
In Situ pH Measurement in Microfluidic Porous Media Indicated by Surfaces Functionalized with Polyaniline (PAni)

1
Department of Energy Science and Engineering, Stanford University, 367 Panama St., Stanford, CA 94305, USA
2
Harvard John A. Paulson School of Engineering and Applied Sciences, Harvard University, Cambridge, MA 02138, USA
*
Author to whom correspondence should be addressed.
Colloids Interfaces 2024, 8(1), 9; https://doi.org/10.3390/colloids8010009
Submission received: 1 December 2023
/
Revised: 4 January 2024
/
Accepted: 11 January 2024
/
Published: 16 January 2024
Abstract
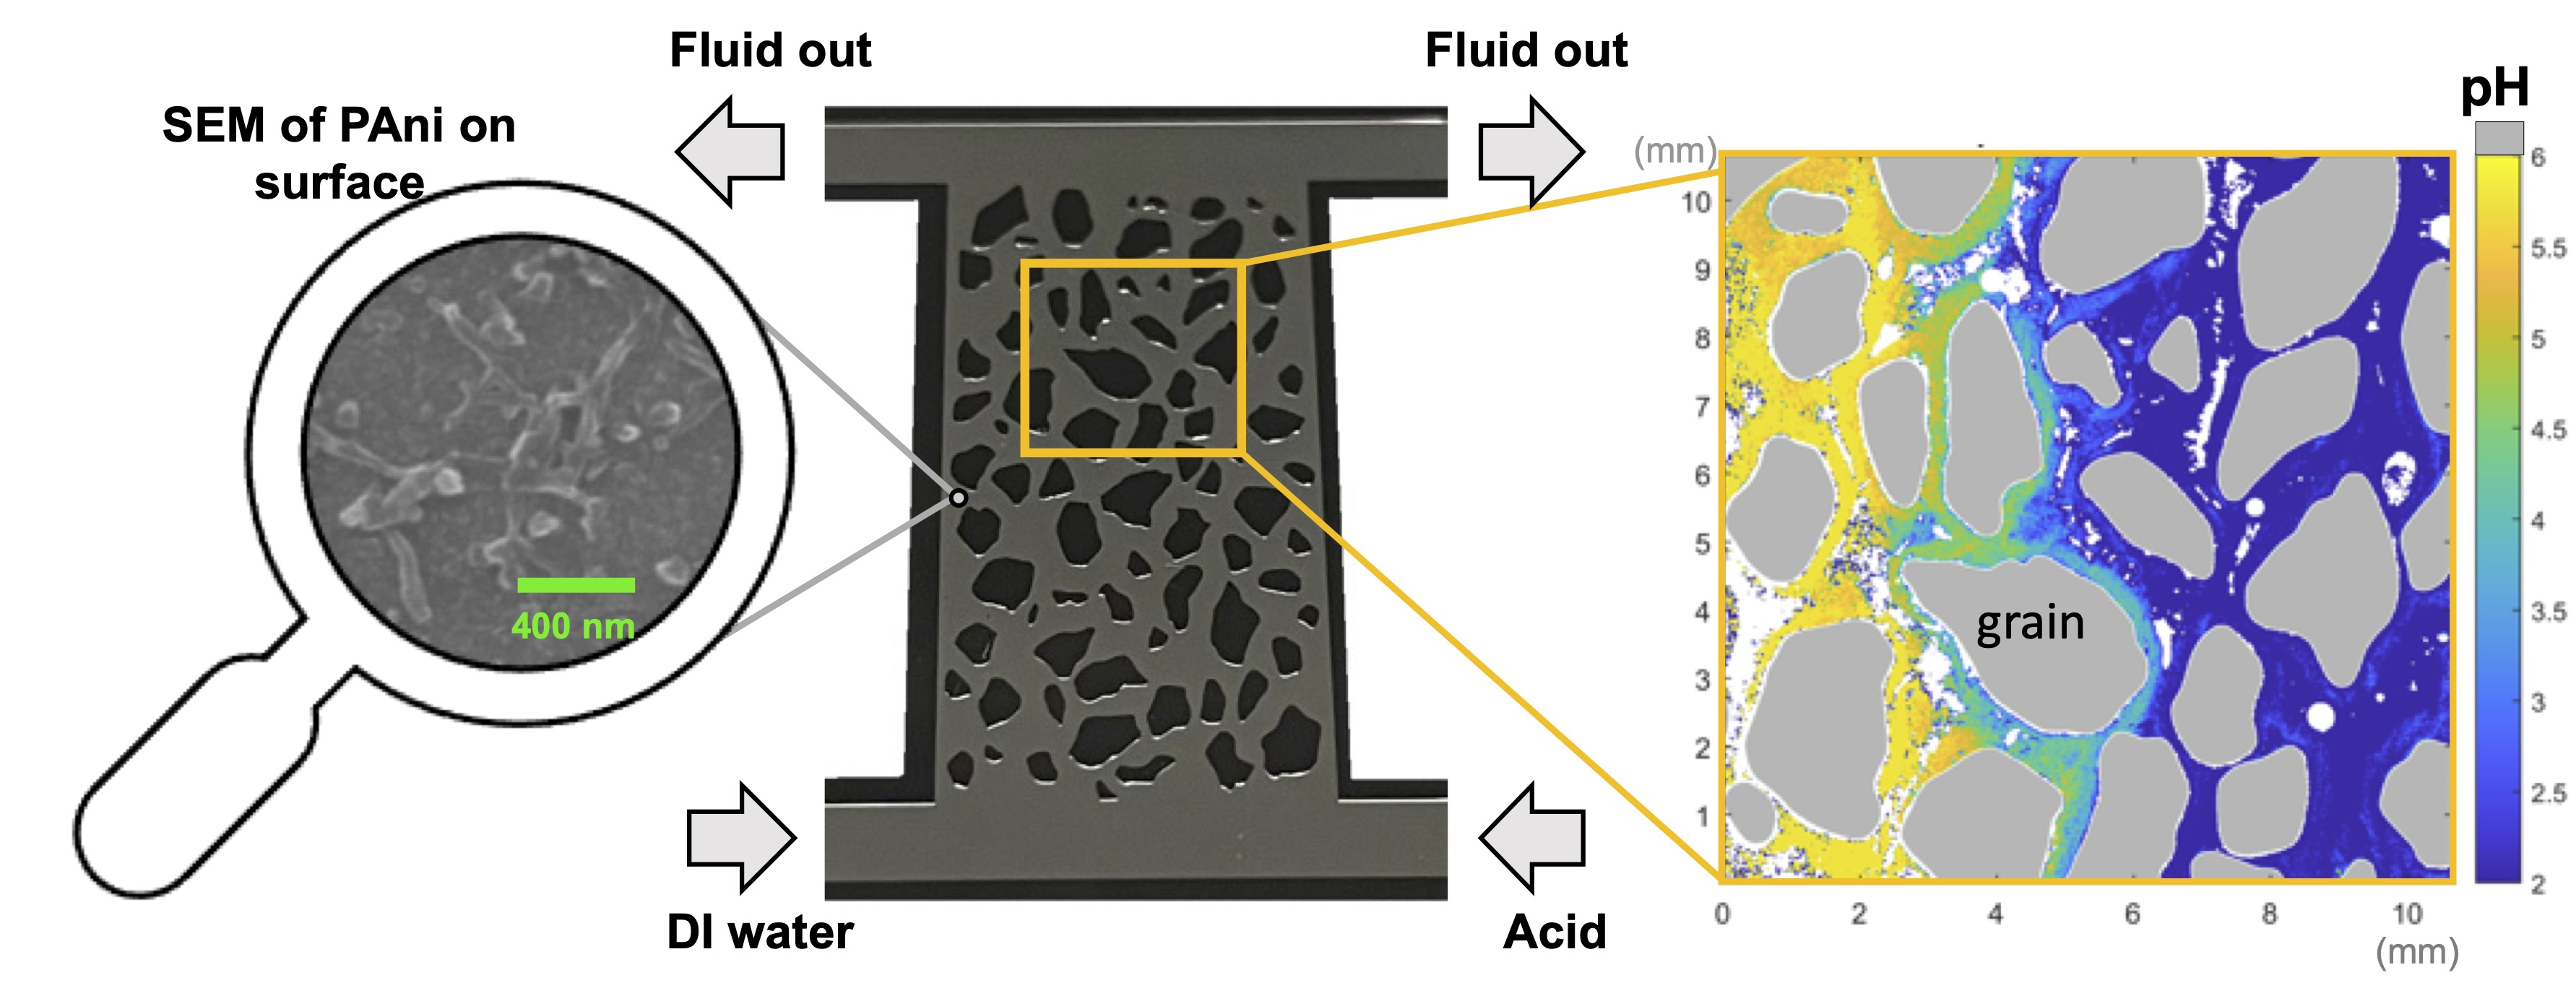
:Aqueous phase pH is a critical metric with significant importance in understanding reactive transport processes in porous media. At the microscale, however, traditional pH detection methods face challenges in capturing dynamic pH due to limited sample volume and sensing time. To overcome these limitations, we leveraged micro/nanofabrication techniques to create a microfluidic porous medium coated with polyaniline (PAni) on its surface. Using this innovative microfluidic design, we achieved colorimetric delineation of pH spatial distribution with fast response and robustness in porous media. By conducting coinjection tests with hydrochloric acid (pH = 2) and DI water (pH ≈ 5.8, equilibrated with air) at various flow rates and relative flow rate ratios in a sandstone-patterned microfluidic device, we observed dynamic pH changes in porous media and obtained a comprehensive understanding of the acid advection-diffusion dynamics. The results highlighted the capability of PAni to enable microscale pH sensing. This research contributes to the development of advanced porous media microfluidics and applications, particularly in mass transfer limits during reactive transport of carbon dioxide sequestration and geological hydrogen storage.

1. Introduction
Solution pH is a crucial parameter that signifies the acidity or alkalinity of an aqueous fluid. Reactive transport processes related to solution pH in porous media are frequently encountered in various engineering domains, including subsurface contaminant transport [1,2,3], carbon dioxide sequestration [4,5], underground hydrogen storage [6,7,8], and certain chemical manufacturing operations [9,10]. In the context of carbon dioxide storage in subsurface environments, the dissolution of CO2 in water, termed dissolution trapping, is deemed advantageous for long-term storage as it reduces CO2 mobility and fosters potential reactions between carbonate ions and other constituents. The resulting carbonic acid from CO2 dissolution significantly lowers the pH of the subsurface environment (H2O (l) + CO2 (aq) ⇌ H+ (aq) + HCO3− (aq); HCO3− (aq) ⇌ H+ (aq) + CO32− (aq)). Laboratory experiments indicate that the pH can drop to around 3 under the high-pressure and -temperature conditions typical of storage sites [11]. However, the heterogeneous phase distribution and arrangement within porous media lead to unevenly distributed reactions and corresponding pH variations. Therefore, monitoring pH fluctuations is a viable method for tracking CO2 dissolution and transport reactions. Additionally, studies have shown that CO2 injection, due to the impact on pH, significantly influences microbial communities, with unknown effects on the ecosystem [12,13].
Regarding the underground storage of hydrogen, key concerns such as hydrogen loss through geochemical reactions and microbial consumption are closely tied to aqueous-phase pH. For instance, the reduction of pyrite to pyrrhotite in the presence of hydrogen elevates the pH and contributes to hydrogen loss [14]. Microorganisms that consume hydrogen, like methanogens, can cause H2 loss through CH4 production within their preferred pH range of 6.0–7.5. Thus, detecting pH within microfluidic devices used to investigate mechanisms such as those described above is an essential task to develop pore-scale understanding.
Microfluidics serves as an invaluable tool for understanding the mechanisms of heterogeneous reactive transport in porous media. A more precise, pore-scale, delineation of pH distribution aids our physical understanding. Microfluidic devices provide an analog for natural porous media and are a versatile platform for the direct observation of processes through the aid of microscopes and digital sensors [15,16,17,18,19,20,21]. For example, a specially designed microfluidic planar fracture works as a micro-scale rheometer for aqueous foam flow and also measures foam viscosity [21].
Microfluidics has been previously employed for pH change detection; for instance, Edery et al. [22] used Congo red to visualize pH changes, that shift from red to blue when pH exceeds 4. However, traditional pH-sensing methods face several challenges. Colorimetric or fluorescent dyes, typically used for pH indication, have a limited detection range specific to their capabilities. These dyes must be uniformly mixed with solutions at consistent concentrations, and this inevitably alters the original state of the solutions. Traditional pH sensors, such as electrodes and paper-based litmus tests, encounter significant integration challenges within microfluidic systems, primarily due to scale limitations and sensing time restrictions. These traditional pH-sensing methods typically require a sample volume that is too large for effective use in microfluidic research where the total volume is in the range of microliters. This mismatch in scale can lead to difficulties in obtaining an adequate detection signal from microfluidic devices. Additionally, the response time of these classical pH sensors often does not align well with the rapid dynamics of pore-scale flow conditions. The lag in response time further limits the effectiveness of these sensors in real-time monitoring and analysis of microfluidic processes. Moreover, to obtain a comprehensive map of pH distribution rather than a local value, numerous sensors need to be strategically positioned, complicating the setup of the microfluidics. A detailed review by Steinegger et al. [23] outlines various types of pH sensors, their applications, and their limitations.
To achieve our goal of mapping pH distribution in porous media conveniently and enabling the injection of various solutions, enhancing the microfluidic system with real-time pH sensing capabilities is a suitable approach. Polyaniline (PAni) is a unique polymer that exhibits both electrochemical and colorimetric characteristics based on its interaction with H+ ions [24]. Research has indicated that PAni can switch from an emeraldine salt form with a green color to an emeraldine base form with a blue color in the presence or absence of H+ ions [25,26]. This change is characterized by the protonation of the nitrogen atoms in the polymer chain, that results in the emeraldine salt exhibiting different physical and electrical properties. By conducting rapid mixing polymerization of aniline at room temperature (20 °C) with a low molar ratio of ammonium peroxydisulfate (APS) to aniline of 0.25, PAni nanofibers with diameters as small as 50 nm can be synthesized [27]. These nanofibers are ideally suited for thin-layer deposition onto microfluidic channels. Florea et al. [28,29] were the first to introduce PAni into microfluidics, providing a detailed protocol for depositing PAni onto the surface of straight channels made from polydimethylsiloxane (PDMS).
In this study, we introduce a novel, etched-silicon microfluidic porous medium (i.e., a micromodel) where surfaces are functionalized with PAni to enable visualization of aqueous-phase pH distributions and elucidate pH-dependent reactive transport processes. This new tool significantly advances the investigation of microscale mechanisms accompanying pH-related changes in porous media. Section 2 outlines the fabrication of the micromodel, the characterization of PAni and its functionalization process, and the experimental framework established for pH monitoring during fluid injection. Section 3 focuses on the results of testing the model, including calibration of pH detection, the model’s capacity for rapid pH fluctuation tracking, as well as tests of coinjection. Coinjection experiments involve low-pH hydrochloric acid (HCl) solutions (pH = 2) and deionized water (DI water, pH ≈ 5.8 under atmospheric conditions) at varying flow rates and flow rate ratios. These tests illustrate the impact of HCl’s convection and dispersion on the pH maps obtained and, conversely, provide insights into underlying flow dynamics. Section 4 engages in a critical discussion of the advantages and limitations encountered, followed by conclusions in Section 5.
2. Materials and Methods
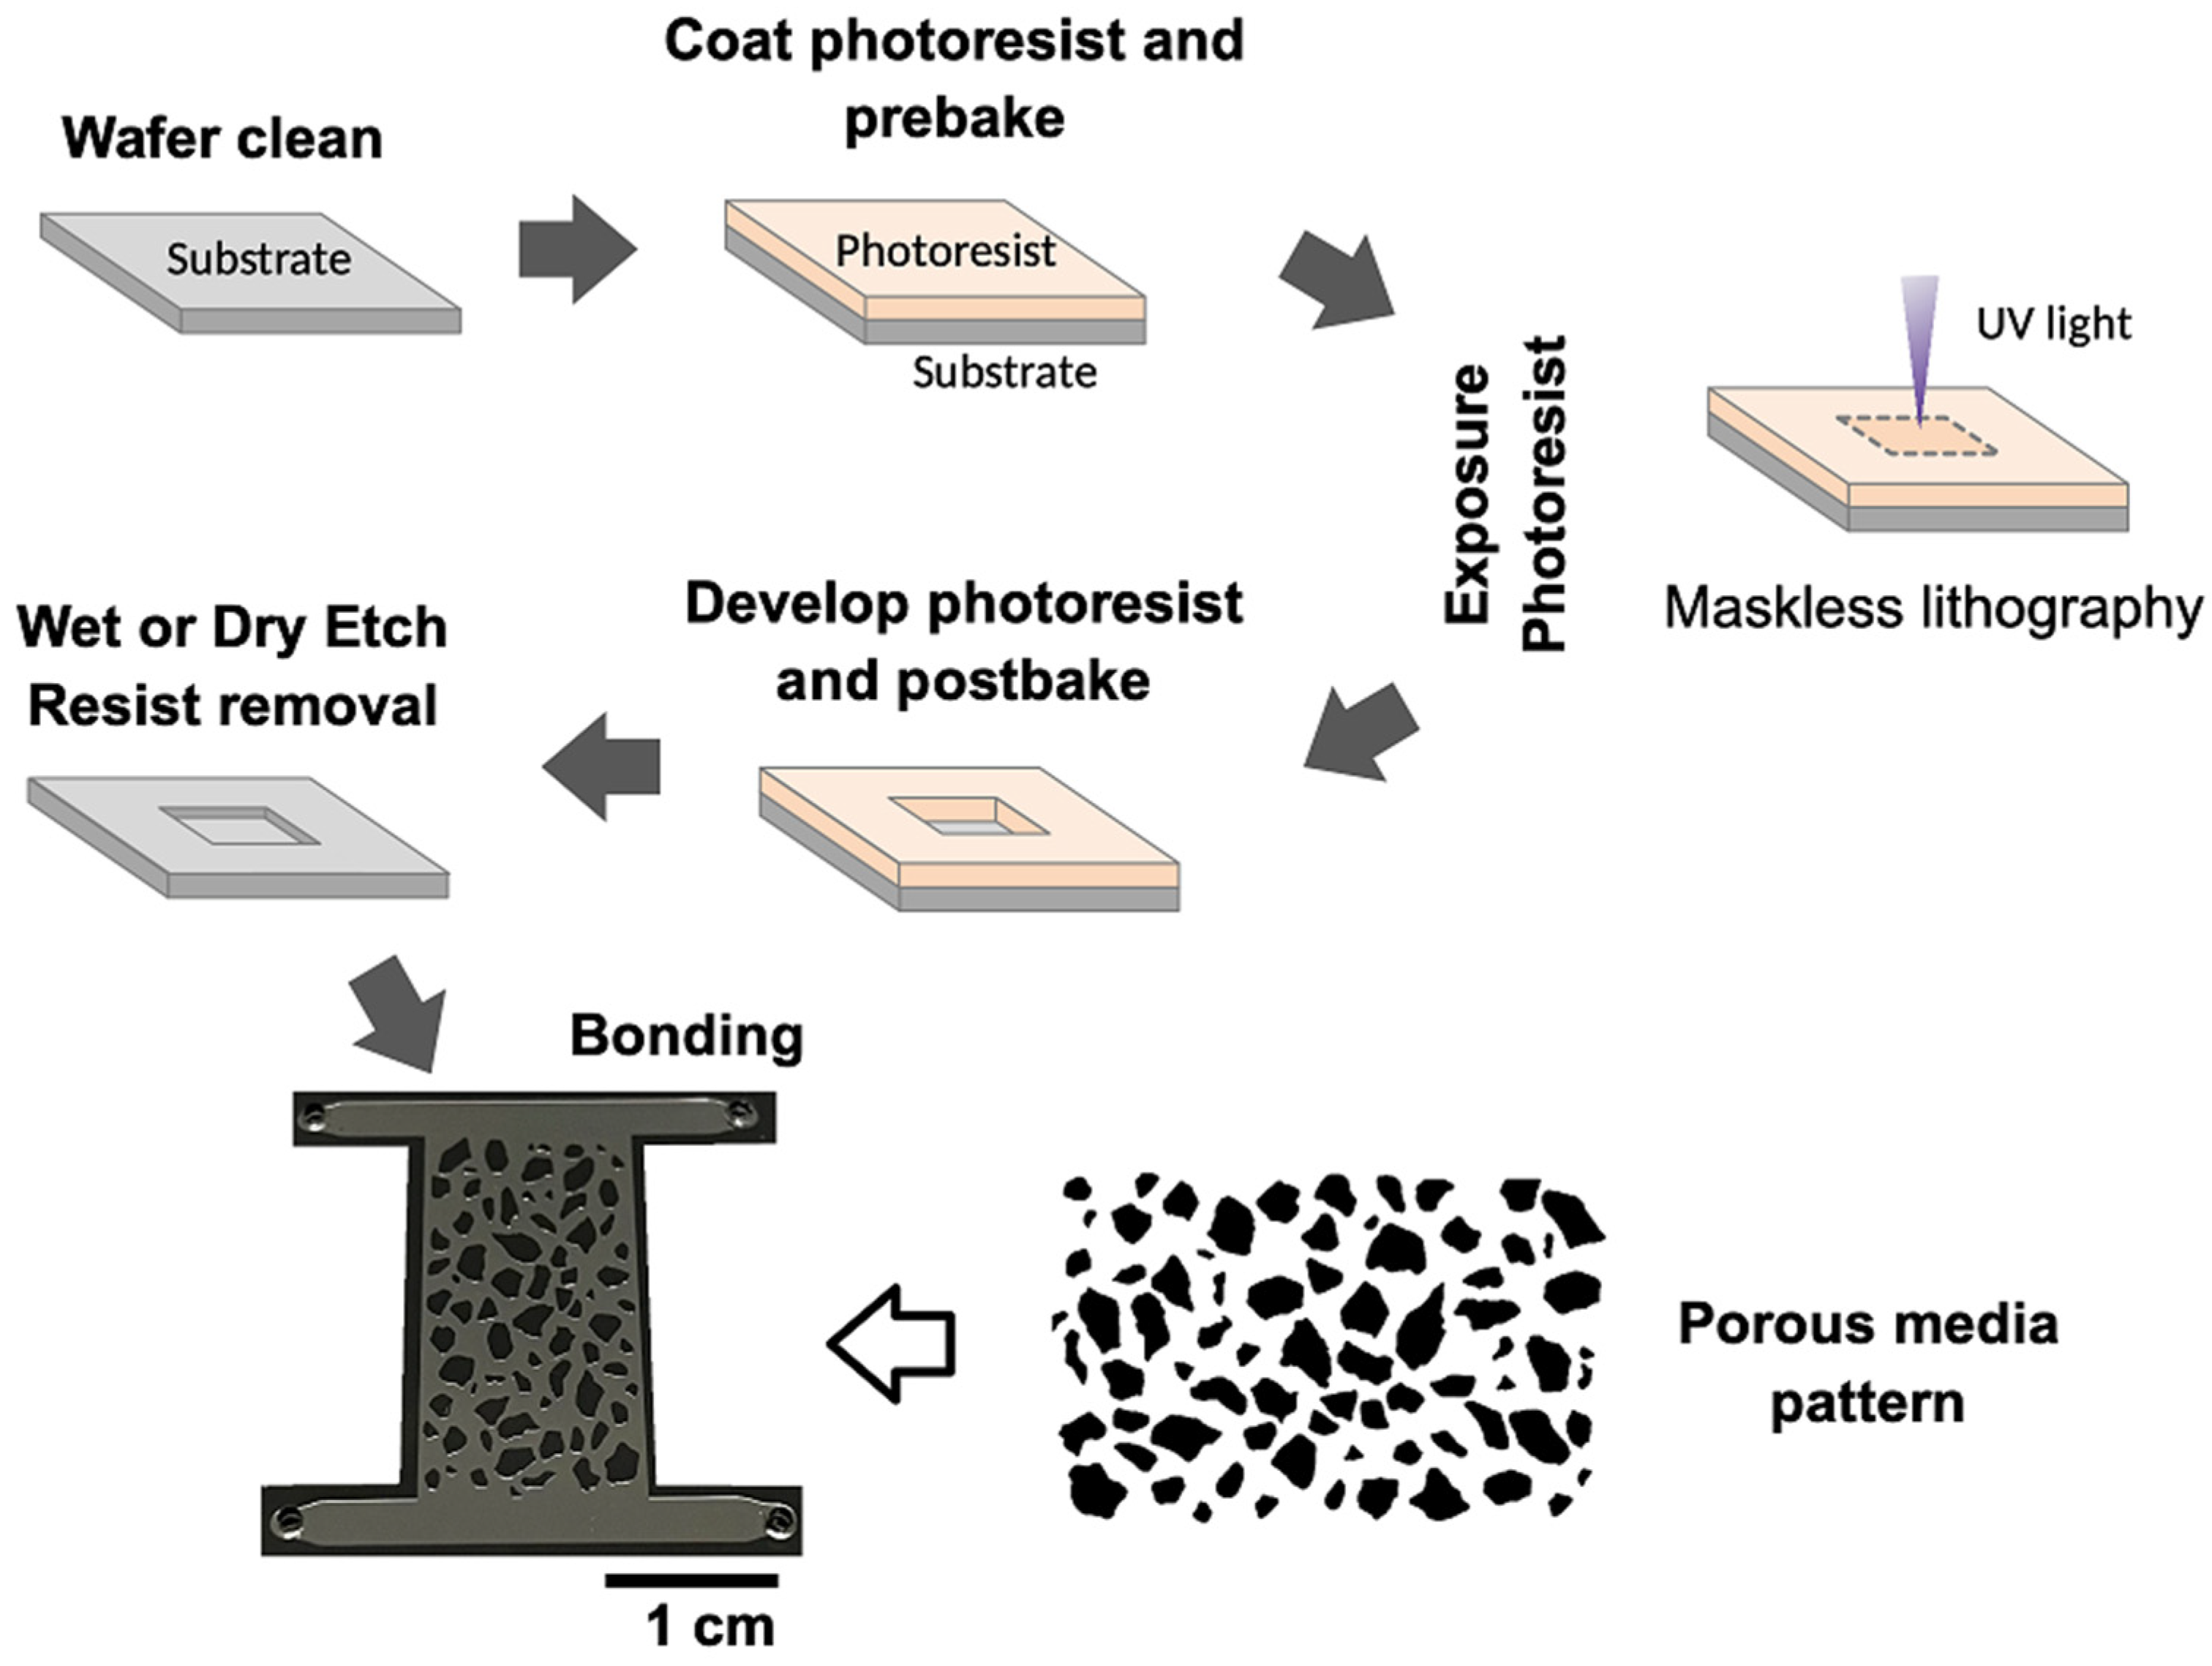
For initial steps, we followed our standard fabrication protocols for etched-silicon microfluidic devices [15,17,30,31,32]. The porous media pattern is a simplified representation of sandstone, as depicted in Figure 1. The original pattern is from a sandstone [33], but we removed fine grains and enlarged grains to make sure the smallest pore-throat was around 300 µm to avoid aggregation of PAni during the in situ deposition process. The overall dimensions of the porous medium are 1.42 cm in width and 2.74 cm in length. Our design incorporates flow distribution channels at the inlet and outlet, each with two ports for fluid injection/production. The porous media pattern was designed using AutoCAD and then exported to an MLA 150 maskless aligner (Heidelberg Instrument, Heidelberg, Germany) for pattern exposure. The microfluidic model was fabricated at the Stanford Nanofabrication Facility.
The process commenced with the preparation of a 4-inch K-prime silicon wafer (NanoSILICON, Inc., San Jose, CA, USA), that was treated in a YES prime oven (Yield Engineering Systems, Fremont, CA, USA) to allow its surface to be coated with HMDS (Hexamethyldisilazane, by Alfa Aesar, Ward Hill, MA, USA), enhancing photoresist adhesion. Subsequently, the wafer was coated with Shipley 3612 (SPR 3612, Marlborough, MA, USA) positive photoresist to a thickness of 1.6 µm using spinning coating and then pre-baked for 60 s. Ultraviolet light was directed onto the predetermined areas (voids and channels), rendering the photoresist soluble to the developer. The areas with grain and wall patterns remained shielded by the photoresist for the development process. Plasma dry etching was employed to remove silicon from areas not protected by the photoresist, forming the etched pattern on the silicon wafer. In preparation for PAni deposition, the microfluidic device undergoes treatment with oxygen plasma (PE-50 by Plasma Etch, Inc., Carson City, NV, USA) for 60 s. This step activates the Si-Si bonds, resulting in the formation of silanol groups (Si-OH) on the surface. These groups establish an anchoring foundation for subsequent deposition. Any residual photoresist and contaminants were then eliminated using a piranha solution (9:1 sulfuric acid to 30% hydrogen peroxide ratio). The etched-silicon wafer was then bonded to a transparent top glass plate (SCHOTT BOROFLOAT® 33, Schott AG, Mainz, Germany) using anodic bonding. Ports were drilled into the top glass plate, and tubing was connected using so-called “NanoPorts” (IDEX, Lake Forest, IL, USA) to facilitate subsequent procedures. The fabricated model measures 65 µm in depth. The distances between the four ports are 3.0 cm and 3.05 cm, horizontally and vertically, as shown in Figure 1.
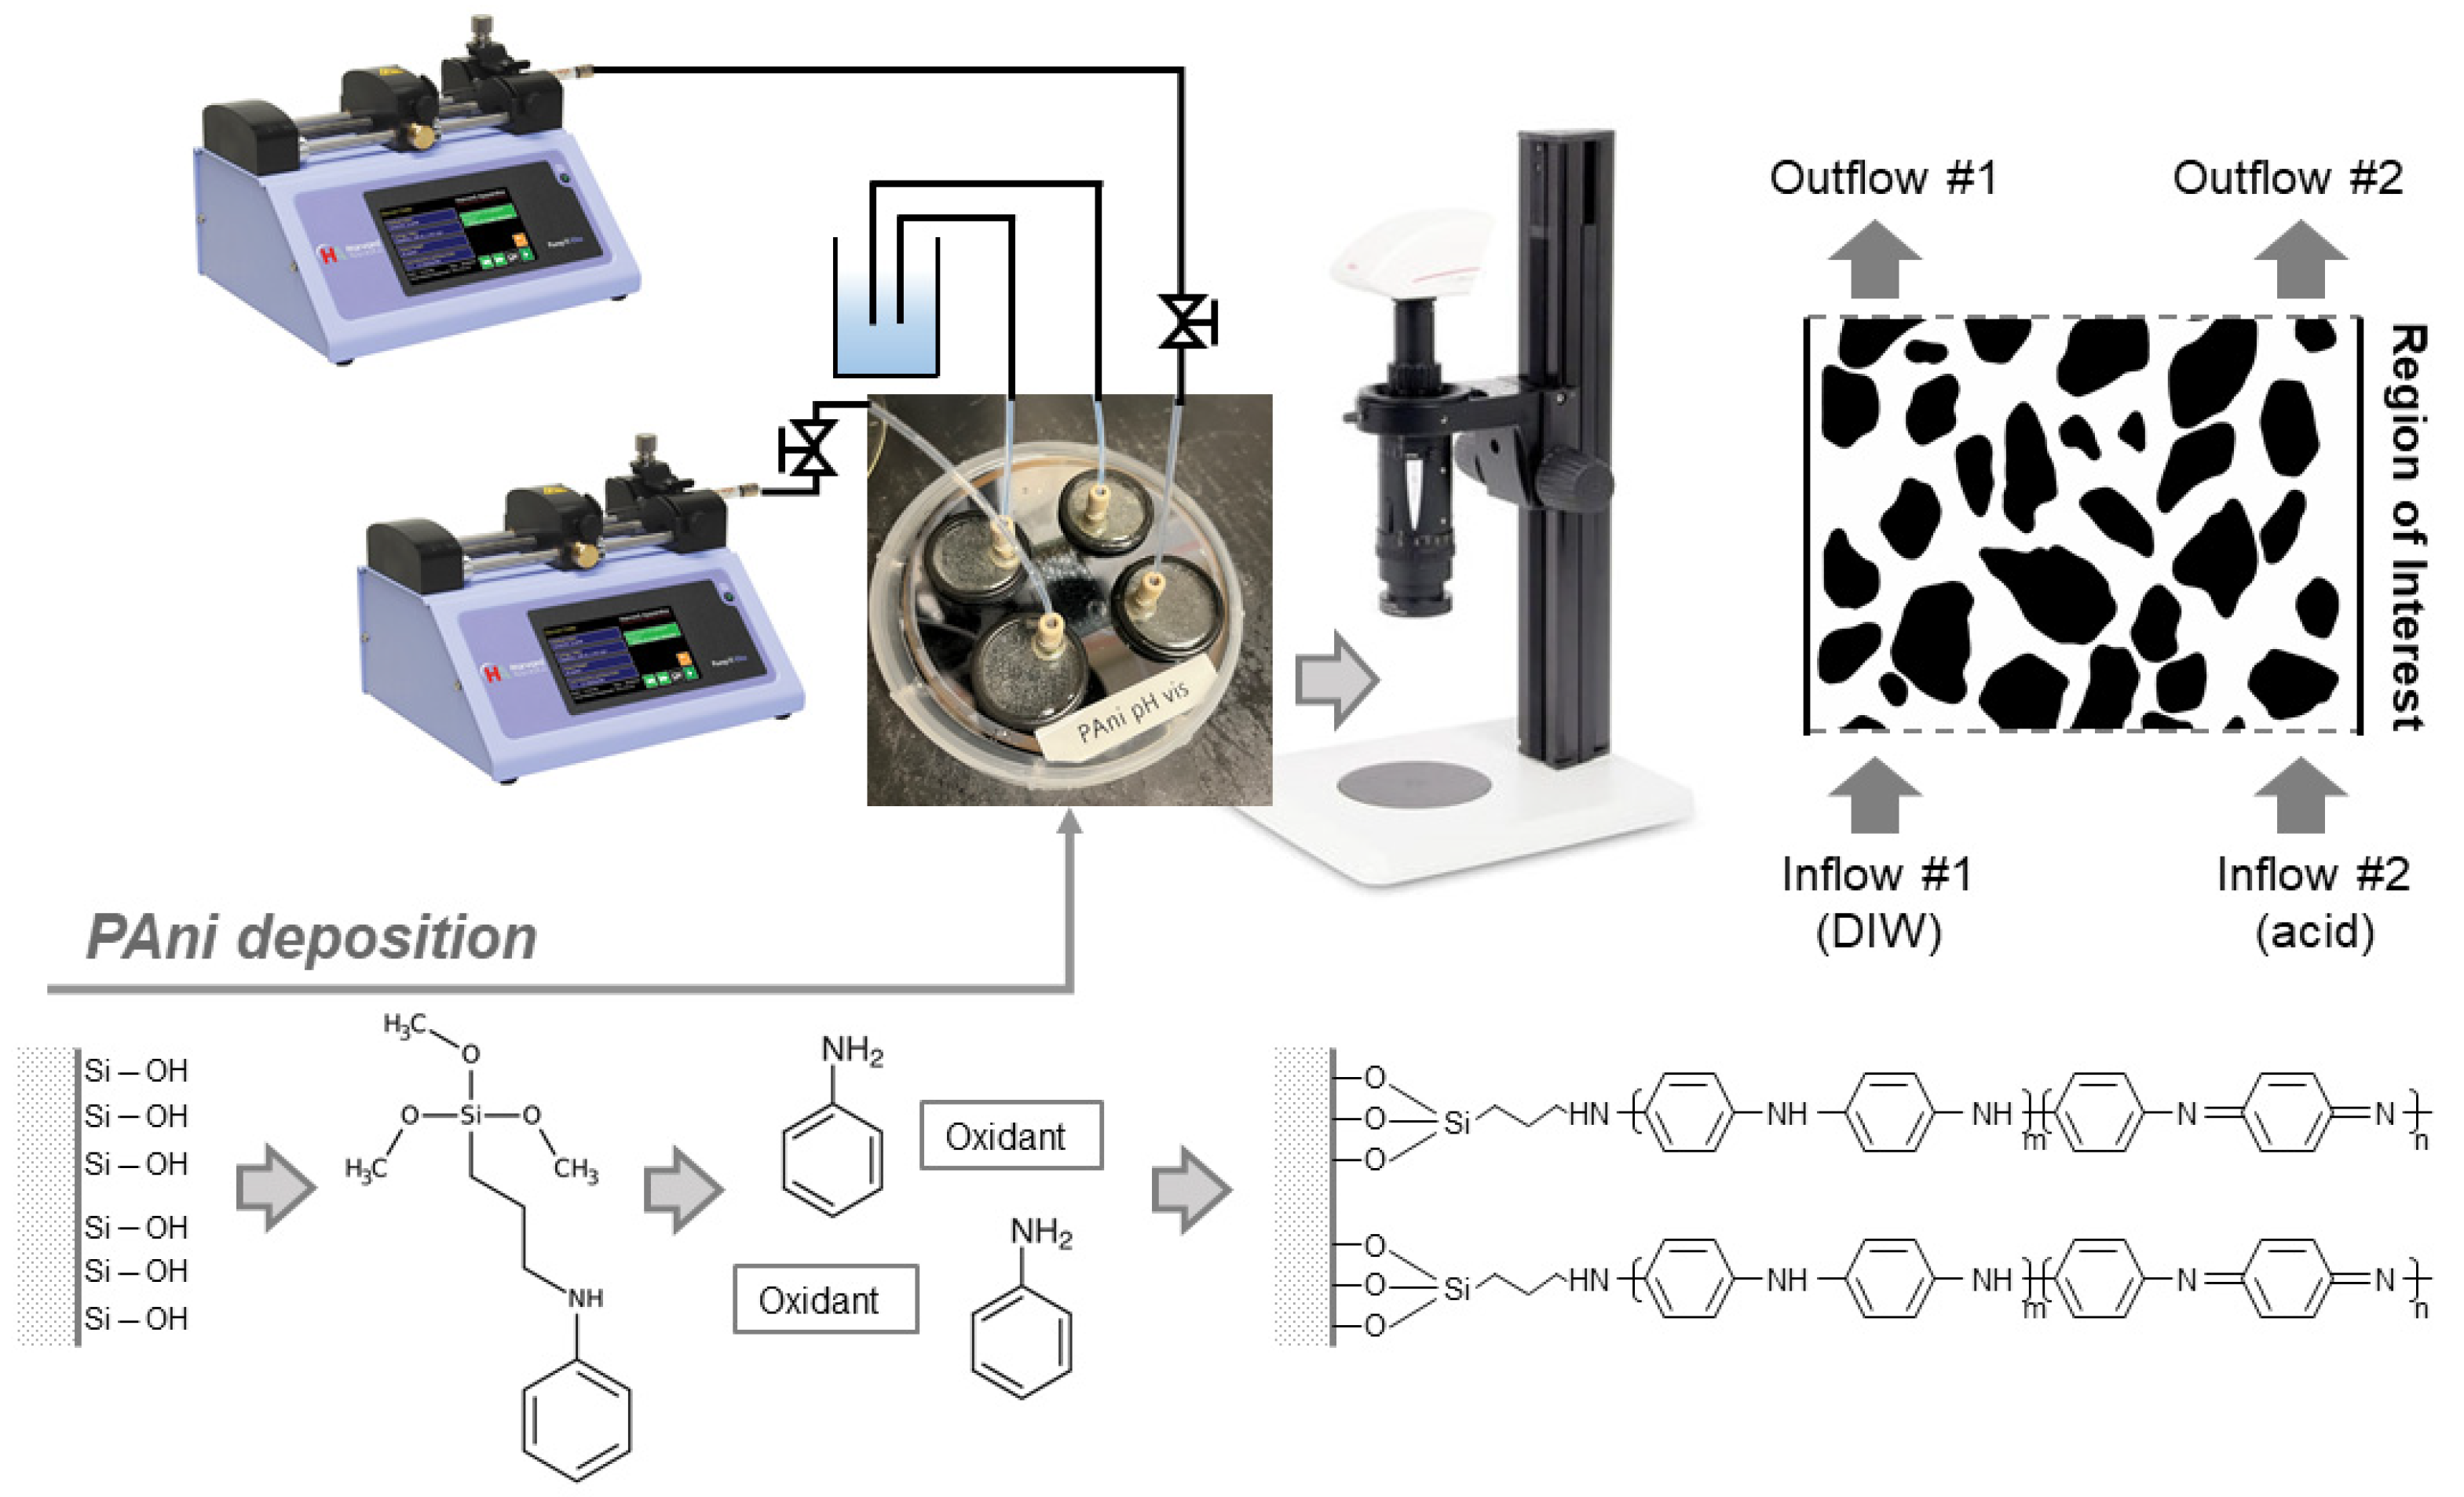
PAni is then applied to the inner walls of the microfluidic system after bonding. The PAni preparation steps are shown in Figure 2. Firstly, the model is saturated and rinsed with a 20 wt% solution of N-[3-(Trimethoxysilyl)propyl]aniline (Sigma-Aldrich, St. Louis, MO, USA) in ethanol. The flow rate is maintained at 1 µL per minute for a duration exceeding 60 min. As depicted in Figure 2, two syringe pumps (Harvard Pump 11 Elite by Harvard Apparatus, Holliston, MA, USA) facilitate the injection, ensuring a consistent flow rate. After this stage, silane-bearing aniline forms on the surface. The subsequent step involves the polymerization of aniline, encompassing both the free aniline in the solution and the aniline anchored to the surface. The model is filled with a freshly prepared 1 M HCl (Fisher Chemical, Fair Lawn, NJ, USA) solution containing the oxidant (APS by Sigma-Aldrich, St. Louis, MO, USA) and 0.1 mol of aniline (Sigma-Aldrich, St. Louis, MO, USA) at a molar ratio of 0.25:1. The system is left idle for an hour at room temperature. At this specified molar ratio and room temperature, researchers have indicated the formation of a uniformly distributed layer of PAni nanofibers [27]. Lastly, we thoroughly rinse with water to eliminate any unattached PAni nanofibers and aggregated debris from the channel.
Figure 2 also provides a schematic of the setup for experiments. The completed micromodel functionalized with PAni is examined under a stereo microscope (Leica Z6 APO, Deerfield, IL, USA) that is linked to a computer for image capture and recording. Fluid injections are administered using two 5 mL glass syringes (Hamilton Gastight Syringe, Reno, NV, USA) attached to the syringe pumps. Differently concentrated HCl is used in coninjection with DI water (pH ≈ 5.8 at room pressure).
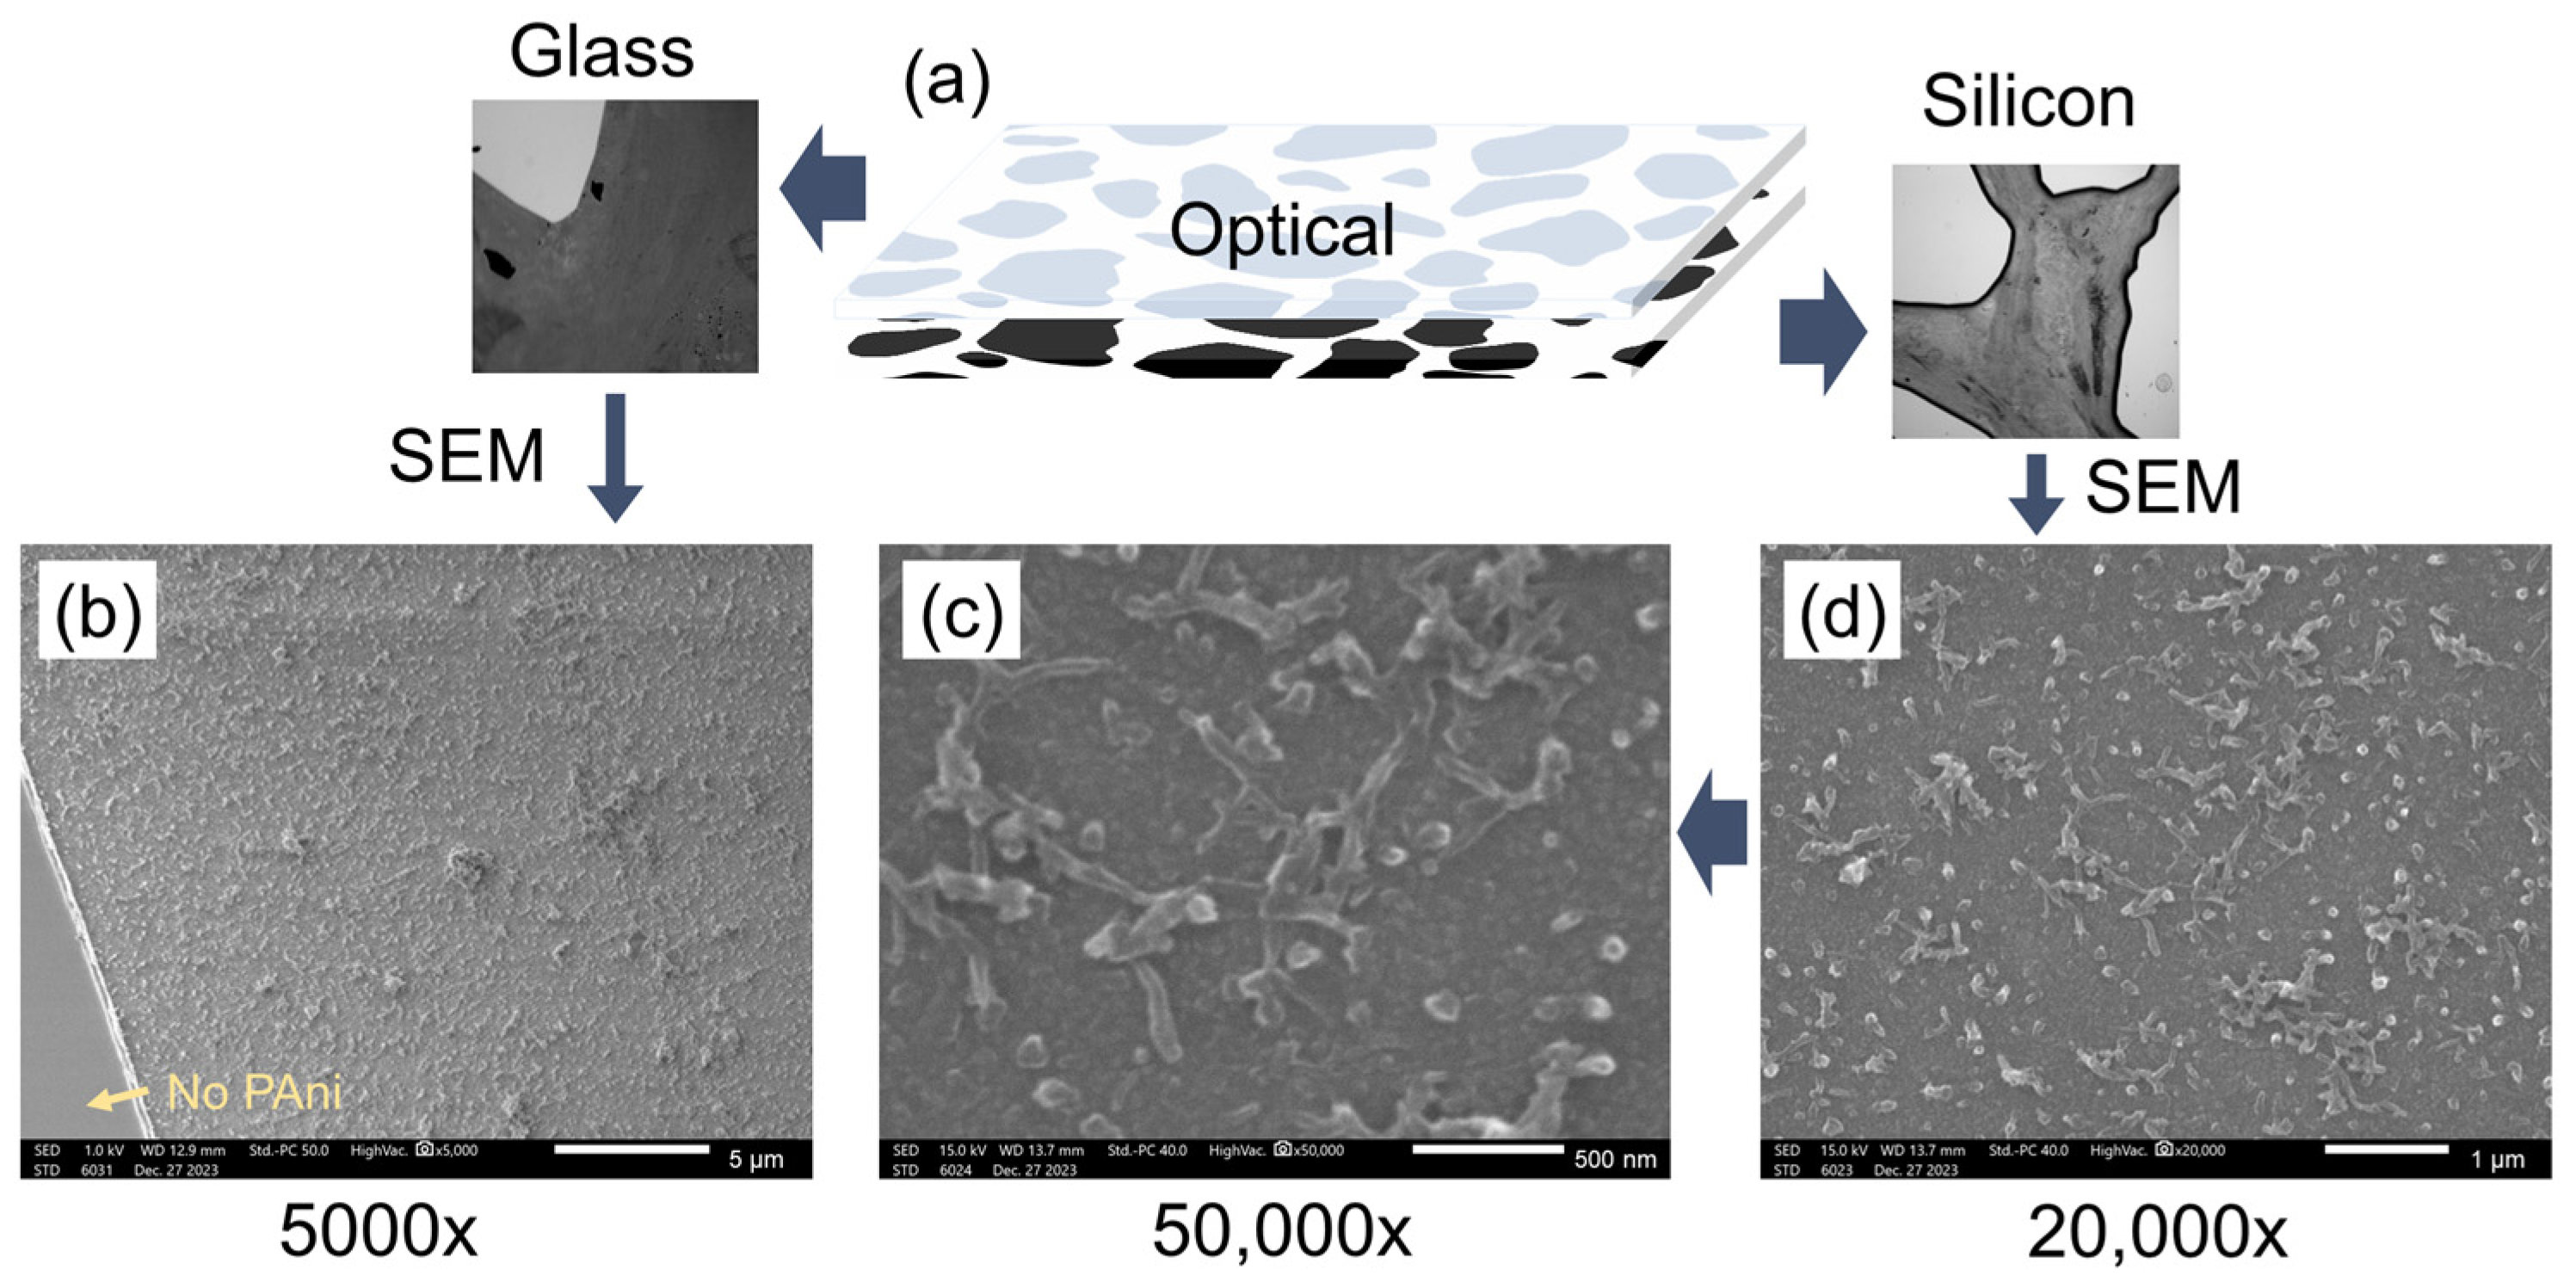
A JEOL JSM-IT500HR scanning electron microscopy (SEM, by JEOL Ltd., Tokyo, Japan) was employed to characterize the PAni deposited on the wall within the channel. By detaching the glass coverplate from the bottom silicon substrate of an extra microfluidic model, we observed grain areas devoid of PAni deposition. Comparative analysis under the microscope revealed a denser coverage of PAni on the glass plate than on the silicon substrate on the two sides of the schematic in Figure 3a. SEM imaging provided detailed insights into the microscale features of the PAni-coated surfaces on both glass (Figure 3b) and silicon (Figure 3c,d), respectively. The glass surface without PAni, shown in Figure 3b’s bottom-left corner, appears smooth, contrasting with areas where PAni polymers are densely coated. Despite plasma treatment of the silicon surface, Figure 3d demonstrates less PAni attachment compared to the glass. A 50,000× magnification in Figure 3c clearly displays the characteristic features of PAni, with typical polymer lengths in the micron range and fiber diameters below 100 nm, aligning with findings by Qiang et al. [27] and the PAni characteristic dimension in a PDMS microfluidic channel fabricated by Florea et al. [28].
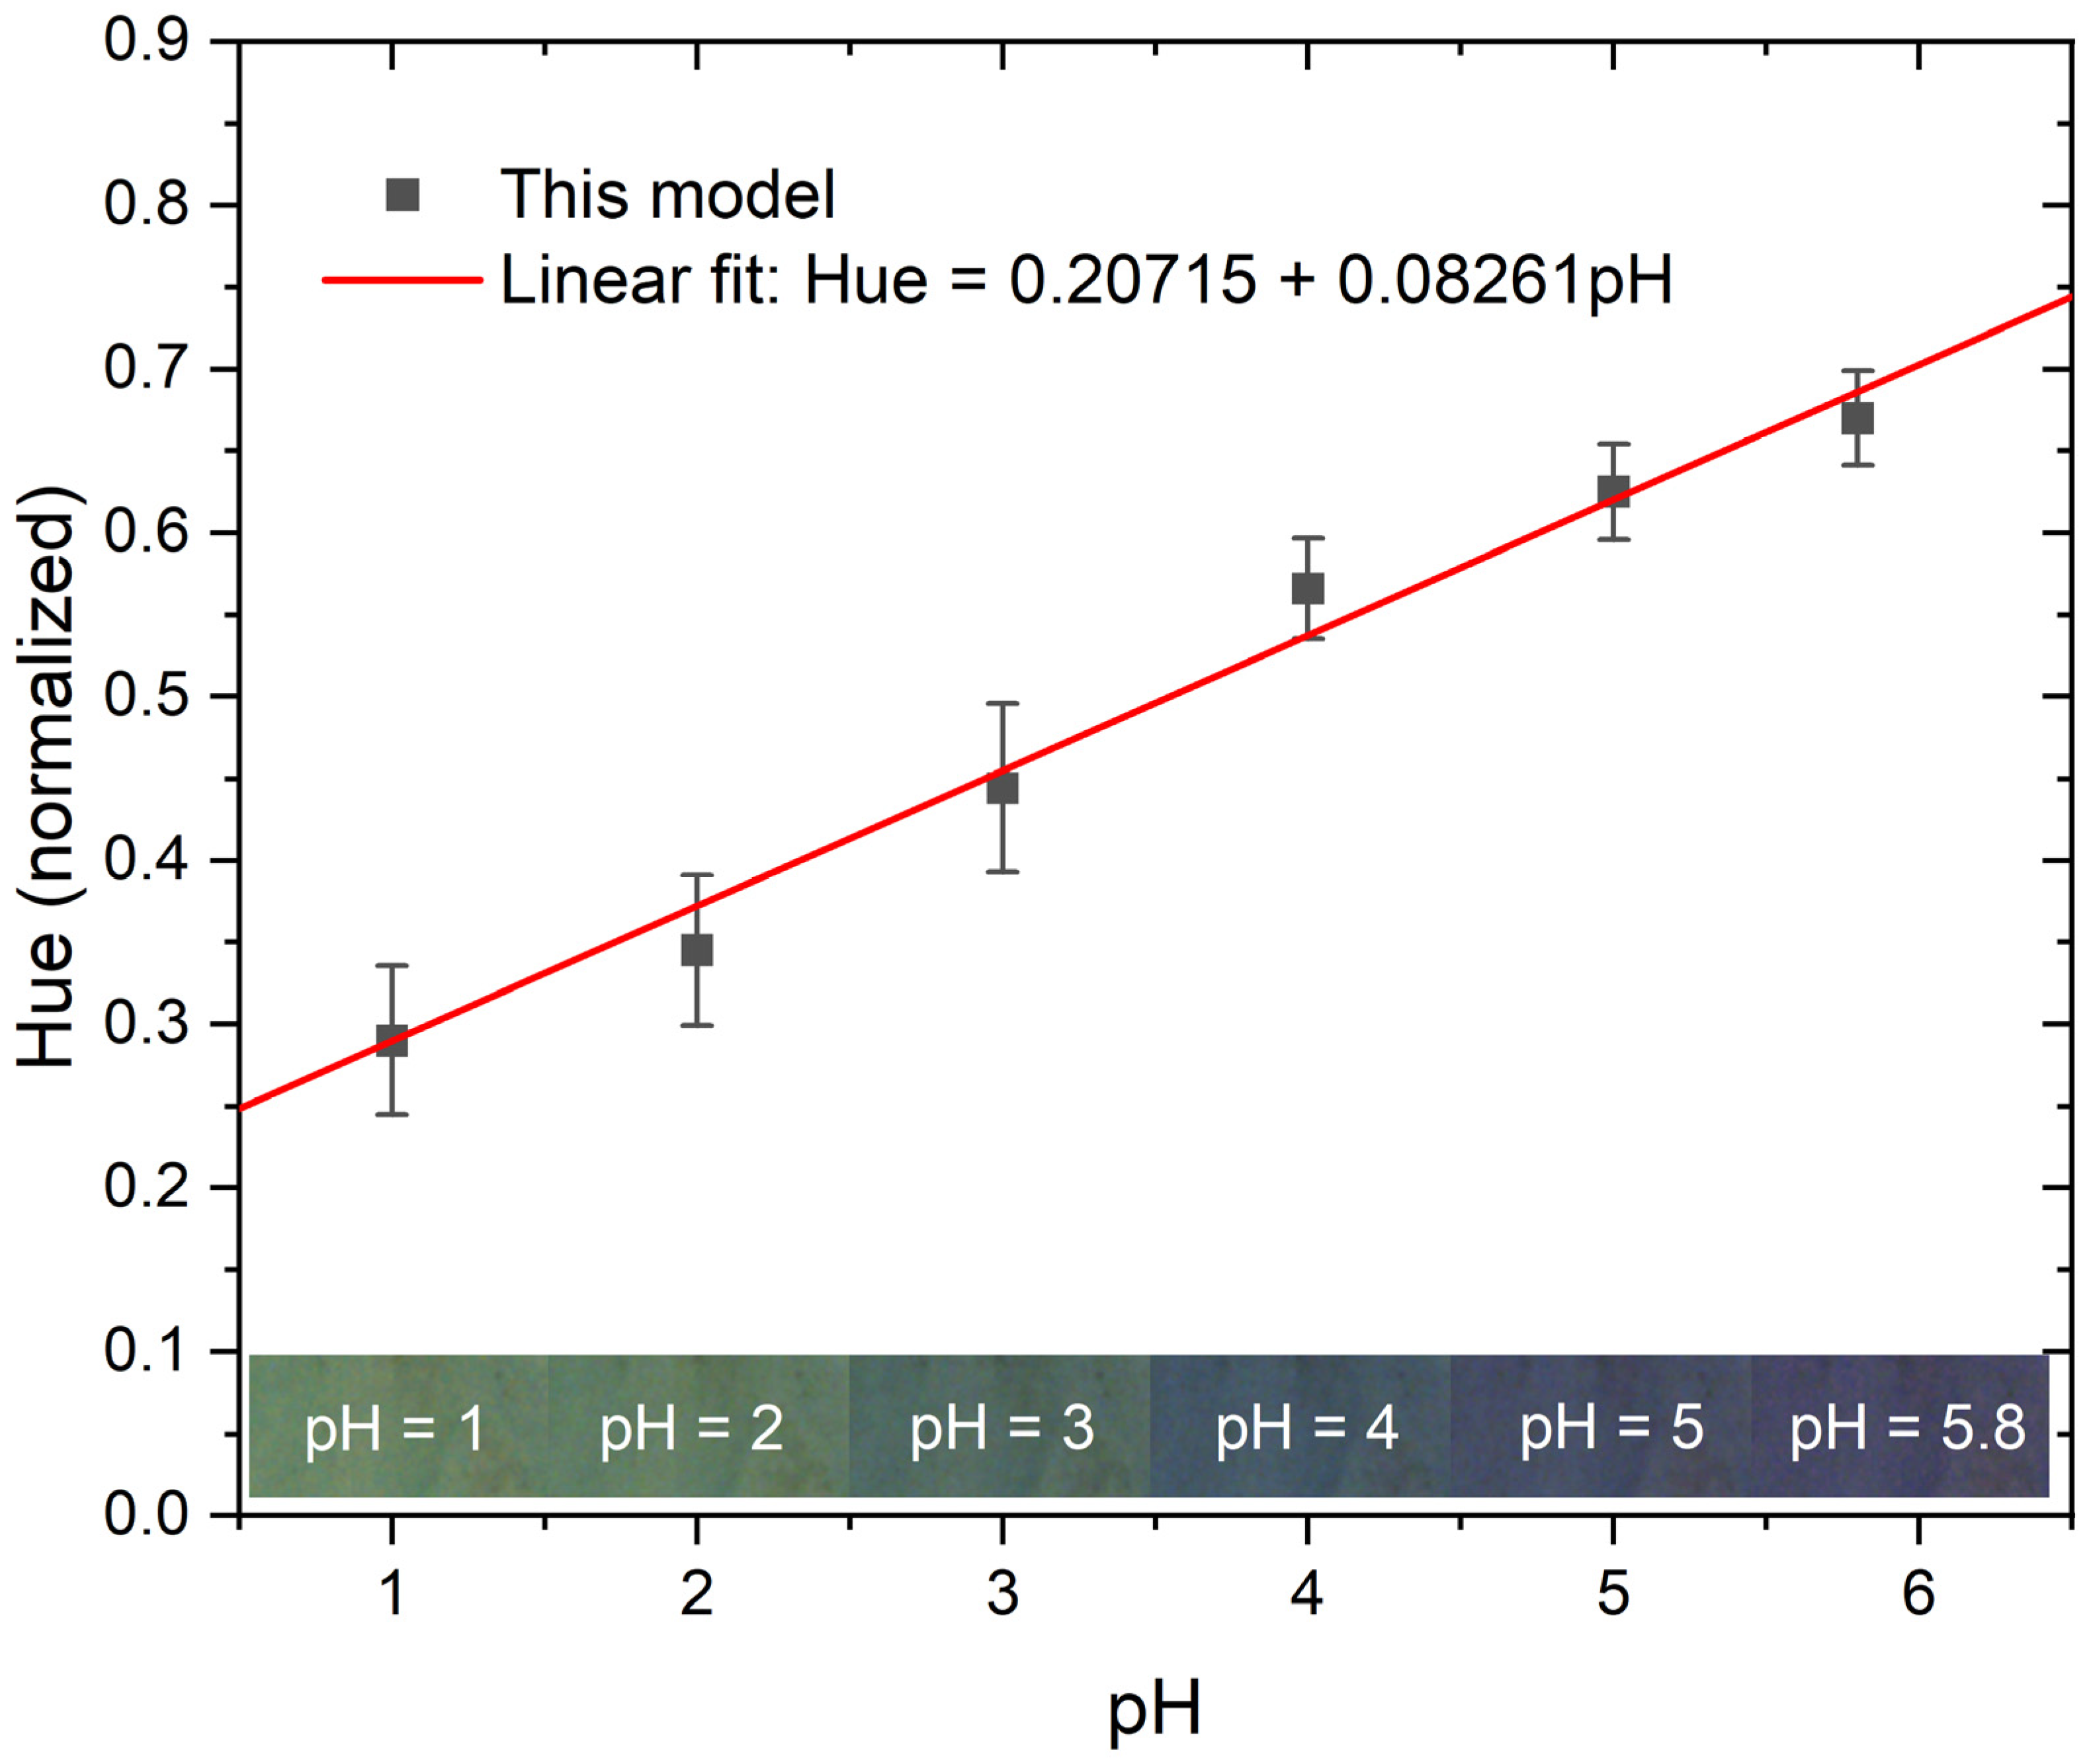
In our study, pore-scale solution pH is visualized, making post-processing essential to extract meaningful information from photos taken under varied conditions. The initial phase of post-processing excludes all rock grains, achieved using a pre-established mask. The next step involves denoising the image to correct for interference caused by factors like polymer debris, environmental lighting, and other unforeseen circumstances. To represent pH, we extracted the hue value from each image. The hue serves as a consistent descriptor independent of both lightness and saturation, with each unique color aligning with a specific angular position on a color wheel. For these post-processing tasks, we utilized the open-source software Image J, as well as self-written MATLAB code. The extracted hue values were then normalized based on their maximum values.
3. Results
3.1. Model Calibration with pH
To ensure accuracy and reliability in our pH visualization within the microfluidic system, we implemented a robust calibration procedure. We prepared several standard pH solutions using HCl, with values ranging from pH = 1 to pH = 5. Additionally, we used DI water, which presents a pH of 5.8 under lab conditions, attributable to the carbon dioxide dissolved from the atmosphere. A digital pH meter was employed to verify frequently the pH values of these solutions, minimizing potential errors during calibration.
For each calibration process, we began by flushing the model with DI water for over 15 min at a high flow rate of approximately 1 mL per minute, ensuring no residues remained in the channel. Subsequently, we introduced the acid solution at a high flow rate for several minutes, capturing images of the model as it was fully filled with the solution. This process was repeated for each standard solution. The images taken at different pH levels exhibited varying colors, transitioning from light green to dark blue and finally to nearly violet, as depicted in Figure 4 (the color band).
This entire procedure was repeated three times, allowing us to estimate the error, as highlighted by the error bars in Figure 4. Notably, the error observed during calibration was minimal. After correlating the hue values with their respective pH levels, we derived a linear relationship between hue and pH. In research conducted by Florea et al. [28], a sigmoidal curve was fitted to represent the relationship between hue and pH. However, our observations indicated that in the alkaline regime (pH > 7), hue is not sensitive to pH changes. Between pH = 2 and pH = 6, the relationship is linear. Our findings further corroborate this observation. Given our specific interest in measuring acidic solutions, we opted for a linear curve to simplify the hue–pH relationship. This simplified relationship was then employed to back-calculate the pH in subsequent experiments.
3.2. Fast Detection of pH Changes
Initially, we aimed to confirm that the PAni functionalized micromodel rapidly detected changes in solution pH without time lag. Ideally, when a surface coated with PAni comes into contact with a solution of a specific pH, it should provide an immediate and accurate readout of the pH. This response should occur in real-time, accurately reflecting any changes in the pH of the solution. To this end, we executed an acid injection test at relatively large flow rates and captured video within the region of interest (ROI). Concurrently, we conducted a numerical simulation using the same experimental parameters for a side-by-side comparison of pH transition timelines.
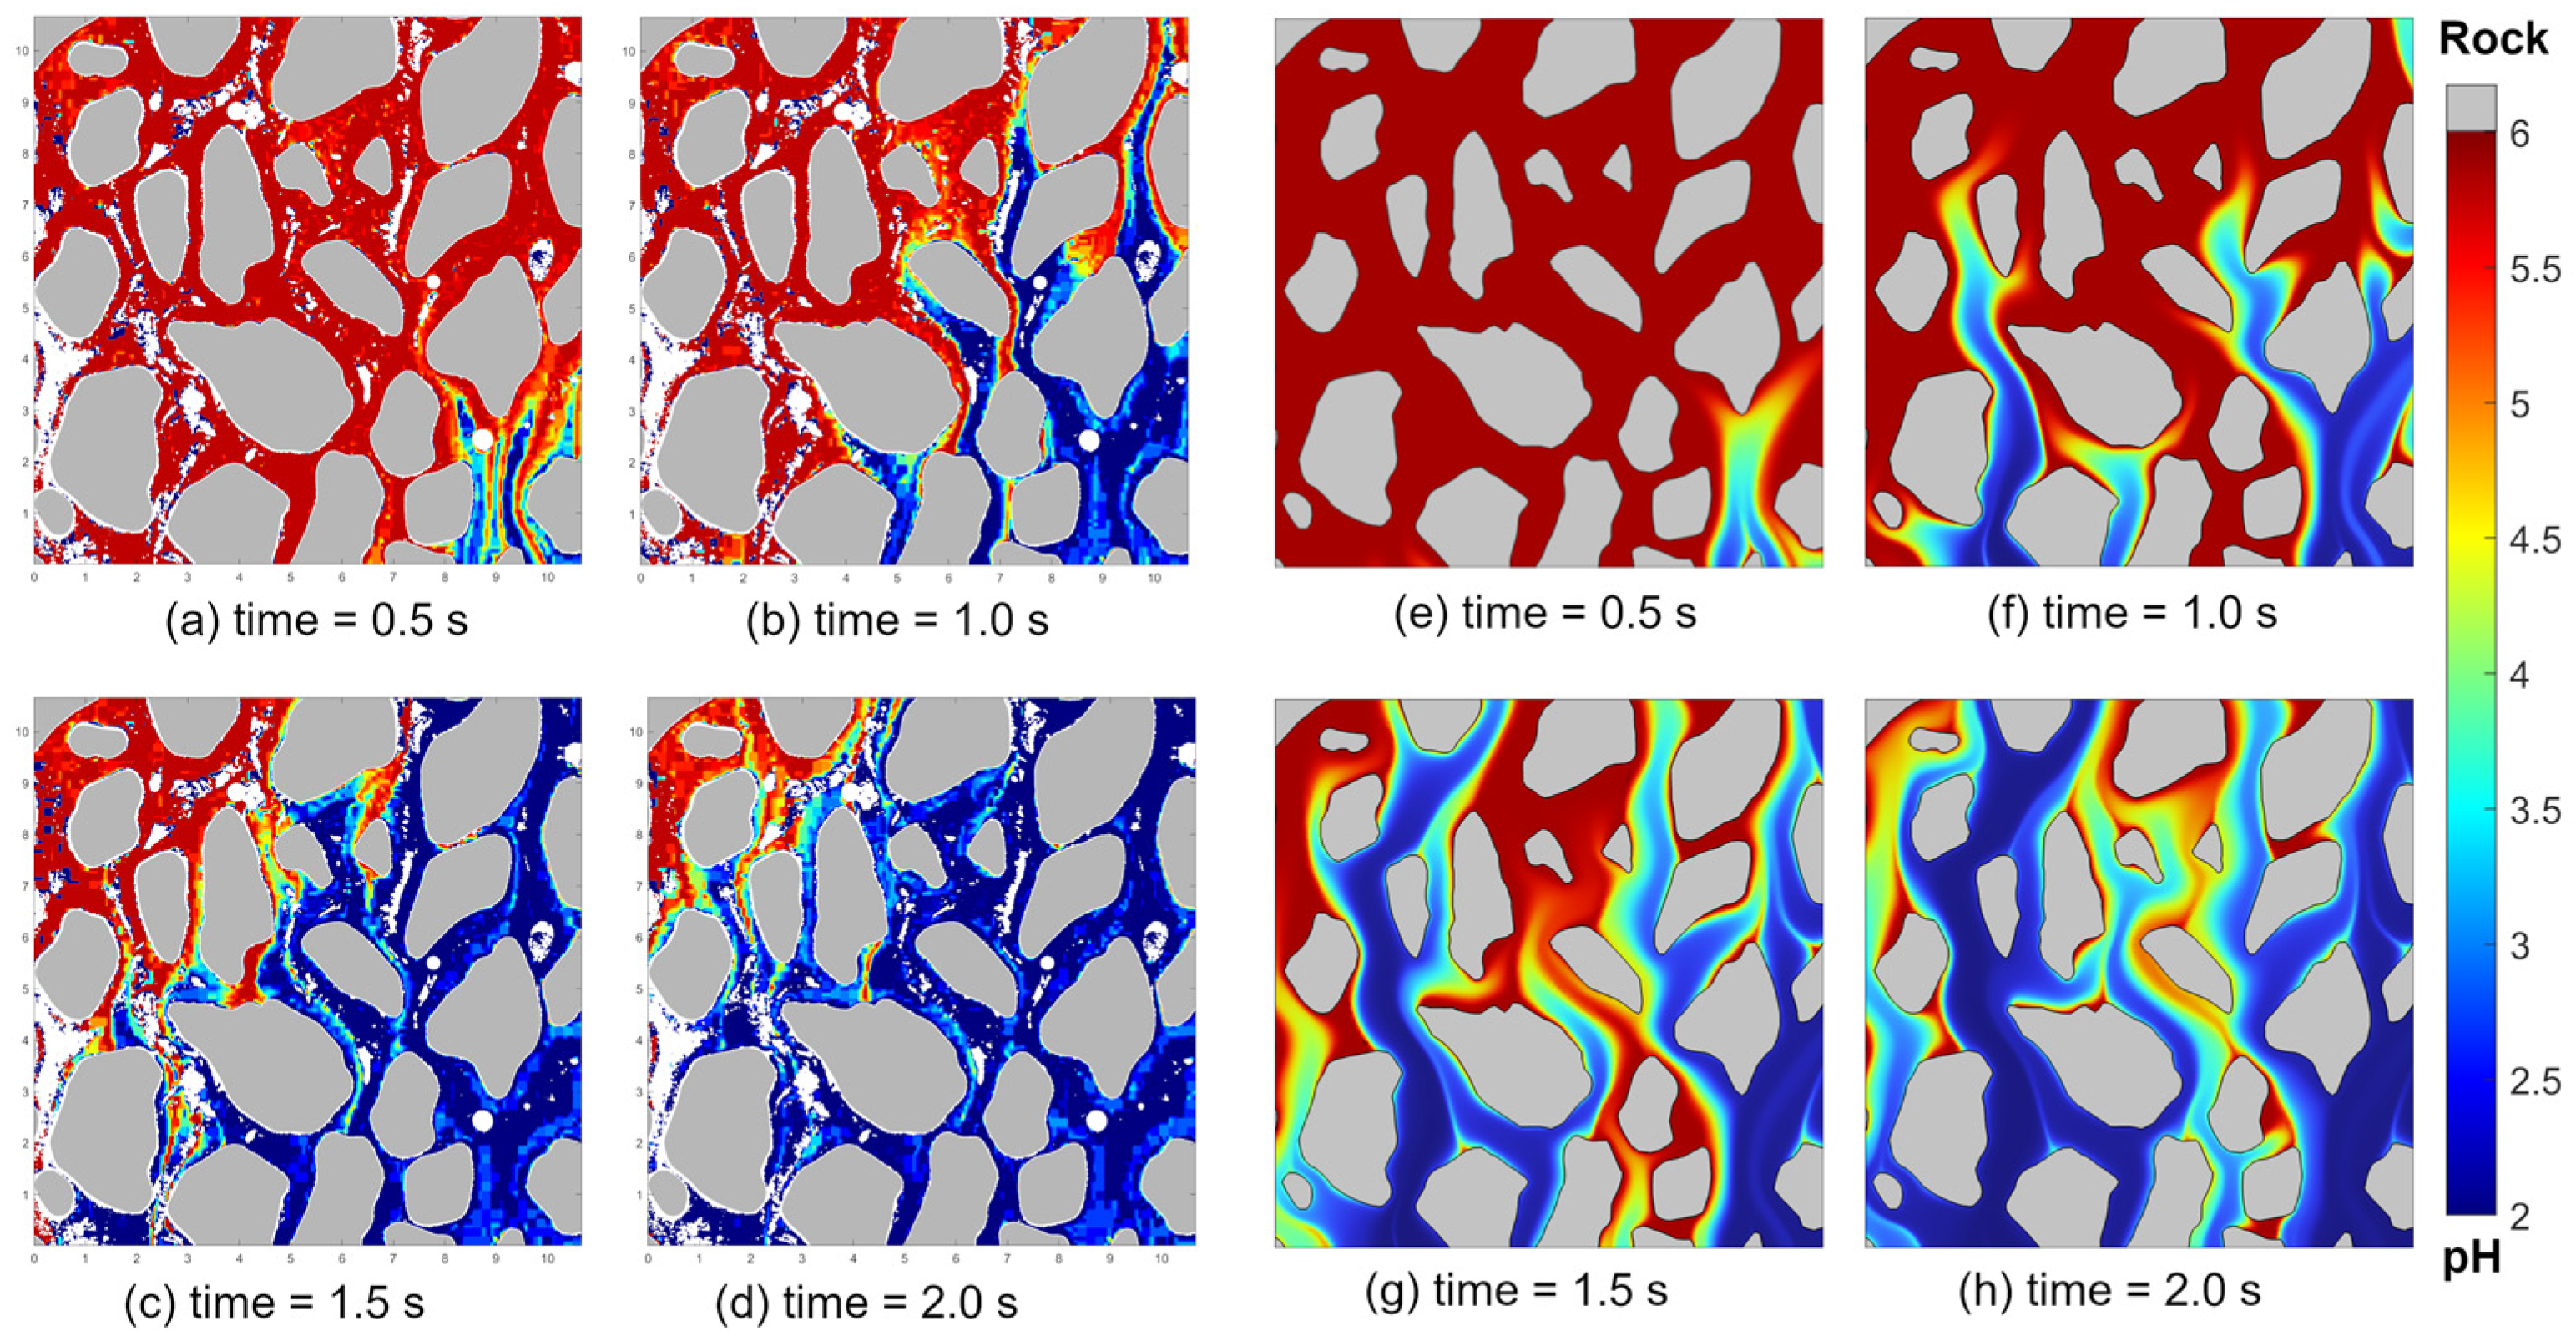
The model was prefilled with DI water, registering a pH of 5.8, manifesting as a red color in Figure 5a. Upon closing the valve on the DI water side and halting the pump, acid injection commenced instantly at a flow rate of 250 µL per minute. The corresponding Reynolds number (Re) ≈ 1.39, defined as
where U is the fluid velocity from the inlet channel, which has a dimension of 3 mm width by Lz = 65 µm depth, and v is the kinematic viscosity of water. The introduction of this acid solution into the pore space induced immediate pH shifts. Figure 5d illustrates the pore space almost entirely invaded by the low-pH acid solution within 2 s. Observationally, the acid’s sweeping action was not uniform in our experiments. Several preferential flow paths, evident by their smaller pH, emerged. These low-pH channels indicate regions with larger flow rates where convection was predominant. This observation is in contrast to interspersed regions that experienced slower pH transitions and smaller pore-scale flow rates, as captured in Figure 5b,d. The whole process is recorded and presented in Video S1 in the Supplementary Materials.
A parallel acid sweep simulation, performed in COMSOL 6.0, revealed a similar pattern, completing in roughly the same 2 s timeframe. A difference between the simulated displacement pattern and the experimental reality is found in Figure 5b,f. The simulation depicted a secondary plume on the left side of the ROI, absent in the experimental visualization. Additionally, the simulation results show more residual high-pH regions, partly because the two-dimensional simulation introduces systematic differences in the setup. The flow field depicted in Figure S1 illustrates the velocity distribution within the system, as well as the trajectory of transport. This visualization provides a clear representation of how fluid moves through the microfluidic model, highlighting areas of varying flow velocities. The trajectories shown in the figure offer valuable insights into the transport dynamics, essential for understanding the behavior of substances, such as reactants or indicators, within the microfluidic environment. The overarching saturation patterns and time scales, however, were consistent between the two, attesting to the rapid and precise pH display capabilities of our PAni-deposited microfluidic model.
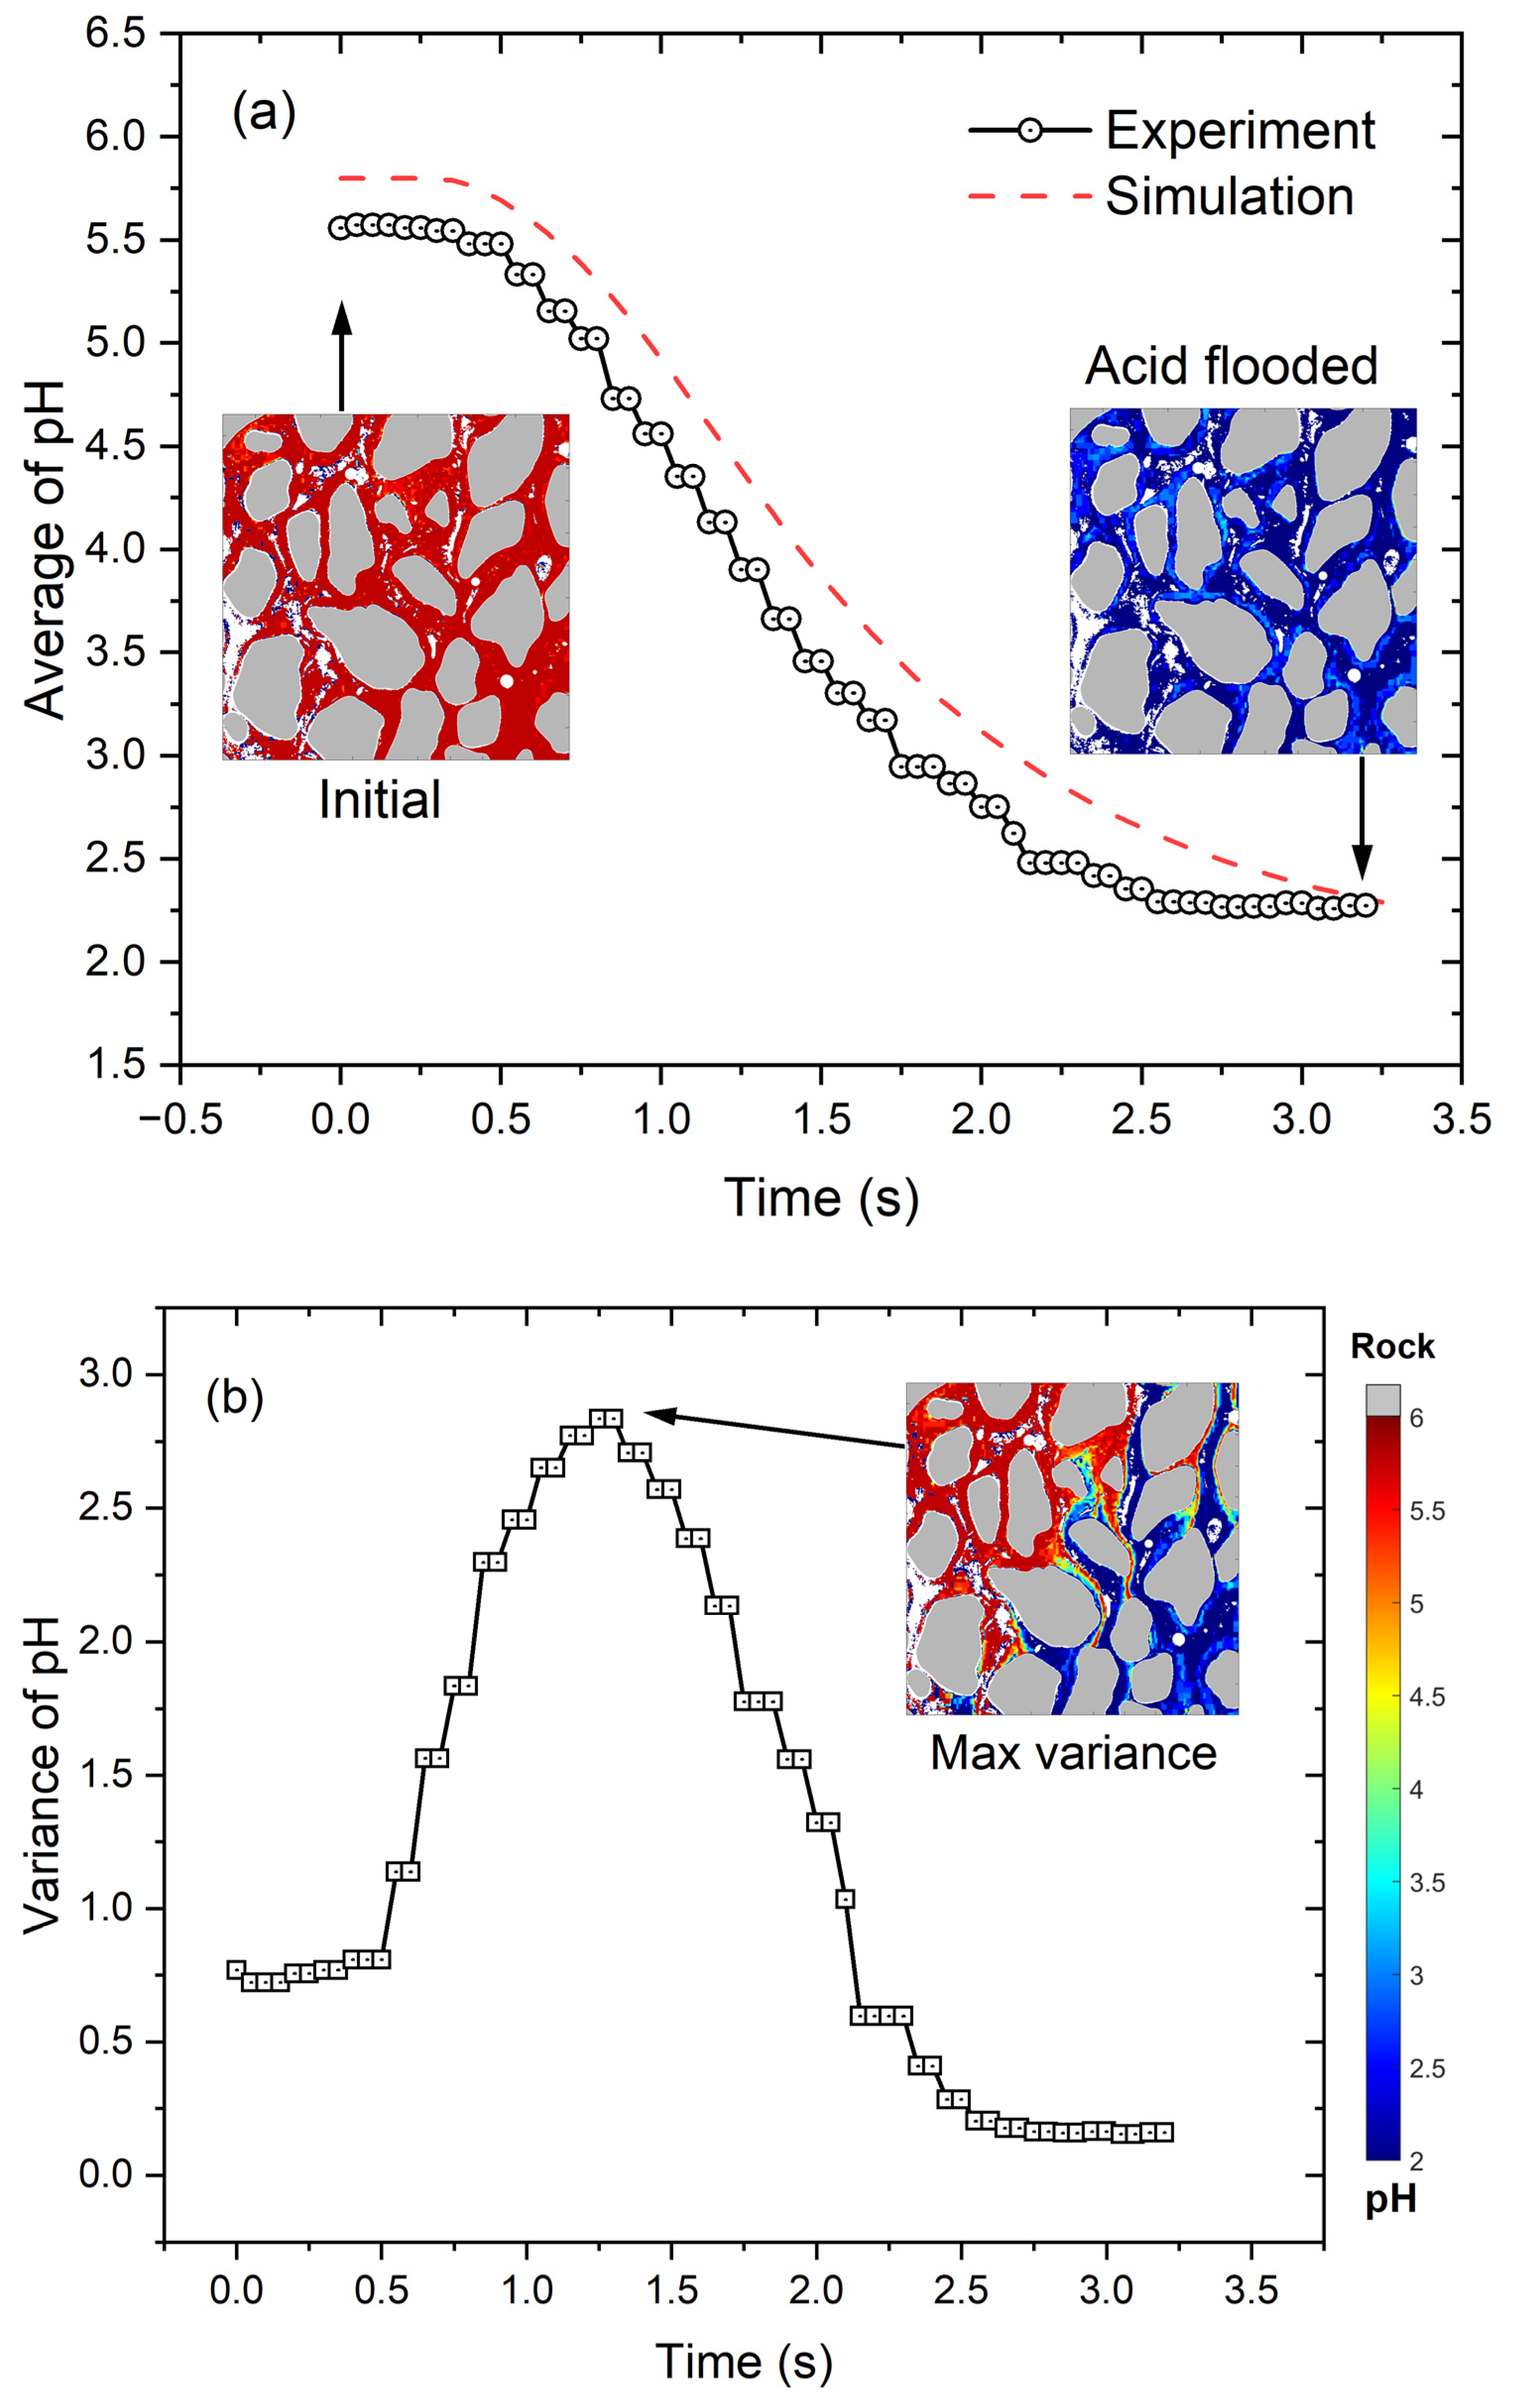
We are interested in observing the spatial transition from relatively high pH to low pH within the system. To achieve this, we computed two fundamental metrics during each frame of the sweeping experiment as follows. (1) Average pH: This metric reflects the overall state of fluids within the porous media and tracks its transitional process. If the system is in a steady state with no new fluid invasion of a different pH or is saturated with fluid of a single pH value, the average pH remains consistent. Even a minute incursion of a low-pH fluid, however, can disrupt this equilibrium. (2) Variance of pH values distributed in the porous media: This metric is a statistical measure of pH values obtained from each pixel, providing insight into the mixing buffer zone between fluids. It ranges from zero, indicating a single pH value, to the maximum, where two distinct pH levels each occupy half the zone space. Formation of mixing buffers and unbalanced distinct pH occupancies result in a medium value between 0 and the maximum. The infiltration of acid, for instance, introduces pockets or clusters of low pH, causing an uptick in variance.
Taken together, these two metrics not only delineate the fluid state within the porous medium but also highlight the dynamics and heterogeneities arising due to the mixing of fluids with different pH levels.
As depicted in Figure 6a, the average pH transitions from approximately 5.8 (weakly acidic) to 2.0 (strongly acidic). There is a slight deviation due to noise in the results that persists throughout the calculation. The pH change undergoes three distinct stages. Initially, the miscible "fingering effect" results in the slow introduction of low-pH fluid into the region, causing a gradual decrease in pH. Subsequently, as more acid permeates the area, the rate of pH reduction accelerates. Finally, after the acid has swept through the region, only small, localized zones of high-pH fluid remain. Over time, influenced by diffusion, the pH stabilizes to a constant value. The simulation results display a greater initial and lower final value compared to the experiment, as it ideally models the transition from pH 5.8 to 2.0. In Figure 6a, the red dashed curves that are positioned above the experimental results indicate more pronounced channeling of low pH invasion in a two-dimensional simulation. In Figure 6b, the variance serves as an indicator of the acid’s introduction into the region, creating a contrast in pH values compared to the original DI water. A peak variance is observed around 1.25 s. During this phase, both the acid and the DI water are roughly in equal proportions within the region, with minimal buffering observed. Notably, the progression of the variance mirrors the changes in average pH. Specifically, the shape of the variance closely resembles the derivative of the average pH with respect to time.
3.3. Coinjection of Low- and High-pH Fluids with the Same Flow Rate
In addition to the sweeping scenario, fluid flow through porous media often involves the simultaneous flow of two fluids with differing pH. We conducted coinjection experiments where both DI water and HCl acid were introduced together into the system. This procedure was designed as a fundamental exploration of the basic transport mechanisms of acid within porous media. Serving as a foundational study, it provides essential insights into the behavior of fluids under simplified conditions. Under these conditions, achieving a pseudo steady state is feasible when advection and diffusion reach equilibrium within the region of interest (ROI). Video S2 offers an illustrative example of this scenario. To verify this final state, we injected fluids exceeding 20 pore volumes (PV ≈ 0.0278 mL) and allowed them to remain for an extended period to ensure that the observed pattern remained unchanged over several minutes. The knowledge gained from this basic test is crucial for understanding more complex flow and transport scenarios in porous media, paving the way for subsequent experiments that delve into intricate aspects of fluid dynamics and interactions within these environments.
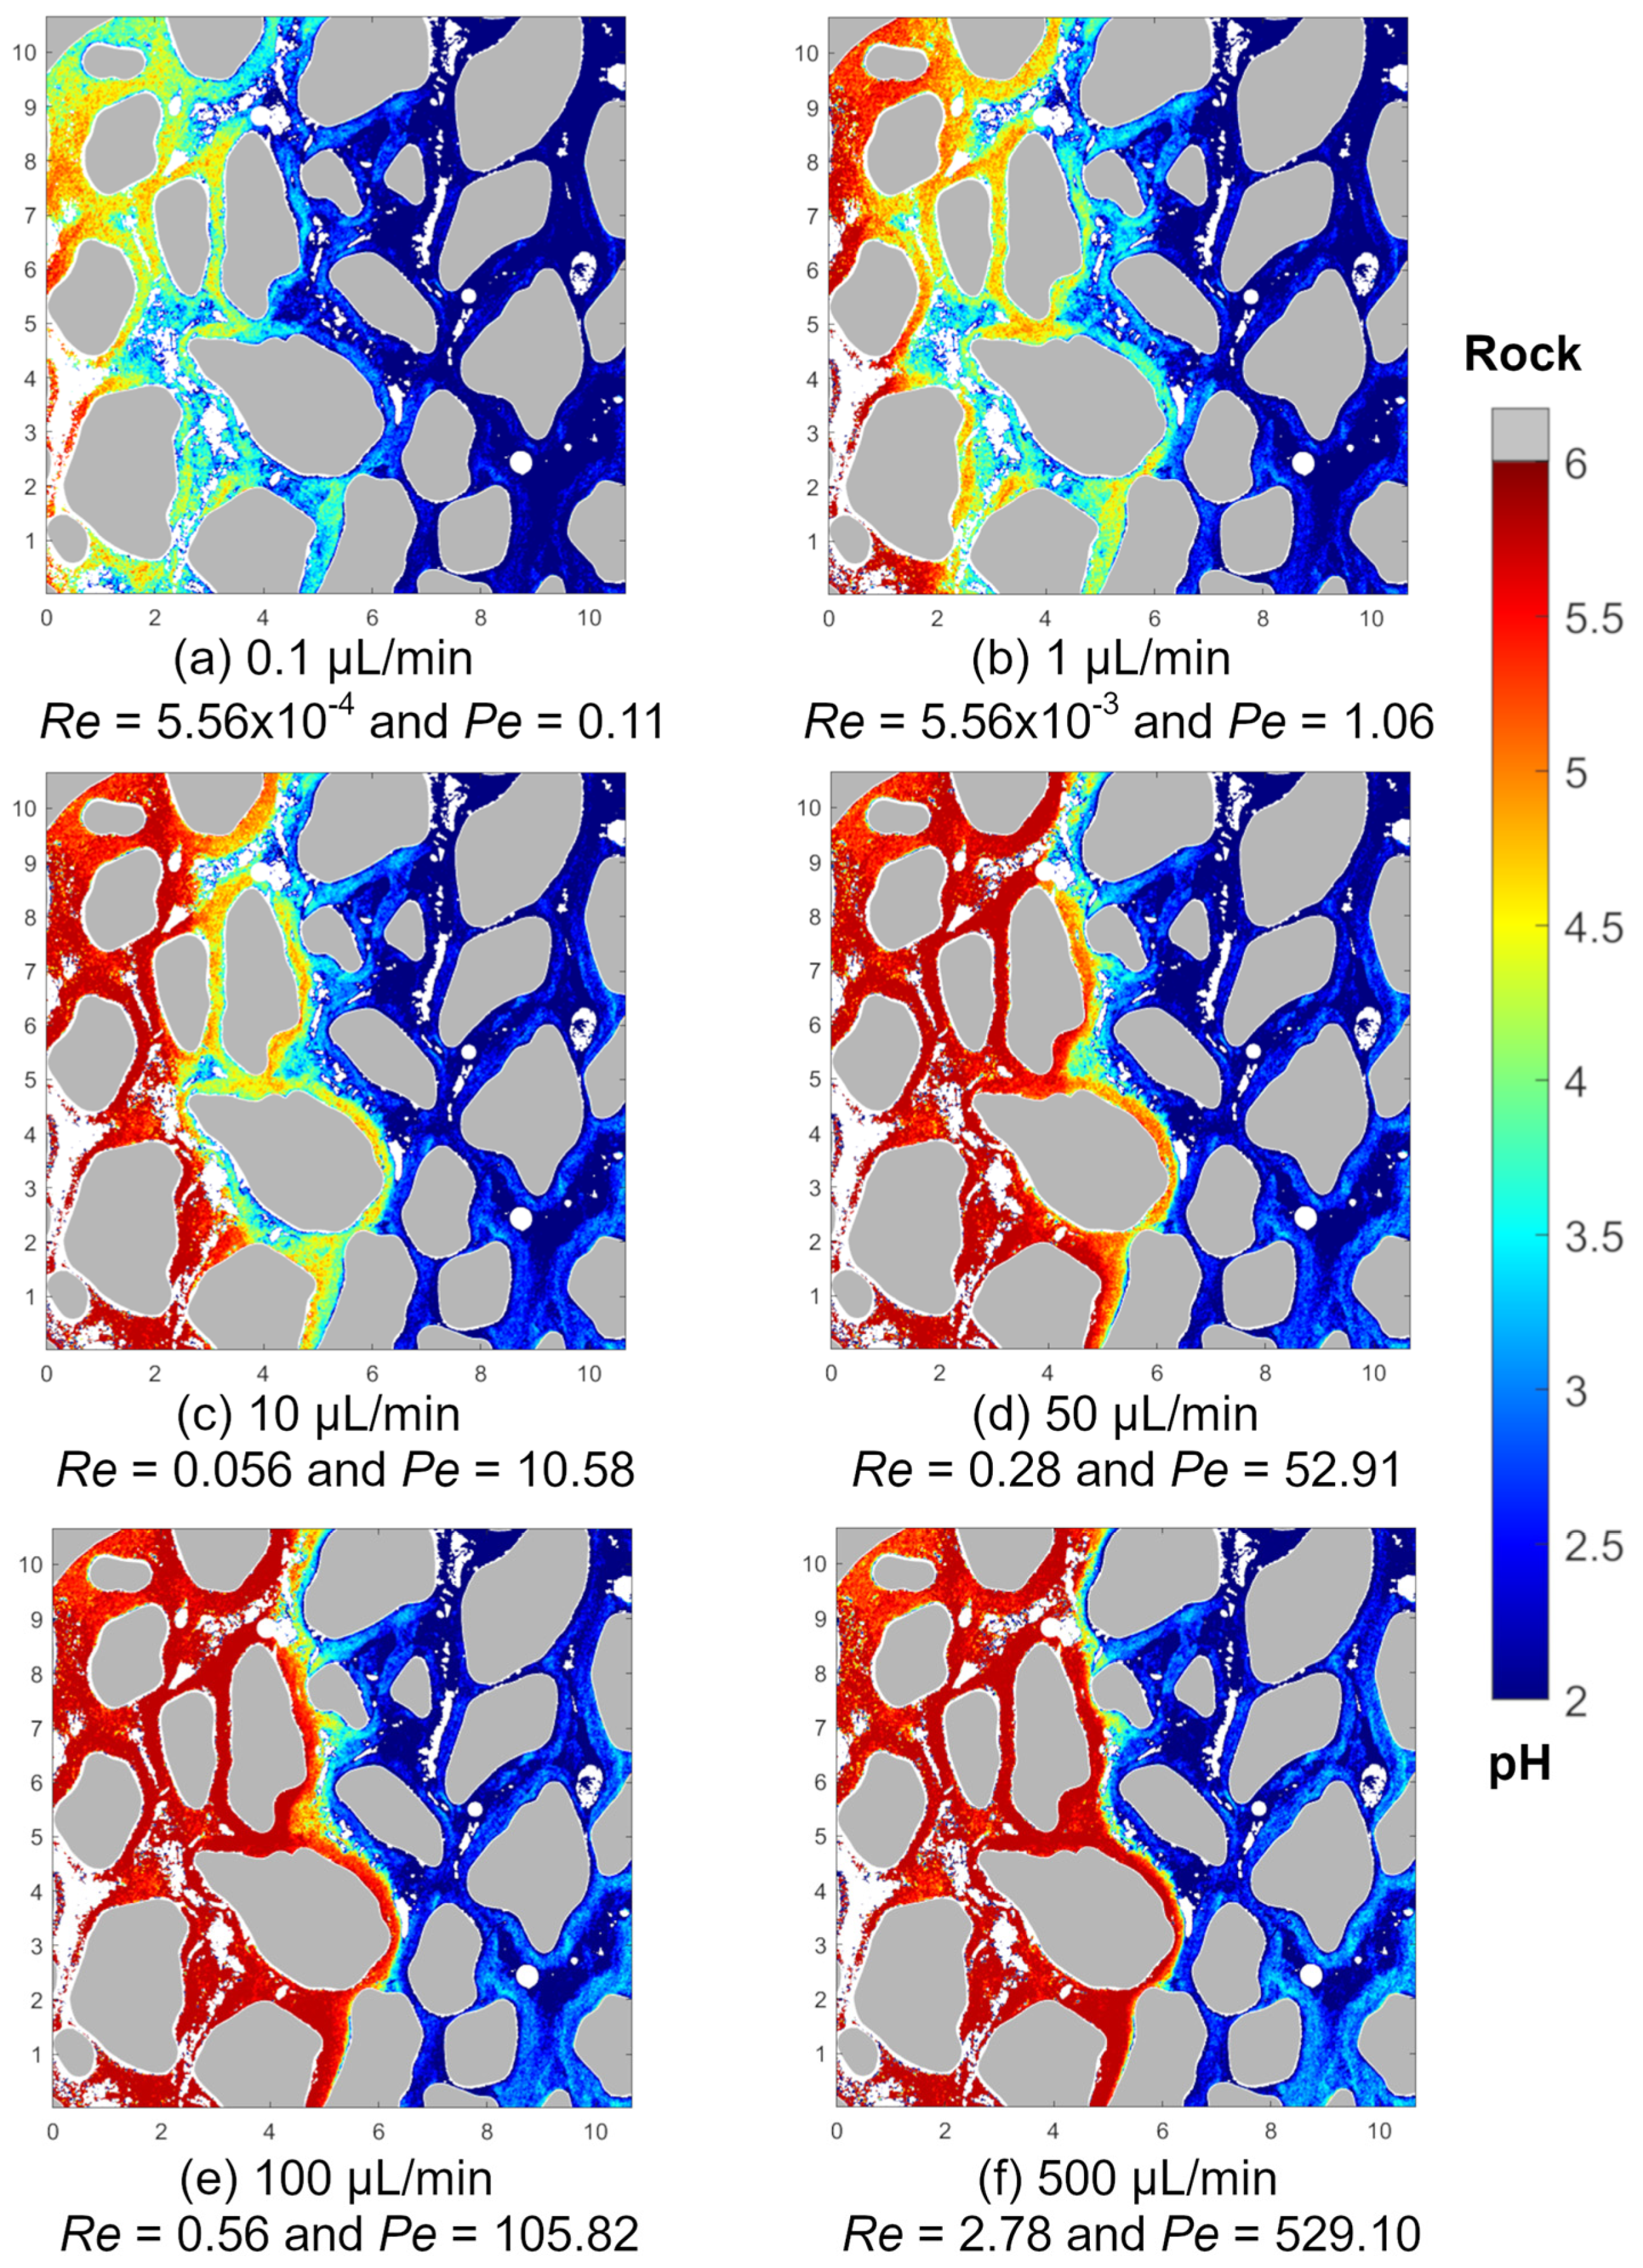
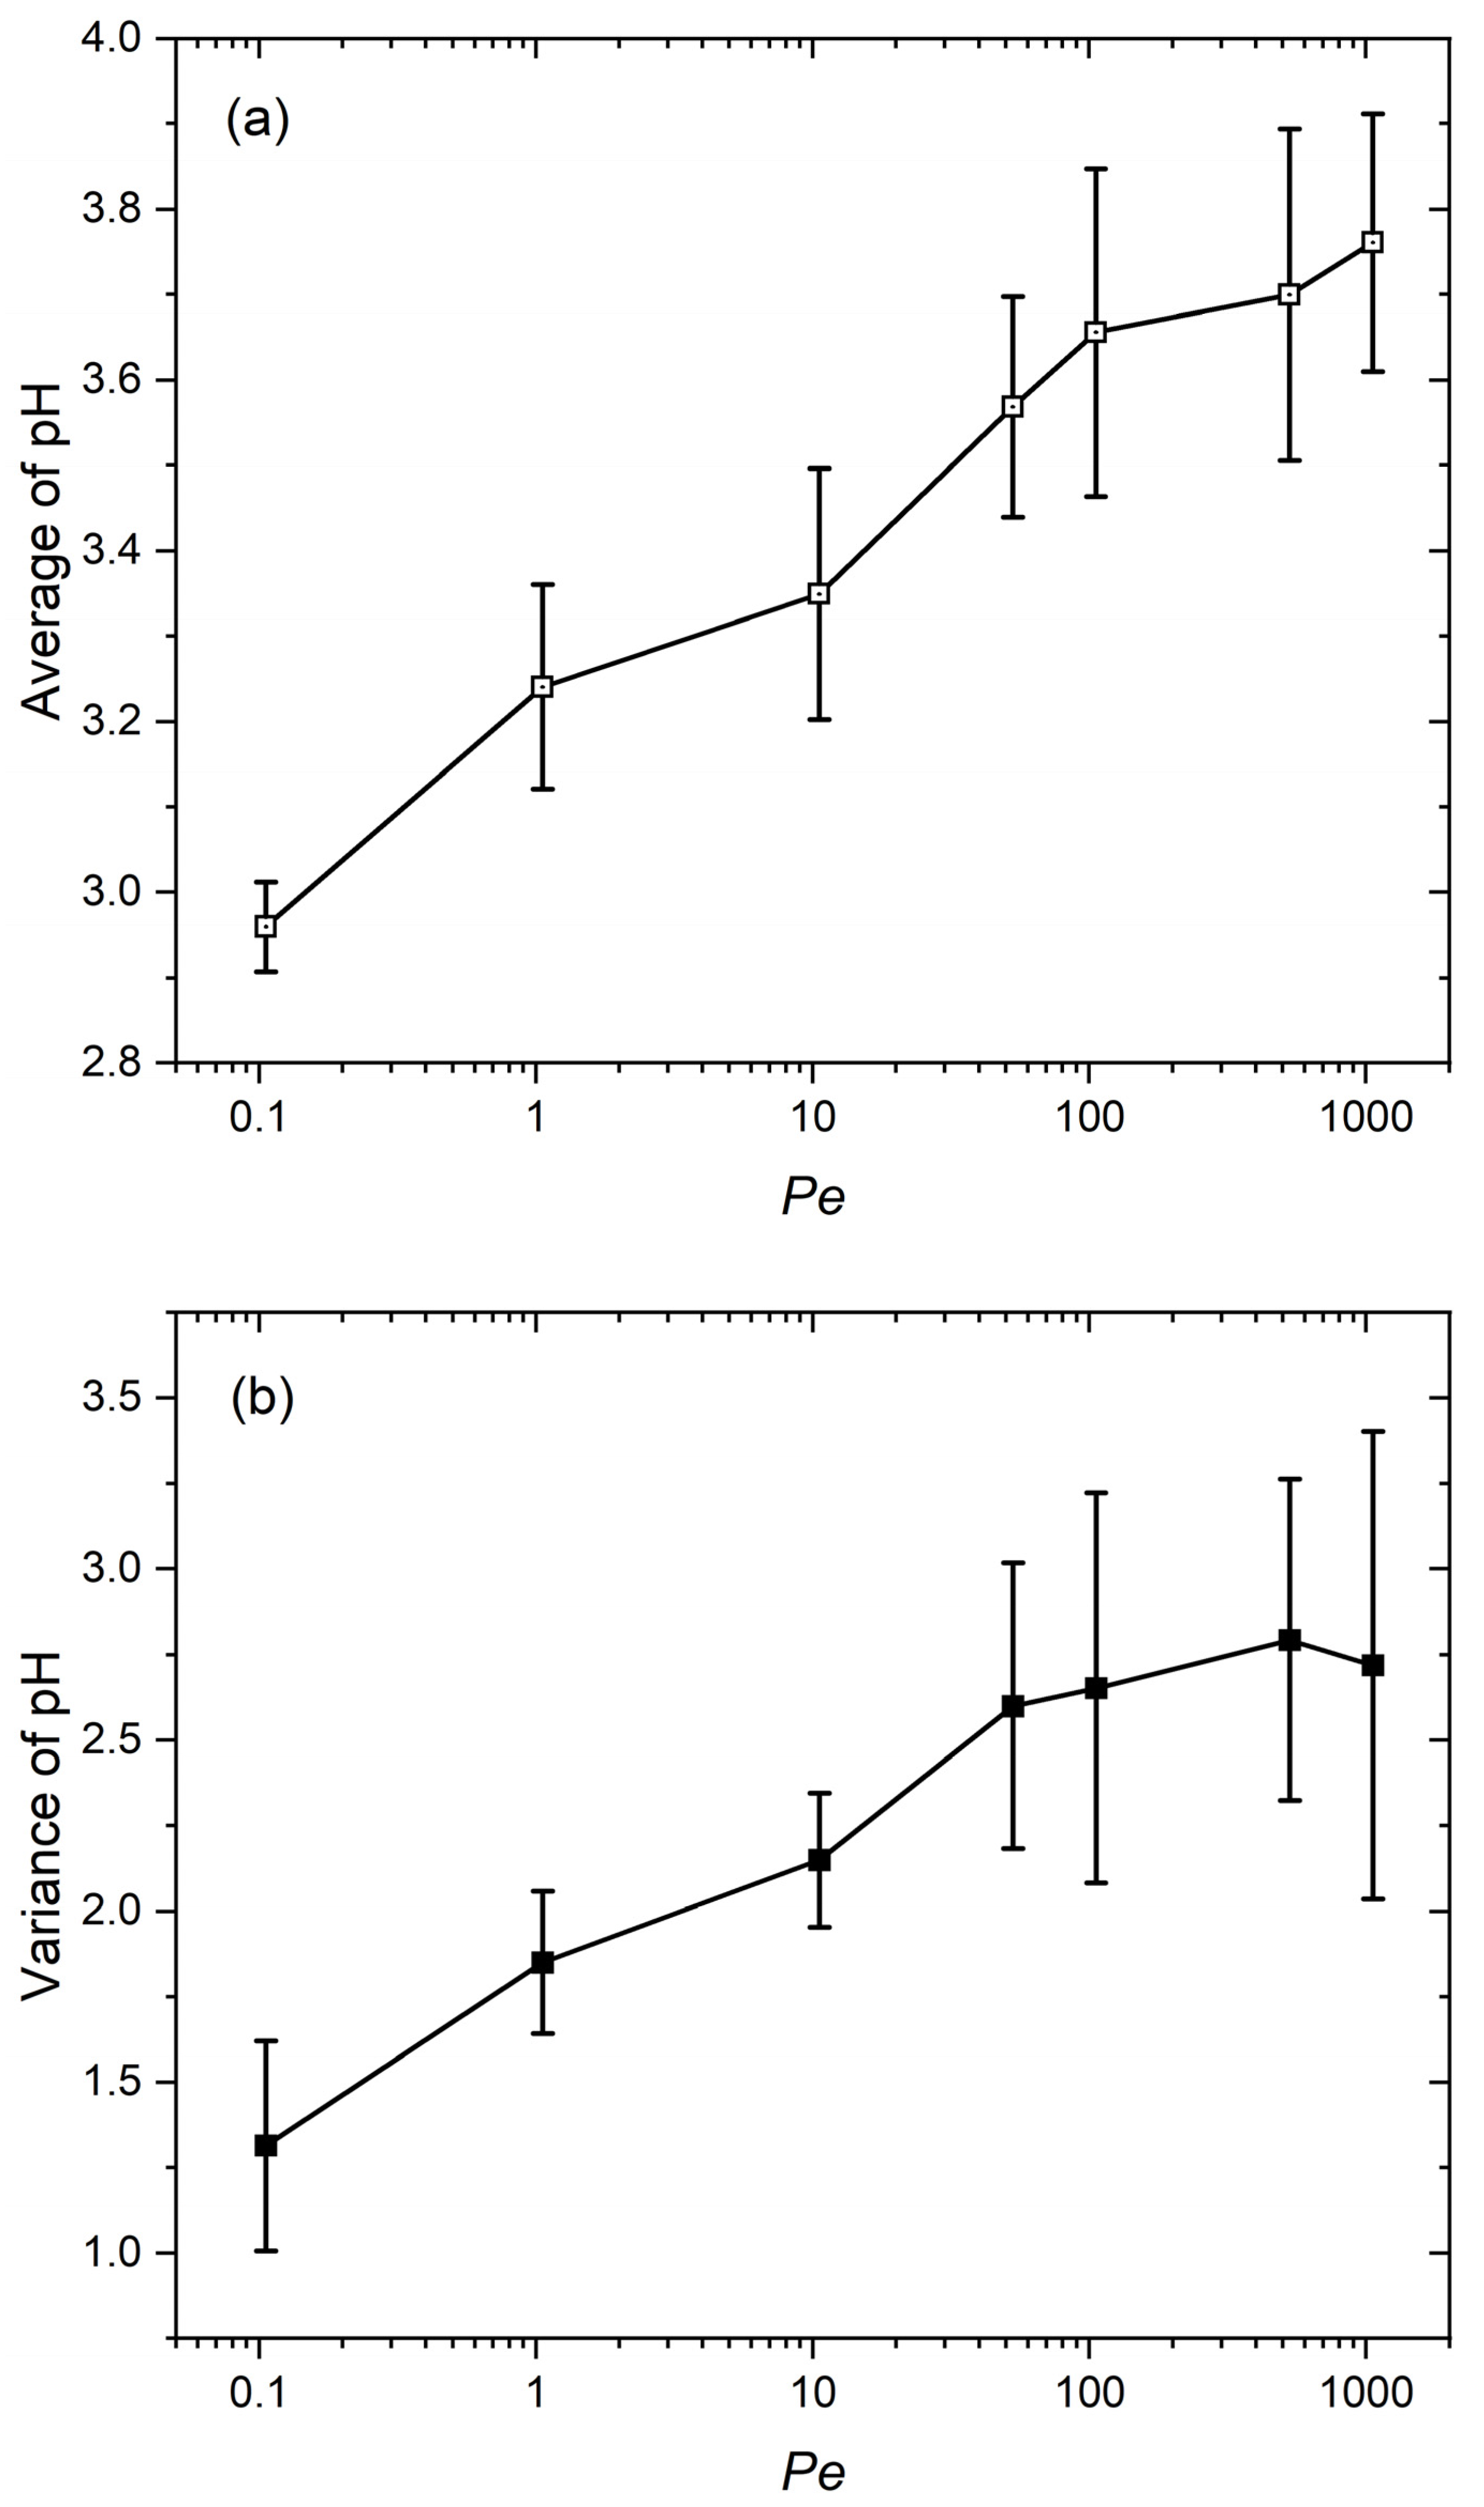
We first conducted a coinjection test using both DI water and acid at identical flow rates. For this test, we explored a broad spectrum of Péclet numbers (Pe)—a dimensionless number that gauges the influence of advection over diffusion in transport processes. We adjusted the flow rate from 0.1 µL per min up to 1000 µL per min to vary the Péclet number. The Péclet number is computed as follows:
where Da is the diffusivity of H+ in the DI water. At room temperature, the value is around 5.25 × 10⁻⁵ cm2/s. Correspondingly, the Re number ranges from 5.56 × 10⁻⁴ to 5.56, spanning 4 orders of magnitude, and all these conditions can be classified as creeping flow. Fluid injection follows the setup shown before in Figure 2, where acid comes from the lower right and DI water from the lower left.
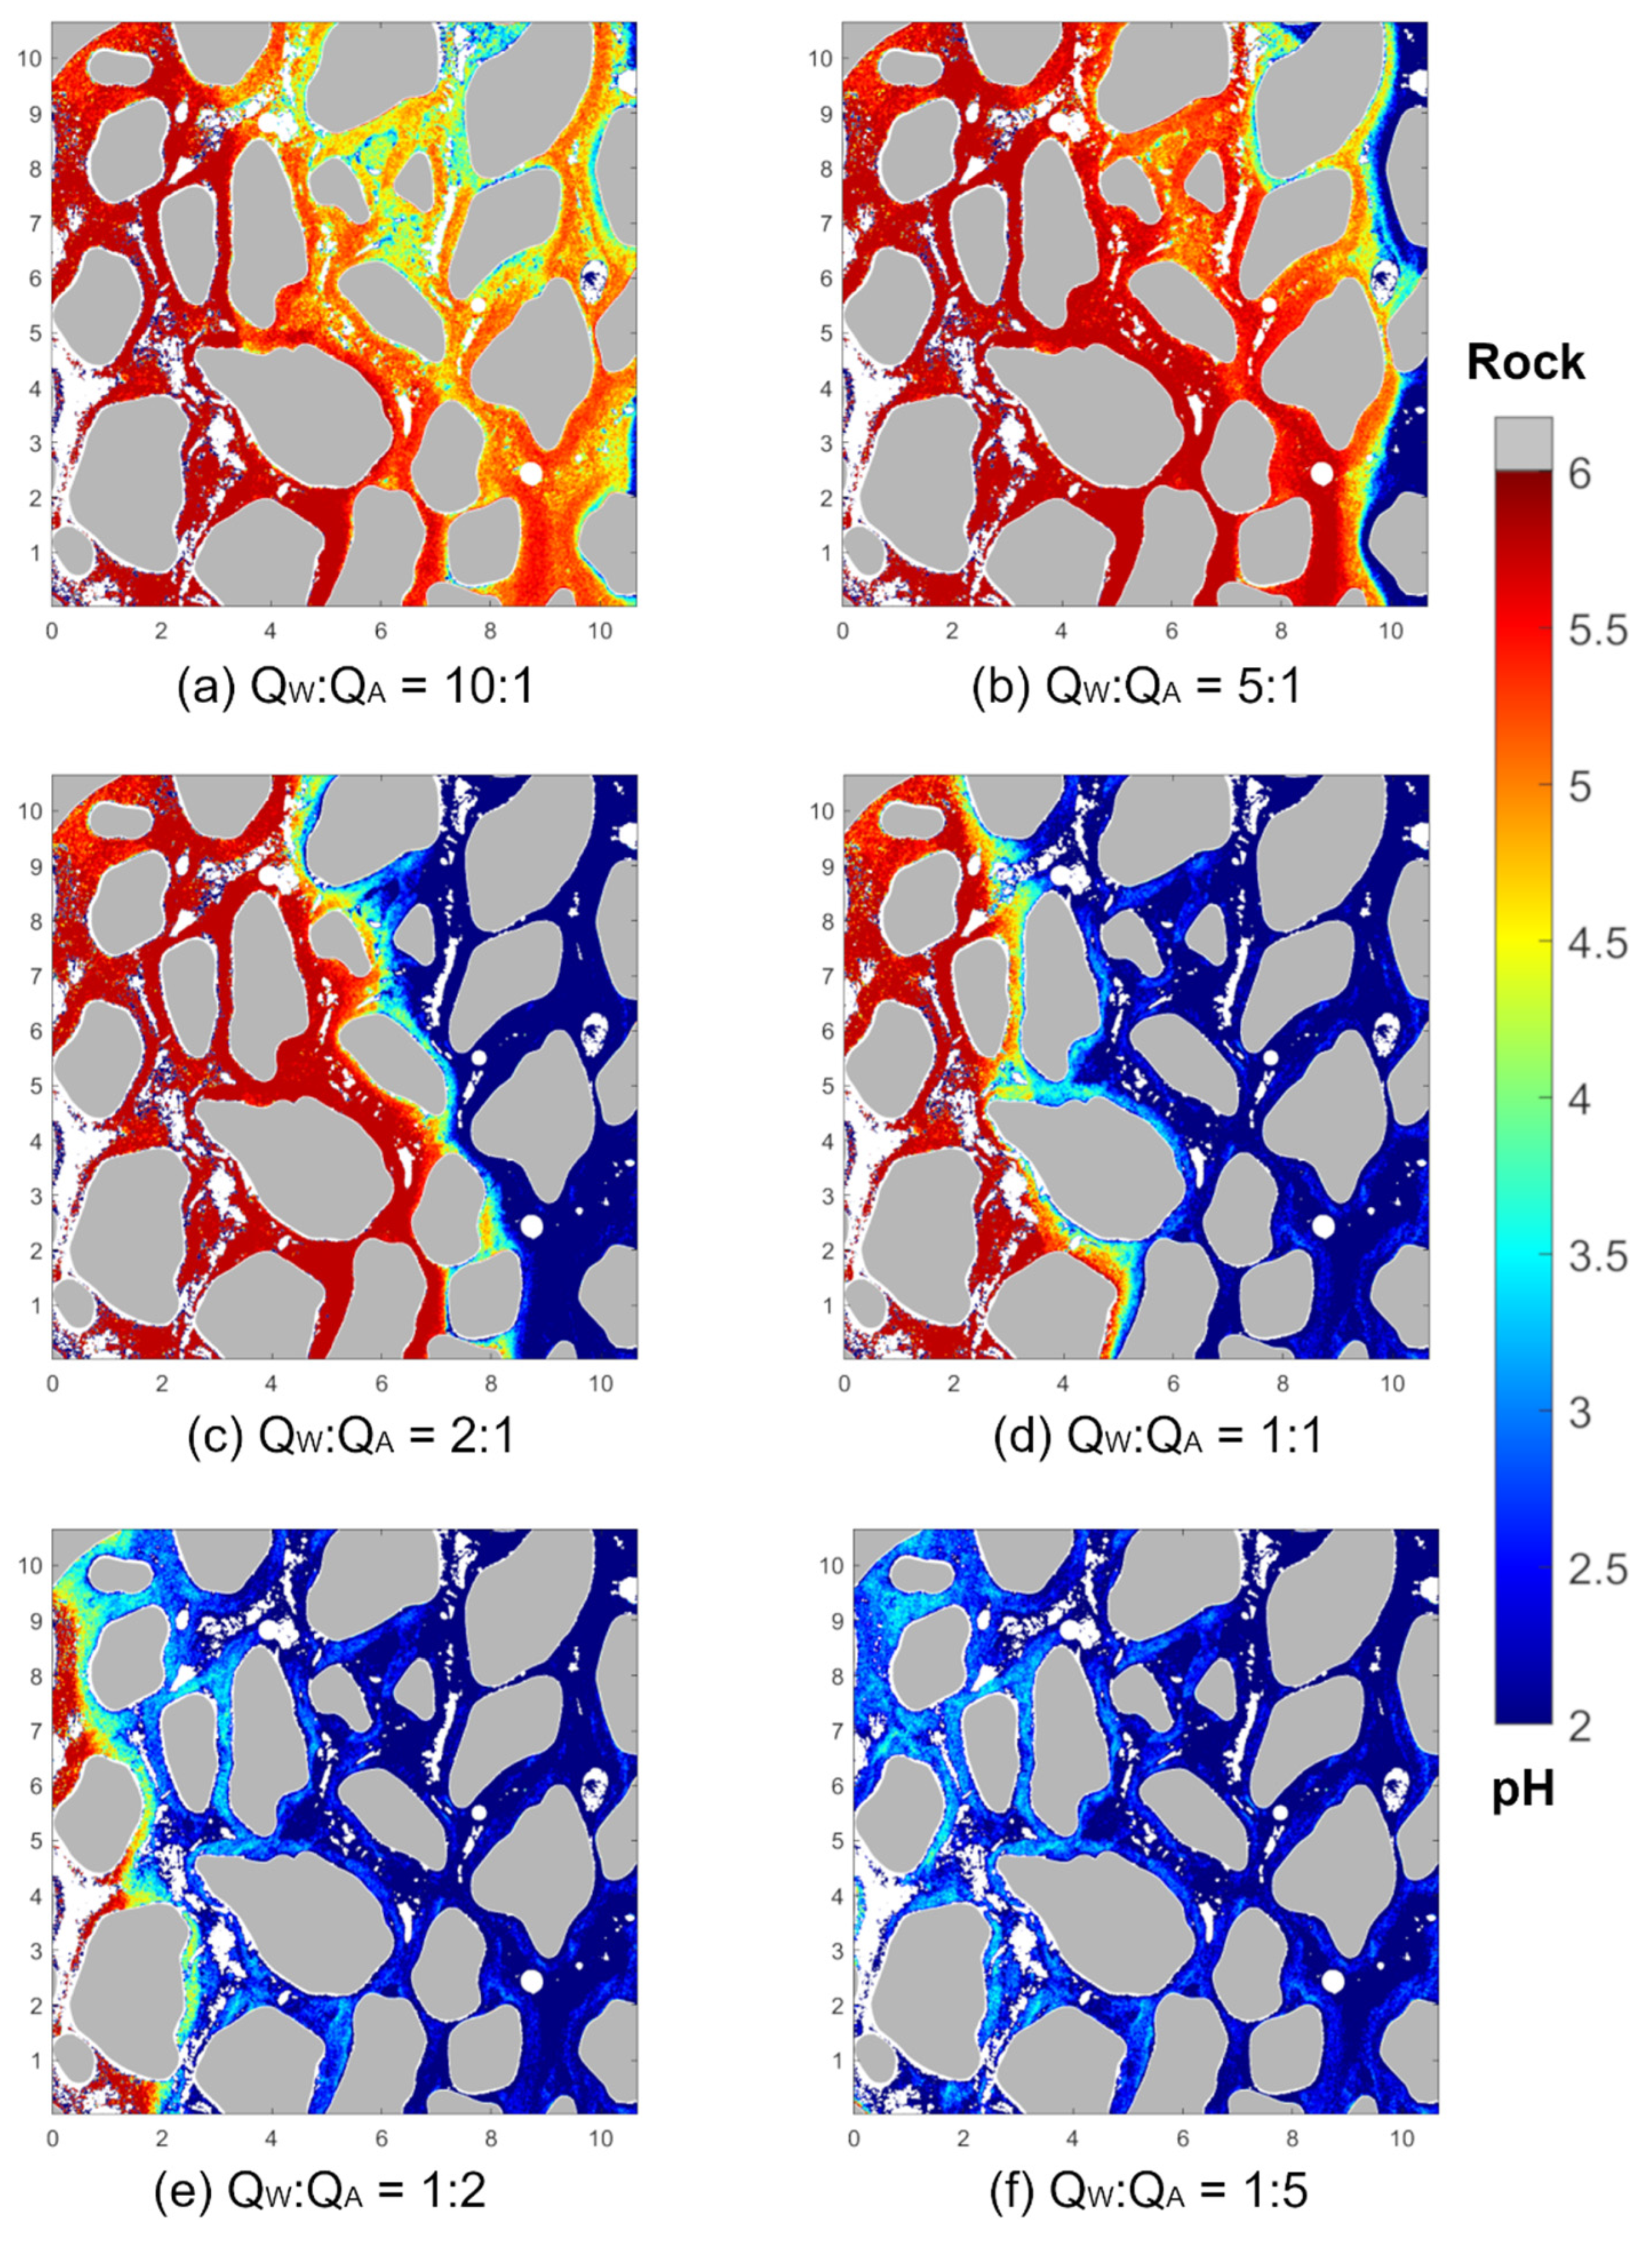
Figure 7 illustrates the pH distribution in the porous medium during the coinjection of two fluids at varying flow rates. At a minimal flow rate of Q = 0.1 µL/min, the associated Pe is merely 0.1. In this regime, the effect of diffusion is evident, resulting in a broad transition zone of pH between the two injected fluids, with pH ranging from 2 to 5.8. It is essential to note that while pH logarithmically represents hydrogen ion concentration [H+], diffusion predominantly follows a linear process. Consequently, as depicted in Figure 7a, a high pH value is confined to a narrow band on the figure’s left side, with most of the porous medium presenting a transition from the acidic small pH to DI water with a larger pH.
As the flow rate and its associated Pe increase, the diffusion-controlled transition zone narrows, making the boundary between low- and high-pH regions more defined. By the time we observe in Figure 7f, only a thin layer of fluid shows a pH ranging between 2 and 5.8. At this juncture, the convective forces overwhelmingly govern the transport, relating to a high Pe of 529. This leads to an almost even distribution of the two distinct pH values across the porous medium. Greater flow rates result in a similar pH distribution pattern, and so the figures for these cases are not included in Figure 7.
From the average pH and the variance of pH in the ROI, insights into the evolution of the pH transition zone with respect to the Pe number or flow rate can be drawn (refer to Figure 8a,b). At a lower Pe, about half of the observed region displays a pH value near 2, while the majority of the medium is dominated by fluids with pH spanning from 2 to 5.8. In such scenarios, the corresponding average pH plunges below 3. Because the flow of DI water suppresses the acid diffusion, there is a noticeable increase in the average pH, reaching a value of approximately 3.6. As the transition region between the two fluids becomes less pronounced and a more distinct boundary appears, the rise in average pH stabilizes around a Pe of 52.9. This stabilization is evident in the pH distribution showcased in Figure 7d, where there is minimal variance in the pH transition zone from Figure 7d through Figure 7f. Furthermore, when wide pH transition layers exist, the pH distribution exhibits reduced variance because intermediate pH values are compensated between the maximum and the minimum. On the other hand, in scenarios where two distinct pH clusters are apparent, the variance is markedly larger. This trend is evident in Figure 8b. As the width of the transition layer shrinks, there is an increase in variance, eventually plateauing once the transition layer becomes sufficiently narrow.
3.4. Coinjection with Different Ratios of Flow Rate
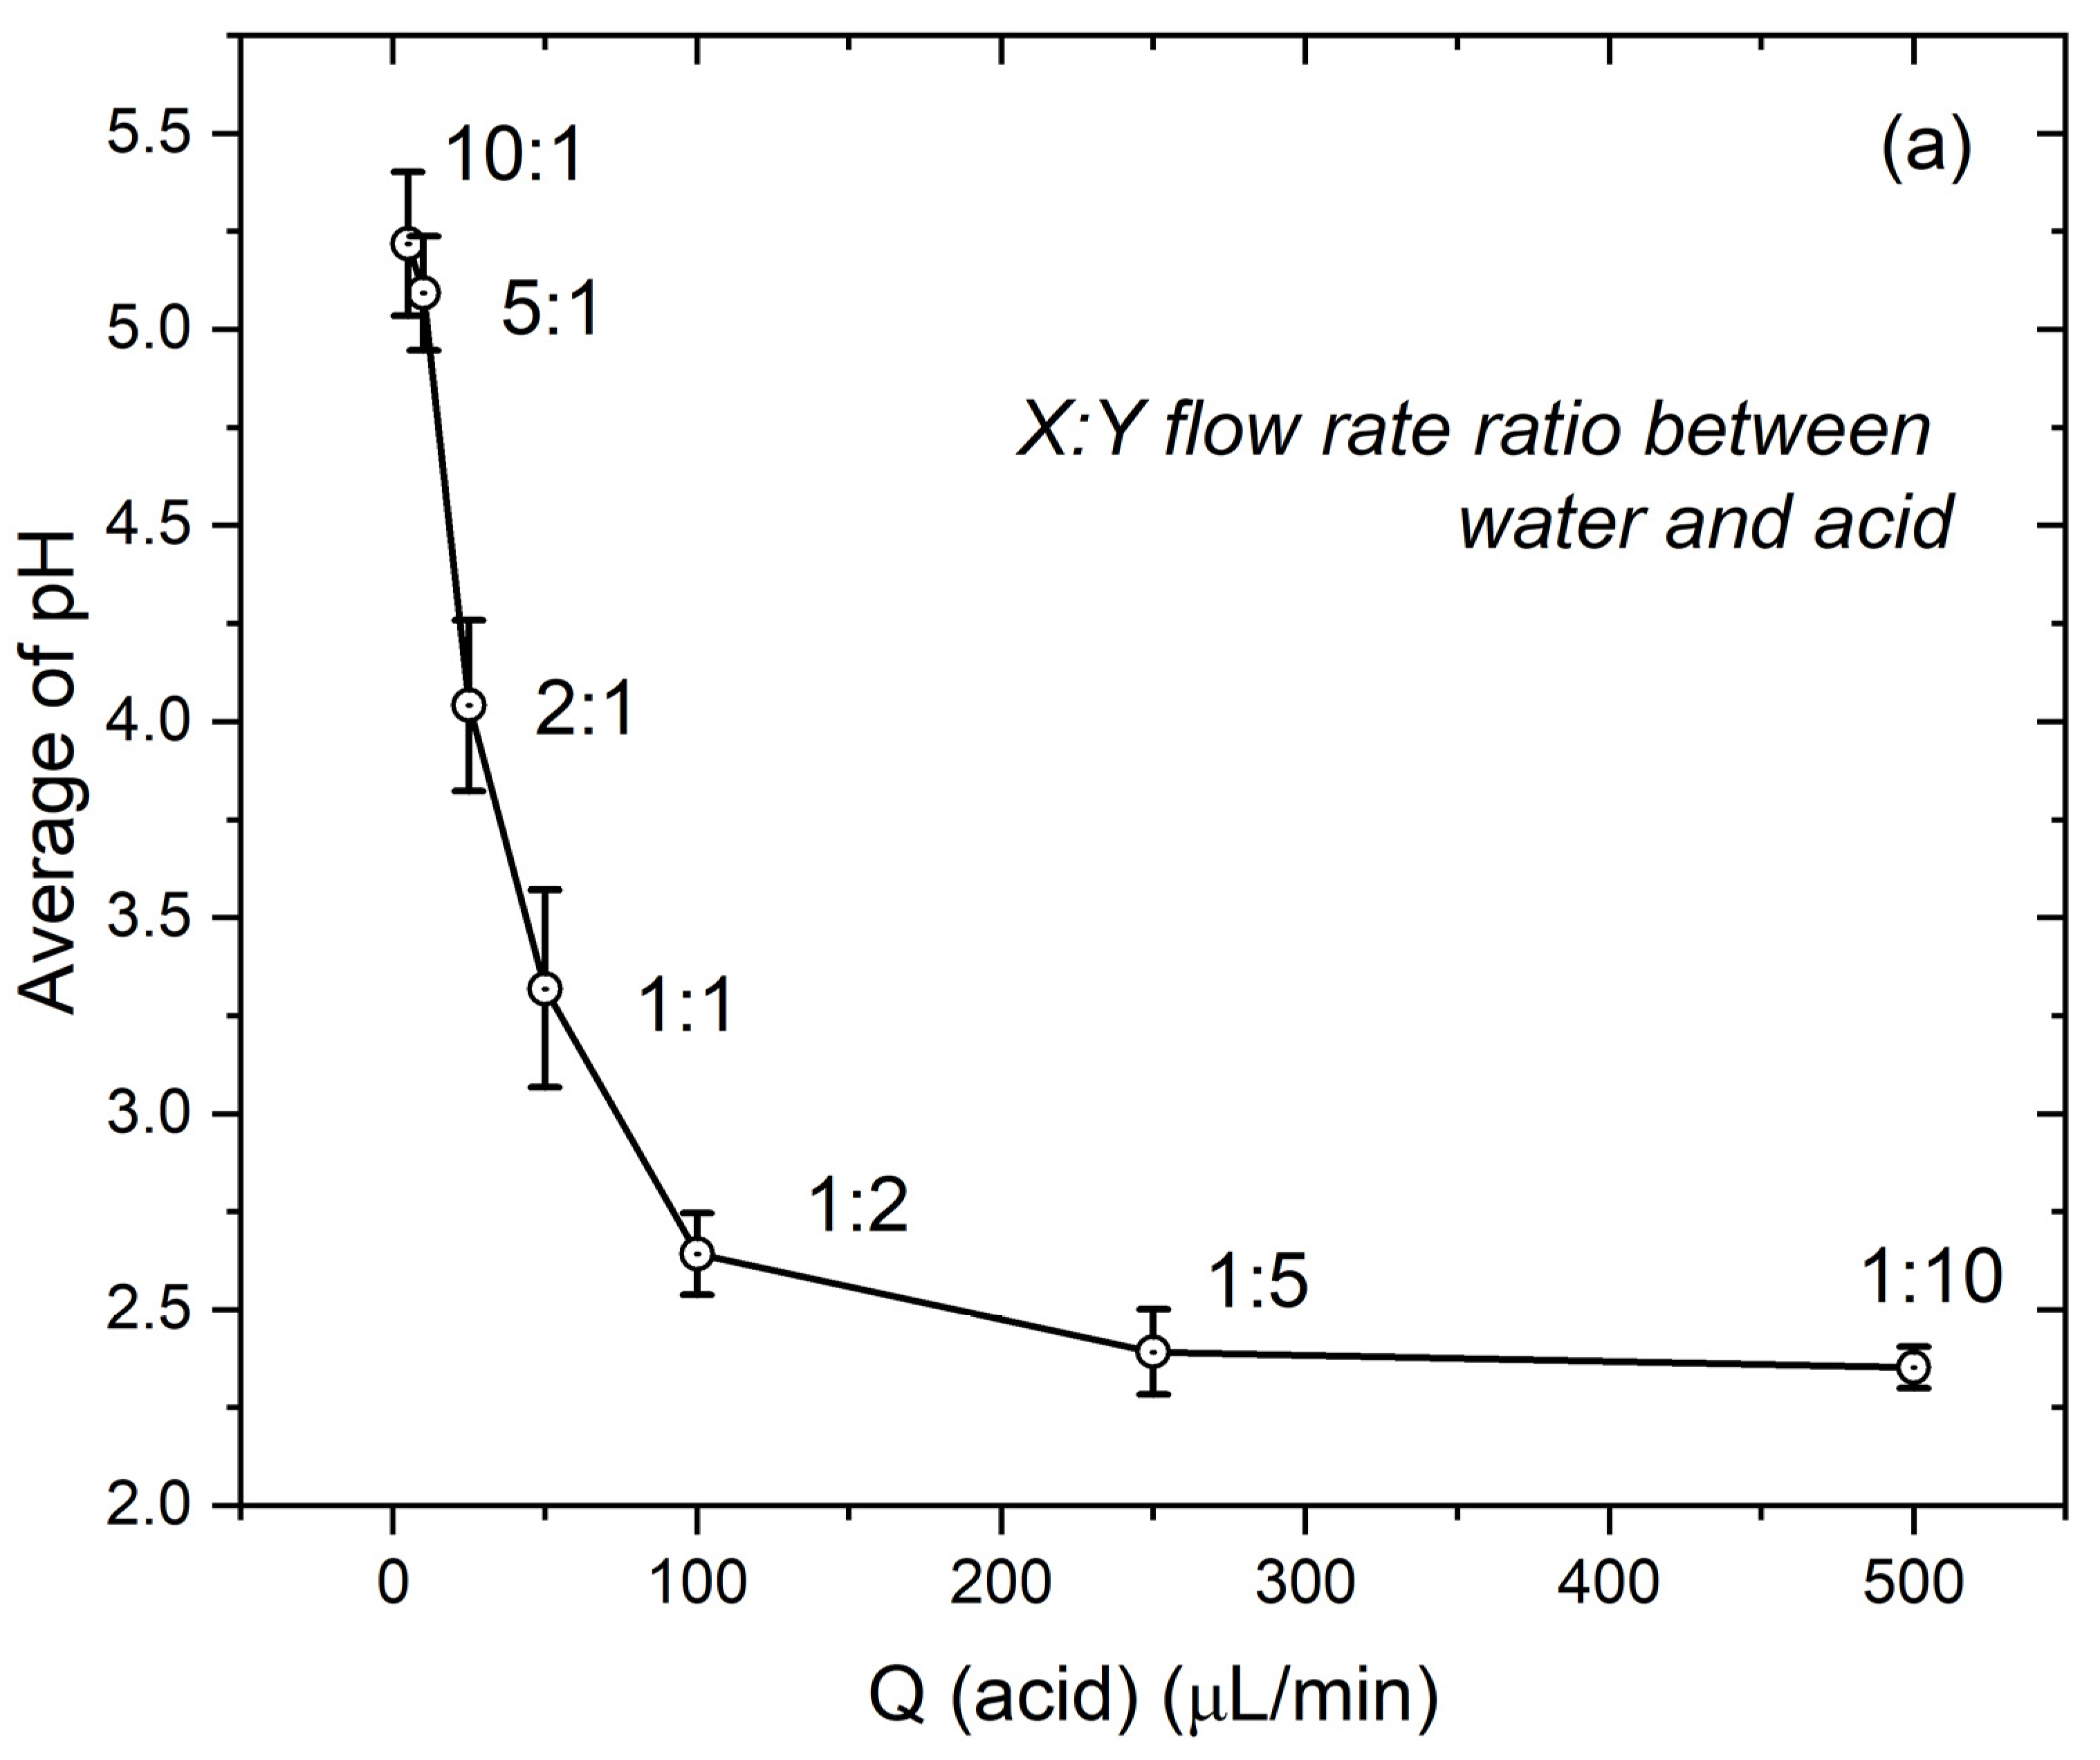
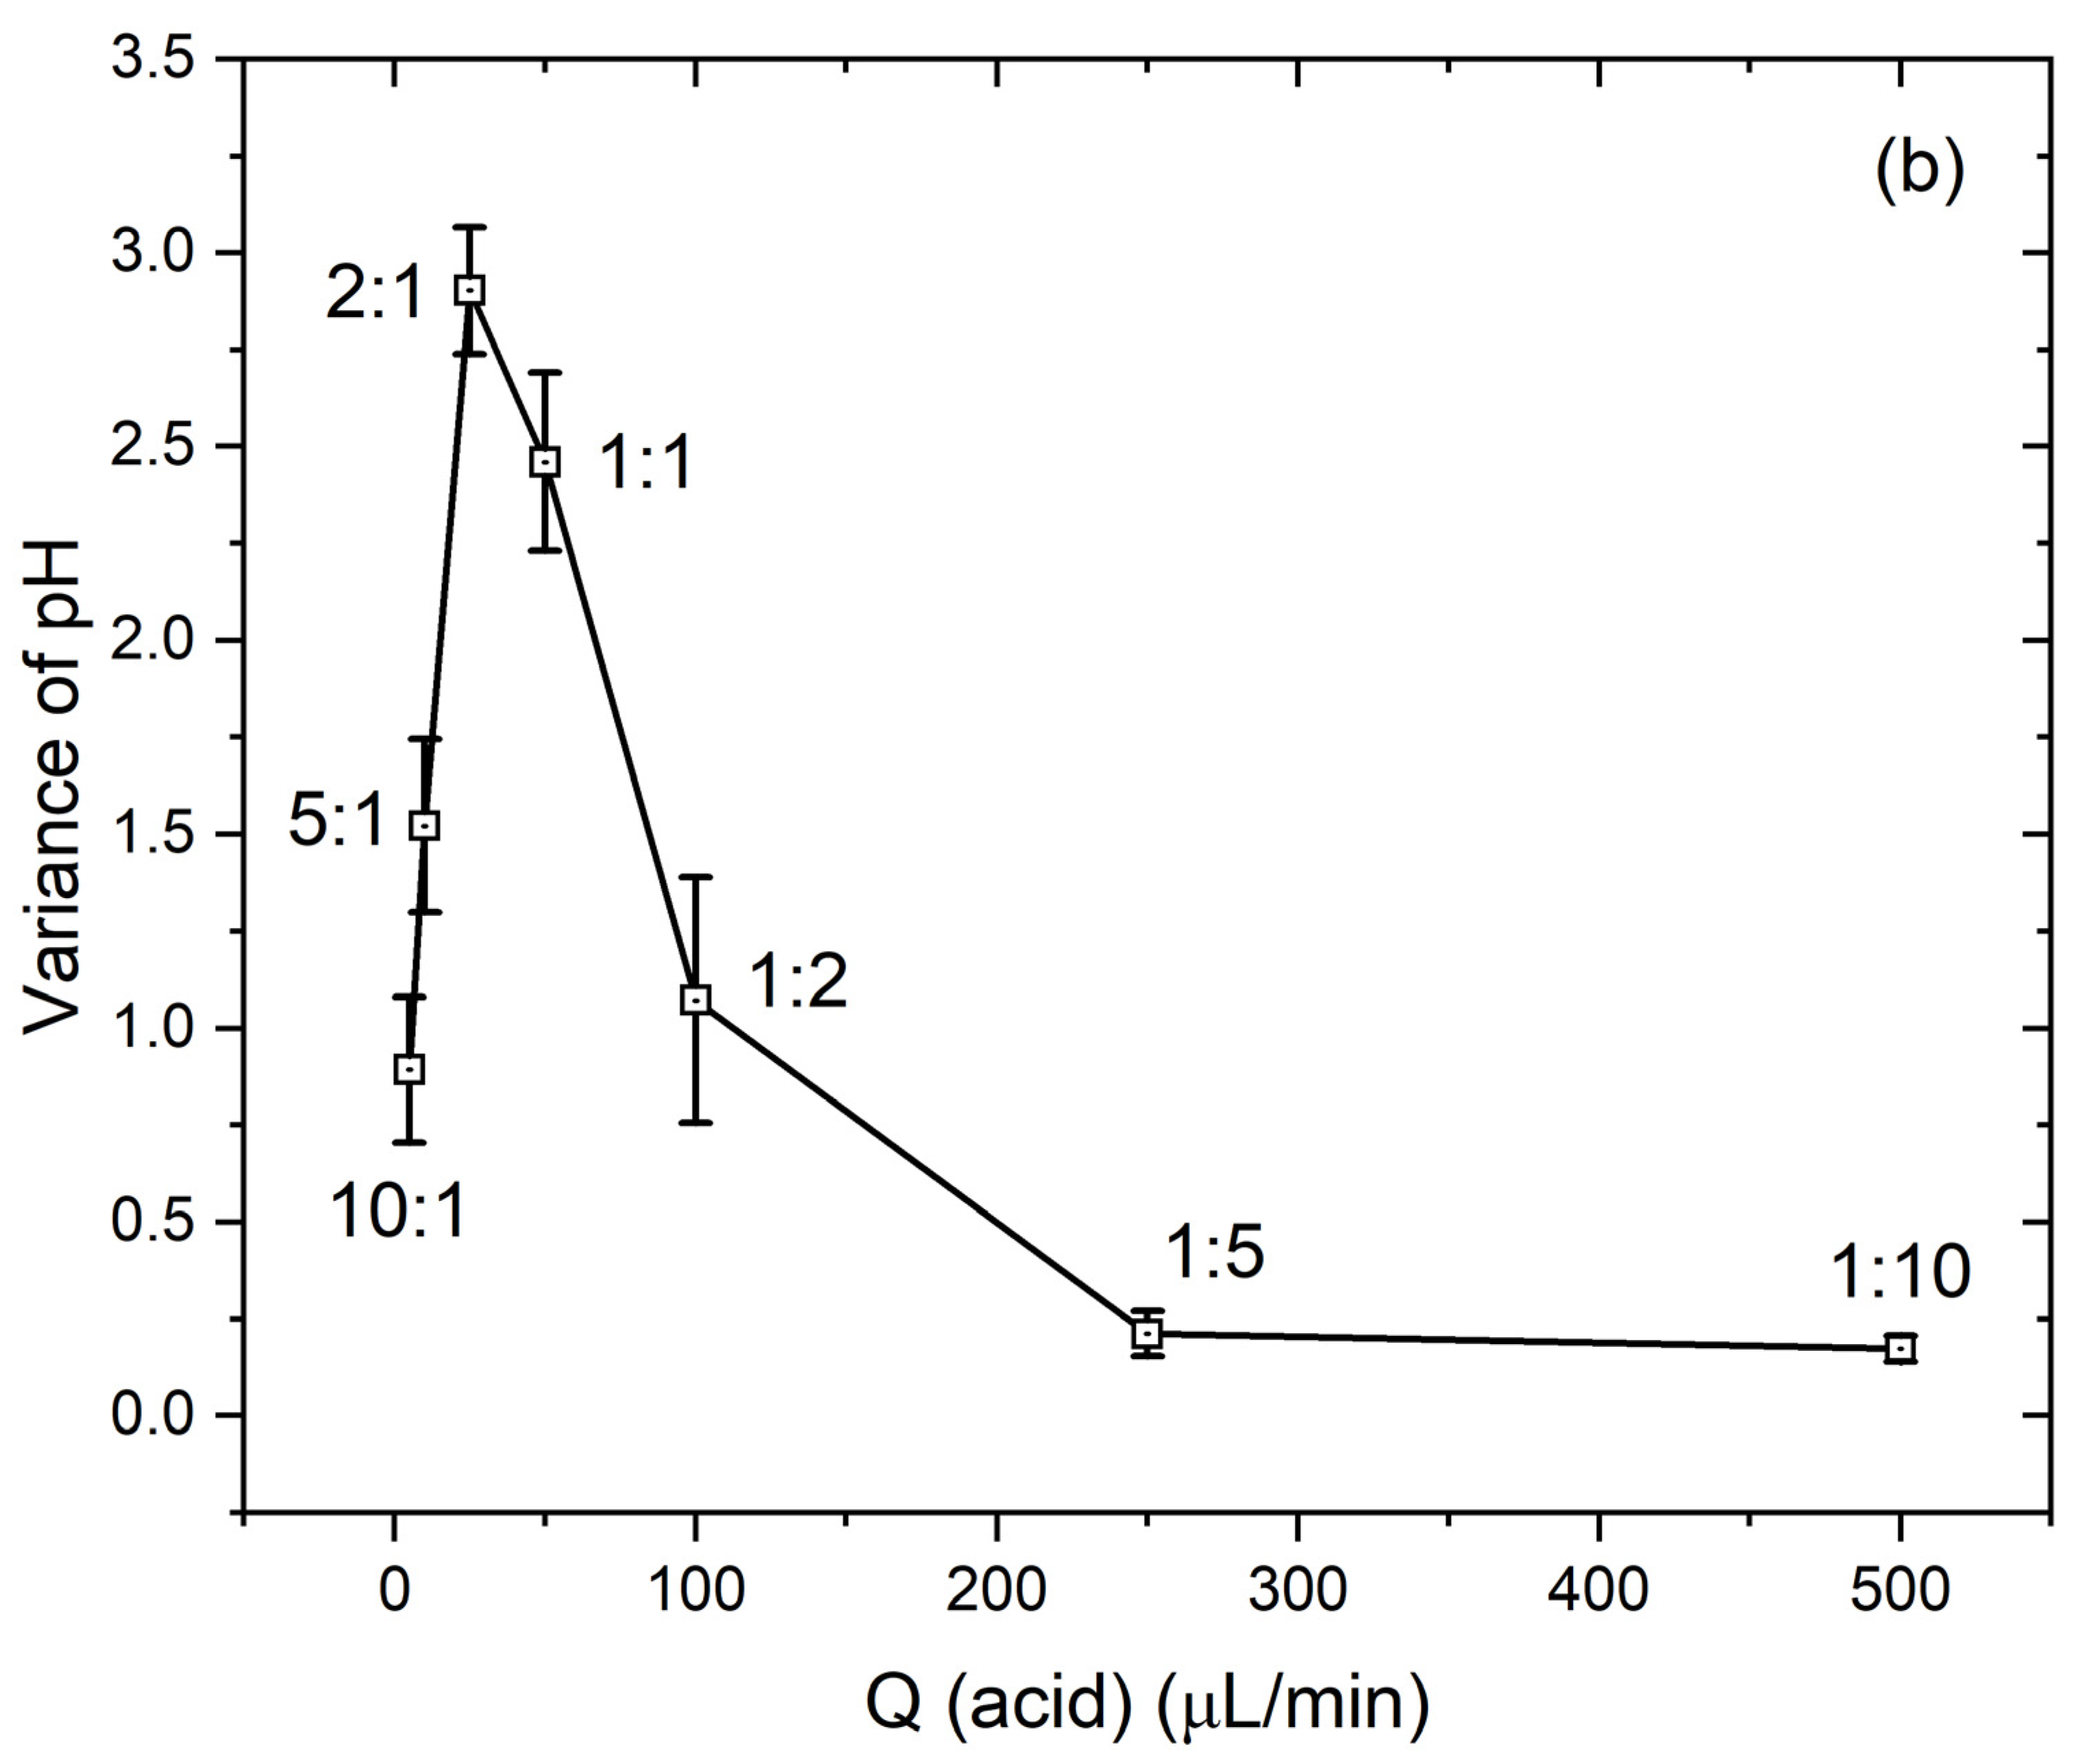
In our investigation into the effects of fluid flow rates on pH distribution, we conducted another coinjection test using varying ratios of the two fluids’ flow rates. For this, we held the DI water injection rate steady at QW = 50 µL/min while varying the acid injection rate QA from 5 µL/min to 500 µL/min.
Figure 9 illustrates the shifting dominance between DI water and acid as we modified the acid injection rate. When only a minute amount of acid (5 µL/min) is introduced into the bulk of the DI water, it tends to disperse, creating a substantial buffer region, as demonstrated in Figure 9a. In this scenario, the predominant pH value remains from DI water. It is noteworthy that almost half of the ROI is occupied by a buffer zone with a lower pH value. In Figure 9b, a pronounced stream of acid with low pH becomes apparent on the right side, while the diffusion area is compressed toward the right. Though more acid is being injected into the porous medium, the increased flow rate of the acid has the effect of constricting its diffusion. Figure 9c,d capture the competitive relationship between the DI water and acid injection. They show a pH transition zone migrating from middle-right to middle-left. It is particularly intriguing to observe that the areas near the grain interfaces, that typically experience slower flow rates, exhibit a pH transition that hugs the grain surface tightly. As the acid flow rate is ramped up further, the DI water’s influence wanes. This leads to the situation depicted in Figure 9f, where acid almost entirely saturates the region. We opted not to depict the scenario where the flow ratio is 1:10, as it closely presents the pattern found in Figure 9f.
In statistical analysis of the pH distribution of each case in Figure 10 as well as larger acid flow rate cases, Figure 10 shows that the average pH in the porous medium decreases with the increase in the acid flow rate. This rate of change decreases, and the average pH value stabilizes as almost all the void space is filled with the acid solution. It is noteworthy that the variance of pH exhibits a peak value at a ratio of around 2:1. At this ratio, two distinct pH clusters share the pore volume equally, and the transition layer between them is minimal. This observation aligns with the findings discussed in Section 3.3, where the greatest variance was achieved. As the flow rate ratio increases, leading to more regions with low pH, the variance declines due to the homogeneity of the data. At ratios of 1:5 and 1:10, the porous medium is predominantly filled with acid, resulting in a constant variance.
4. Discussion
Based on the results above, the deployment of PAni in a microfluidic porous medium has demonstrated significant promise as a pH indicator, providing direct visualization of pH transitions through perceivable color changes. This pH visualization tool is particularly notable as some advantages are presented. The microfluidic porous media exhibits a vivid color change corresponding to shifts in pH. This change is discernible to the unaided eye and is quantified accurately using digital image analysis. The colorimetric representation of pH is both accurate and rapid, responding promptly to pH fluctuations without delays. The innovative design of our microfluidic device facilitates direct mapping of solute transport within porous media exhibiting varied pH distributions. Additionally, our experiments with PAni reveal that the polymer remains functional for several months without any noticeable decline in its pH-sensing capabilities. When contrasted with traditional methods that involve mixing pH-sensitive dyes into the solution, this PAni-coated device proves to be more adaptable. During the test of transport processes, the width of the pH transition zone depicted in the contour maps sheds light on the interplay between flow and diffusion effects. Our assessments under varied fluid flow conditions provided valuable insights into pH distributions within the medium.
Utilizing an organized, analytical method, RGB [34], the microfluidic model developed is evaluated for different aspects. This model has undergone extensive testing to assess its functionality as a pH indicator. Key aspects of this evaluation include the range of pH detection, the ability to detect rapid pH changes, and compatibility with various fluid flow conditions. At the core of our model is the basic chemical process where polyaniline (PAni) transitions from its emeraldine base form to the emeraldine salt form. This transition is well-documented in scientific literature and serves as the fundamental mechanism for pH indication in our system. Additionally, our model boasts durability and a relatively straightforward fabrication process. The latter involves a direct, one-step in situ polymerization method, simplifying the overall production of the microfluidic device.
Challenges are still present for the further development of this technology. In situ deposition of PAni within the porous medium remains a challenge, largely attributed to the polymer’s high viscosity and uneven mixing status between several solutions. This presents a difficult task for model cleaning. Uneven coating and debris formation on the model surface have also emerged as significant impediments to precise pH readout. Such issues were absent in studies utilizing straight channels [29] and our tests with larger-scale porous media prototypes that are not presented here.
The dimensions of the porous medium have a pronounced impact on fluid flow dynamics and overall system behavior. Decreasing the channel dimensions of the porous medium introduces specific challenges and complexities. With smaller channel dimensions, flow resistance increases, that inherently results in slower velocity. The presence of solid grains in a microscaled porous medium also significantly impedes fluid flow. In this case, PAni polymer flow through all regions is difficult during in situ deposition processes, and PAni tends to aggregate within zones where the pore scale flow is slow.
Variance in pH readouts is another problem that requires intense calibration work. Variability in lighting conditions and model materials impact the hue values extracted. This can introduce discrepancies in pH readout if the device is not calibrated again for the new conditions. Specifically, inadequate illumination can damage image quality, rendering post-processing and pH data extraction problematic. Another limitation is that because pH visualization is based on colorimetric values, the solution itself should be transparent and not change color during reactive transport. Otherwise, it presents a challenge for pH indication.
5. Conclusions
We have successfully integrated a unique polymer, PAni, into microfluidic porous media with the objective of enabling in situ and real-time visualization of aqueous phase pH. This innovative approach holds great potential for enhancing pH detection within microfluidic porous media compared to traditional effluent measurements. It directly maps the pH distribution compatible with optical detection and shows a real-time response to pH changes. The deposited PAni layer shows remarkable durability for repeated and prolonged fluid flooding during experiments. This newly designed and validated model serves as a pivotal tool for investigating reactive transport processes within porous media, bridging the fields of chemical engineering, environmental science, and energy resources engineering. The comprehensive design and fabrication processes pave the way for further advancements in PAni embedded device development.
Supplementary Materials
The following supporting information can be downloaded at: https://www.mdpi.com/article/10.3390/colloids8010009/s1, Figure S1: Fluid flow velocity and streamlines in the porous media (simulated by COMSOL 6.0); Video S1: The record of fast pH changes when acid sweeps DI water at the flow rate of 250 µL/min; Video S2: A coinjection test of DI water and acid at flow rate of 10 µL/min shows a relatively steady state is achievable.
Author Contributions
Conceptualization, methodology, and investigation, G.Z., N.N. and A.R.K.; writing—original draft preparation, G.Z.; writing—review and editing, N.N. and A.R.K.; supervision and project administration, A.R.K. All authors have read and agreed to the published version of the manuscript.
Funding
This research was funded by Chevron, and further funding was provided by the SUETRI-A Industrial Affiliates. Part of this work was performed at the Stanford Nanofabrication Facility (SNF), supported by the National Science Foundation under award ECCS-2026822.
Data Availability Statement
The authors confirm that the data supporting the findings of this study are available within the article and its Supplementary Materials upon reasonable request.
Acknowledgments
We thank Jimin D. Zhou, Zitong Huang, Siqin Yu, Fatimah AlNasser, and Hong Yang for their valuable discussion and technical support.
Conflicts of Interest
The authors declare no conflicts of interest.
References
- Roy, S.B.; Dzombak, D.A. Chemical Factors Influencing Colloid-Facilitated Transport of Contaminants in Porous Media. Environ. Sci. Technol. 1997, 31, 656–664. [Google Scholar] [CrossRef]
- Kanti Sen, T.; Khilar, K.C. Review on Subsurface Colloids and Colloid-Associated Contaminant Transport in Saturated Porous Media. Adv. Colloid Interface Sci. 2006, 119, 71–96. [Google Scholar] [CrossRef]
- McCarthy, J.F.; Zachara, J.M. Subsurface Transport of Contaminants. Environ. Sci. Technol. 1989, 23, 496–502. [Google Scholar] [CrossRef]
- Jessen, K.; Kovscek, A.R.; Orr, F.M. Increasing CO2 Storage in Oil Recovery. Energy Convers. Manag. 2005, 46, 293–311. [Google Scholar] [CrossRef]
- Benson, S.M.; Orr, F.M. Carbon Dioxide Capture and Storage. MRS Bull. 2008, 33, 303–305. [Google Scholar] [CrossRef]
- Tarkowski, R. Underground Hydrogen Storage: Characteristics and Prospects. Renew. Sustain. Energy Rev. 2019, 105, 86–94. [Google Scholar] [CrossRef]
- Zivar, D.; Kumar, S.; Foroozesh, J. Underground Hydrogen Storage: A Comprehensive Review. Int. J. Hydrogen Energy 2020, 46, 23436–23462. [Google Scholar] [CrossRef]
- Bo, Z.; Zeng, L.; Chen, Y.; Xie, Q. Geochemical Reactions-Induced Hydrogen Loss during Underground Hydrogen Storage in Sandstone Reservoirs. Int. J. Hydrogen Energy 2021, 46, 19998–20009. [Google Scholar] [CrossRef]
- Godinez, I.G.; Darnault, C.J.G. Aggregation and Transport of Nano-TiO2 in Saturated Porous Media: Effects of pH, Surfactants and Flow Velocity. Water Res. 2011, 45, 839–851. [Google Scholar] [CrossRef]
- Prigiobbe, V.; Bryant, S.L. pH-Dependent Transport of Metal Cations in Porous Media. Environ. Sci. Technol. 2014, 48, 3752–3759. [Google Scholar] [CrossRef]
- Haghi, R.K.; Chapoy, A.; Peirera, L.M.C.; Yang, J.; Tohidi, B. pH of CO2 Saturated Water and CO2 Saturated Brines: Experimental Measurements and Modelling. Int. J. Greenh. Gas Control 2017, 66, 190–203. [Google Scholar] [CrossRef]
- Morozova, D.; Wandrey, M.; Alawi, M.; Zimmer, M.; Vieth, A.; Zettlitzer, M.; Würdemann, H. Monitoring of the Microbial Community Composition in Saline Aquifers during CO2 Storage by Fluorescence in Situ Hybridisation. Int. J. Greenh. Gas Control 2010, 4, 981–989. [Google Scholar] [CrossRef]
- Gulliver, D.M.; Lowry, G.V.; Gregory, K.B. Comparative Study of Effects of CO2 Concentration and pH on Microbial Communities from a Saline Aquifer, a Depleted Oil Reservoir, and a Freshwater Aquifer. Environ. Eng. Sci. 2016, 33, 806–816. [Google Scholar] [CrossRef]
- Gholami, R. Hydrogen Storage in Geological Porous Media: Solubility, Mineral Trapping, H2S Generation and Salt Precipitation. J. Energy Storage 2023, 59, 106576. [Google Scholar] [CrossRef]
- Buchgraber, M.; Kovscek, A.R.; Castanier, L.M. A Study of Microscale Gas Trapping Using Etched Silicon Micromodels. Transp. Porous Media 2012, 95, 647–668. [Google Scholar] [CrossRef]
- Song, W.; Ogunbanwo, F.; Steinsbø, M.; Fernø, M.A.; Kovscek, A.R. Mechanisms of Multiphase Reactive Flow Using Biogenically Calcite-Functionalized Micromodels. Lab Chip 2018, 18, 3881–3891. [Google Scholar] [CrossRef]
- Yun, W.; Ross, C.M.; Roman, S.; Kovscek, A.R. Creation of a Dual-Porosity and Dual-Depth Micromodel for the Study of Multiphase Flow in Complex Porous Media. Lab Chip 2017, 17, 1462–1474. [Google Scholar] [CrossRef] [PubMed]
- Berejnov, V.; Djilali, N.; Sinton, D. Lab-on-Chip Methodologies for the Study of Transport in Porous Media: Energy Applications. Lab Chip 2008, 8, 689. [Google Scholar] [CrossRef]
- Whitesides, G.M. The Origins and the Future of Microfluidics. Nature 2006, 442, 368–373. [Google Scholar] [CrossRef]
- Datta, S.S.; Ramakrishnan, T.S.; Weitz, D.A. Mobilization of a Trapped Non-Wetting Fluid from a Three-Dimensional Porous Medium. Phys. Fluids 2014, 26, 022002. [Google Scholar] [CrossRef]
- Nazari, N.; Kovscek, A.R. A Micro-Scale Rheometer to Study Foam Texture and Flow Resistance in Planar Fractures. Lab Chip 2022, 22, 3489–3498. [Google Scholar] [CrossRef]
- Edery, Y.; Dror, I.; Scher, H.; Berkowitz, B. Anomalous Reactive Transport in Porous Media: Experiments and Modeling. Phys. Rev. E 2015, 91, 052130. [Google Scholar] [CrossRef]
- Steinegger, A.; Wolfbeis, O.S.; Borisov, S.M. Optical Sensing and Imaging of pH Values: Spectroscopies, Materials, and Applications. Chem. Rev. 2020, 120, 12357–12489. [Google Scholar] [CrossRef]
- Yang, M.; Sun, N.; Lai, X.; Wu, J.; Wu, L.; Zhao, X.; Feng, L. Paper-Based Sandwich-Structured Wearable Sensor with Sebum Filtering for Continuous Detection of Sweat pH. ACS Sens. 2023, 8, 176–186. [Google Scholar] [CrossRef] [PubMed]
- Ko, Y.; Jeong, H.Y.; Kwon, G.; Kim, D.; Lee, C.; You, J. pH-Responsive Polyaniline/Polyethylene Glycol Composite Arrays for Colorimetric Sensor Application. Sens. Actuators B Chem. 2020, 305, 127447. [Google Scholar] [CrossRef]
- Li, Y.; Mao, Y.; Xiao, C.; Xu, X.; Li, X. Flexible pH Sensor Based on a Conductive PANI Membrane for pH Monitoring. RSC Adv. 2020, 10, 21–28. [Google Scholar] [CrossRef] [PubMed]
- Qiang, J.; Yu, Z.; Wu, H.; Yun, D. Polyaniline Nanofibers Synthesized by Rapid Mixing Polymerization. Synth. Met. 2008, 158, 544–547. [Google Scholar] [CrossRef]
- Florea, L.; Fay, C.; Lahiff, E.; Phelan, T.; O’Connor, N.E.; Corcoran, B.; Diamond, D.; Benito-Lopez, F. Dynamic pH Mapping in Microfluidic Devices by Integrating Adaptive Coatings Based on Polyaniline with Colorimetric Imaging Techniques. Lab Chip 2013, 13, 1079. [Google Scholar] [CrossRef]
- Florea, L.; Martin-Mayor, A.; Bou-Ali, M.M.; Meagher, K.; Diamond, D.; Tutar, M.; Benito-Lopez, F. Adaptive Coatings Based on Polyaniline for Direct 2D Observation of Diffusion Processes in Microfluidic Systems. Sens. Actuators B Chem. 2016, 231, 744–751. [Google Scholar] [CrossRef]
- Buchgraber, M.; Al-Dossary, M.; Ross, C.M.; Kovscek, A.R. Creation of a Dual-Porosity Micromodel for Pore-Level Visualization of Multiphase Flow. J. Pet. Sci. Eng. 2012, 86–87, 27–38. [Google Scholar] [CrossRef]
- Nazari, N.; Yun, W.; Kovscek, A.R. The Motion of Long Bubbles in Microchannels Using a Meter-Long, Rectangular Capillary on a Chip. J. Colloid Interface Sci. 2023, 638, 149–160. [Google Scholar] [CrossRef] [PubMed]
- Song, W.; Kovscek, A.R. Direct Visualization of Pore-Scale Fines Migration and Formation Damage during Low-Salinity Waterflooding. J. Nat. Gas Sci. Eng. 2016, 34, 1276–1283. [Google Scholar] [CrossRef]
- Song, W.; Kovscek, A.R. Functionalization of Micromodels with Kaolinite for Investigation of Low Salinity Oil-Recovery Processes. Lab Chip 2015, 15, 3314–3325. [Google Scholar] [CrossRef] [PubMed]
- Nowak, P.M.; Kościelniak, P. What Color Is Your Method? Adaptation of the RGB Additive Color Model to Analytical Method Evaluation. Anal. Chem. 2019, 91, 10343–10352. [Google Scholar] [CrossRef]
Figure 1.
Photolithography fabrication processes for microfluidic porous media. Modern direct-write processes are depicted. The coverplate is attached to the etched wafer using anodic bonding.
Figure 1.
Photolithography fabrication processes for microfluidic porous media. Modern direct-write processes are depicted. The coverplate is attached to the etched wafer using anodic bonding.

Figure 2.
Overview of the PAni deposition process, the experimental setup, and PAni attached to the surface. The PAni is deposited within the completed model, and each solution is delivered through syringe pumps and tubing. In the following experiments, DI water is introduced from the lower left side (Inflow #1) and acid from the lower right side (Inflow #2) of the model, showing the region of interest (ROI) as well.

Figure 3.
Characterization of PAni deposited in the microfluidic device: (a) schematic of the microfluidic porous media detaching the top glass plate (with optical microscopic image on the left side) and the bottom silicon substrate (with optical microscopic image on the right side); (b) SEM image of PAni deposited on the glass surface at 5000× (bottom-left corner with no deposition); (c) the shape of deposited PAni on silicon at 50,000× by SEM; (d) SEM characterization of the PAni deposited on the bottom silicon substrate at 20,000×.

Figure 4.
Calibration of a PAni functionalized surface. The solution pH is indicated by the normalized hue value. PAni transitions from its emeraldine base form to the emeraldine salt form upon the addition of HCl. An increase in pH results in a corresponding linear increase in hue, with the appearance transitioning from light green to violet.

Figure 5.
Measurement of rapid pH changes in the pore space when swept by HCl acid solution (pH = 2) displacing DI water (pH = 5.8) from the lower right side. (a–d) showcase the experimental results of the pH changes, with the gray color representing rock grains at increasing elapsed times. (e–h) display the corresponding direct numerical simulation results as the acid sweeps through the model.

Figure 6.
Average pH and variance of pH within the pore space imaged: (a) the average pH and the flow of acidic solution into the pore space results in smoothly decreasing pH. (b) The variance in pH highlights the heterogeneity of its distribution within the pore space.
Figure 6.
Average pH and variance of pH within the pore space imaged: (a) the average pH and the flow of acidic solution into the pore space results in smoothly decreasing pH. (b) The variance in pH highlights the heterogeneity of its distribution within the pore space.

Figure 7.
Coinjection of two fluids with same flow rate highlights the transition from a dispersed to a sharp displacement interface at the flow rate from low (Q = 0.1 µL/min) to high (Q = 500 µL/min). The corresponding Pe and Re numbers are provided beneath the injection rates. Injections are introduced from the bottom left with DI water and from the bottom right with the acid; the above steady states are recorded after injecting more than 20 pore volumes (PVs) into the pore space and with the pattern remaining unchanged for over 2 min.

Figure 8.
The (a) average pH and (b) variance of pseudo steady pH distribution with the increase in Pe correspond to the ROI in Figure 7, where pH is calculated per pixel.
Figure 8.
The (a) average pH and (b) variance of pseudo steady pH distribution with the increase in Pe correspond to the ROI in Figure 7, where pH is calculated per pixel.

Figure 9.
Coinjection of two fluids with varying flow rate ratios (DI water Qw to acid QA). While the flow rate of DI water Qw is held constant at 50 µL/min, the acid flow rate QA is varied. The injection settings are consistent with the previous experiments, introducing DI water from the bottom left and acid from the bottom right. Steady states are recorded using similar criteria, with the additional condition that, for each case, the model is initially saturated with DI water.

Figure 10.
The (a) average pH and (b) variance of steady pH distribution at different flow rate ratios between DI water and acid correspond to the ROI in Figure 9, where pH is calculated per pixel. The flow rate ratios are marked with data points, and error bars show the standard deviation.
Figure 10.
The (a) average pH and (b) variance of steady pH distribution at different flow rate ratios between DI water and acid correspond to the ROI in Figure 9, where pH is calculated per pixel. The flow rate ratios are marked with data points, and error bars show the standard deviation.


Disclaimer/Publisher’s Note: The statements, opinions and data contained in all publications are solely those of the individual author(s) and contributor(s) and not of MDPI and/or the editor(s). MDPI and/or the editor(s) disclaim responsibility for any injury to people or property resulting from any ideas, methods, instructions or products referred to in the content. |
© 2024 by the authors. Licensee MDPI, Basel, Switzerland. This article is an open access article distributed under the terms and conditions of the Creative Commons Attribution (CC BY) license (https://creativecommons.org/licenses/by/4.0/).
Share and Cite
MDPI and ACS Style
Zhang, G.; Nazari, N.; Kovscek, A.R. In Situ pH Measurement in Microfluidic Porous Media Indicated by Surfaces Functionalized with Polyaniline (PAni). Colloids Interfaces 2024, 8, 9. https://doi.org/10.3390/colloids8010009
AMA Style
Zhang G, Nazari N, Kovscek AR. In Situ pH Measurement in Microfluidic Porous Media Indicated by Surfaces Functionalized with Polyaniline (PAni). Colloids and Interfaces. 2024; 8(1):9. https://doi.org/10.3390/colloids8010009
Chicago/Turabian StyleZhang, Ge, Negar Nazari, and Anthony R. Kovscek. 2024. "In Situ pH Measurement in Microfluidic Porous Media Indicated by Surfaces Functionalized with Polyaniline (PAni)" Colloids and Interfaces 8, no. 1: 9. https://doi.org/10.3390/colloids8010009