1. Introduction
Surface and interfacial tensions are important parameters to characterize liquid interfaces. The most reliable and frequently used methodology is based on drop and bubble profile analysis tensiometry (PAT). The principle consists in describing the profile of axisymmetric drops or bubbles by the Gauss–Laplace Equation (GLE). This equation represents the balance of the pressure difference across a curved interface by interfacial tension γ and the corresponding curvature of the interface. The fitting of the GLE to experimental liquid profiles provides then the value of the γ as the only unknown parameter.
The method is known since a very long time and the first who used it to measure the interfacial tension of liquid menisci were Bashforth and Adams [
1], who provided tables for the determination of γ from selected geometric data of drops/bubbles obtained from photographs. Only after Neumann and co-workers [
2] introduced a video technique and computer-based fitting of the GLE to experimental profiles, did the method become routine in our laboratories for measuring interfacial tensions and contact angles. Since that time, the method was further refined and additional interfacial characteristics became accessible, such as the dilational interfacial visco-elasticity [
3] which can be measured with oscillating drops/bubbles using computer-controlled dosing systems. Additional extra equipment made the PAT become a special tool to study rather a complex system, such as the sequential adsorption of different surface-active molecules at the same liquid interface using a coaxial double capillary [
4]. A particular design of PAT with such a double capillary and multiple dosing systems was even applied to mimic the digestion process in the human body [
5].
For a versatile method such as PAT, it is important to know that it works accurately and reliably. In the first designs, the calibration of the video chip was still an issue [
6], while now the high quality of these chips does not require much care. When going beyond the given physical limits, PAT can produce erroneous results as it is the case when drops are generated to oscillations at too high frequencies [
7]. A good criterion for understanding if the method is used in the correct physical conditions, the drop profile fitting error, was recently discussed in [
8]. As long as the value of this error (for the sake of simplicity we call the fitting error in the drop profile analysis only Error), which is defined as the standard deviation of the calculated to the experimental drop/bubble profile, remains in the limit of the order of the profile detection accuracy, all experimental conditions are chosen well. As soon as the distribution of the deviations around the profile shows a particular pattern [
9], or the error value goes beyond the given limit (typically 1–2 µm), systematic errors can be expected.
In [
8] the adsorption of alkane molecules from the vapor phase have been studied at the surface of pure water drops but also of aqueous surfactant solutions. The chain length of the alkane and its partial vapor pressure in the air phase around the aqueous drops have a strong impact on the amount of adsorbed alkane and the resulting changes in the measured surface tension [
10]. In a recent analysis it was shown [
11] that the co-adsorption of hexane with surfactants can lead to quite unexpected phenomena, such as leading to drops completely covered by a hexane film with a surface tension close to that of a pure hexane drop in air.
The oxyethylated alcohols represent a special class of non-ionic surfactants. The important feature of C
14EO
8 aqueous solutions is that the surfactant molecule can adsorb at the interface in different states with different molar areas [
12]. Experimental studies of C
14EO
8 solutions were performed using drop and bubble profile tensiometry in [
13].
The present work deals with a further refinement of the analysis of hexane co-adsorption from the vapor phase surrounding aqueous surfactants solution drops. It is shown that the size of the drop relative to the capillary at which it is formed has an impact on the measured (partly apparent) surface tension. Moreover, in dependence on the surfactant concentration, the resulting apparent surface tension, as measured by the standard software of the drop profile analysis tensiometry, passes through a maximum. This maximum is the consequence of two effects: at low surfactant concentrations, the amount of adsorbed hexane is larger and the surface tensions tends to the values of pure hexane, while at higher surfactant concentrations, the co-adsorption of hexane is strongly reduced and the measured apparent surface tensions approach the physical surface tensions of the corresponding aqueous surfactant solutions in air.
In this work, we studied drops of water and aqueous C13DMPO and C14EO8 solutions immersed into a cuvette filled with hexane-saturated air. In the experiments performed with pure water drops in hexane vapor, the capillary diameter and drop volume were varied. The amount of hexane covering the drop was determined from the drop volume calculated by the PAT software based on the drop image profile, and the amount of water pumped into/out of the drop. In the experiments performed with surfactant solutions, also the effects caused by the capillary diameter, drop volume and surfactant concentration were studied. New important features which control the co-adsorption of hexane and surfactants were revealed. In particular, it was shown that the dependencies of both the dynamic and equilibrium surface tensions on the concentration exhibit maxima, and in the concentration range above the minimum the surfactant molecules are mainly adsorbed, while at concentrations below the minimum a significant adsorption of hexane occurs. Therefore, a competition between the components for the place in the adsorption layer exists, accompanied by the cooperative increase in adsorption of the first component due to the presence of the second compound.
3. Results and Discussion
Consider first the results obtained for water drop immersed in hexane vapor.
Figure 1 illustrates the dependencies of the apparent dynamic surface tension (solid curves) and the Error (dashed curves) on time for four initial values of drop volume. It is seen that the surface tension virtually did not depend on the drop volume, while the Error increased with the drop volume. For all values of initial drop volume, the surface tension decreased to 28–29 mN/m. The dependence of the Error on the drop volume is obvious. Note that for large times, the error decreased to its usual value of 1–2 μm. It was reported earlier in [
11] that, if we use the density of hexane (0.665 g/cm
3 at 20 °C) instead of that of water, the values of the interfacial tensions of about 30 mN/m change to 19 mN/m, a value expected for the hexane–air interface. This is a clear indication for a fully developed hexane film formed around the water drop.
Figure 2 illustrates the influence of the drop volume for the capillary with a 2 mm diameter. While the initial volumes were lower than those referred to in
Figure 1, the trend is the same.
Dependencies of the Error on the water drop surface area for all experiments are shown in
Figure 3. The results were obtained with four different capillaries: 1.5, 2.0, 2.8 and 3.0 mm in diameter. Note, for all capillaries the ratio of drop volume to drop surface area was chosen within the range of 0.4–0.58 mm. It is seen that this dependence could be approximately represented by a straight line for all capillaries. The Error also increased with the increase in volume, but the values were more scattered than those shown in
Figure 3. The dependence of this Error on the size of capillary and drop can be ascribed to these facts: (i) the drops with larger volume accumulated more hexane at their surface, because the adsorption is roughly proportional to the area of the drop surface; (ii) the higher the drop size, the lower the Laplacian pressure, therefore larger drops are more prone to deformation due to the presence of a liquid hexane film at the drop surface. Both factors resulted in larger deviations from the perfect Laplacian profile for larger drops.
In the experiments, the drop surface area was kept constant due to the automated injection or extraction of the necessary amount of solution. The amount of hexane transferred from the environment onto the drop was estimated based on the change of the drop volume (∆V
D) obtained from the drop profile image captured by the device, and the volume of water extracted from (or injected into) the drop (V
E), which was also measured by the experimental device. The fact that these two volumes were equal to each other would mean that hexane did not form thick films on the drop (third phase). This does not apply to the case of a monolayer adsorption, because it would require less than 0.001 mm
3 of hexane to form a monolayer on the drop with a surface area of 30 mm
2, which is much lower than the experimental error. However, it was found that the extracted water volume V
E is larger than the measured change of drop volume ∆V
D, therefore the value V
E − ∆V
D is the volume of hexane transferred from the environment to the drop. Initially, the drop volume V
D was determined by the software implemented in the tensiometer, with calculations based on the curvature of the drop image profile. The value V
curv obtained in this way agreed to within 1% with the experimental values reported in [
16]. However, this method becomes less accurate when it comes to larger elongated drops. To make the estimation of drop volume more precise, another software was developed, which divided the drop image into vertically stacked horizontal cylinders 1 pixel in height, and the total volume V
cyl was calculated as the sum of volumes of these individual cylinders. The values obtained by different methods for the capillary 2 mm in diameter are compared in
Table 1. The number of cylinders was 493–529 depending on the drop elongation with time.
Figure 4 illustrates the dependence of the value V
H = V
E − ∆V
cyl (the hexane volume retained in the drop) on time during the measurement process for initial drop volumes of 15 and 24 mm
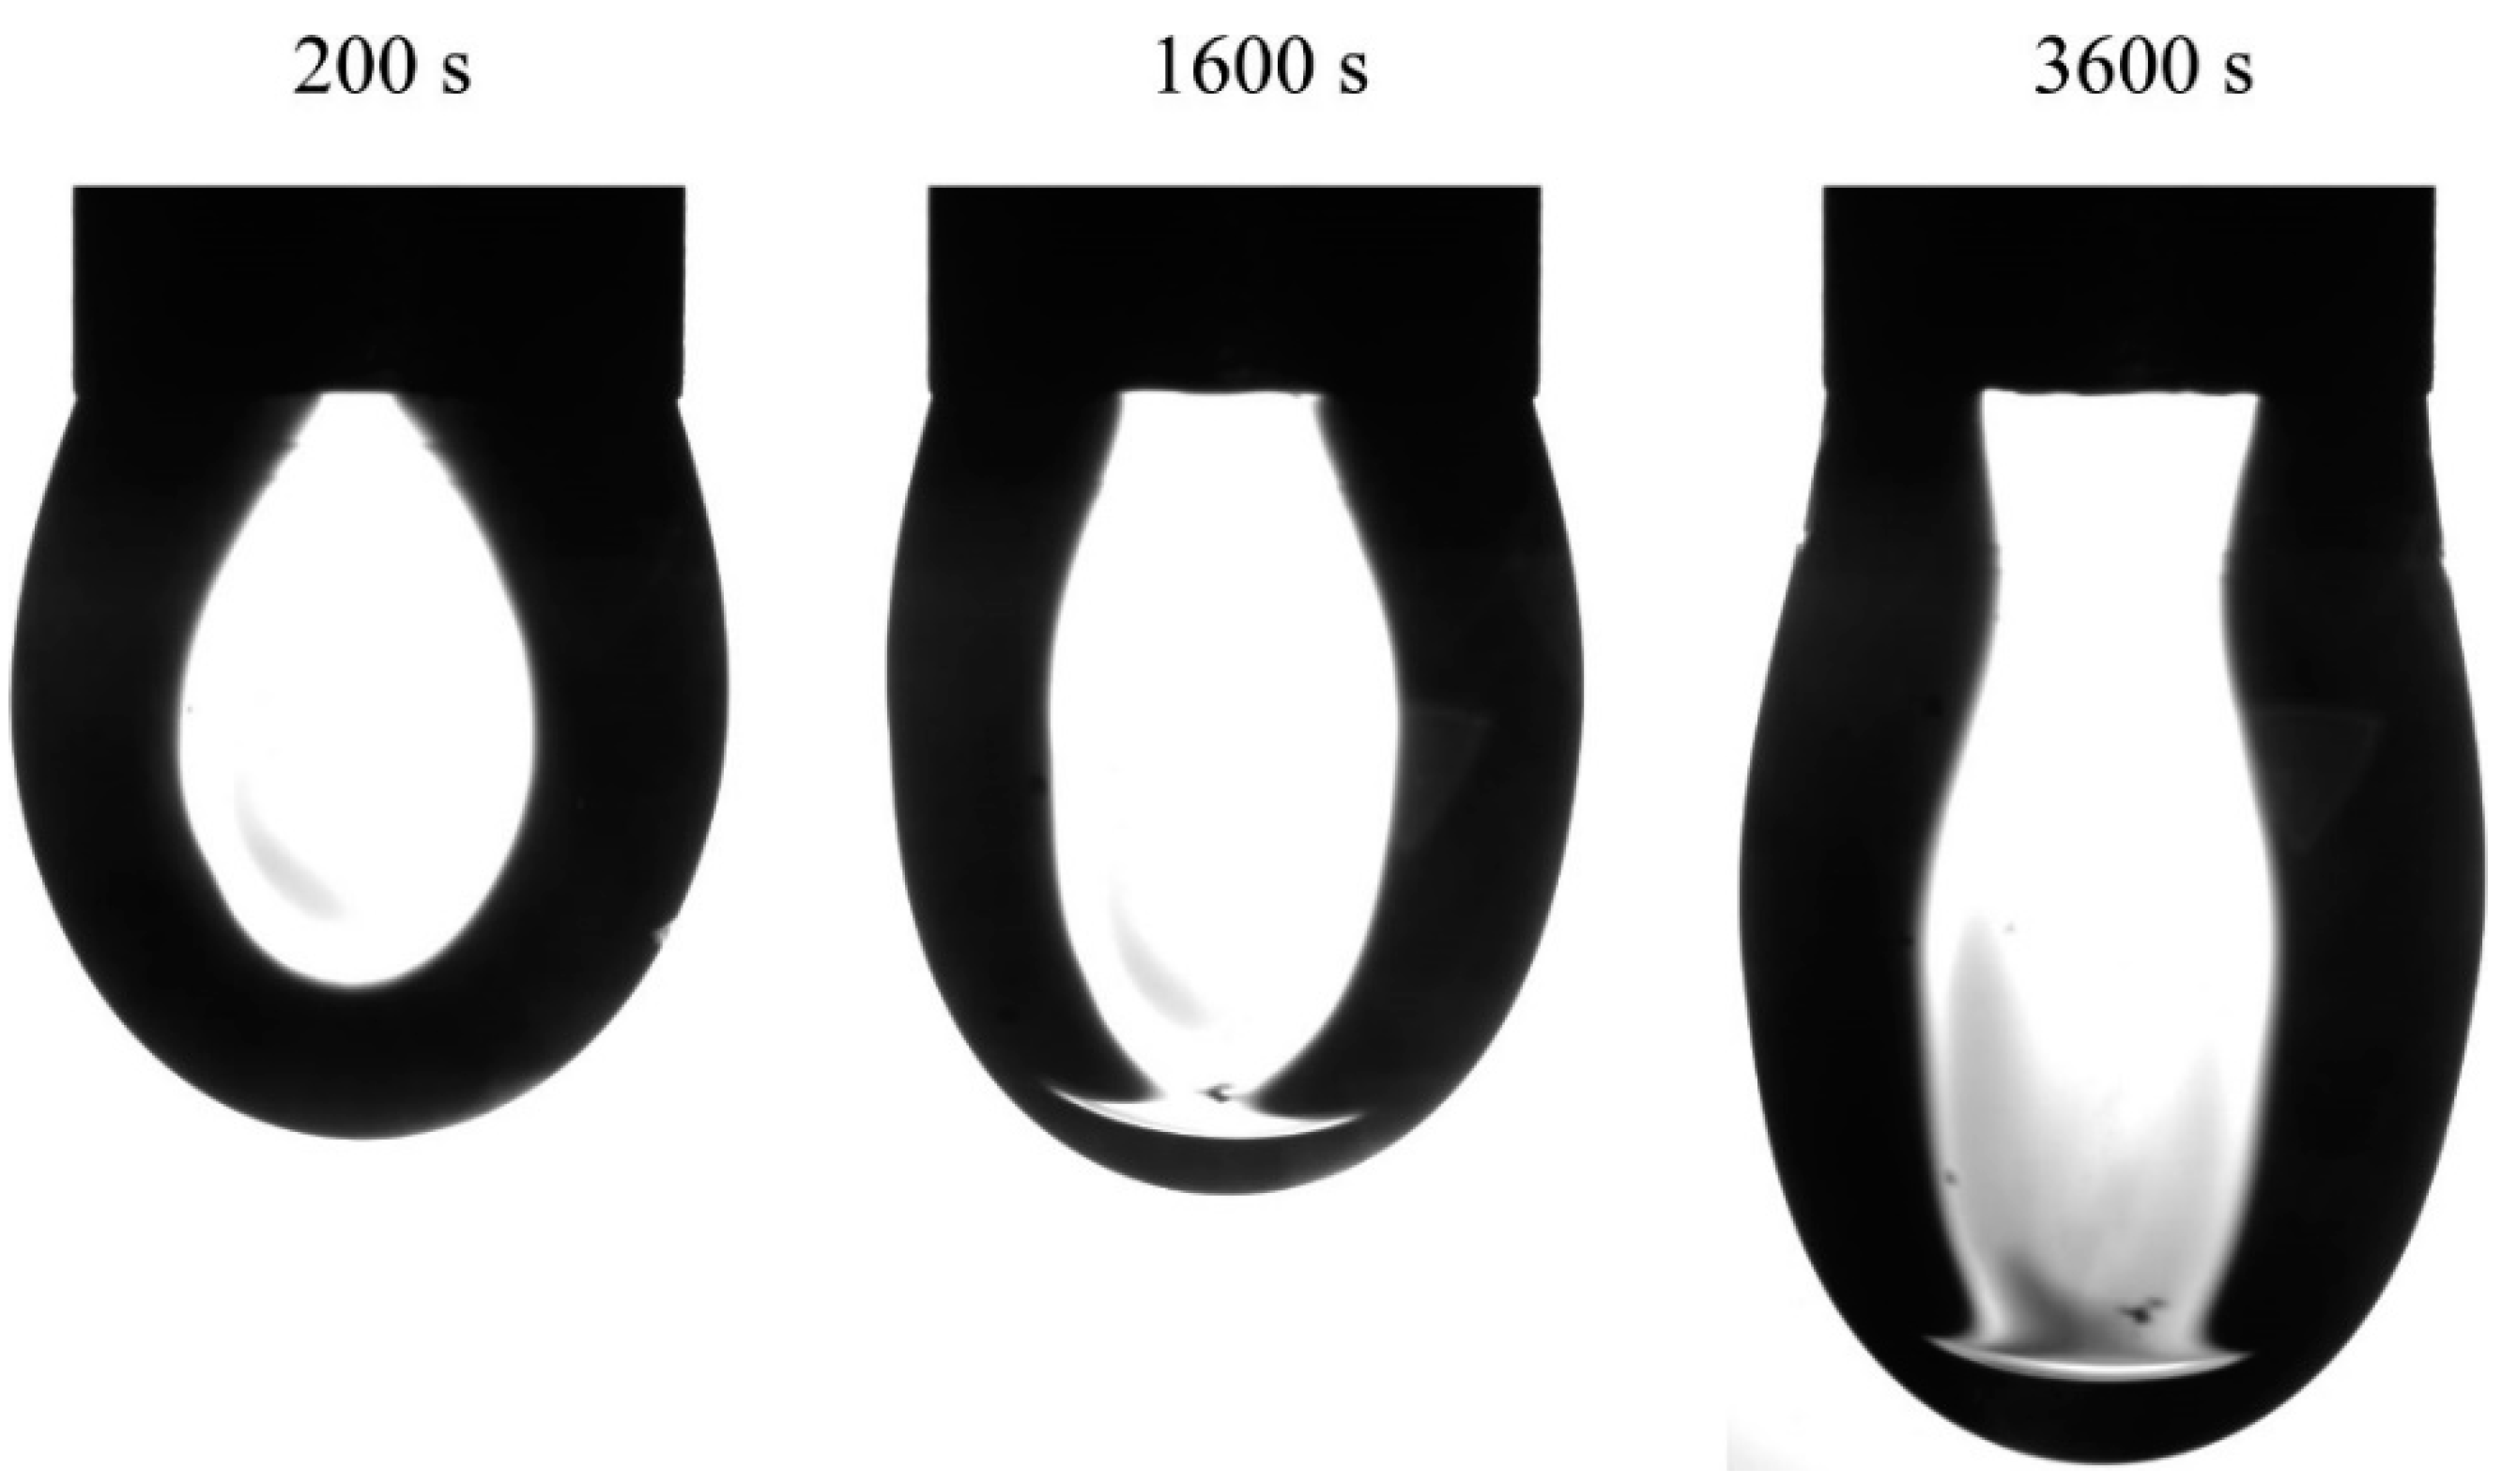
3, and for capillary diameters of 2 and 3 mm, respectively. Shown in
Figure 5 are the images of water drops with an initial volume of 15 mm
3 in hexane vapor at 200, 1600 and 3600 s after the start of the experiment. In the images taken at 1600 and 3600 s the hexane phase is clearly seen in the lower part of the drop. It is interesting that, in spite of the essential elongation of the drop, its volume became smaller, rather than larger, during the experiment. In particular, at a time of 3600 s the drop volume became 0.3 mm
3 lower, while the amount of water pumped out of the drop was 0.6 mm
3. Therefore, the amount of hexane adsorbed on the drop surface was 0.3 mm
3. For the surfactant solution drops the volume variation depended on the surfactant concentration.
Next, we analyzed results obtained for drops of C
13DMPO and C
14EO
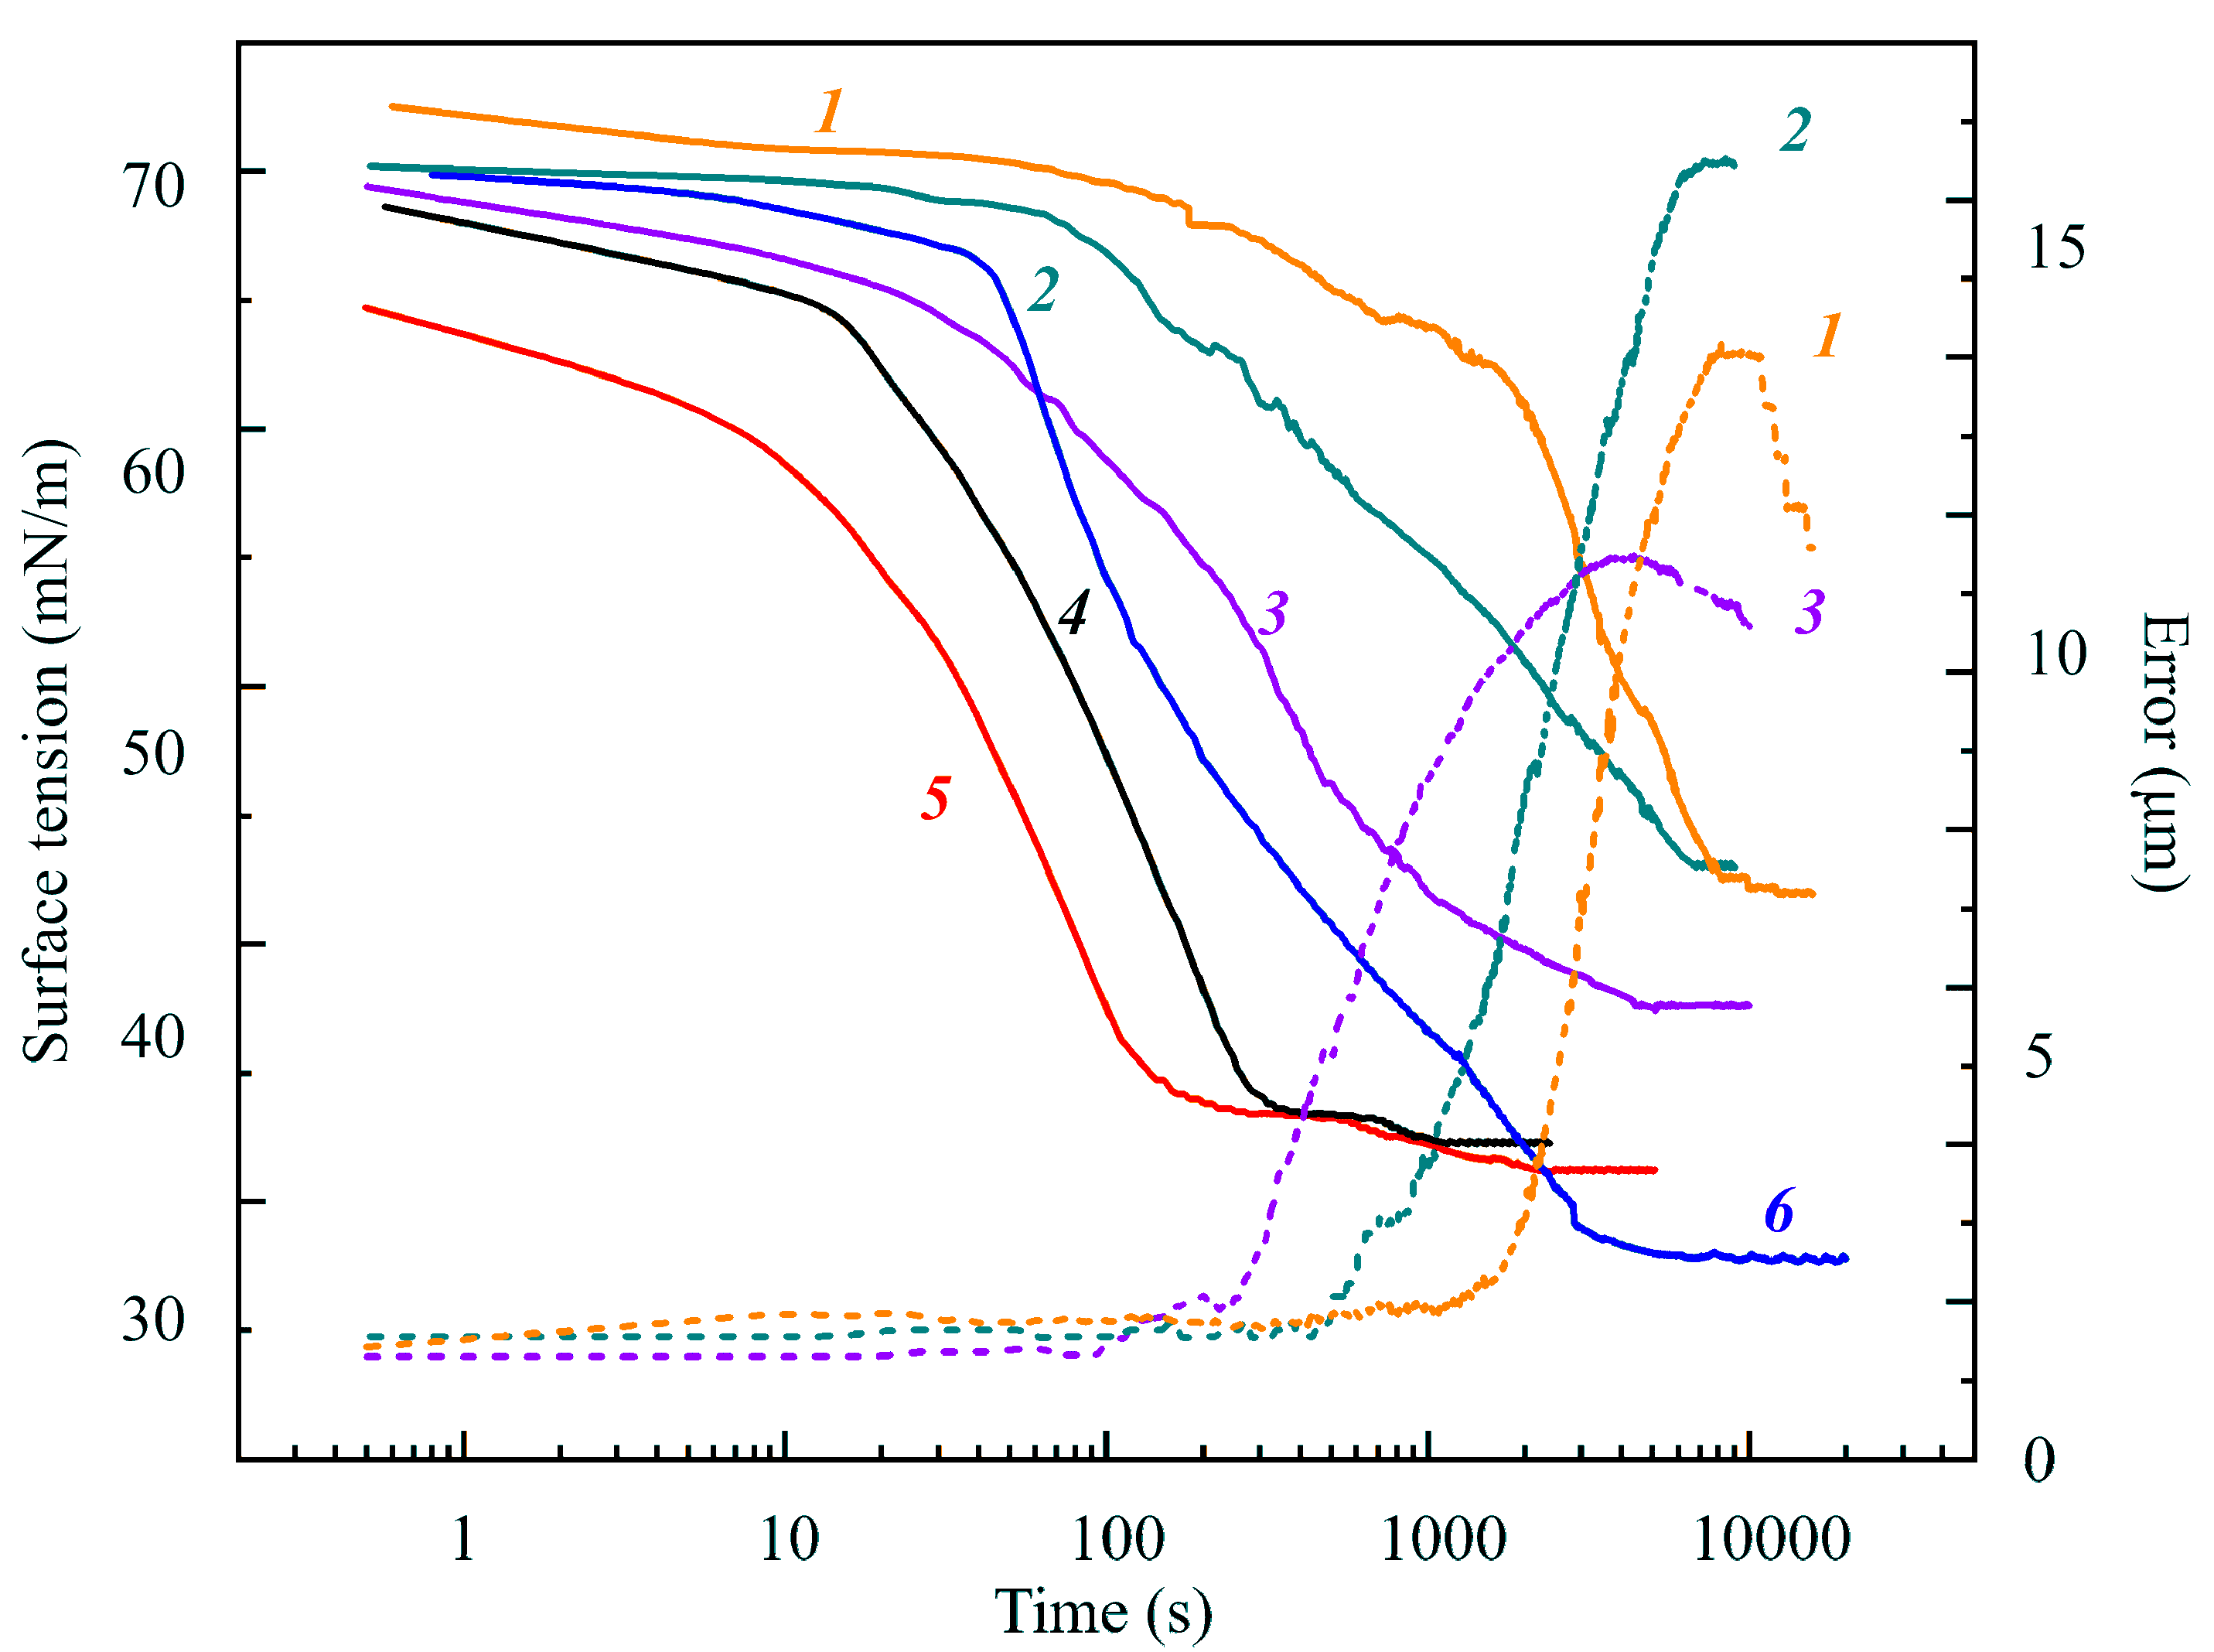
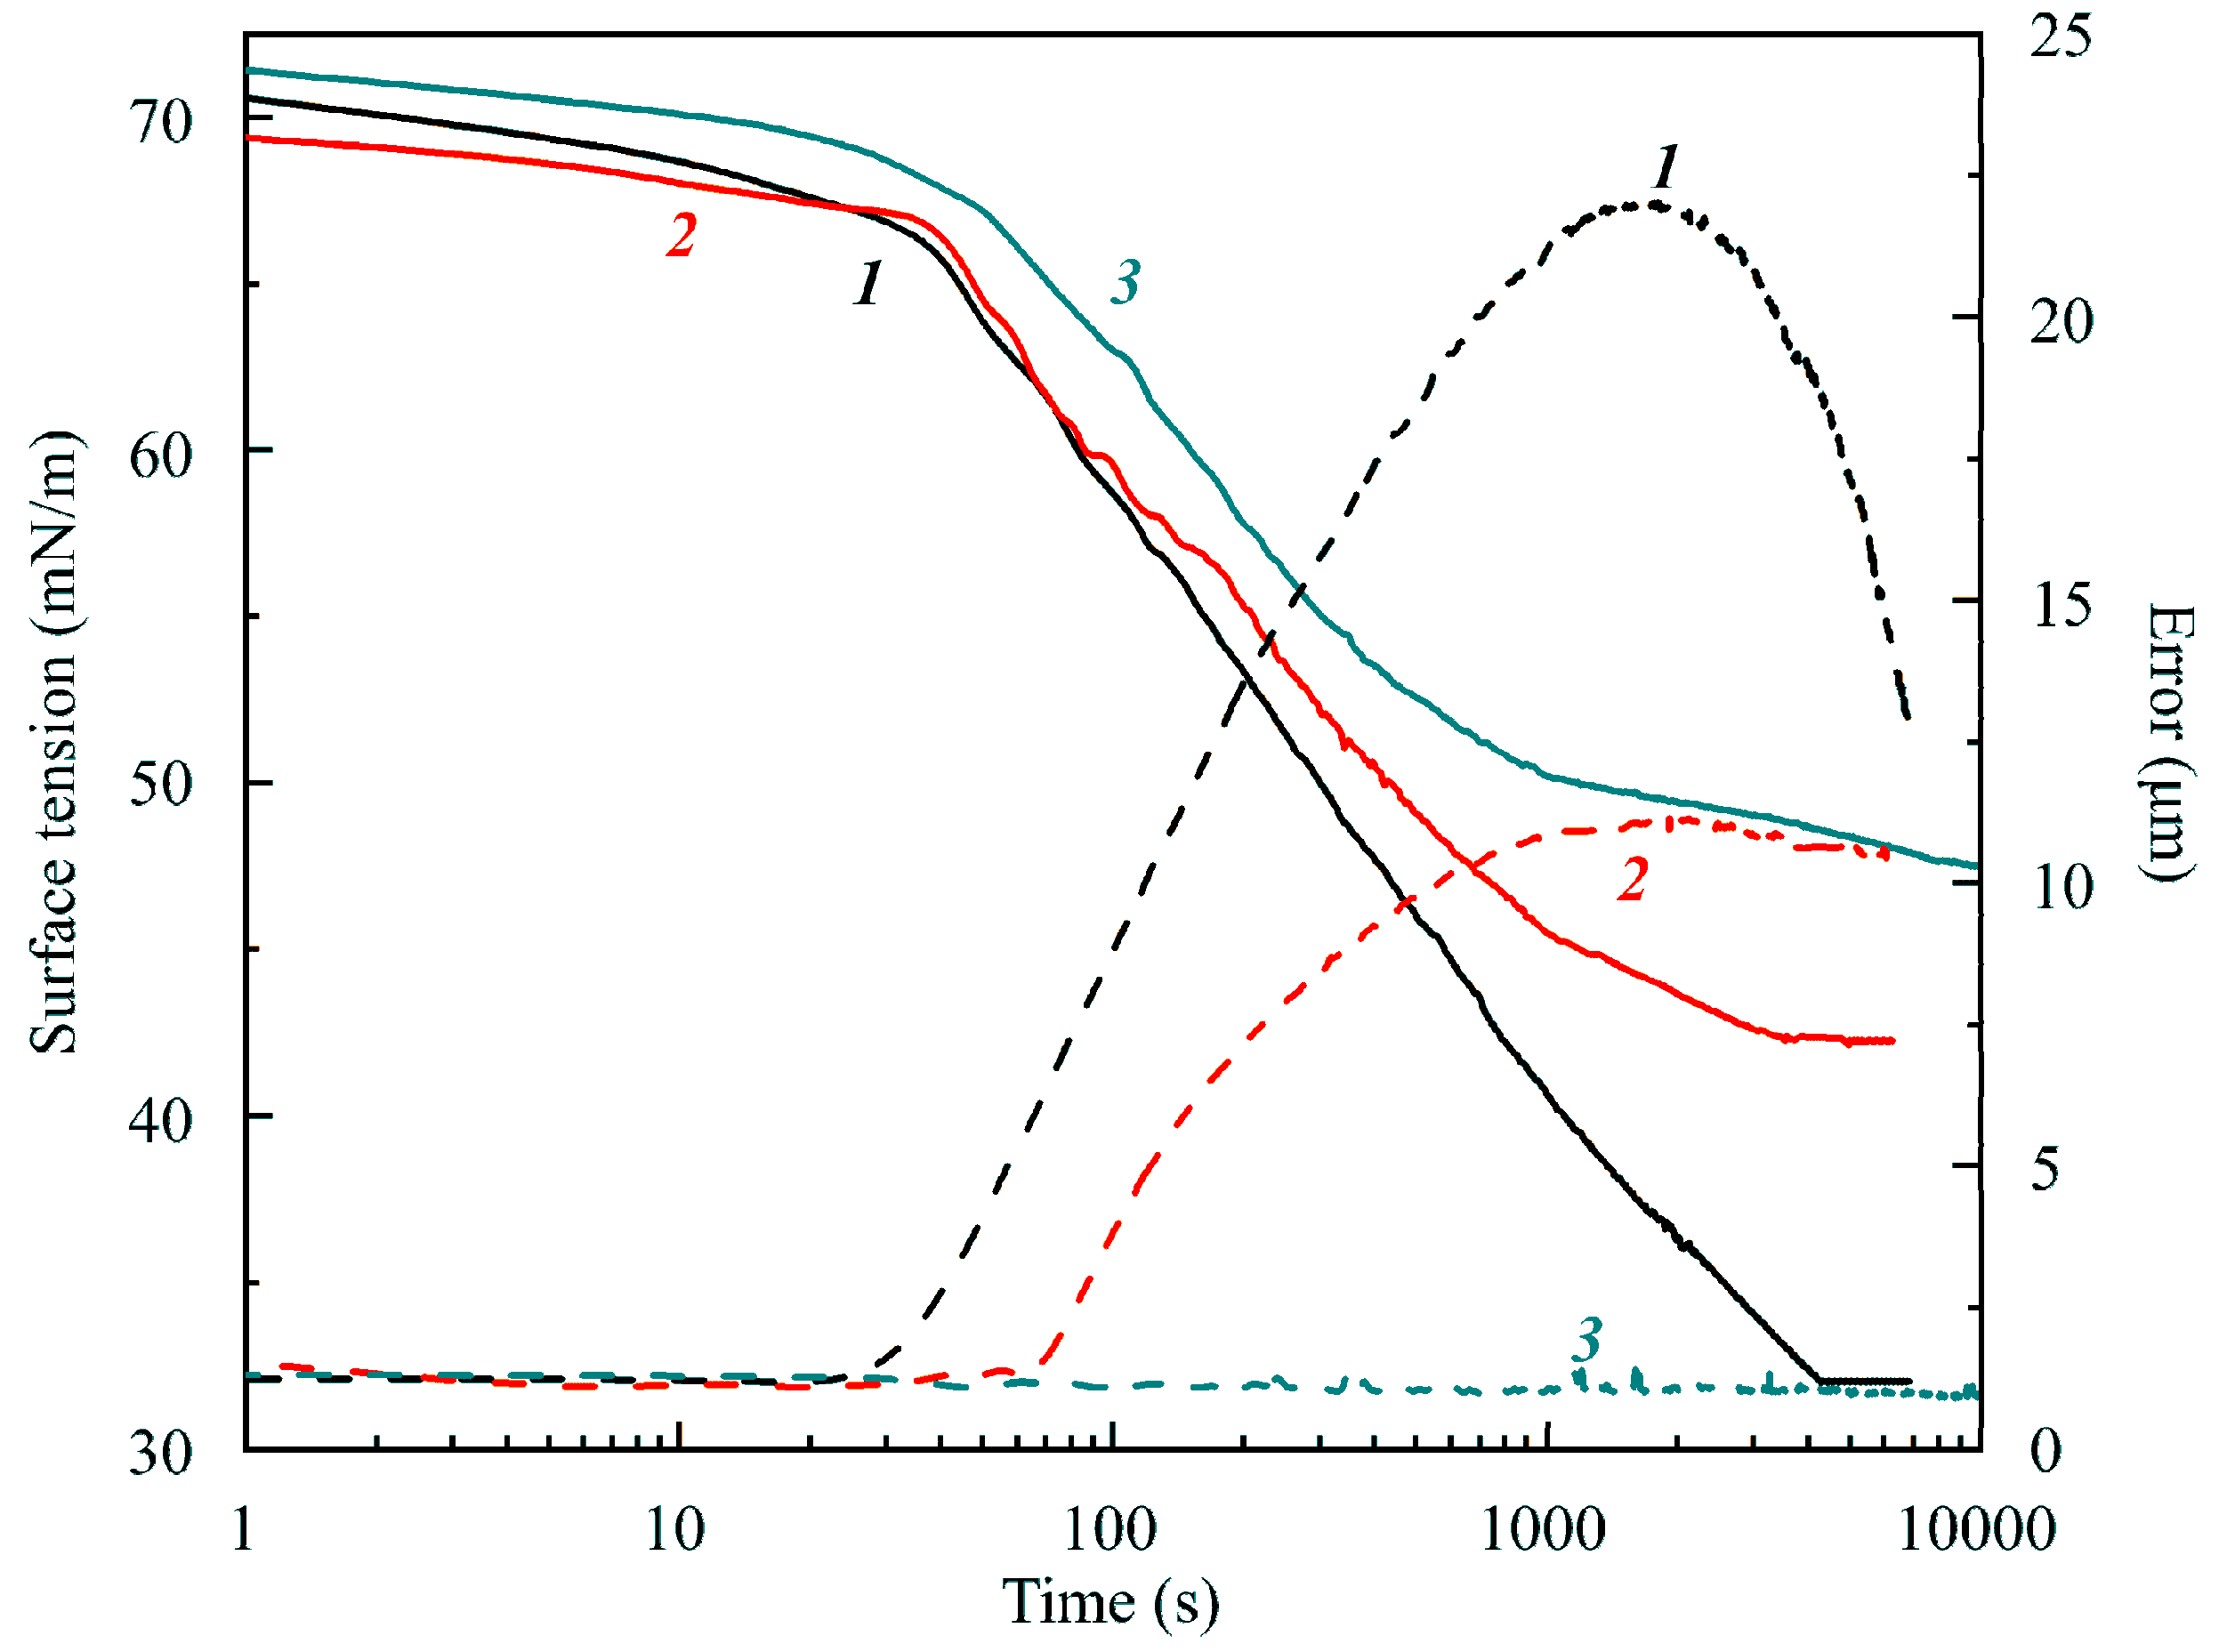
8 solutions in a hexane vapor environment. The dependencies of the dynamic surface tension (solid lines) and the Error (dashed lines) on time for C
14EO
8 aqueous solutions of different concentrations are shown in
Figure 6. At surfactant concentrations of 10 and 20 μmol/L, the Error is within 1.0–1.5 μm and is not shown in the Figure. These results were obtained with the capillary of 2 mm in diameter for equal initial drop volumes (10 mm
3) in air saturated by hexane vapor. It is seen in the images (not shown here) that after 3000–4000 s the phase of liquid hexane emerged at the drop bottom, which resulted in the increase in the drop volume. It should be noted that for concentrations 0.5 and 2 μmol/L the equilibrium surface tensions were almost the same.
Figure 7 illustrates the (apparent) dynamic surface tension for a 1 μmol/L C
14EO
8 solution at different volumes of the drop. It is seen that for the larger drop (26 mm
3 volume, 37 mm
2 surface area, V/S = 0.7 mm) the initial decrease in surface tension was faster, but the equilibrium tension exceeded that for smaller drops, and also the values shown in
Figure 6 for the solution concentrations of 0.5 and 2 μmol/L by 2–3 mN/m. This could be a consequence of larger deviations from the perfect Laplacian profile for larger drops, as discussed above.
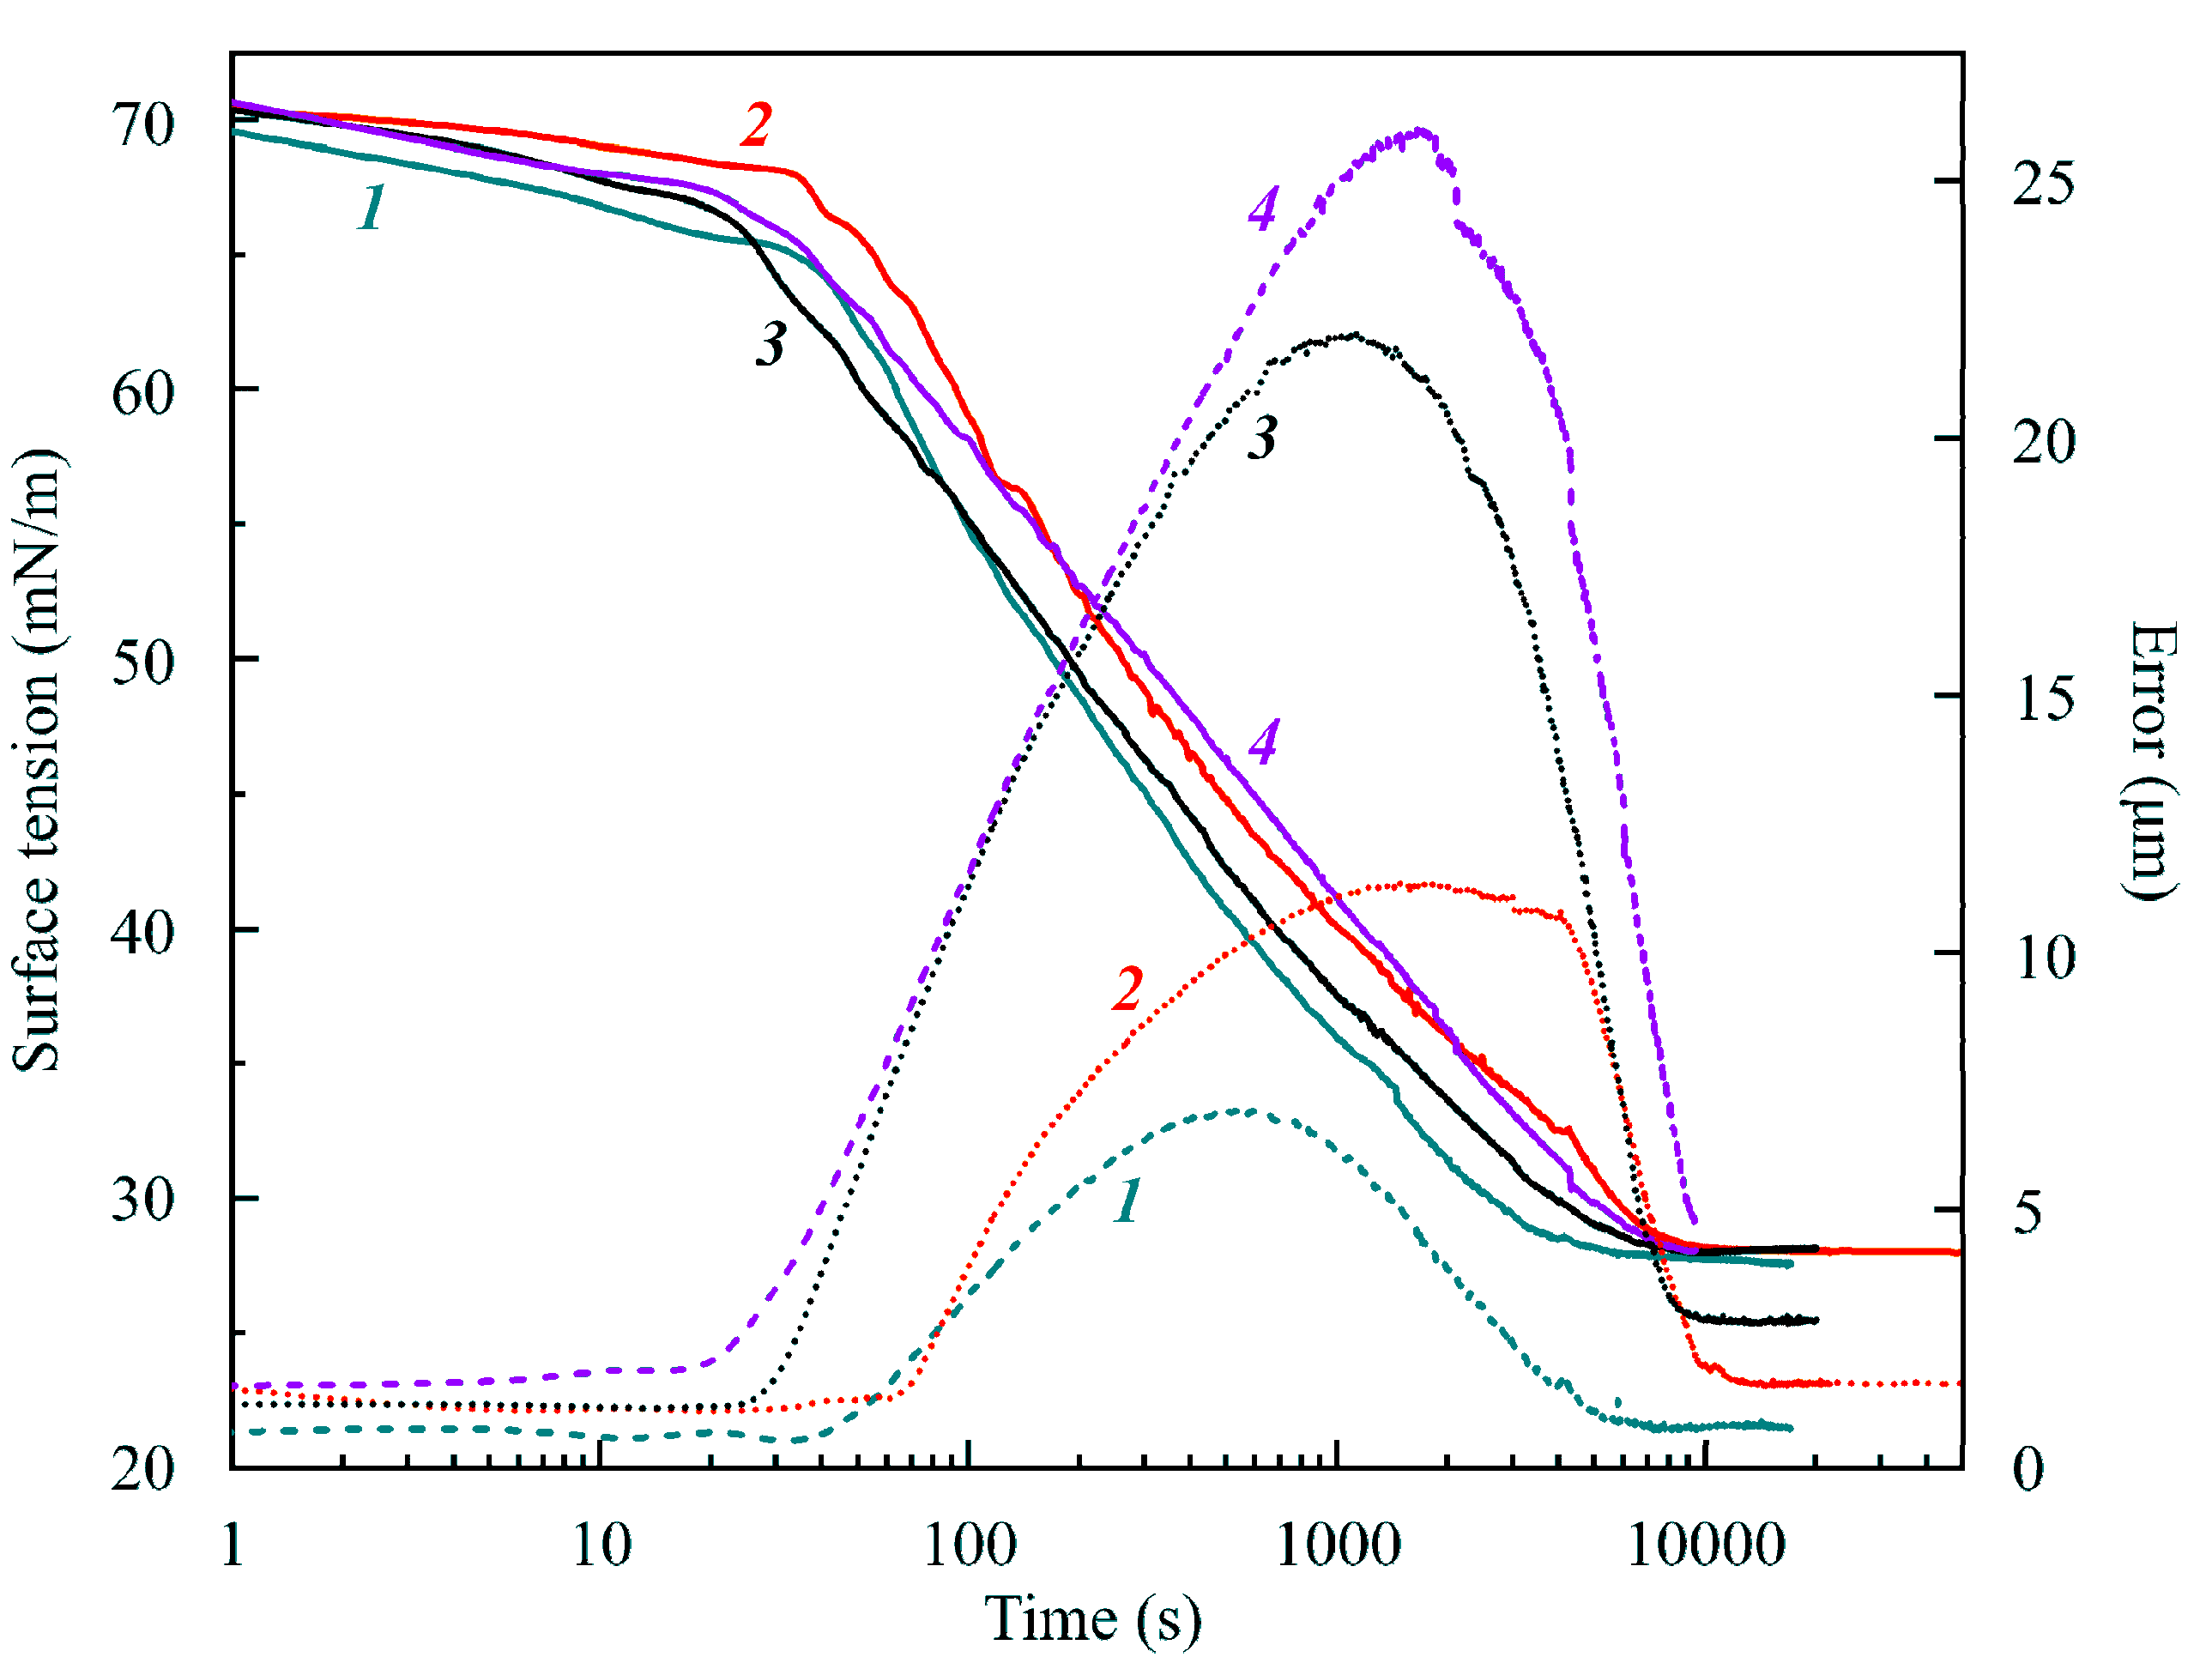
The dependencies of surface tension and fitting error on time for aqueous C
13DMPO solutions with different concentrations, obtained in the experiments with a capillary diameter of 2 mm, initial drop volume 10 mm
3 and surface area 20 mm
2 are shown in
Figure 8. It is seen that initial surface tension decrease is larger for higher solution concentrations, but the equilibrium surface tension is roughly the same, 29–31 mN/m, for all concentrations.
Figure 9 illustrates the dependencies of (apparent) surface tension and Error on time for C
13DMPO solutions in experiments with a capillary diameter of 3 mm, initial drop volume 24 mm
3, surface area 34 mm
2, and three different surfactant concentrations of 1, 2 and 5 μmol/L. It is seen that the equilibrium surface tension was higher for higher surfactant concentrations. A similar behavior was also observed for C
14EO
8 in
Figure 6, where curve
6 shows surface tensions for a pure water drop (with an initial volume of 10 mm
2 formed on a capillary of 2 mm in diameter) lower than those corresponding to surfactant solution drops with concentrations of 0.5, 2 and 4 μmol/L. This fact is attributable to the influence of the hexane film formed at the surface of large drops.
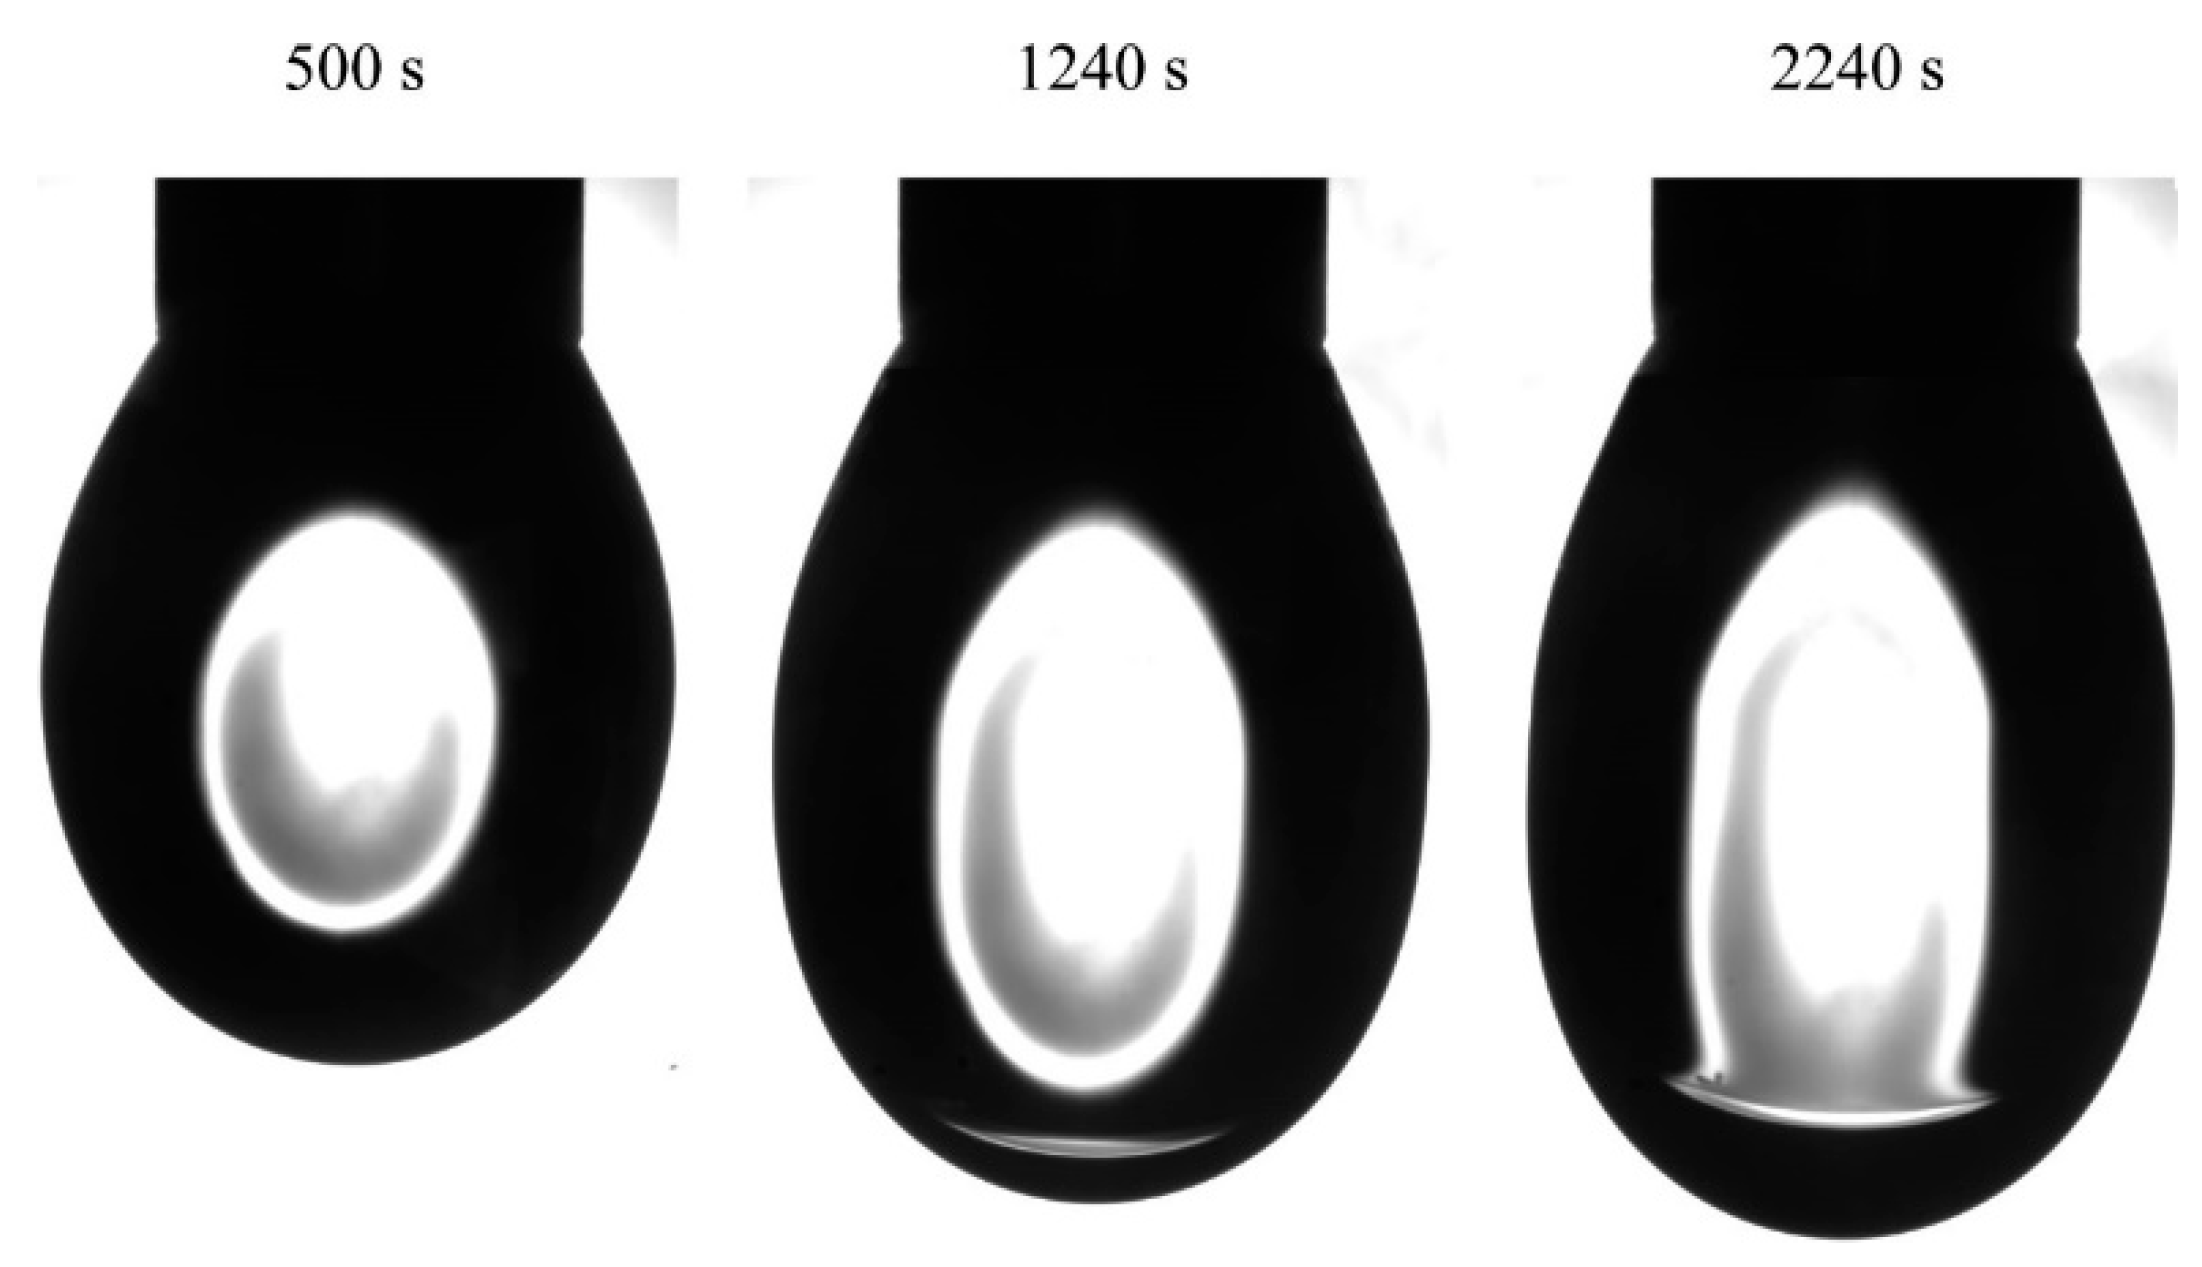
The images of C
14EO
8 solution drops in hexane vapor obtained in experiments with a capillary of 2 mm in diameter, initial drop volume of 20 mm
3 and a surfactant concentration of 1 μmol/L are shown in
Figure 10. The hexane phase is obviously seen in images taken after 1240 and 2240 s.
Table 2 summarizes the experimental and calculated drop volumes for this experiment.
The increase in the drop volume is clearly seen. In particular, while at time moment 500 s, the drop increased by 0.1 mm3, during the time interval of 500 to 2740 s the increase was as large as 1.56 mm3. It should be noted that, while water was pumped into the drop, the amount injected during 2740 s was only 0.5 mm3; therefore, the amount of hexane present in the drop was quite significant, about 1 mm3, which is much higher than that observed in the experiments with pure water drop. Therefore, it could be concluded that at low surfactant concentrations, the adsorption of surfactant and its presence in water promote the formation of hexane film at the drop surface, while at high surfactant concentration this phenomenon does not exist.
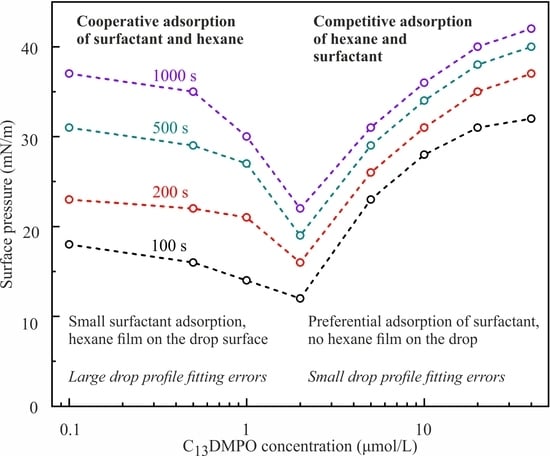
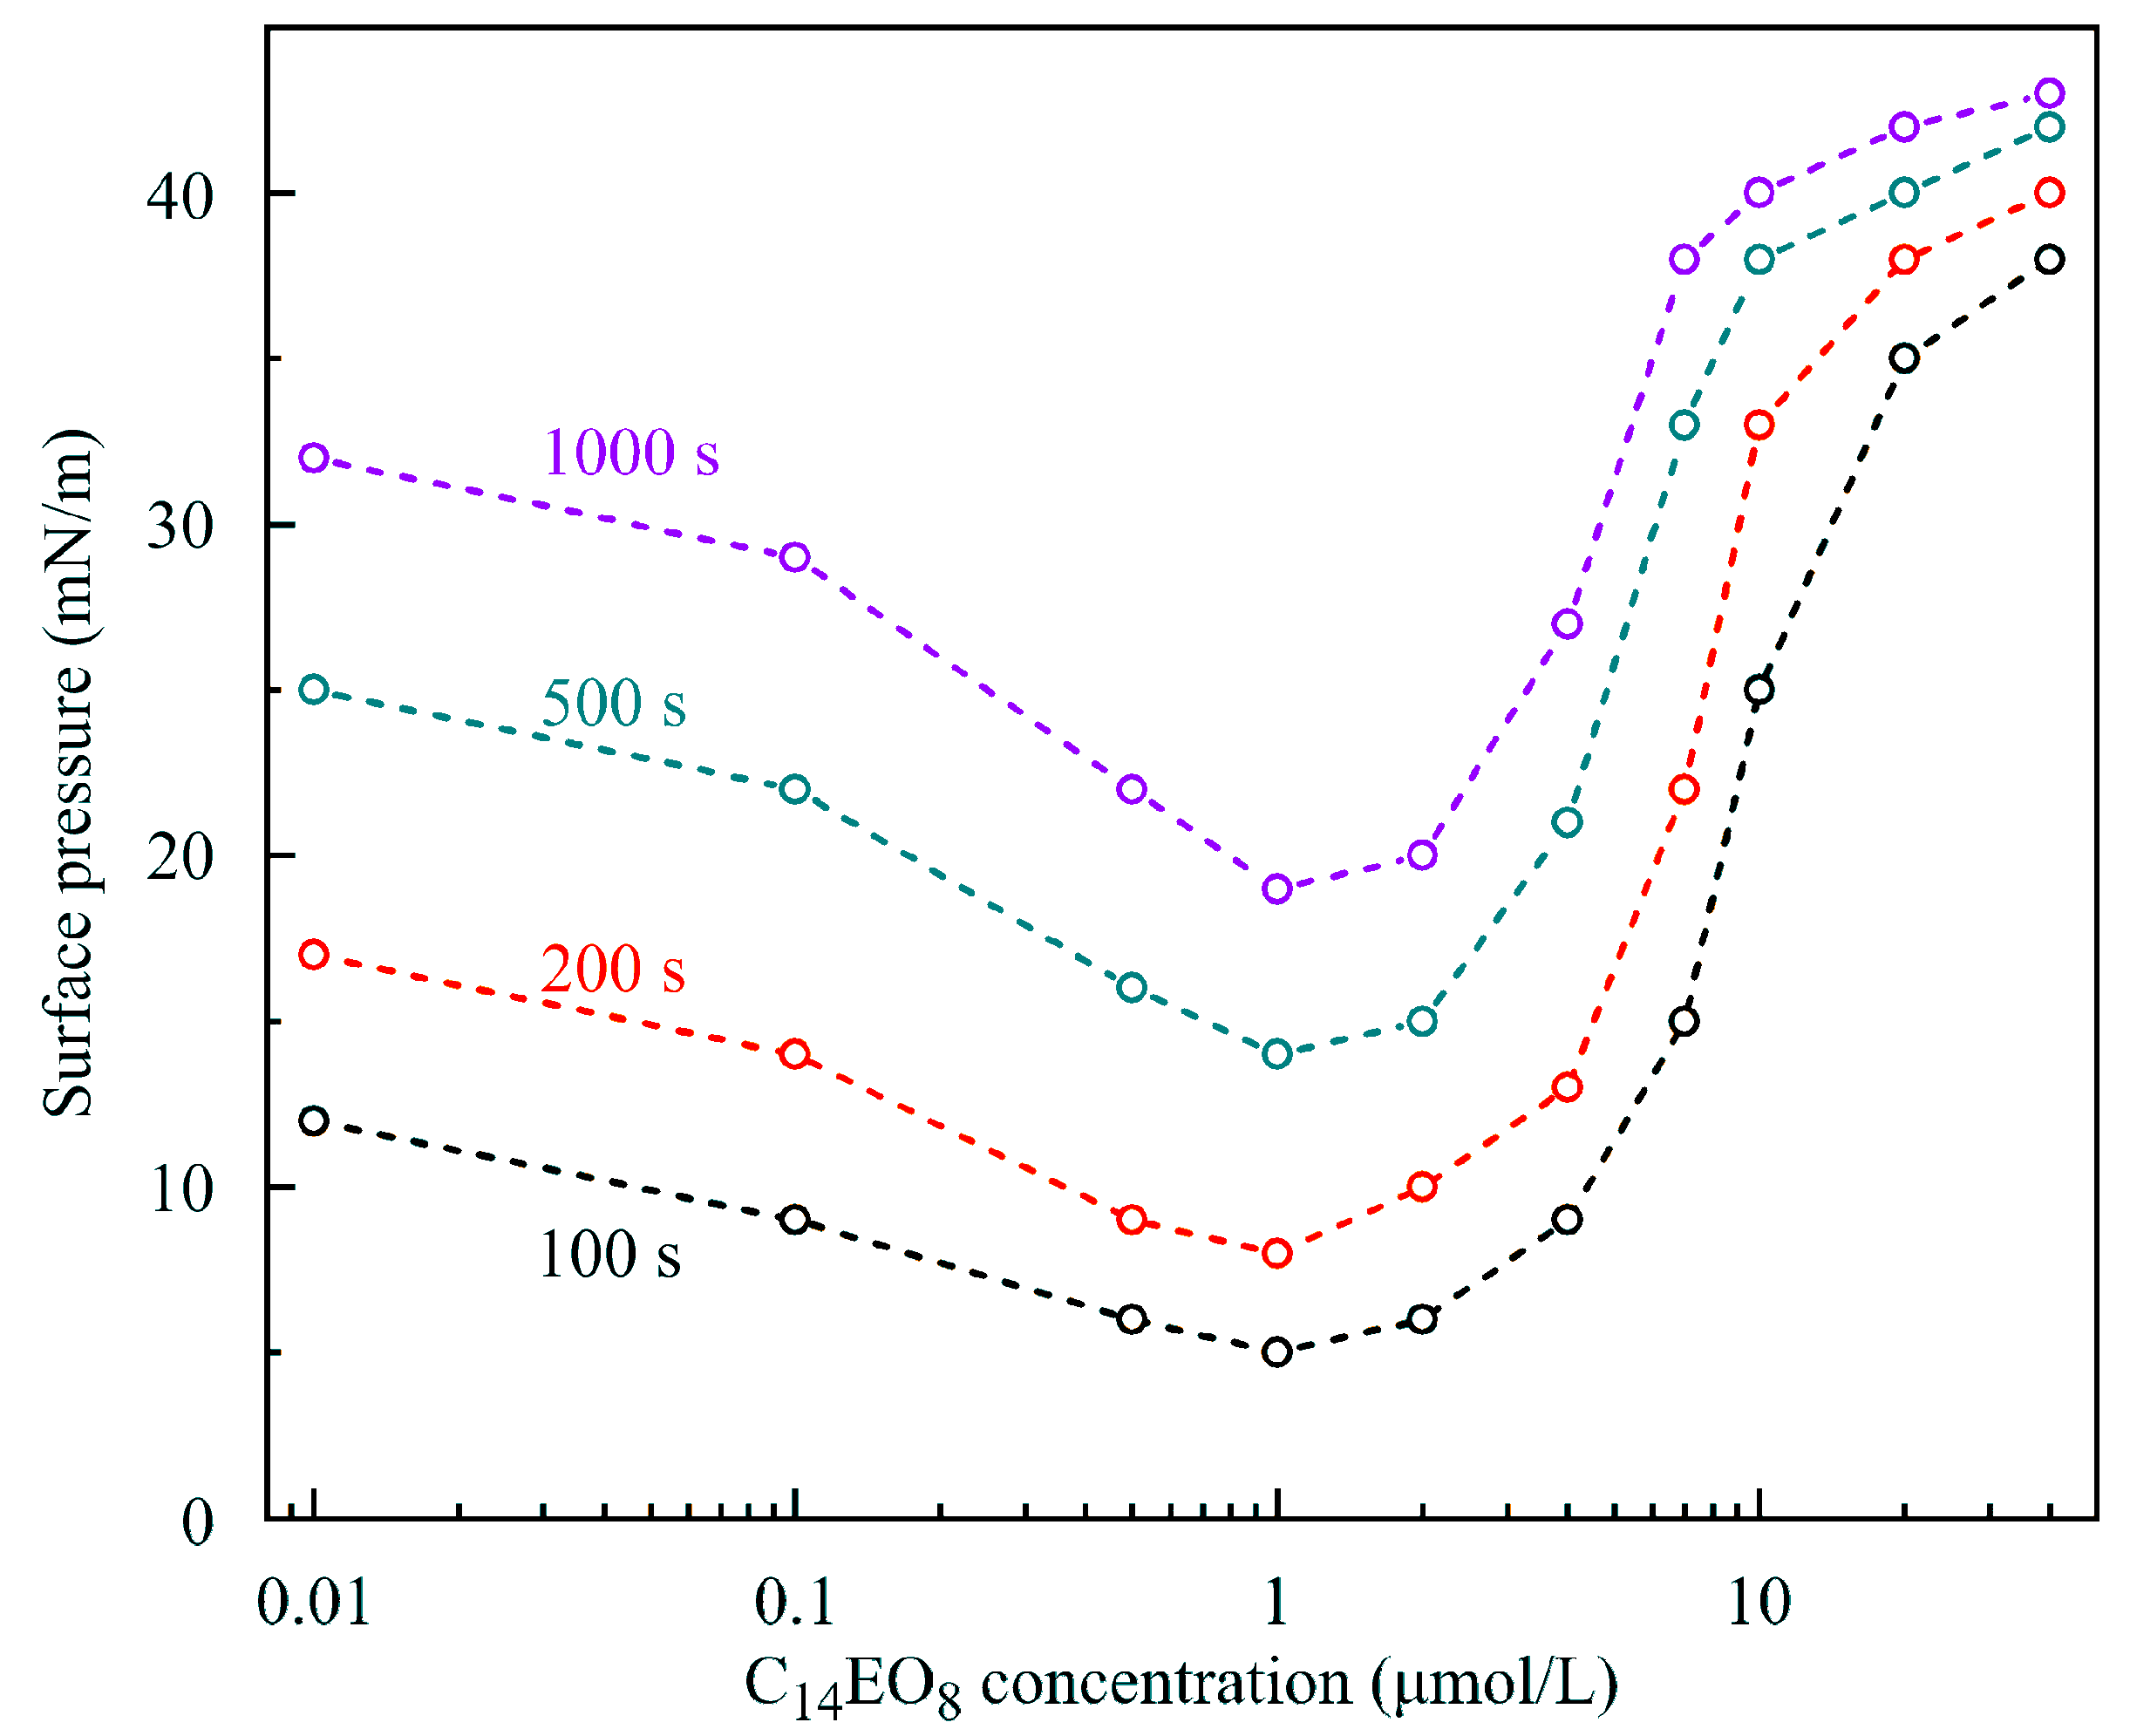
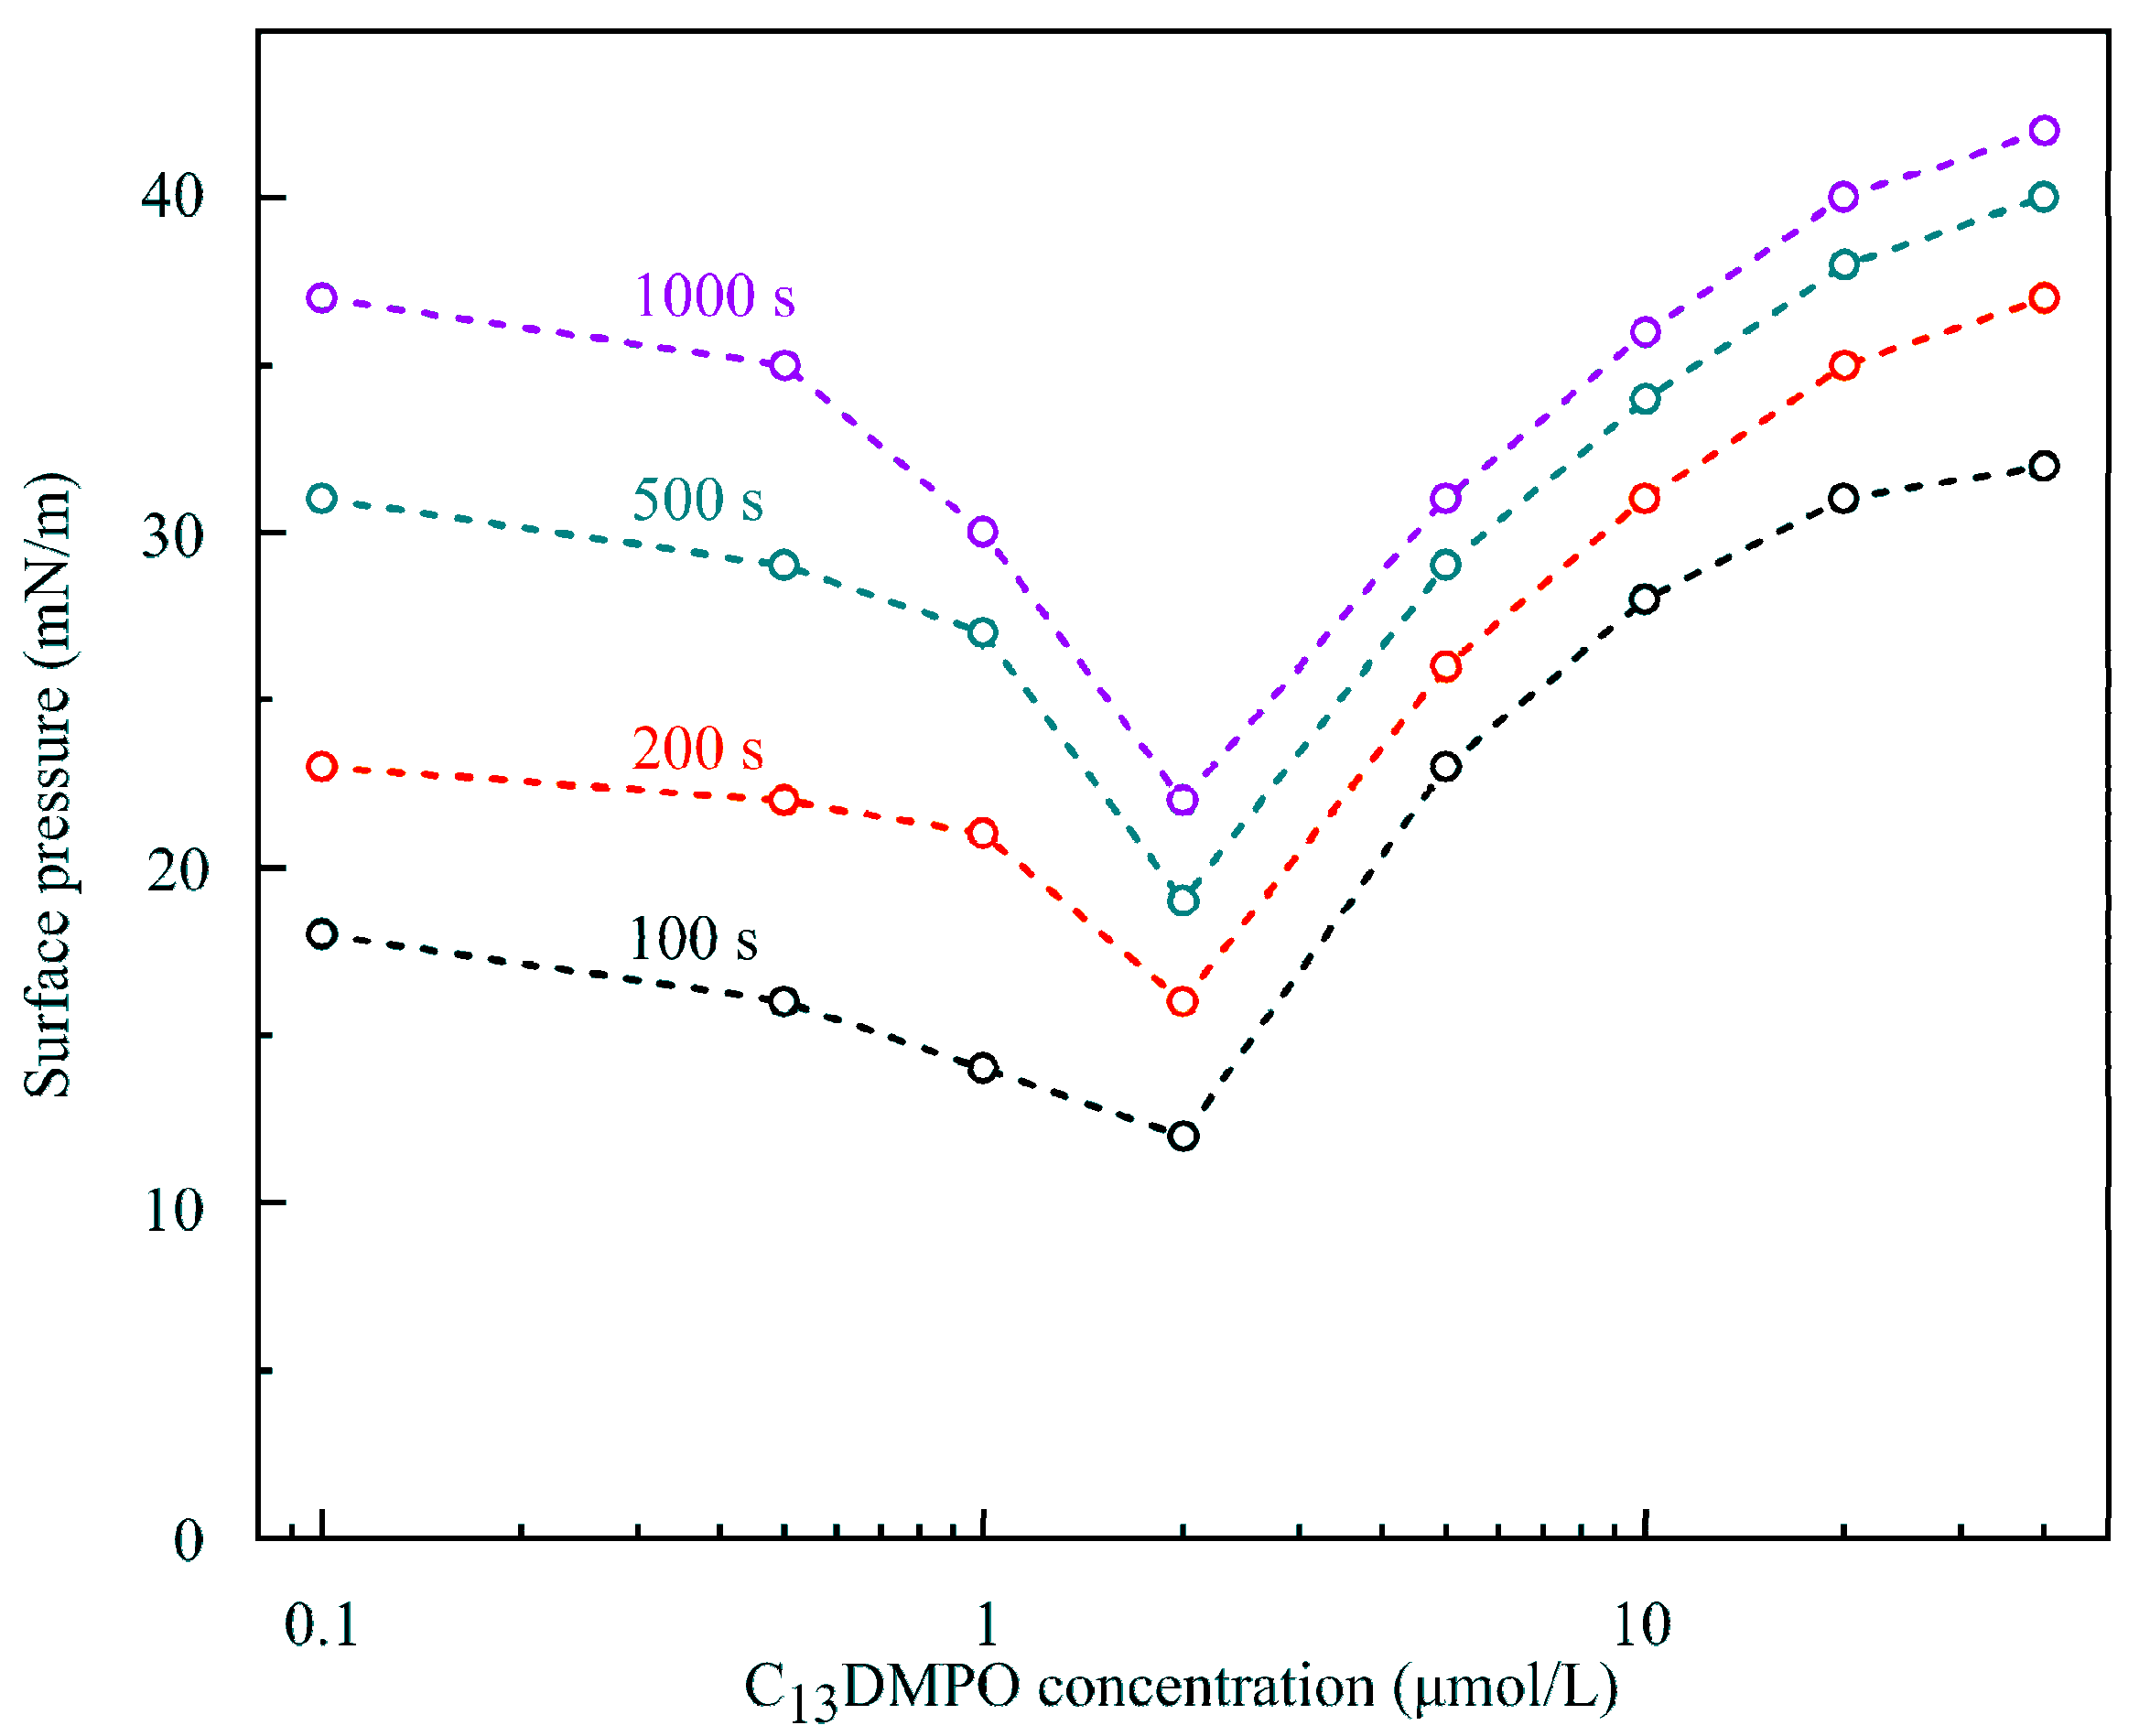
In our opinion, this unusual behavior of solutions could be explained when
Figure 11 and
Figure 12 are considered. In these Figures, the dependencies of surface pressure on C
14EO
8 and C
13DMPO solutions concentration obtained in the experiments with a capillary diameter 3 mm and initial drop volume 24 mm
3 at times 100, 200, 500 and 1000 s are shown. It is seen that at concentrations below 1–2 μmol/L the surfactants showed an apparently higher surface activity, which is caused by cooperative adsorption of hexane and surfactant. Under these conditions a hexane film was formed at the drop surface, leading to apparent high surface pressures. As explained in [
11], the interaction between the surfactant and hexane led to a higher hexane adsorption compared to the (unrealistic) case, when such interaction would be absent (cooperative effect). With increasing surfactant concentration, the adsorption of surfactant increased, which initially also enhanced the hexane adsorption (e.g., for C
13DMPO concentrations below 0.2 μmol/L, cf.
Figure 7 in [
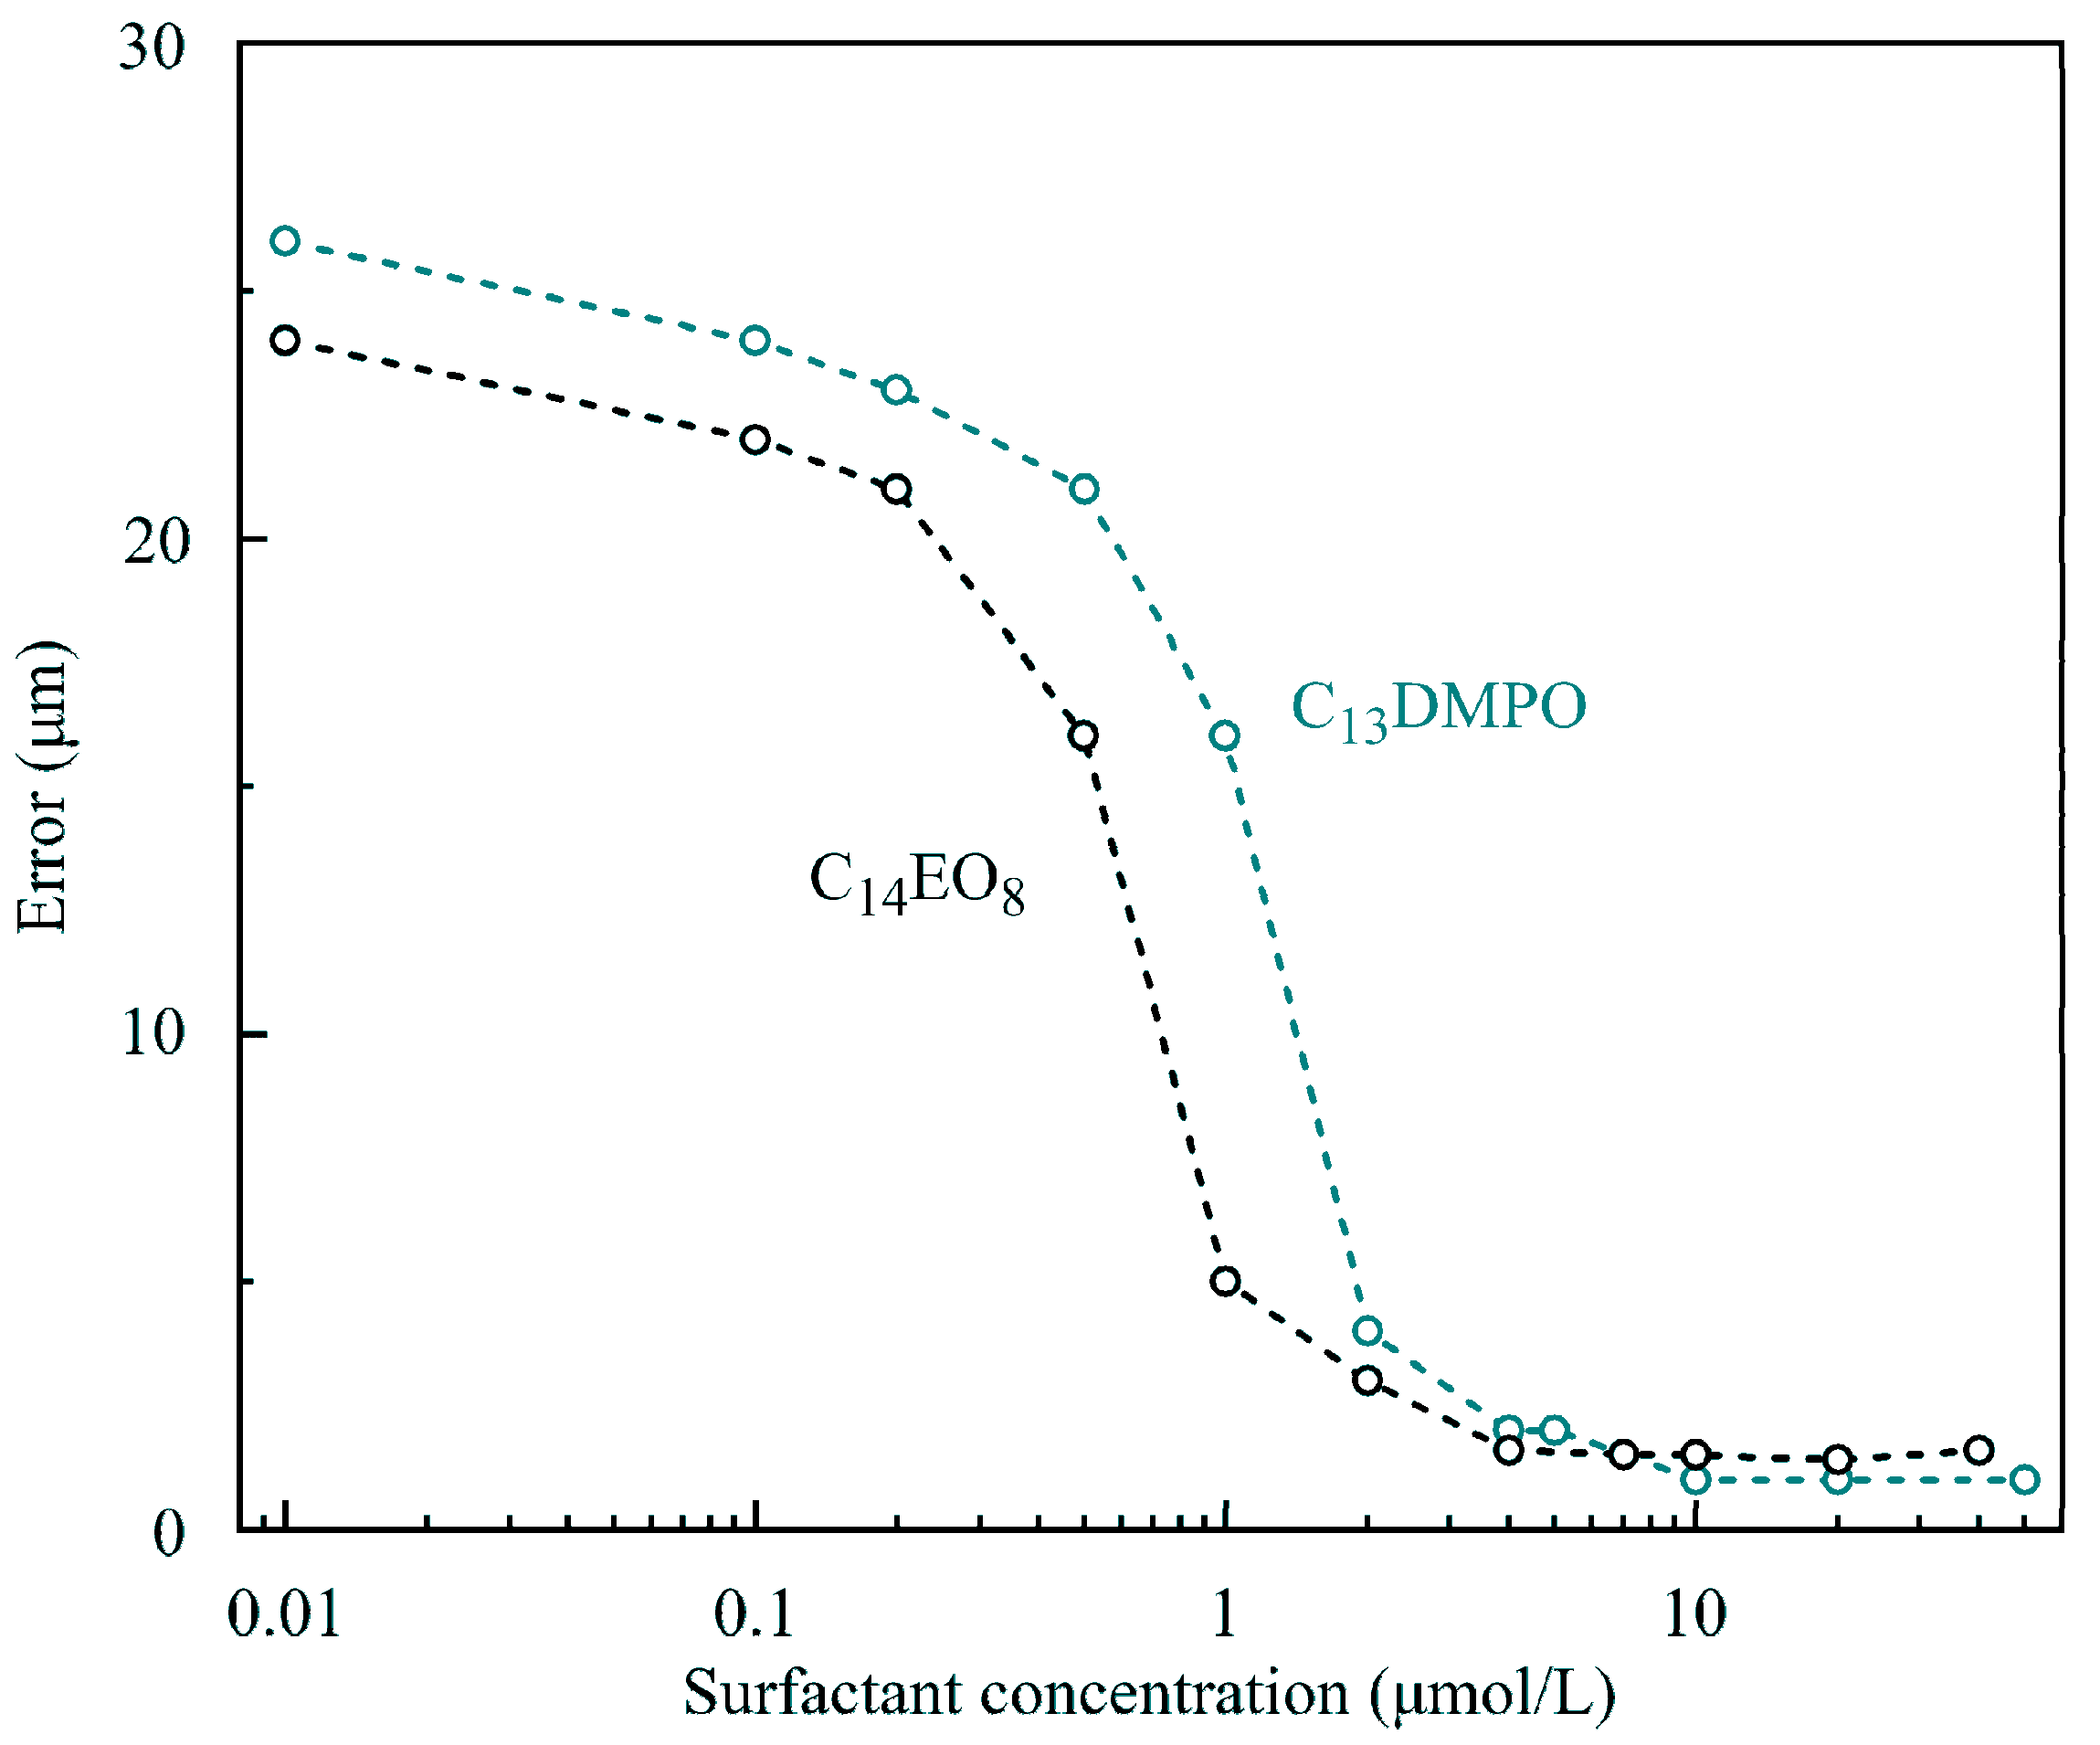
11]). However, with a further surfactant concentration increase, the hexane adsorption decreased due to the competition with the surfactant for the place in the adsorption layer. Note that in this higher concentration range, the Errors of fitting the drop profiles became very small, as shown in
Figure 13, due to the gradual disappearance of the hexane film on the drop surface. At concentrations lower than those corresponding to the minimum of surface pressure, the surfactant adsorption is very small, and the hexane film formed at the drop surface governs the measured apparent surface tension. This explains the significant Errors in fitting the drop profile at low surfactant concentrations (
Figure 13). Therefore, at low surfactant concentrations the interfacial parameters, apparent surface tension and Error, were approximately the same as those for the pure water drop in hexane vapor.
Consider finally the equilibrium properties of the studied systems illustrated in
Figure 14. Here, the data obtained in [
11,
17,
18] for C
13DMPO solutions at the interface with air are shown by open squares, and the data [
11] for C
13DMPO solutions at the interface with hexane vapor are shown by filled rhombi. In these experiments the V/S ratio for drops was 0.55. Open triangles show the data obtained in [
13,
17,
19] for C
14EO
8 solution drops at the interface with air, while filled triangles show the data obtained in the present study for C
14EO
8 drops formed in a hexane vapor atmosphere. In these experiments, the V/S ratio was 0.7. Filled squares represent the values obtained in this work at the interface of C
13DMPO solutions with hexane vapor. Here, the V/S ratio was also equal to 0.7. It is seen that the results obtained in [
11] for C
13DMPO solution drops in hexane vapor (filled rhombi) somewhat differ from the values obtained in the present study (filled squares). This difference is attributed to different V/S ratio values: the solution depletion caused by the adsorption of surfactant on the drop surfaces in this study are lower than those in [
11].
It follows from the above that the isotherms for solution drops in the hexane vapor exhibited the maximum of (apparent) equilibrium surface tension at the solution concentrations equal to those which corresponded to the minimum of dynamic surface pressure as shown in
Figure 11 and
Figure 12. This indicated that in the two concentration ranges, different mechanisms governed the influence of hexane on the adsorption of surfactant. At the concentrations above the extremum, the presence of hexane stimulated the adsorption of the surfactant, and the presence of the surfactant also led to the increase in the surfactant adsorption. The theoretical model which explains this phenomenon is presented in detail in [
12]. In particular, for water-soluble surfactants the corresponding adsorption isotherm reads
where the subscripts refer to the surface-active components,
i = 1 or 2 for hexane and surfactant, respectively; θ
i is the surface coverage by the molecules of
ith component. The other model parameters are b
2—surfactant adsorption activity parameter, c
2—equilibrium surfactant concentration inside the drop. The Frumkin interaction coefficients a
1 and a
2 refer to molecules of component 1 or 2, respectively, and a
12 to the interaction between component 1 and 2. The adsorption isotherm for alkane molecules reads [
11]
here, P
1 is the partial pressure of hexane vapor (component 1) and d
1 is the corresponding adsorption activity coefficient. The partial pressure of saturated hexane vapor in air at 25 °C amounts to 2 × 10
4 Pa. The adsorption activity depends on the interaction between hexane and water (d
1), and hexane with the surfactant (k
1).
The dependencies of equilibrium surface tension at the interface between the solution drop and air shown in
Figure 14 were described in [
17] using the Frumkin adsorption model. It was shown that the adsorption activity parameter b
2 for C
14EO
8 was significantly higher than that of C
13DMPO. However, the best results for C
14EO
8 at the solution surface with air were obtained by fitting the more rigorous reorientation model [
16,
17,
19] which exhibited a much better agreement with the experiment. (Note, the optimum parameter values of the respective thermodynamic model were obtained via a fitting procedure of the respective equations to the measured data. The deviation between the measured and calculated dependencies was used as target function in this fitting process, it has however nothing to do with the Error we discuss here as a quality parameter for fitting the experimental drop profiles by the GLE). In the present work, the model which combines the hexane adsorption isotherm (2) and the reorientation adsorption isotherm [
17] for the surfactant, was used to calculate the surface tension values at the concentrations above that corresponding to the extremum shown in
Figure 14. In particular, the adsorption activity coefficients for the surfactants obtained from fitting this combined model to the experimental data were found to be much larger than those estimated from the Frumkin model, Equations (1) and (2), while the parameters which govern the behavior of hexane were almost the same.
The dependencies of surface tension on the surfactant concentration in the range below that corresponding to the extremum shown in
Figure 14 are still to be theoretically explained. It can be supposed that to obtain the correct theoretical description of this behavior, the influence of the surfactant on the formation of the hexane phase at the drop surface should be taken into consideration.


 ,
, 


