
Optimization of Fiber Factors on Flexural Properties for Carbon Fiber Reinforced Polypropylene


1
Department of Mechanical and Industrial Engineering, Universitas Gadjah Mada, Yogyakarta 55281, Indonesia
2
Department of Mechanical Engineering, Universitas Muhammadiyah Yogyakarta, Yogyakarta 55183, Indonesia
*
Author to whom correspondence should be addressed.
J. Compos. Sci. 2022, 6(6), 160; https://doi.org/10.3390/jcs6060160
Submission received: 11 April 2022
/
Revised: 17 May 2022
/
Accepted: 23 May 2022
/
Published: 30 May 2022
Abstract
:Fiber factor strongly influences the flexural properties of fiber-reinforced composites. Theoretically, strong fiber-matrix bonds combined with long fibers can produce high composite strength, while short fibers influence the ductility of the composite. Both conditions are obtained by aligning the fiber with the loading direction. In this study, an experimental study was conducted on the effect of fiber factors on the flexural strength and modulus of carbon fiber reinforced polypropylene. The fiber factors included in this study were: cryogenic fiber surface treatment, fiber length, and fiber orientation; each factor was divided into three levels. The relationship between the fiber factors and the responses was analyzed using the Response Surface Method (RSM) and Analysis of Variance (ANOVA). The results indicate that there is a good correlation between the predicted response values of the model and the results of the confirmation test. The fiber orientation has the most significant effect on the flexural strength of the composite. All fiber factors significantly affected flexural modulus, with fiber orientation as the most significant factor.
1. Introduction
The technical application of short carbon fiber reinforced thermoplastic (SCFT) composites is increasingly popular because of its advantages, such as the strength-to-weight ratio, ease of production process, and low price. The flexural properties of fiber-reinforced thermoplastic composites are influenced by several factors, including fiber type, fiber volume fraction, fiber orientation, and fiber–matrix bond [1,2]. As one type of commodity thermoplastic, polypropylene (PP) has gained popularity as a matrix resin due to its being lightweight, waterproof, and low cost. However, PP has low adhesion to carbon fibers (CFs). Modifications to the matrix and carbon fiber are needed to improve the interfacial and mechanical properties of the composite [3].
Short fibers always strive to align the loading direction in the production process. This alignment can provide better load-bearing support [4]. Zhou and Mallick [5] investigated the mechanical behavior of the short glass fiber reinforced polyamide-6.6 specimen, which was in the direction of the injection flow and perpendicular to the injection flow. The strength of the specimens perpendicular to the injection flow was 35% lower than the specimens in the direction of the injection flow, as was the tensile modulus. Werken, et al. [6] proved that carbon fiber arrangement can increase the tensile strength and modulus of carbon fiber reinforced composites by 100 and 137%, respectively, compared to non-aligned composites. According to Teixeira, et al. [7], a higher degree of fiber orientation is responsible for the higher flexural strength of the composite. Kumaresan, et al. [8] stated that tensile and flexural strength showed the maximum value in the 0° orientation (unidirectional) compared to other fiber orientations.
Several studies have also been conducted to examine the effect of fiber length on the mechanical properties of composites. Fu and Lauke used two probability density functions for modeling fiber length distribution and fiber orientation [9]. The model was developed to estimate the elastic properties of short fiber reinforced plastic (SFRP). The strength of SFRP was calculated as a function of fiber length and distribution of fiber orientation. Their study found that the strength of SFRP increases dramatically as the mean fiber length increases. Rezaei, et al. studied how fiber length affected the thermomechanical properties of short carbon fiber/PP (SCF/PP) composites. SCF/PP composites demonstrated that longer carbon fibers had better thermomechanical properties than shorter ones [10]. As the fiber length had a significant effect on the mechanical properties of the composites, it was important to get the critical length which represented the minimum fiber length that could be fractured by applied stress. There needed to be a balance between fiber pull-out and fiber breakage. It should be noted that the calculation of the single fiber critical length was different from the calculation of the tow critical length [11,12].
In contrast, Karsli, et al. [13] stated that the initial fiber length in their studied range did not significantly affect the properties of composites. The increase in tensile strength and modulus were more influenced by fiber content. Fiber length is strongly correlated with Young’s modulus and tensile strength, and it can be considered a critical factor for impact strength [14]. Hirano, et al. [3] investigated the effects of the fiber length and IFSS on the mechanical properties of carbon fiber reinforced polypropylene. They found that when the fiber length is sufficiently short, the composite strength and impact resistance improves with increasing IFSS. On the other hand, when the fiber length is longer, the impact resistance improves with decreasing IFSS. Thus, the bond strength between fiber and matrix, as indicated by IFSS, is also a critical factor in optimizing the potential of fiber-reinforced composite to support the load.
High bond strength provides effective stress transfer from the matrix to the reinforcement, improving the ultimate strength. In contrast, low fiber/matrix interfacial strength contributes significantly to the failure of composite structures [15]. Treatment of the fiber surface, both chemically and mechanically, is one way to increase its bond strength with the matrix. Cryogenic treatment is an effective and low-cost method of improving the interfacial properties of a fiber-reinforced composite. Zhang, et al. [16] applied a cryogenic treatment to carbon fibers and observed their effect on changes in the surface roughness of the fibers and their interfacial properties. In one of their experiments, Zhang placed carbon fiber directly in liquid nitrogen at 77K. When compared to untreated fiber, cryo-treated fiber has a higher surface roughness. Changes in surface roughness can be caused by fiber-free volume contraction induced by the shock-cooling. Cryogenic treatment of carbon fiber has also been shown to improve interfacial properties [17]. Shao, et al. [18] studied the influence of cryogenic treatment on the mechanical and interfacial properties of carbon nanotube fiber/bisphenol-F epoxy composite. Because of the significant difference in their thermal expansions, the structure of embedded carbon nanotubes (CNT) fiber changed due to unequal shrinkage of the CNT fiber and the epoxy at cryogenic temperatures. The cryogenic treatment did not affect the strength of the CNT fiber, but it did reduce the variation of the strength.
In previous studies, the researchers observed the effect of fiber orientation, fiber length, and fiber treatment on the flexural properties of CFRP separately. In actual manufacturing conditions, these three factors have a simultaneous influence on the flexural properties, so it is necessary to find the factors that have the most significant effect on the mechanical performance of the composite, and to obtain recommendations for the optimal combination of parameters. This research uses the compression molding method to make a fiber-reinforced polypropylene composite specimen with a thickness of 1 mm. There are three factors: fiber length, fiber orientation, and fiber surface treatment; each factor is divided into three levels (low, medium, and high). This study aimed to determine the effect of process factors on the flexural strength and modulus of the laminate. The relationship between factors and responses was analyzed using the Response Surface Method and Analysis of Variance. By knowing the most significant factors, composite makers can pay more attention in cases of production problems, while the optimization of fiber factors in the manufacturing process will reduce the potential for trial and error.
2. Experimental
This section describes the material, research stages, experimental design, and testing methods used in this study.
2.1. Material
High-impact polypropylene copolymer Cosmoplene AW564 (The Polyolefin Company, Singapore) was selected and used as matrix material [19]. PAN-based carbon fibers (12 k, commercially sized, T-700 grade) manufactured by Toray, Tokyo, Japan, were used as short fiber reinforcement [20]. The fibers were surface treated by immersion in liquid nitrogen. The properties of the materials are tabulated in Table 1.
2.2. Fiber Length and Fiber Orientation
The strength, stiffness, and toughness of SCFT are determined by fiber length and fiber orientation [4]. These properties are increased when the fiber is aligned in the load direction; correspondingly, they are reduced when the fiber is at right-angles to the load direction. In this study, the carbon fiber was arranged in the mold to form the angle of the fiber in three directions—0, 45, and 90°—to the longitudinal axis of the specimen, as described in Figure 1. To ensure the fibers were evenly dispersed and arranged in the specified position, the fibers were manually laid on the mold, guided by the wire mesh with three angle settings.
In a short fiber composite, the critical fiber length is the minimum fiber length at and beyond which maximum allowable fiber strength can be achieved [4,21]. Since the specimen contained a tow of fiber, the tow diameter and critical length of the tow were considered. The critical tow length is expressed in Equation (1):
where , , and are the fracture strength, the cross-sectional area, and the perimeter of the tow, respectively. is the interfacial shear strength (IFSS) between the matrix and the fiber. In this case, the tow diameter was 0.85 mm, the tow cross-sectional area was 0.56 mm2, and the tow perimeter was 2.7 mm. Based on initial experiment, the bundle fracture strength was 422 MPa, and the IFSS of the copolymer PP/carbon fiber was 35.4 MPa [22]; then a critical length of 2.5 mm was obtained. The fiber length varied in three levels of 1.5 mm, 3 mm, and 4.5 mm, respectively. The first level of variation in fiber length was determined to be lower than the critical length to observe the effect of the critical length.
2.3. Composite Fabrication
Figure 2 shows the preparation of composite specimen. The compression molding process was used to prepare composite specimens. The raw material used in this process was already in the form of composite pellets composed of carbon fiber covered by a polypropylene matrix; an extrusion-pultrusion process produced these pellets. Before being combined with the matrix, the carbon fiber was surface treated by immersion in liquid nitrogen. The immersion time of the fiber was selected as one of the variables in this study. There were three variations in immersion time: 10, 15 and 20 min. Immersion time in liquid nitrogen for 10 min had been shown to provide a good fiber–matrix bond [23]. The effect of a longer immersion time was observed in this study. The extension of the immersion time was expected to provide additional time for the surface shrinkage of the carbon fiber. The composite pellets were then cut into three variations of length and laid out in the mold in three variations of orientation. The composite pellets were pressed into the mold, which was heated at 200 °C to form a panel with a size of 80 × 10 × 1. The panel was then cut to fit the flexural testing specimen according to ASTM D790 [24].
2.4. Design of Experiment
The Response Surface Method (RSM) has proved to be a powerful statistical method for determining the relationship between process factors and multiple responses [25]. Furthermore, the significance of the individual factors and the model was determined by the Analysis of Variance (ANOVA) method, through which the generalized empirical model was refined by the removal of insignificant terms. F-ratios and p-values were calculated and compared. Table 2 shows the varied factors and levels, while Table 3 describes the experimental matrix. The experimental matrix consisted of 15 runs with three repetitions. Five specimens were taken for flexural tests, and five specimens for tensile tests, in each run.
2.5. Characterization
The flexural test was carried out using the three-point bending method according to the ASTM D790. Specimens were cut from compression-molded panels with dimensions of 32 × 10 × 1 mm. The test speed was maintained at 2 mm/min. The neutral axis was assumed to be precisely at the middle of the specimen depth. Shear interactions were minimized or eliminated using a 16:1 span length to depth ratio. The flexural strength and modulus of the fiber-reinforced composite material can be written as:
where F is the maximum load before failure; L, b, and h are the span, width, and depth of the specimen; m is the slope of the tangent to the initial straight-line portion of the load-deflection curve; and D is the maximum deflection before failure [24].
Maintaining a final fiber length that exceeds the desired critical length (lc) for effective load transfer is a significant barrier in the compression molding of fiber-reinforced plastic.
3. Results and Discussion
3.1. Experimental Results
The average results from 15 trials with varying factors and levels are shown in Table 4. These results showed the same trend: that the highest flexural strength and modulus were obtained in specimens with a fiber length of 4.5 mm and fiber orientation of 0° (in the direction of loading), and that the lowest values were found in specimens with a fiber length of 1.5 mm and fiber orientation of 90°. To obtain the possibility of increasing flexural properties, it is necessary to find the appropriate parameters. ANOVA can help to find the relevance of these factors and responses.
3.2. Analysis of Flexural Strength
ANOVA analyzed the relationship between factors and responses to determine the significance of the influence of the response-forming factors. Table 5 describes the analysis of variance of flexural strength based on the experimental result from Table 4. The Model F-value of 3.84 implies that the model is significant. There is only a 4.99% chance that an F-value this large could occur due to noise. A “p-value” greater than 0.1000 indicates the model terms are not significant. In this case, fiber orientation had the most significant effect on the model, while fiber treatment had a lower effect than other factors.
A negative “Pred R-Squared” indicates that the cumulative mean outperformed the current model in terms of response prediction. The signal-to-noise ratio was measured by “Adeq Precision”. A ratio higher than four was preferred. In this case, the ratio of 5.222 showed an adequate signal. This model assisted in finding the way around the design space. The “R-Squared” of 0.5117 conformed reasonably with the “Adj R-Squared” of 0.3785; the difference was less than 0.2. The model generated by ANOVA can be expressed mathematically in Equation (4):
where σfc is the flexural strength of the composite, A is the fiber immersion time, B is the fiber length, and C is the fiber orientation, respectively. This Equation can be used to calculate the response for different levels of each factor. Each factor level should be defined in its original units.
The influence of individual factors on flexural strength is shown in Figure 3. Changes in fiber length had little effect on increasing flexural strength, but fiber orientation sharply controlled flexural strength. In contrast, the cryogenic treatment of fiber did not affect the flexural strength of the composite.
As shown in Table 4, the experiment resulted in the highest flexural strength of 78.43 MPa at a combination of 4.5 mm fiber length parameters and 0° of fiber orientation. Equation (4) can be used to find the probability of maximizing flexural strength by determining the appropriate factor values, as shown in Table 6. In the three variations of fiber orientation angle, fiber length was used as a controlling factor. Although in Figure 3, fiber length does not increase flexural strength, the trend of increasing fiber length improves flexural strength. The fiber length entered as a calculation input was more than 4.5 mm, with the maximum limit being the dimensions of the specimen in the direction of fiber orientation. For orientation 0°, the fiber length limit was 32 mm (the maximum length of the test specimen); for orientation 45°, a fiber length of 14.14 mm was used; and for orientation 90°, the fiber length was 10 mm (the maximum width of the specimen). The fiber immersion time was set constant at a minimum level, as this factor had a more negligible effect on the response. By calculation, the maximum increase in fiber length according to its orientation can increase flexural strength.
3.3. Analysis of Flexural Modulus
In Table 7, ANOVA for flexural modulus showed that both the model and the factors were significantly related to the response; all p-values were less than 0.05. As in flexural strength, fiber orientation also has the most significant influence on flexural modulus.
The “Pred R-Squared” of 0.6218 is in reasonable agreement with the “Adj R-Squared” of 0.7750; i.e., the difference is less than 0.2. The signal-to-noise ratio can be measured by “Adeq Precision.” The ratio of 12.06 (higher than 4) is desirable and indicates an adequate signal. The model fulfills the requirement to navigate the design space. The model built by ANOVA is written mathematically in Equation (5):
where is the flexural modulus of the composite. Equation (5) can be used to maximize flexural modulus by determining the appropriate factor values, as shown in Table 8:
The relationship between each individual factor and the flexural modulus is shown in Figure 4. Both fiber immersion time and fiber length showed a positive effect. This means that an increase in both can improve the flexural modulus. In contrast to these two factors, an increase in the angle of fiber orientation has a negative effect on the flexural modulus. By using Equation (5), the flexural modulus can be calculated based on the factor entered. The results show that the flexural modulus can be increased dramatically in all fiber directions by maximizing the fiber length and the fiber immersion time.
3.4. Optimization and Confirmation
Using Response Surface Methodology allows for achieving optimum flexural strength and modulus simultaneously. The so-called desirability function is the most common method used for optimizing quantitative response variables. It is a function that converts an estimated response variable Yi into a desirability value di, where 0 ≤ di ≤1. As the desirability of the response increases, so does the value of di. The desirability value is 0 if the product characteristic is in an undesirable target area, and 1 if the product criterion is at its optimal value [25]. This function can be combined with RSM to provide a more profound approach for determining an appropriate response, including antagonist responses [26]. To solve a multi-objective optimization, the desirability response (DR) in Equation (6) is needed, which is calculated as the arithmetic means of the desirability functions, where d1 and d2 are the desirability function of each response [26]:
Table 4 shows that the highest flexural strength value of 78.43 MPa, and flexural modulus of 3426.7 MPa, were produced by 15 min cryogenic immersion, 4.5 mm fiber length, and 0° fiber orientation. However, calculations using Equations (4) and (5) from the ANOVA model resulted in flexural strength of 64 MPa and a flexural modulus of 3145.6 MPa at 20 min of cryogenic immersion, 4.5 mm fiber length, and 0° fiber orientation, as can be seen in Figure 5. The combination of these factors had not previously appeared in the Design of Experiment Table. Thus, the desirability for the flexural strength response was 0.612, and the modulus for the flexural response was 0.912. The value of these fiber factors can meet the multi-responses desirability of 0.75, which means that the chance of achieving such a flexural property is high. Although the fiber immersion time does not significantly affect flexural strength, the desirability function recommended using a high factor level (20 min) because of flexural modulus.
Based on the validation of the ANOVA models, an experimental confirmation program was conducted on the optimal mix conditions obtained from the multi-objective optimization technique. The average flexural strength value of the experimental confirmation result was 8.5% higher than the predicted flexural strength, while the result of the flexural modulus was 5.4% higher than the predicted value, as shown in Table 9.
4. Conclusions
The fabricating of carbon fiber reinforced polypropylene by compression molding has been successfully carried out. Fiber orientation corresponded closely with flexural strength and modulus responses, confirming a solid dependence of fiber orientation on flexural behavior. Principal conclusions drawn from this study are:
- The RSM-ANOVA models of the flexural strength and modulus have been developed and statistically validated.
- The RSM optimization technique reduces the experimental time, improves the flexural performance of the composite, improves reliability, and achieves robustness of the composite.
- The orientation of the fibers has the most significant effect on the flexural strength of the composite.
- All fiber factors influenced flexural modulus significantly, with fiber orientation being the most significant factor.
- Applying the optimal fiber factors can improve the flexural strength and modulus of carbon fiber reinforced polypropylene.
Author Contributions
Conceptualization, G.N.; data curation, C.B.; funding acquisition, G.N.; investigation, C.B.; methodology, C.B.; project administration, G.N.; resources, G.N.; software, C.B.; supervision, G.N.; validation, G.N.; writing—original draft, C.B.; writing—review and editing, G.N. All authors have read and agreed to the published version of the manuscript.
Funding
This research received no external funding.
Institutional Review Board Statement
Not applicable.
Informed Consent Statement
Not applicable.
Acknowledgments
The authors would like to acknowledge the Department of Mechanical and Industrial Engineering, Universitas Gadjah Mada Yogyakarta, and the Department Mechanical Engineering, Universitas Muhammadiyah Yogyakarta, for supporting the materials and equipment used in the experiment.
Conflicts of Interest
The authors declare no conflict of interest.
References
- Singh, J.; Kumar, M.; Kumar, S. Properties of glass-fiber hybrid composites: A review. Polym. Plast. Technol. Eng. 2017, 56, 455–469. [Google Scholar] [CrossRef]
- Kugler, S.K.; Kech, A.; Cruz, C. Fiber Orientation Predictions—A Review of Existing Models. J. Compos. Sci. 2020, 4, 69. [Google Scholar] [CrossRef]
- Hirano, N.; Muramatsu, H.; Inoue, T. Study of fiber length and fiber-matrix adhesion in carbon-fiber-reinforced polypropylenes. Adv. Compos. Mater. 2014, 23, 2–151. [Google Scholar] [CrossRef]
- Piggott, M.R. Load Bearing Fibre Composites, 2nd ed.; MERP: Toronto, ON, Canada, 2016. [Google Scholar]
- Zhou, Y.; Mallick, P.K. A non-linear damage model for the tensile behavior of an injection molded short E-glass fiber reinforced polyamide-6,6. Mater. Sci. Eng. 2005, 393, 303–309. [Google Scholar] [CrossRef]
- Werken, N.V.; Reese, M.S.; Taha, M.R.; Tehrani, M. Investigating the effects of fiber surface treatment and alignment on mechanical properties of recycled carbon fiber composites. Compos. Part A 2019, 119, 38–47. [Google Scholar] [CrossRef]
- Teixeira, D.; Giovanela, M.; Gonella, L.B. Influence of injection molding on the flexural strength and surface quality of long glass fiber-reinforced polyamide 6.6 composites. Mater. Des. 2015, 85, 695–706. [Google Scholar] [CrossRef]
- Kumaresan, M.; Satish, S.; Karthi, N. Effect of Fiber Orientation on Mechanical Properties of Sisal Fiber Reinforced Epoxy Composites. J. Appl. Sci. Eng. 2015, 18, 289–294. [Google Scholar] [CrossRef]
- Fu, S.; Lauke, B. Effect of Fiber Length and Fiber Orientation Distributions on the Tensile Strength of Short-Fiber-Reinforced Polymers. Compos. Sci. Technol. 1996, 56, 1179–1190. [Google Scholar] [CrossRef]
- Rezaei, F.; Yunus, R.; Ibrahim, N.A. Effect of fiber length on thermomechanical properties of short carbon fiber reinforced polypropylene composites. Mater. Des. 2009, 30, 260–263. [Google Scholar] [CrossRef]
- Harper, L.T.; Turner, T.A.; Warrior, N.A.; Rudd, C.D. Characterisation of random carbon fibre composites from a directed fibre preforming process: The effect of fibre length. Compos. Part A 2006, 37, 1863–1878. [Google Scholar] [CrossRef]
- Ksouri, I.; Guermazi, N.; Haddar, N.; Ayedi, H.F. Effects of Processing Steps and Hygrothermal Ageing on Mechanical Performance of PA6GF30 Composite: Interfacial Shear Strength. Polym. Compos. 2018, 36, 504–512. [Google Scholar] [CrossRef]
- Karsli, N.G.; Aytac, A.; Deniz, V. Effects of initial fiber length and fiber length distribution on the properties of carbon-fiber-reinforced-polypropylene composites. J. Reinf. Plast. Compos. 2012, 3, 1053–1060. [Google Scholar] [CrossRef]
- Rohde, M.; Ebel, A. Influence of Processing Parameters on the Fiber Length and Impact Properties of Injection Molded Long Glass Fiber Reinforced Polypropylene. Intern. Polym. Process. 2011, 26, 292–303. [Google Scholar] [CrossRef]
- Warrier, A.; Godara, A.; Rochez, O.; Mezzo, L.; Luizi, F.; Gorbatikh, L.; Verpoest, I. The effect of adding carbon nanotubes to glass/epoxy composites in the fibre sizing and/or the matrix. Compos. Part A 2010, 41, 532–538. [Google Scholar] [CrossRef]
- Zhang, Y.; Xu, F.; Zhang, C.; Wang, J.; Jia, Z.; Hui, D.; Qiu, Y. Tensile and interfacial properties of polyacrylonitrile-based carbon fi ber after different cryogenic treated condition. Compos. Part B 2016, 99, 358–365. [Google Scholar] [CrossRef]
- Li, W.; Zheng, L.; Gao, Y.; Xu, F. Interfacial Bonding Enhancement between Cryogenic Conditioned Carbon Fiber and Epoxy Resin Characterized by the Single-Fiber Fragmentation Method. AATCC J. Res. 2020, 8, 24–30. [Google Scholar] [CrossRef]
- Shao, Y.; Xu, F.; Liu, W.; Zhou, M.; Li, W.; Hui, D. Influence of cryogenic treatment on mechanical and interfacial properties of carbon nanotube fiber/bisphenol-F epoxy composite. Compos. Part B. 2017, 125, 195–202. [Google Scholar] [CrossRef]
- Sumitomo Chemical. Cosmoplene® AW564 Technical Data Sheet; The Polyolefin Company: Singapore, 2019. [Google Scholar]
- Torayca. T700S Data Sheet No. CFA-005; Torayca: Santa Ana, CA, USA, 2018. [Google Scholar]
- Mortazavian, S.; Fatemi, A. Effects of fiber orientation and anisotropy on tensile strength and elastic modulus of short fiber reinforced polymer composites. Compos. Part B Eng. 2015, 72, 116–129. [Google Scholar] [CrossRef]
- Burn, D.T.; Harper, L.T.; Johnson, M.; Warrior, N.A.; Yang, L.; Thomason, J. The Influence of Coupling Agent, Fibre Sizing and Matrix Degradation on the Interfacial Shear Strength between Carbon FIbre and Polypropylene. In Proceedings of the ECCM-16TH European Conference On Composite Materials, Seville, Spain, 22–26 June 2014. [Google Scholar]
- Budiyantoro, C.; Rochardjo, H.S.B.; Nugroho, G. Effects of Processing Variables of Extrusion—Pultrusion Method on the Impregnation Quality of Thermoplastic Composite Filaments. Polymers 2020, 12, 2833. [Google Scholar] [CrossRef]
- ASTM D790; Standard Test Methods for Flexural Properties of Unreinforced and Reinforced Plastics and Electrical Insulating Materials. ASTM Internasional: West Conshohocken, PA, USA, 2013.
- Fu, T.; Haworth, B. Analysis of process parameters related to the single-screw extrusion of recycled polypropylene blends by using design of experiments. J. Plast. Film Sheeting 2017, 32, 168–190. [Google Scholar] [CrossRef] [Green Version]
- Pal, S.; Gauri, S.K. A desirability functions-based approach for simultaneous optimization of quantitative and ordinal response variables in industrial processes. Int. J. Eng. Sci. Technol. 2018, 10, 76–87. [Google Scholar] [CrossRef] [Green Version]
Figure 1.
Fiber orientation with the respect to load direction: (a) 0°; (b) 45°; (c) 90°.
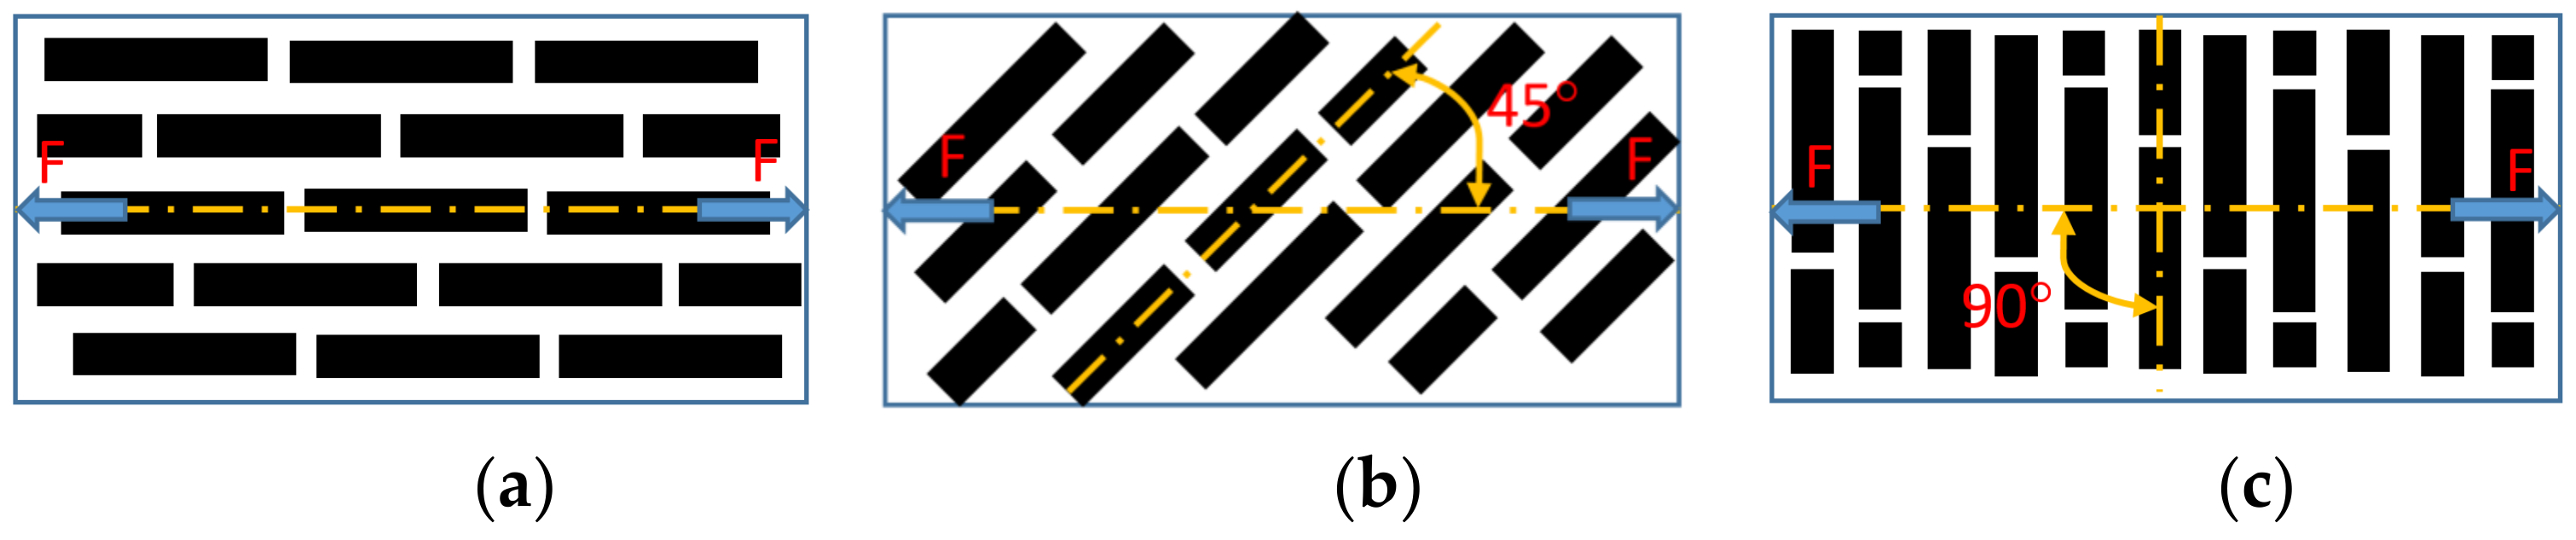
Figure 2.
Preparation of composite specimen involving three factors: fiber immersion, fiber length, and fiber orientation.
Figure 2.
Preparation of composite specimen involving three factors: fiber immersion, fiber length, and fiber orientation.

Figure 3.
Effect of the individual factors on flexural strength: (a) effect of cryogenic treatment; (b) effect of fiber length; (c) effect of fiber orientation.
Figure 3.
Effect of the individual factors on flexural strength: (a) effect of cryogenic treatment; (b) effect of fiber length; (c) effect of fiber orientation.

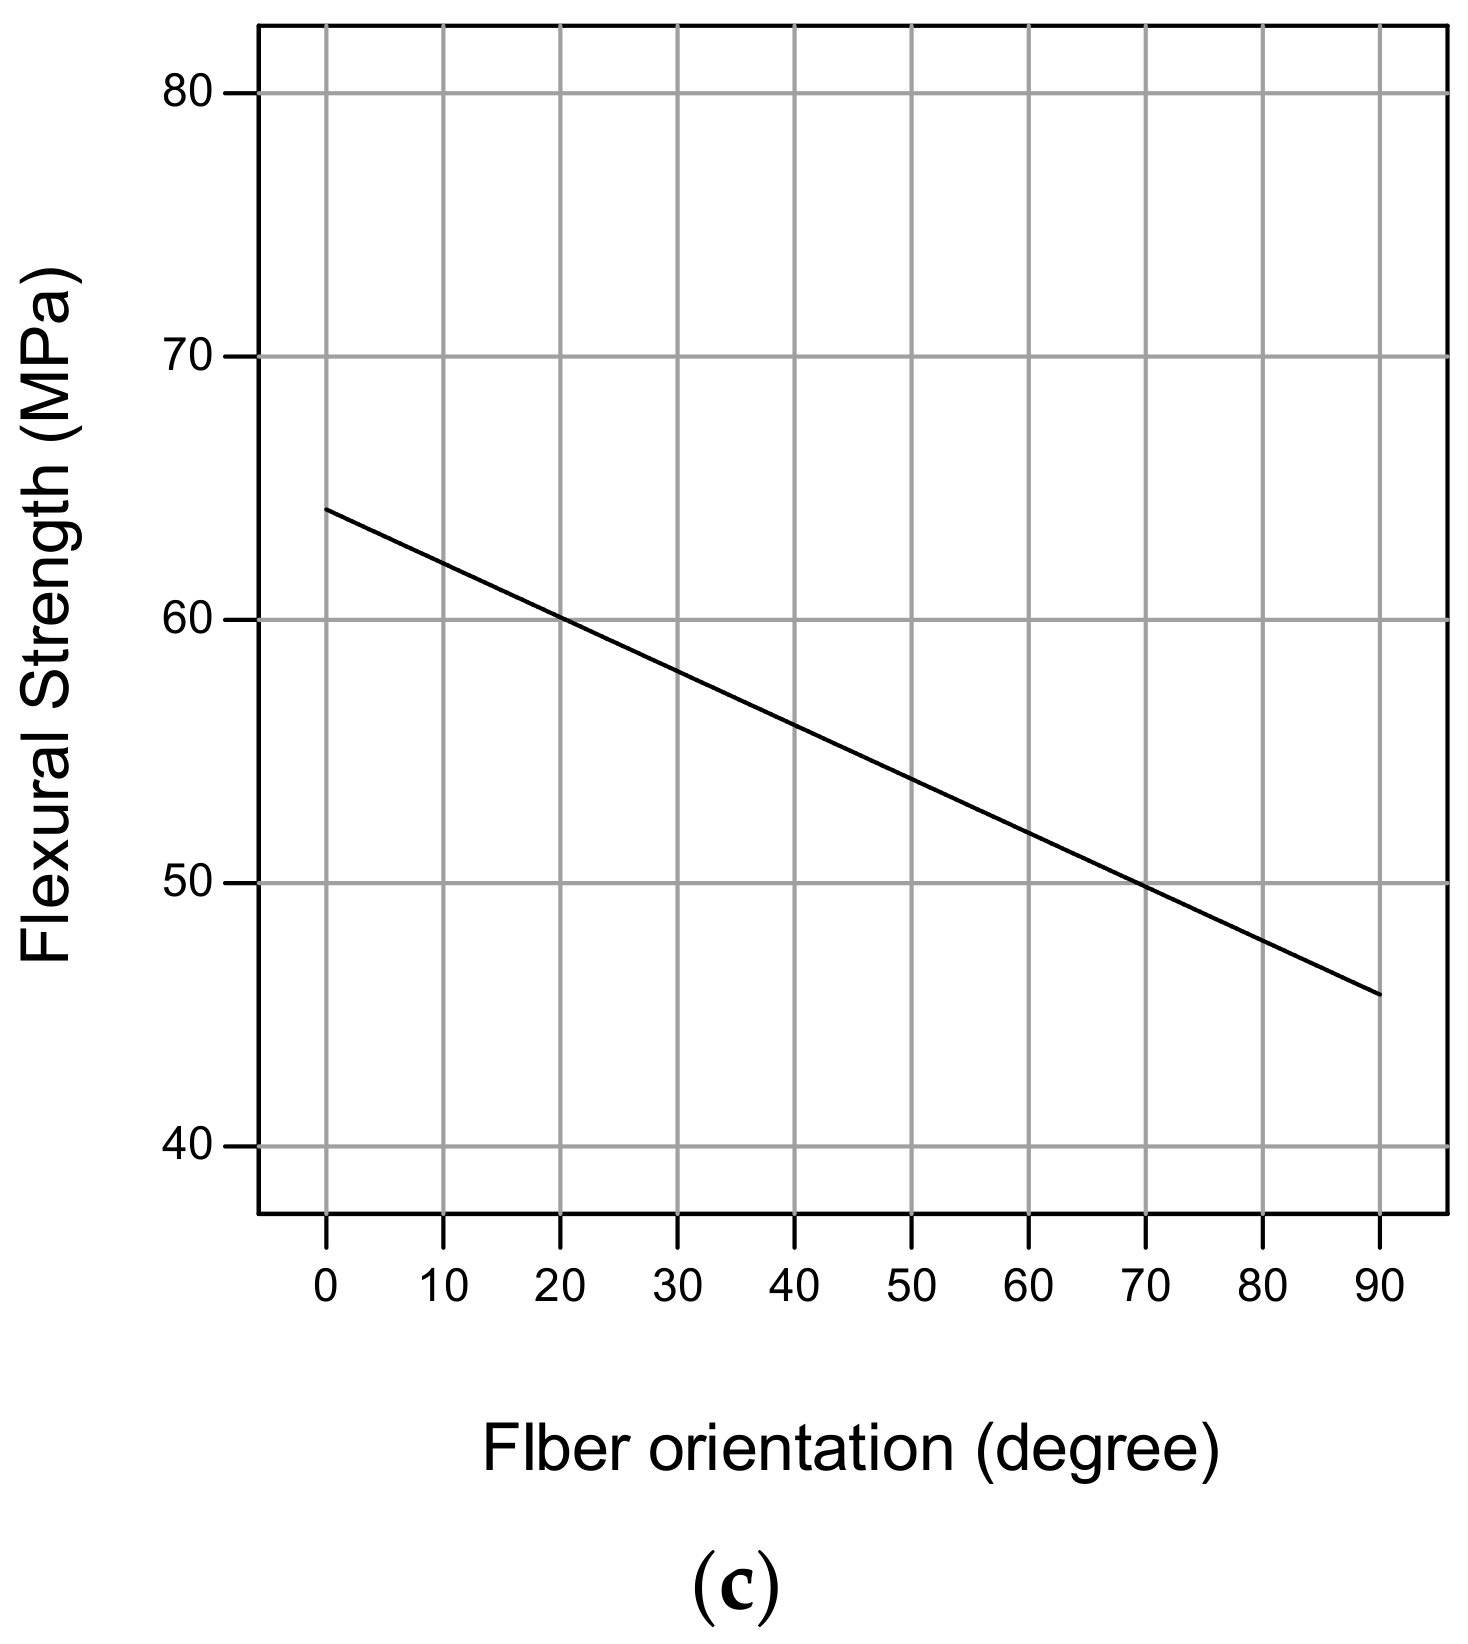
Figure 4.
Effect of the individual factors on flexural modulus: (a) effect of cryogenic treatment; (b) effect of fiber length; (c) effect of fiber orientation.
Figure 4.
Effect of the individual factors on flexural modulus: (a) effect of cryogenic treatment; (b) effect of fiber length; (c) effect of fiber orientation.

Figure 5.
Optimized responses defined by desirability function: (a) desirability; (b) optimized flexural strength; (c) optimized flexural modulus.
Figure 5.
Optimized responses defined by desirability function: (a) desirability; (b) optimized flexural strength; (c) optimized flexural modulus.


Table 1.
Material properties.
| Material | Properties | Values |
|---|---|---|
| Carbon fiber (T700SC 12K) | Filament diameter (µm) | 7 |
| Tow diameter (mm) | 0.85 | |
| Density (g/cm3) | 1.8 | |
| Tensile strength (MPa) | 4900 | |
| Cosmoplene AW564 | Density (g/cm3) | 0.9 |
| Melting temperature (°C) | 190–230 | |
| Tensile strength at yield (MPa) | 27.5 | |
| Tensile strength at break (MPa) | 23 | |
| Liquid nitrogen | Boiling point (°C) | −196 |
| Density, Liquid @ BP, 1 atm (kg/m3) | 808.5 | |
| Specific Gravity, Liquid (water = 1) @ 20 °C, 1 atm | 0.808 |
Table 2.
Selected Factors and Levels.
| Factors | Coding | Actual Level | ||
|---|---|---|---|---|
| Low (−1) | Middle (0) | High (+1) | ||
| Fiber immersion time (min) | A | 10 | 15 | 20 |
| Fiber length (mm) | B | 1.5 | 3 | 4.5 |
| Fiber orientation (°) | C | 0 | 45 | 90 |
Table 3.
Experimental matrix.
| Run | Code | Actual | ||||
|---|---|---|---|---|---|---|
| A | B | C | A | B | C | |
| 1 | −1 | 0 | −1 | 10 | 3 | 0 |
| 2 | 0 | −1 | −1 | 15 | 1.5 | 0 |
| 3 | 0 | 0 | 0 | 15 | 3 | 45 |
| 4 | −1 | 1 | 0 | 10 | 4.5 | 45 |
| 5 | −1 | 0 | 1 | 10 | 3 | 90 |
| 6 | 0 | −1 | 1 | 15 | 1.5 | 90 |
| 7 | 0 | 1 | −1 | 15 | 4.5 | 0 |
| 8 | −1 | −1 | 0 | 10 | 1.5 | 45 |
| 9 | 0 | 1 | 1 | 15 | 4.5 | 90 |
| 10 | 0 | 0 | 0 | 15 | 3 | 45 |
| 11 | 1 | −1 | 0 | 20 | 1.5 | 45 |
| 12 | 1 | 0 | 1 | 20 | 3 | 90 |
| 13 | 0 | 0 | 0 | 15 | 3 | 45 |
| 14 | 1 | 0 | −1 | 20 | 3 | 0 |
| 15 | 1 | 1 | 0 | 20 | 4.5 | 45 |
Table 4.
Experimental results.
| Run | Factors | Average Flexural Strength (MPa) | Average Flexural Modulus (MPa) | ||
|---|---|---|---|---|---|
| A | B | C | |||
| 1 | 10 | 3 | 0 | 63.87 | 1326.7 |
| 2 | 15 | 1.5 | 0 | 55.7 | 2630 |
| 3 | 15 | 3 | 45 | 58.6 | 1409 |
| 4 | 10 | 4.5 | 45 | 46.8 | 1540 |
| 5 | 10 | 3 | 90 | 45.3 | 345 |
| 6 | 15 | 1.5 | 90 | 44.1 | 240 |
| 7 | 15 | 4.5 | 0 | 78.43 | 3426.7 |
| 8 | 10 | 1.5 | 45 | 62.6 | 439.7 |
| 9 | 15 | 4.5 | 90 | 47.9 | 658 |
| 10 | 15 | 3 | 45 | 59.1 | 1400.2 |
| 11 | 20 | 1.5 | 45 | 45.27 | 1079.7 |
| 12 | 20 | 3 | 90 | 50.5 | 1283.3 |
| 13 | 15 | 3 | 45 | 58.27 | 1403.3 |
| 14 | 20 | 3 | 0 | 63.5 | 2740 |
| 15 | 20 | 4.5 | 45 | 50.43 | 1680 |
Table 5.
ANOVA for flexural strength.
| Source | Sum of Squares | df | Mean Square | F-Value | p-Value Prob > F | Note |
|---|---|---|---|---|---|---|
| Model | 692.22 | 3 | 230.74 | 3.84 | 0.0419 | significant |
| A-Cryogenic Immersion | 1.03 | 1 | 1.03 | 0.017 | 0.8982 | |
| B-Fiber length | 12.23 | 1 | 12.23 | 0.20 | 0.6606 | |
| C-Fiber orientation | 678.96 | 1 | 678.96 | 11.30 | 0.0063 | significant |
| Residual | 660.66 | 11 | 60.06 | |||
| Pure Error | 0.26 | 2 | 0.13 | |||
| Mean | 53.75 | |||||
| R-Squared | 0.5117 | |||||
| Adj R-Squared | 0.3785 | |||||
| Pred R-Squared | −0.0427 | |||||
| Model Precision | 5.222 |
Table 6.
Proposed fiber length for maximizing flexural strength.
| Calculation Run | Factor Entry | Calculated Flexural Strength (MPa) | ||
|---|---|---|---|---|
| Fiber Immersion Time (min) | Fiber Length (mm) | Fiber Orientation (°) | ||
| 1 | 10 | 32 | 0 | 87 |
| 2 | 10 | 14.14 | 45 | 63 |
| 3 | 10 | 10 | 90 | 51 |
Table 7.
ANOVA for flexural modulus.
| Source | Sum of Squares | df | Mean Square | F-Value | p-Value Prob > F | Note |
|---|---|---|---|---|---|---|
| Model | 9.503 × 10⁶ | 3 | 3.168 × 10⁶ | 17.08 | 0.0002 | significant |
| A-Cryogenic Immersion | 1.226 × 10⁶ | 1 | 1.226 × 10⁶ | 6.61 | 0.0260 | significant |
| B-Fiber length | 1.062 × 10⁶ | 1 | 1.062 × 10⁶ | 5.73 | 0.0357 | significant |
| C-Fiber orientation | 7.214 × 10⁶ | 1 | 7.214 × 10⁶ | 38.90 | <0.0001 | significant |
| Residual | 2.040 × 10⁶ | 11 | 1.855 × 10⁵ | |||
| Pure Error | 39.85 | 2 | 19.92 | |||
| Mean | 1440.11 | |||||
| R-Squared | 0.8233 | |||||
| Adj R-Squared | 0.7750 | |||||
| Pred R-Squared | 0.6218 | |||||
| Model Precision | 12.060 |
Table 8.
Proposed fiber length for maximizing flexural modulus.
| Calculation Run | Factor Entry | Calculated Flexural Modulus (MPa) | ||
|---|---|---|---|---|
| Fiber Immersion Time (min) | Fiber Length (mm) | Fiber Orientation (°) | ||
| 1 | 10 | 32 | 0 | 9043 |
| 2 | 10 | 14.14 | 45 | 3755 |
| 3 | 10 | 10 | 90 | 1799.6 |
| 4 | 15 | 32 | 0 | 9435 |
| 5 | 15 | 14.14 | 45 | 4146.5 |
| 6 | 15 | 10 | 90 | 2191.1 |
| 7 | 20 | 32 | 0 | 9826.5 |
| 8 | 20 | 14.14 | 45 | 4537.9 |
| 9 | 20 | 10 | 90 | 2582.5 |
Table 9.
Response results of the confirmation experiment and the prediction model.
| Trial | Flexural Strength (MPa) | Flexural Modulus (MPa) | ||
|---|---|---|---|---|
| Confirmation | Predictive | Confirmation | Predictive | |
| 1 | 70.3 | 64 | 3200 | 3145.6 |
| 2 | 74 | 3580 | ||
| 3 | 64.3 | 3170 | ||
| Average | 69.5 | 3316 | ||
Publisher’s Note: MDPI stays neutral with regard to jurisdictional claims in published maps and institutional affiliations. |
© 2022 by the authors. Licensee MDPI, Basel, Switzerland. This article is an open access article distributed under the terms and conditions of the Creative Commons Attribution (CC BY) license (https://creativecommons.org/licenses/by/4.0/).
Share and Cite
MDPI and ACS Style
Nugroho, G.; Budiyantoro, C. Optimization of Fiber Factors on Flexural Properties for Carbon Fiber Reinforced Polypropylene. J. Compos. Sci. 2022, 6, 160. https://doi.org/10.3390/jcs6060160
AMA Style
Nugroho G, Budiyantoro C. Optimization of Fiber Factors on Flexural Properties for Carbon Fiber Reinforced Polypropylene. Journal of Composites Science. 2022; 6(6):160. https://doi.org/10.3390/jcs6060160
Chicago/Turabian StyleNugroho, Gesang, and Cahyo Budiyantoro. 2022. "Optimization of Fiber Factors on Flexural Properties for Carbon Fiber Reinforced Polypropylene" Journal of Composites Science 6, no. 6: 160. https://doi.org/10.3390/jcs6060160