The Magneto-Mechanical Behavior of Active Components in Iron-Elastomer Composite


1
Institute of Physics of Czech Academy of Science, Na Slovance 1999/2, 182 21 Prague 8, Czech Republic
2
Institute for Nano Materials, Technical University of Liberec, Studentská 1402/2, 461 17 Liberec 1, Czech Republic
3
Department of Civil Engineering and Architecture and UdR-Catania Consorzio INSTM, University of Catania, Viale Andrea Doria 6, 95125 Catania, Italy
*
Author to whom correspondence should be addressed.
J. Compos. Sci. 2018, 2(3), 54; https://doi.org/10.3390/jcs2030054
Submission received: 29 July 2018
/
Revised: 24 August 2018
/
Accepted: 3 September 2018
/
Published: 6 September 2018
Abstract
:The magneto-rheological effects in iron-elastomer composites (IEC) were investigated by simulation, surface topography, and 3D representation. The simulated behavior of magneto-rheological elastomeric composites in the presence of an external magnetic field was determined and the influence of magnetic intensity on the isotropic distribution of iron filler particles in IECs was investigated. The magnetic intensity distribution was analyzed from the edge of the surface towards the center of the IEC. The samples were characterized for microstructural images after experimental tests using both micro-computed tomography (µCT) and scanning electron microscopy (SEM). The adhesion of filler particles within the matrix of the magneto-rheological elastomer (MRE) composite and their distributions were also investigated. µCT showed the overall 3D representation of IEC and the inner distribution of filler particles revealed the presence of some porosity which may be due to bubbles and voids in the matrix of the composite. Finally, a mechanism was established governing particle–particle interactions on the basis of dipole–dipole interactions.
1. Introduction
Recently increasing focus has been directed on magneto-rheological elastomer (MRE) composites with magneto-active particles embedded inside the matrix of polymer. MREs are the emerging alternative for magneto rheological (MR) fluids which suffer from some drawbacks such as particles settling down and loss of the MR effect [1,2]. The MREs are analogous materials to MR fluids with the carrier fluid replaced by the polymer matrix and the embedded ferromagnetic particles as filler. The isotropic distribution of filler particles in the MREs plays a crucial role in increasing the elastic modulus under an external magnetic field. Due to their property variability, these materials are considered as smart materials. Until now the maximum modulus increase for the MRE has been reported to be up to 0.6 MPa (40% of initial modulus) with iron filler concentration of 30 vol % [3,4]. The MRE materials can be used in various applications such as adaptive and tuned vibration absorbers, stiffness tunable mounts, as well as semi-active and active mounts in vehicles [5]. Due to the damping property, these materials are also used in many industrial applications as dampers and isolators [6].
However, the conventional fabrication of the MRE under the influence of magnetic field has faced many limitations in the industrial application. The anisotropic distribution of the particles as a chain shape must be considered under the application of an external magnetic field rather than prior to use of the material. According to many researchers [6,7], the anisotropic distribution in MRE samples showed a much larger MR effect than that of isotropic ones. The isotropic distribution of iron particles showed a low MR effect at the initial stage, therefore MRE isotropic distribution could represent a new area for this research. The dynamic properties of isotropic MREs depend on the matrix, the particles content, and the external magnetic field. The microstructural characterization of the filler, within the surface of the matrix, and the influence of filler shape have shown improvement in the mechanical properties of the resultant composite [8]. A simulation analysis was carried out before performing the experiment and the influence of magnetic field towards the MRE sample at various positions from bottom to top level was studied. The MRE samples after testing, in the presence of a magnetic field, were analyzed for microstructure and filler orientation. Micro-computed tomography (µCT) was implemented to examine an overall 3D representation of filler particles distribution in the MRE composite. The filler orientation within the MRE composite with self-assembly particles which may lead to dipole interactions was observed by using scanning electron microscopy (SEM). A correlation was established between the observations of simulation properties, µCT, and SEM images of the MRE samples, and their magnetic interaction arises from self-assembly filler particles [9,10].
In our previous study [11,12] we focused on the fabrication of isotropic distribution of the MRE samples without any influence of external magnetic field. The mechanical properties and microstructure of the MRE samples were briefly discussed with isotropic distribution [13]. In the present work we investigated the iron filler distribution and the adhesion throughout the matrix of the magneto rheological elastomeric composite. With the aim to describe the behavior of the magnet active component the configuration of the sample was studied without and with mesh condition, and the filler-matrix interaction, adhesion, surface feature analysis, orientation of distribution of the particles were analyzed. The composites were analyzed by scanning electron microscopy (SEM) for the distribution and orientation of the filler within the material. The influence of magnets creates porosity very widely throughout the composite, however fabrication of the MRE composite with magnets results in anisotropic distribution of filler within the matrix.
2. Experimental
Iron particles (Havel Composites CZ s.r.o., Olomoucky Kraj, Czech Republic) of 50–100 µm (purity > 95%) were incorporated into silicon elastomer and two different composition of matrix, ZA 22 (polyaddition product, Figure S2) and N 1522 (polycondensation product, Figure S3) from Lučební závody, Kolín, Czech Republic were taken into consideration. The composites were prepared using 30 vol % filler particles with and without magnetic field influence on the fabrication methods. In optical microscope images of Figure 1 it is possible to observe that the MRE samples, fabricated by N 1522 matrix in the presence of a magnetic field, show an anisotropic structure. The silicon oil was used to improve the adhesive properties of the particles on the matrix surface. All the components such as filler with silicon oil, matrix, binder, and catalyst were stirred slowly until homogenization for 30 min at room temperature. Then, for the final fabrication of the sample, the mixture was put under vacuum, to remove air bubbles, and then cured for 24 h in the standard mold without any influence of magnetic field. The samples were designed cylindrically with length of 20 mm and radius of 5 mm. The induced magnetic field was applied perpendicularly to the sample thickness (Figure S1). The magnetic intensity and the sample orientation in the magnetic field were set up. The MRE sample was put in contact, by its upper and lower surface, with copper slabs in the circuit of the magnetic field as described elsewhere [14]. Simulation was carried out by the means of MSC MARC, non-linear dynamics Software (Newport Beach, CA, USA) and characterization of the MRE composites after testing was carried out using SEM and µCT analyses. The simulation parameter was carried out at boundary conditions of the magnetic potential and current of 1 A. The surface morphology of the samples was examined by SEM (Hitachi-model TM-3000, Hitachi High-Technologies Corporation, Tokyo, Japan), with a Secondary Electron Detector (Hitachi High-Technologies Corporation, Tokyo, Japan) and field emission source using 10 kV acceleration voltages. Sample fragments were mounted onto aluminum stubs and out-gassed in a desiccator over 48 h before being coated with a 4 nm layer of platinum prior to imaging in the SEM.
The µCT (Bruker, R.M.I. s.r.o., Lázně Bohdaneč, Czech Republic) analysis was carried out on an open tube source with Tungsten, power of 10 kW, voltage source of 100 kV, and current of 100 µA. The number of projections was 2849 with total test duration of 4 h. X-ray spot target was 16 µm with rotation of 360° and camera resolution of 1632 × 1092. µCT analysis was carried out in a model: sky scan with reconstructed images in 3D ways from slices of the two dimensional structure.
3. Results
3.1. Simulation Behavior of the Magnet and MRE Samples
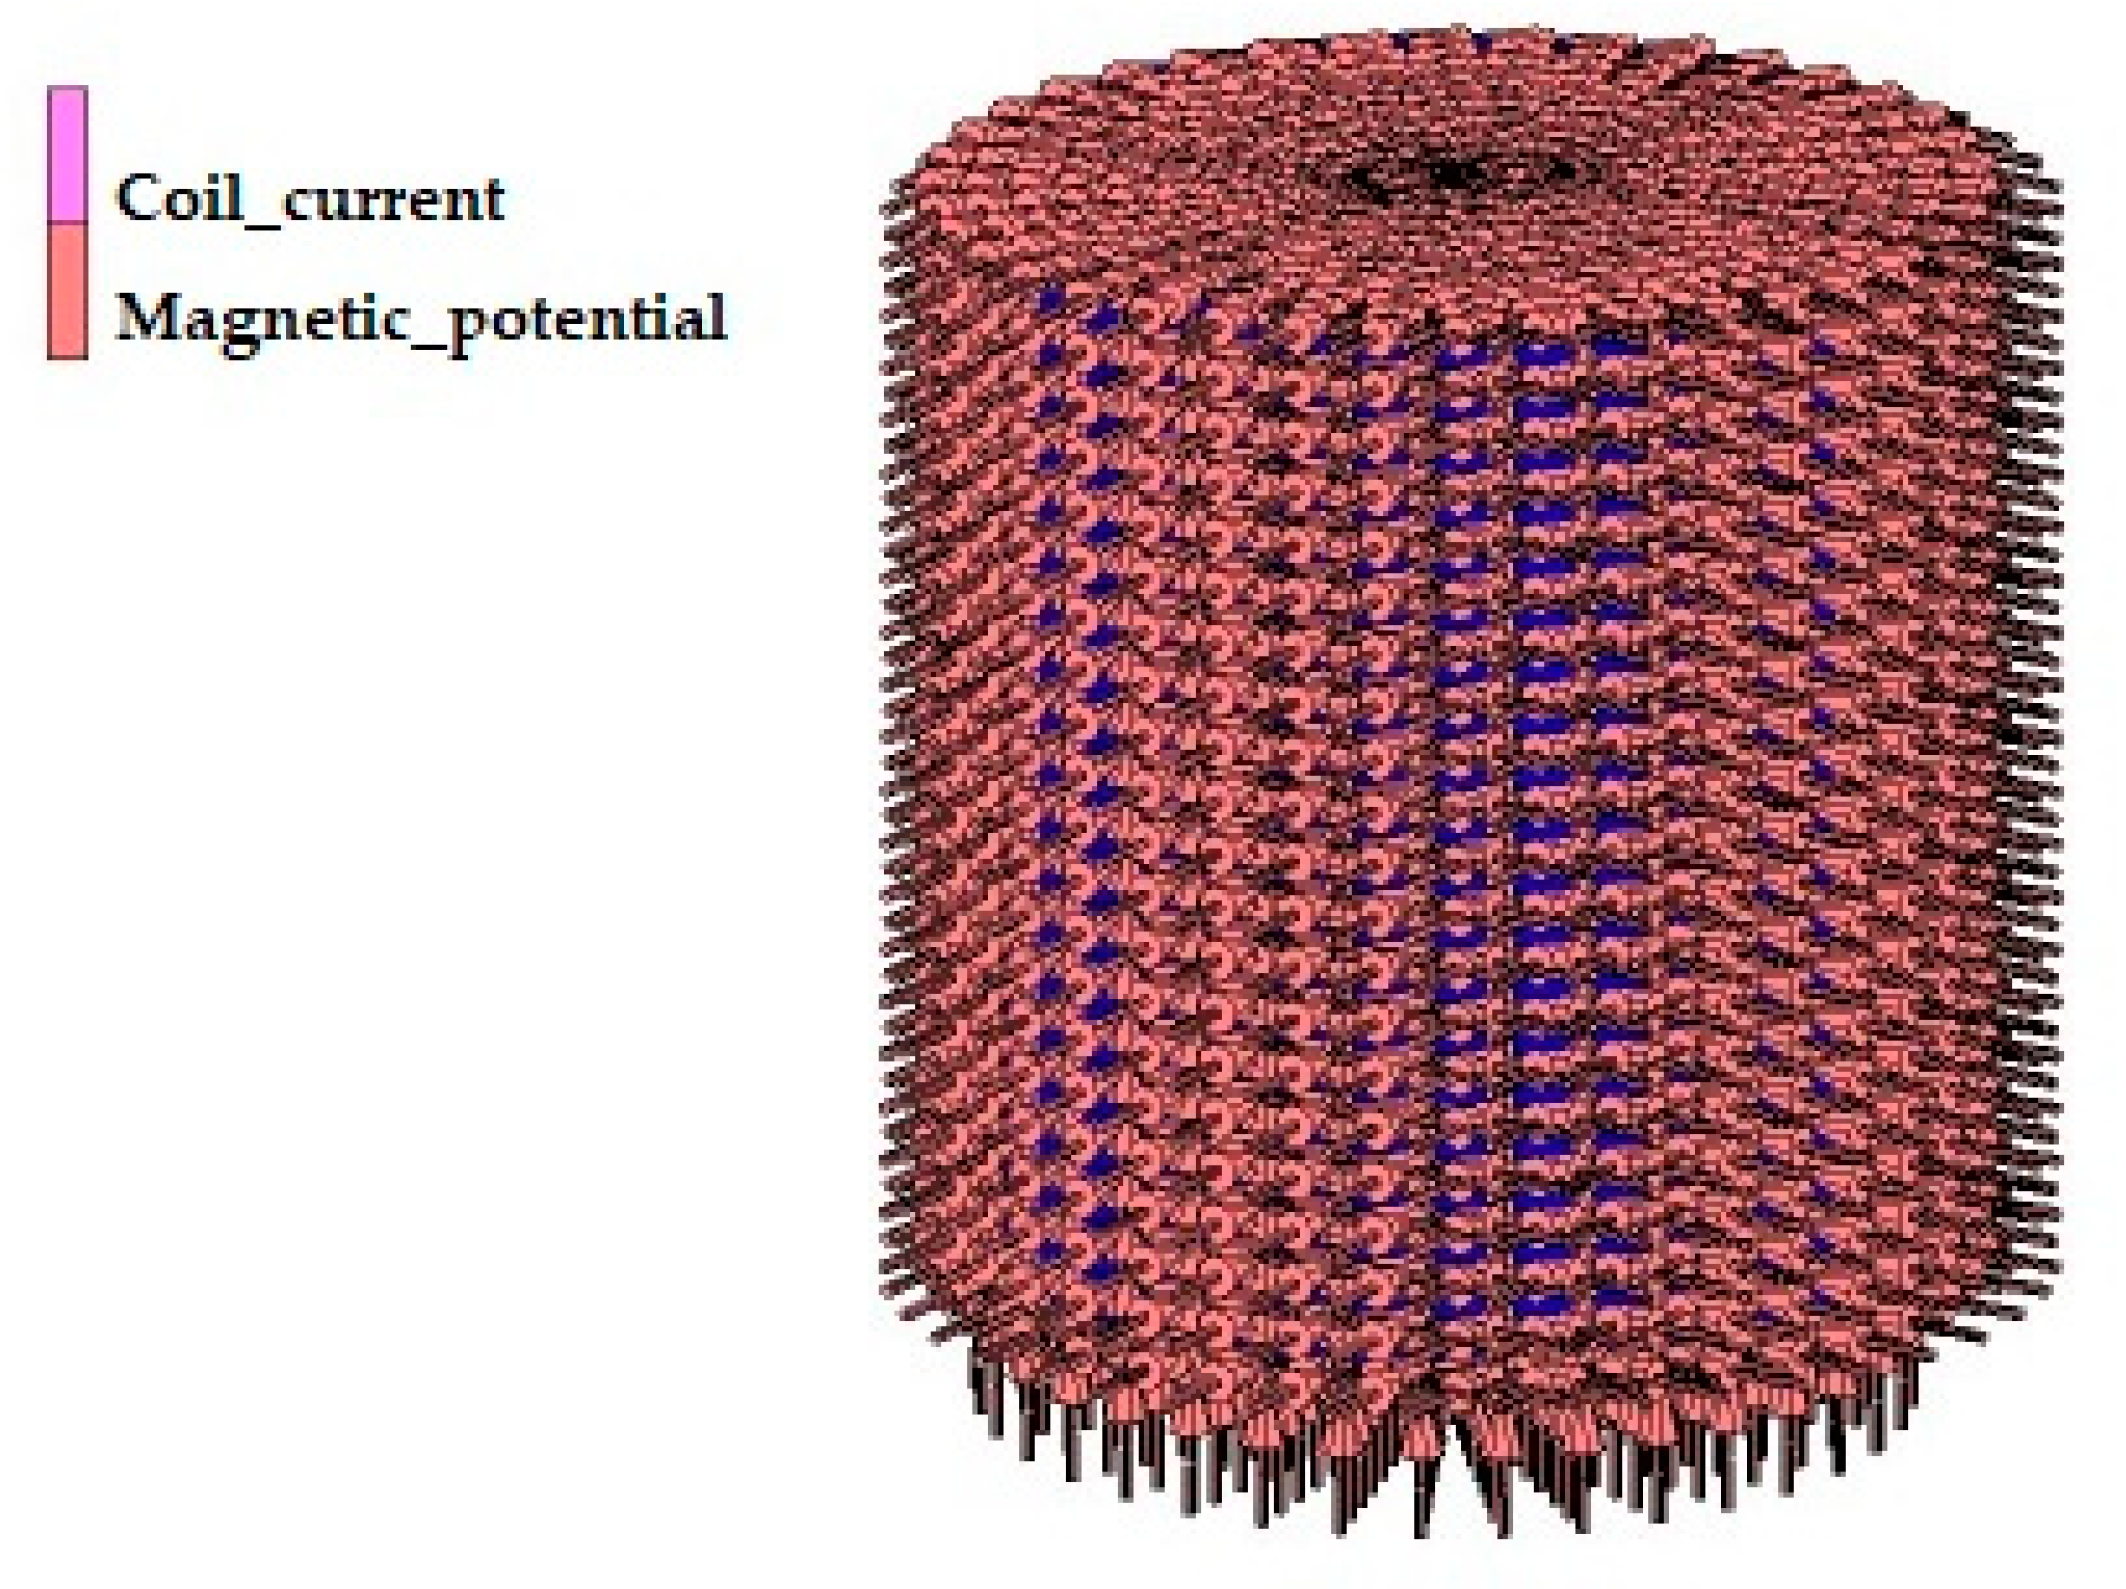
In Figure 2, the external region of the cylindrical magnet is presented by coil current location and its respective magnetic potential. Here it represents the outer magnetic potential as element or entity and coil current that develops in the magnet.
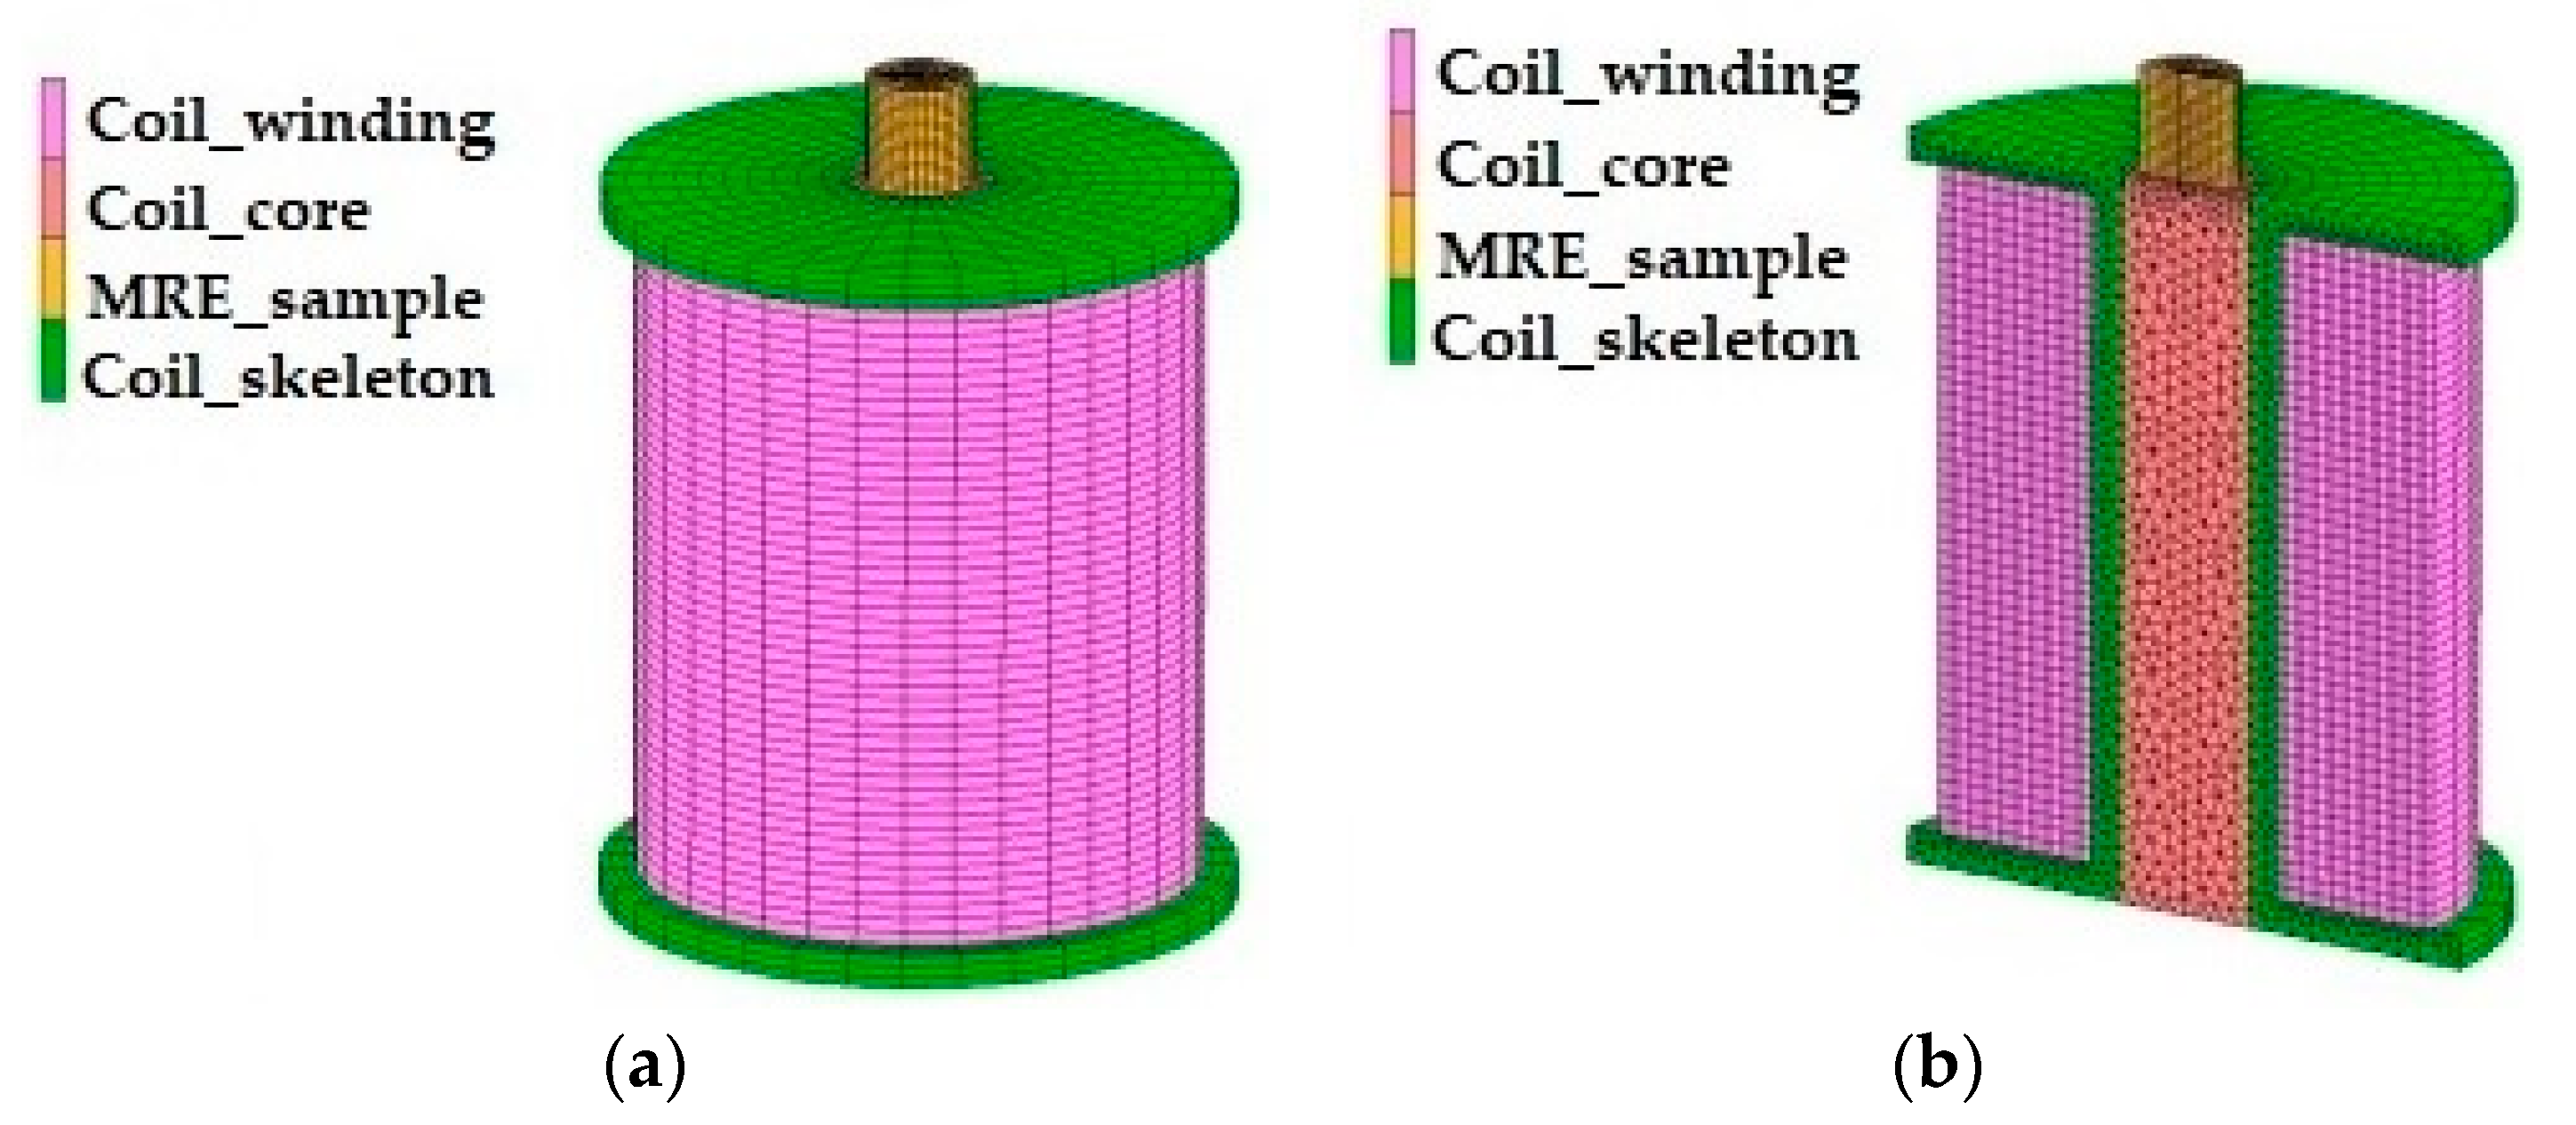
Figure 3a portrays the magnet and the MRE sample at the top position on considering other factors such as coil winding, coil coren and coil skeleton, whilst in Figure 3b the schematic diagram in the mesh position is reported.
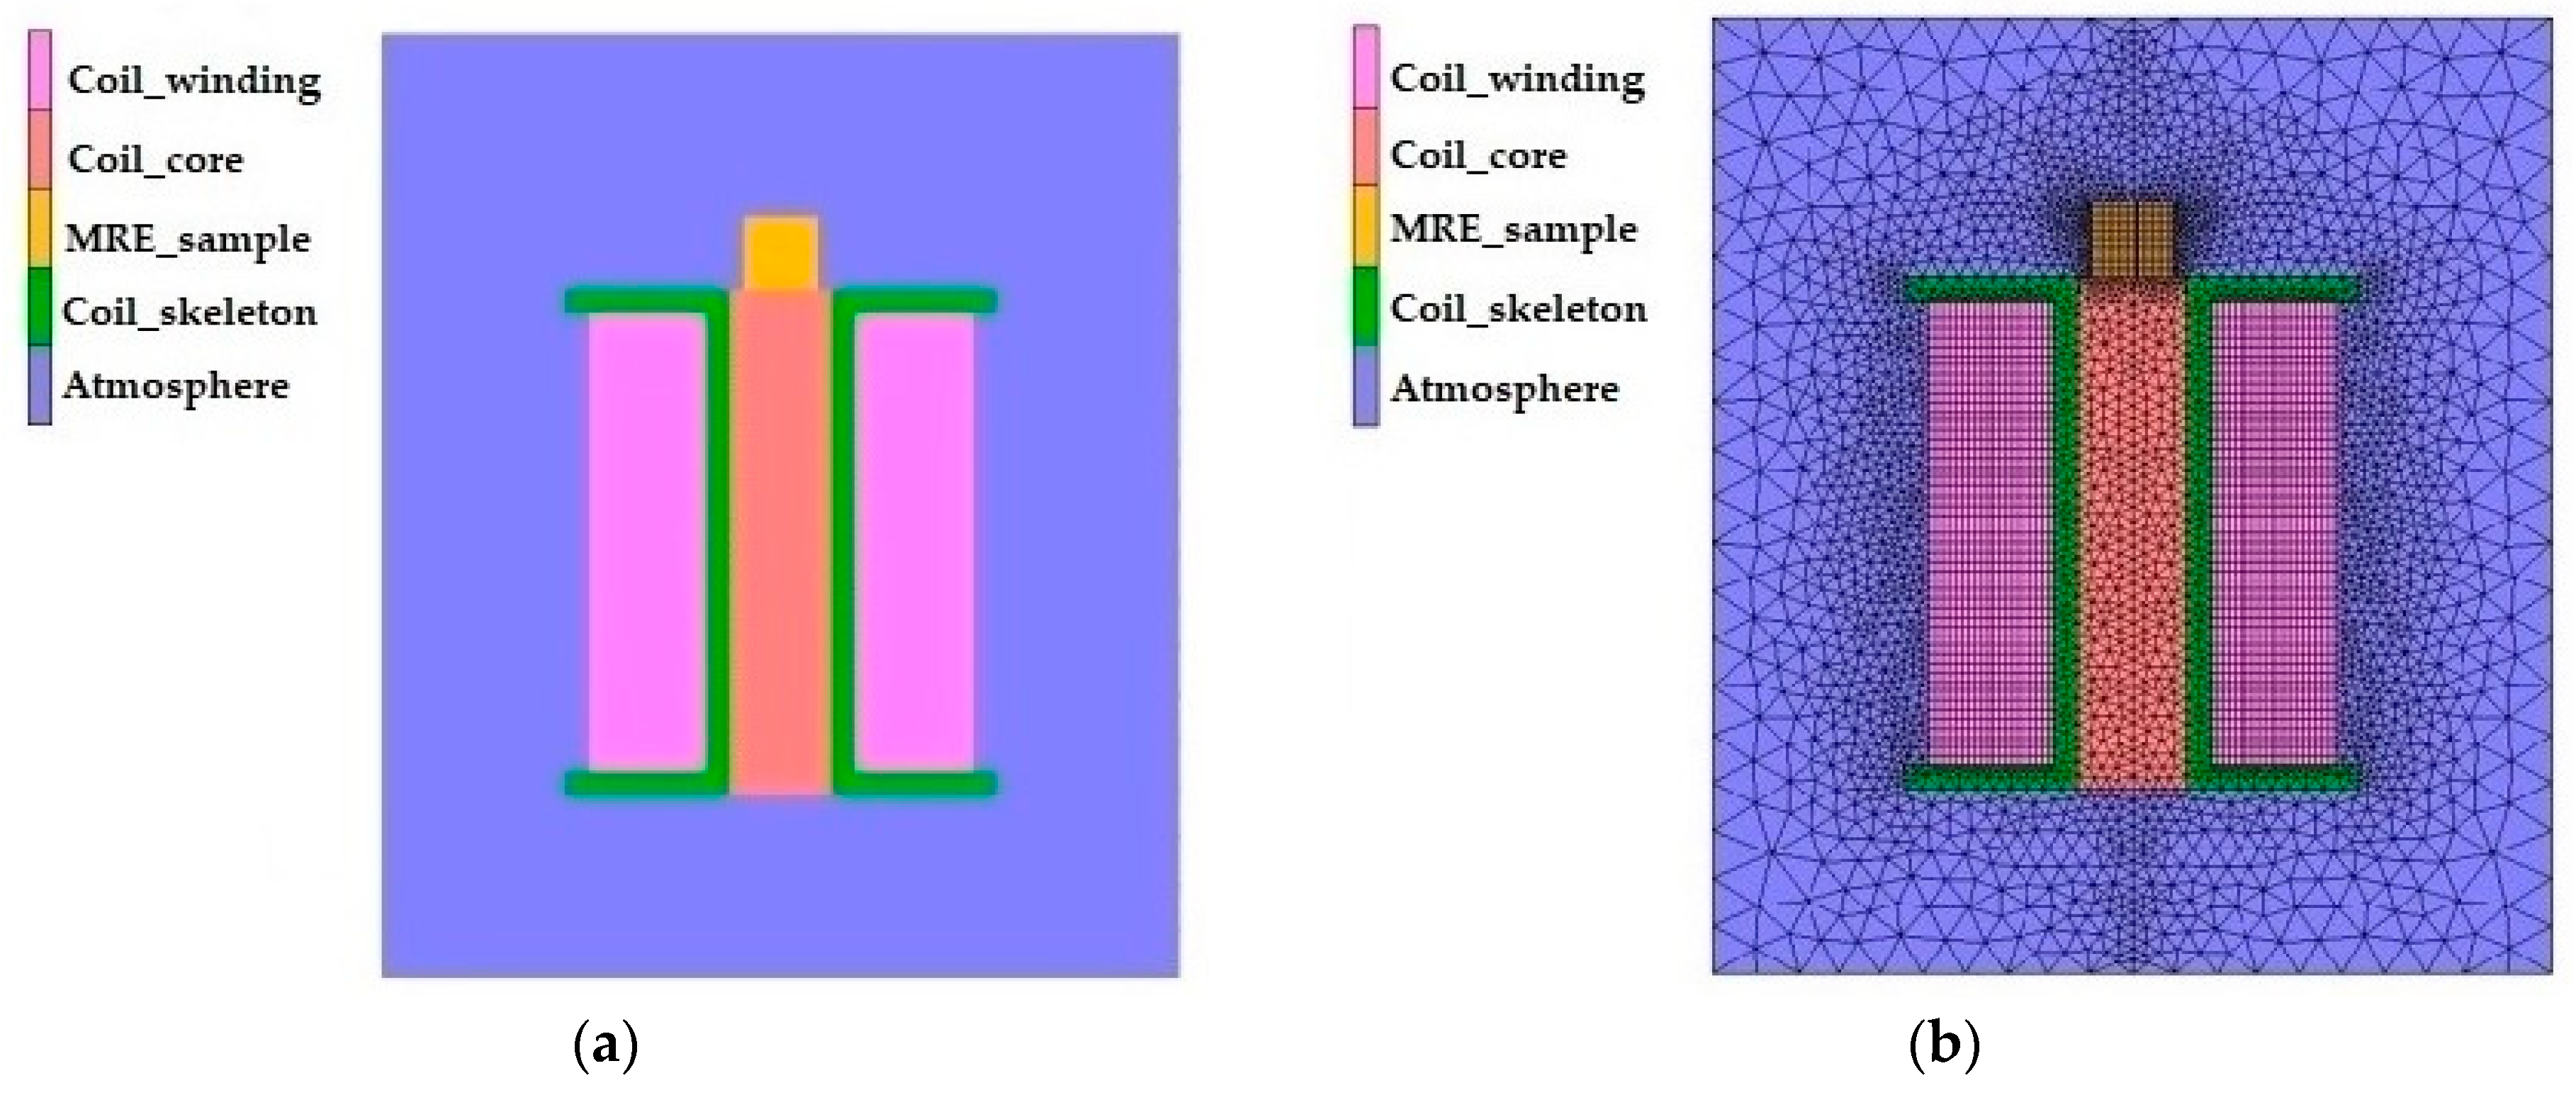
Figure 4a displays the schematic presentation of the MRE sample position on the lower part of the magnetic domain. The position of the sample with cross sectional view is displayed on considering the mesh size of the magnet and the surrounding atmosphere is sketched in Figure 4b.
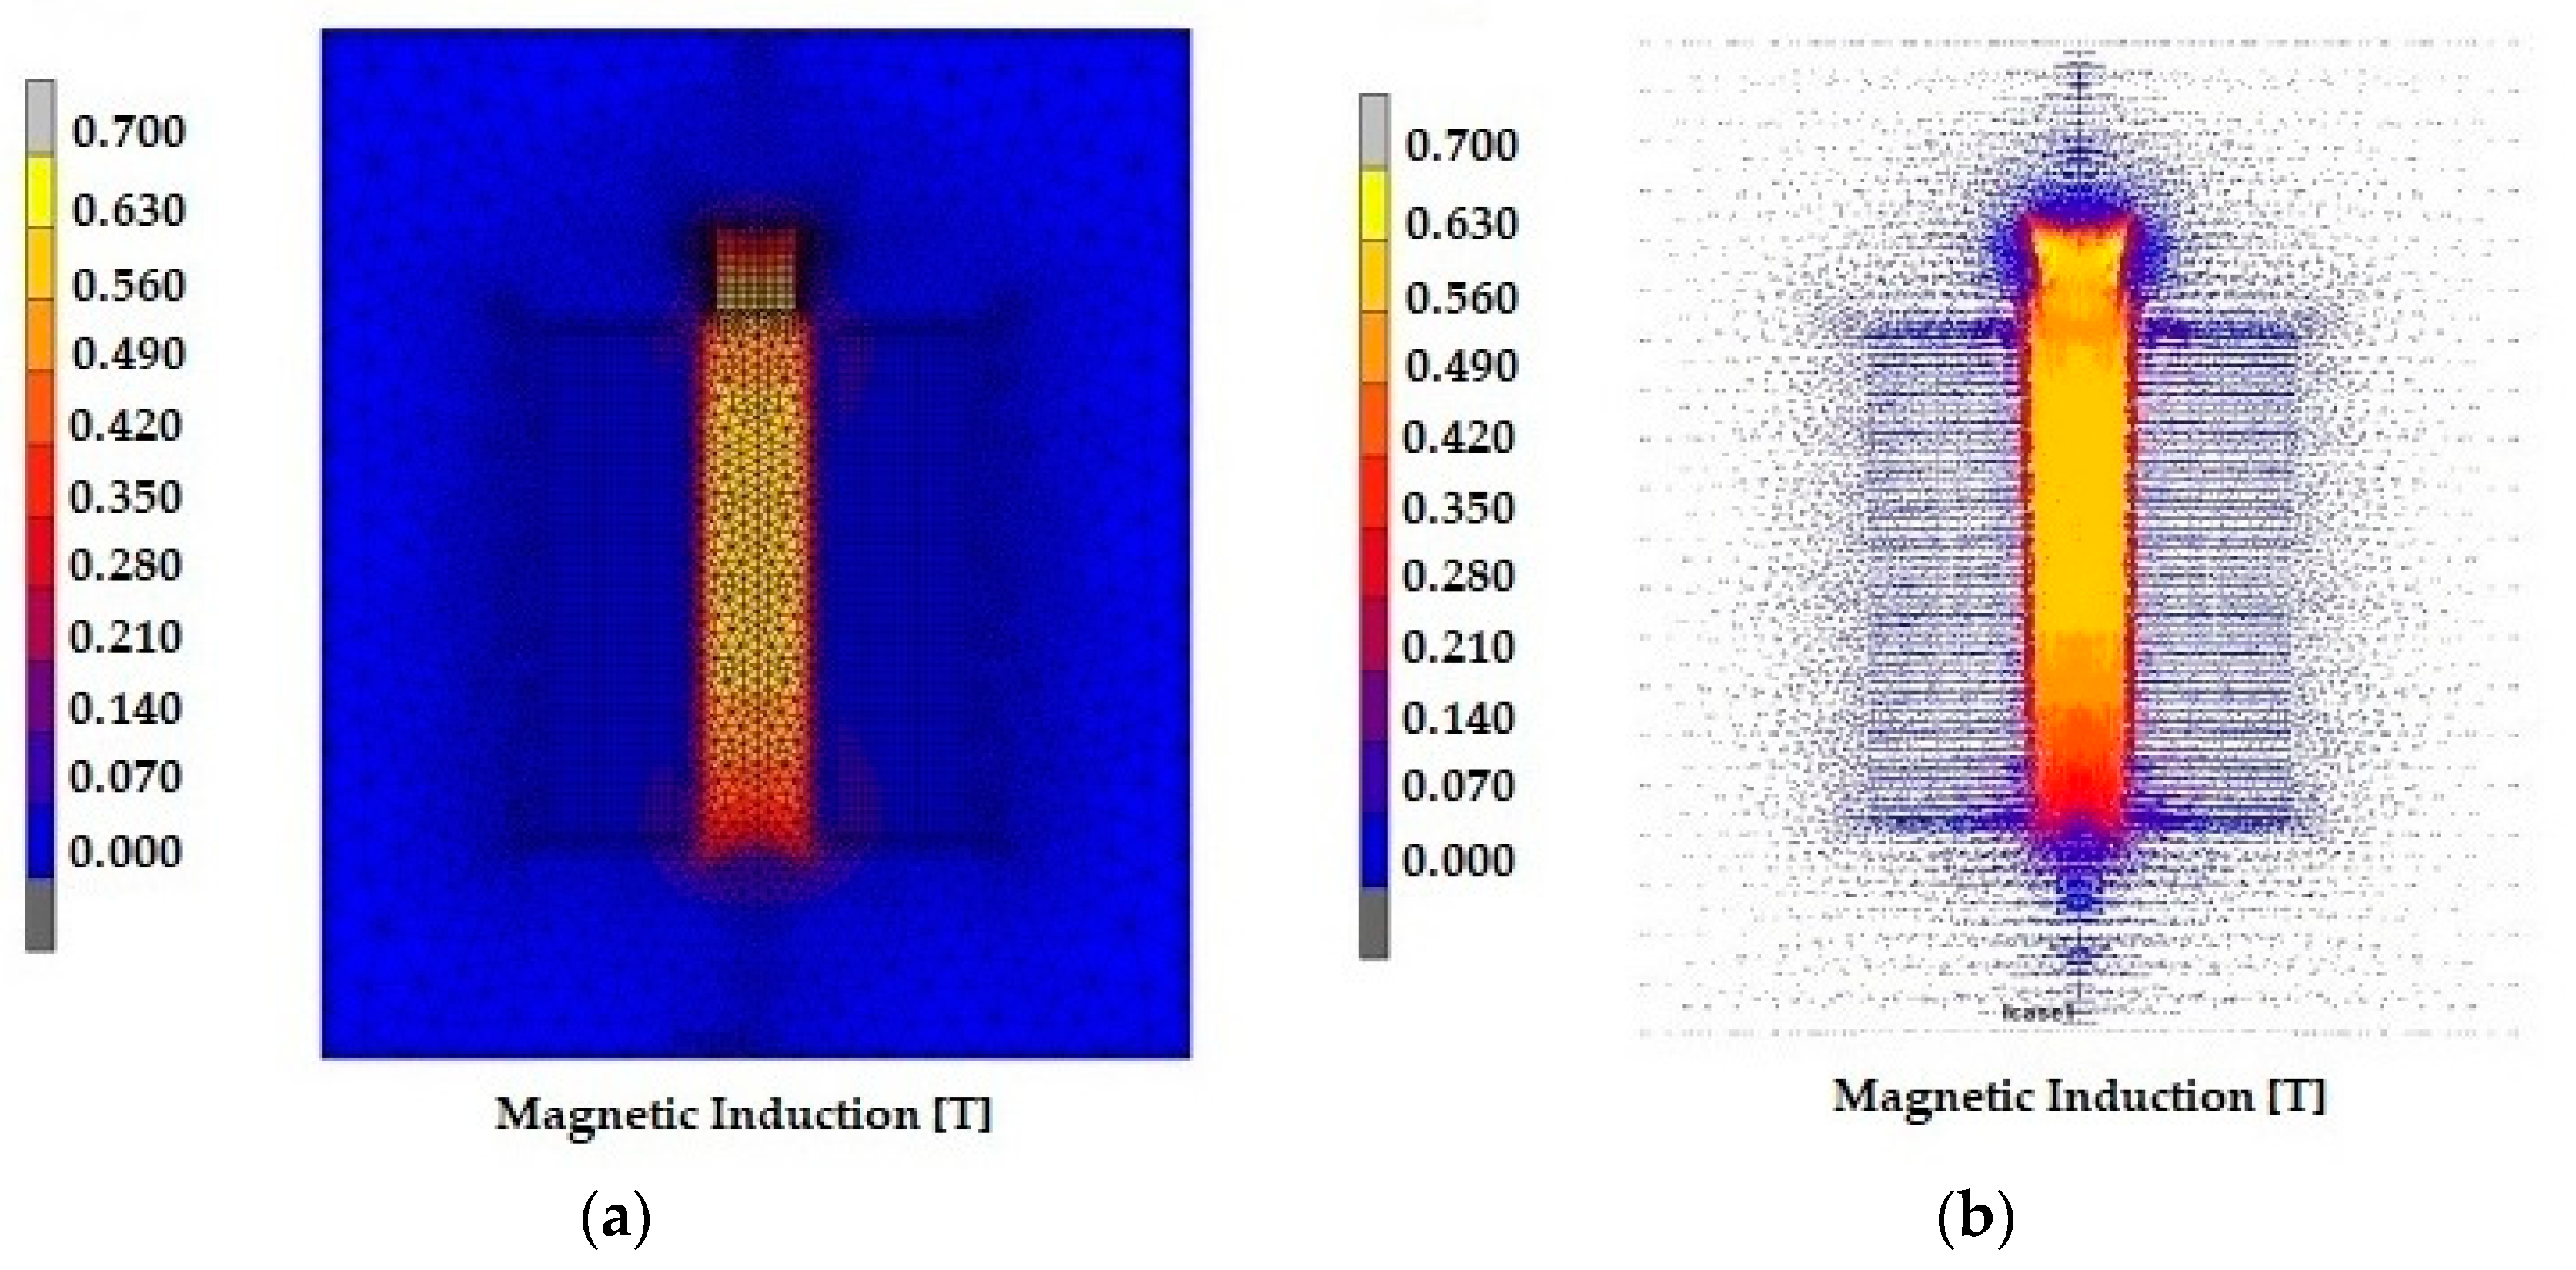
Figure 5a displays the distribution of magnetic induction within the magnet and the MRE sample in the presence of atmospheric effect. Simultaneously the distribution of magnetic induction (Tesla) in the presence of magnetic field is calculated considering the force lines within the magnet, which is presented in Figure 5b.
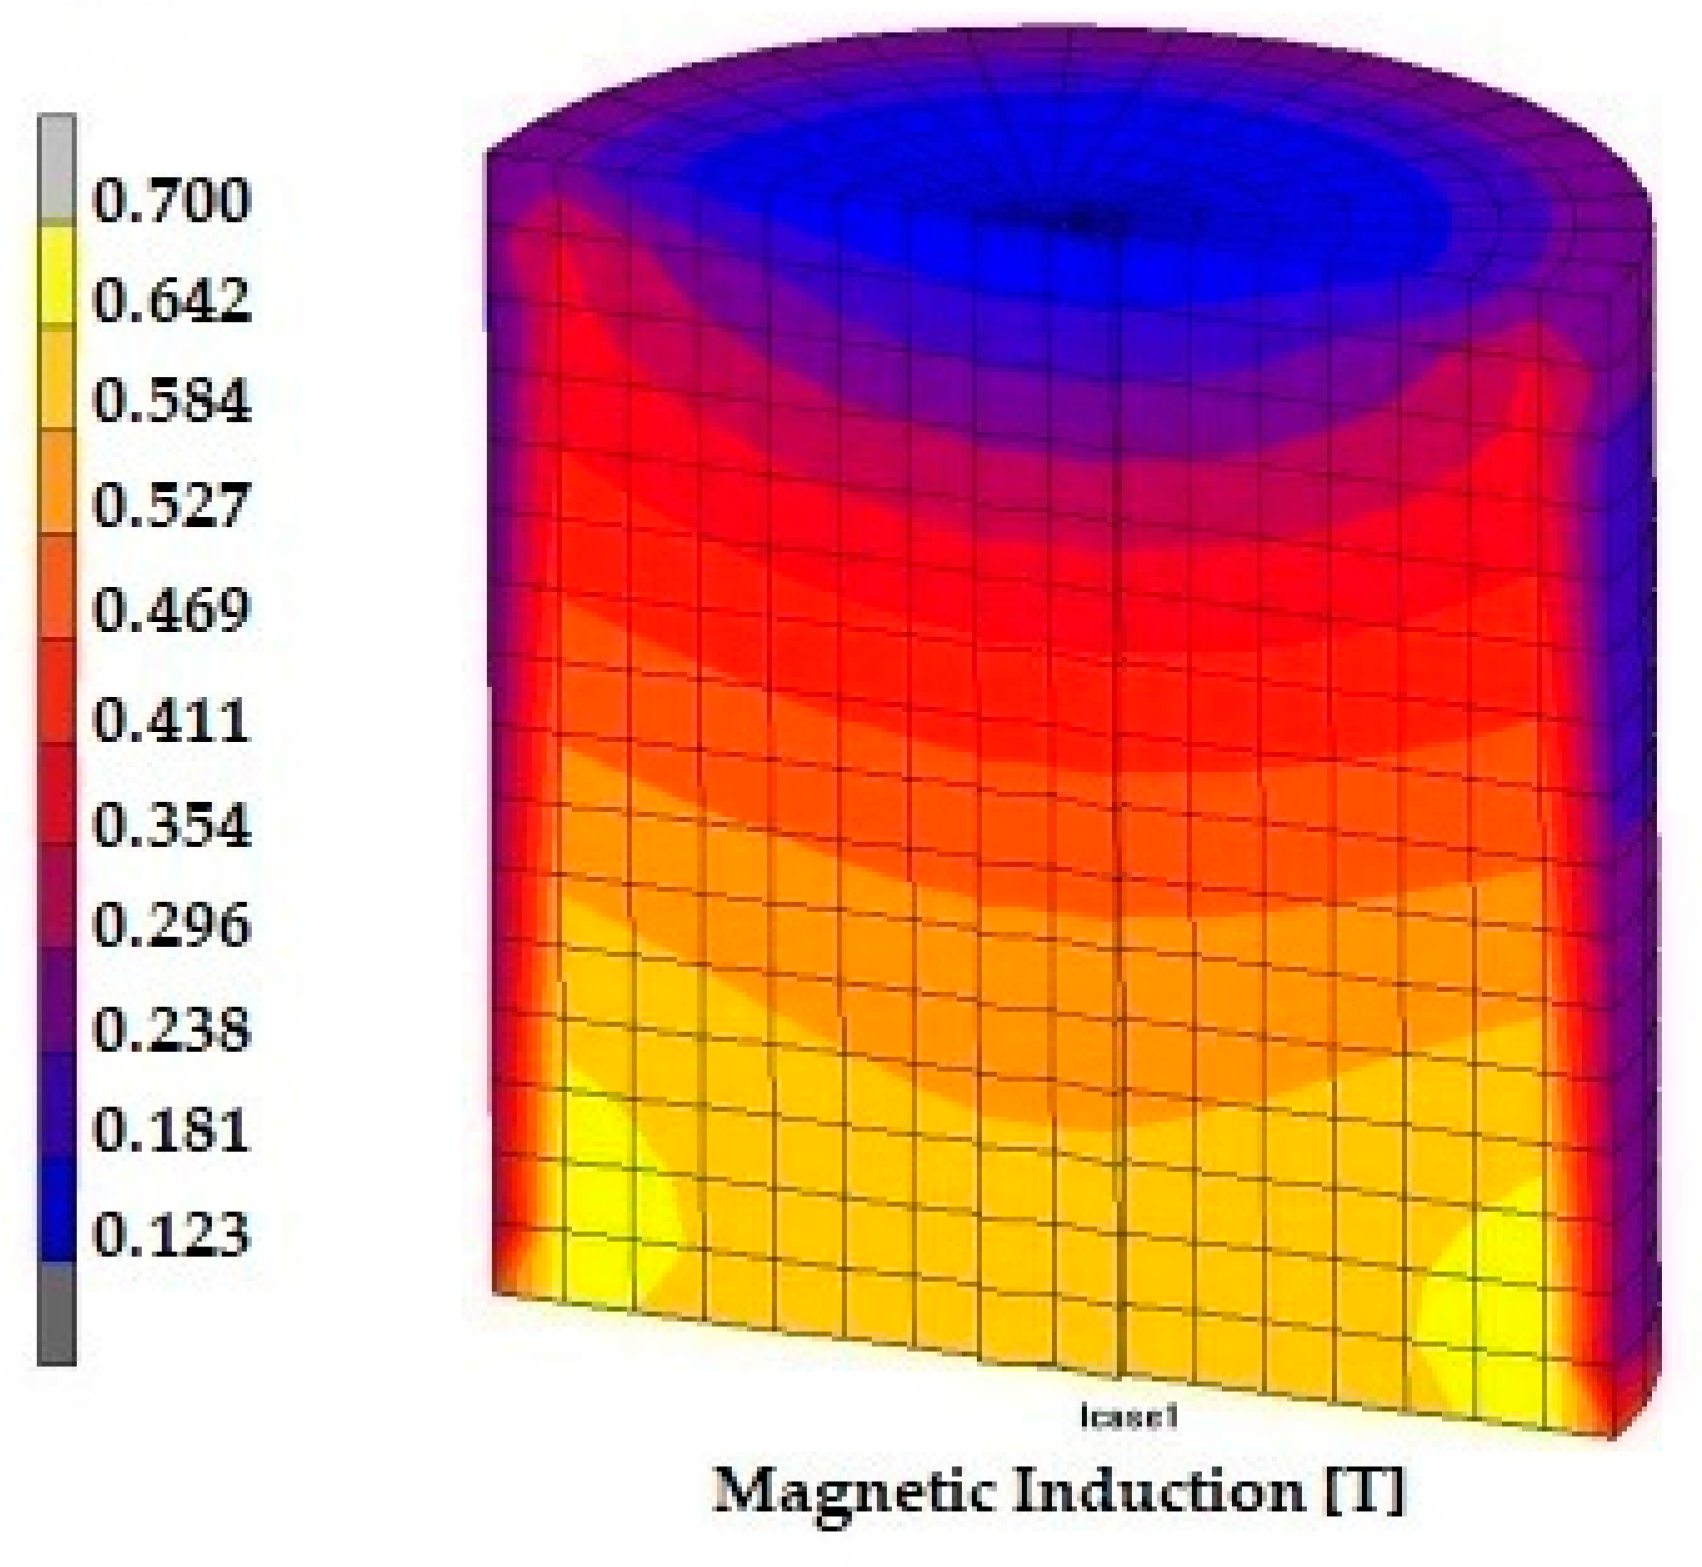
It was observed that the magnetic induction reached a range of the interval 0.7–0.3 Tesla. The distribution of the values of magnetic induction was studied at various positions in the MRE sample. The magnetic induction distribution is shown on the upper part of the magnet including the MRE on position. The calculation showed that the average value of magnetic induction reached 0.3 Tesla on considering the maximum and minimum ranges from the bottom to the top level (Figure 6a). The magnetic induction lines of the MRE sample force are also shown in Figure 6b, with the maximum and minimum values, from the base to the top level, which presented an average value of 0.3 Tesla. The magnetic induction of the magnet and the position of the MRE on the sample were distributed throughout the system.
The influence of magnetic induction at various positions from the bottom to the top is plotted in the MRE on consideration of the boundary region with mesh size and stiffness boundary, as the composite was affected by an elastomeric effect (Figure 7a,b).
Simultaneously the magnetic induction was observed on the cross-section length of the magnetic bar as a function of the arc length (Figure 8). The deduction shows the lower position (blue line) has a maximum strength of magnetic induction of 0.7 Tesla, however the top position shows (black lines) the minimum value of magnetic induction. This may arise due to the contact area of the MRE sample with the magnetic domain. The value of the magnetic induction was derived from the magnetic coil towards the MRE sample and is reported in Figure 9, where the magnetic induction is plotted as a function of the distance in combination with the magnet and the sample position. It was observed that the magnetic induction is maximum for the MRE sample at the contact position and then becomes lower towards the top position. This representation shows the maximum strength to minimum position of magnetic induction as a function of displacement. The overall statistics of the analysis is 2% of the results.
3.2. Microstructural Observation of MRE Composite
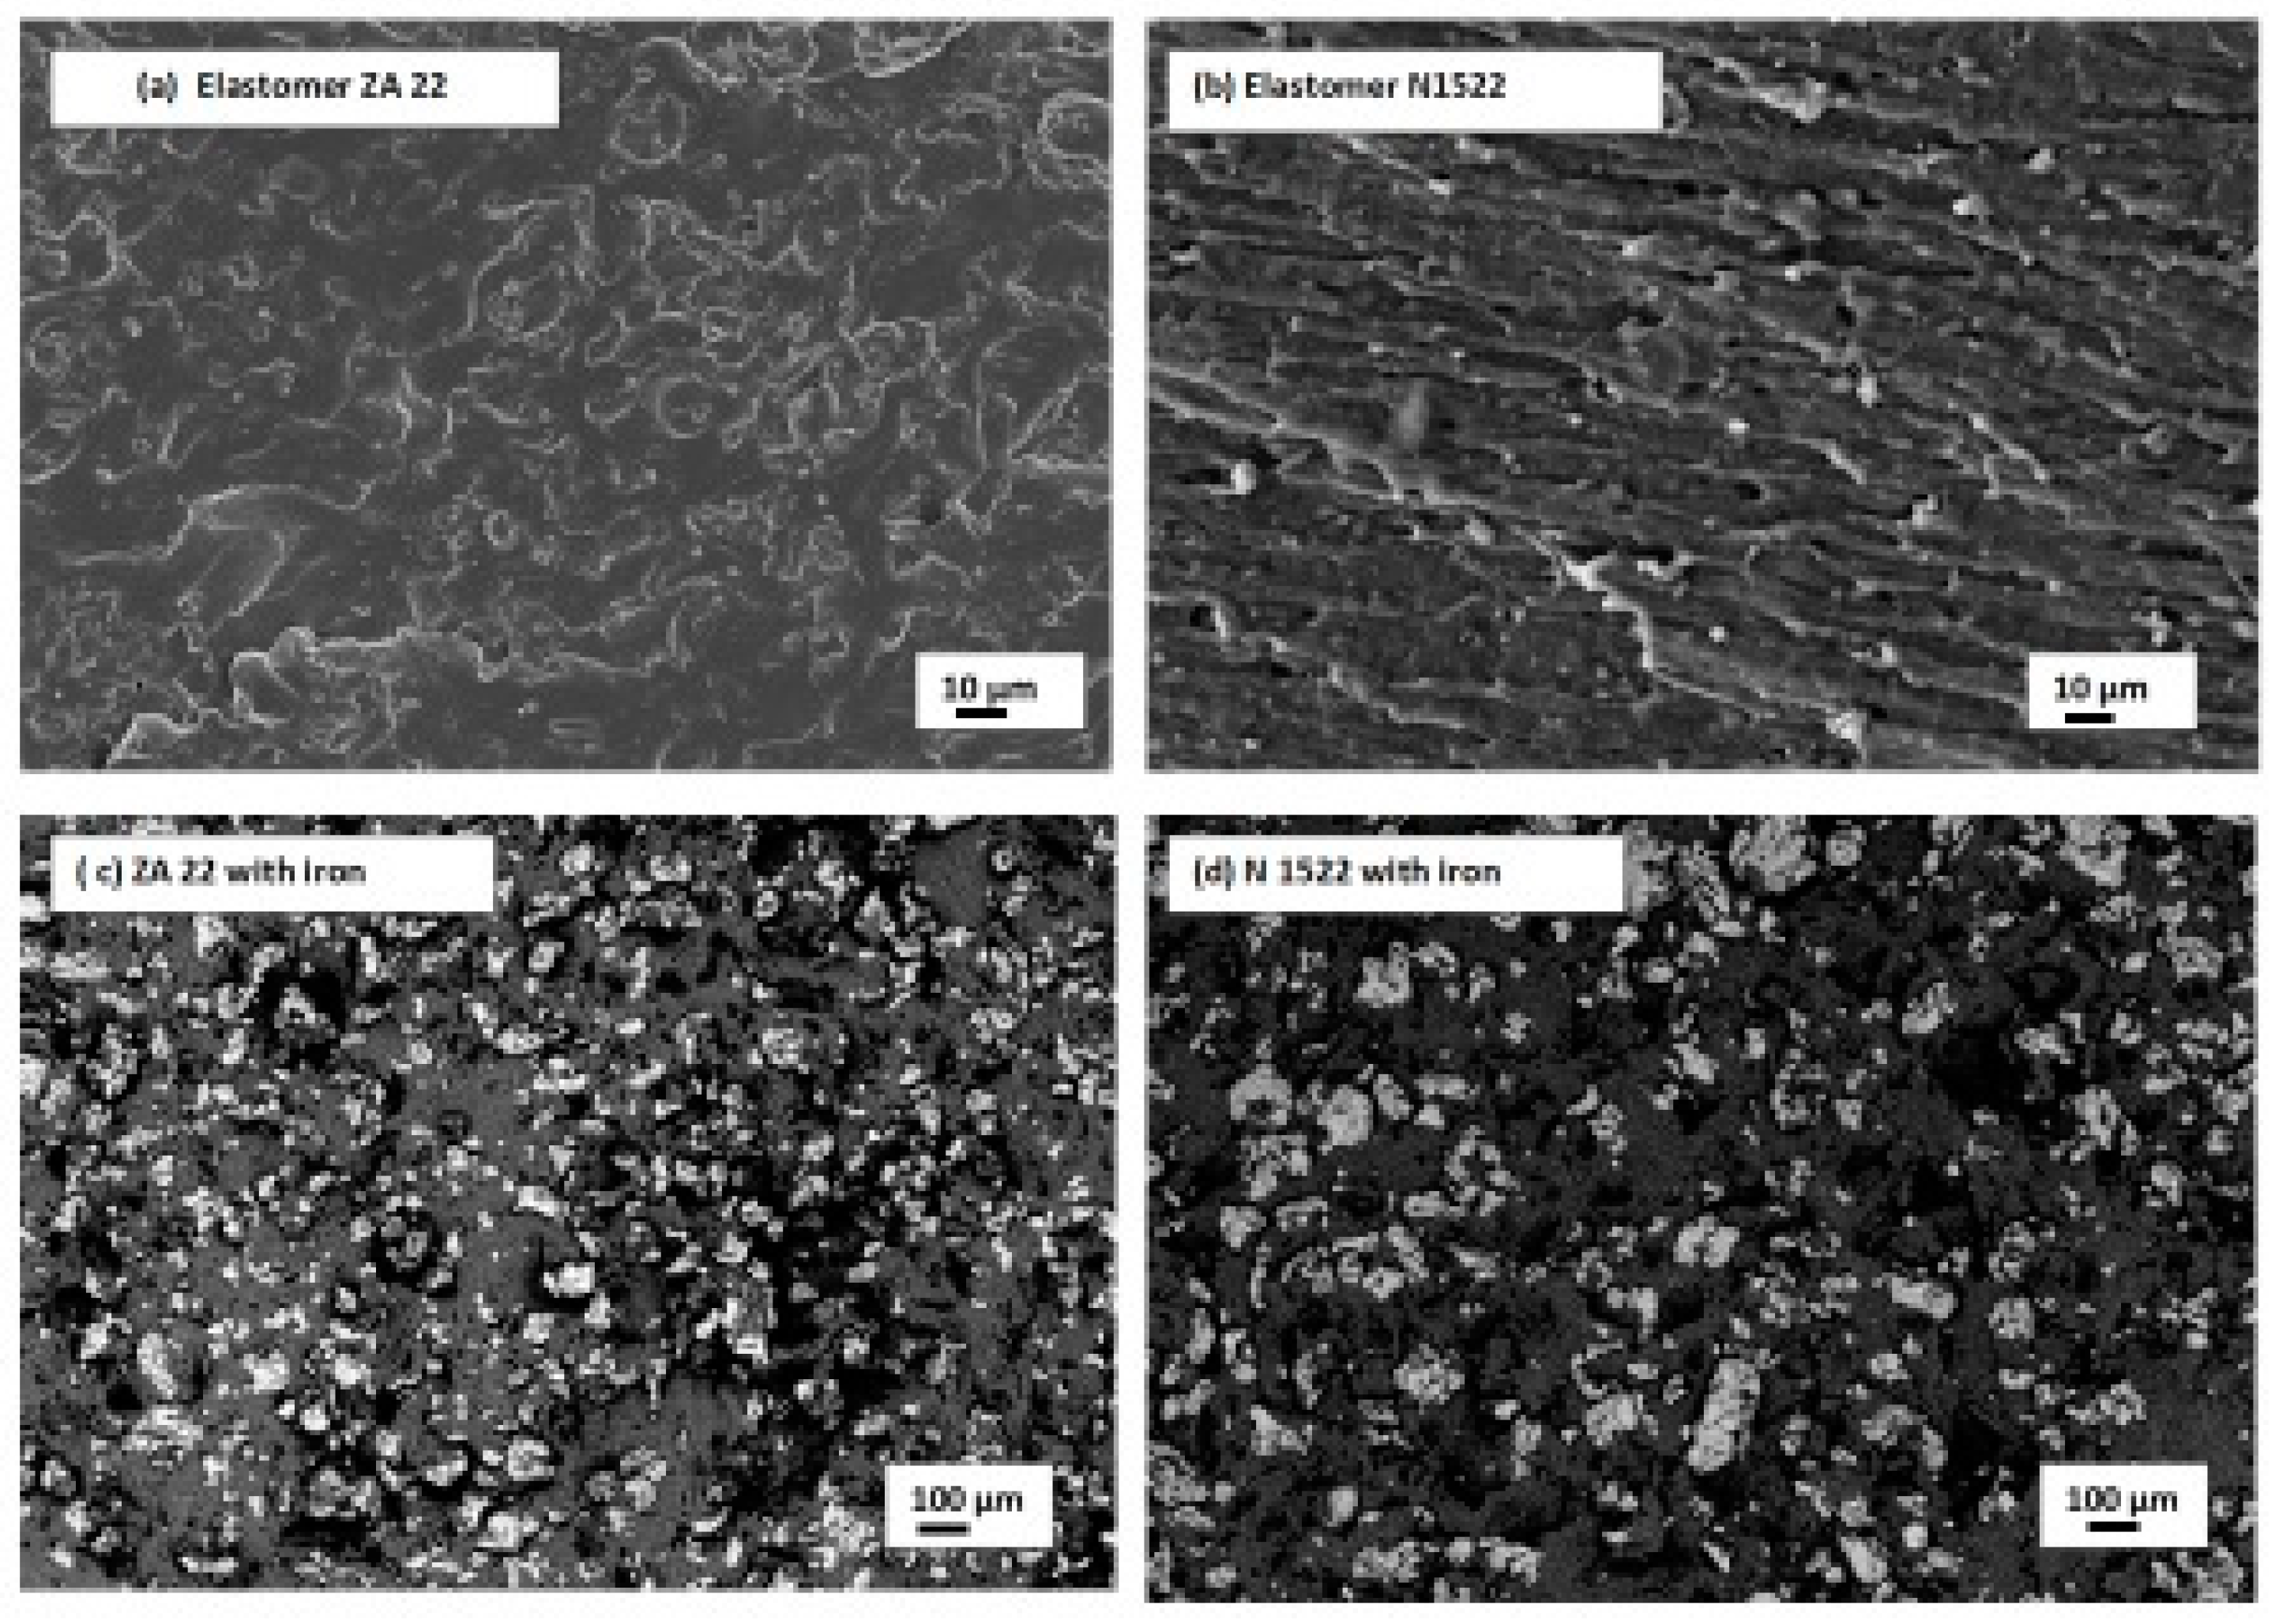
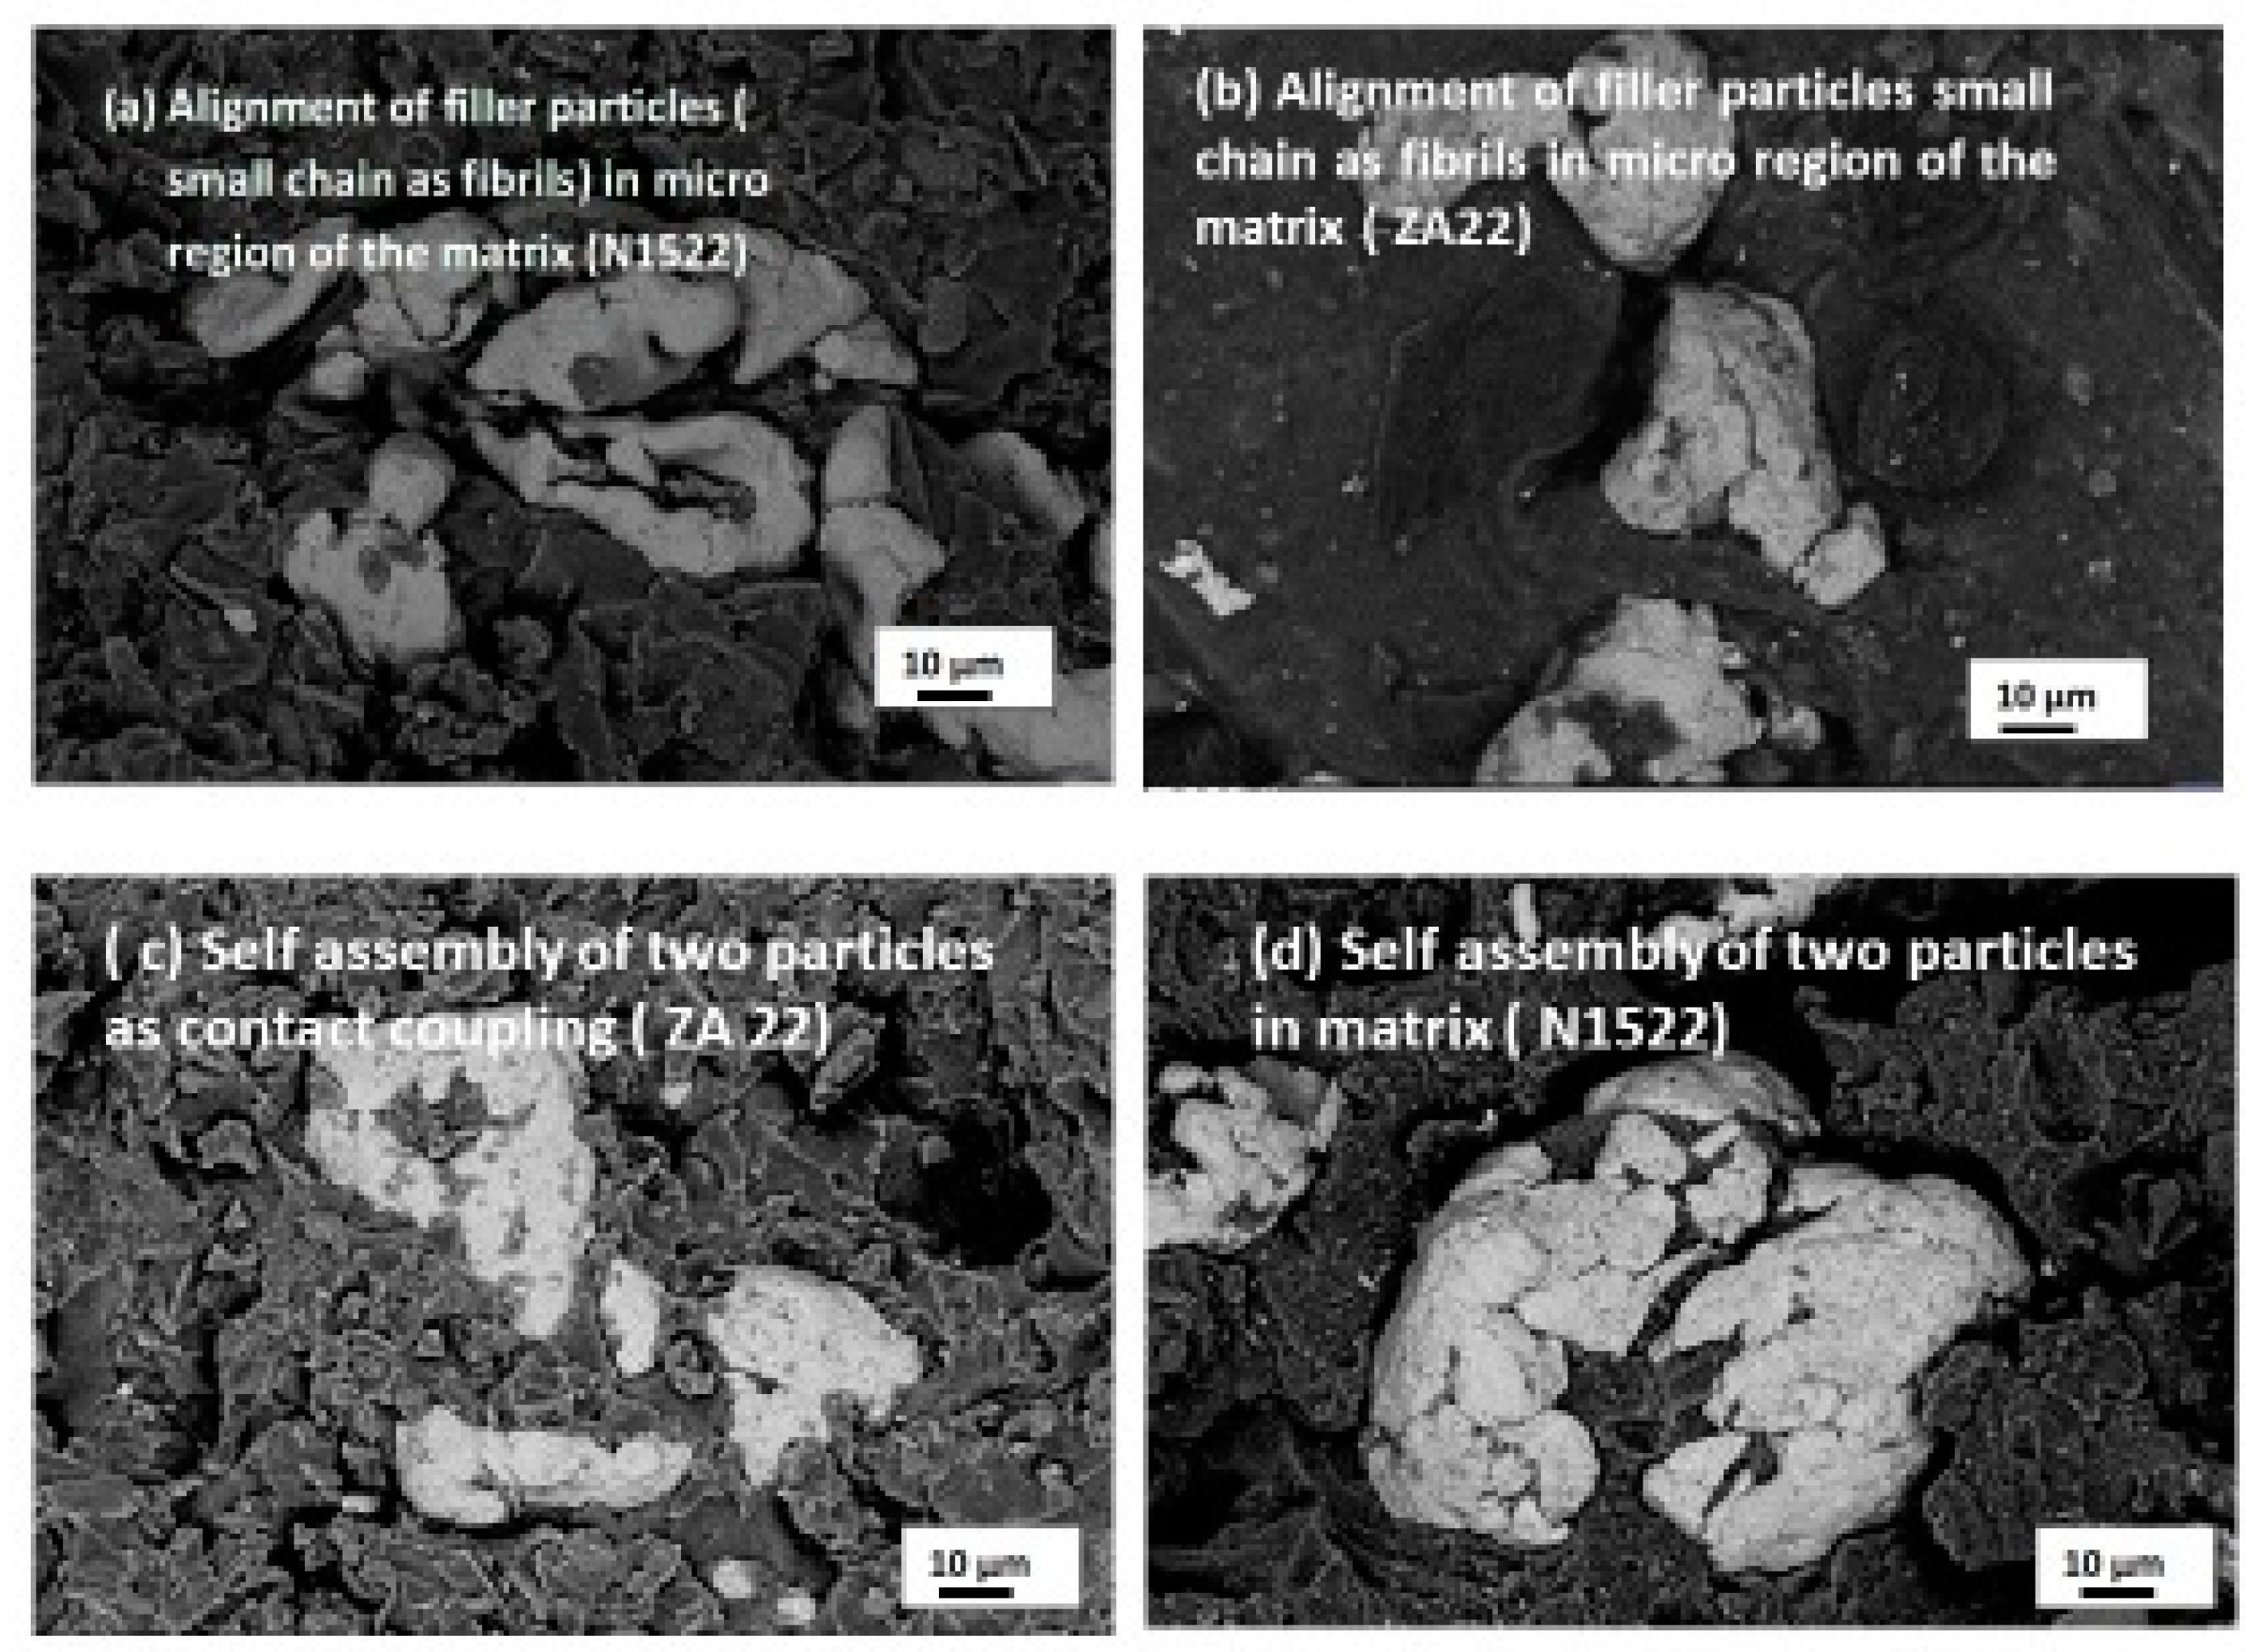
The microstructure of the MRE composites was examined by SEM. The top surface and even the cross section of the samples were investigated to verify the iron particles distribution within the matrix of the silicon couch polymer. Figure 10a,b displays the microstructure of the elastomer matrix (ZA 22 and N1522). The MREs composite showed uniform and isotropic distribution of filler particles within the matrix (Figure 10c,d). The isotropic distribution of iron particles showed adherence to the network structure of the polymer matrix. Figure 11a–d displays the self-assembled structure of iron particles (fibril) that developed due to the affine coupling nature of the magnetic field (two particle model) in the microscopic configuration of the MRE composite under the influence of the magnetic field. A series of very small chains of three or two particles of filler arrangement were observed in the microstructure of the MRE samples. This may lead to dipole– dipole interaction or contract interaction that gives rise to coupling of the spin particle direction as a function of the magnetic field.
3.3. Micro Computed Tomography of MRE
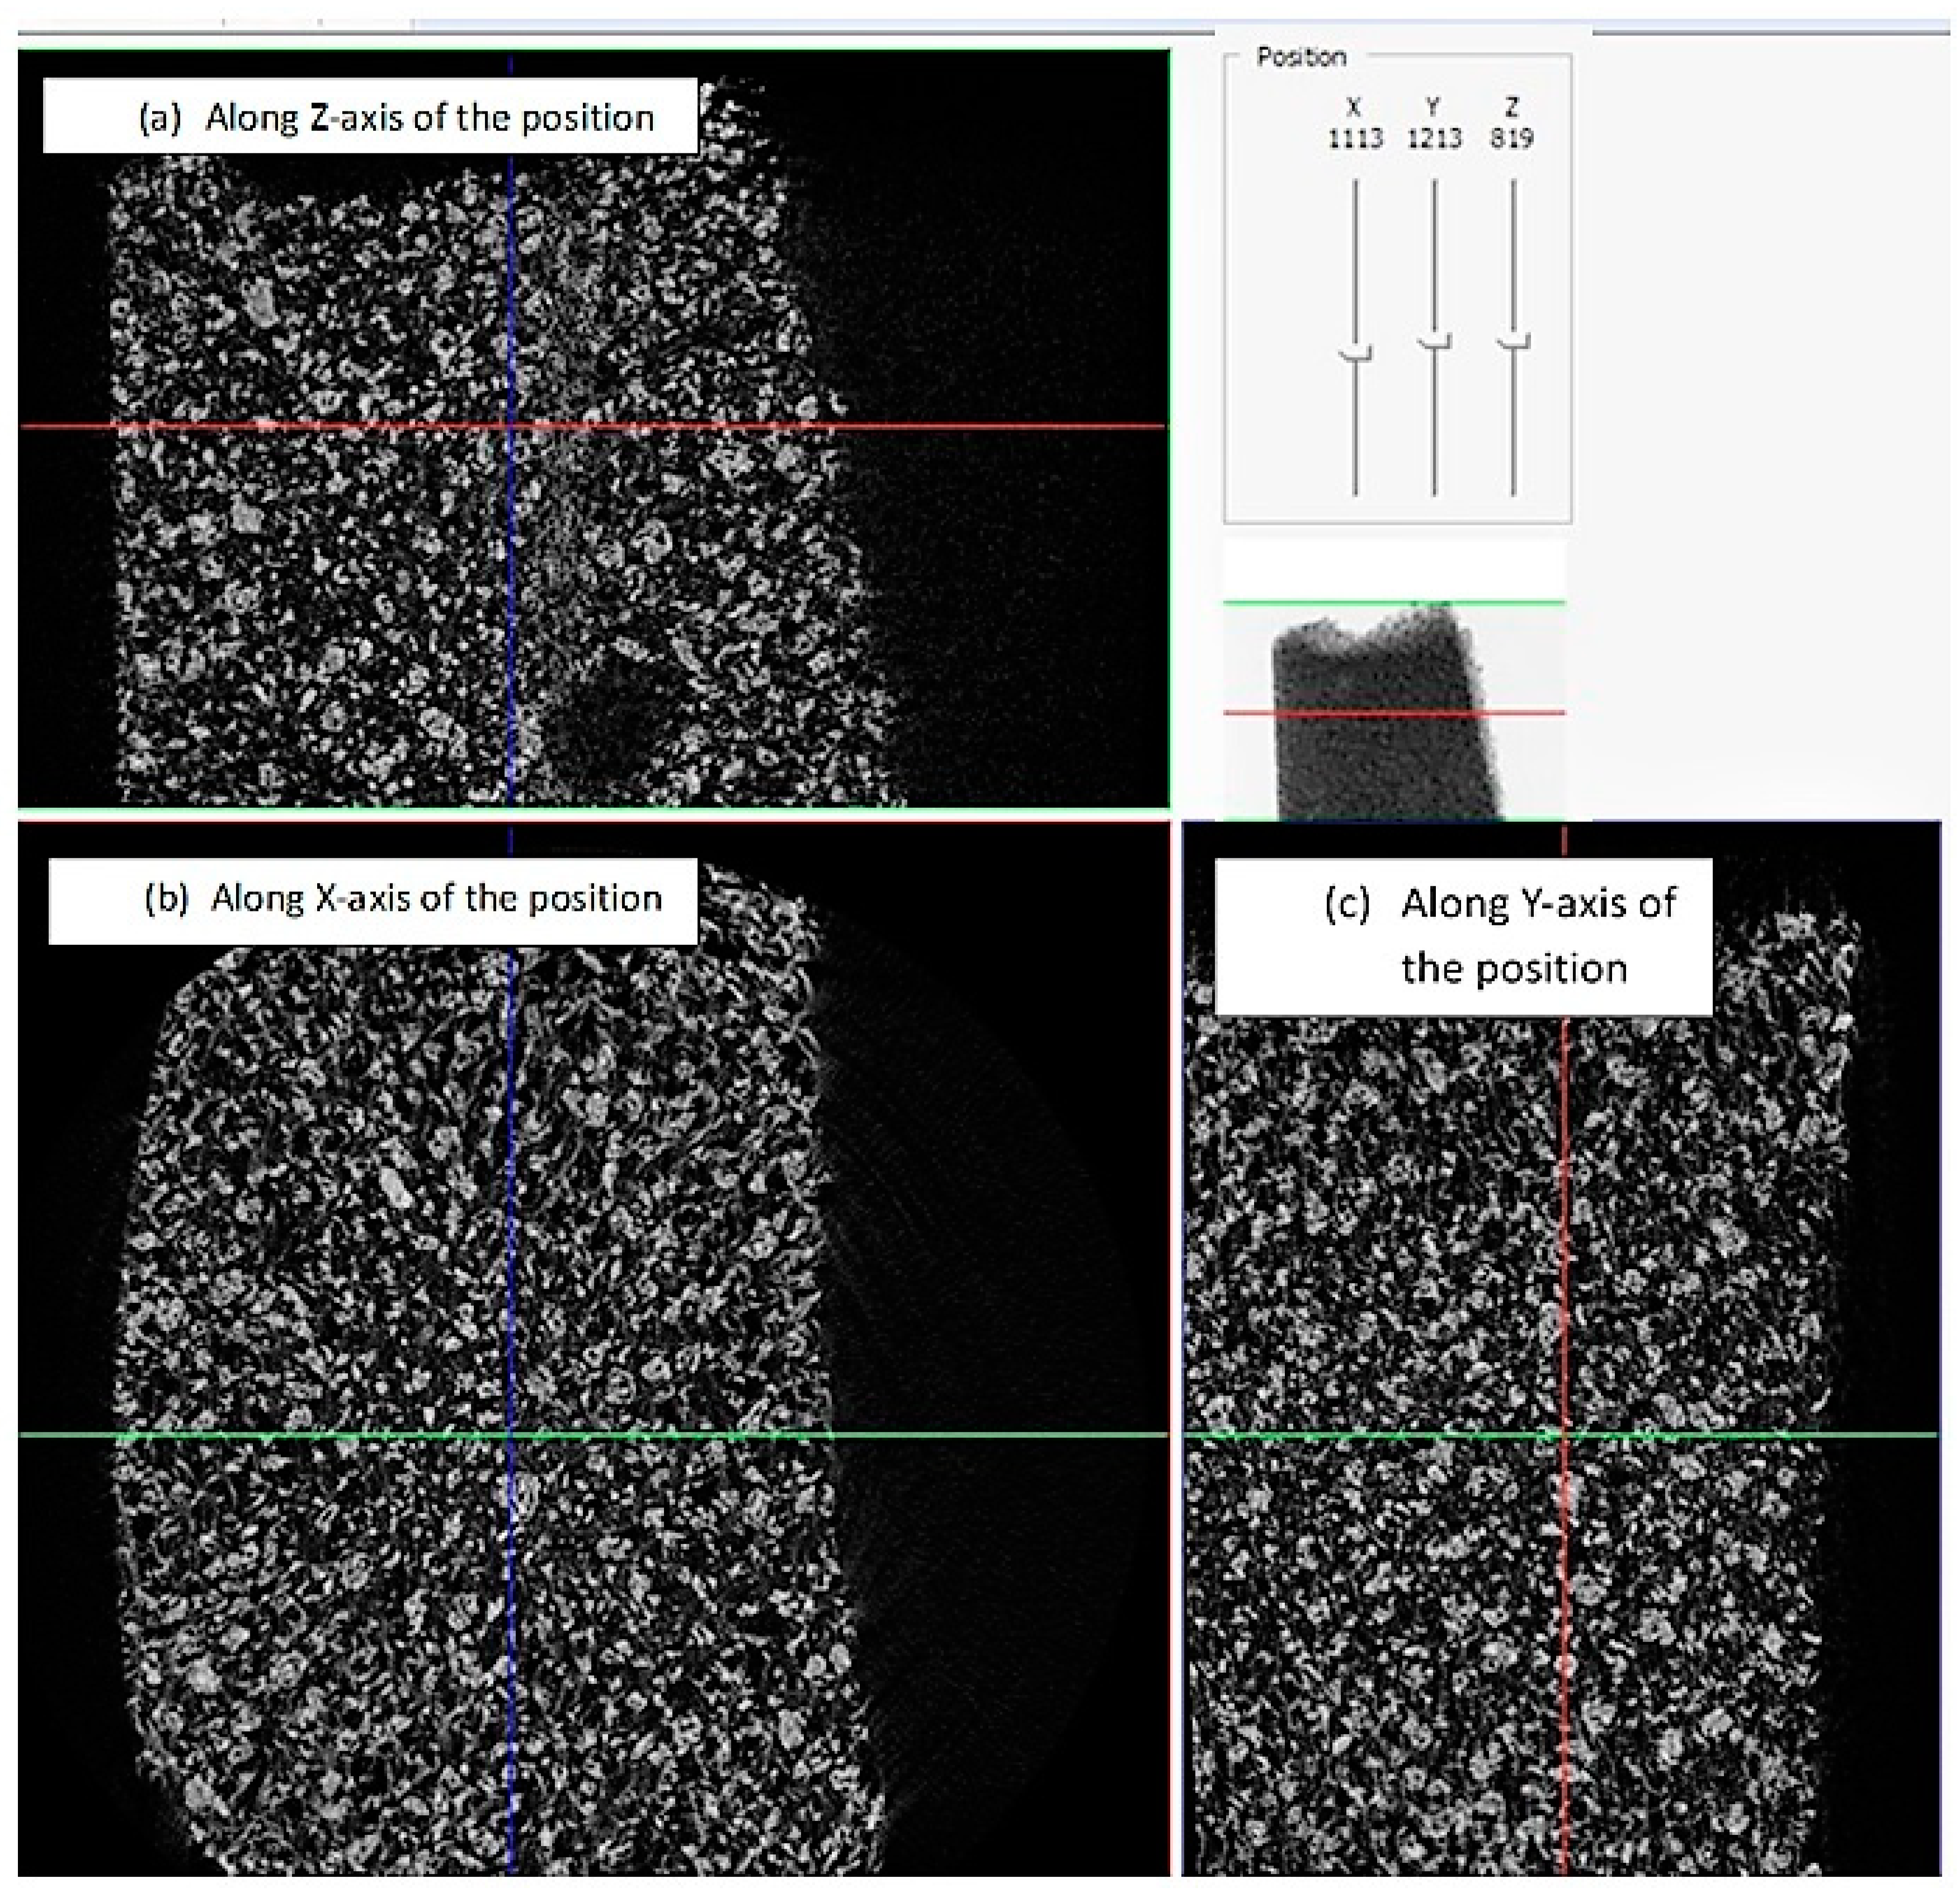
Figure 12 displays the µCT image of the elastomer matrix, without any porosity. In the same figure the 3D image of the MRE composite at various positions of the X-, Y-, and Z-axis is visualized. Furthermore, we analyzed samples using micro-computed tomography for the overall distribution of filler particles within the matrix of the composite. Figure 13 shows the µCT characterization of the MRE composite (ZA 22) with iron nanoparticles. The 3D image shows the porosity and iron filler volume distribution of the materials. The report of the observations is summarized in Table 1.
Figure 14 displays the overall and inner position of the MREs composite with matrix ZA 22 and N1522, where it is possible to observe that the ZA 22 matrix shows better adhesion and distribution of filler particles within the composite matrix. However, the N 1522 matrix develops poor adhesion while a lot of porosity was observed in the overall display of the MRE composite.
4. Discussions
The self-assembled structure was developed by filling, in the presence of the magnetic field, exploiting its contribution along the sample in the parallel direction. As the filler particle is already stabilized in the cured matrix, the movement of the filler particle arises at the resting position from magnetic torques. As a result, the dipolar and contact interactions between magnetic moments play a role in the improved behavior of the mechanical properties. Strongly and loosely coupled filler particles generate coupling of the magnetic moment that arises in the presence of the magnetic field. Table 1 reports various information of the MRE sample (ZA 22) from µCT observation. A total porosity of 17.4% was observed in the sample. The sample position during analysis is represented with a total volume of 15.7 mm3 and surface area of 1166.2 mm2. Both the lower and upper vertical positions of the sample with centroid position are explained.
The isotropic distribution of the iron particles was observed in the MRE composite during the fabrication stage without any influence of the magnetic field. The additive silicon oil improved the iron particles adhesion within the matrix, and during the measurement of mechanical properties under the influence of the external field, the particles provided a slight influence. As a result, self-assembled microstructure (fibrils) resulted in the microscopic range of the particle region within the larger or microscopical area of the MRE sample.
This “two particles model” microstructure was generated by the strong coupling between the iron particles, due to their magnetic interactions, which is known as the affine coupling effect. The magnetic field arises due to the dipole of the initial particle [15]:
the vector potential is defined as:
where θ’ is the angle between r’ and dr(r’ − r). So can be written as:
The magnetic moment of each filler particle is represented by m = , so the dipole potential can be converted [16] to:
According to the magnetic field which plays the induction role due to dipole interaction:
here is the unit vector and r is the position vector for the individual filler particle is defined as follows:
with respect to the 3D coordinate (x, y, z). The magnetic induction that arises within the MRE due to filler dipole interaction is:
The interaction energy between two magnetic dipoles is given by:
where and are the unit vectors corresponding to the two particles in nearby positions. So the internal energy between two particles, due to dipole–dipole interaction, is nominated based on the position vector and the respective angle [17]:
On taking the derivative with respect to the angular position of particle 1 and 2 defined as:
and
So, the value of and falls in the range 0–π. The coupling along the x- and y- axis, results in a change of orientation spin from α to β. The magnetic dipole of the interaction between two iron particles defined as the magnetic dipole moment of a particle under external field H0 [18] is
where μ0 is the vacuum permeability, β = (μp − μm)/μp + 2μm), μp and μm are the relative permeability of the particles and the matrix respectively. For an iron particle and silicone rubber, μp ≈ 1000, μm ≈ 1 and β ≈ 1. The self-assembled microstructure can also decrease the initial shear modulus. The initial modulus of the MRE without magnetic field [19] can be written as
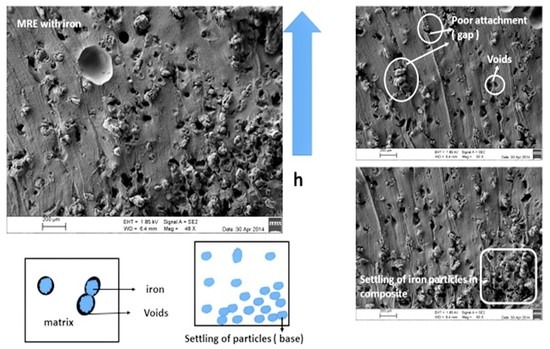
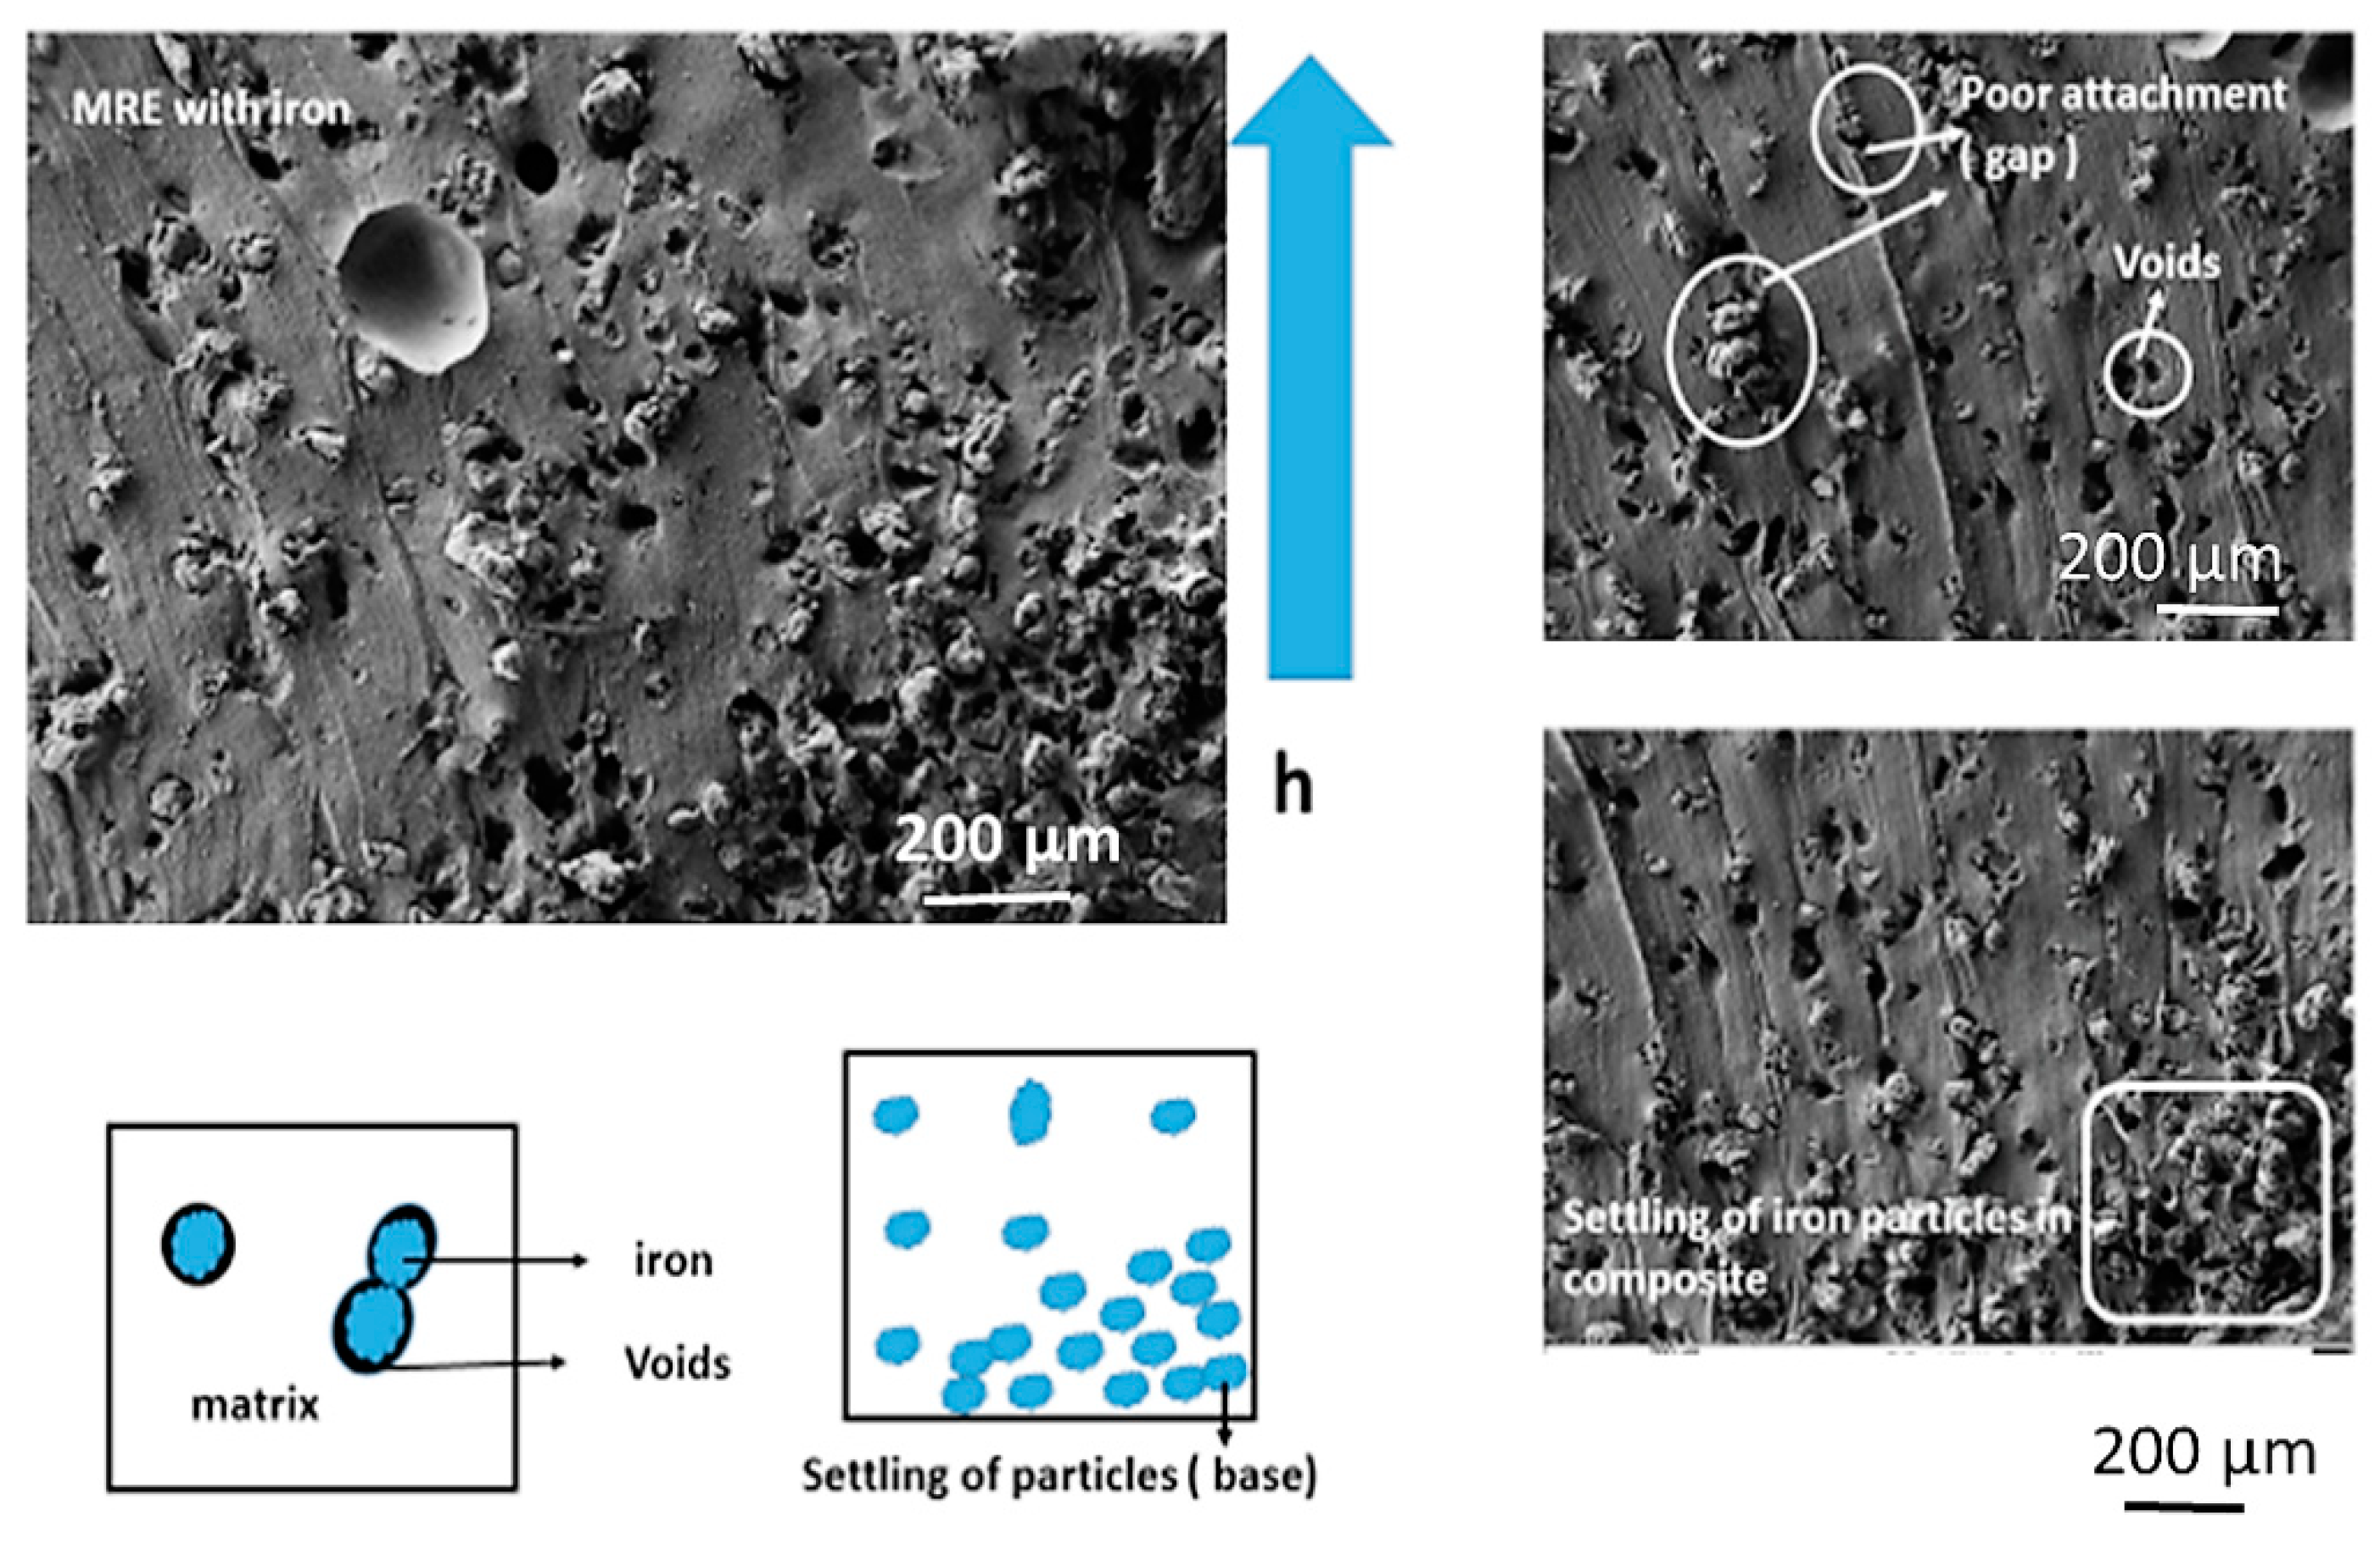
where G0 is the modulus of the matrix and Φ is the volume percentage of the particles. The particle volume percentage in the MRE was assumed to be 30%. On this basis, the probability of formation of SC or HCP microstructures is effective in the composite. However, some exceptions were observed in the MRE composites during the fabrication process. Due to the higher density of iron particles, during the curing process at room temperature, their settlement was observed more towards the bottom with respect to the top layer (Figure 15).
ma = 4πμmμ0R3βH0
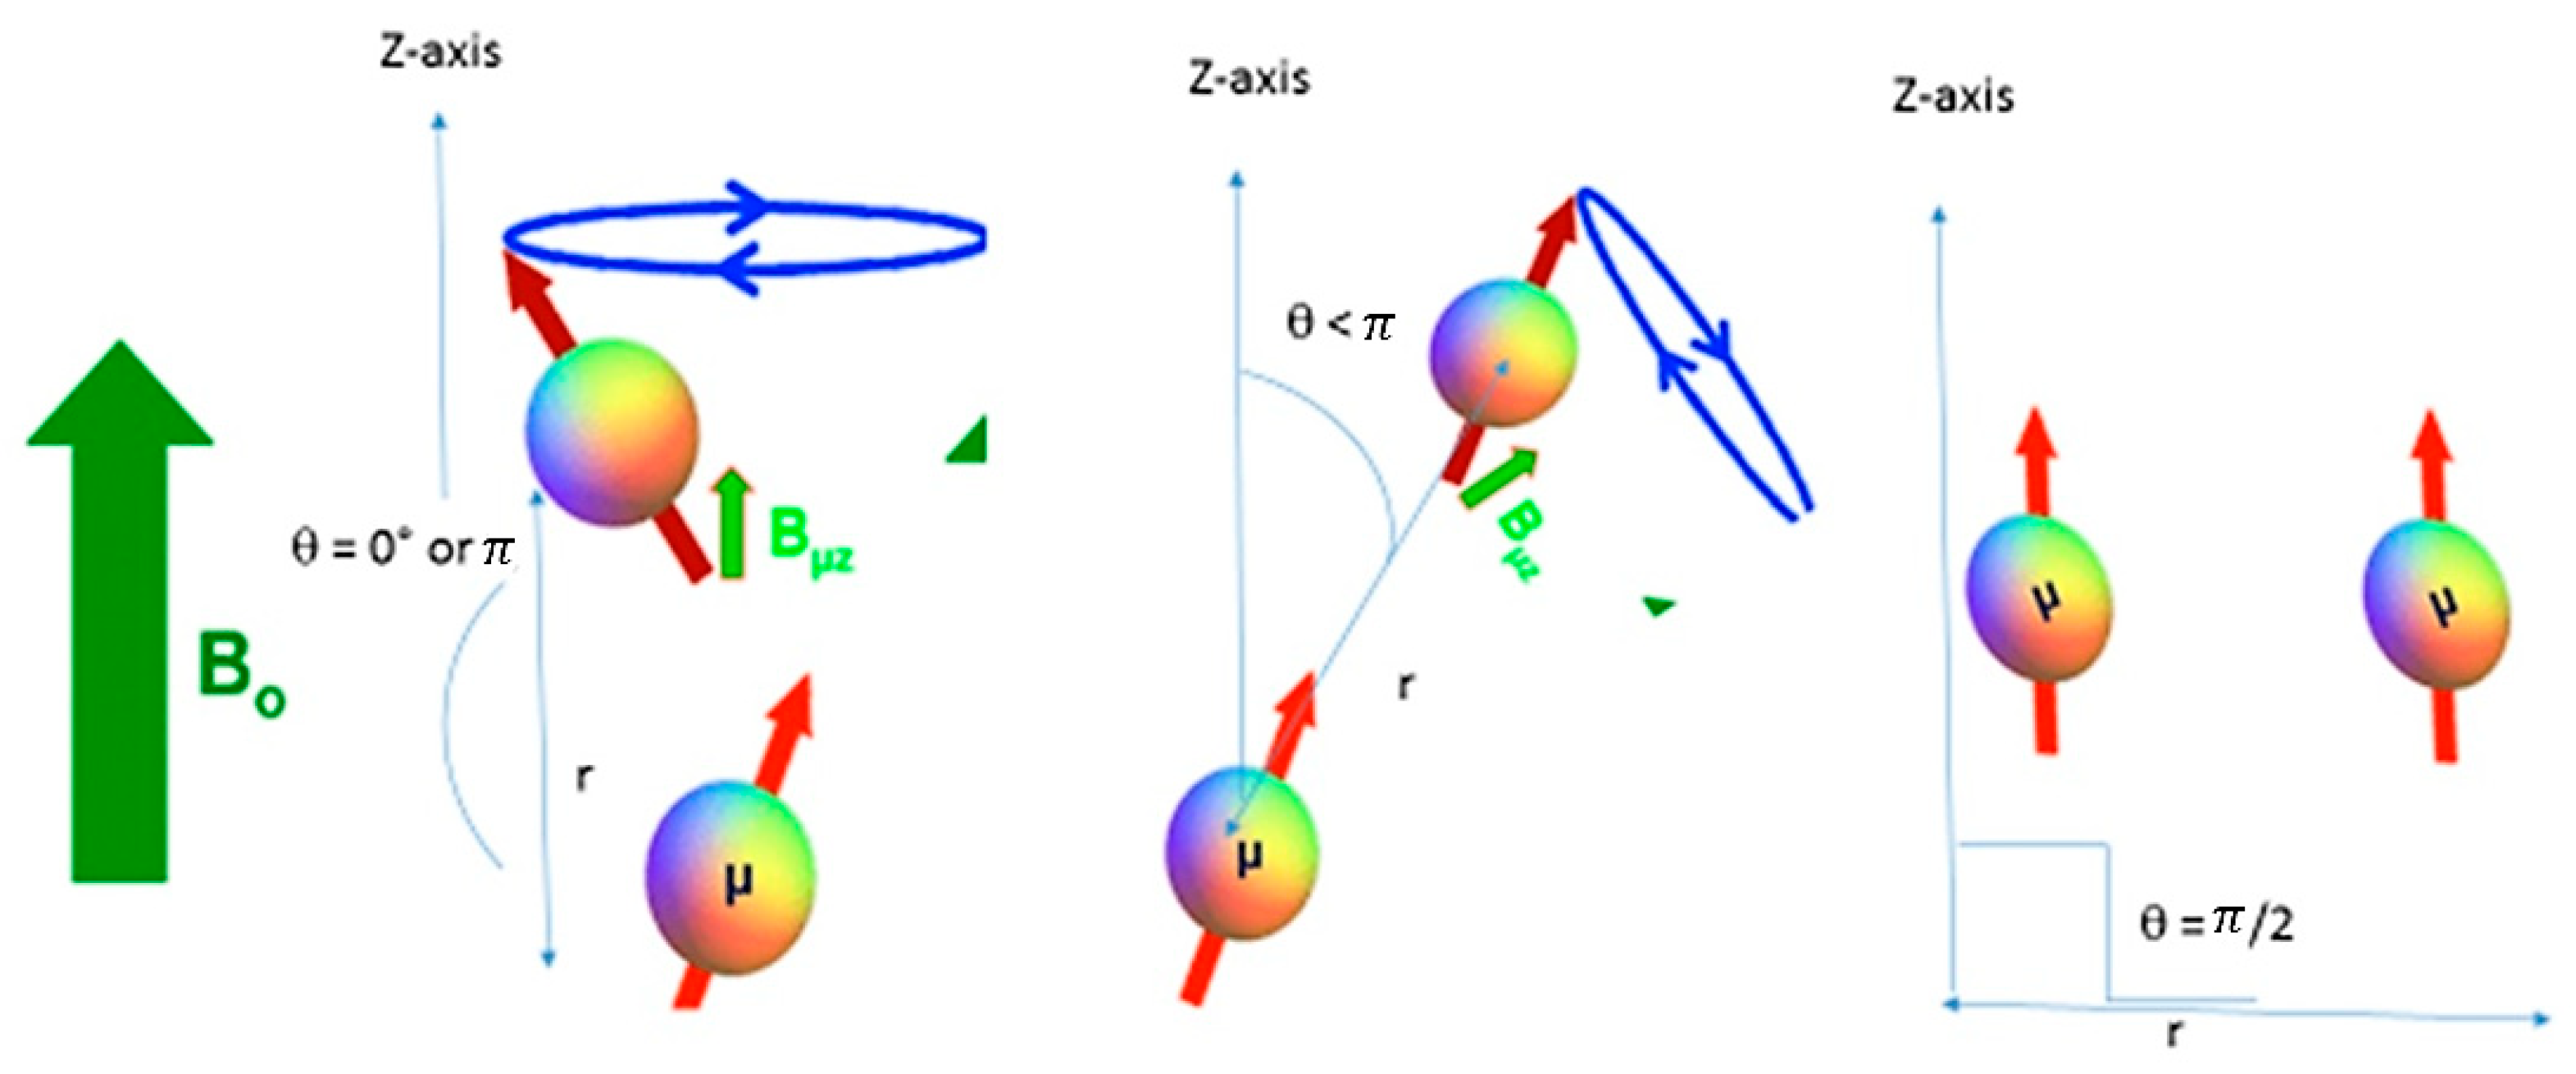
The magneto-rheological effect was attributed to the dipole–dipole interaction of particles or particles self-assembled phenomena in the MRE composite. The magneto-rheological properties arise from the magnetic alignment of the iron particles in the MRE composites under the influence of a magnetic field. This magnetic alignment increased the stiffness of the material, observed as an increase in the shear storage modulus during the shear test, depending on the magnetic properties, morphology, and concentration of the particles in the composite. A schematic diagram of the filler particles behavior in response to the applied magnetic field is portrayed in Figure 16, where the influence of the size of regular and irregularly shaped particles in the composite and their intermediate states for the magnetic induction toward the formation of fibrils are shown.
The self-assembly model is used to explain the microstructure of iron particles in the MRE composites, as shown in Figure 14 in agreement with literature [18,19]. The isotropic distribution of filler particles facilitates microscopic behavior changes within the MRE composite, thus resulting in affine coupling of the particles, likely following the two-particle model, within the broad dimension of the macroscopic deformation of the samples [9,15]. The effect of the formation of a self-assembled microstructure is observed in the isotropic distribution of the MRE composite, which agrees well with our previous data [20].
The bonds between the particles and matrix influence the mechanical behavior of the composite material: if they are weak, then failure will occur at the surface of the composite. Weak interfacial bonding was observed as a pit at the interface between the iron filler and silicon couch matrix. A weak contact surface (Figure 15) was primarily observed in the sample with iron particles, showing isotropic particles distribution in the MRE composite. The magnetic dipole moment of each magnetic particle m is directed toward the horizontal direction with a polar angle. The balance between the elastic and magnetic forces is the factor influencing magnetic interactions (such as the magnetic properties, particle size, and spatial density of the filler) and which control the MR effect. Iron particles with a high saturation magnetization can be considered as one of the best filler materials. Usually, micrometer-sized particles are used, although recently MREs based on sub-millimeter iron particles were fabricated with a more pronounced MR effect. Smaller filler particles size and lower magnetic fields result in stronger magnetic networks. Both factors result in the extension of the linear viscoelastic regime to larger strain amplitudes and lead to higher shear storage and loss of moduli values [21,22]. The particle–particle dipolar interaction is explained in the schematic diagram (Figure 16) based on the various vector and angular positions that play the active role in the dipolar moment, contributing to the magneto-rheological effect in the MRE sample in the presence of a magnetic field [23], and also according to the continuum based model proposed in the literature [24,25,26,27].
5. Conclusions
The simulation behavior of the magnet and sample position were explained and the values of magnetic induction were calculated at various stages in the configuration of the sample without and with mesh condition. Magnetic force alignment was induced in the MRE composite in the presence of an external cylindrical magnetic field, resulting in magnetic interaction between two magnetically active particles with co-aligned dipoles induced by a uniform magnetic field. The isotropic distribution of iron particles in the MRE composites was observed from microstructural images, showing the formation of fibrils of particle chains (two or three particles series arrangement) within the elastomer. With the influence of magnetic field, a binary or ternary arrangement of the self-assembled microstructure was formed by the iron particles which exhibited the influence of the magnetic effect in the composite due to dipolar interaction. In a uniform magnetic field, particles become magnetized and assemble into chain-like microstructures due to dipole–dipole interactions, thus tending to align with the direction of the external field. The self-assembled magneto active particles induce a magnetic effect in the elastomeric composite. The normalized dipole–dipole interaction forces developed on various angles of the particles with relative angular positions to each other. This mechanism also explains the origin of the magneto-rheological effect that can contribute towards the better damping properties of the MRE composites, resulting in a great advantage for smart materials application, such as the damper in automotive vehicles.
Supplementary Materials
The following are available online at https://www.mdpi.com/2504-477X/2/3/54/s1, Figure S1: Schematics/directions of the application of the magnetic field, Figure S2: Scheme of polyaddition chemical reaction for ZA 22, Figure S3: Scheme of polycondensation chemical reaction for N 1522.
Author Contributions
S.S., M.K. and I.B. conceived and designed the experiments; S.S. and M.K. performed the experiments; S.S. and M.K. analyzed the data; S.S., M.K. and I.B. wrote the paper.
Funding
This research received no external funding.
Conflicts of Interest
The authors declare no conflict of interest.
References
- Samal, S.; Vlacha, J.; Kavana, P. Improved mechanical properties of magneto rheological elastomeric composite with isotropic iron filler distribution. Ciênc. Tecnol. Mater. 2016, 28, 155–161. [Google Scholar] [CrossRef]
- Carlson, J.D.; Jolly, M.R. MR fluid, foam and elastomer devices. Mechatronics 2000, 10, 555–569. [Google Scholar] [CrossRef]
- Ginder, J.M.; Nichols, M.E.; Elie, L.D.; Tardiff, J.L. Magnetorheological elastomers: Properties and applications. In Proceedings of the 1999 Symposium on Smart Structures and Materials, Newport Beach, CA, USA, 1 March 1999; pp. 131–138. [Google Scholar]
- Hu, Y.; Wang, Y.L.; Gong, X.L.; Gong, X.Q.; Zhang, X.Z.; Jiang, W.Q.; Zhang, P.Q.; Chen, Z.Y. New magnetorheological elastomers based on polyurethane/Si-rubber hybrid. Polym. Test. 2005, 24, 324–329. [Google Scholar] [CrossRef]
- Jolly, M.R.; Carlson, J.D.; Munoz, B.C.; Bullions, T.A. The magnetoviscoelastic effect of elastomer composites consisting of ferrous particles embedded in a polymer matrix. J. Intell. Mater. Syst. Struct. 1996, 7, 613–622. [Google Scholar] [CrossRef]
- Balasoiu, M.; Bica, I. Composite magnetorheological elastomers as dielectrics for plane capacitors: Effects of magnetic field intensity. Results Phys. 2016, 6, 199–202. [Google Scholar] [CrossRef]
- Bica, I.; Anitas, E.M.; Averis, L.M.E. Tensions and deformations in composites based on polyurethane elastomer and magnetorheological suspension: Effects of the magnetic field. J. Ind. Eng. Chem. 2015, 28, 86–90. [Google Scholar] [CrossRef]
- Bunoiu, M.; Bica, I. Magnetorheological elastomer based on silicone rubber, carbonyl iron and Rochelle salt: Effects of alternating electric and static magnetic fields intensities. J. Ind. Eng. Chem. 2016, 37, 312–318. [Google Scholar] [CrossRef]
- Shiga, T.; Okada, A.; Kurauchi, T. Magnetroviscoelastic behavior of composite gels. J. Appl. Polym. Sci. 1995, 58, 787–792. [Google Scholar] [CrossRef]
- Stepanov, G.V.; Borin, D.Y.; Raikher, L.Y.; Melenev, P.V.; Perov, N.S. Motion of ferroparticles inside the polymeric matrix in magnetoactive elastomers. J. Phys. Condens. Matter 2008, 20, 204121. [Google Scholar] [CrossRef] [PubMed]
- Petríková, I.; Marvalová, B. Experimental research and numerical simulation of the damping properties of Magnetorheological Elastomers. In Constitutive Models for Rubber X; Lion, A., Johlitz, M., Eds.; CRC Press: London, UK, 2017; pp. 1–8. [Google Scholar]
- Samal, S.; Vlach, J.; Kolinova, M.; Kavan, P. Micro-computed tomography characterization of isotropic filler distribution in magnetorheological elastomeric composites. In Advanced Processing and Manufacturing Technologies for Nanostructured and Multifunctional Materials; Ohji, T., Singh, M., Halbig, M., Moon, K., Eds.; Wiley: Hoboken, NJ, USA, 2017; pp. 57–69. [Google Scholar]
- Yu, M.; Ju, B.; Fu, J.; Liu, X.; Yang, Q. Influence of composition of carbonyl iron particles on dynamic mechanical properties of magnetorheological elastomers. J. Magn. Magn. Mater. 2012, 324, 2147–2152. [Google Scholar] [CrossRef]
- Lokander, M.; Stenberg, B. Improving the magnetorheological effect in isotropic magnetorheological rubber materials. Polym. Test. 2003, 22, 677–680. [Google Scholar] [CrossRef]
- Sorokin, V.V.; Ecker, E.; Stepanov, G.V.; Shamonin, M.; Monkman, G.J.; Kramarenko, E.Y.; Khokhlovad, E.A.R. Experimental study of the magnetic field enhanced Payne effect in magnetorheological elastomers. Soft Matter 2014, 10, 8765–8776. [Google Scholar] [CrossRef] [PubMed]
- Molchanov, V.; Stepanov, G.; Vasiliev, V.; Kramarenko, E.; Khokhlov, A.; Xu, Z.-D.; Guo, Y.-Q. Viscoelastic properties of magnetorheological elastomers for damping applications. Macromol. Mater. Eng. 2014, 299, 1116–1125. [Google Scholar] [CrossRef]
- Ivaneyko, D.; Toshchevikov, V.; Saphiannikova, M.; Heinrich, G. Mechanical properties of magneto-sensitive elastomers: Unification of the continuum-mechanics and microscopic theoretical approaches. Soft Matter 2014, 10, 2213–2225. [Google Scholar] [CrossRef] [PubMed]
- Rey, T.; Chagnon, G.; Le Cam, J.-B.; Favier, D. Effects of Temperature on the Mechanical Behavior of Filled and Unfilled Silicone Rubbers. Available online: https://hal.archives-ouvertes.fr/hal-00936536 (accessed on 11 January 2014).
- Taniguchi, T.; Mitsumata, T.; Sugimoto, M.; Koyama, K. Anisotropy in elastic modulus of hydrogel containing magnetic particles. Physica A 2006, 370, 240–244. [Google Scholar] [CrossRef]
- Qiao, X.; Lu, X.; Gong, X.; Yang, T.; Sun, K.; Chen, X. Effect of carbonyl iron concentration and processing conditions on the structure and properties of the thermoplastic magnetorheological elastomer composites based on poly(styrene-b-ethylene-co-butylene-b-styrene) (SEBS). Polym. Test. 2015, 47, 51–58. [Google Scholar] [CrossRef]
- Sorokin, V.V.; Stepanov, G.V.; Shamonin, M.; Monkman, G.J.; Kramarenko, E.Y. Hysteresis of the viscoelastic properties and the normal force in magnetically and mechanically soft magnetoactive elastomers: Effects of filler composition, strain amplitude and magnetic field. Polymer 2015, 76, 191–202. [Google Scholar] [CrossRef]
- Wang, Y.; Hu, Y.; Chen, L.; Gong, X.; Jiang, W.; Zhang, P.; Chen, Z. Effects of rubber/magnetic particle interactions on the performance of magnetorheological elastomers. Polym. Test. 2006, 25, 262–267. [Google Scholar] [CrossRef]
- Lu, X.; Qiao, X.; Watanabe, H.; Gong, X.; Yang, T.; Li, W.; Sun, K.; Li, M.; Yang, K.; Xie, H.; et al. Mechanical and structural investigation of isotropic and anisotropic thermoplastic magnetorheological elastomer composites based on poly(styrene-b-ethylene-co-butylene-b-styrene) (SEBS). Rheol. Acta 2012, 51, 37–50. [Google Scholar] [CrossRef]
- Saxena, P.; Hossain, M.; Steinmann, P. A theory of finite deformation magneto-viscoelasticity. Int. J. Solids Struct. 2013, 50, 3886–3897. [Google Scholar] [CrossRef]
- Saxena, P.; Hossain, M.; Steinmann, P. Non-linear magneto-viscoelasticity of transversally isotropic magneto-active polymers. Proc. R. Soc. Lond. Ser. A 2014, 470, 2166. [Google Scholar] [CrossRef] [PubMed]
- Saxena, P.; Pelteret, J.P.; Steinmann, P. Modelling of iron-filled magneto-active polymers with a dispersed chain-like microstructure. Eur. J. Mech. A Solids 2015, 50, 132–151. [Google Scholar] [CrossRef]
- Mehnert, M.; Hossain, M.; Steinmann, P. Towards a thermo-magneto-mechanical framework for magneto-rheological elastomers. Int. J. Solids Struct. 2017, 128, 117–132. [Google Scholar] [CrossRef]
Figure 1.
Optical images (a,b) of the linear arrangement of filler particles within the magneto-rheological elastomers (MREs) composite (N 1522 as matrix) in the presence of magnetic field during fabrication. (c) The linear chain and branches of filler particles.
Figure 1.
Optical images (a,b) of the linear arrangement of filler particles within the magneto-rheological elastomers (MREs) composite (N 1522 as matrix) in the presence of magnetic field during fabrication. (c) The linear chain and branches of filler particles.
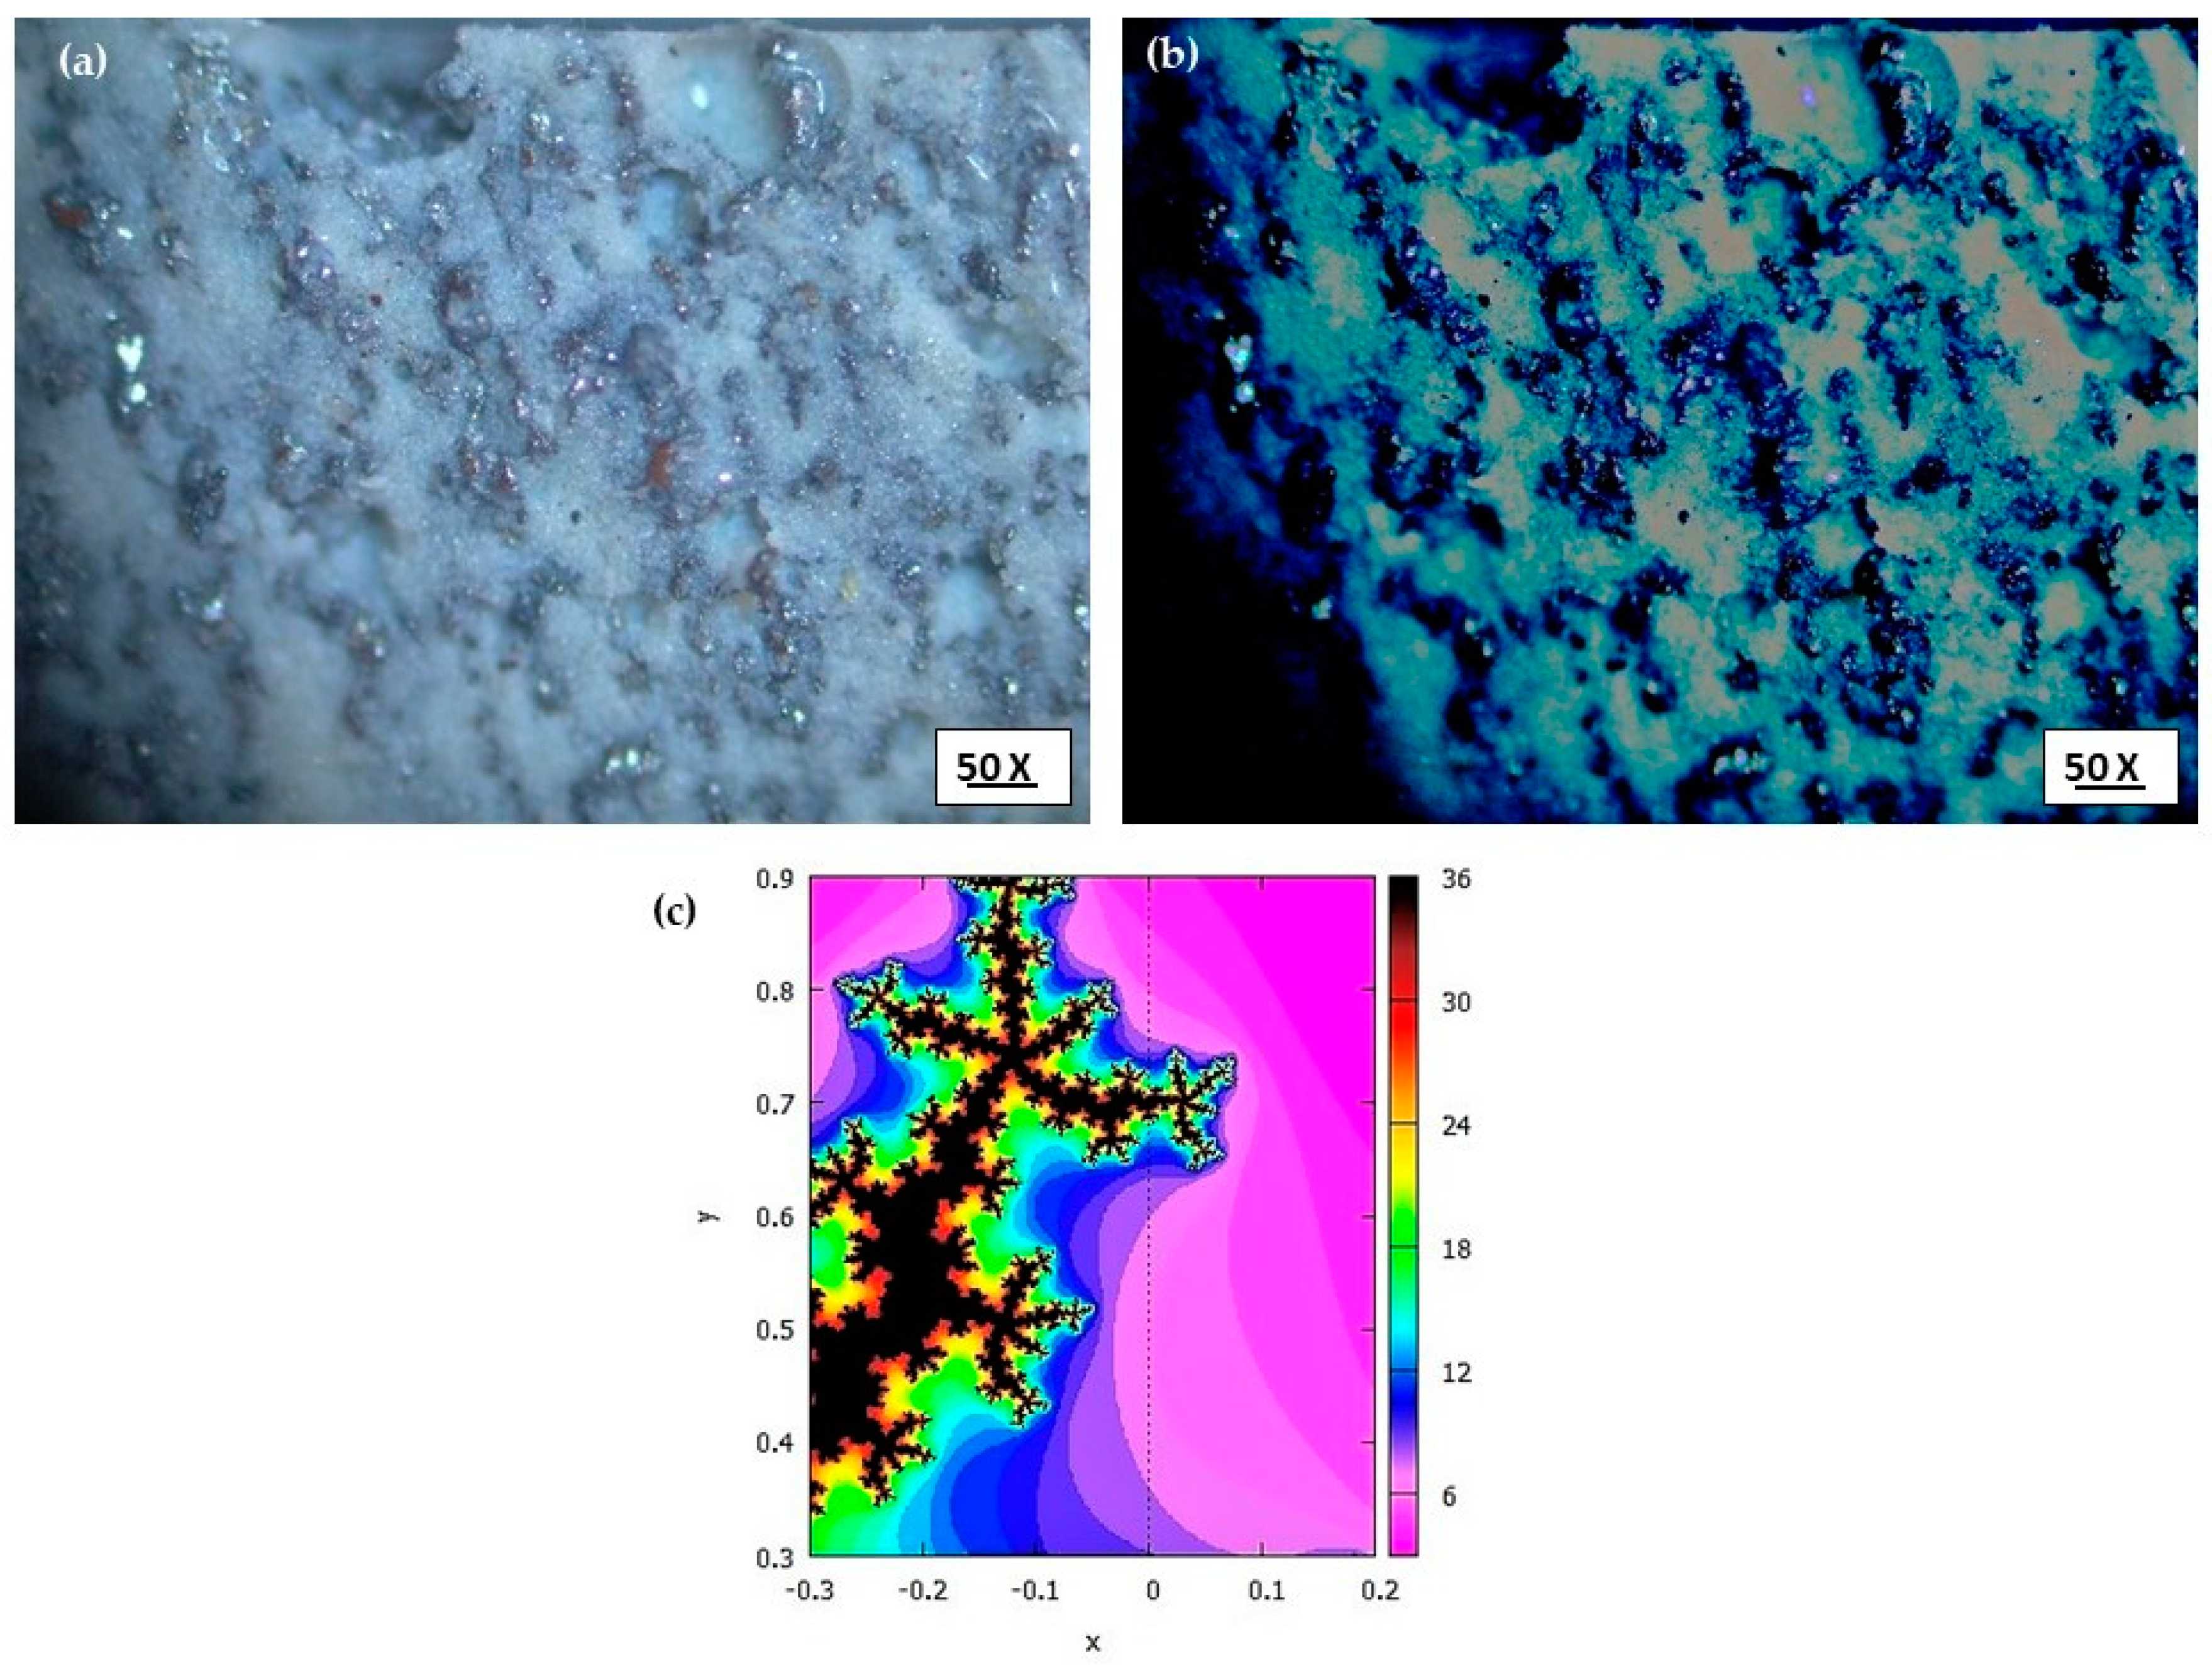
Figure 2.
Magnet with coil current and magnetic potential of magnet.

Figure 3.
(a) Magnet with MRE sample and (b) cross section view of magnet with core, skeleton, coil winding, and MRE sample position.
Figure 3.
(a) Magnet with MRE sample and (b) cross section view of magnet with core, skeleton, coil winding, and MRE sample position.

Figure 4.
Schematic presentation of the magnet with the MRE sample position on the top of the magnetic and respective atmosphere, (a) without mesh, (b) with mesh.
Figure 4.
Schematic presentation of the magnet with the MRE sample position on the top of the magnetic and respective atmosphere, (a) without mesh, (b) with mesh.
Figure 5.
Distribution of magnetic induction on the above configuration of MRE in presence of magnetic field (a) with mesh and considering surrounding atmosphere (b) without mesh and using lines of force as external parameter.
Figure 5.
Distribution of magnetic induction on the above configuration of MRE in presence of magnetic field (a) with mesh and considering surrounding atmosphere (b) without mesh and using lines of force as external parameter.

Figure 6.
(a) Magnetic induction distribution on the top portion of the configuration exposing the magnet and MRE sample (b) closure view.
Figure 6.
(a) Magnetic induction distribution on the top portion of the configuration exposing the magnet and MRE sample (b) closure view.
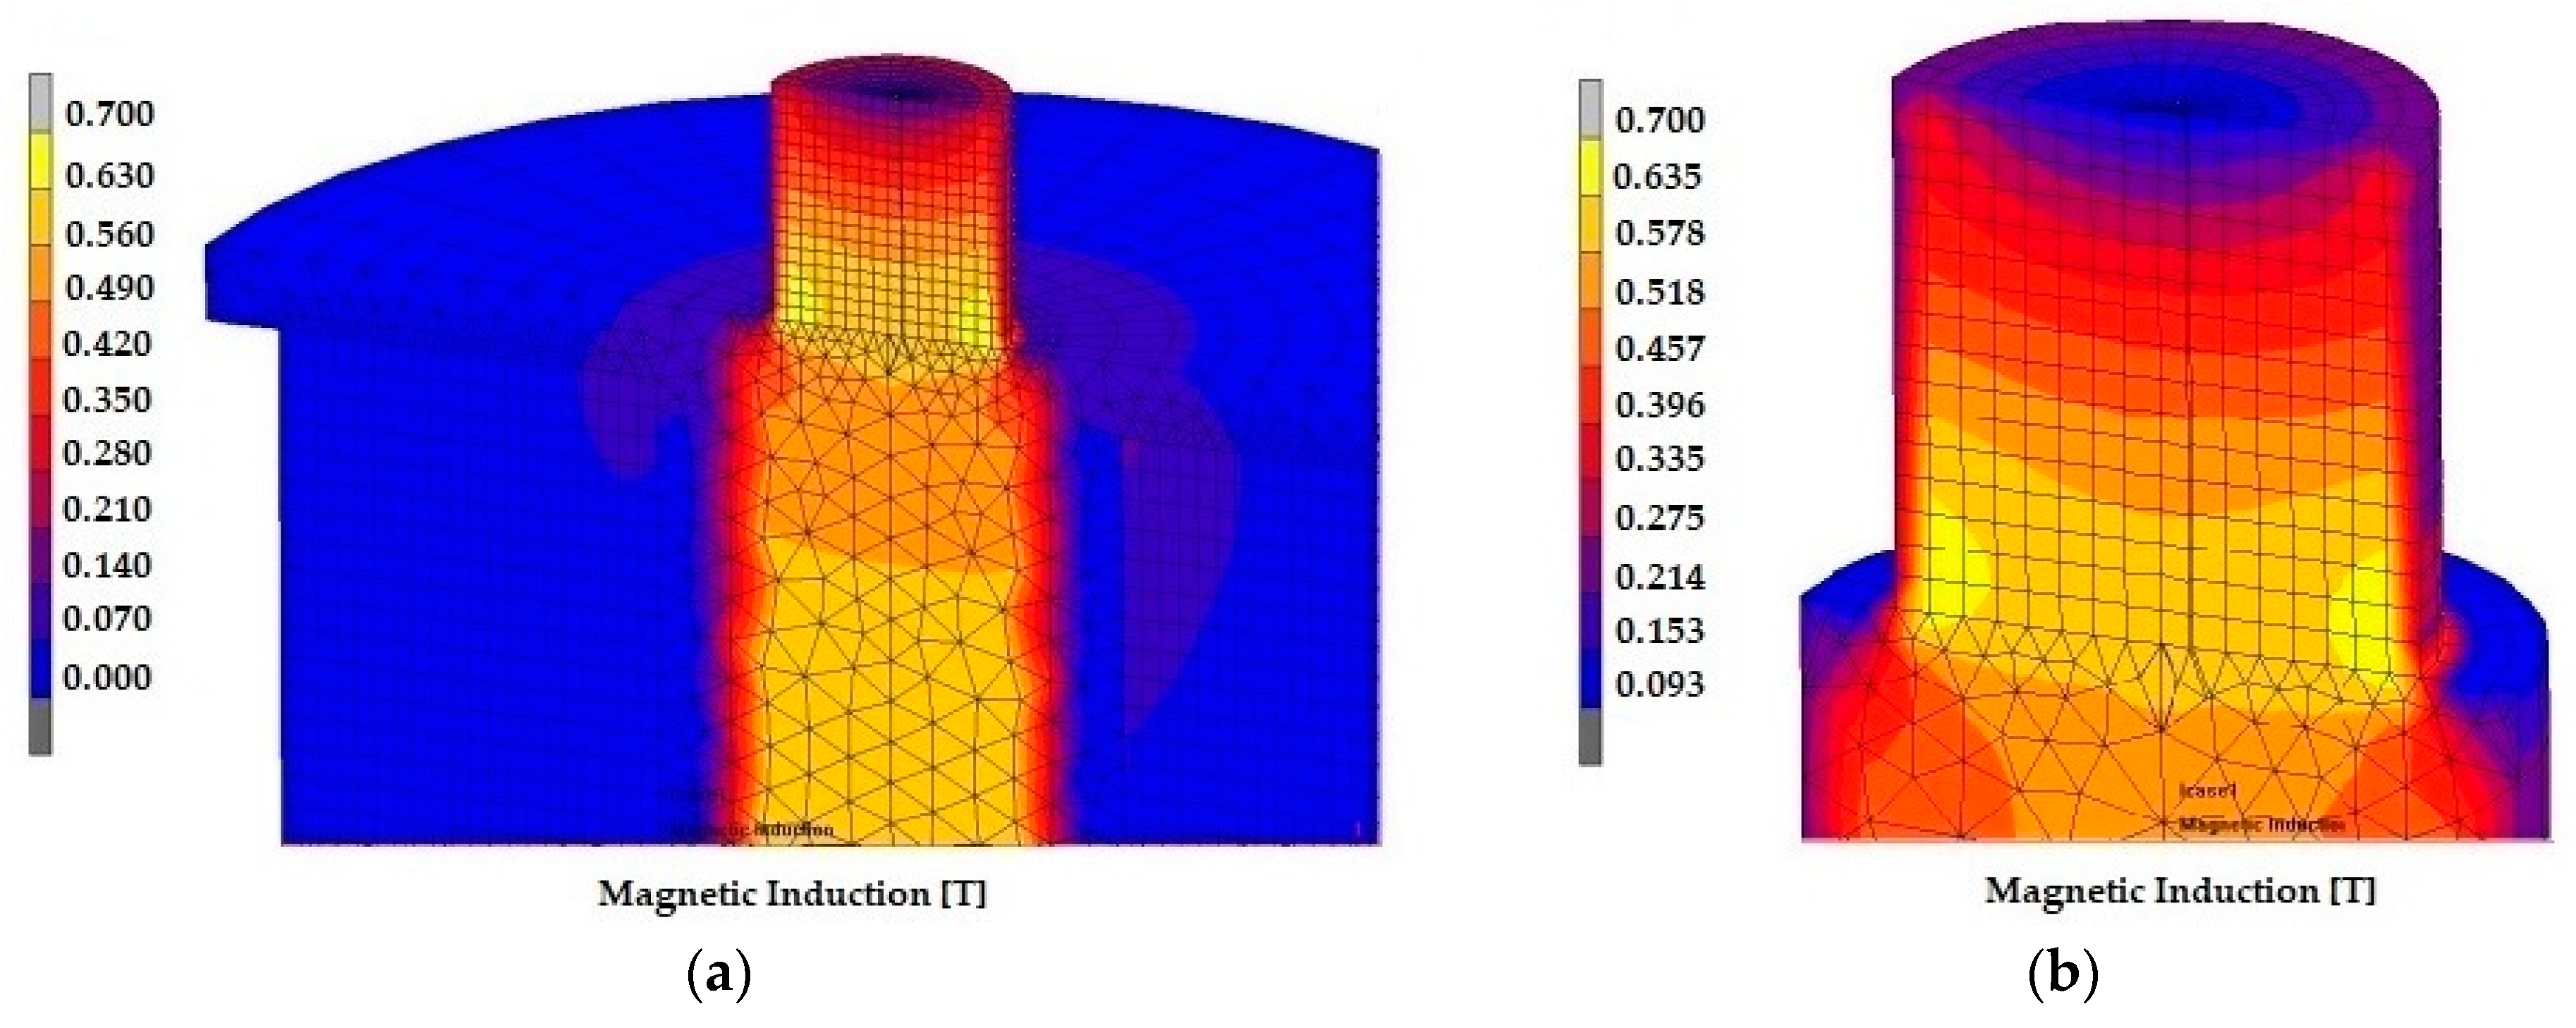
Figure 7.
Magnetic induction of the MRE sample in the presence of a magnetic field showing the distribution of magnetic lines force from the bottom to top layer considering the mesh size as boundary layer.
Figure 7.
Magnetic induction of the MRE sample in the presence of a magnetic field showing the distribution of magnetic lines force from the bottom to top layer considering the mesh size as boundary layer.
Figure 8.
Magnetic induction as a function of arc length from bottom, middle, and top positions in the MRE sample.
Figure 8.
Magnetic induction as a function of arc length from bottom, middle, and top positions in the MRE sample.
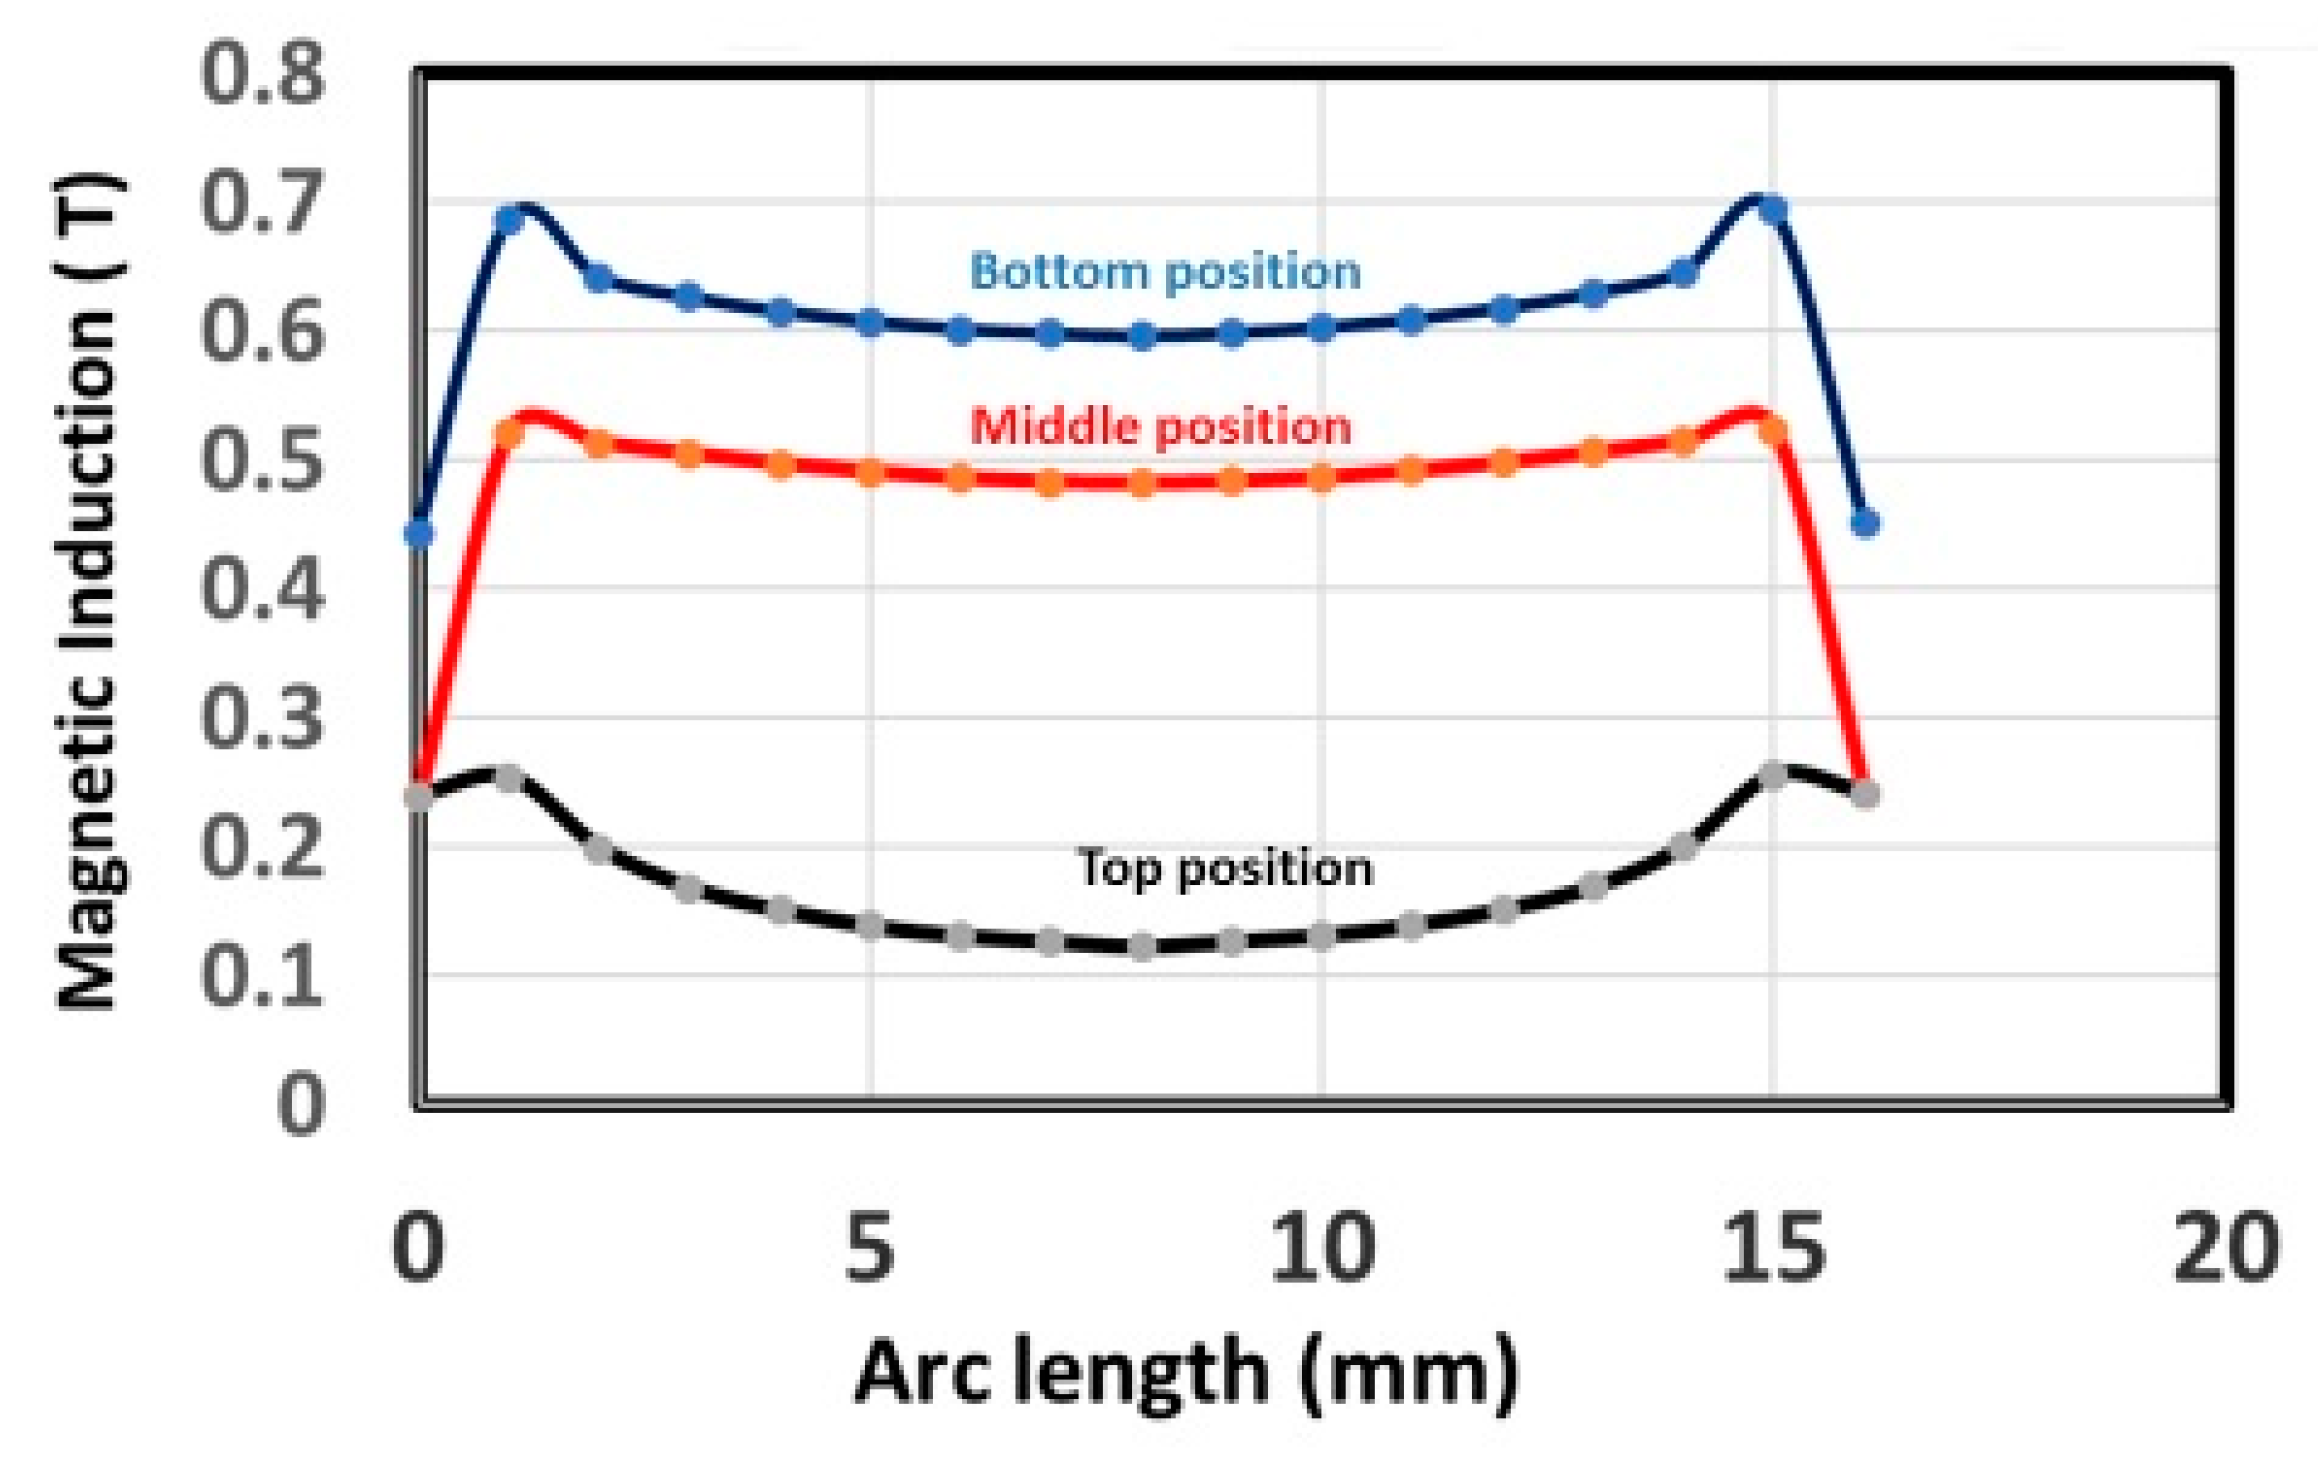
Figure 9.
Magnetic induction in the middle of the coil of the MRE sample from the coil position towards the sample.
Figure 9.
Magnetic induction in the middle of the coil of the MRE sample from the coil position towards the sample.
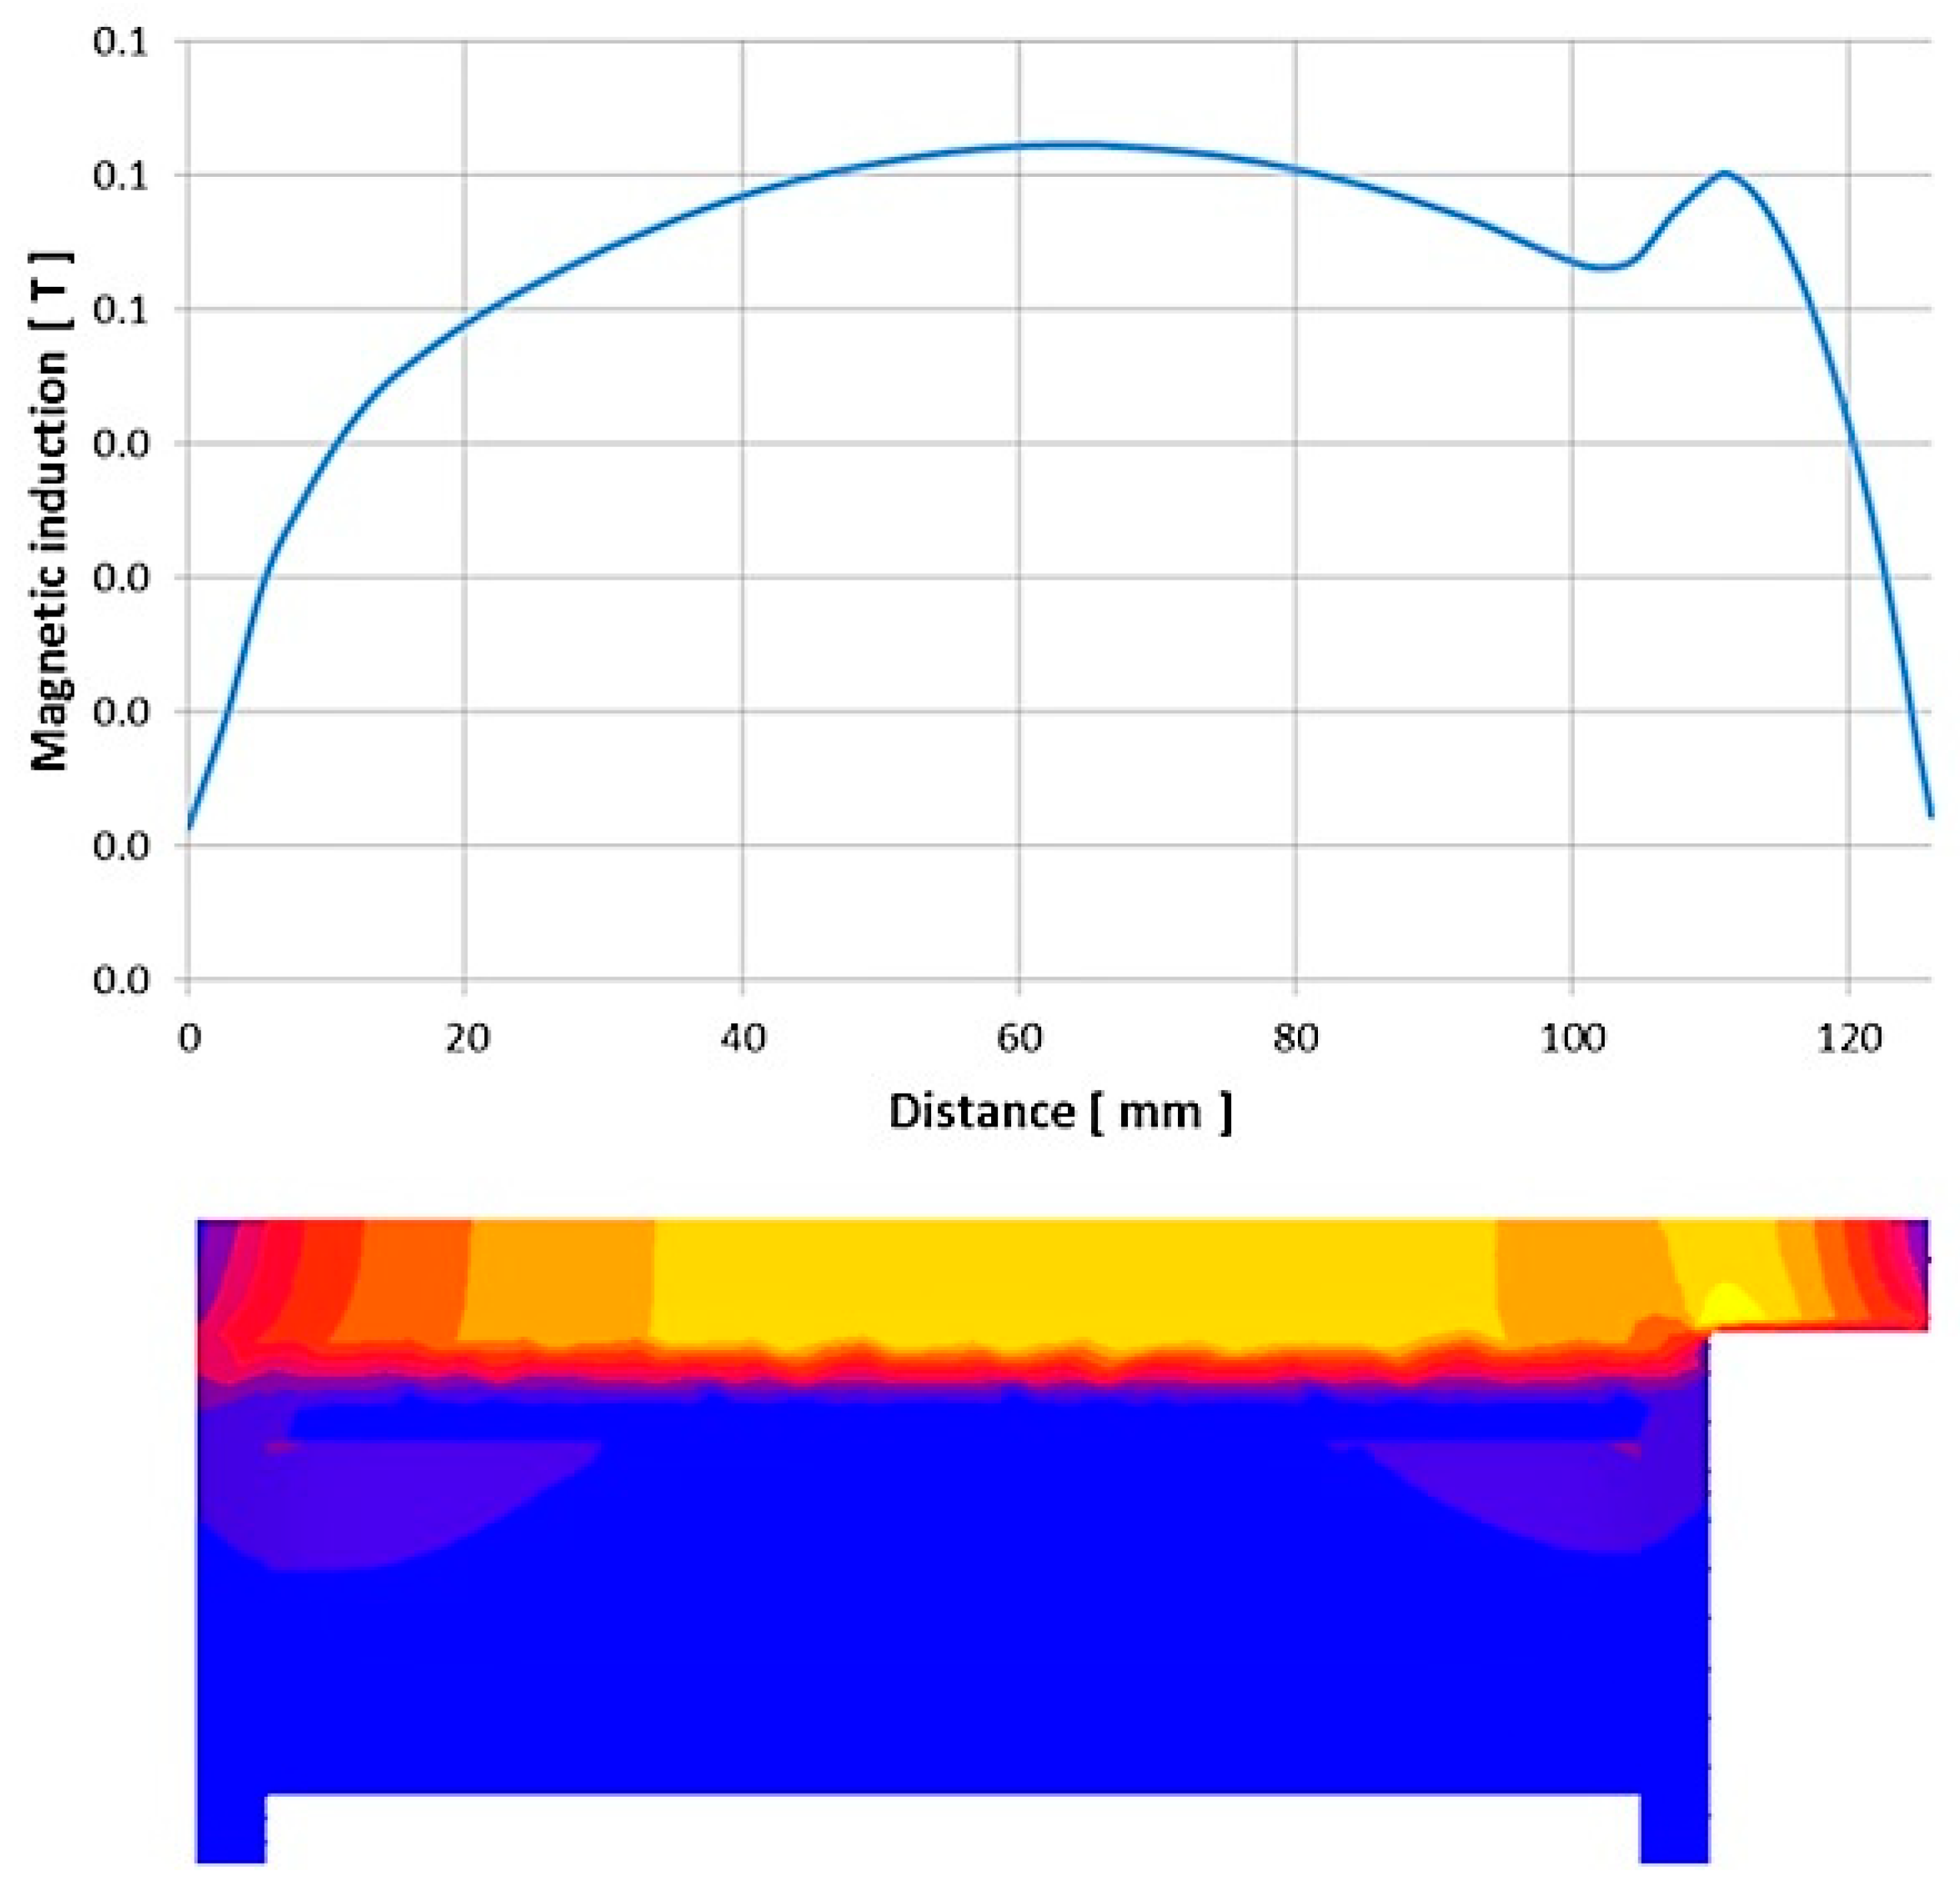
Figure 10.
(a,b) Microstructural image of elastomer matrix and (c,d) scanning electron microscopic image of isotropic distribution of filler particles within the matrix of the composite.
Figure 10.
(a,b) Microstructural image of elastomer matrix and (c,d) scanning electron microscopic image of isotropic distribution of filler particles within the matrix of the composite.
Figure 11.
(a–d) Self-assembled structure of iron particles (affine coupling, microscopic behavior) in MRE composite.
Figure 11.
(a–d) Self-assembled structure of iron particles (affine coupling, microscopic behavior) in MRE composite.
Figure 12.
Micro-computed tomography investigation of ZA 22 elastomer.
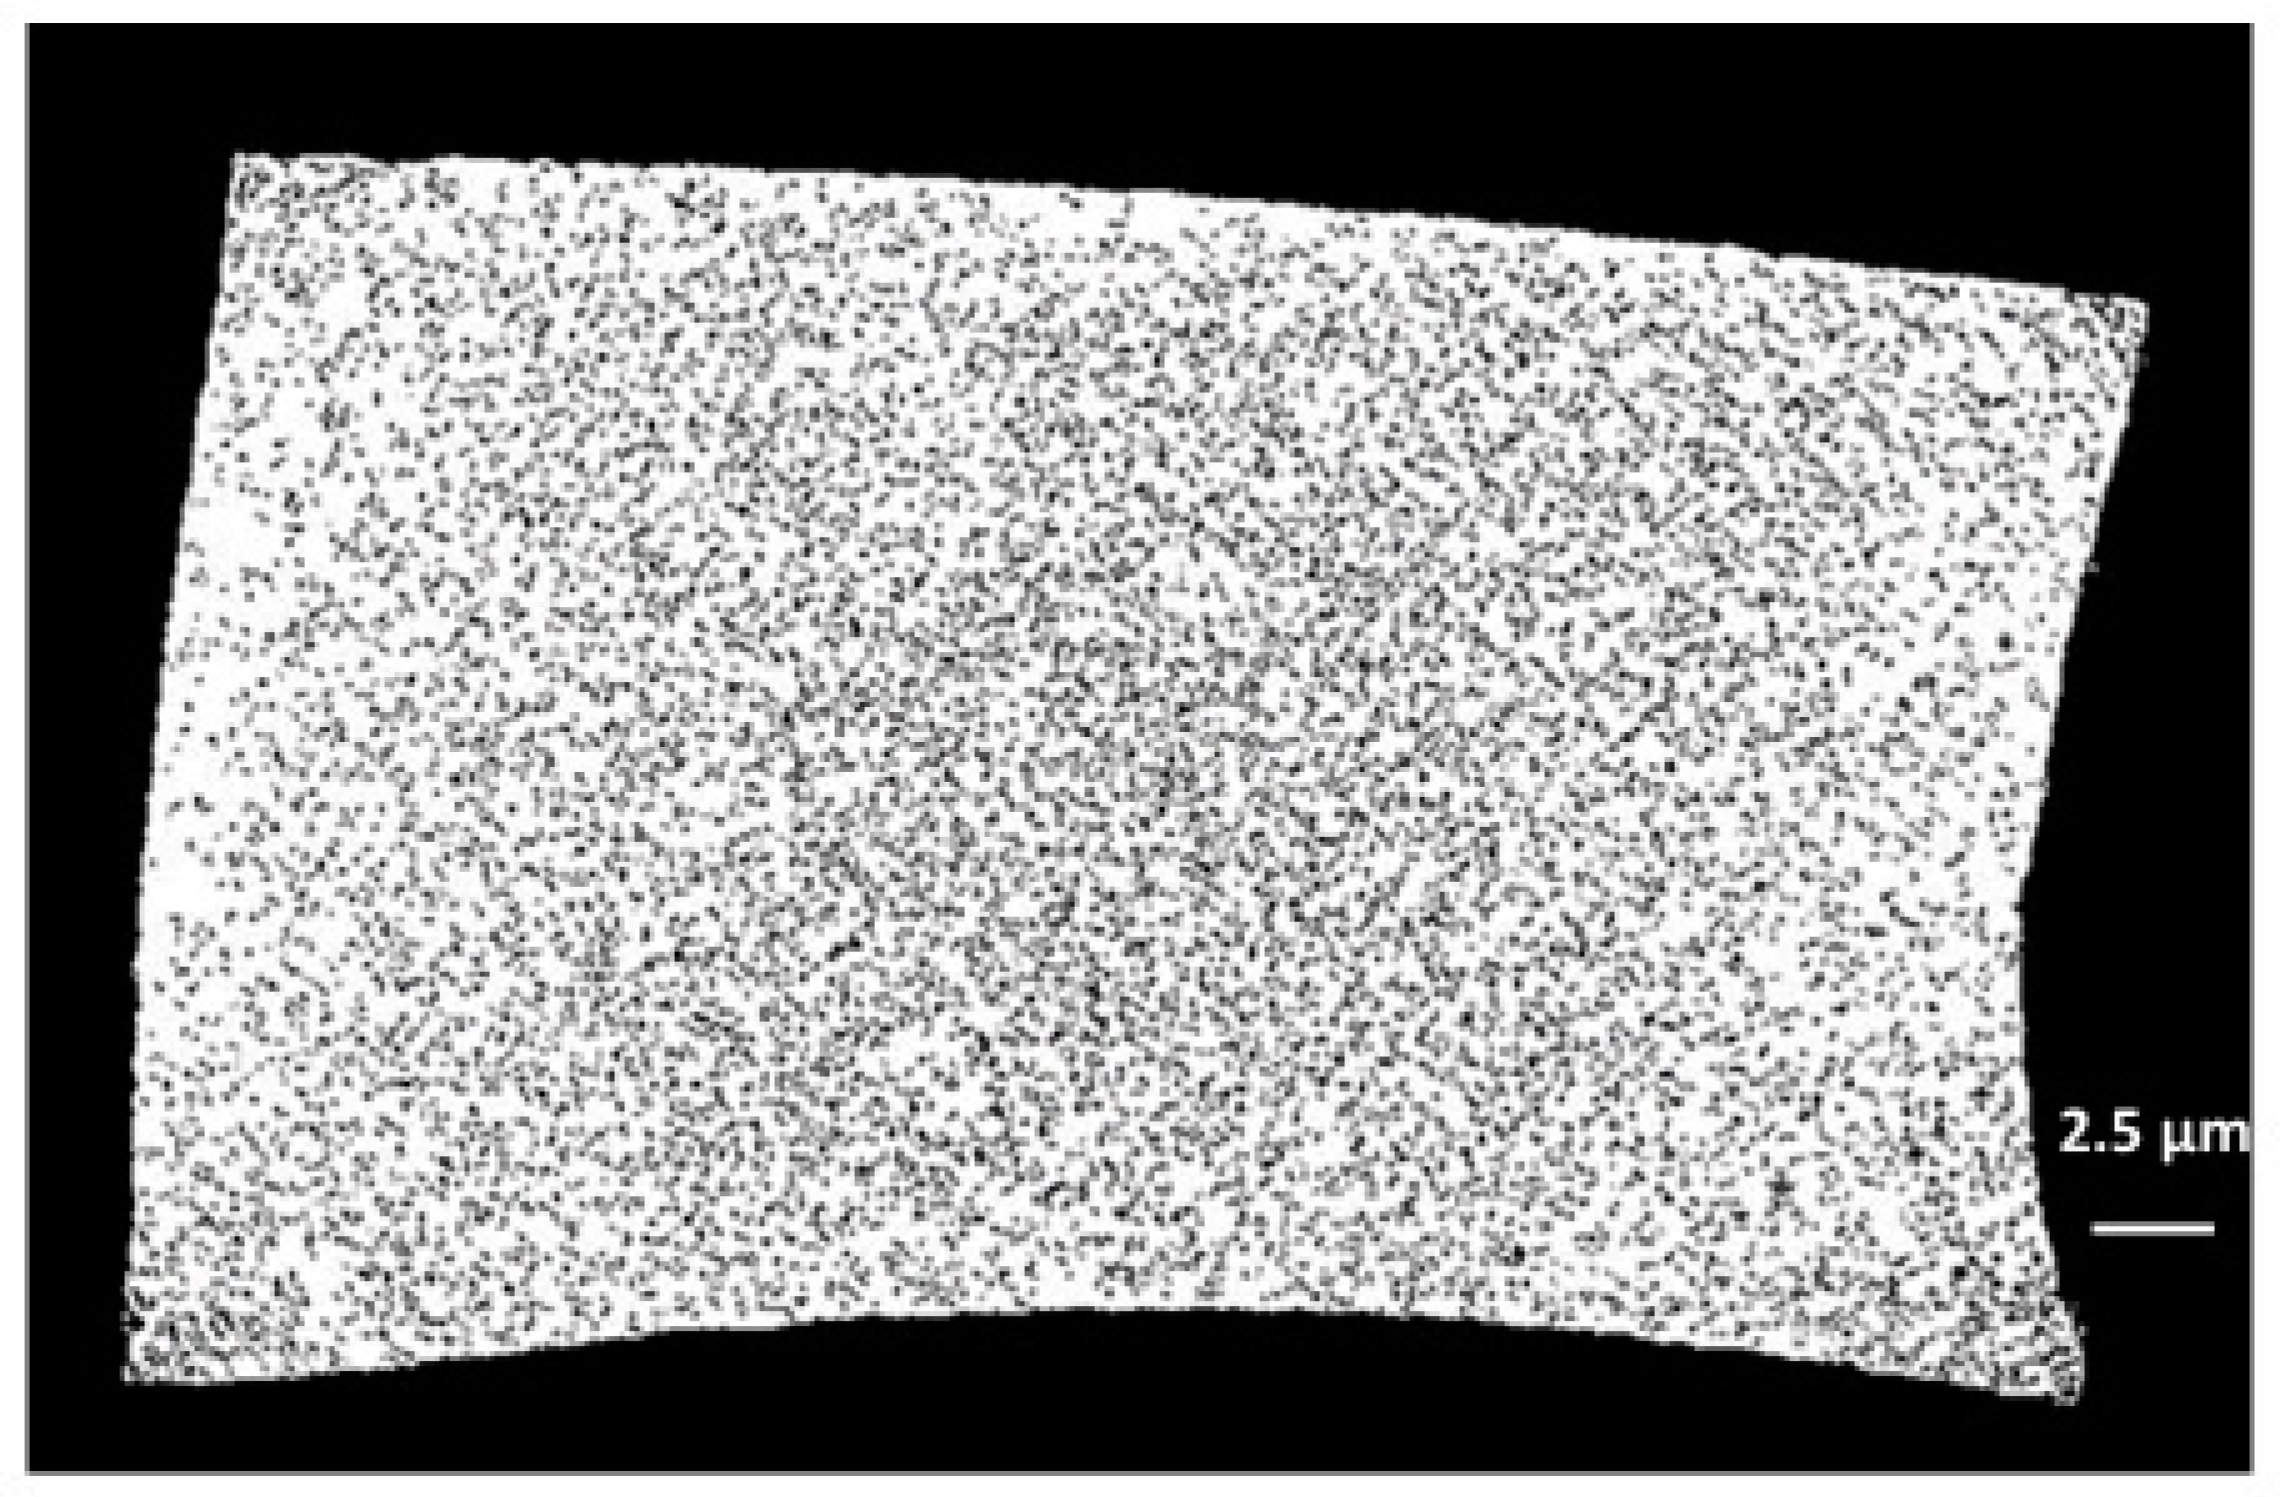
Figure 13.
Three-dimensional image of the MRE composite (ZA 22 as matrix) using micro-computed tomography (µCT).
Figure 13.
Three-dimensional image of the MRE composite (ZA 22 as matrix) using micro-computed tomography (µCT).
Figure 14.
µCT characterization of iron filler MRE composites at different orientation for MREs with matrices ZA 22 (a,b) and N1522 (c,d).
Figure 14.
µCT characterization of iron filler MRE composites at different orientation for MREs with matrices ZA 22 (a,b) and N1522 (c,d).
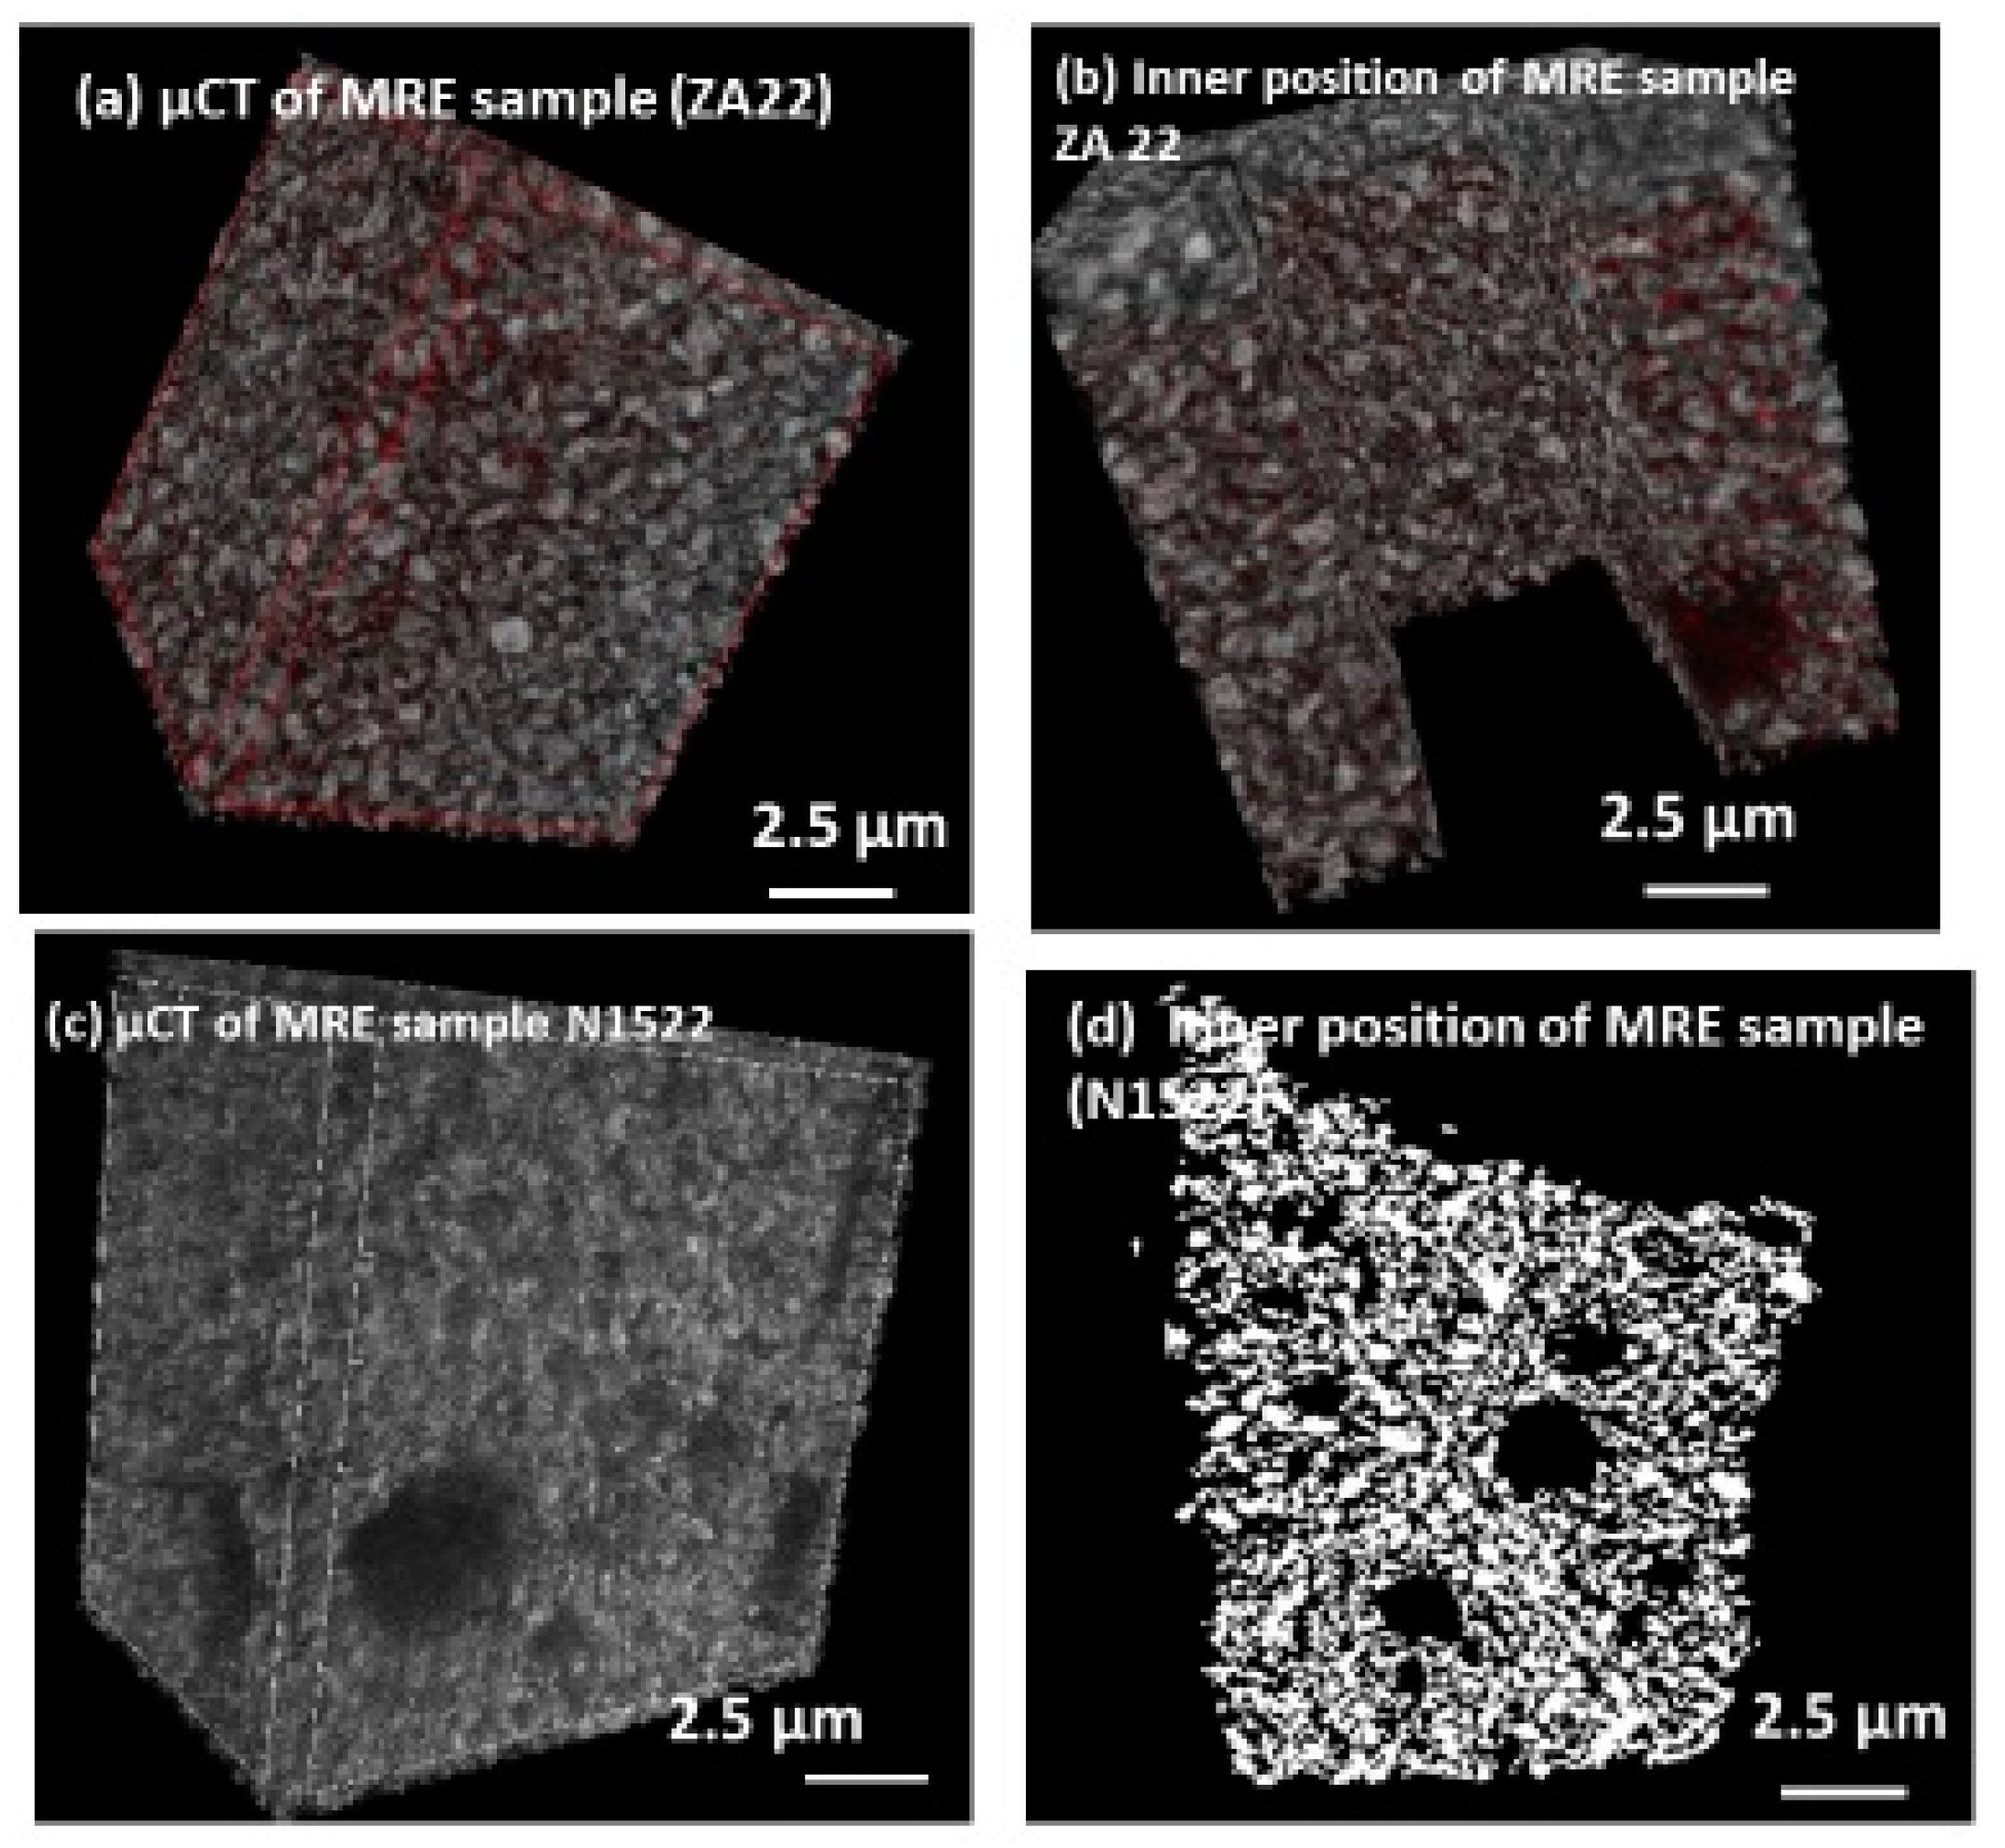
Figure 15.
MRE with iron particles distribution and some exceptions during fabrication.
Figure 16.
Dipole–dipole interaction of two filler particles on the various angles and position vectors on alignment of the z-axis for the coupling mechanism in the MRE sample.
Figure 16.
Dipole–dipole interaction of two filler particles on the various angles and position vectors on alignment of the z-axis for the coupling mechanism in the MRE sample.


Table 1.
Experimental observation of the magneto-rheological elastomer (MRE) sample with micro-computed tomography (µCT).
Table 1.
Experimental observation of the magneto-rheological elastomer (MRE) sample with micro-computed tomography (µCT).
| Number of Layers | 1101 |
| Total VOI Volume | 15.7 mm3 |
| Object Surface Obj.S | 1166.2 mm2 |
| Surface Convexity Index SCv.I | −314.3 mm−1 |
| Structure Separation St.Sp | 0.01 mm |
| Surface of Closed Pores Po.S(cl) | 57.3 mm2 |
| Total Volume of Pore Space Po.V(tot) | 2.7 mm3 |
| Lower Vertical Position | 0.1 mm |
| Object Volume | 12.9 mm3 |
| Intersection Surface i.S | 29.2 mm2 |
| Centroid (x) Crd.X | −0.3 mm |
| Number of Objects Obj.N | 2913 |
| Closed Porosity Po(cl) | 0.6% |
| Total Porosity Po(tot) | 17.4% |
| Upper Vertical Position | 2.3 mm |
| Object Volume Obj.V/TV | 82.5% |
| Object Surface/Volume Ratio Obj.S/Obj.V | 90.0 mm−1 |
| Centroid (y) Crd.Y | 0.02963 mm |
| Number of Closed Pores Po.N | (cl) 82215 |
| Volume of Open Pore Space Po.V (op) | 2.6 mm3 |
| Pixel Size | 2 µm |
| Total VOI Surface (TS) | 38.7 mm2 |
| Object Surface Density Obj.S/TV | 74.2 mm−1 |
| Centroid (z) Crd.Z | 1.2 mm |
| Volume of Closed Pores Po.V(cl) | 0.1 mm3 |
| Open Porosity Po(op) | 16.9% |
© 2018 by the authors. Licensee MDPI, Basel, Switzerland. This article is an open access article distributed under the terms and conditions of the Creative Commons Attribution (CC BY) license (http://creativecommons.org/licenses/by/4.0/).
Share and Cite
MDPI and ACS Style
Samal, S.; Kolinova, M.; Blanco, I. The Magneto-Mechanical Behavior of Active Components in Iron-Elastomer Composite. J. Compos. Sci. 2018, 2, 54. https://doi.org/10.3390/jcs2030054
AMA Style
Samal S, Kolinova M, Blanco I. The Magneto-Mechanical Behavior of Active Components in Iron-Elastomer Composite. Journal of Composites Science. 2018; 2(3):54. https://doi.org/10.3390/jcs2030054
Chicago/Turabian StyleSamal, Sneha, Marcela Kolinova, and Ignazio Blanco. 2018. "The Magneto-Mechanical Behavior of Active Components in Iron-Elastomer Composite" Journal of Composites Science 2, no. 3: 54. https://doi.org/10.3390/jcs2030054