1. Introduction and Related Research
Amongst all the economic sectors, manufacturing is of high importance to the world economy. Particularly, the automotive industry, which is the largest investor in R&D, plays a crucial role in this aspect, accounting for 25% of total R&D spending; it generates an 839 billion turnover which represents 6.9% of EU GDP. In addition, 5.3% of the EU workforce is employed in this sector [
1]. Almost 3 million of the world’s jobs in the automotive industry represent 10% of Europe’s manufacturing employment [
2].
The manufacturing of engine components is vital to automotive and other vehicle production. Customarily, the manufacturing of engines is performed in automated manufacturing lines (either in flexible manufacturing lines or transfer lines). Among all processes performed in a line, machining operations have a significant effect on the performance of the manufacturing system and on the quality of the final parts. Machining is the most predominant manufacturing process in terms of volume and expenditure; furthermore, it is critical for the manufacturing system of this sector. It has been estimated that 15% of the world’s mechanical component manufactured is derived from machining [
3]. In developed countries, the machining process expenditure contributes approximately 5% of the total GDP while, in the US alone, it contributes approximately
$250 B per year [
4]. The manufacturing industries strive to achieve either a minimum cost of production or a maximum production rate, or an optimum combination of both, along with better product quality in machining [
5]. In a competitive global manufacturing environment, it is necessary for every manufacturing company to optimize the machining parameters with respect to the manufacturing system’s performance indicators in order to increase the productivity, decrease cost and produce parts according to design specifications.
There are two main bodies of literature that are related to the present research. The first refers to studies of models that analyze the performance of the interaction (relationship) between machining process parameters and performance measures (operational parameters) of manufacturing systems, and the second refers to system dynamics applications for the modelling and analysis of manufacturing systems.
Machining is a process in which complex and nonlinear relationships between parameters are involved. The machining process is influenced by a number of input (independent) and output (dependent) variables. The machining process input variables include capacity, cutting tool material, workpiece material, speed, feed rate, depth of cut, etc. Cutting tool life, tool wear, tool wear rate, cutting forces, material removal rate, etc., are included in the machining process output variables. The cutting technology has grown substantially over time owing to the contribution of many branches of engineering with a common goal of achieving higher machining process efficiency. Practically, in many machining processes, parameters can be varied within a wide range. Nevertheless, in many cases, the typical correlations between these parameters and the performance measures are not fully understood [
3,
4].
In a multi-stage machining operation, the manufacturer seeks to set the process related controllable input variables at their optimal operating conditions with minimum effect of uncontrollable variables on the levels and variability in the outputs. To implement an effective process control for machining operation by parameter optimization, the performance measures between production rate and cost at each stage of operation should be balanced to improve delivery [
6,
7].
Simulation and modelling are the commonly used techniques in modern manufacturing that help the process planners in reducing their efforts in selecting and optimizing machining parameters for analyzing and understanding the dynamics behavior of manufacturing systems. The use of simulation technology for analyzing the interaction of machine tool elastic structure and the cutting process is a big challenge. This is due to the fact that a large variety of phenomena exist, and they have to be modelled in great detail for the specific problems [
8]. Much research has focused on calculating and predicting the fundamental cutting conditions; however, understanding the interaction between the cutting process parameters and the performance measures is not a trivial task, and it is an active research area [
9]. Brecher et al. [
9] described the importance of studying the interaction of machine parameters and process parameters and summarized the available modelling techniques for process and machine interactions.
Most previous research work has been done on numerical and analytical modelling of cutting process [
10,
11,
12,
13]. After determining the appropriate physical data, R.W. Ivester, et al. predicted the effect of changes in cutting conditions on decision criteria (performance criteria) (wear rate/tool life, surface quality, etc.) [
4]. At the beginning of the 1990s, Teitenberg et al. [
14] proposed an analytical model to predict tool-life/tool-wear during milling operations. Kannan et al. presented an analytical model for the prediction of tool flank wear progression during orthogonal machining of aluminium-based metal matrix composites (MMCs) [
15]. Yen et al. proposed a model using FEM (Finite Element Method) simulation to estimate tool wear of carbide tools in orthogonal cutting [
16]. Recently Attanasio et al. developed FEM-based simulation for forecasting tool wear progression during turning operations [
17]. Moreover, Zel et al. implemented a similar FEM strategy and methodology to predict tool wear in turning operations in terms of crater depth and position [
18].
Ribeiro et al. (2017) [
19] studied the influence of each cutting parameter of feed, the depth of cut and the speed on surface roughness individually by applying an analysis of variance (ANOVA). Nalbant et al. (2007) [
20], Hasçahk and Çaydas (2008) [
21], Ribeiro et al. (2017) [
22] used the Taguchi-based method to study the machining process in order to optimize the most controllable parameters, like feed rate, cutting speed and depth of cut. Britz and Ulbrich [
23] carried out a coupled simulation of rigid and flexible multi-body machine structure models and process, and the process force was calculated by using the model.
In their work, Pang et al. [
24] introduced the application of Taguchi optimization method to optimize the machining parameters of an end milling process. The depth of cut, cutting speed and feed rate were chosen to be evaluated to measure the surface roughness and the cutting force. The coupling of the modelling of processes and machines for different grinding kinematics were described by Aurich et al. [
25]. Multiple modelling techniques, such as analytical methods, the finite element method, the Taguchi method boundary element method, and the multi body simulation method have been used to model the complex relationship between process and machine parameters through the prediction of forces, surface integrity, energy, and temperature. However, the interaction of the machining process parameters and performance measures in the manufacturing system and the consequences of machine life (age effect, maintenance, etc.) itself have not been considered in any of these works. In their work, Yang et al. [
26] used discrete element simulation to analyze orthogonal cutting with different cutting conditions; the results of cutting force and surface cracks were studied.
Discrete event simulation (DES) is the most popular approach for simulation models of manufacturing systems [
27]. It has been employed to understand and assess the impact of decisions made on the production system, including its various functional areas. DES support the engineer and decision maker to analyze each individual operation and evaluate and improve manufacturing processes and to make decisions at an early stage of implementation [
28]. Kibira et al. (2009) [
29] stated that, typically, DES is done to address a particular set of problems, and it does some ‘what if’ analyses, in which the effect of different options can be investigated. Smith, J. S. (2003) reviewed the literature on the use of DES for manufacturing system design and operation problems [
30]. Caggiano, A., and Teti, R. (2018) applied DES to analyze the different manufacturing cell production strategies. DES was also employed to improve the performance of manufacturing systems in terms of throughput time, productivity, energy efficiency and resource utilization [
31,
32]. Application of DES can sometimes be unnecessarily complex and time consuming [
33].
System Dynamics (SD) is a method for studying the world around us. It is used to study objects as a whole to understand how they interact with each other as part of a system, instead of studying each object separately [
34]. In complex environments, like a manufacturing system, objects often create feedback loops, where a change in one parameter affects the others dynamically, which feeds back to the original object, and so on. The interplay among objects determines the different states that the system can assume over the course of time, which is known as the dynamic behavior of the system [
35]. The dynamic complexity of the system arises not from the number of system components, but from the combination of interactions among system elements over time [
36,
37]. The principles of SD in manufacturing systems and how this differs from DES and applications of SD in manufacturing system modelling has been well explored [
38].
2. System Dynamics and Its Application for Modelling and Analysis of Manufacturing Systems
The manufacturing of complex products requires the machining and assembly of many components. Most real-world problems are too complex to be formulated by mathematical equations [
39]; therefore, a simulation approach for analyzing and optimizing a given system structure is required. The main advantages of simulation arise from the better understanding of interactions and identification of potential difficulties that simulation offers, allowing the evaluation of different alternatives and therefore, reducing the number of changes in the final system [
33]. In a variety of different situations, SD shows up similar patterns of behavior. This is one of the reasons why SD is considered the most powerful of this type of problem solving method.
The work conducted by Baines and Harrison [
40] demonstrated that SD has typical performance characteristics when considering strategic issues in manufacturing companies. SD has been applied to a wide range of problems. In the manufacturing industry, it is applied to analyze, evaluate and modify strategy and policy issues and to make decisions relevant to the dynamic environment of the market. SD has been widely used to understand system structure and its behavior over different time spans and to spot difficulties within a system. It has been successfully applied to a range of industrial management problems, like inventory management, logistic and supply chain management, production planning and control, demand forecasting and capacity expansion, human resource management, etc. [
41].
Helo presented a SD model for strategic scenarios analysis and polices for the supply chain operations in manufacturing systems [
42]. Oyarbide et al. [
33] investigated the application of SD in the transfer line modelling task. Deif and ElMaraghy analyzed the concept of capacity management of the different performance measures of the manufacturing system using a SD approach under conditions of unanticipated demand fluctuations [
43]. Shooshtarian and Jones used SD simulation modelling for the analysis of production line systems for the continuous model of transfer lines with unreliable machines and finite buffer stock in the system [
44].
Until now, the majority of the work done for the application of SD in manufacturing systems has focused mainly on performance analysis of the supply chain. This work has mainly considered how systems are designed to respond to unexpected customer demand, considering certain performance measures of the supply chain [
34,
45,
46,
47]. Parnaby outlined a conceptualized SD model to manufacturing systems [
48]. A manufacturing system application of SD was used by Byrne and Roberts (1994) to evaluate manufacturing performance in a Kanban-based system [
49]. Until recently, in the reviewed technical literature, to the authors’ knowledge, there has been no definite holistic approach available for the performance analysis of manufacturing systems that considers the interaction of machine tool elastic structure, and the process and operational parameters of a manufacturing system, while developing models for the machining processes. However, a highly automated manufacturing environment requires a powerful strategy for the control of process chain and material flow.
Most industries use the knowledge of experienced machine operators and programmers [
4] to predict and control the effects of the variation of process parameters on overall manufacturing system behavior. However, this process is expensive and time consuming [
4]. Thus, one of the main motivations for this research work is to develop a generic framework for manufacturing systems that considers the complex interaction of manufacturing system parameters. As a consequence, development of an appropriate evaluation tool and a sustainable framework applicable for this strategy is needed. A methodology that considers the various combinations of manufacturing system parameters and their interactions and that can also predict, optimize and analysise the outcomes of a process with respect to the performance criteria selected is required.
Manufacturing system modelling is a complex problem due to the presence of multiple decision makers, the complexity of the parts produced, demand fluctuation, continuous development of workpiece materials, technology limitations, unavailability of defined methodology and various kinds of delays. In this paper, a SD simulation and modelling approach is presented to formulate the structure and interrelationships between parameters for the machining process of an engine block. In reality, minor fluctuations in the system’s initial parameters can cause significant long-term variations, which, in turn, have a significant effect on a machining system’s behavior. This problem is analyzed using a SD approach. To figure out the defined problem, the present methodology studies the system as a whole rather than using an analytical approach which breaks down the problem into smaller parts. Analyzing the structure of the system as a whole makes it possible to identify the non-linear causal relationships among the system parameters and to understand the structure of the complex system [
35,
39].
Objectives and Outline of the Paper
In this paper, a conceptual framework for the manufacturing system of an engine block machining is developed. As a case study, a model for a boring process—one of the critical operations for the engine block machining process—is presented. This can be used as a reference model and is able to represent the relationships between manufacturing system parameters, the machine elastic structure and the selected performance measures. A flexible machine tool (FMC) is considered for the analysis.
The remainder of the paper is organized as follows:
Section 3 defines some of the terms and terminology used in this paper according to the context. In
Section 4, the manufacturing system process modelling is described. The basic concept of the proposed methodology, the scope of modelling and the parameters of manufacturing systems are included in this section.
Section 5 describes the analysis and discussions. In
Section 6, results are presented. Finally, conclusions and considerations for future research are provided in
Section 7.
4. Manufacturing System Process Modelling
4.1. Engine Block Machining Process Overview
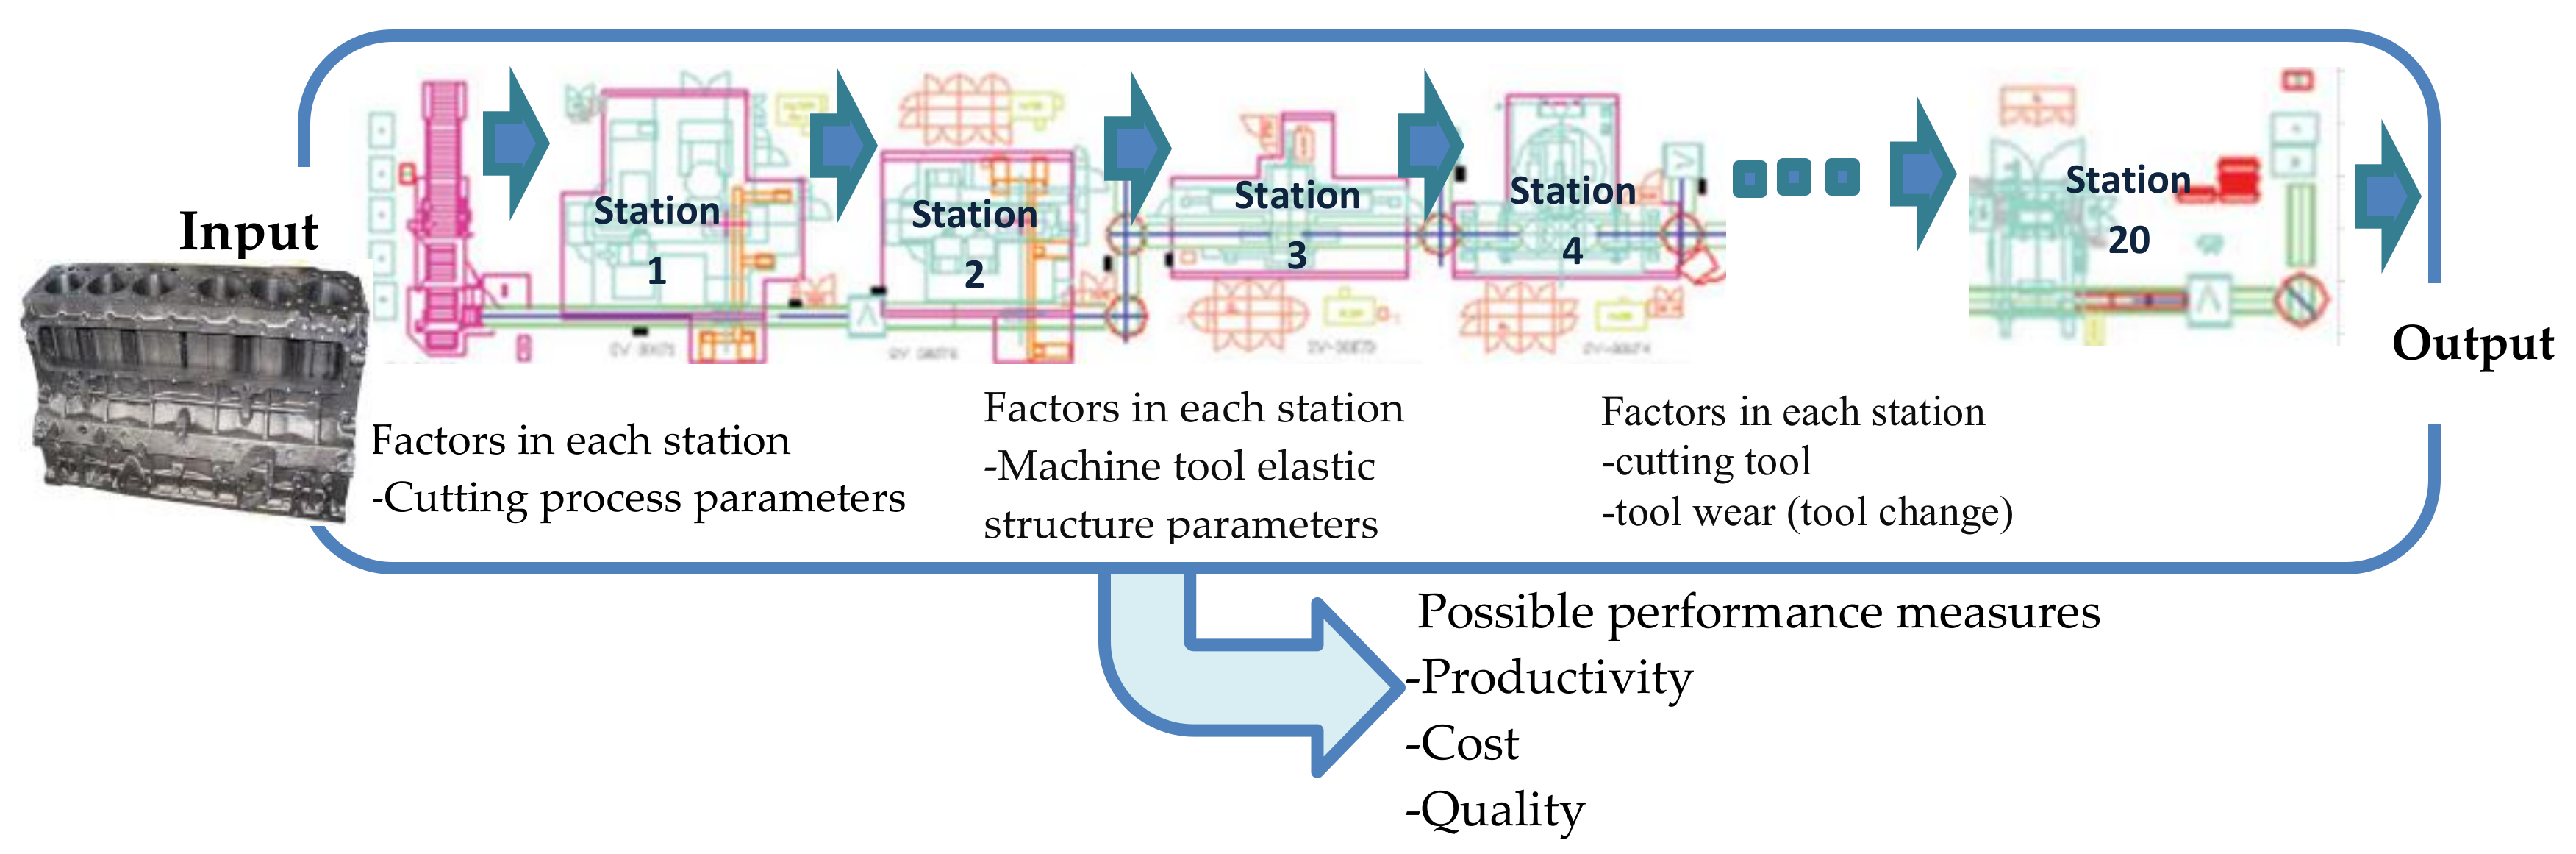
An engine block has thousands of machined parts (features). Machining of the engine block requires a number of different machining operations and passes through around 20 processing stations in the manufacturing line. More than one machining operation can be conducted at each station. To evaluate and analyze the entire machining process, two possible ways/levels of evaluation technique are proposed—the system level and the process level. The choice is based on suitability in the area of application.
4.1.1. System Level Analysis
In system level analysis, all sequences of operations in the manufacturing line are hidden inside black boxes (
Figure 1). The strategy for this level of analysis ignores the internal mechanism (process) of each station and focuses solely on the output of parts in response to selected inputs and execution conditions. As input parameters, only the workpiece property specifications from the foundry and the control factors from the external environment are considered. In general, this level of analysis does not concern how the inner detail process of each station is produced to achieve the desired output.
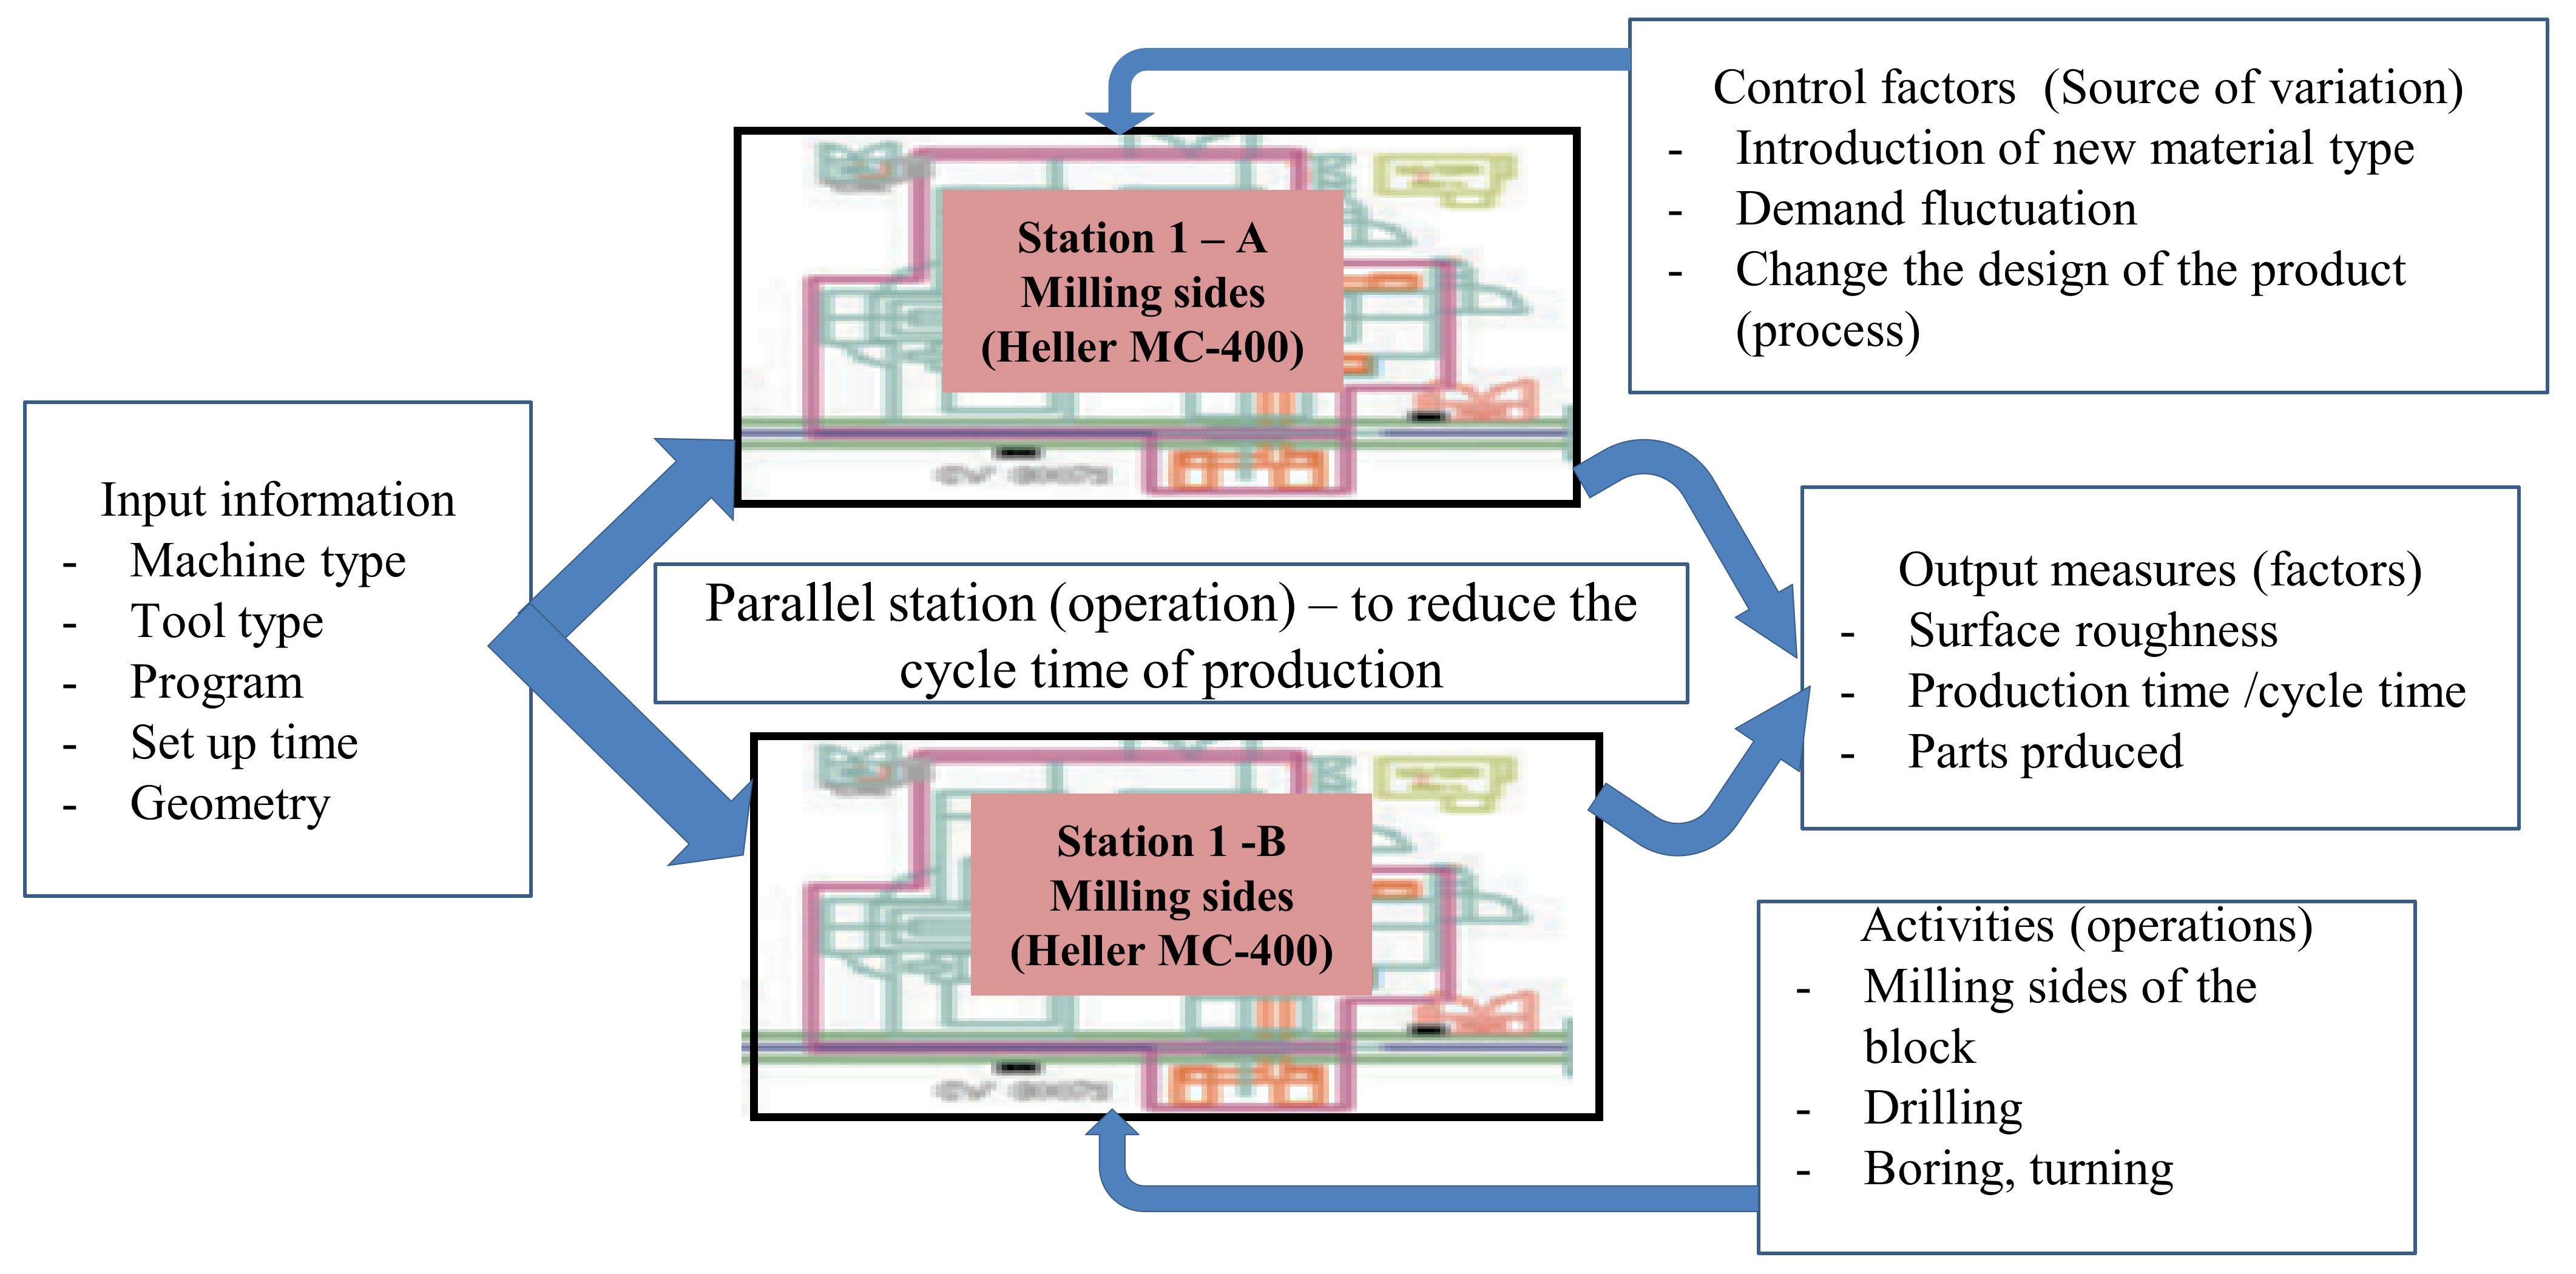
4.1.2. Process Level Analysis
In process level analysis, each station in the manufacturing line is accounted for independently, unlike in system level analysis. It is a detailed process level analysis that considers almost all of the factors at each station. To analyze the output of the part produced, each station’s input parameters, the control factors, the interaction of process parameters and other activities are taken into consideration (see
Figure 2).
Figure 2 describes the machining process of some features at a station (station 1 from
Figure 1 is taken as an example). The parallel machines in this given station, which are identical and function in exactly similar operations, indicate the possibility of adding a machine in order to cut the cycle time by half.
To evaluate the machining process for the entire manufacturing system, the working conditions of each station is analyzed independently, like in process level analysis, consequently combining and placing them in a green box. In this paper, the process for one station, boring operations, will be studied and analyzed using process level analysis.
4.2. Machining Process Parameters
Boring is one of the most common metal cutting operations for engine block machining and will be accounted for in this paper. It is characterized by its kinematics, productivity and dynamics. Productivity and kinematics parameters include the cutting speed, spindle speed, cutter diameter, number of teeth (inserts) in the cutter, feed per tooth, feed rate, depth of cut, number of inserts in the cut, chip thickness, feed rate adjustment, cross sectional area of uncut chips, metal removal rate, machining time, etc. The parameters of process dynamics include the tangential cutting force, torque, the machining power at the cutter and the machining power at the motor. Some of the many features in engine block machining that control the boring operation include the crankshaft bore for roughing and finishing operation, the camshaft bore for roughing and finishing operation, cylinder bores, etc.
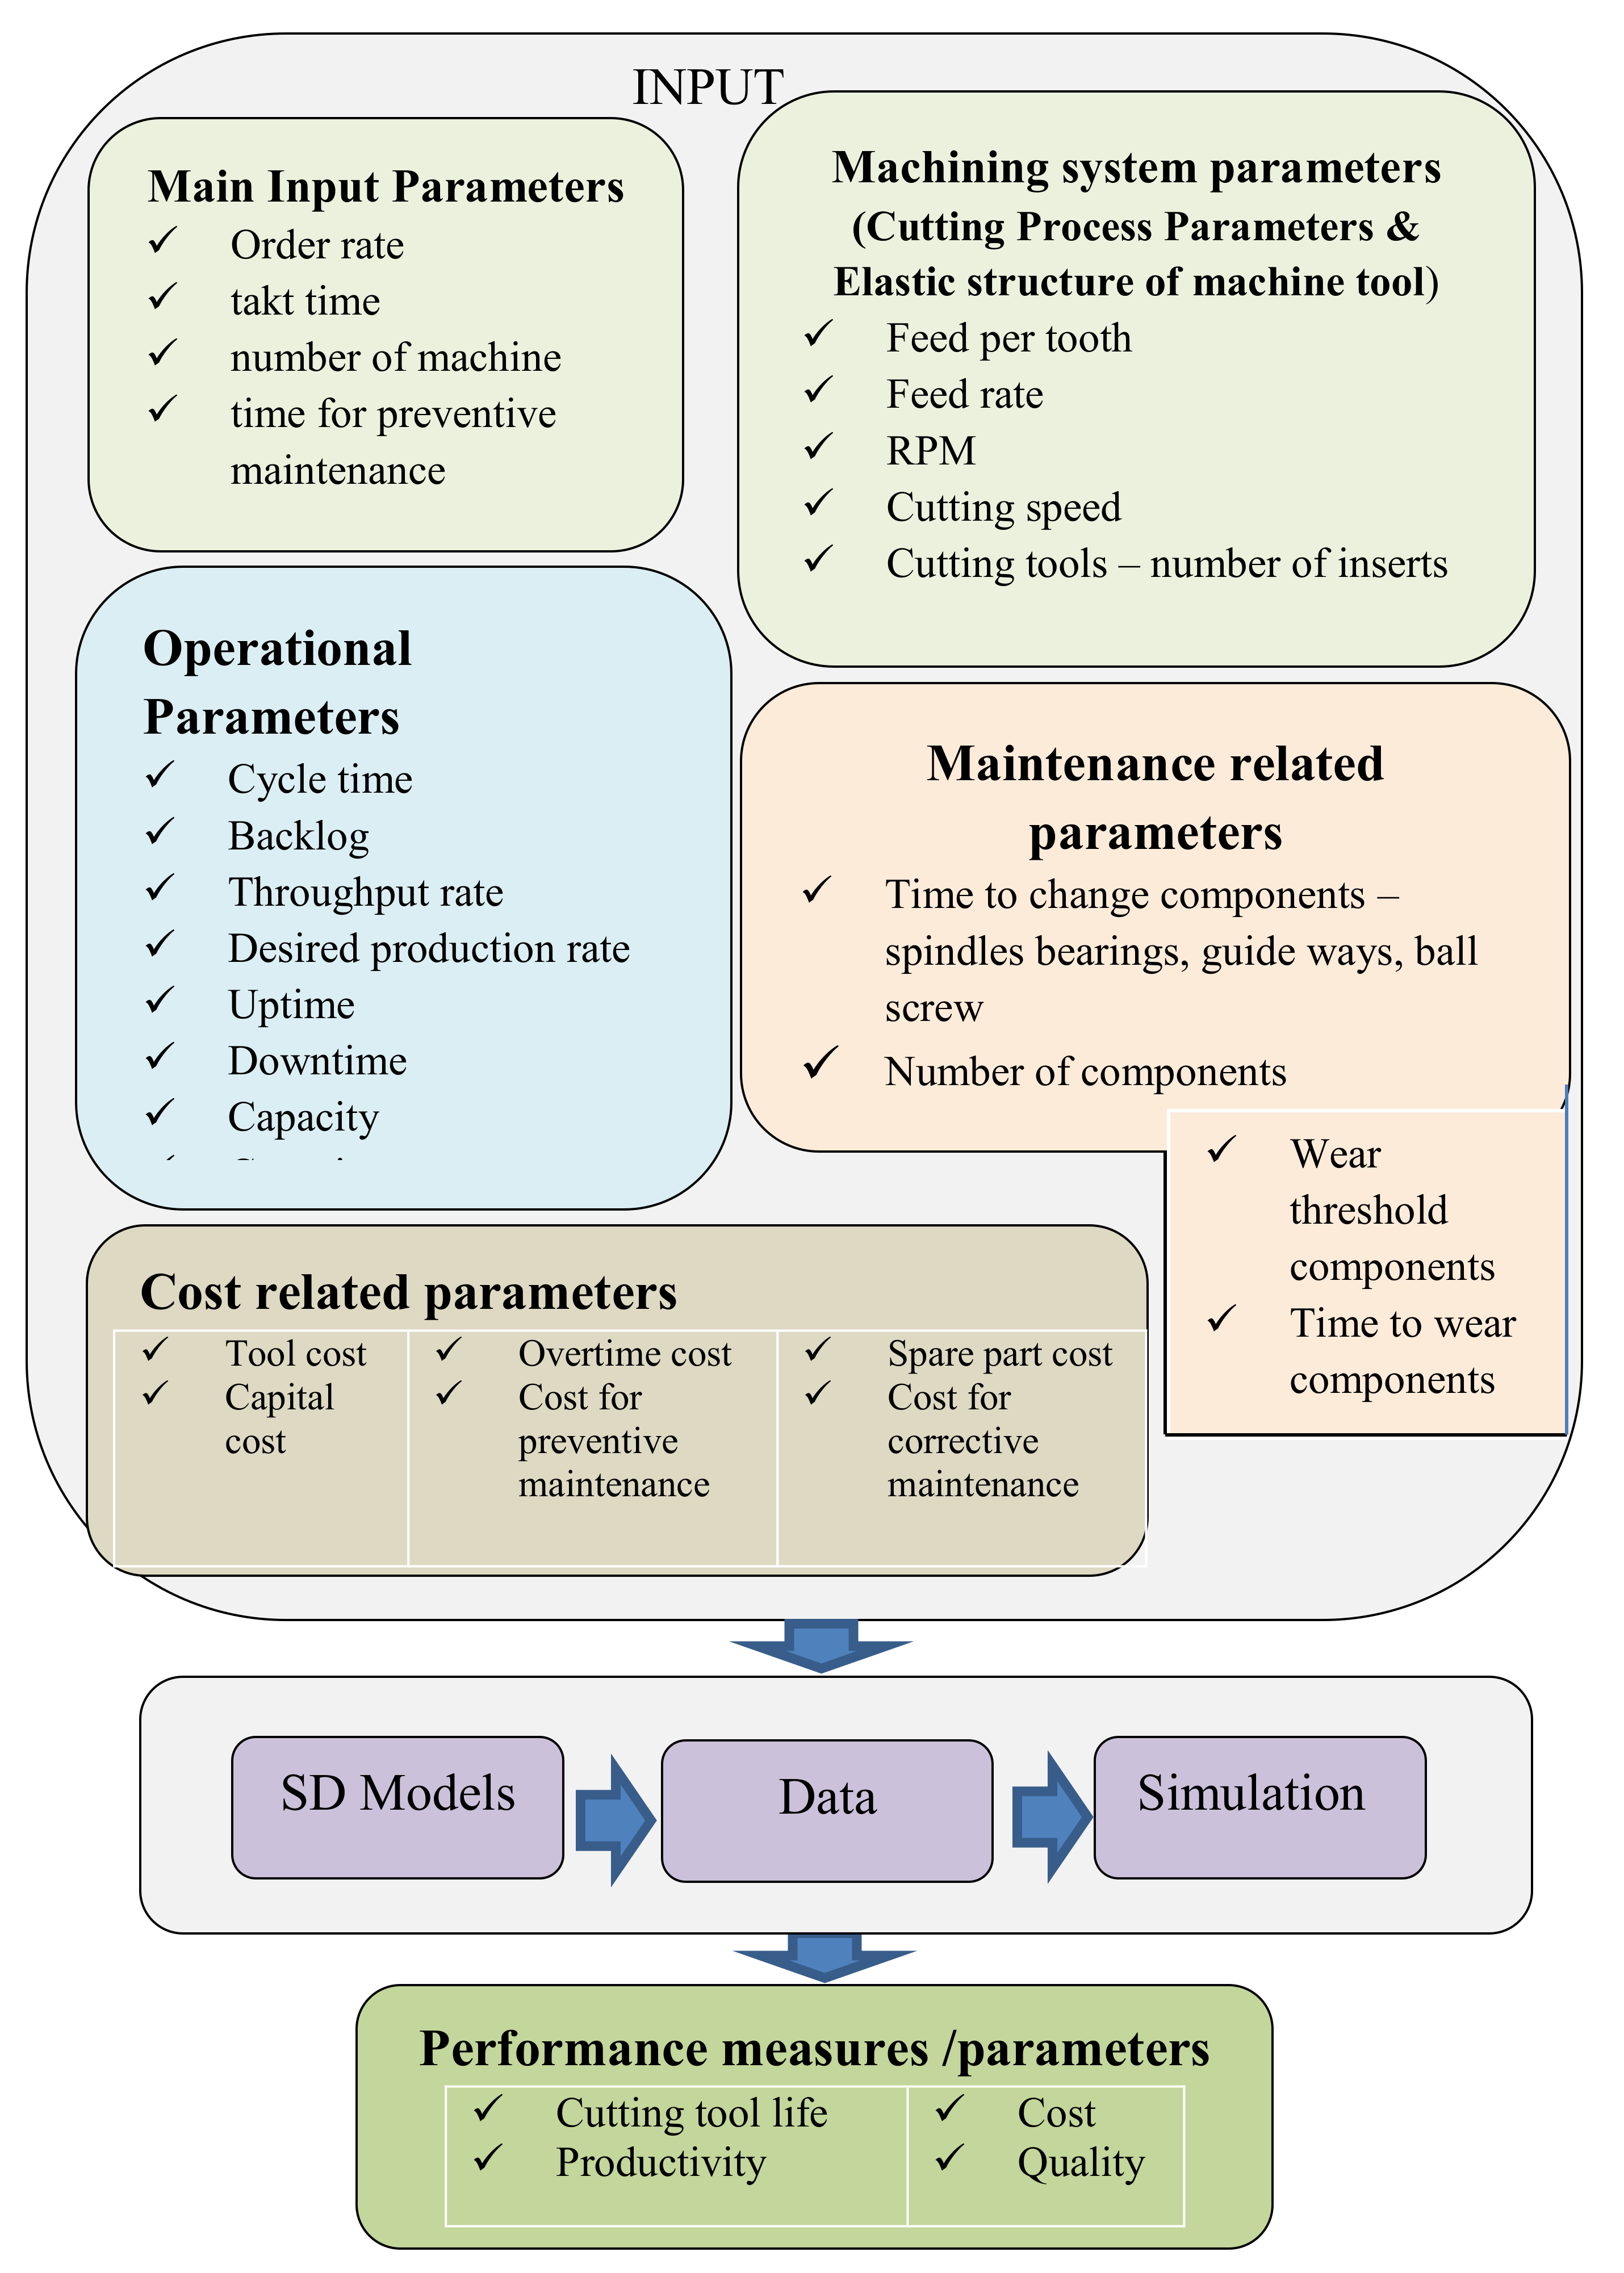
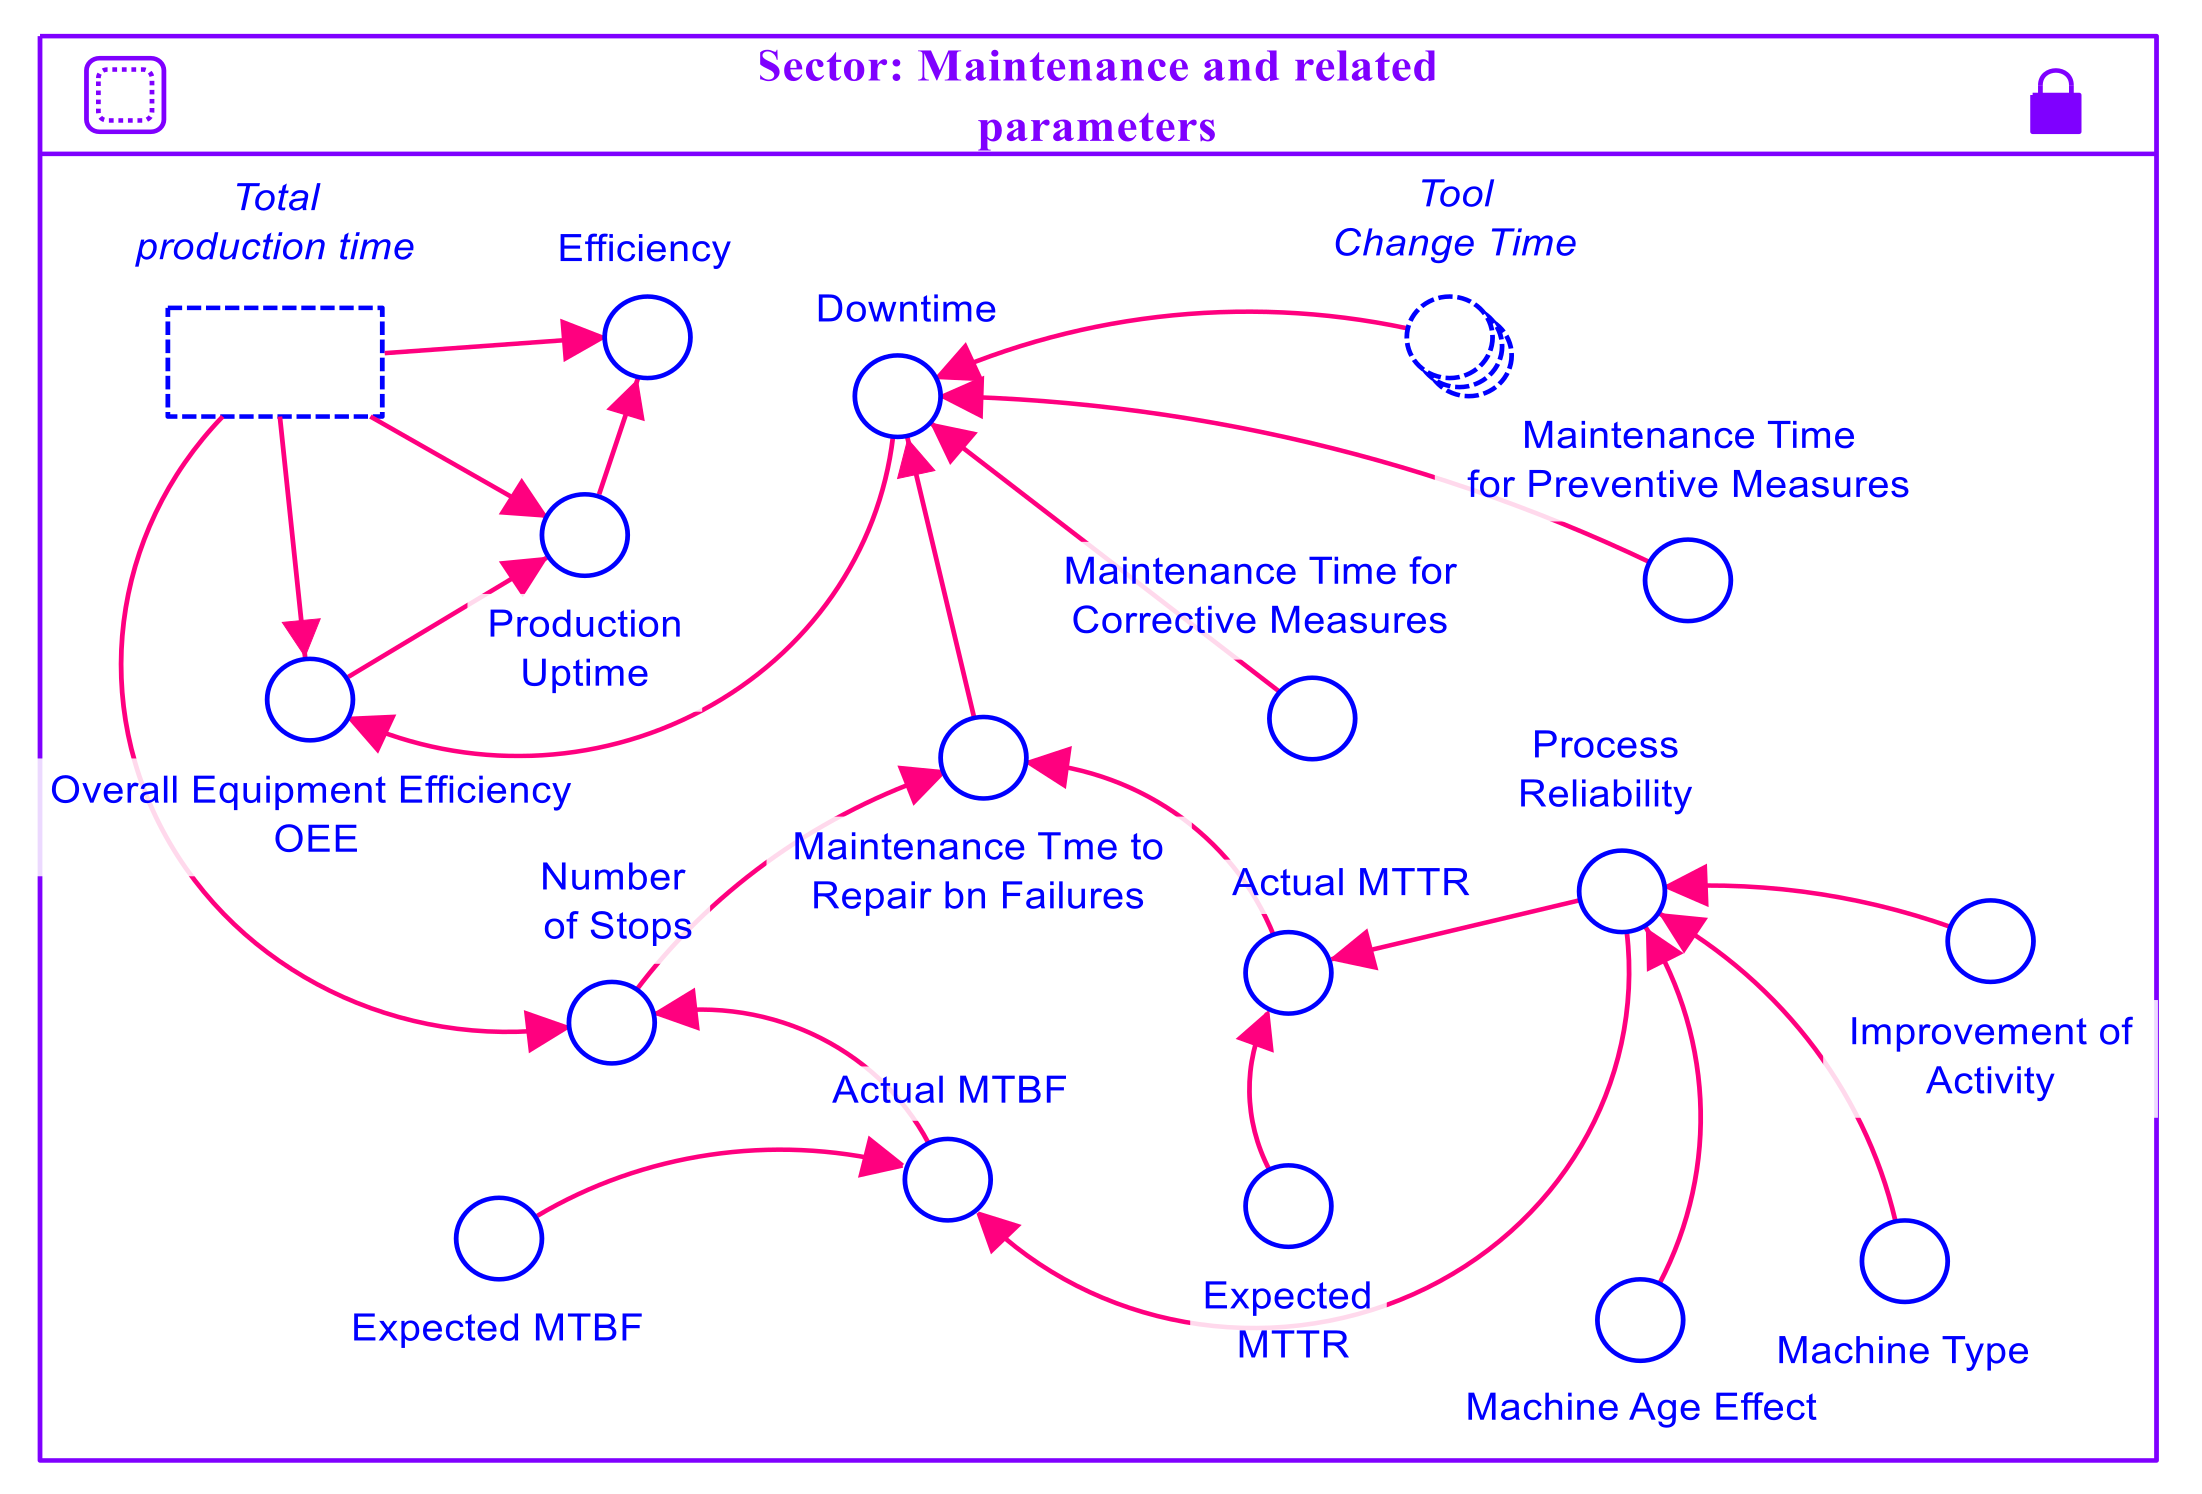
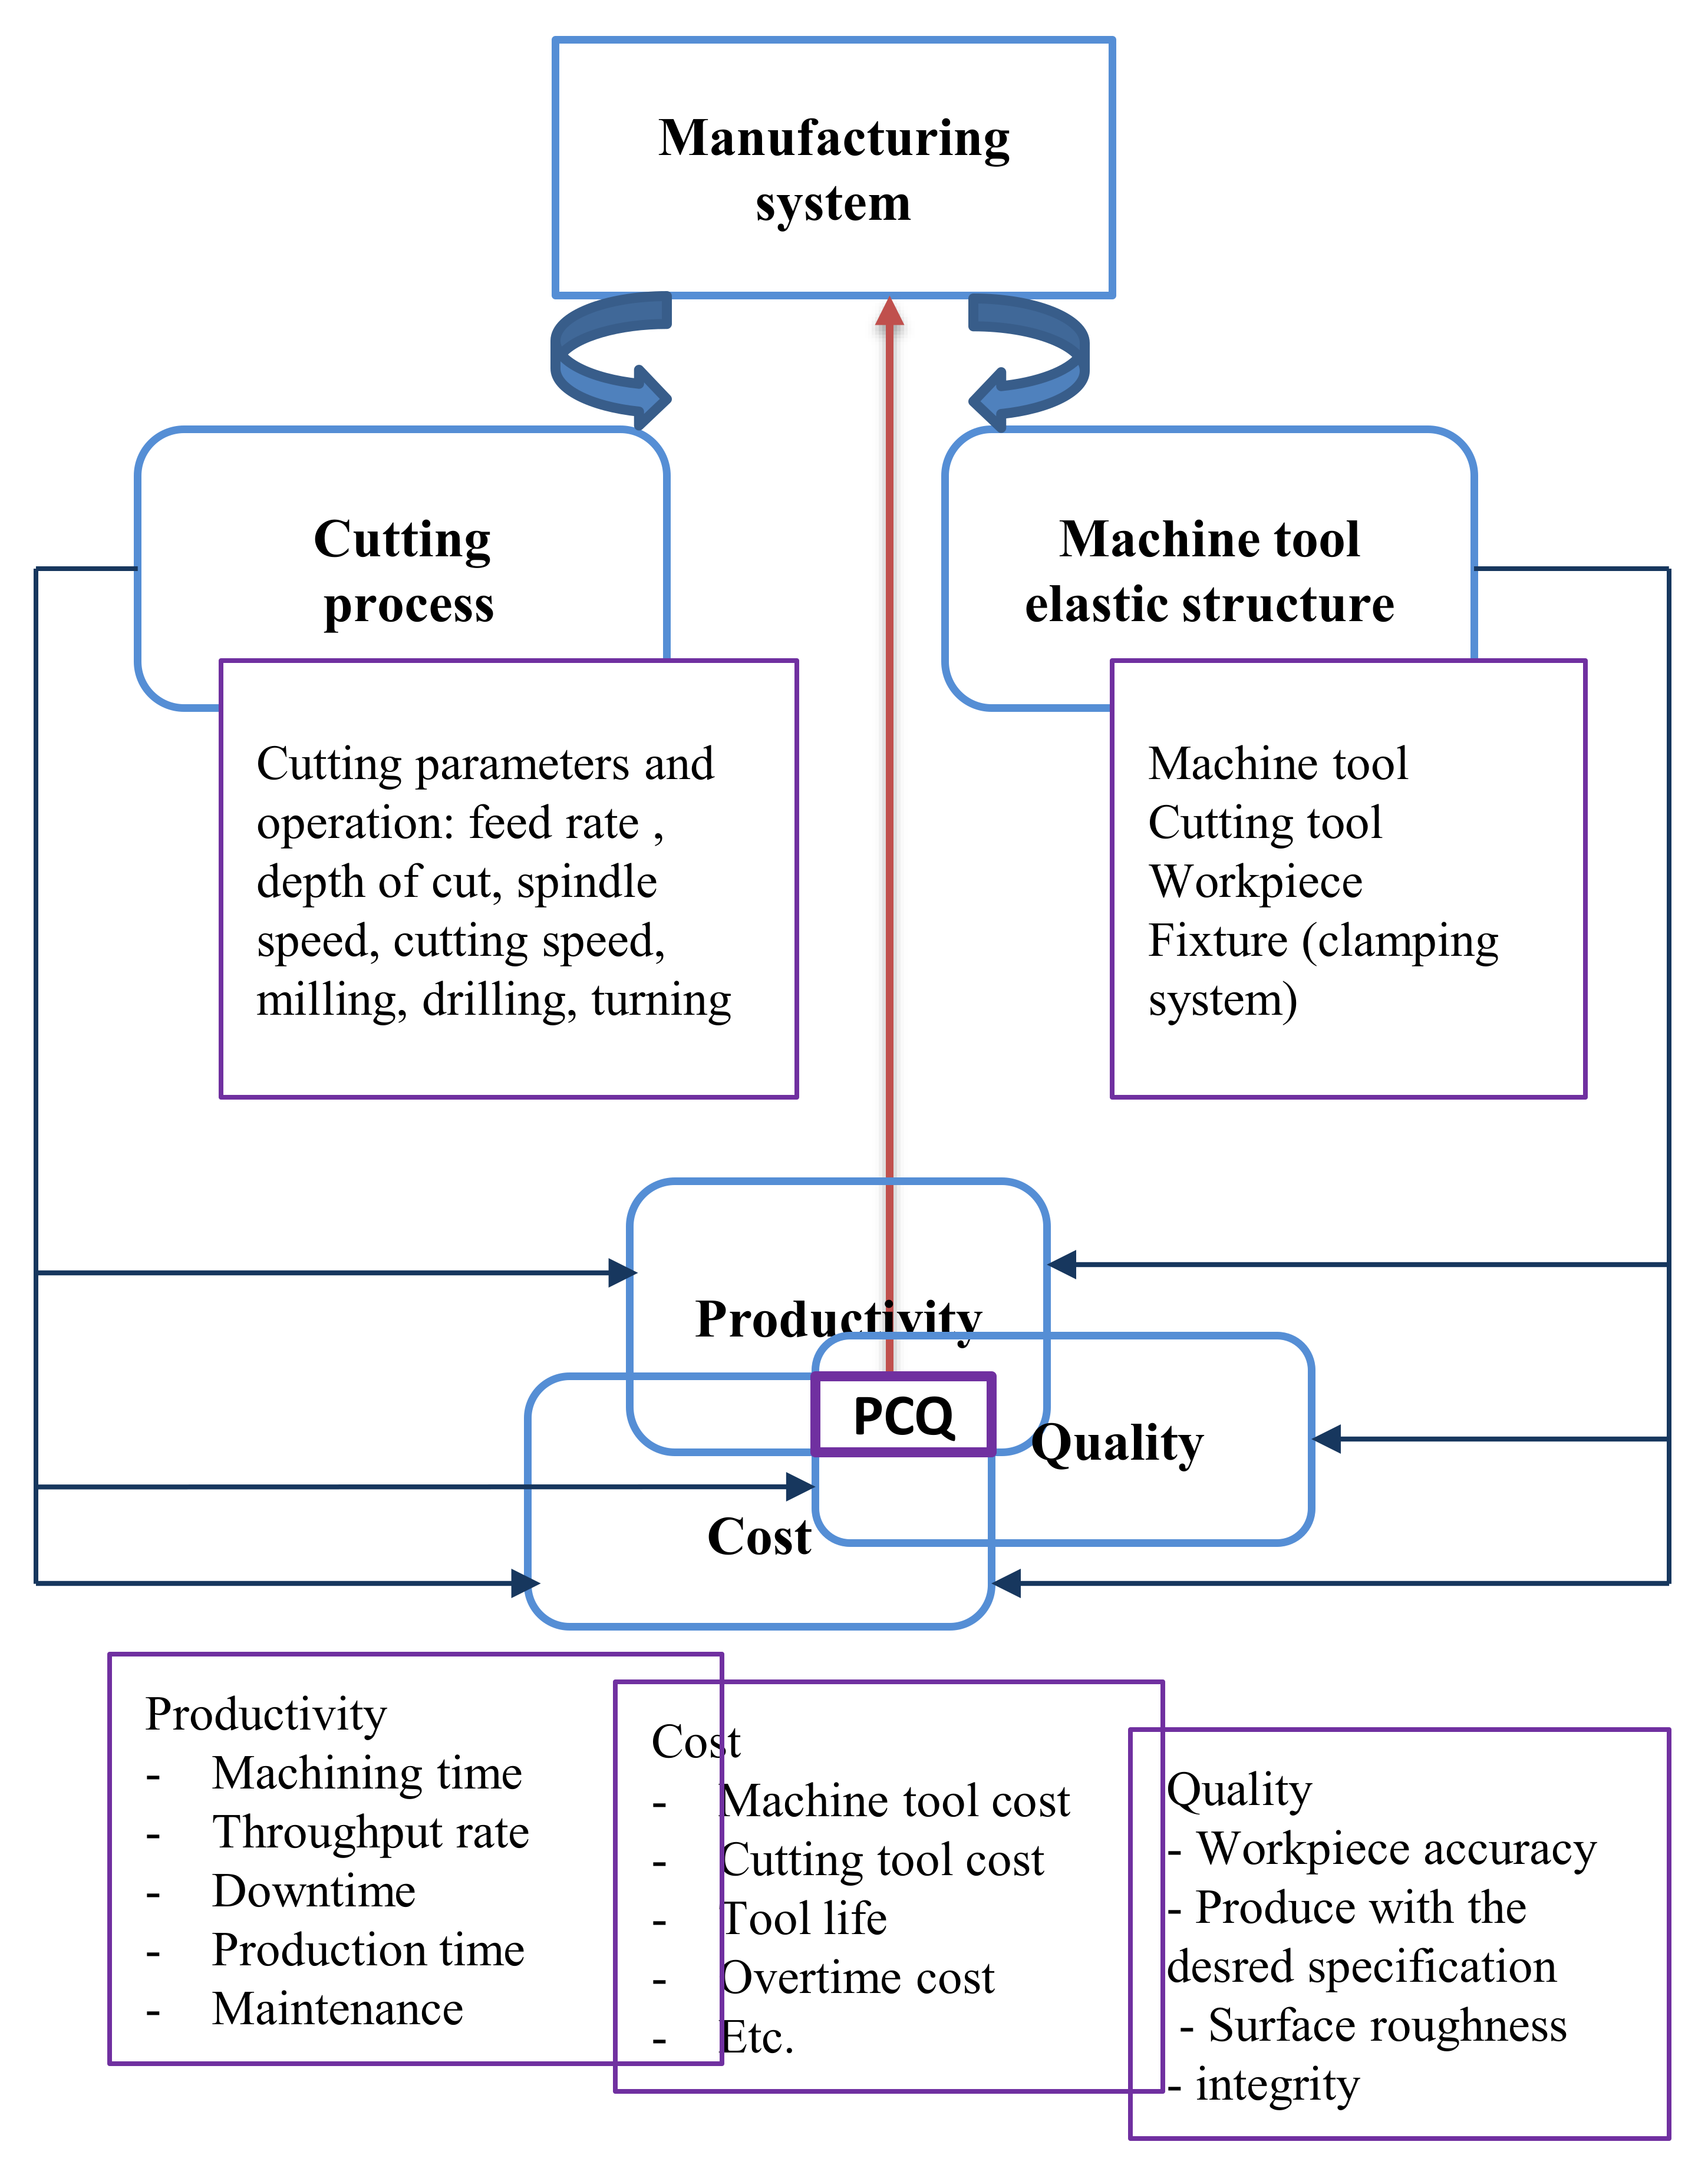
4.3. Manufacturing System Parameters and Performance Indicators
The principal performance indicators and machining system parameters deployed in this paper are presented in
Figure 3. These parameters were obtained from a literature survey and the current configuration of an actual engine block manufacturing line in the automotive industry. Due to the fluctuations in factors like demand, workpiece material, design specification, number of machines and others, the input parameters values for the machining process might be varied. However, there are parameters that might be kept constant to maintain the production flow, such as takt time, total production time, etc.
In this research, the actual cost is expected to an output dependent on values from other connected parameters, but only the main cost derived is considered.
4.4. Scope for Modelling
Figure 4 explicitly describes the manufacturing strategy for an engine block that is designed to be produced in-line with optimal performance criteria—PCQ (productivity, cost and quality). The manufacturing system is set up to produce the desired quantity of parts that fulfils the required quality requirement and achieves the optimum cost. To produce an optimal output for PCQ with a set of given input parameters, the manufacturing system is adjusted accordingly. This is the feedback system that closes the loop.
A specific input parameter is taken into account, and based on the variation of this parameter, the machining strategy is configured. If some adjustment in the manufacturing system behavior is required, the cutting process parameters can be varied; such requirements, for example, high/low product demand. To produce the given demand, the process can be fast/slow; thus, the total production time is varied in order to either produce overtime beyond threshold because of higher demand or reduce it because the targeted production rate has not be achieved. Moreover, the cycle time can also be reduced by adding a parallel machine to a station which is either bottlenecked or has the highest cycle time in the line.
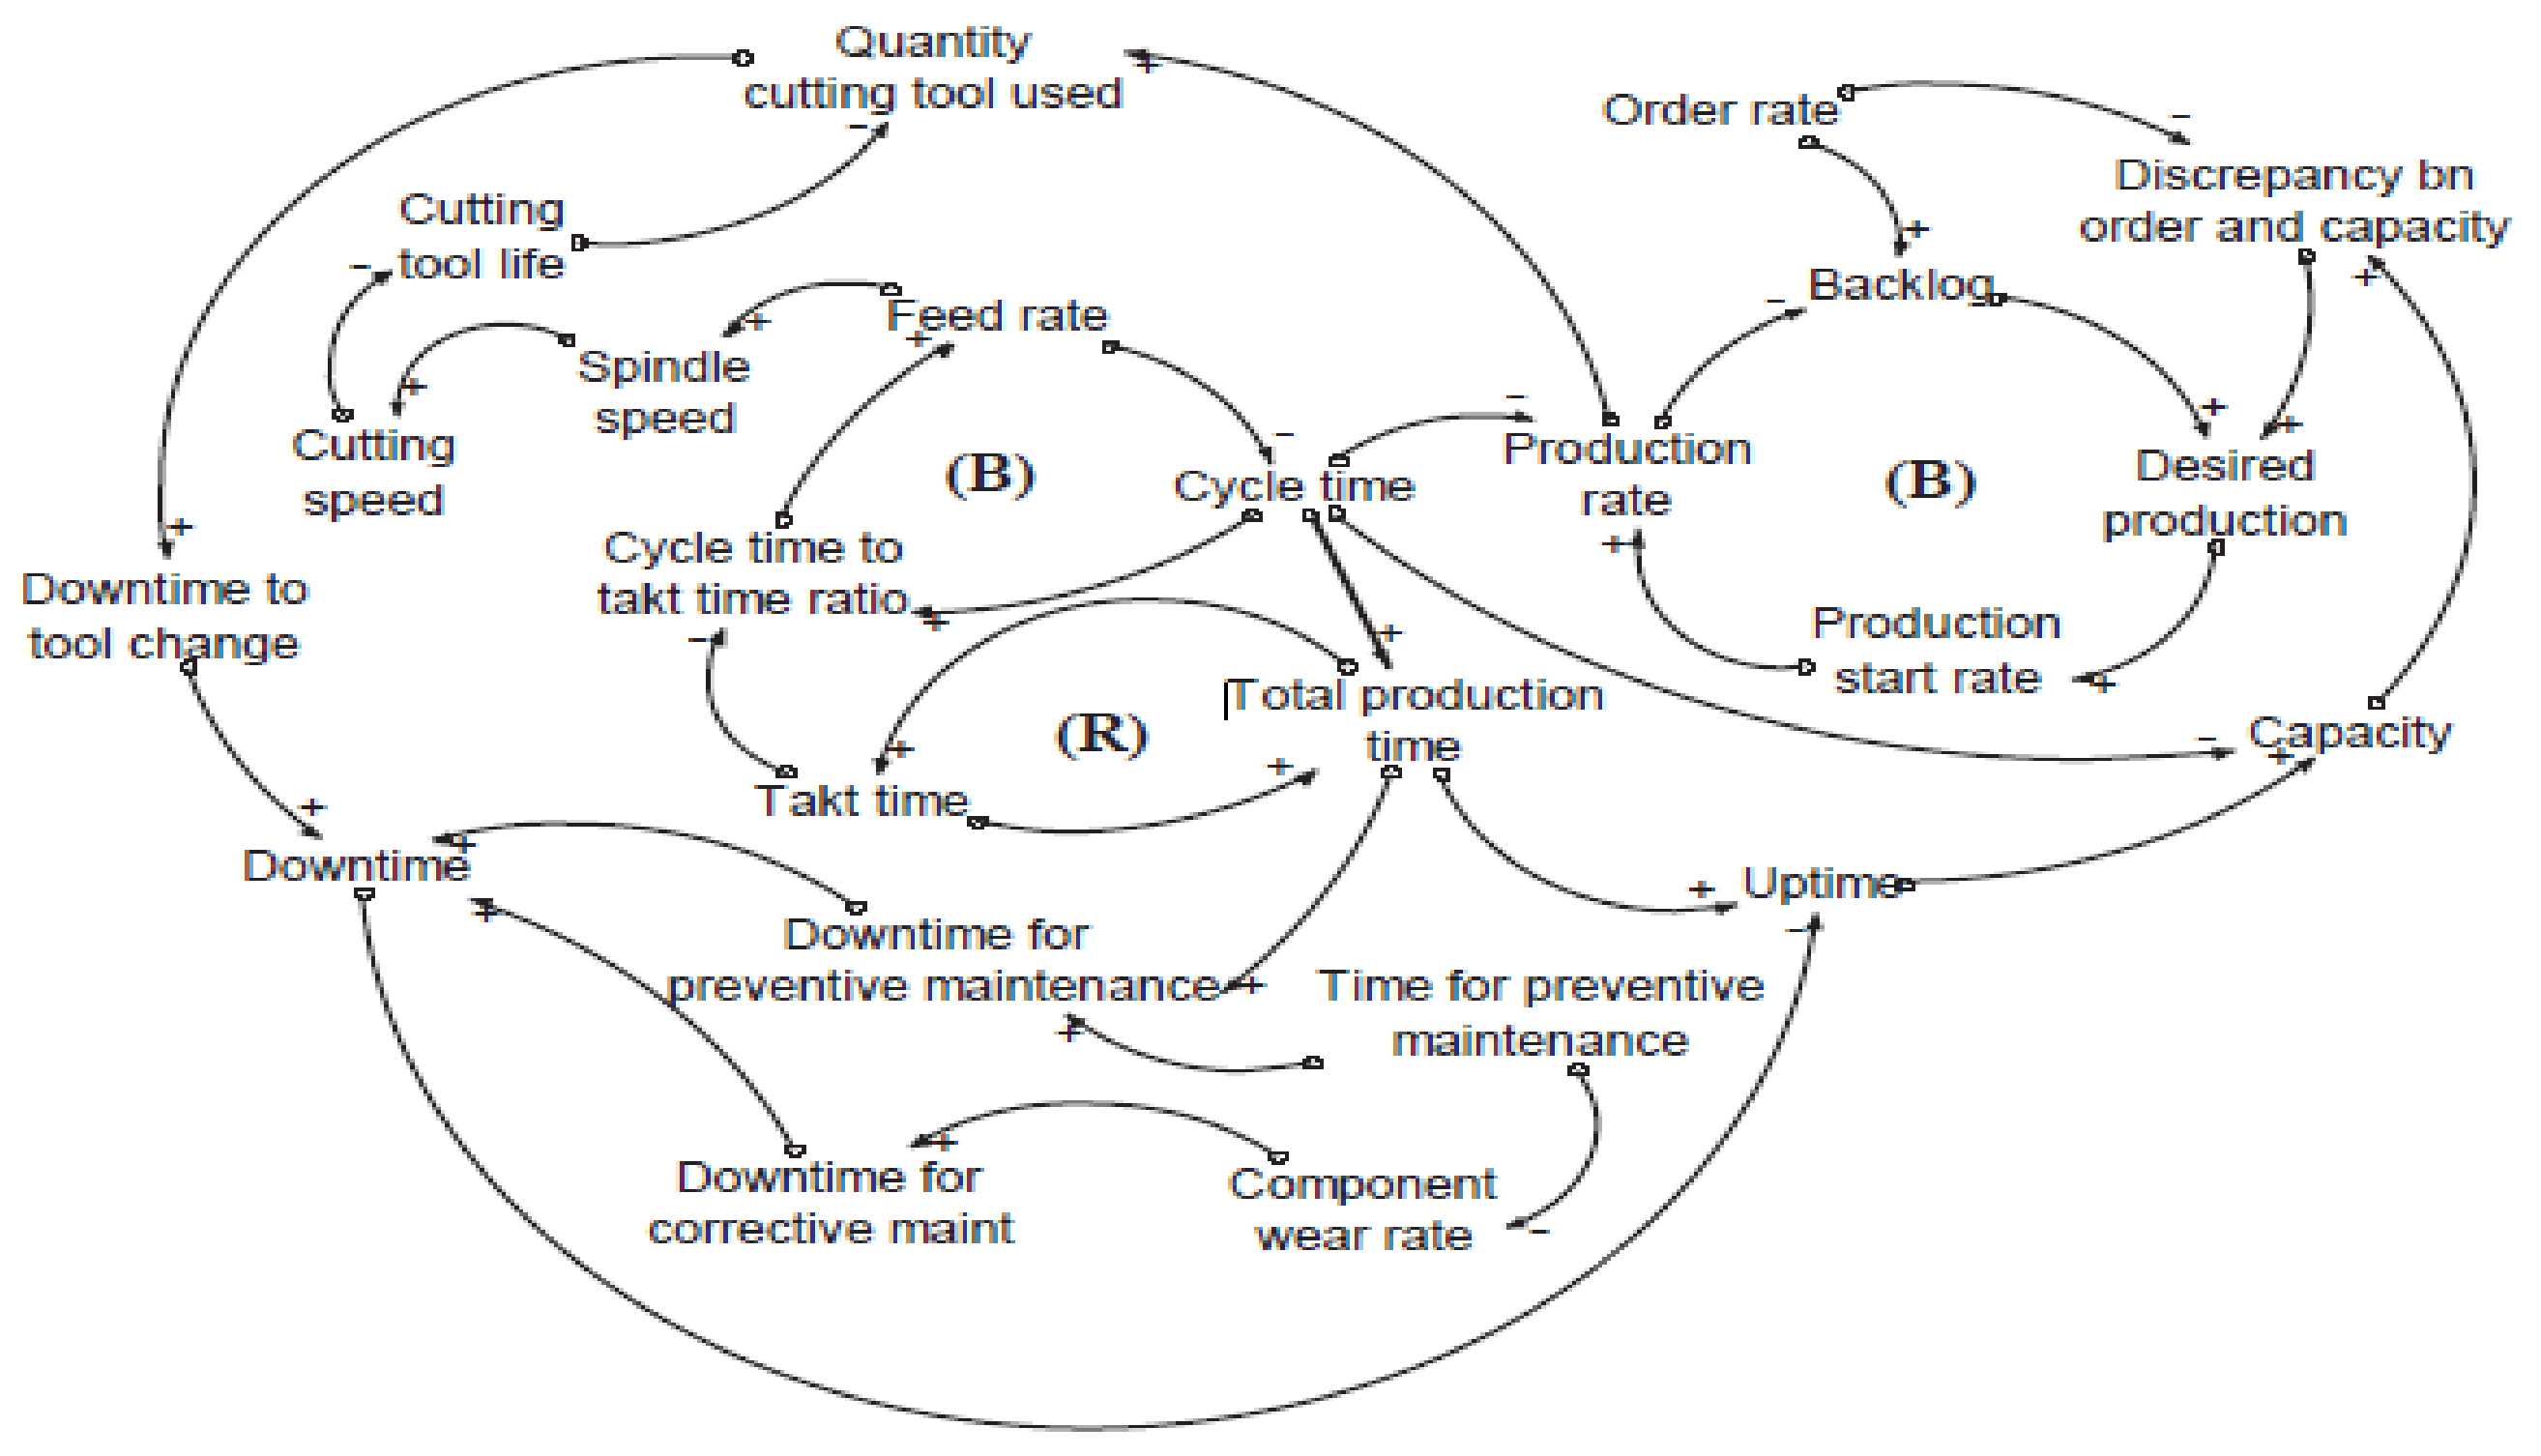
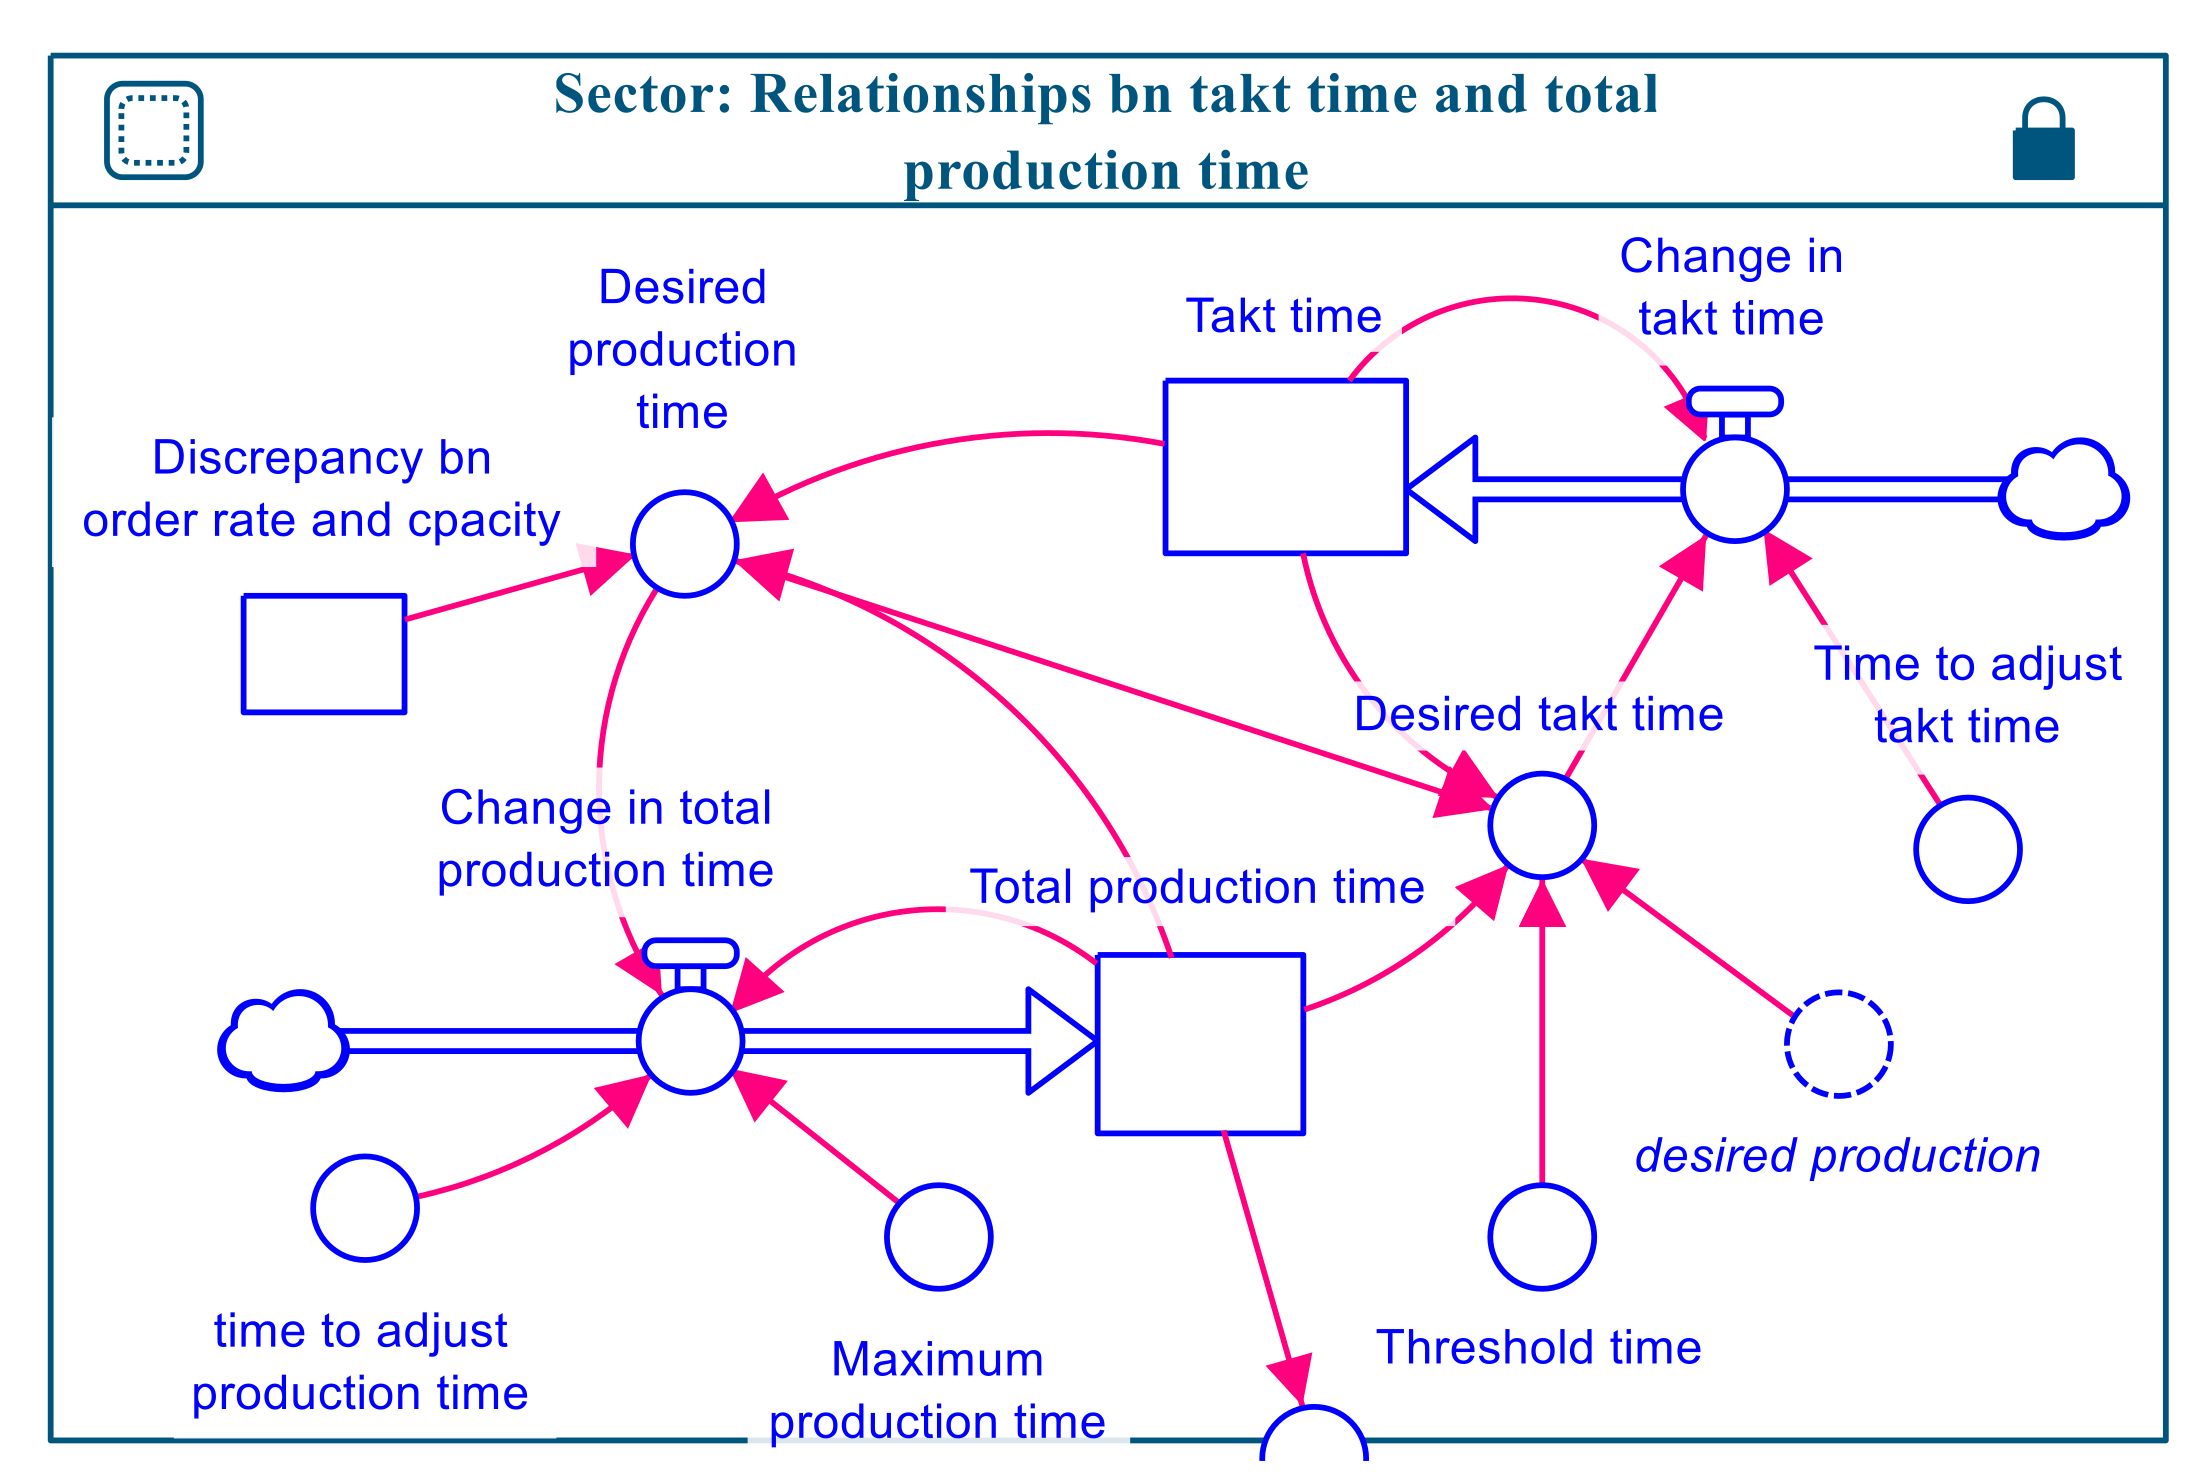
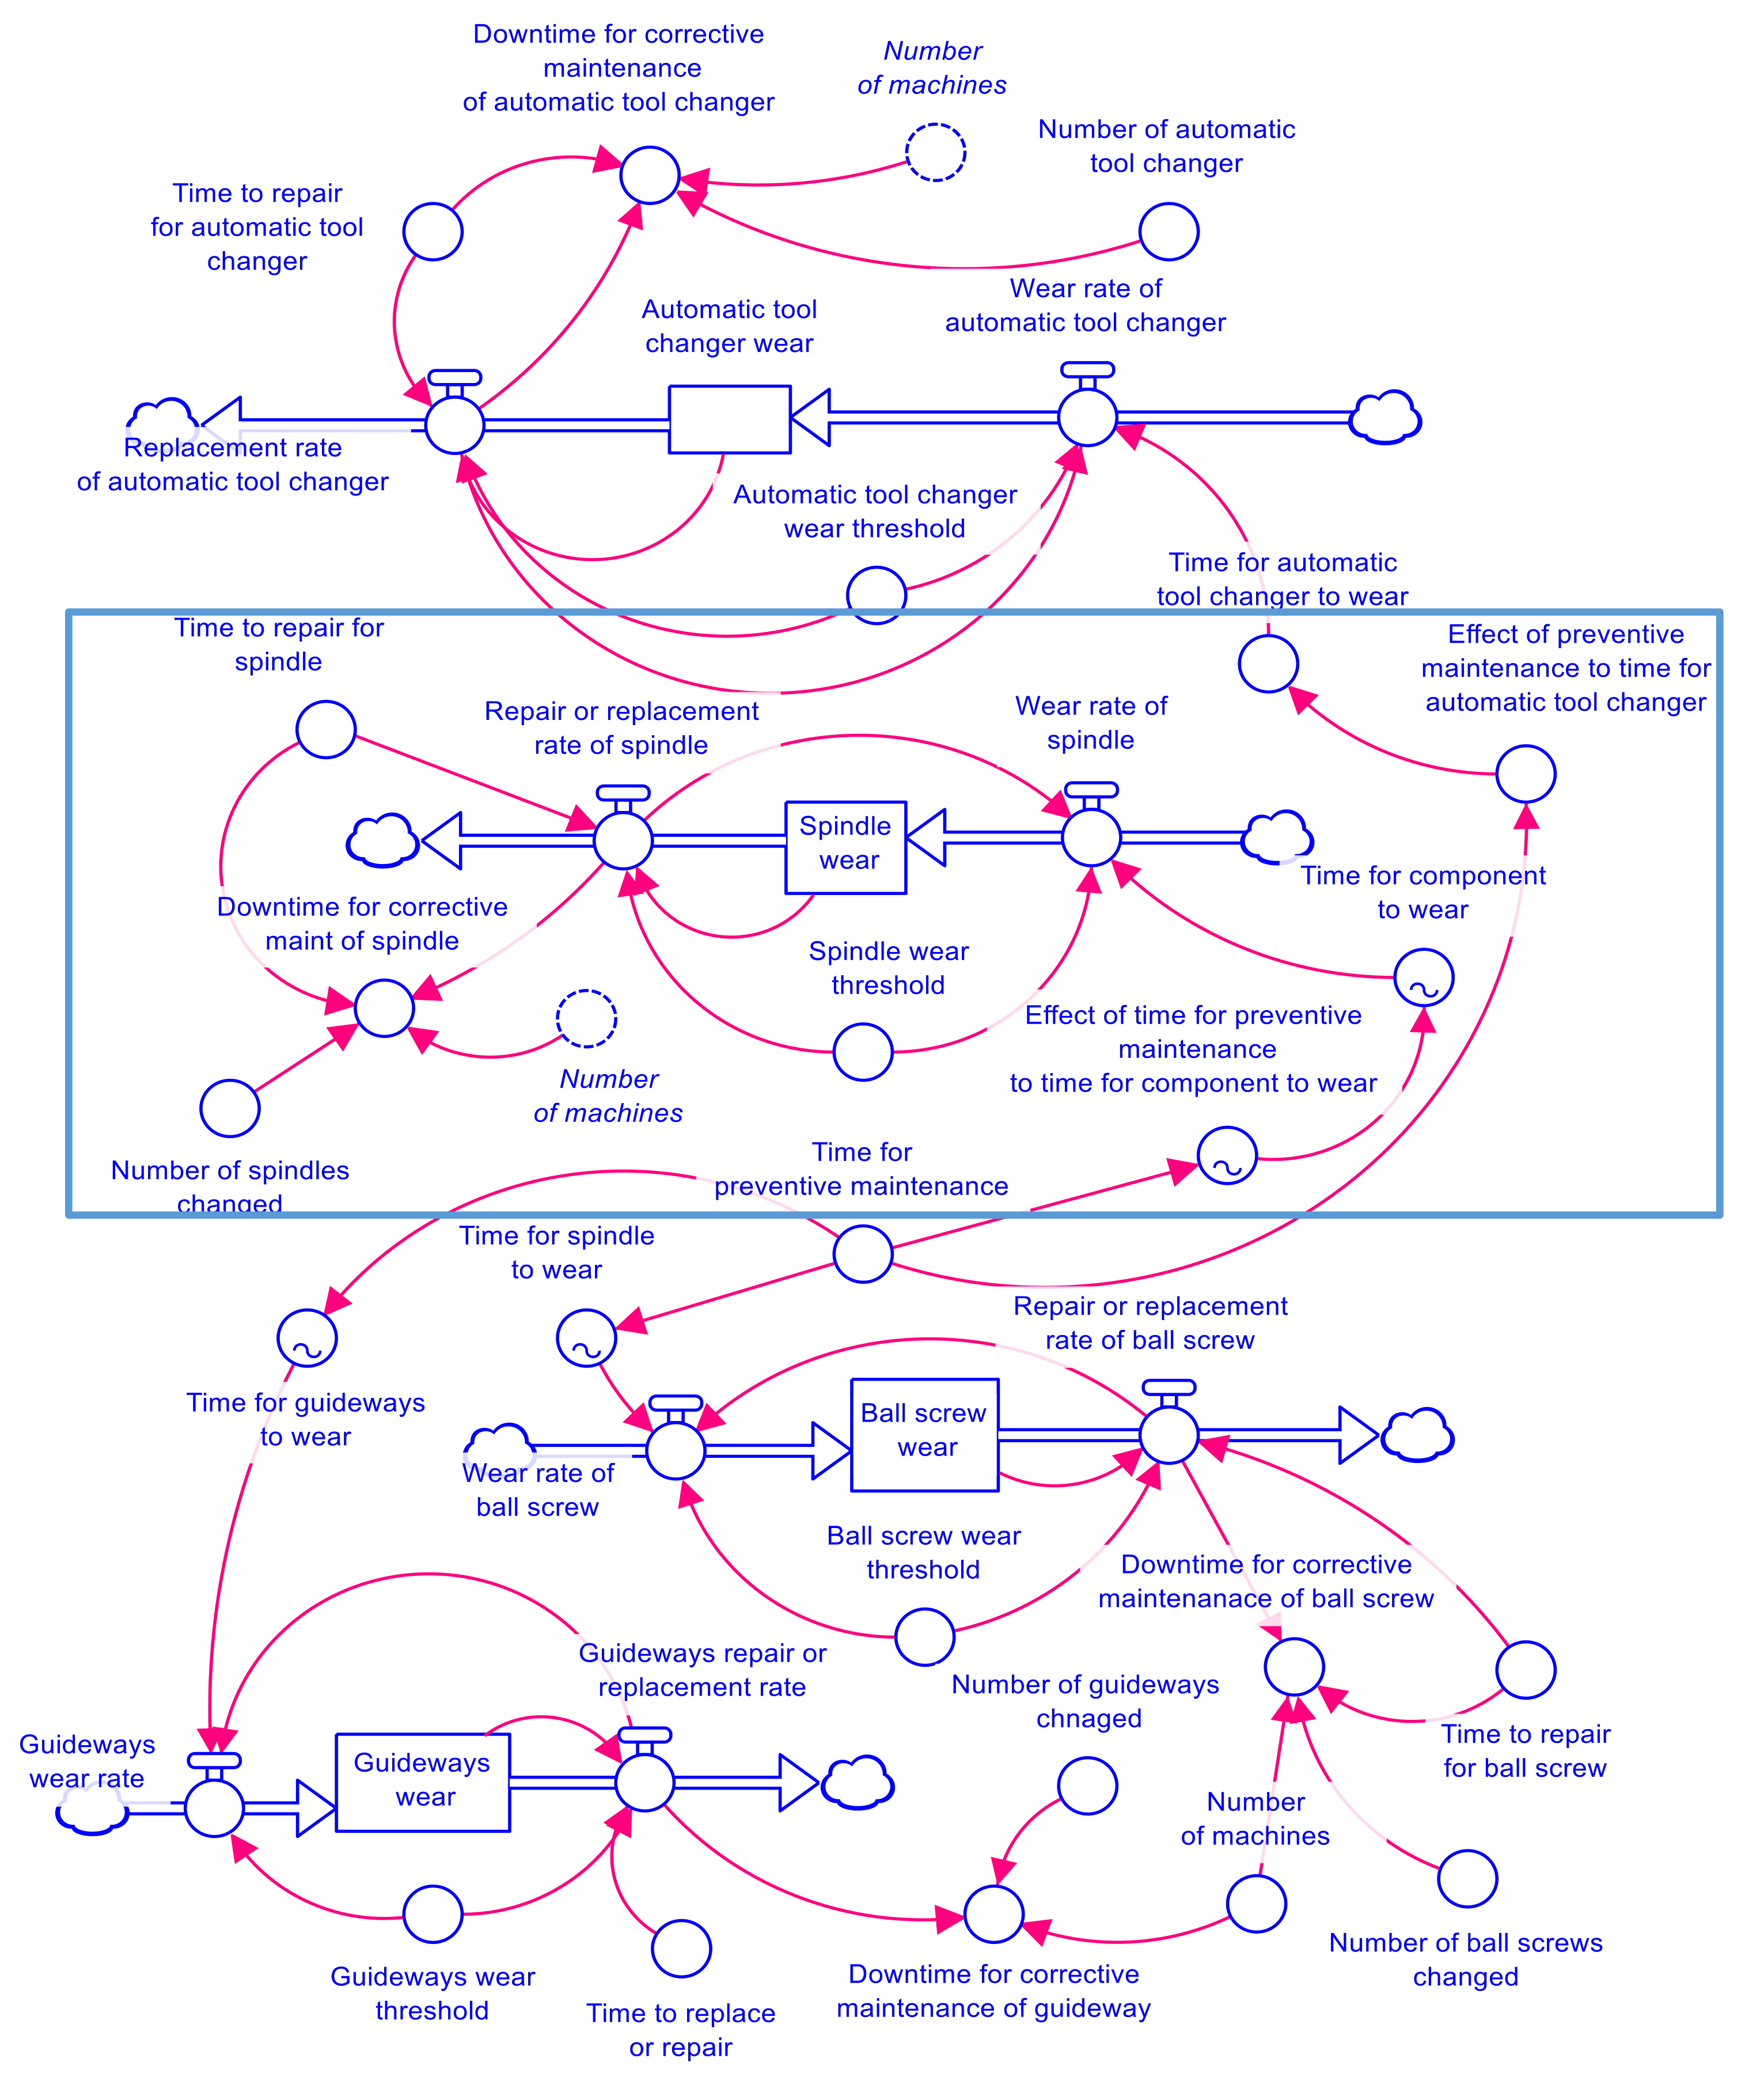
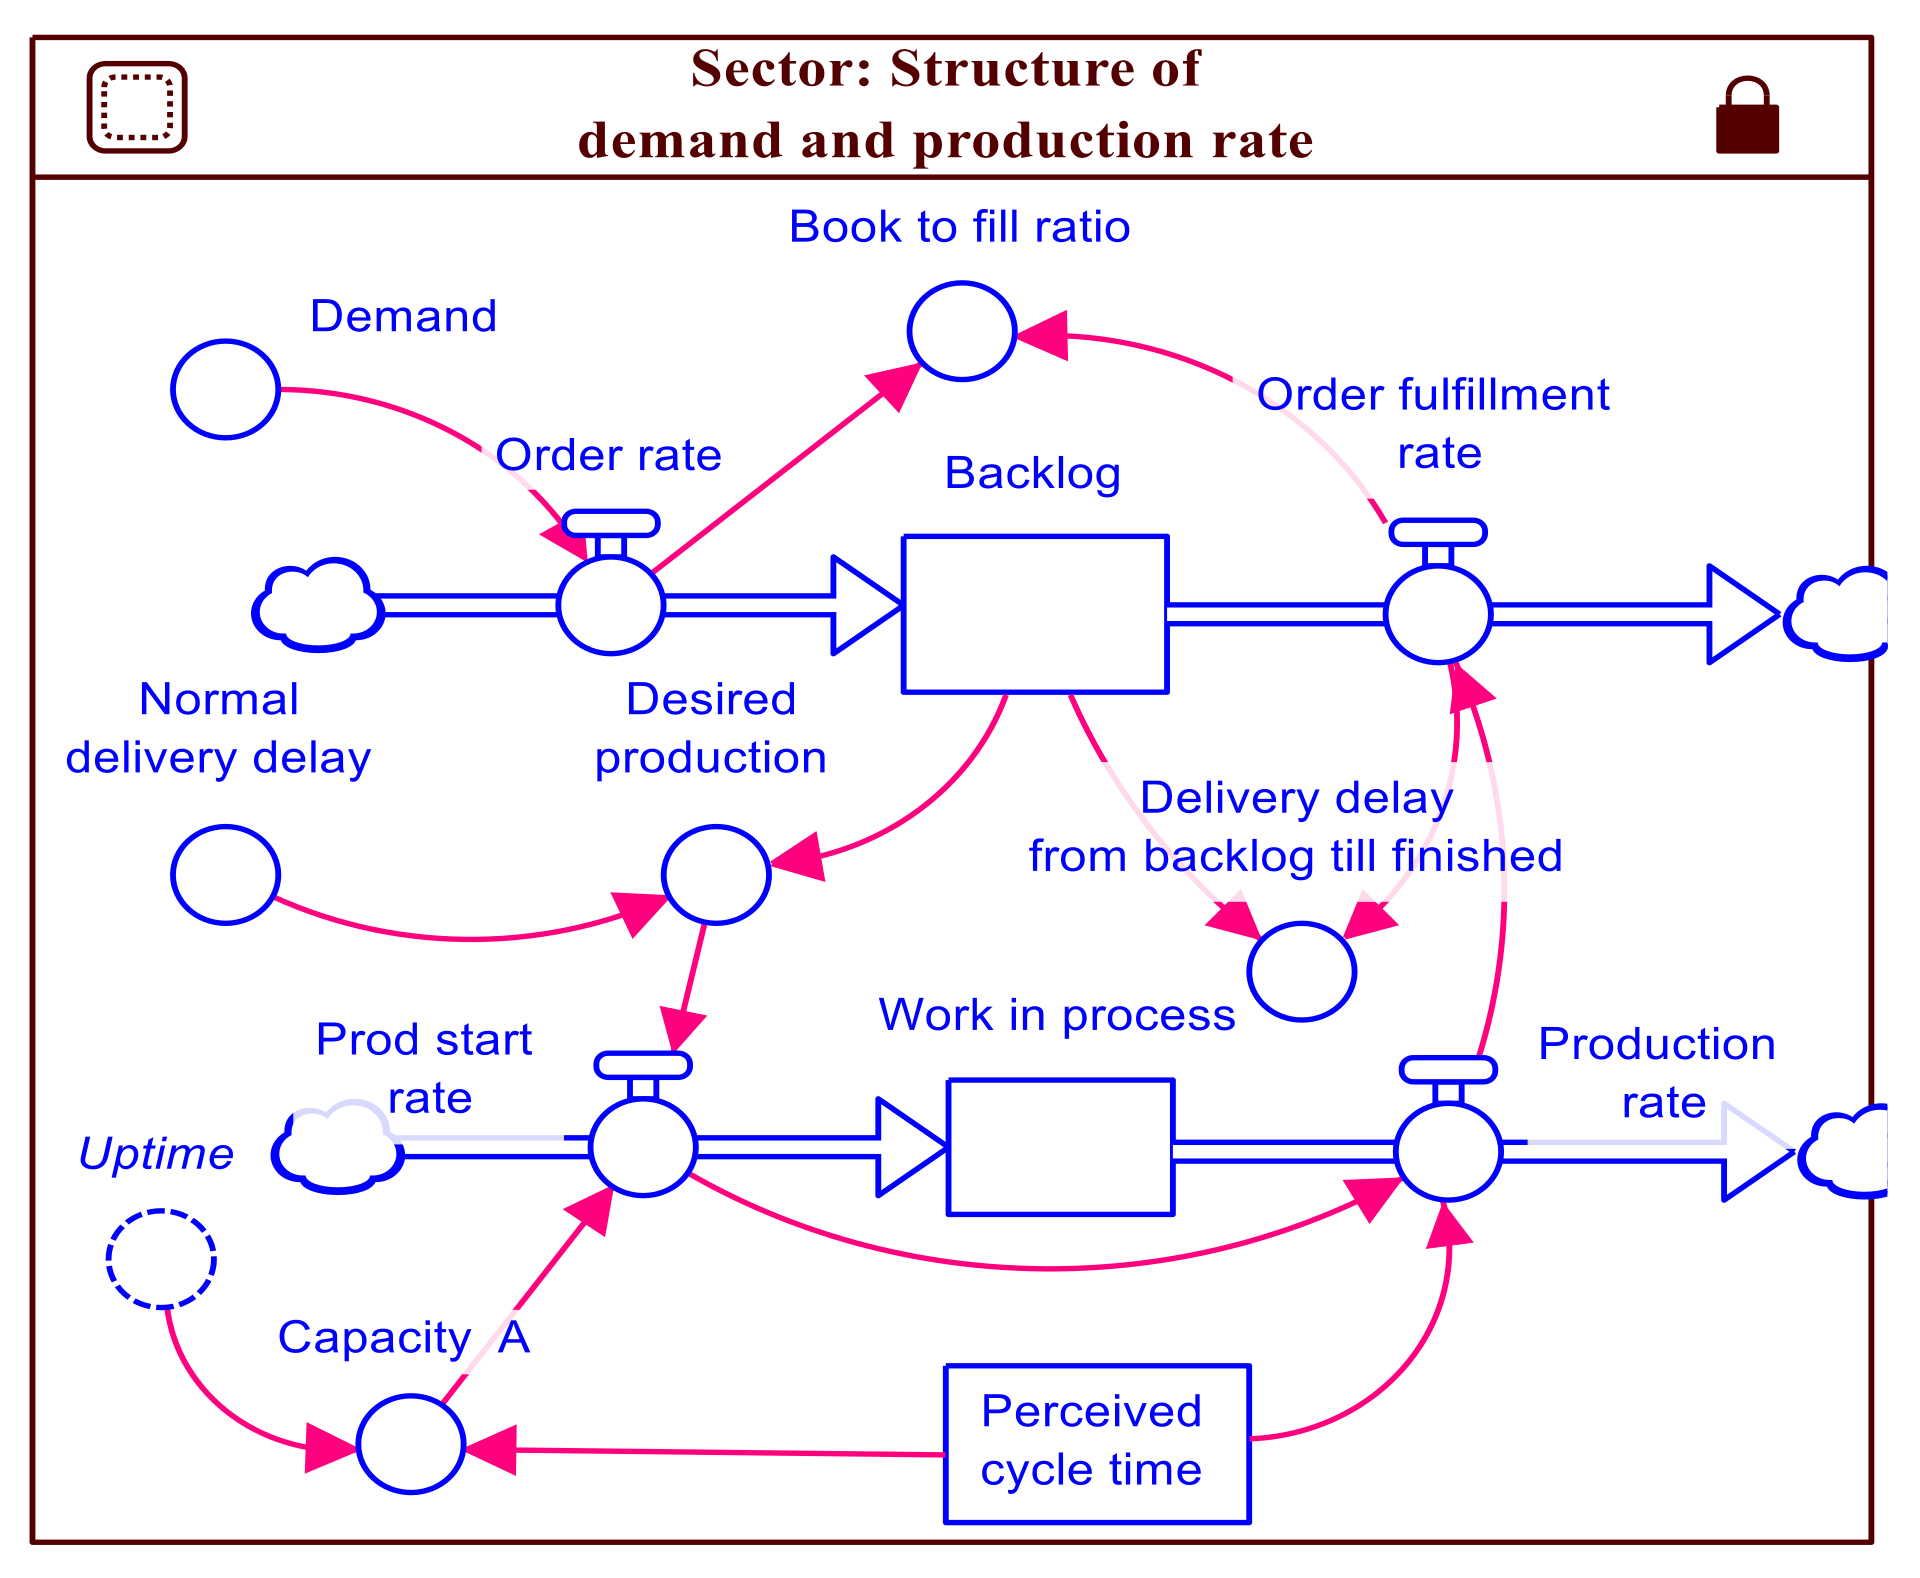
4.5. Causal Loop Diagram
The causal loop diagram (CLD), is a tool to map the structure of a complex system. The cause effect connections in a system sometimes form loops indicating information feedback between parameters; the nature of these feedback loops determines the structure and behavior of the system. The structure of a manufacturing system’s main parameters’ relationship, their interaction, and feedback of the system are captured in the CLD, illustrated in
Figure 5. Parameters are related by causal links, shown by arrows. Each causal link is assigned a polarity, either positive (+) or negative (−). The + and − signs represent the relationships between respective connected parameters, either in direct or inverse proportionality, respectively. They indicate also how a dependent parameter changes when an independent parameter changes. The two types of feedback loop—negative or balancing loop (B) and positive or reinforcing (R) loop—are also presented.
6. Results
6.1. Analyzed Model’s Results
The proposed SD model explained in the previous section was built using Stella Professional software. Stella is a modelling tool commonly used to build, simulate and analyze system dynamics models. It provides a flexible way of building simulation models based on causal loops or stock and flow diagrams.
The model provides the structure for how the different factors of the machining process and performance parameters interact in the manufacturing system, considering a boring operation as an example. The interaction between factors in the overall manufacturing system can be developed with respect to the possible variation in demand, workpiece materials and new product design introduction for parts produced in different machines and with manufacturing systems’ settings (flexible or dedicated manufacturing systems). The structure of these relationships can be modified according to the type of operation, variation and working conditions. Essentially, the model is used as a framework for other related processes. This framework is the core, which is adapted for other related machining processes within an engine block production line.
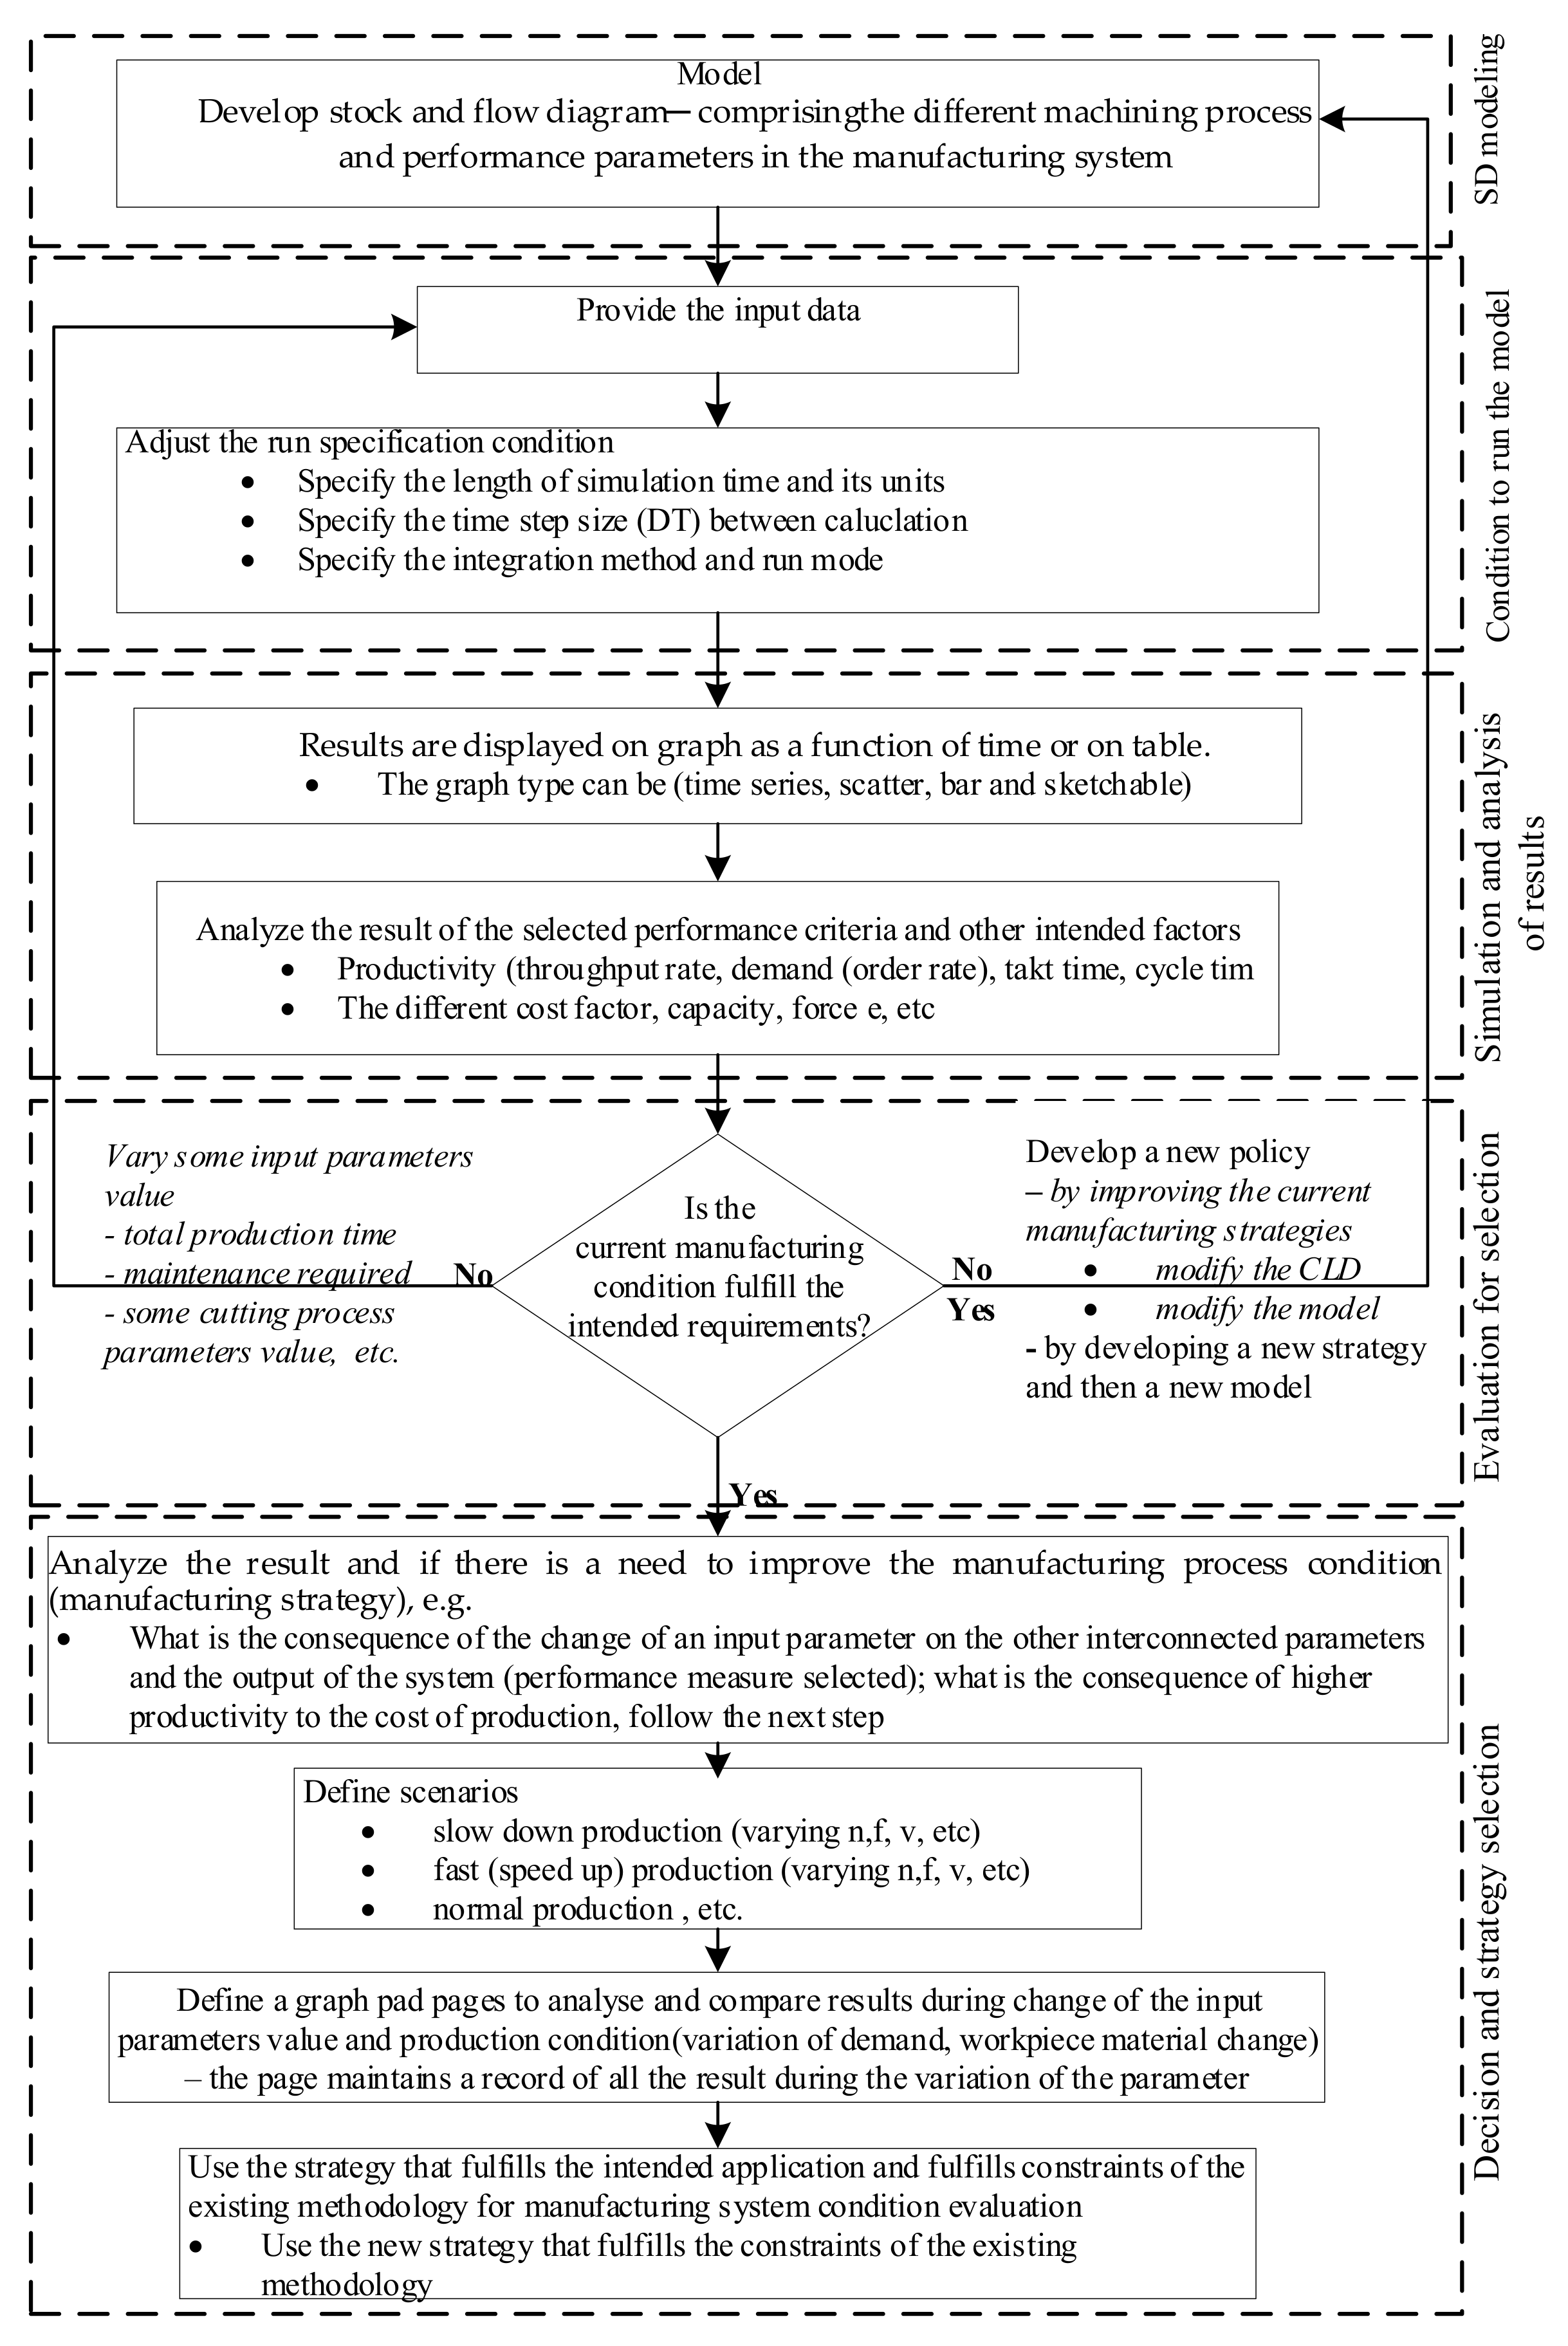
After creating the overall structure of the manufacturing system condition for a given machining process of the engine block production, the initial input parameters’ values can be introduced, and the model is ready to run. The boring process parameters’ relationships with performance measures and the manufacturing system’s condition is taken as an example that can be used as the basis for other processes of engine block machining. The simulation results can be described and analyzed using different perspectives. However, in this paper, the simulation results of the actual working conditions are not provided; rather, only the general framework for the interrelations of the machining process parameters, performance indicators and their behaviors is studied. The general procedure to run and analyze the behavior of the simulation model result is briefly presented in
Figure 17.
6.2. General Procedure to Run the Model
The proposed model can be run under every possible combination of production parameters and given performance criteria. To run and analyze the simulation results, one first determines the length of simulation, the time step size (DT) between calculations, the interval between simulation pauses, the units of time, the integration method and the run mode. A step size/time delay (DT) achieves a good compromise between accuracy of results and speed of simulation—the smaller the simulation time step, the more accurate the simulation results. However, DT should be smaller than the smallest time delay in the model. In general, a good first approximation would be to choose a step size one-half of the shortest time delay in the model. Many time delays may be apparent, though, if the shortest time delay can be determined, it is a good starting point for selecting the step size.
6.3. The Behaviour of the System
Over the course of simulation runs, the model’s structure creates the behavior of the system’s performance for the designated model parameters. In order to illustrate and analyze the dynamic behavior and performance of the system, a dynamic demand patter can be considered. The dynamic behavior of the different performance criteria can be analyzed after providing the initial input parameters’ values and the result is displayed in graphs as a function of time.
Consider what the dynamic behavior of the different performance measures (productivity, cost,) in the system will be if the system is disturbed by variation in demand. Is the existing manufacturing system condition capable of responding to the given demand variation? If not, will varying some of the parameters, such as feed rate, cutting speed and working time, make a change in the manufacturing system? Is it possible to optimize the manufacturing system by controlling the interaction effects of process and performance parameters? Does it require additional parallel machine tools to enhance production and achieve the target? By doing so, the behavior of the simulation result for the order rate from customers (demand) and the production rate will be illustrated by graphs/tables.
Similarly, the result for other performance indicators, like cost and quality, can be analyzed. Moreover, the interaction between these indicators will be explored with the same manufacturing strategy as well as by modifying or changing the strategy. Furthermore, it is viable to analyze the manufacturing strategy’s effect on the change in parameter values on the performance indicators (criteria) chosen. By changing some parameter values, it is possible to see the effect of this change on the interconnected parameters and on performance measure—cost, productivity and quality of parts produced. Changing one parameter in system dynamics application does not mean freezing others and seeing the effect of the change only in the output. Rather, these changes will make a change on the other interconnected parameters and on the output of the system, because the system parameters are interconnected through the system in the model.
6.4. Fast and Slow Production/Performance Policy Analysis
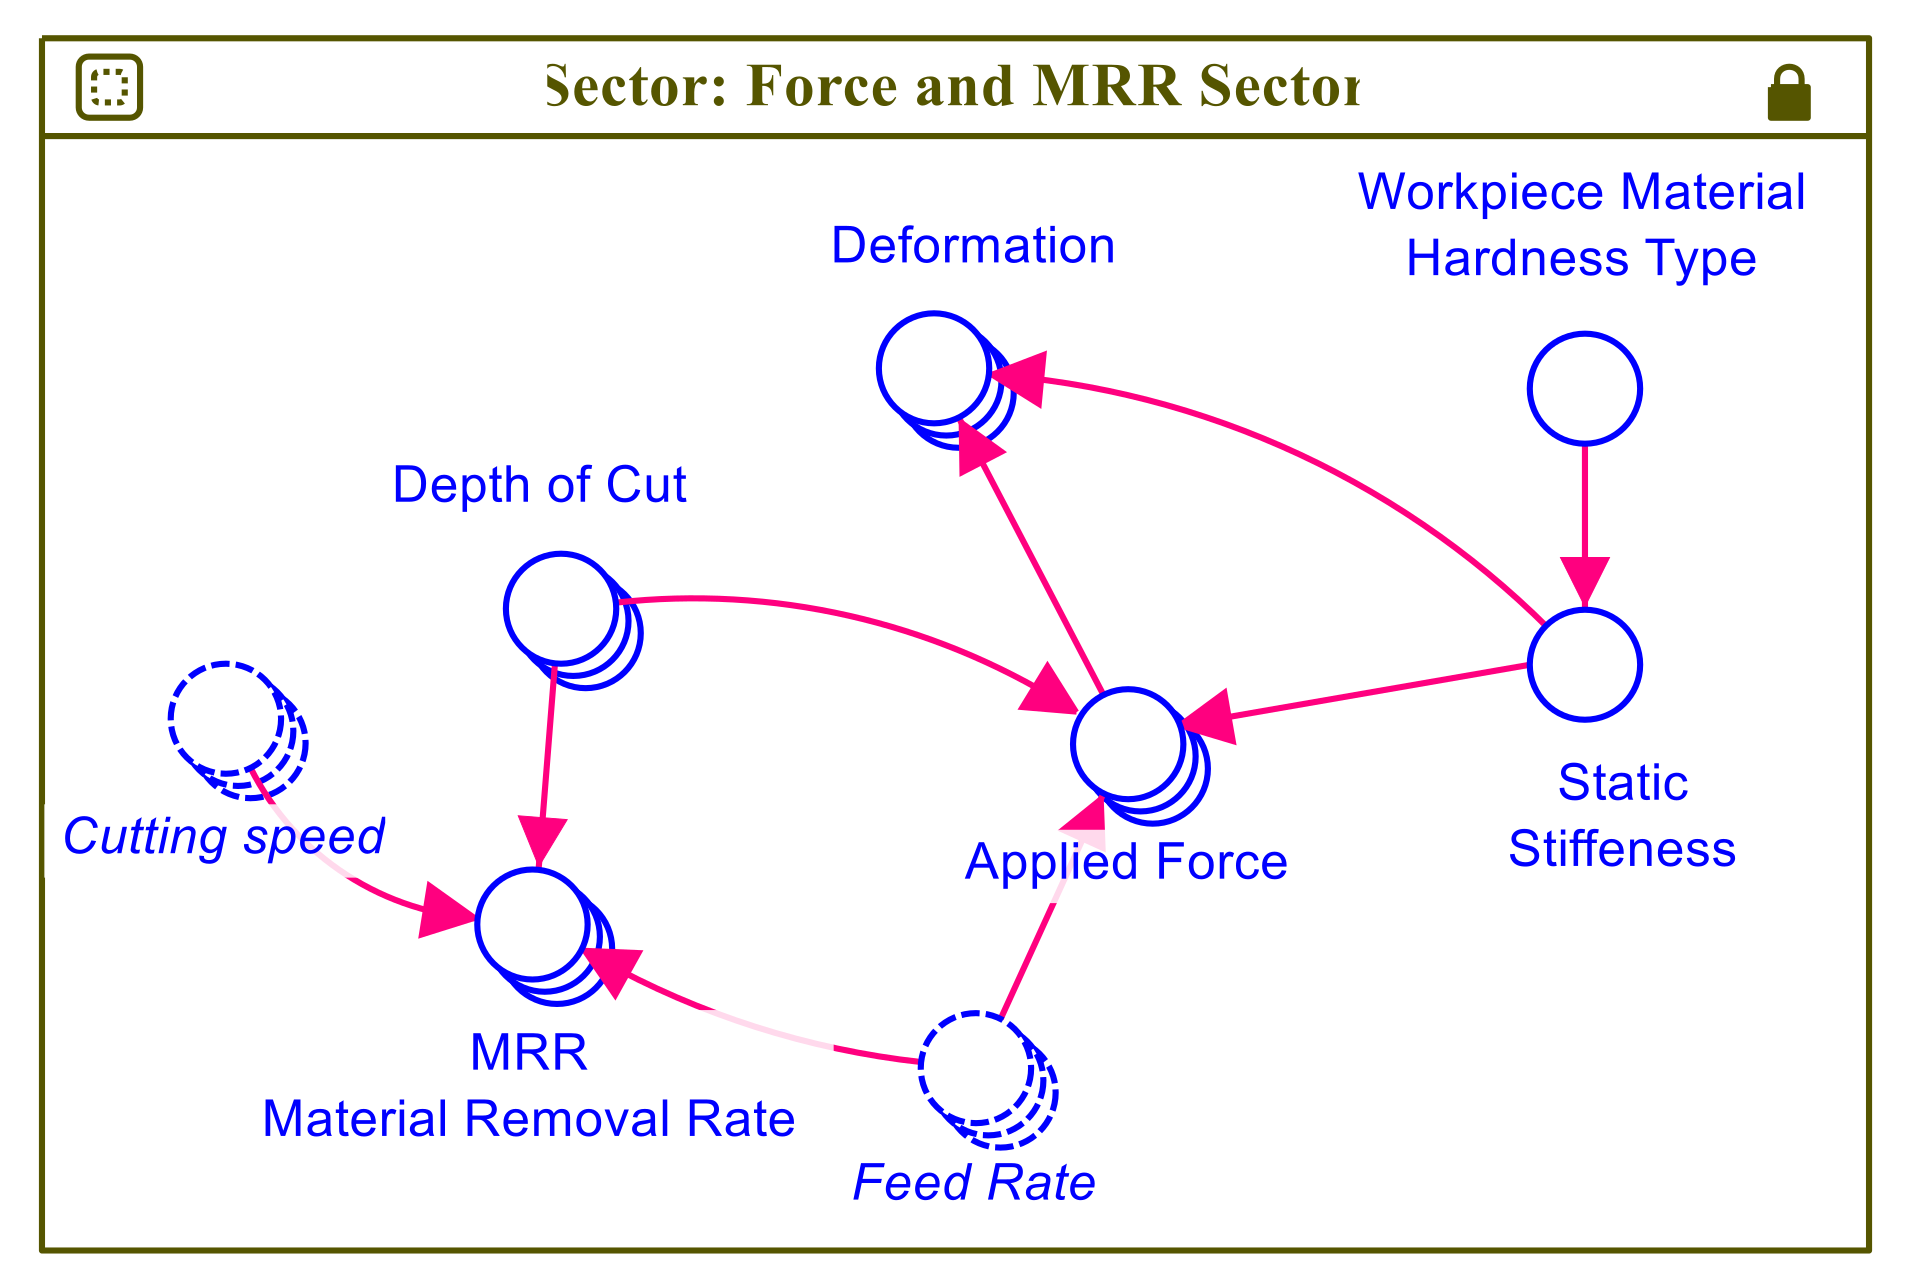
There are conditions and scenarios where fast or slow production rates are required in the machining process. To slow down production, it is necessary to either decrease the feed rate, depth of cut, or the cutting speed, etc. A decrease in feed rate increases the cutting time and takt time and decreases the cutting speed, which induces lower cutting forces and results in smaller deformations. The lower cutting forces imply lower tool wear rates, better dimensional accuracy (due to decreased deflections/deformation) and increased machine tool life (due to reduced loads on bearings and guideways). As a consequence, the life of the cutting tool will be longer, causing a reduction in the total tool cost. Productivity might be lower if a higher demand of production is required; cost will be determined according to specifications, along with the desired product quality in machining. The intricate interaction and influence between these parameters can be analyzed in the simulation run. A similar analysis can also be applied to accelerate the machining operation.
When a change in workpiece material in the system is experienced, the machinability data that contains the recommended values of cutting speeds, feed rates and depth of cut for the respective work material can be collected in handbooks (design) or from a company’s computer database. Then, the respective simulation for a change in workpiece material can be analyzed in a similar way as described for variation of demand. The main difference will be the input values of some cutting process parameters and their interrelationships. The change in workpiece material strongly influences the overall machining cost, which depends mainly on the tool life that can be achieved under the assumed production conditions.
7. Conclusions and Recommendation
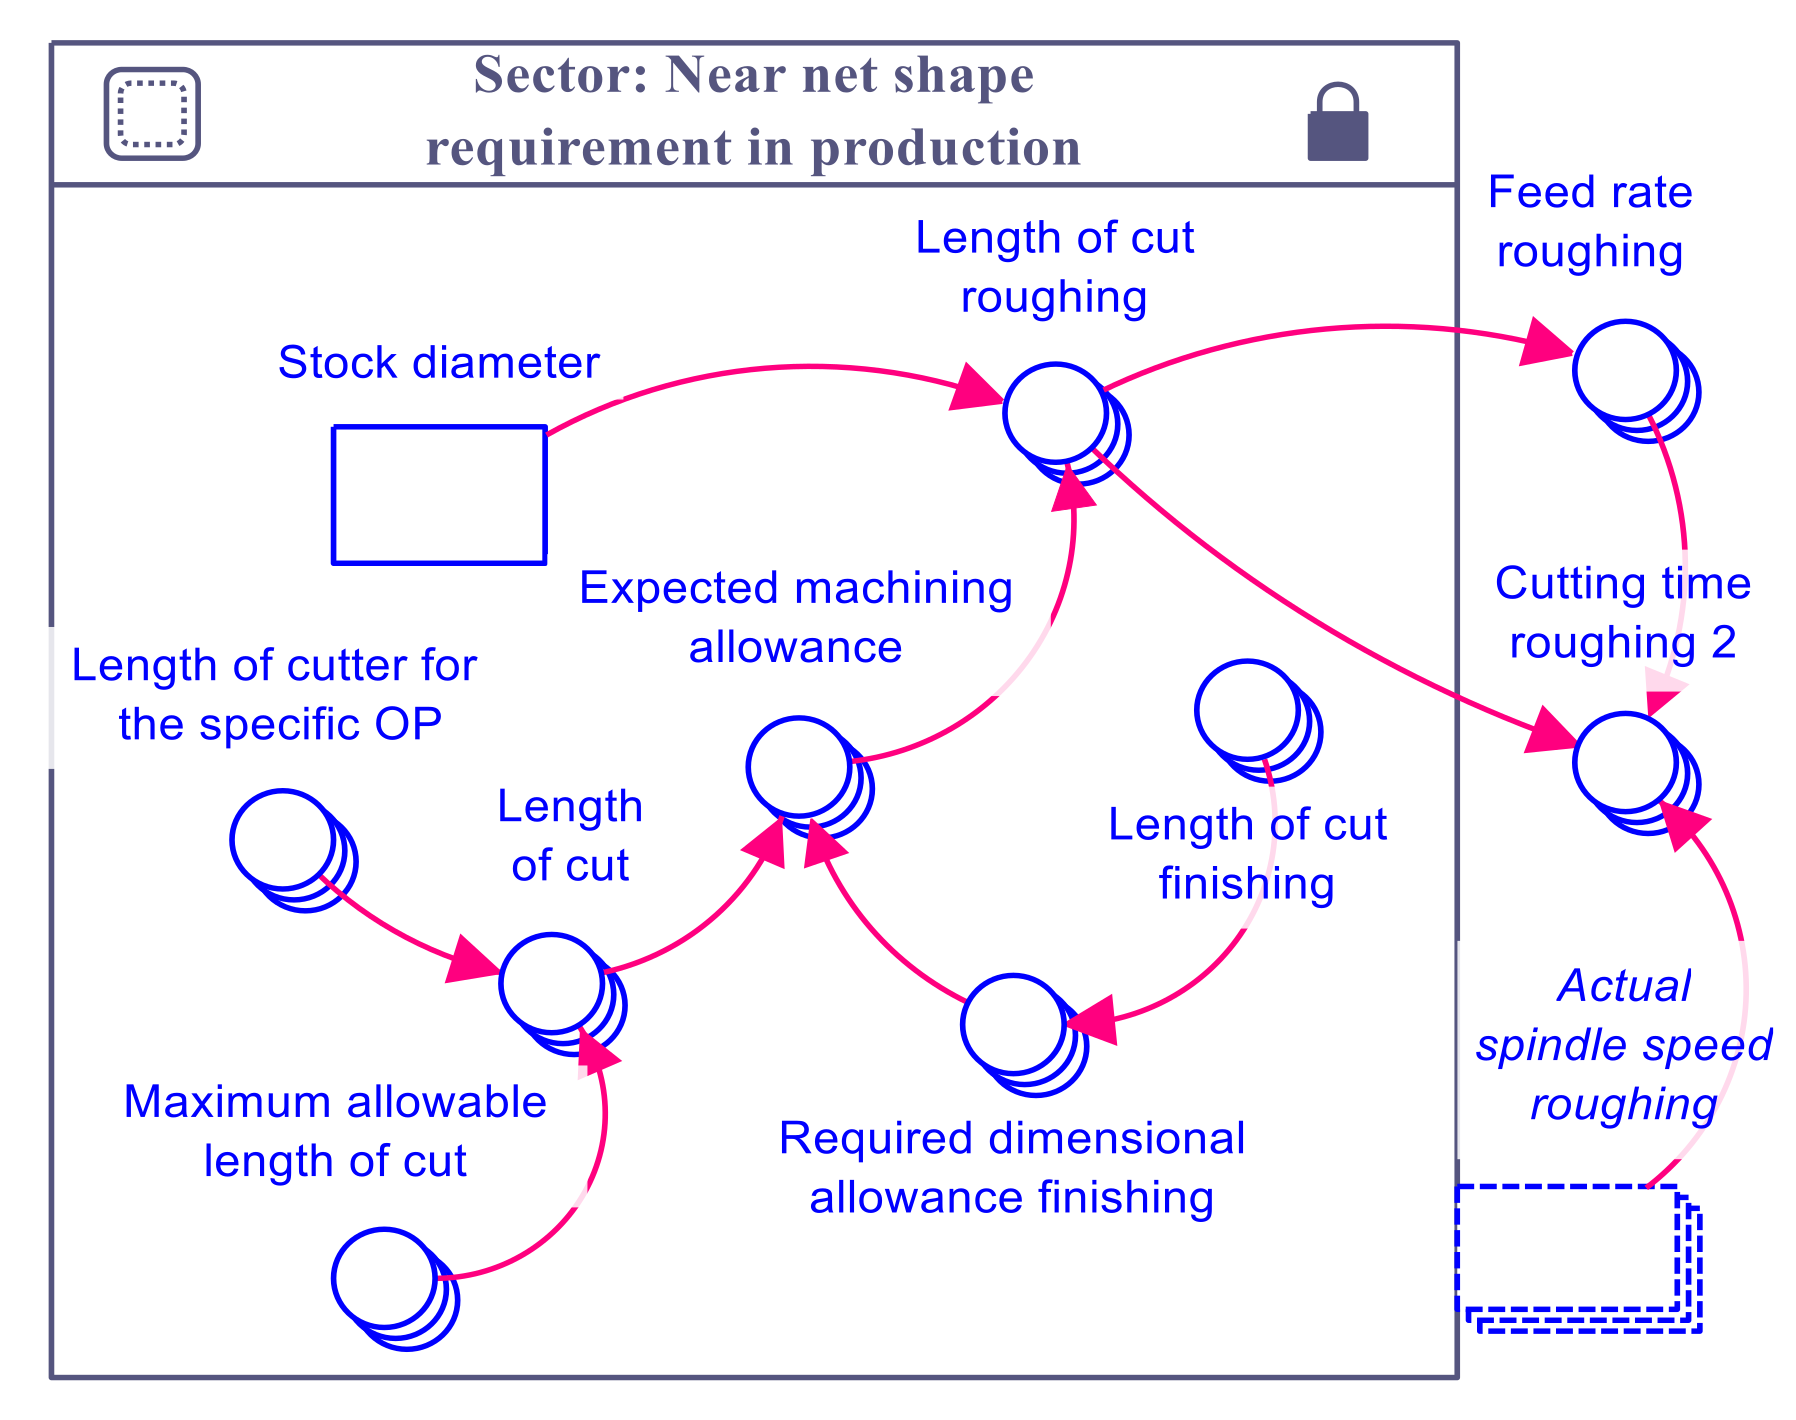
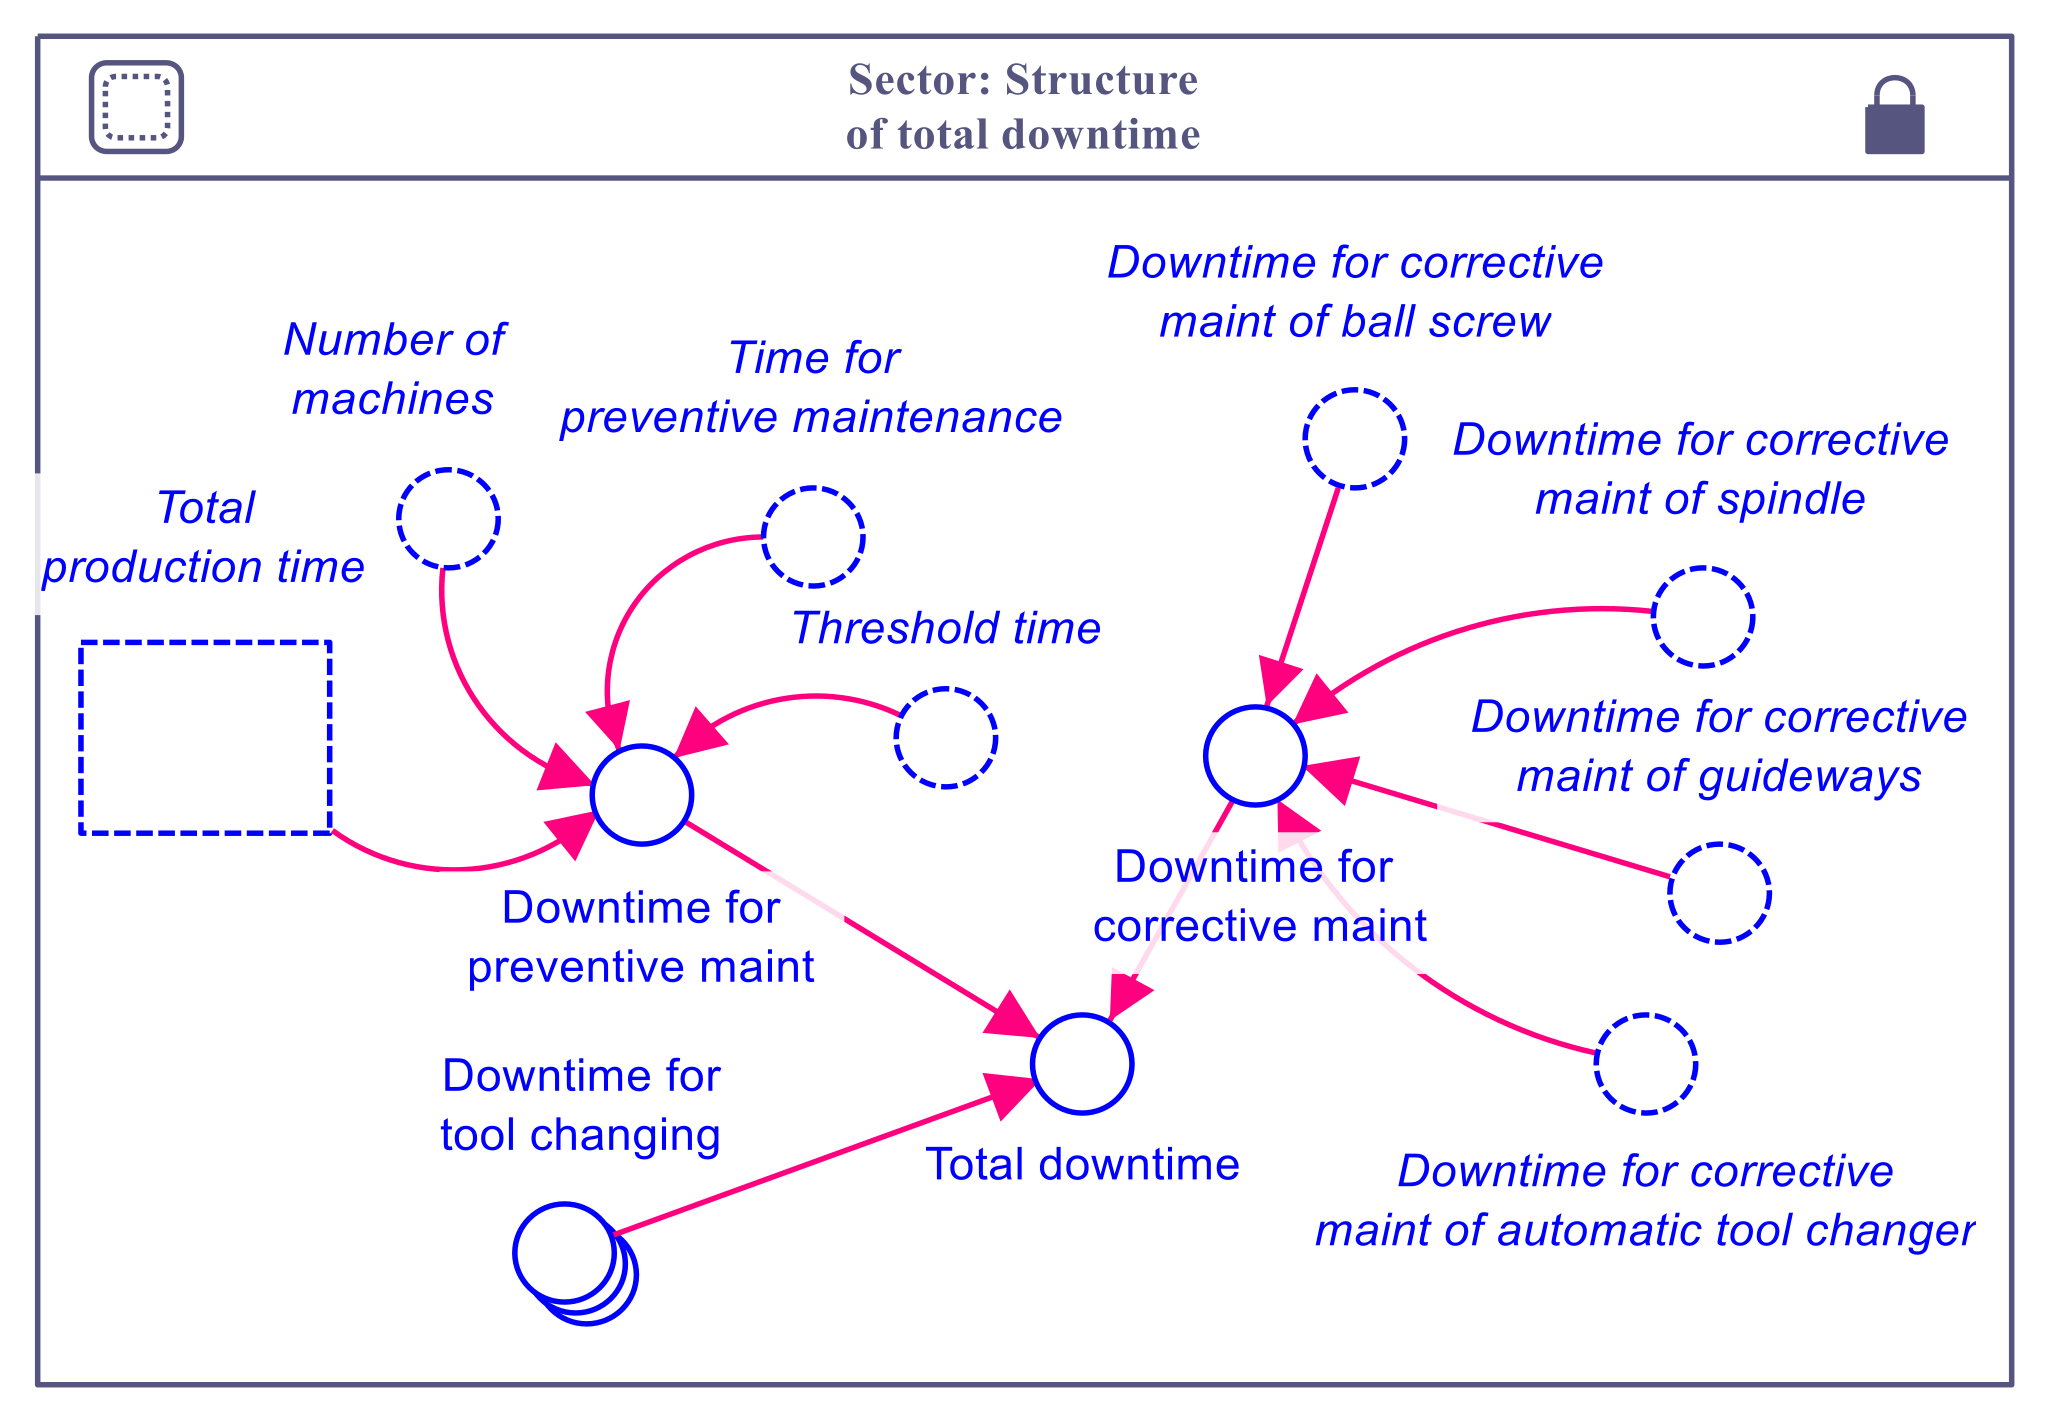
Manufacturing companies are adopting various strategies to enhance the performance of the manufacturing systems. A system dynamics model is presented herein to analyze the machining operations for some specific features of the engine block production. This model forms the standpoint for the development of a generic framework for performance analysis of manufacturing systems. The core of the model is represented by the interaction between process and system parameters with respect to key technological and cost performance measures. Accordingly, the model analyzes the intricate interaction between manufacturing system parameters and the machine elastic structure in relation to the selected key performance measures. Namely, it includes the feedback loop structure of the operational parameters, machining process parameters, force/power and MRR, near-net shape production and maintenance modules. The model also encompasses the manufacturing metrics—the cost structure for capturing the cost per part for manufacturing. Input data from an engine block manufacturing process can be provided to simulate the results and validate the model. Hence, the model can be used as a performance evaluation tool for the manufacturing system of engine block machining and as a decision support system for selecting a suitable strategy for manufacturing system configuration. A sensitivity analysis could be carried out to determine the key parameters that should be taken into account for optimization or a controlling process. A new policy framework can be proposed to improve the existing system by changing the manufacturing strategy and varying the values of applicable parameters in the system. The effect of the variation of the different manufacturing system parameters and their interaction in different scenarios on the manufacturing system could be evaluated. In general, the model enables an understanding of industry relevant outcomes depending on the chosen setting and thus, can improve productivity and the performance criteria intended to be attained.
To sum up, the outcomes from the system dynamics modelling environment in this research work enable the following:
A generic model, developed for the performance evaluation of manufacturing systems for specific machining operations which can be used for adapting the production to various market situations. However, modification according to system specifications is required.
The model could evaluate the relationships between critical parameters in relation to the selected key performance criteria.
As described earlier, herein only the structure of the model and the procedures of how to analyze the simulation result have been presented. However, it is recommended that the simulation result of the model is analyzed by considering one process as an example; also the structure of the model should be validated.


