
Reinforcement Learning-Based Low-Altitude Path Planning for UAS Swarm in Diverse Threat Environments


1
Northwestern Polytechnical University, Xi’an 710129, China
2
Shenyang Aircraft Design and Research Institute, Shenyang 110035, China
*
Author to whom correspondence should be addressed.
†
These authors contributed equally to this work.
Drones 2023, 7(9), 567; https://doi.org/10.3390/drones7090567
Submission received: 26 July 2023
/
Accepted: 24 August 2023
/
Published: 4 September 2023
Abstract
:Unmanned aircraft systems (UASs) with autonomous maneuvering decision capabilities are expected to play a key role in future unmanned systems applications. While reinforcement learning has proven successful in solving UAS path planning problems in simple urban environments, it remains under-researched for some complex mountain environments. In this paper, the path planning of UAS swarm for the low-altitude rapid traverse in diverse environments is studied when facing the threats of complex terrain, radars and swarm failure. First, a UAS swarm radar detection probability is built up for evaluating the radar detection threat by a networked radar system, where the detection probability of a UAS swarm is equated to a single UAS with appropriate position and radar cross section named as the swarm virtual leader. Second, a reinforcement learning based path planning method is proposed to seek the optimal path for the swarm virtual leader which balances instantaneous reward, including detection probability and path constraints with terminal reward, including normal rate. Third, a formation optimization strategy is designed to further reduce the threat of radar detection through dynamically adjusting the formation geometry. Final, simulations in the complex environment have been carried out to evaluate the performance of the proposed method, where the path quality, task success rate and normal rate are counted as the performance indicators.
1. Introduction
With the innovation of technologies and hardware related to unmanned systems, Unmanned aircraft systems (UASs) play an important role in different task scenarios. Swarms are one example of UAS applications that have become a major focus of the UAS community. Additionally, the advantages of swarm UAS over individual UAS in terms of task efficiency are obvious [1], but there are other aspects of swarm UAS that need to be taken into account; for example, the logistical footprint and planning complexity of swarm UAS may be larger than that of an individual UAS. For example, in the monitoring of natural disasters, UAS swarm collaborative monitoring has a larger monitoring area and faster timing [2] in geographic mapping, and the detection of a terrain swarm can be more quickly completed using photography [3]. With the rapid development of artificial intelligence in recent years, the field of autonomous maneuvering decision making for UASs has become the target of expert research aimed at enabling UASs to accomplish the task of trajectory planning more quickly under multiple optimized conditions.
Swarm path planning in areas with radar, electromagnetic interference, or with other sources of interference is a challenging task because the swarm is at risk of detection, tracking, and failure, potentially resulting in not completing the task. Many countries are developing stealth UASs with minimized radar cross sections for radar-contested environments, including the methods for accessing it [4]. This approach can decrease the chances of radar detection and improve UAS survivability [5]. For successful swarm rapid traverse tasks in real-world scenarios, swarms must overcome various obstacles and uncertainties such as terrain obstacles, radar detection, and swarm failure. Therefore, efficient path planning strategies for swarm UASs in complex 3D environments have become an important research topic.
Some traditional path planning methods are widely used for rapid traverse tasks or path planning in the complex environment, but there are still some shortcomings. Based on the A-star algorithm, an improved algorithm that can meet the efficiency and accuracy requirements of the algorithm in a complex three-dimensional environment is proposed, which makes the route have higher safety and lower cost [6]. To consider both terrain and UAS constraints, Ref. [7] introduces a particle swarm optimization algorithm, which improves the performance through adaptive speed tuning, chaotic initialization, and an improved logistic chaotic map that considers terrain and UAS performance constraints to find paths with higher safety and a smaller cost function. An improved complete particle swarm optimization-based 3D path planning algorithm [8] is proposed, which considers terrain threats, radar detection, and infiltration time. In [9], a framework for optimizing the trajectory of multiple UASs in dynamic rapid traverse task planning is preset, considering diverse obstacles and perception constraints. In the field of UAS swarm path planning, several studies have proposed effective methods to address specific challenges, such as radar detection and terrain constraints. For example, Ref. [10] proposed genetic algorithms for threat avoidance path planning with good feasible solutions, while a method that can successfully plan paths in complex obstacle environments [11] is proposed. However, many of these methods rely on optimizing a specific objective function, which can lead to suboptimal results and slow optimization times.
Reinforcement learning (RL) based methods for trajectory planning are gaining popularity [12,13,14]. RL can be used to solve a specific problem for optimal control as well as traditional methods. In RL, an agent achieves an optimal solution to a problem by continuously interacting with the environment and receiving rewards or penalties based on its behavior to obtain the maximum accumulated reward. RL is more successful in finding the optimal control of complex problems because the agent can improve itself over time by interacting more with the environment. One of the reasons why RL is effective in finding optimal solutions is its ability to handle problems in complex environments by maximizing the reward value and iteratively learning from experience. This robustness is a key factor in the success of RL-based methods. In [15], a deep reinforcement learning approach is proposed for the radar route planning that can handle the problem of sparse rewards and improve the performance of the learning agent. To improve the convergence speed of the algorithm, a Relevant Experience Learning-DDPG approach is proposed in [16], which finds the most similar experience to the current state for learning using expert knowledge. Considering the threat of radar, a situational assessment model is constructed, and the path planning problem of UASs in a multi-threat environment is solved using the dual deep Q-networks algorithm [17]. A two-aircraft cooperative penetration strategy based on DRL is proposed [18] for the continuous action space, and an approximate strategy optimization algorithm is used to achieve a two-aircraft cooperative reconnaissance mission. Existing reinforcement learning methods can solve the problem of UAS penetration path planning in some complex environments, but most of them only plan paths in two-dimensional planes and do not consider the impact of terrain changes on paths. And the studies that have considered terrain threats in 3D environments did not explore the threat and failure assessment of UASs by other factors such as radar, but only did avoidance training.
Despite numerous works on UAS rapid traverse path planning, several key issues remain unresolved. In many cases, radar is considered an impassable obstacle, but due to the difficulty in finding a path that completely avoids radar, the planned path of the UAS must pass through it. Few works consider path planning based on UAS swarm rapid traverse tasks, usually because too many UASs would require a large amount of computing resources and increase the overall system complexity, and it is difficult to estimate the radar detection probability of the UAS swarm. Generally, when a UAS reaches its target position, the task is considered complete. Previous works have considered the normal operation rate of the swarm to a lesser extent, focusing more on the path cost at individual waypoints and swarm collision avoidance. In [19], although radar detection and tracking is taken into account during path planning, the possibility of failure to the UAS while traveling is not addressed. The swarm planning process is only concerned with energy consumption and collision avoidance [20,21]. However, when the swarm rapidly traverses diverse threats area, the UASs in the swarm can failure, so using the normal operation rate (normal rate) as a new indicator can better optimize the paths. We correlate the probability of UAV failure due to electromagnetic interference or other sources of interference in the threat area with the more complex probability of radar detection in the subsequent discussion.
In this paper, a framework for UAS swarm path planning based on reinforcement learning and formation control algorithms is proposed to address the aforementioned issues while ensuring the safety, efficiency, and robustness of the planned path. Our method outperforms existing approaches by planning high-quality paths in complex environments in a shorter time, and by increasing the success and normal rates of the swarm for completing the task. We summarize our contributions as follows:
- 1.
- An effective equivalent model method for establishing the radar detection probability of a UAS swarm in a network radar system is proposed. By considering the number of UASs in a radar resolution cell and the radar cross section of each UAS, the detection probability of a UAS swarm can be approximated as that of a single UAS. This approximation allows for the simple and rapid calculation and evaluation of the swarm’s detection probability.
- 2.
- A novel path planning method based on reinforcement learning is proposed, which balances the instantaneous rewards and terminal rewards. This method considers normal rate as a key indicator and takes into account the threat of failure to the swarm along the path, thereby forming an optimized path.
- 3.
- A formation optimization strategy is presented that can reduce the probability of detection and mitigate the threat of failure. By dynamically adjusting the formation geometry of the swarm, we optimize the number of UASs in each radar resolution cell to ensure that the radar detection probability of the UAS swarm does not exceed a predetermined threshold.
- 4.
- We present extensive simulations and experiments of the proposed method, and these results show that our method outperforms existing methods in terms of combined path quality, task success rate, and swarm normal rate.
The remainder of this paper is organized as follows. Section 2 introduces the problem formulation. In Section 3, we present the swarm rapid traverse algorithm based on reinforcement learning. Section 4 discusses the control of the movement of all UASs in the swarm, based on the results obtained from the reinforcement learning component. The simulation results of the algorithm are analyzed in Section 5. Finally, we summarize the paper in Section 6.
2. Problem Formulation
2.1. UAS Dynamics Model
The focus of this paper is on the maneuvering decision of the UAS in a three-dimensional space. Still, we do not consider the influence of external conditions such as wind while ignoring the side-slip angle of the UAS. The relationship between the coordinate system and each angle of the UAS is shown in Figure 1.
In the inertial coordinate system, the X-axis points positively to the north, the Y-axis points positively to the east, and the Z-axis is vertically upward. The dynamics equation of the UAS i is shown below.
where , denotes the position of UAS i, represents the current velocity of the UAS i, denotes the angle from the plane to , denotes the angle from the X-axis to the projection of in the plane and denotes the roll angle of the UAS around . g is the gravitational acceleration, and denote the overload of the UAS i, the first is the tangential overload and the second is the normal overload. We denote the control input as
2.2. UAS Topology Model
We adopt a leader–follower formation control approach, where this leader represents the virtual UAS. The path of the entire UAS swarm is pre-planned and serves as a reference path for all UASs within the swarm, and all UASs follow this path. A UAS swarm with N UASs is pre-evenly divided into n groups, each of which has an independent virtual leader and is located at the geometric center of the group, defining the set of virtual leaders for the all groups as . It should be noted that the UAS formation configuration is constant in each group, so we can change the formation geometry of the swarm by adjusting the distance between the virtual leaders of different groups. Based on this, we can dynamically change the number of UASs in a radar resolution cell.
Define a minimal spherical envelope of radius W such that it encompasses all the UASs in every group. A virtual leader l is set for the UAS swarm, and its collision radius is expanded to W, thus ensuring that the path planned based on l allows each group to avoid collision with obstacles while following. Therefore, the envelope of the virtual leader l is defined as
where denotes the position of the virtual leader l.
Denote the desired positions of the virtual leader l (VL) and the virtual leader in group j (VL) as and , respectively. Define a deviation vector
which specifies the deviation of the position of each group with respect to . Given by Equation (4), we can derive the desired position of the VL as follows,
The desired geometry formation of the UAS swarm is changed via tuning .
2.3. Equivalent Radar Detection Model for UAS Swarm
For a single radar system, the detection probability of UAS is only related to the distance from UAS to the radar center when the factors such as false alarm probability and transmitter power are known. In one cycle, the detection probability [22] of the radar is given by the following equation:
where denotes the false alarm probability of the radar, denotes the distance between the UAS and the radar, denotes the factor related to the radar power, and is the Radar Cross-Section (RCS) of one UAS. In this paper, the UASs are all homogeneous and each UAS maintains the same during flight.
When all UASs are located within one radar resolution cell as shown in Figure 2, the radar treats them as one target with position and the echo intensity is the superposition of the echo intensity of each UAS. That is, the RCS of N UASs in one radar resolution cell is .
In contrast, when the UASs are in separate resolution cells, the radar system will determine that there are multiple targets. According to the elevation resolution cell , the azimuth resolution cell and the range resolution cell , the maximum distance between two adjacent resolution cells can be calculated as
The distance between groups in a UAS swarm is small compared to ; thus, we consider that if the distance between any two groups is less than , then they are in a radar resolution cell.
In the real world, multiple radars can be deployed to form a networked radar system to improve the detection performance, the model of which must be considered here. In the networked radar system, the number of resolution cells of different radars occupied by the swarm is different, so we use the worst case to represent the probability of being detected at this time. According to Equation (6), we define the probability that the networked radar system detects UASs in one resolution cell as:
where indicates the number of UASs in one resolution cell of radar i, denotes the performance parameter of the radar i, denotes the distance between the center of the UASs in the resolution cell and the radar i, denotes the total number of radars that can detect UASs, and is the worst case detection probability. We can obtain the equivalent model when planning the swarm path as follows:
where denotes the equivalent RCS value, and denotes the distance between the VL and radar i.
2.4. UAS Swarm Failure Model
According to the radar principle and tracking theory [23,24], the radar needs to detect the target for a sustained period of time to initiate a trajectory of target. And UASs can only failure if the radar can consistently track the swarm. Therefore, we first define the probability that groups of UASs located in one resolution cell are continuously tracked by the radar during the time interval [15].
where represents the event that the swarm is detected. Actually, is only the probability of whether the swarm is detected or not, not the probability of failure. Therefore, we further define the probability of failure for each UAS given that the swarm is detected.
where denotes the event of UAS i failure, denotes the radius of possible failure and is the position of VL. Eventually, we can evaluate whether each UAS failure by
2.5. Low-Altitude Rapid Traverse Task Description
The UAS swarm faces a variety of different threats when performing rapid traverse tasks on a complex environment. In this paper, the main threats considered by the swarm include collision with terrain, detection by radar, and swarm failure. The swarm needs to stay as far away from radar as possible during rapid traverse, reduce flight time in the radar area, and in the end state needs to reach the target position while maintaining a high normal rate and a short flight range. There are several task requirements that need to be accomplished by the swarm during the rapid traverse task:
- Avoid collision with terrain. Equation (3) is used to determine whether the virtual leader l collides with the terrain when planning the rapid traverse path, ensuring that is guaranteed at any time, where denotes the terrain obstacle space.
- Approach the target position. Normally, the swarm needs to be as close to the target location as possible at every moment to avoid exploring and traveling in the opposite direction. Therefore, the distance from the virtual leader l to the target position should decrease with time, where denotes the position of the target.
- If there is no threat, the swarm tend to travel at a preset low altitude . Radar does not easily detect near-ground targets due to the curvature of the earth and the interference of ground clutter with radar. However, if the altitude of swarm is too low, it will face threats from more types of threats.
- The swarm needs to pass through the radar area with a low probability of detection , reducing the number of failure UASs . The closer the swarm is to the center of the radar, the more easily it will be detected; the swarm needs to avoid being close to the radar during its flight.
Combining the situations of movement, altitude, radar detection and swarm failure, we define
where H denotes the altitude of the l, is the distance between the initial position and the target position and denotes the number of the normal UASs.
Define the real-time comprehensive situation in evaluating the rapid traverse process of UASs as
where and are scaling factors representing the impact of different situation factors on the situation assessment. Moreover, since the range of values of and differs greatly, we have to balance their effects by and . Therefore, the UASs rapid traverse planning decision problem can be considered as an optimization problem,
where denotes the set of control inputs for the VL, means is the function of and .
2.6. Algorithm Framework
In the context of reinforcement learning-based path planning for UAS swarms, whether each UAS should have its own individual network or share a network with the swarm depends on the specific application scenario and requirements.
If each UAS has its own separate network, it means that each UAS can make decisions. However, having a separate network for each UAS also has some drawbacks. First, this increases the complexity and cost of the system, requiring more hardware and software resources. Second, due to the lack of effective coordination mechanisms between UASs, conflicts and competition may arise among UASs, leading to a decrease in the overall efficiency and performance of the system. In contrast, by planning a path for the VL of the swarm and combining it with a cluster formation control algorithm, the complexity of the system can be effectively reduced and conflicts can be optimized. Therefore, compared with direct planning control for each UAS, we can control the UAS by the above simple and effective method, making full use of two different optimization strategies to solve the problem of swarm formation flight, as well as decomposing the complexity of the problem into smaller sub-problems, which is more conducive to the convergence of the algorithm, thus improving the efficiency and scalability of the algorithm. This paper proposes a method that combines a reinforcement learning and formation control algorithm to better enable collaboration within the swarm, thereby improving efficiency and performance. The flowchart is shown in Figure 3.
3. Rapid Traverse Task Planning Based on Deep Reinforcement Learning
In the path planning of UAS swarm, the normal rate is an important indicator, but it is difficult to accurately evaluate the final normal rate during the planning process. In addition, the objective function we propose has complex high-order nonlinearity, making it difficult to obtain the optimal solution. To better consider the factors of threat and normal rate in path planning, we adopt a deep reinforcement learning approach. Specifically, we incorporate threat into instantaneous rewards and normal rate into final rewards, to ensure that the swarm can successfully complete the task with high normal rate in the face of threats. By this approach, we can calculate an optimal path that considers the balance between threat and normal rate and ensures the UAS swarm can efficiently execute rapid traverse task in complex environments.
To be precise, we utilized proximal policy optimization (PPO). PPO is a cutting-edge, benchmark, model-free, on-policy, policy gradient reinforcement learning algorithm designed by OpenAI [25]. It improves upon the classical policy gradient (PG) algorithm and actor-critic (AC) algorithms [26]. PPO not only exhibits excellent performance and lower complexity, but also possesses superior tunability, finding the best balance between implementation, batch sampling efficiency, and ease of tuning. To attempt the implementation part, we first formulate our problem as MDP, and the key assumption of an MDP is that the probability of transitioning from one state to another depends only on the current state and the action taken, and not on any previous states or actions. The MDP is defined in terms of a tuple , where denotes the state space, denotes the action space, denotes the state transition probabilities, denotes the reward function, and denotes the discount factor, where , respectively, and several of these are discussed later.
3.1. State Space
The state of the virtual leader l of the UAS swarm can reflect information about the state of the swarm in the environment. We consider the design of the state space of the virtual leader l from three aspects: the first is the state of l, the second is the relative relationship between l and the target position , and the third is the relative distance of l and the radars. In this paper, the variables contained in the state space are listed in Table 1, where and denote the distance between l, the target position, and the angle between the line connecting them and the direction of the X-axis, respectively. denotes the distance between l and radar i. Overall, the state contains three parameters, as follows:
3.2. Action Space
In our problem setting, the action a is determined by the control input at each moment, and since is continuous, the action space is also continuous. The action space contains all feasible control inputs . The range of the action space is as follows:
where denote the tangential overload, normal overload, and roll angle of the UAS, respectively. Ultimately, the action space of VL can be regulated within a range, as shown in Figure 4. At each moment, the VL selects an action according to the current state of , i.e., it selects a control input and uses this control input to drive itself in the environment.
3.3. Reward Function
A well-designed reward function can effectively improve the convergence speed of the algorithm and optimize the final result; thus, how to design the reward function is a crucial part of reinforcement learning. The design of the reward function is based on the task requirements mentioned in Section 2.5. For the swarm corresponding to the VL, we design its reward function, as follows:
- The element that moves closer to the target position. In order to prevent the sparse reward problem [27] and improve the sampling efficiency, this paper uses a distance-based bootstrap reward. As shown in Equation (18), the virtual leader l will be rewarded for each approach to the target during the exploration of the environment.where are constants representing the weights of VL to the target distance, and the proximity to target, denotes the distance difference between the current moment and the previous moment to the target position.
- The element of altitude control. The altitude of the virtual leader during flight should tend to a desired altitude . When the virtual leader deviates from this altitude, the system will obtain a negative reward.where denotes the influence factor of altitude deviation on the system reward, and is the altitude of VL.
- The element of radar detection. The VL needs to reduce the radar detection as it approaches the target position. The closer the leader is to the center of the radar, the greater the penalty.where and denote the penalty factor of the swarm approaching the radar; is a preset parameter that denotes the danger range, i.e., the probability of being detected increases when the VL-to-radar distance is less than this value; denotes the effective detection distance of the radar.
- The element of swarm failure. The penalty term in the reward function is given for the degree of failure as follows:where is the number of normal UASs in the swarm, is the number of UASs failure and is a constant greater than zero that regulates the level of impact of the failure on the swarm.
- The element of reaching the target. The rewards on arrival at the target position are as follows:where denotes the normal rate of the UAS swarm after completing the task. After arriving at the target position and satisfying the normal rate, the system is rewarded heavily, prompting the system to converge more easily in subsequent training.
In summary, the evaluation reward function for maneuvers in the system can be defined as
where and indirectly affect the tendency of the system in path planning by influencing . When the weight of is greater, the swarm will demonstrate preference to the path that is less detected by radar, i.e., the safer path.
3.4. Proximal Policy Optimization
The PPO algorithm can be better applied to continuous control tasks, and its objective function is optimized as follows
with
where and represent the network weights before and after the update, respectively. The system effect is observed by the ratio of the action probability of the current strategy to the action probability of the previous strategy [25]. It means that if the current policy is more appropriate, the value of will be greater than 1, and vice versa, the value of will be between 0 and 1. The PPO algorithm improves the stability of the training agent behavior by restricting the policy updates to a small range. The clip function in Equation (25) is a truncation function that restricts the values of the old and new policy parameters to the interval . In brief, the purpose of this trick is to prevent the distribution of and from varying too much, while avoiding the problem of difficult network convergence. When the estimated advantage [28] is positive, it indicates that the current action has a positive impact on the optimization goal, and it helps the system to measure whether the action improves the default behavior of the policy. As illustrated in Algorithm 1, set the maximum number of iterations per training, and if the algorithm can output a feasible solution within this number limit, then this solution must satisfy and at any time t.
| Algorithm 1: RL-Based Path Planning for Swarm Virtual Leader l |
 |
4. Formation Optimization Strategy
Based on the previous section, we can obtain a reference path for the entire UAS swarm. Although the swarm radar detection probability of each waypoint is considered when planning this reference path, a strong constraint is not imposed on this parameter, so there may be some waypoints with higher radar detection probability on the path. These waypoints will increase the threat of swarm failure and undermine the effectiveness of the final rapid traverse task. Therefore, this section presents the strategy to optimize the rapid traverse task completion effect by changing the formation geometry of the UAS swarm.
4.1. Formation Geometry Change
According to Equation (9), the geometry of the formation affects the number of UASs in the radar resolution cell, which further affects . The swarm changes the formation geometry by splitting and merging groups, thus reducing the failure to the swarm. Splitting and merging of swarms can be achieved by changing the deviation vector . According to Equation (5), we can obtain the desired position for each group, and next discuss the solution of .
If the separation distance between two groups j and k is expanded to equal , i.e., , we consider them to be in different radar resolution cells. For an easy description, we define a distance set as
where denotes the distance interval between two adjacent groups.
Define the instruction for the formation geometry change, as shown in Figure 5.
At time t, if a split operation is performed, ; if a merge operation is performed, . It should be noted that the UAS swarm consisting of n groups that can be split up at most e times satisfies relation .
When , the groups keep the initial position deviation . When , we define the set of elements in the part of the set that needs to be updated as so that the elements in it are equal to and the rest of the elements in remain unchanged, and is defined as follows
Based on Equation (28) and the reference waypoint in , we can obtain the deviation vector that satisfies Equation (27). Finally, according to Equation (5), the desired position of the VL can be computed.
The flowchart is shown in Figure 6, where denotes the set detection probability threshold.
4.2. Control Law
As for the control law, we only use the potential field. To begin with, it should be noted that if the swarm needs to split, then the desired position of the front group will move forward along the reference path, so that the attractive force will drive the group to split forward; similarly, if the swarm needs to merge, then the back group will also be driven to merge forward.
An artificial potential field is used here to drive the group to chase its desired position. The attractive force of each group is designed as follows:
where is the positive parameter of the attractive force.
To avoid collisions between groups, there exists a repulsive potential field and a repulsive force. The repulsive potential field generated by group j and its neighboring groups is defined as
where denotes the distance between the VL and VL, indicates the safe distance; if the distance between any two groups is less than it, they will collide, and is the proportional coefficient. From Equation (30), the total potential field generated by the virtual leader of all groups is given by
Then, the repulsive force is the partial derivative of the total repulsive potential field, as shown below
According to Equation (32), it can be observed that the repulsive force on ranges from positive infinity to zero along with d ranging from to . Obviously, the closer the virtual leaders of two adjacent groups are, the greater the repulsive force is, and it does not make their distance less than . For , it is subjected to the following combined force
Then, the combined force can be resolved into two components along the longitudinal axis and the vertical axis, denoted as and , respectively. and can be calculated from and . Based on this, we can obtain the control input of the virtual leader for each group and use it to control the motion of the whole group.
5. Experiments
In this section, we first introduce the experimental setup, and then give the simulation results of the UAS swarm performing the rapid traverse task under different conditions, analyze the different simulation results, and give the number of normal UASs when the final swarm reaches the target position.
5.1. Environment and Training Setup
The experiments are conducted in a simulated mission area, and the simulation sets the planning scenario in a rectangular area of a size 230 km × 160 km × 1.6 km, corresponding with the x, y and z coordinate axes, respectively. As shown in Figure 7, We set two initial positions and one ending position in the environment, and deploy five radars around the line connecting the starting points and ending point, and the coordinate information is shown in Table 2, where z denotes the terrain altitude corresponding to x, y.
The parameters mentioned in the previous section and the parameters of the algorithmic model are set in Table 3.
In the simulation of the swarm’s rapid traverse, the neural network structures are all fully connected neural networks, the output layer uses a activation function, and all others are activation functions. The learning rate is 0.000125, the discount factor is 0.9, and the number of samples taken in batch during training is 64. The decision cycle of the system is 1 s, and a maximum of 550 decisions are made for an episode. The training round ends if any of the following conditions are met: the training exceeds the max_episode_length; the swarm collides with the terrain or reaches the target.
5.2. Simulation Setup and Evaluation Indicators
The number of failure UASs is related to a random judgment of the probability of failure for each UAS. To further validate the effectiveness of the proposed method, so we perform a numerical simulation of the swarm rapid traverse system using the Monte Carlo method. There are four indicators established to evaluate the simulation results:
- Average path length (APL, ): The average length of the planned path should be as short as possible to reduce energy consumption, time costs, and the risk of being detected.
- Average rapid traverse success rate (APSR, ): Given the total time of a simulation, the number of simulations in which the UAS swarm completed the rapid traverse task is counted as a percentage of the total number of simulations. This index can evaluate the learning efficiency of the evaluation environment and reward settings in the algorithm.
- Average swarm normal rate (ASSR, ): It implies the average UAS normal rate among all simulations that completed the task. Higher normal rate indicates better resistance and reliability, which is essential for successful deployment of UAS swarm. This indicator is crucial for assessing the operational effectiveness of the swarms in carrying out their tasks.
- Average algorithm computation time (AACT, ): The computation time of the algorithm is measured and should be as short as possible to ensure a real-time and efficient performance.
At the same time, evaluation indicators need to be defined:
where M is the total number of Monte Carlo simulations; is the index of the simulation. denotes whether the single planning is successful or not, and takes the value of 1 if successful. , , and denote ASSR, APL, AACT, and APSR, respectively.
To examine the ability of the swarm to perform tasks in the constructed simulation environment, tests are performed by varying the number of radars and the parameters and . We combined with different ratios of , and conducted corresponding experiments and analyses. Then, the algorithm proposed in this paper is compared and analyzed with the classical A* and RRT* algorithms to prove the scalability, adaptability, and robustness of the algorithm by comparing the abovementioned indicators.
5.3. Results and Discussions
Multiple radars are present in the rapid traverse path to enable the tracking and constraint of the swarm. The overall goal of swarm rapid traverse is to plan a path that avoids collisions while balancing range and failure. Based on this, five radars are deployed in the environment, and the parameter is set. The UAS swarm starts the rapid traverse task from two initial positions, where the swarm passes through the radar detection areas and approaches the target position. The formation geometry is changed in the radar area to reduce the probability of detection and to guarantee the normal rate of the UASs in the final arrival at the target position.
Using the built swarm rapid traverse model to solve the problem, the path of the swarm is obtained as shown in Figure 8, and the 3D path is shown in Figure 9. In Figure 8a, the swarm passes through one radar area, while the swarm passes through two radar areas in Figure 8b. The formation geometry change instruction for the swarm in the radar areas along the two paths mentioned above is shown in Figure 10a, where the X-axis represents the time series of the swarm after entering the radar area. The green and red lines correspond to the paths in Figure 8a,b. That is, the virtual leader crosses two radar areas in Figure 8b, the first two subplots in Figure 10a represent the instruction changes for this case.
According to Section 2.4, we can obtain the change in the number of UASs in the radar areas as shown in Figure 10b. The results showed that the number of UASs in the UAS swarm that finally completed the rapid traverse task is 27 and 21, and the normal rate of the swarm is 67.5% and 52.5%, respectively. In order to show more clearly the formation geometry changes of the UAS swarm during the task, we explain the path in Figure 8b as an example. And according to Equation (12), we can evaluate and decide whether each UAS is failure or not, and get the final normal state of the swarm as shown in Figure 11. The UAS swarm first maintains the initial formation geometry. After entering the radar area, it gradually splits, increasing the distance between groups, and the formation geometry changes the most when it is closest to the radar. During the flight away from the radar region, the swarm merges and converges to the initial formation geometry.
To demonstrate the capability of the proposed algorithm to handle rapid traverse tasks in unknown environments and to validate its generalization and robustness, we randomly generate positions for swarms and vary the number of radars in the environment. The proposed algorithm is then evaluated in these randomly generated environments, and the results are shown in Figure 12.
When , we combine different radar numbers with different ratios of , and the results of the evaluation indicators are shown in Figure 13. Based on the results, it is obvious that the ASSN decreases as the number of radars increases. This is because an increase in the number of radars increases the probability of the swarm being in the radar area, making it more prone to failure. We can clearly observe the impact of the parameters on the indicators. A smaller value of means that the swarm pays more attention to the negative impact of the radar; thus, it tends to avoid the radar. On the contrary, the larger the value, the more the swarm tends to move towards the target position. Therefore, the total path length is inversely proportional to this ratio.
The simulation environment for the comparison test of the proposed algorithm with the improved A* algorithm and RRT* algorithm is shown in Figure 7, and results of the comparison test are shown in Table 4, where the cost function settings in the comparison algorithm are consistent with the proposed algorithm.
From the experimental results in Table 4, it can be observed that:
- 1.
- The proposed algorithm increases , and in the normal rate compared with the other two algorithms, respectively. It shows that the proposed algorithm can obtain flight paths with a lower detection probability and improve the normal rate of UASs.
- 2.
- The proposed algorithm is slightly longer than the A* algorithm in terms of path length , but it outperforms the A* algorithm in terms of the speed of solution. Compared with the RRT* algorithm, the path length is reduced by . Compared with the traditional algorithm, the proposed algorithm can obtain a shorter flight path, which enables the UAS cluster to cross the detection threat area quickly.
- 3.
- The proposed algorithm is shorter than the other two algorithms in terms of running time , with a significant reduction of and in computing time, respectively. In complex environments, the proposed algorithm is more adaptable, i.e., it is more capable of handling unknown environments and abnormal situations, because it can adjust its strategy according to the changes in the environment, thus finding the optimal path quickly.
- 4.
- The proposed algorithm is higher than the other two algorithms in terms of a rapid traverse success rate , which indicates that the algorithm has a better robustness and stability.
6. Conclusions
In this paper, a novel path planning method for a UAS swarm rapid traverse task is proposed, which enables the swarm to achieve the goal of improving normal rate under the condition of no collision. First, the dynamics model of UAS and the radar detection model are established, and the task requirements of the flight are clarified, which lay a good foundation for the subsequent effective training. Second, the principle of deep reinforcement learning is introduced. A reasonable state space, action space, and reward function are designed to effectively avoid the disadvantage of reward sparsity in long-running time systems and make the network converge effectively. Then, the reinforcement learning algorithm is combined with the formation control algorithm, and the output of the network is applied to the algorithm of the formation keeping and reconfiguration to control the movement of UASs in the swarm, avoiding the direct processing of the high-dimensional UAS cluster information. Final, the simulation results demonstrate that the proposed algorithm can significantly enhance the normal rate of the swarm after the rapid traverse task.
In future work, we will study end-to-end UAS decision making and planning methods to accomplish tasks such as the real-time dynamic obstacle avoidance of UAS swarms by adding sensor information.
Author Contributions
Conceptualization, L.F. and J.H.; methodology, L.F.; software, L.F.; validation, Y.L., Z.X. and W.F.; formal analysis, L.F. and J.H.; investigation, Y.L. and Z.X.; resources, G.X.; data curation, L.F.; writing—original draft preparation, L.F. and J.H.; writing—review and editing, L.F. and J.H.; visualization, L.F. and Y.L.; supervision, W.F. and G.X.; project administration, J.H. and G.X.; funding acquisition, G.X. All authors have read and agreed to the published version of the manuscript.
Funding
This document is the results of the research project funded by National Natural Science Foundation of China (52372434), New Concept Air Combat Weapon Technology Innovation Workstation (20-163-00-GZ-016-001-01) and Aeronautical Science Foundation of China (2019ZA053008, 20185553034).
Data Availability Statement
Not applicable.
Conflicts of Interest
The authors declare no conflict of interest.
References
- Chen, W.; Liu, J.; Guo, H.; Kato, N. Toward robust and intelligent drone swarm: Challenges and future directions. IEEE Netw. 2020, 34, 278–283. [Google Scholar] [CrossRef]
- Hu, J.; Niu, H.; Carrasco, J.; Lennox, B.; Arvin, F. Fault-tolerant cooperative navigation of networked UAV swarms for forest fire monitoring. Aerosp. Sci. Technol. 2022, 123, 107494. [Google Scholar] [CrossRef]
- Gomez, C.; Purdie, H. UAV-based photogrammetry and geocomputing for hazards and disaster risk monitoring—A review. Geoenviron. Disasters 2016, 3, 23. [Google Scholar] [CrossRef]
- Li, Y.; Huang, J.; Hong, S.; Wu, Z.; Liu, Z. A new assessment method for the comprehensive stealth performance of penetration aircrafts. Aerosp. Sci. Technol. 2011, 15, 511–518. [Google Scholar] [CrossRef]
- Zhang, Z.; Jiang, J.; Wu, J.; Zhu, X. Efficient and optimal penetration path planning for stealth unmanned aerial vehicle using minimal radar cross-section tactics and modified A-Star algorithm. ISA Trans. 2023, 134, 42–57. [Google Scholar] [CrossRef]
- Zhang, Z.; Wu, J.; Dai, J.; He, C. Optimal path planning with modified A-Star algorithm for stealth unmanned aerial vehicles in 3D network radar environment. Proc. Inst. Mech. Eng. Part G J. Aerosp. Eng. 2022, 236, 72–81. [Google Scholar] [CrossRef]
- Chu, H.; Yi, J.; Yang, F. Chaos Particle Swarm Optimization Enhancement Algorithm for UAV Safe Path Planning. Appl. Sci. 2022, 12, 8977. [Google Scholar] [CrossRef]
- Luo, J.; Liang, Q.; Li, H. UAV penetration mission path planning based on improved holonic particle swarm optimization. J. Syst. Eng. Electron. 2023, 34, 197–213. [Google Scholar] [CrossRef]
- Fu, J.; Sun, G.; Yao, W.; Wu, L. On Trajectory Homotopy to Explore and Penetrate Dynamically of Multi-UAV. IEEE Trans. Intell. Transp. Syst. 2022, 23, 24008–24019. [Google Scholar] [CrossRef]
- Leng, S.; Sun, H. UAV Path Planning in 3D Complex Environments Using Genetic Algorithms. In Proceedings of the 2021 33rd Chinese Control and Decision Conference (CCDC), Kunming, China, 22–24 May 2021; pp. 1324–1330. [Google Scholar]
- Zhang, Z.; Tang, C.; Li, Y. Penetration path planning of stealthy UAV based on improved sparse A-star algorithm. In Proceedings of the 2020 IEEE 3rd International Conference on Electronic Information and Communication Technology (ICEICT), Shenzhen, China, 13–15 November 2020; pp. 388–392. [Google Scholar]
- Guo, T.; Jiang, N.; Li, B.; Zhu, X.; Wang, Y.; Du, W. UAV navigation in high dynamic environments: A deep reinforcement learning approach. Chin. J. Aeronaut. 2021, 34, 479–489. [Google Scholar] [CrossRef]
- Hu, Z.; Gao, X.; Wan, K.; Evgeny, N.; Li, J. Imaginary filtered hindsight experience replay for UAV tracking dynamic targets in large-scale unknown environments. Chin. J. Aeronaut. 2022, 36, 377–391. [Google Scholar] [CrossRef]
- Fan, T.; Long, P.; Liu, W.; Pan, J. Distributed multi-robot collision avoidance via deep reinforcement learning for navigation in complex scenarios. Int. J. Robot. Res. 2020, 39, 856–892. [Google Scholar] [CrossRef]
- Alpdemir, M.N. Tactical UAV path optimization under radar threat using deep reinforcement learning. Neural Comput. Appl. 2022, 34, 5649–5664. [Google Scholar] [CrossRef]
- Hu, Z.; Gao, X.; Wan, K.; Zhai, Y.; Wang, Q. Relevant experience learning: A deep reinforcement learning method for UAV autonomous motion planning in complex unknown environments. Chin. J. Aeronaut. 2021, 34, 187–204. [Google Scholar] [CrossRef]
- Yan, C.; Xiang, X.; Wang, C. Towards real-time path planning through deep reinforcement learning for a UAV in dynamic environments. J. Intell. Robot. Syst. 2020, 98, 297–309. [Google Scholar] [CrossRef]
- Zhao, X.; Yang, R.; Zhang, Y.; Yan, M.; Yue, L. Deep Reinforcement Learning for Intelligent Dual-UAV Reconnaissance Mission Planning. Electronics 2022, 11, 2031. [Google Scholar] [CrossRef]
- Hameed, R.; Maqsood, A.; Hashmi, A.; Saeed, M.; Riaz, R. Reinforcement learning-based radar-evasive path planning: A comparative analysis. Aeronaut. J. 2022, 126, 547–564. [Google Scholar] [CrossRef]
- Monwar, M.; Semiari, O.; Saad, W. Optimized path planning for inspection by unmanned aerial vehicles swarm with energy constraints. In Proceedings of the 2018 IEEE Global Communications Conference (GLOBECOM), Abu Dhabi, United Arab Emirates, 9–13 December 2018; pp. 1–6. [Google Scholar]
- Quan, L.; Yin, L.; Xu, C.; Gao, F. Distributed swarm trajectory optimization for formation flight in dense environments. In Proceedings of the 2022 International Conference on Robotics and Automation (ICRA), Philadelphia, PA, USA, 23–27 May 2022; pp. 4979–4985. [Google Scholar]
- Fang, X.l.; Yang, Y.x. Radar target detection range model based on detection probability. Mod. Radar 2008, 30, 18–20. [Google Scholar]
- Skolnik, M.I. Introduction to Radar Systems; McGraw Hill: New York, NY, USA, 1980. [Google Scholar]
- Levanon, N. Radar Principles; John Wiley & Sons: New York, NY, USA, 1988. [Google Scholar]
- Schulman, J.; Wolski, F.; Dhariwal, P.; Radford, A.; Klimov, O. Proximal policy optimization algorithms. arXiv 2017, arXiv:1707.06347. [Google Scholar]
- Sutton, R.S.; McAllester, D.; Singh, S.; Mansour, Y. Policy gradient methods for reinforcement learning with function approximation. Adv. Neural Inf. Process. Syst. 1999, 12, 1057–1063. [Google Scholar]
- Wang, C.; Wang, J.; Wang, J.; Zhang, X. Deep-reinforcement-learning-based autonomous UAV navigation with sparse rewards. IEEE Internet Things J. 2020, 7, 6180–6190. [Google Scholar] [CrossRef]
- Schulman, J.; Moritz, P.; Levine, S.; Jordan, M.; Abbeel, P. High-dimensional continuous control using generalized advantage estimation. arXiv 2015, arXiv:1506.02438. [Google Scholar]
Figure 1.
The model of UAS.
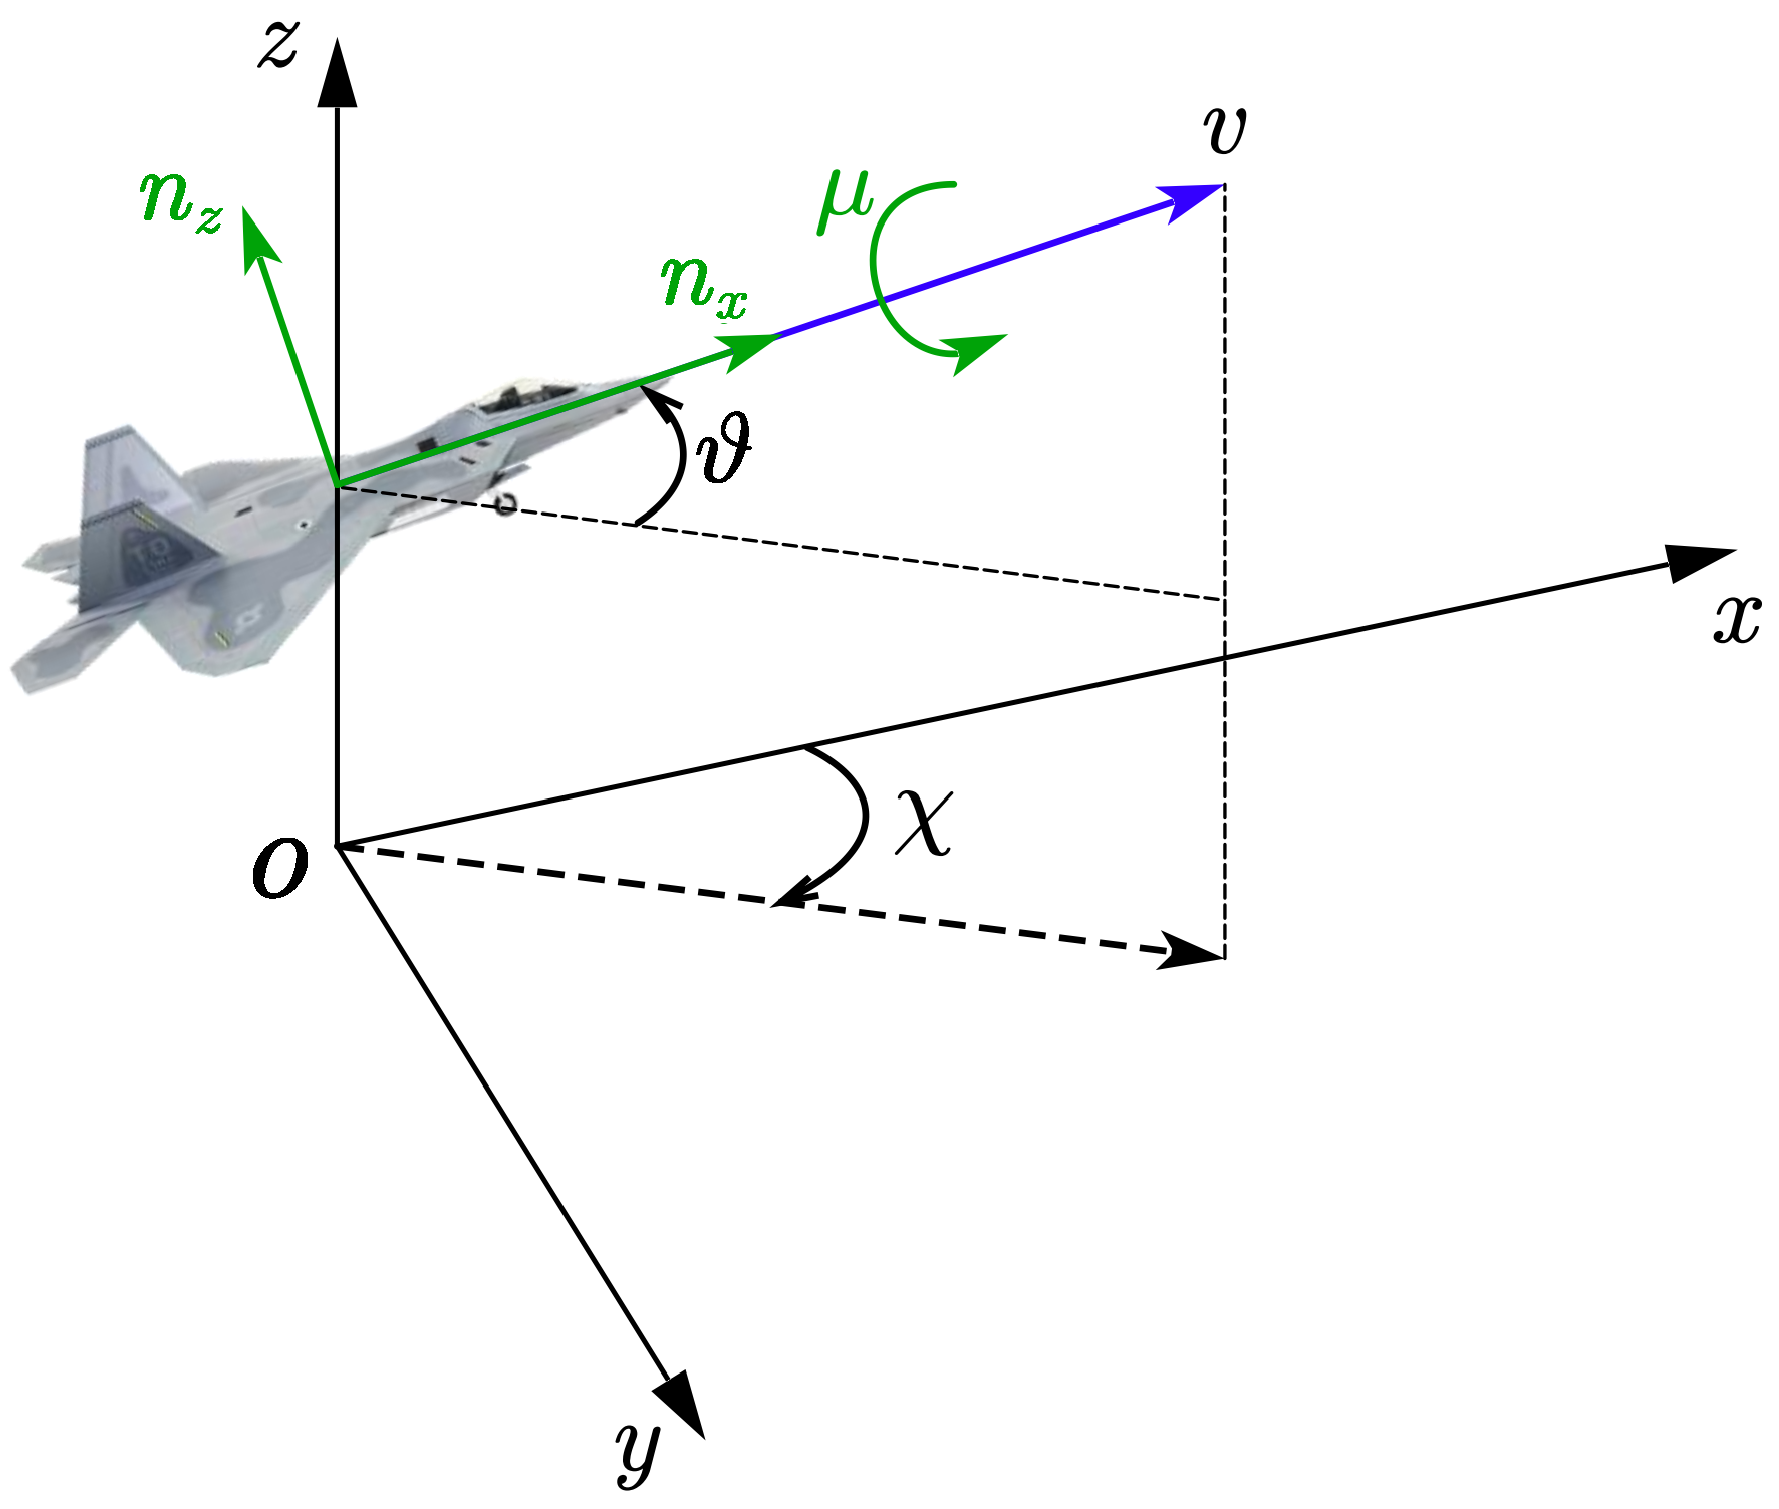
Figure 2.
N UASs in one resolution cell.
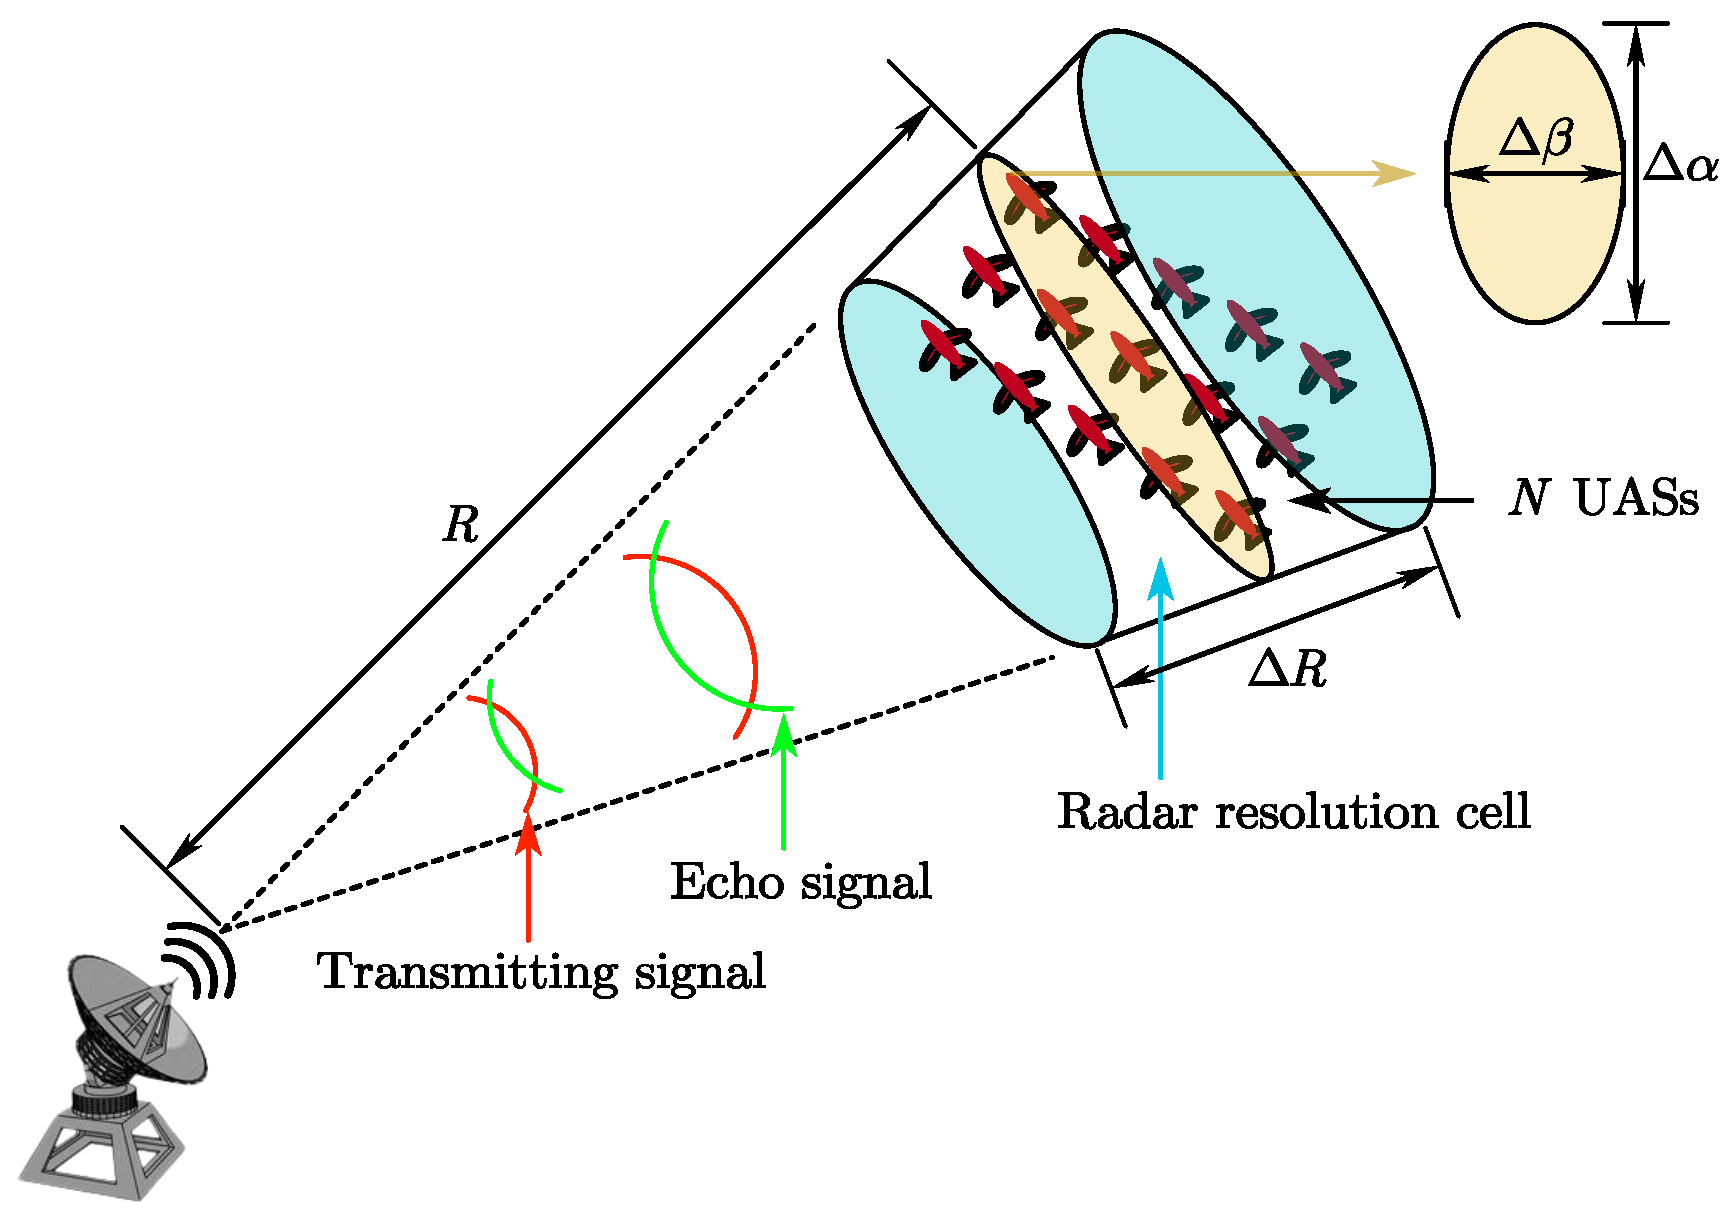
Figure 3.
The flowchart of algorithm framework.

Figure 4.
UAS action range.
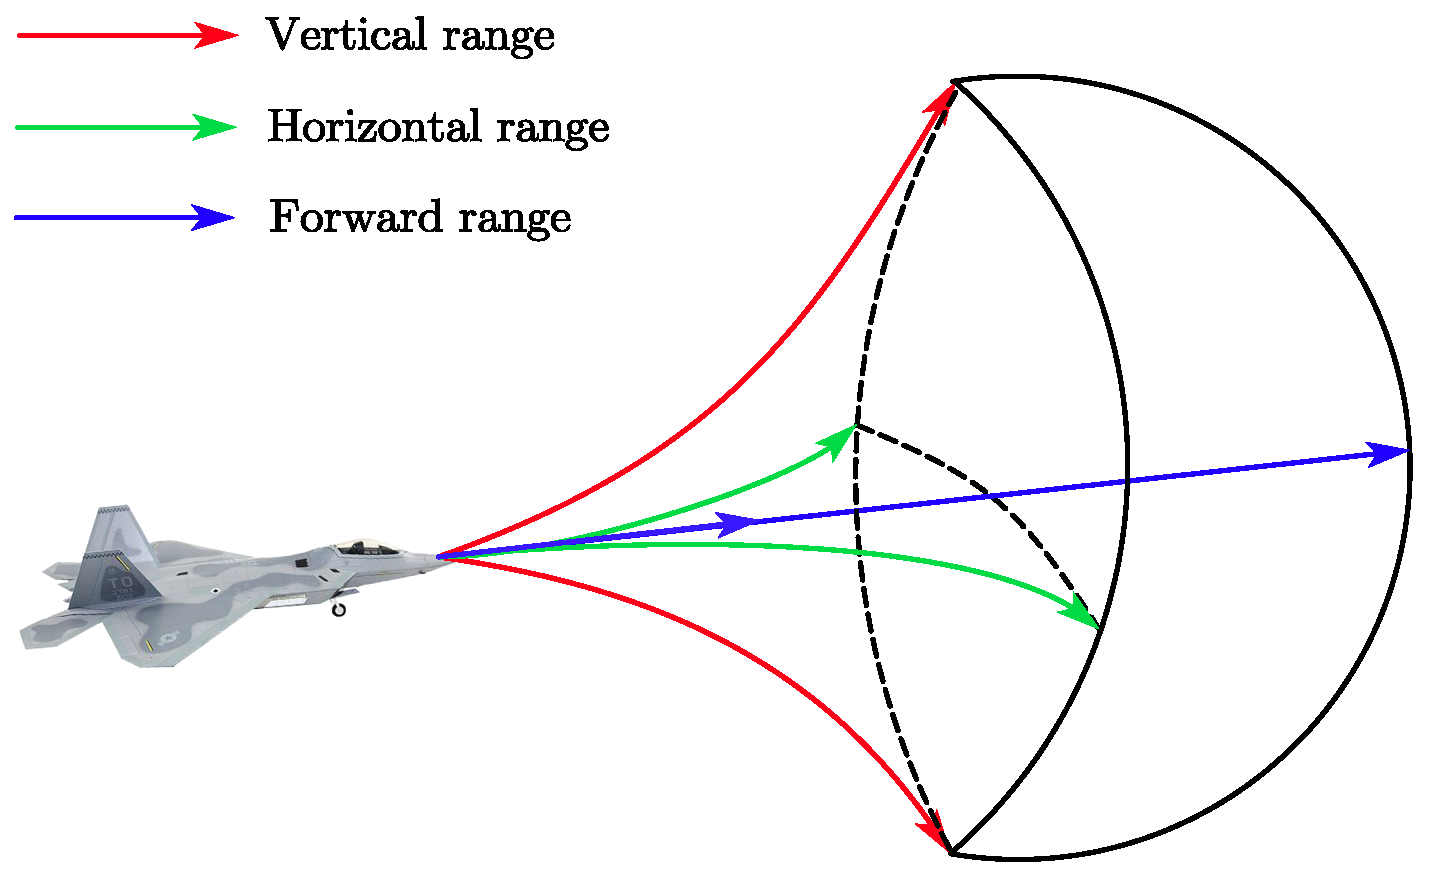
Figure 5.
Split and merge.
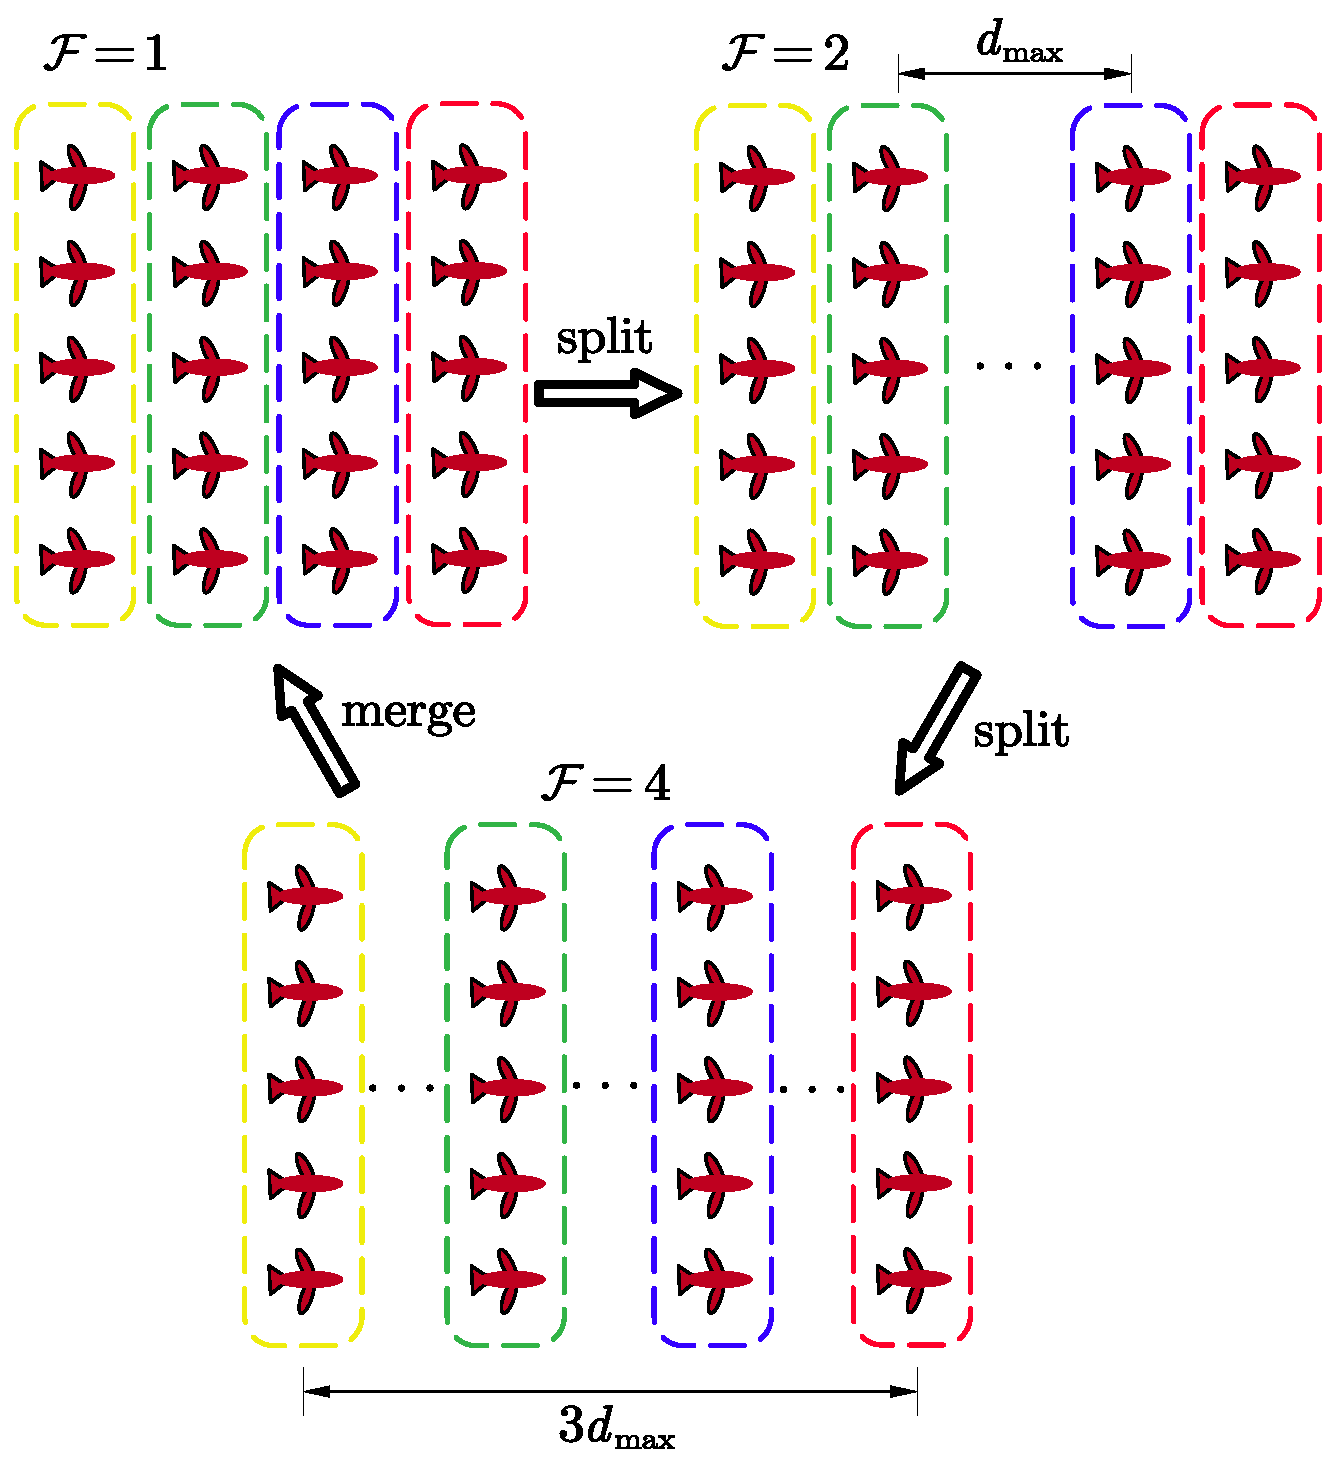
Figure 6.
The flowchart for calculating the desired position of the groups.
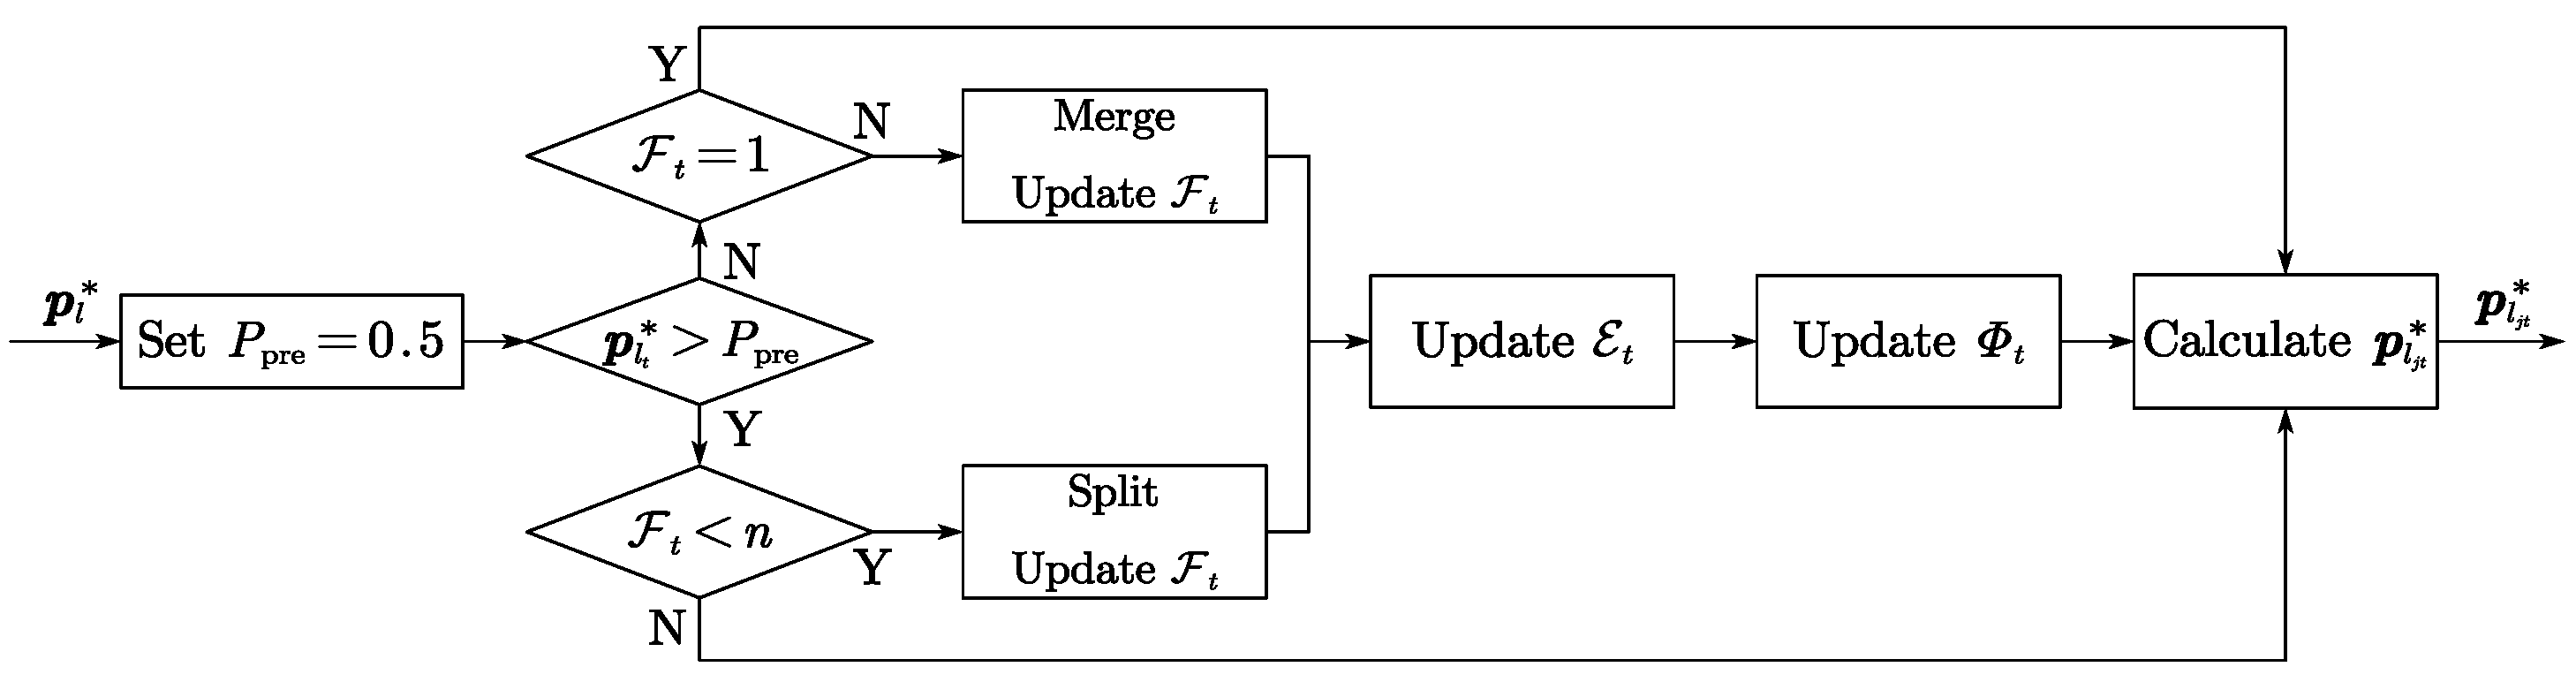
Figure 7.
Environment setup.

Figure 8.
The path of the virtual leader l of the UAS swarm.
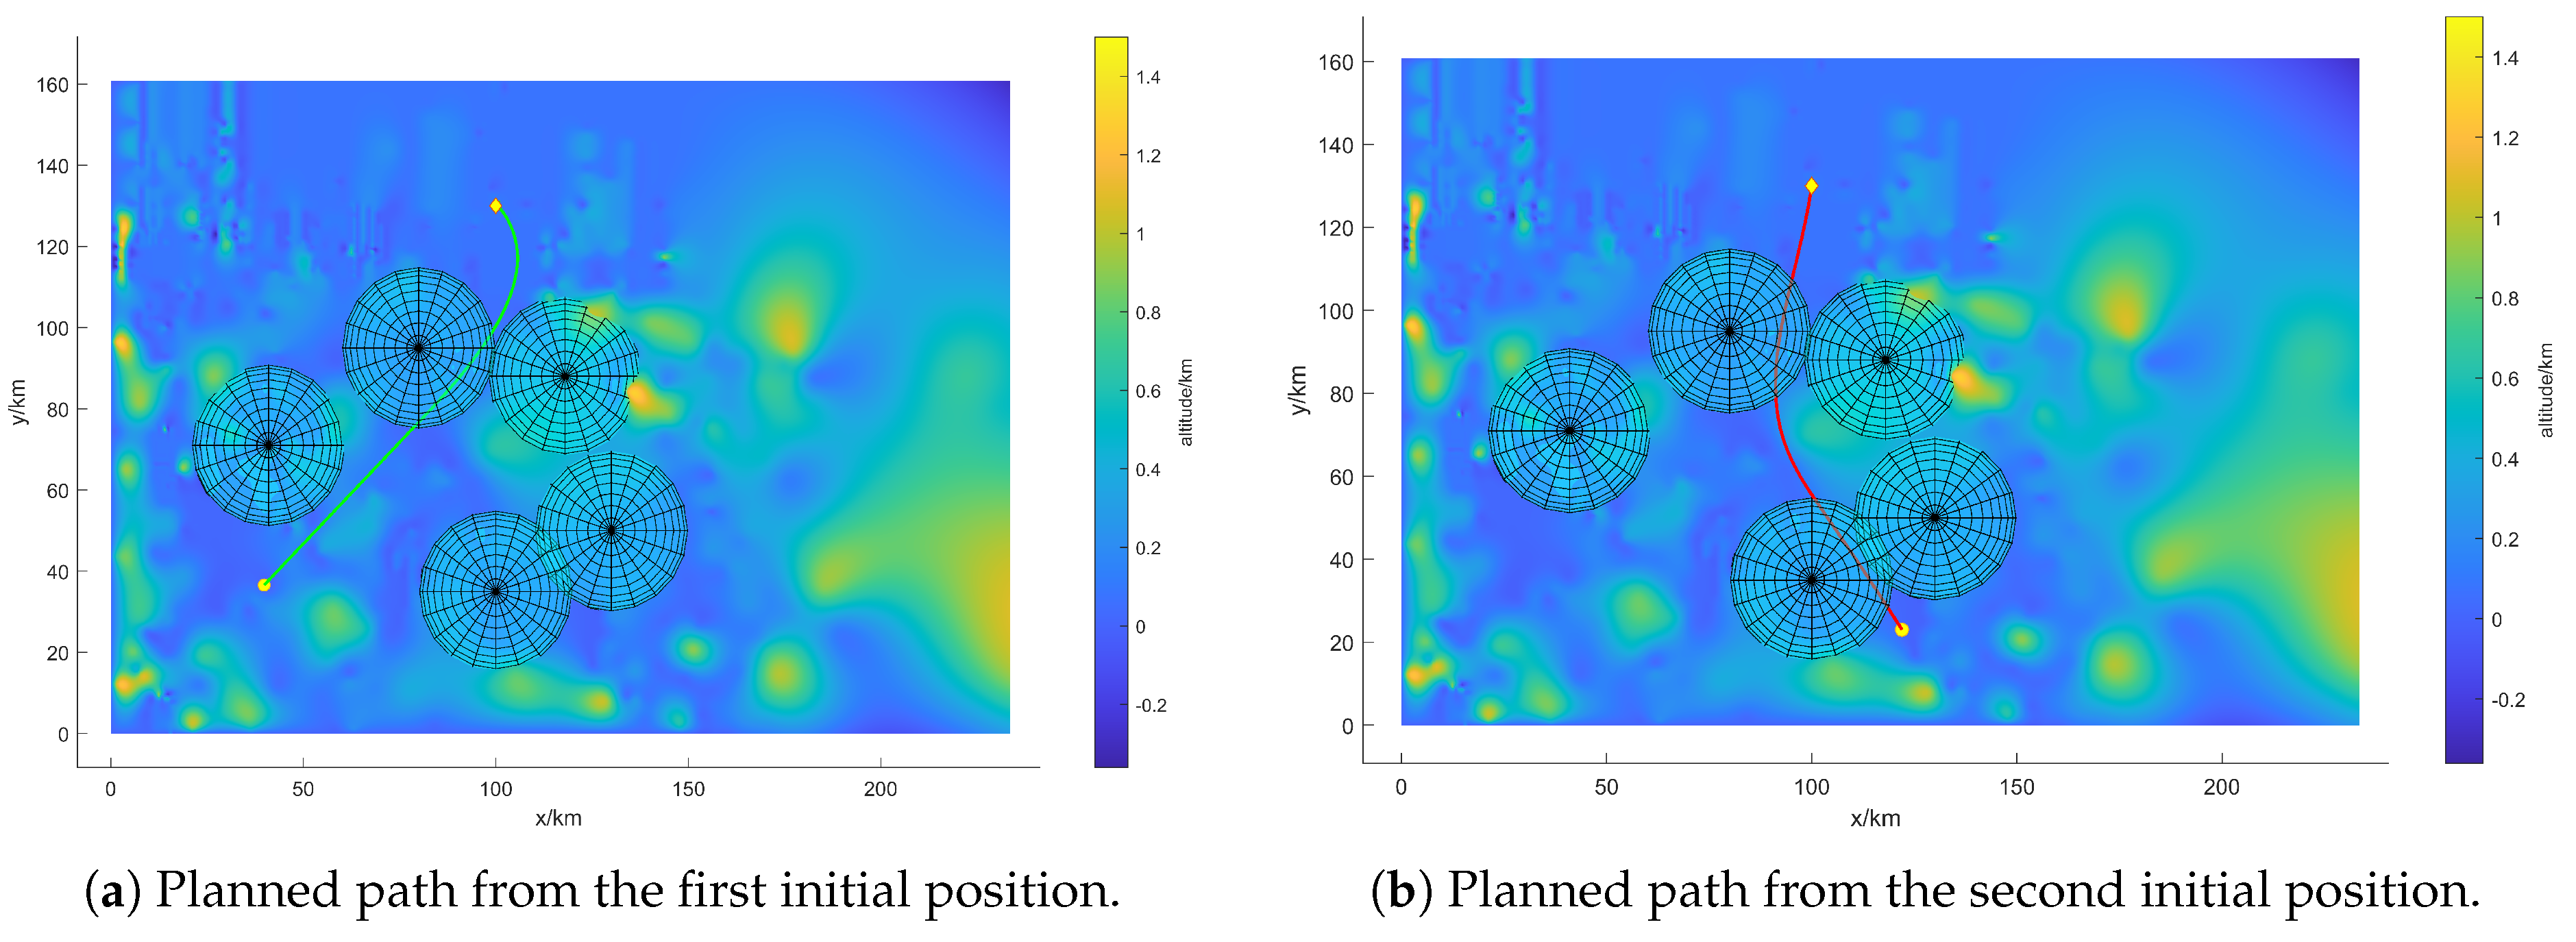
Figure 9.
The 3D path of the virtual leader l of the UAS swarm.
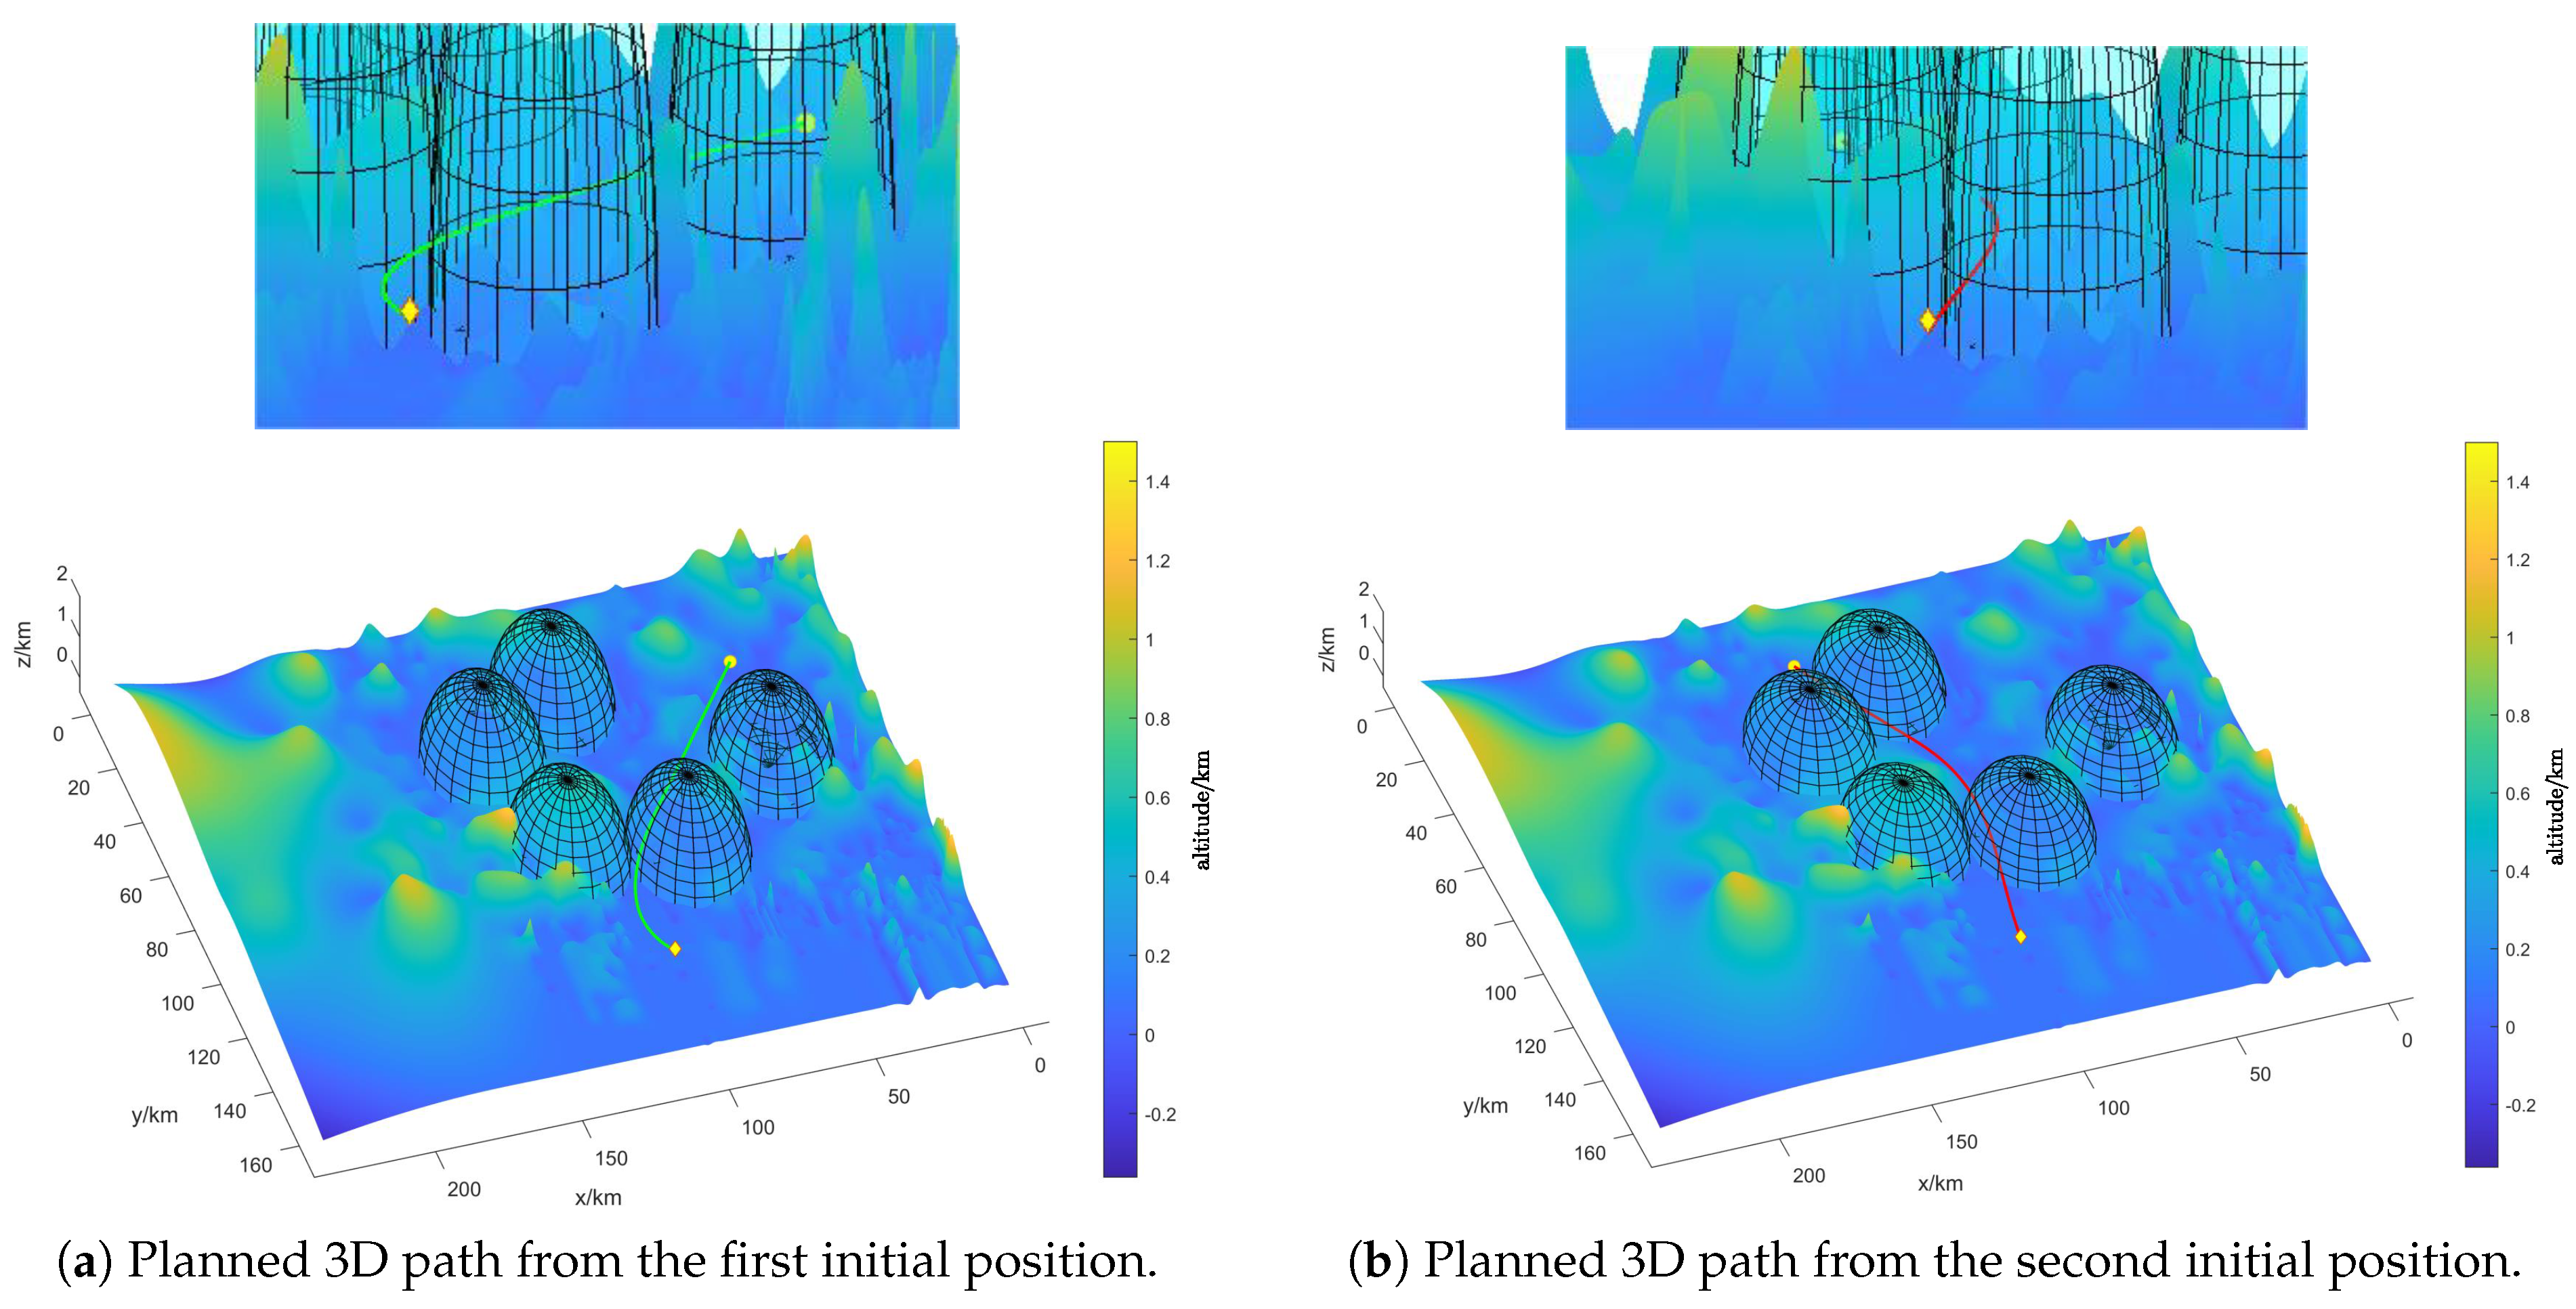
Figure 10.
Formation instructions and number of normal UASs.
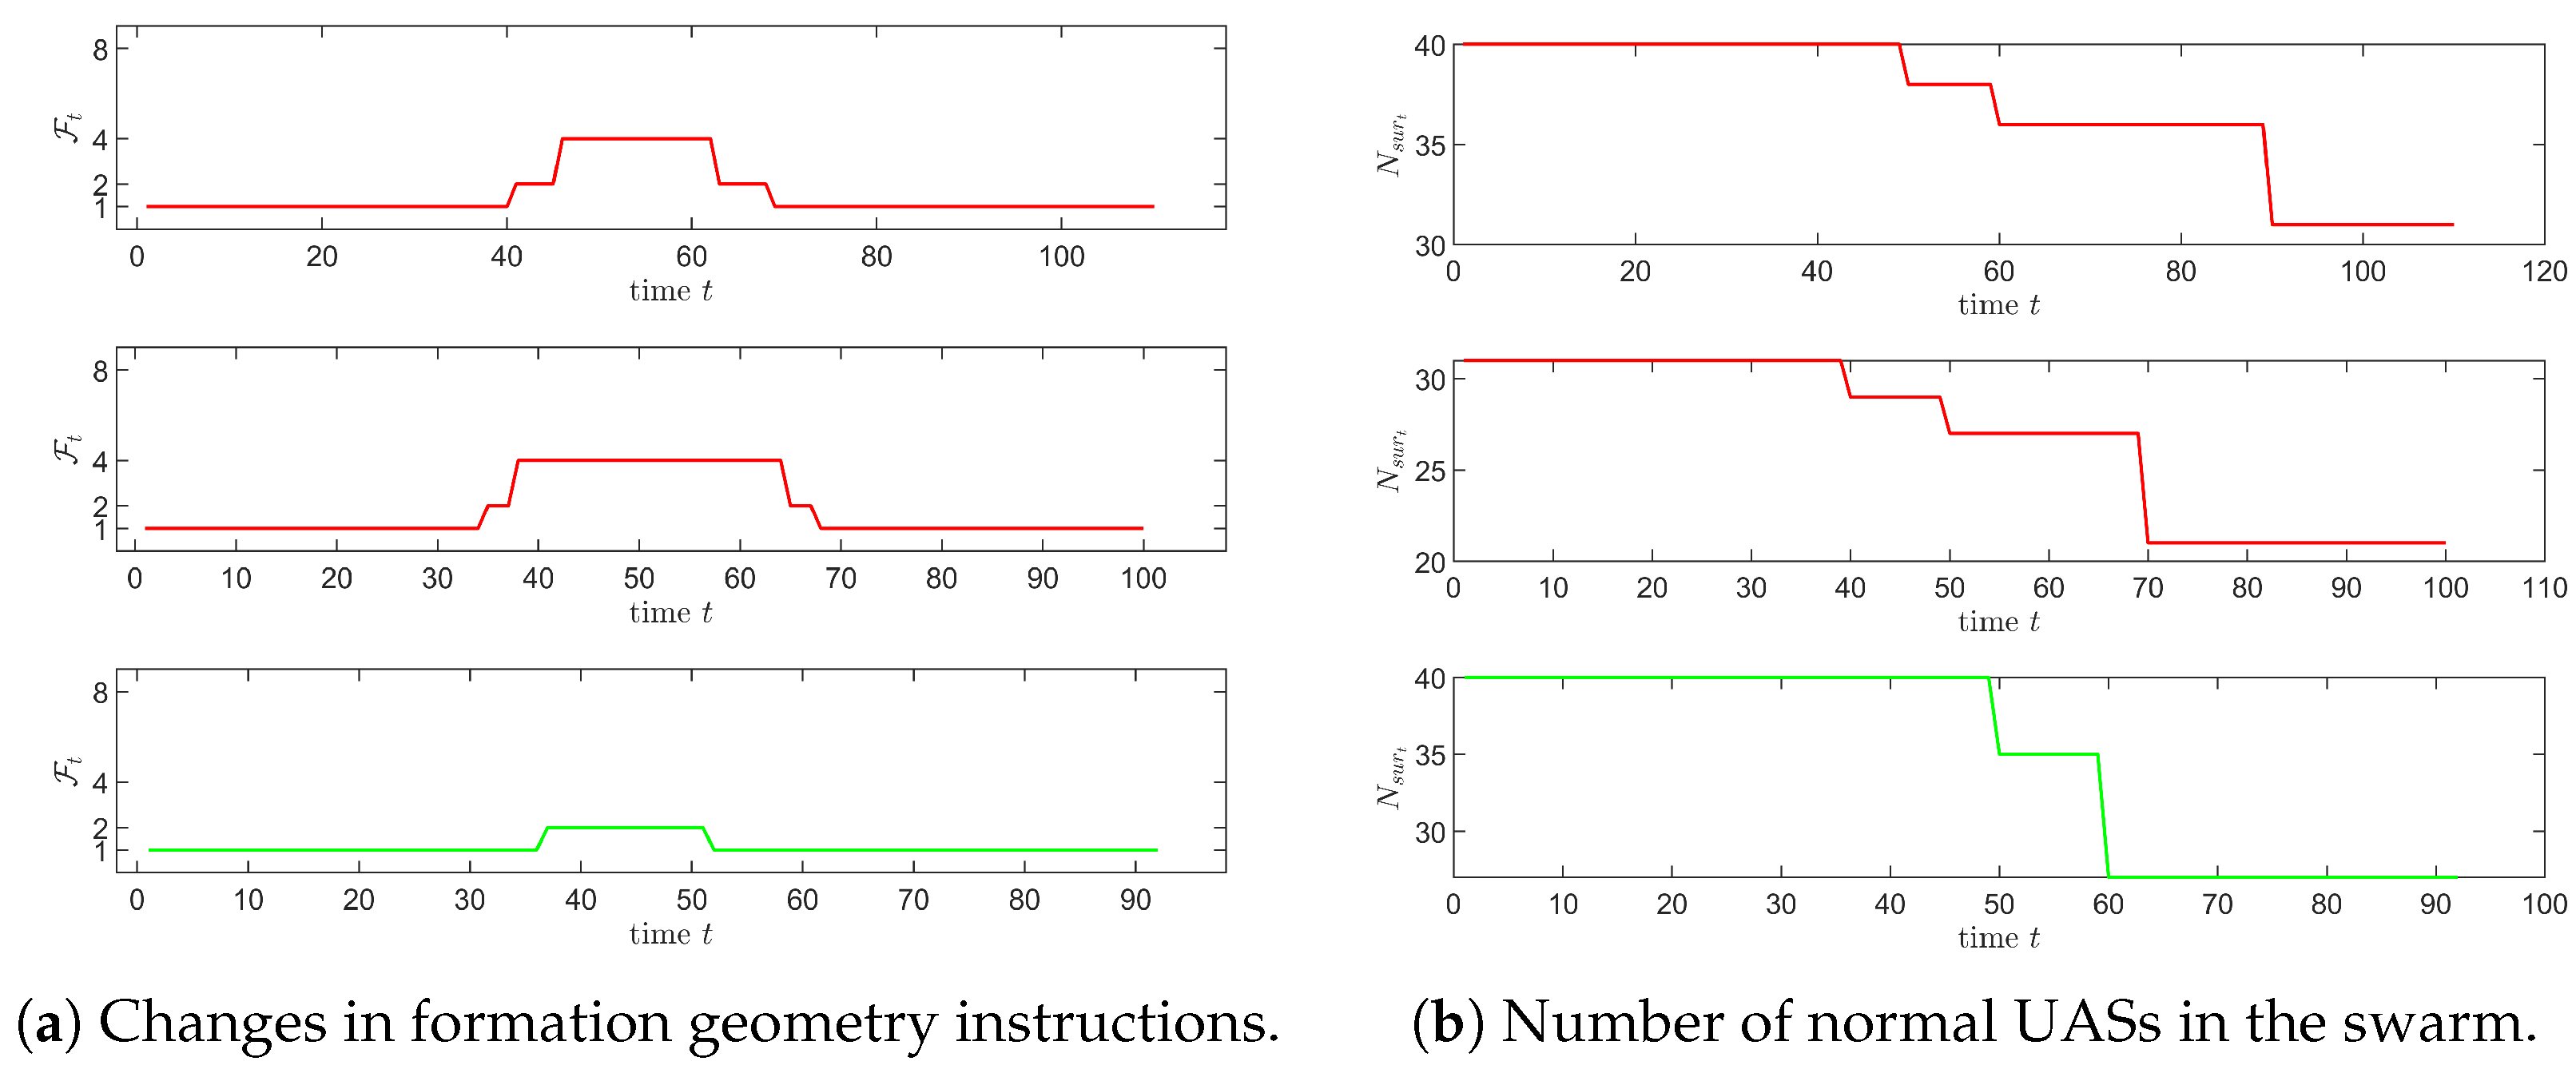
Figure 11.
Formation control along the path.
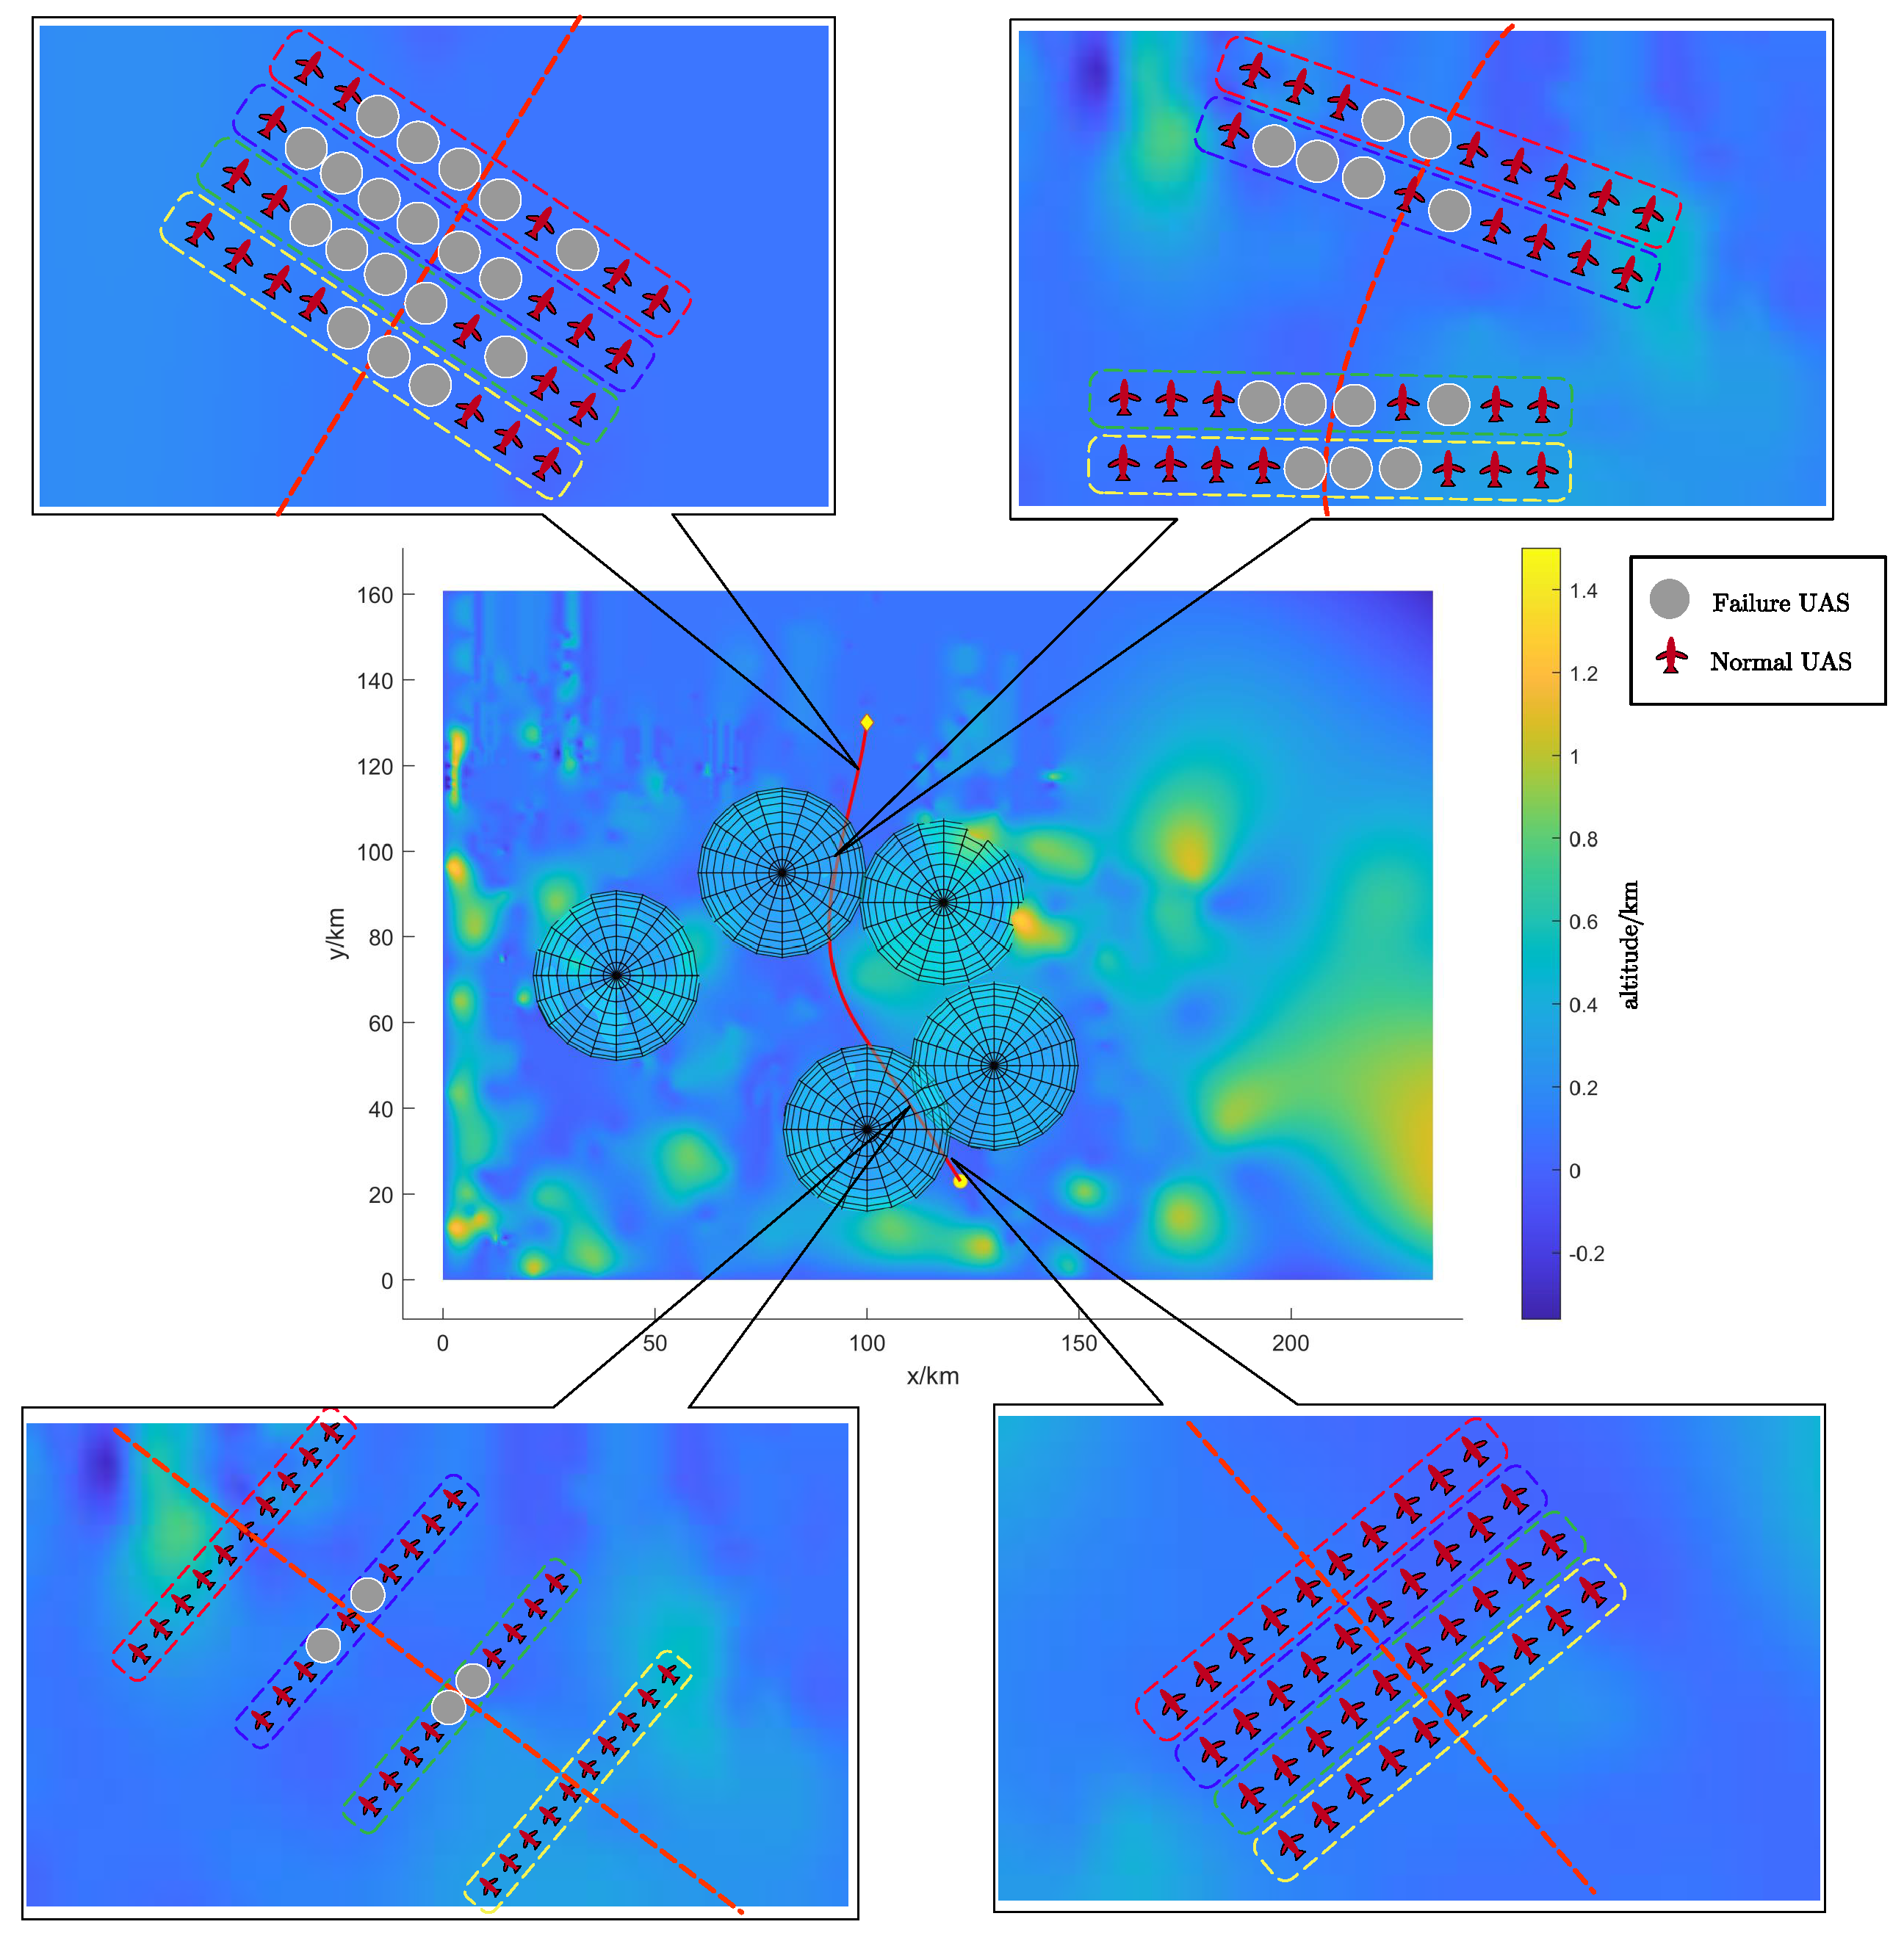
Figure 12.
Random environment rapid traverse path.
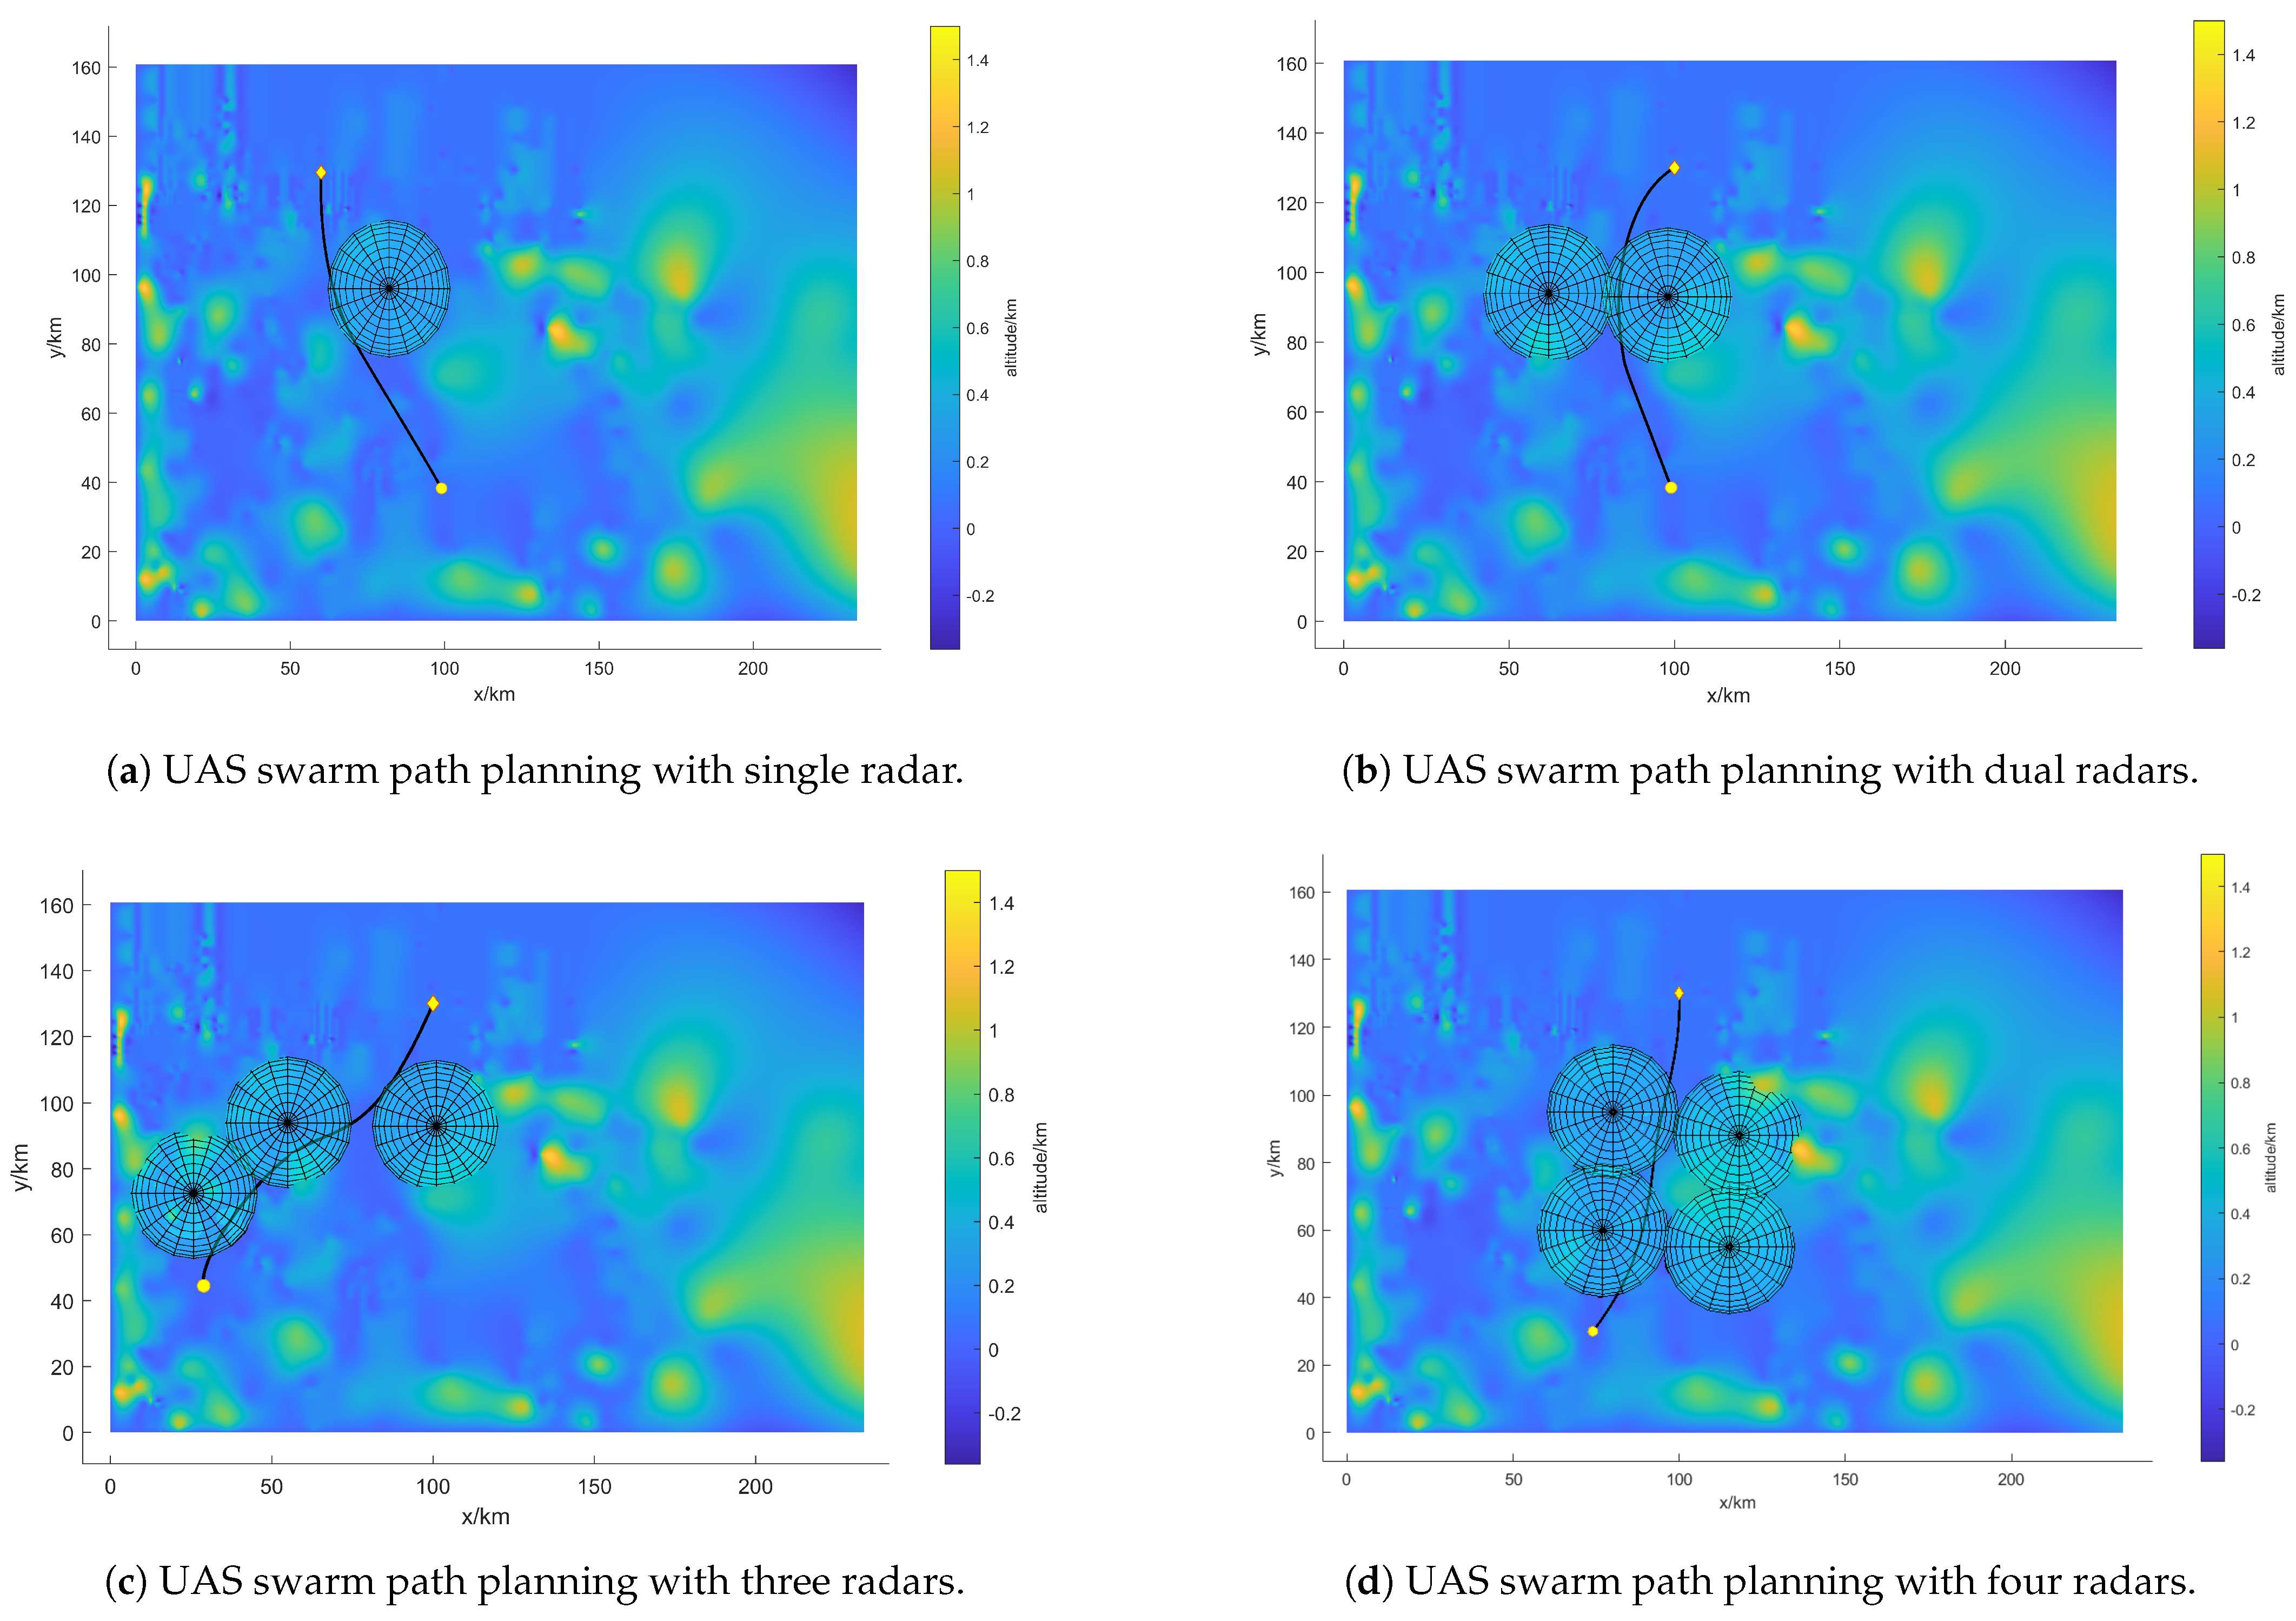
Figure 13.
Monte Carlo simulation.


Table 1.
The state space.
| Variables | Meanings |
|---|---|
| Position of virtual leader l | |
| Speed of virtual leader l | |
| Flight-path inclination angle of l | |
| Flight-path azimuth angle of l | |
| Relationship between target position and l | |
| Relationship between radars and l |
Table 2.
Initial Position Information.
| Radar Position | Initial Swarm Position |
|---|---|
| (80,000, 95,000, z) | |
| (100,000, 35,000, z) | (39,800, 36,500, 300) |
| (41,000, 71,000, z) | |
| (130,000, 50,000, z) | (122,000, 23,000, 300) |
| (118,000, 88,000, z) |
Table 3.
Design of the training parameters.
| Variable | Value | Variable | Value |
|---|---|---|---|
| N | 40 | 0.3 km | |
| 10 | 20 km | ||
| 5, 2 | 0.3 km | ||
| 2, 0.01 | 150 m/s | ||
| 0.65 | 300 m/s | ||
| 0.4 | W | 0.3 km | |
| batch_size | 64 | 10 km | |
| 0.9 | max_episode_length | 550 | |
| learning_rate | 0.000125 |
Table 4.
The results of the comparison test.
| Evaluation Indicators | Proposed Algorithm | Improved A* | RRT* |
|---|---|---|---|
| (km) | 121.694 | 117.237 | 138.276 |
| (s) | |||
Disclaimer/Publisher’s Note: The statements, opinions and data contained in all publications are solely those of the individual author(s) and contributor(s) and not of MDPI and/or the editor(s). MDPI and/or the editor(s) disclaim responsibility for any injury to people or property resulting from any ideas, methods, instructions or products referred to in the content. |
© 2023 by the authors. Licensee MDPI, Basel, Switzerland. This article is an open access article distributed under the terms and conditions of the Creative Commons Attribution (CC BY) license (https://creativecommons.org/licenses/by/4.0/).
Share and Cite
MDPI and ACS Style
Hu, J.; Fan, L.; Lei, Y.; Xu, Z.; Fu, W.; Xu, G. Reinforcement Learning-Based Low-Altitude Path Planning for UAS Swarm in Diverse Threat Environments. Drones 2023, 7, 567. https://doi.org/10.3390/drones7090567
AMA Style
Hu J, Fan L, Lei Y, Xu Z, Fu W, Xu G. Reinforcement Learning-Based Low-Altitude Path Planning for UAS Swarm in Diverse Threat Environments. Drones. 2023; 7(9):567. https://doi.org/10.3390/drones7090567
Chicago/Turabian StyleHu, Jinwen, Liyuan Fan, Yifei Lei, Zhao Xu, Wenxing Fu, and Gang Xu. 2023. "Reinforcement Learning-Based Low-Altitude Path Planning for UAS Swarm in Diverse Threat Environments" Drones 7, no. 9: 567. https://doi.org/10.3390/drones7090567