
Stockpile Volume Estimation in Open and Confined Environments: A Review


1
School of Engineering, The University of Manchester, Manchester M13 9PL, UK
2
Department of Mechanical Engineering, Umm Al-Qura University, Makkah 5555, Saudi Arabia
3
Aerospace Engineering Department, Faculty of Engineering, Cairo University, Giza 12613, Egypt
*
Author to whom correspondence should be addressed.
Drones 2023, 7(8), 537; https://doi.org/10.3390/drones7080537
Submission received: 11 July 2023
/
Revised: 17 August 2023
/
Accepted: 18 August 2023
/
Published: 20 August 2023
Abstract
:This paper offers a comprehensive review of traditional and advanced stockpile volume-estimation techniques employed within both outdoor and indoor confined spaces, whether that be a terrestrial- or an aerial-based technique. Traditional methods, such as manual measurement and satellite imagery, exhibit limitations in handling irregular or constantly changing stockpiles. On the other hand, more advanced techniques, such as global navigation satellite system (GNSS), terrestrial laser scanning (TLS), drone photogrammetry, and airborne light detection and ranging (LiDAR), have emerged to address these challenges, providing enhanced accuracy and efficiency. Terrestrial techniques relying on GNSS, TLS, and LiDAR offer accurate solutions; however, to minimize or eliminate occlusions, surveyors must access geometrically constrained places, representing a serious safety hazard. With the speedy rise of drone technologies, it was not unexpected that they found their way to the stockpile volume-estimation application, offering advantages such as ease of use, speed, safety, occlusion elimination, and acceptable accuracy compared to current standard methods, such as TLS and GNSS. For outdoor drone missions, image-based approaches, like drone photogrammetry, surpass airborne LiDAR in cost-effectiveness, ease of deployment, and color information, whereas airborne LiDAR becomes advantageous when mapping complex terrain with vegetation cover, mapping during low-light or dusty conditions, and/or detecting small or narrow objects. Indoor missions, on the other hand, face challenges such as low lighting, obstacles, dust, and limited space. For such applications, most studies applied LiDAR sensors mounted on tripods or integrated on rail platforms, whereas very few utilized drone solutions. In fact, the choice of the most suitable technique/approach depends on factors such as site complexity, required accuracy, project cost, and safety considerations. However, this review puts more focus on the potential of drones for stockpile volume estimation in confined spaces, and explores emerging technologies, such as solid-state LiDAR and indoor localization systems, which hold significant promise for the future. Notably, further research and real-world applications of these technologies will be essential for realizing their full potential and overcoming the challenges of operating robots in confined spaces.
1. Introduction
1.1. Background
Stockpile volume estimation is an essential process for bulk material management within industries that rely on stockpiles of different materials as inputs and outputs for the various stages of production. Due to atmospheric conditions, it is usually preferred to store stockpiles within confined spaces such as silos, sheds, barns, domes, and hoppers, which poses a challenge for inspection [1,2]. This is because these environments suffer from poor lighting and visibility conditions due to dust and darkness, along with lack of global positioning, uneven and slippery terrains, and sensor interference [3]. That said, it is critical to constantly monitor stockpile volumes within confined spaces to ensure efficient material management.
Traditionally, ground-based methods for estimating stockpile volumes such as walking wheel, global navigation satellite system (GNSS), or terrestrial laser scanning (TLS) have been utilized. However, these methods are associated with risks for the employees, while inspecting hard-to-reach or dangerous areas whose inspection is needed to increase reference measuring points and, hence, improve estimation accuracy. On the other hand, aerial surveying has gained popularity as a fast and safe solution within outdoor missions. In recent years, drone photogrammetry has become a common solution for surveying stockpiles in a variety of industries such as mining [4,5], quarrying [6,7], construction site monitoring [8,9], and agriculture and forestry [10,11]. In fact, large volumes of aerial 2D photos are typically processed using classical photogrammetry methods or structure from motion (SfM; a more modern approach that automates much of the processes involved in classical photogrammetry) [12,13] to create 3D topographical models and orthomosaic maps. That said, airborne LiDAR (Light Detection and Ranging) is another advanced drone surveying method that can cover larger areas while collecting higher resolution data, compared to that obtained from drone photogrammetry. However, it is typically more expensive and heavier than the other drone sensors. Clearly, drones may not be typically designed for confined spaces applications. In fact, a recent review on autonomous exploration of confined subterranean spaces highlighted the challenges of robotic operation in confined spaces, including robust and reliable map generation, precise localization, efficient path planning, and safe navigation [14]. As a result, only a small number of studies have applied drones for indoor stockpile volume estimation, and these studies have only emerged in recent years.
Over the past decade, several review studies have tangentially considered stockpile volume estimation, and here we present a brief summary of these studies, underscoring their respective scope and limitations. Jaboyedoff et al. [15] primarily focused on using LiDAR to examine landslides, including their volume, but did not extend the scope to stockpile volume estimation. Colomina and Molina [16] comprehensively reviewed drone usage in photogrammetry and remote sensing, demonstrating the application of LiDAR technology in unmanned aerial systems (UASs). However, their study did not specifically address the volume-estimation application. Sliusar et al. [17] explored drone technology applications in solid waste landfills and dumpsites, with a majority of the research concentrating on landfill volumetric analysis using aerial photogrammetry. Livers et al. [18] compared and reviewed methods for estimating the volume of wood jams, concluding that visual estimates remain the most time-efficient approach. Deliry and Avdan [19] presented a review paper addressing the accuracy of drone-based photogrammetry, while considering earthwork and snow volumetric measurements using drone photogrammetry techniques. However, they emphasized the need for further investigations to assess the accuracy of these techniques in various contexts, including volumetric analysis. Malang et al. [20] conducted a systematic literature review on drone implementation in warehouse management, noting that only one study applied drone technology for volume estimation. This observation highlights the need for further research in this relatively unexplored area.
Stockpile volume estimation is an interdisciplinary topic spanning various fields, including remote sensing and photogrammetry, geomatics and surveying, geospatial information systems (GIS), civil engineering and construction, mining and geology, agriculture and forestry, environmental science and waste management, and robotics and automation. Despite the valuable contributions of the aforementioned reviews, there has not been a review work focusing on terrestrial and aerial techniques for stockpile volume estimation in open and confined environments. Therefore, this review paper aims to comprehensively address techniques for outdoor stockpile volume estimation, techniques for stockpile volume estimation within confined spaces, and the future perspective of stockpile volume estimation within confined spaces.
1.2. Research Approach
The objective of this study is to present a comprehensive review of the methods developed and challenges encountered in stockpile volume-estimation research. Via an extensive comparative analysis of the conducted research into the field, including that for indoor missions which are not covered in existing review papers, this study is anticipated to add value across multiple fields. For clarity, the scope of this review encompasses any work involving the measurement and monitoring of stockpile volumes, including earthworks and landfills. All studies on indoor missions within confined spaces, such as warehouses, were also included. However, not all outdoor missions were considered. This is because review papers considering drone photogrammetry were already published in 2020 and 2021 [19,21]. Consequently, we only focused on the most recent studies utilizing the photogrammetry approach starting from 2020 to 2023. Studies employing solely TLS and GNSS techniques were selectively excluded from this review. While these methods are undoubtedly pivotal in the domain of stockpile volume estimation, they have been extensively studied and are now considered conventional. As such, the focus of this review is geared towards emerging and advanced methods, particularly those leveraging drone and LiDAR technologies. In this context, TLS and GNSS techniques are commonly used as benchmark standards against which these new methods are compared, and, as such, the inclusion of standalone TLS and GNSS studies is not considered here, as it would divert from the main objective of this review.
Keyword search terms employed in compiling the papers used to inform this review included: ‘stockpile volume estimation’, ‘stockpile measurement’, ‘photogrammetry’, ‘aerial survey’, ‘drone-based volume estimation’, ‘structure from motion (SfM)’, ‘digital surface model (DSM)’, ‘digital elevation model (DEM)’, ‘terrestrial laser scanning’, ‘indoor volume estimation’, ‘warehouse stockpile measurement’, ‘earthwork volume calculation’, and combinations of these terms. Furthermore, drone synonyms like ‘UAV’, ‘UAS’, and ‘aerial’, and stockpile synonyms like ‘earthwork’ and ‘landfill’, were considered. Relevant publications were assembled utilizing online databases, including Web of Science, Scopus, Google Scholar, ResearchGate, and journal publisher websites. Some interesting trends appeared during this search process. For example, Figure 1 shows the historical trend we found for the collected publications related to aerial stockpile volume estimation, based on our search criteria and keywords, while using Scopus. Clearly, the data reveal a significant surge in the application of drones for stockpile volume estimation starting from 2012.
After gathering the papers, each was assessed objectively concerning its scope. To collect additional papers referenced in the initial set of publications, a backward citation search was performed, scrutinizing the citations at the end of each article to ascertain their significance to the present study. A forward citation search was also executed to complete the paper compilation, pinpointing novel findings related to the topic where publications subsequent to a given study cited the original work. The analysis of each paper entailed extracting the employed technique, application, and key findings, such as the precision of the estimated volume.
The layout of this paper is as follows: Section 2 offers an outline of the various techniques employed in estimating stockpile volumes. Section 3 delivers a review of the most recent methods applied for outdoor stockpile volume estimation, focusing on state-of-the-art technologies like drone-based photogrammetry and LiDAR surveying. Section 4 delves into the intricacies of estimating stockpile volumes within indoor environments, addressing the challenges and reviewing relevant solutions and studies in this niche area. The paper then culminates with Section 5, which presents insightful discussions, critical remarks, and prospective directions for future exploration in this field.
2. Techniques for Estimating Stockpile Volumes
2.1. Overview
A wide range of techniques exists for estimating stockpile volumes, spanning from straightforward manual methods to more sophisticated approaches. A flowchart demonstrating a classification of these techniques, along with their typical respective sub-methods used for 3D reconstruction, is illustrated in Figure 2. In this section, we will briefly discuss these various techniques and their relevant applications.
2.2. Manual Measurements
Manual measuring techniques include the use of a walking wheel, truckload-and-bucket-count, or even a less accurate method like eyeballing [22]. The truckload-and-bucket-count method is suitable for small stockpiles, but it becomes impractical for large ones. Generally, manual techniques are time-consuming and require physical effort. However, for common shapes such as conical and elongated piles, the volume can be estimated using a measuring tape and standard formulas [23].
2.3. Satellite Imagery
Satellite imagery (or Earth-observation imagery, spaceborne photography, or simply satellite photo) can be used for earthwork monitoring and stockpile volume estimation [24,25,26,27,28]. This method is useful for monitoring changes in landfills over a long period of time, particularly for large areas. However, it requires ground knowledge of the area and, in fact, provides low accuracy results for volume estimation. Additionally, it cannot be used for dynamic stockpiles, where sizes change regularly.
2.4. GNSS Surveying
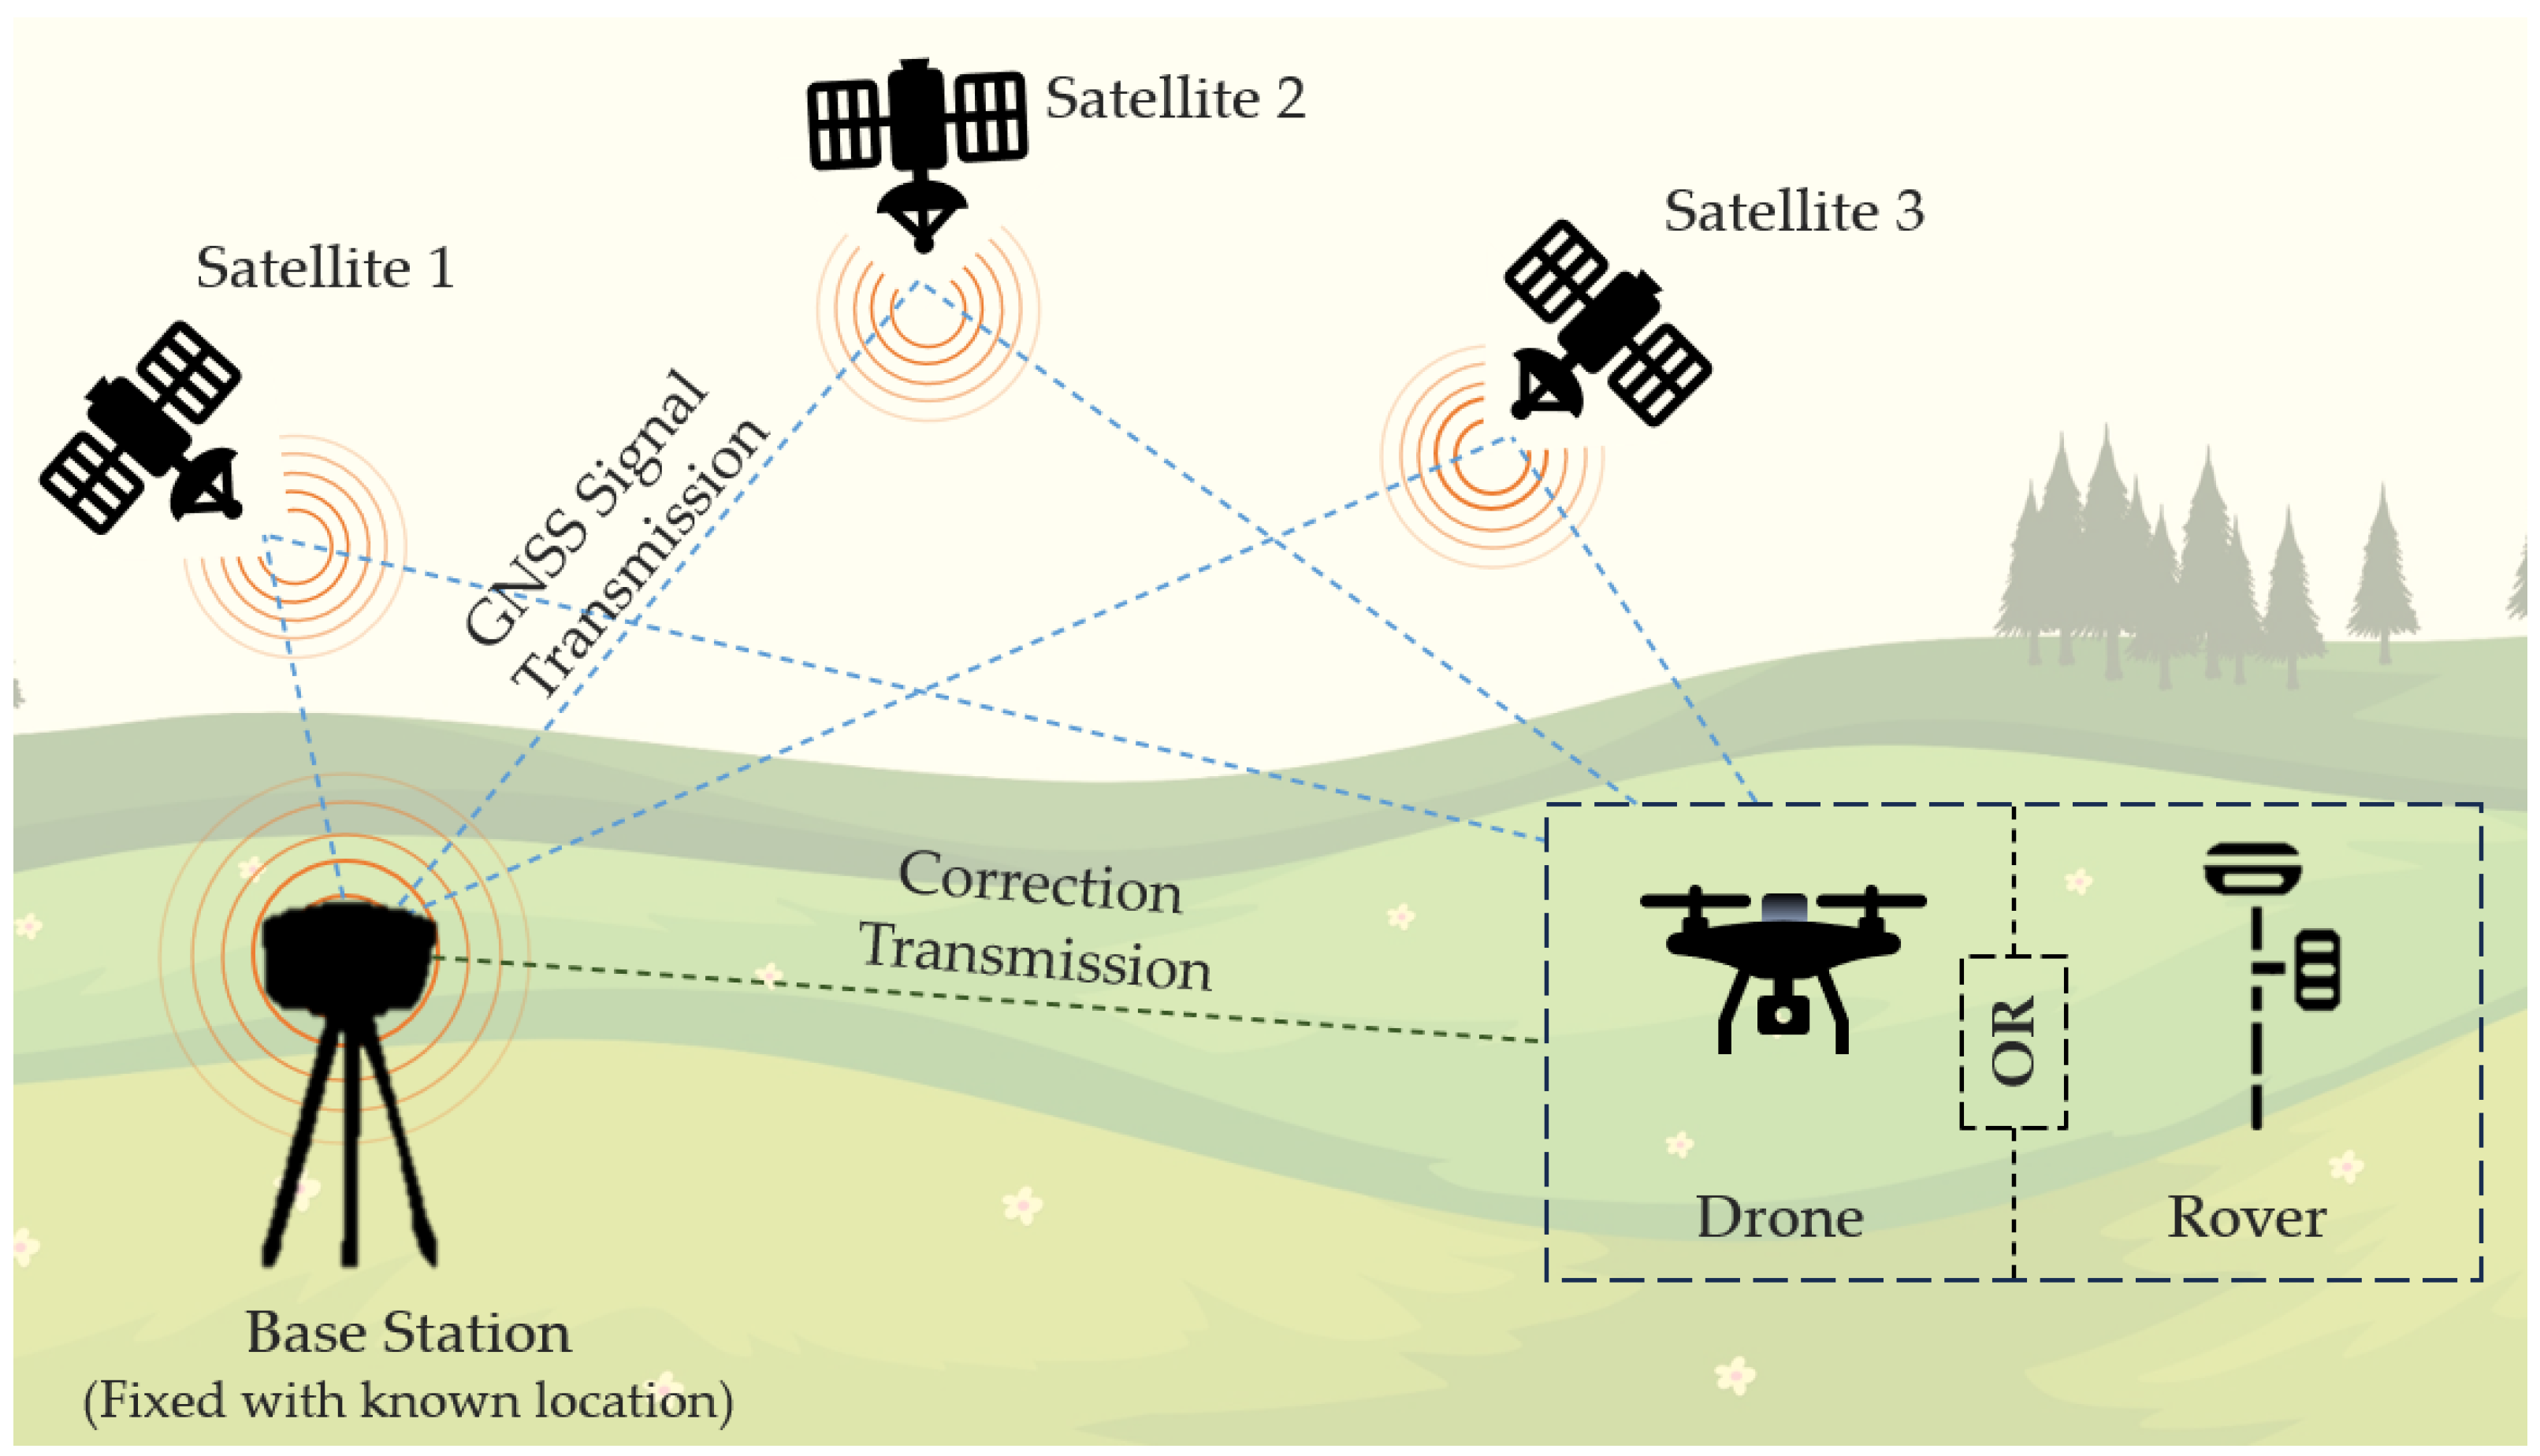
GNSS surveying involves using GNSS signals via a GPS/GNSS receiver and antenna to determine the position of points on surfaces relative to other points. Surveying using GNSS can utilize either Real-Time Kinematic (RTK) or Post-Processed Kinematic (PPK) methods. RTK provides real-time corrections to the GNSS signals, enabling centimeter-level accuracy or even sub-centimeter levels of accuracy when post-processing algorithms are employed [29,30]. It usually requires a base station and a robot that communicates in real time (Figure 3). PPK, on the other hand, stores the raw GNSS data for post-processing later. Both RTK and PPK methods can achieve high accuracy, but they are used in different scenarios, based on the specific requirements of the survey, such as the need for real-time results, the available infrastructure, and other factors [31]. To transform GNSS data into a reconstructed 3D model, methods such as the Triangulated Irregular Network (TIN) and Inverse Distance Weighting (IDW) are among the most commonly used approaches [32]. Note that GNSS surveying only collects single points around and over the area of interest, and the accuracy of the modeled surfaces increases when more points are collected. However, surveyors need to walk around and climb the stockpiles to place the GNSS receivers over the measurement points, which can entail safety hazards, depending on the inspection environment.
2.5. Photogrammetry Surveying
Photogrammetry is a non-contact technique for acquiring reliable and accurate 3D information of the Earth’s surface and its environment from overlapping the acquired 2D images [33] (Figure 4). This technique has gained popularity in recent years, especially with the emergence of drone-based photogrammetry surveys. Among the various photogrammetric methods, structure from motion (SfM) and stereo imaging are widely used techniques for surveying and reconstructing three-dimensional structures. While SfM automatically solves for the camera positions and orientations without the need for known reference points, stereo imaging utilizes two or more images taken from different angles to extract depth information and reconstruct the 3D structure [34]. Currently, many processing software for photogrammetry are available such as Envi, Agisoft Metashape, and Bentley ContextCapture. These software tools can directly generate a 3D model by sequencing 2D aerial images. For a comprehensive understanding of drone photogrammetry, the reader is referred to the review article by Berra and Peppa [21].
Drone photogrammetry has proven to be an efficient method for conducting aerial surveys, especially in areas where direct access is difficult. However, to obtain accurate volume estimations of stockpiles, Ground control points (GCPs) are required. GCPs are known coordinate reference points that are placed in the area of interest and used to scale the 3D model. The positions of GCPs are usually estimated using methods such as GNSS, hence representing a potential drawback of this method. Additionally, generating a 3D model from images taken under low-light conditions or with homogeneous textures can be challenging.
2.6. Terrestrial Laser Scanning (TLS) and Airborne LiDARs
TLS, also known as Terrestrial LiDAR, is a popular method for acquiring 360° panoramic 3D coordinates of numerous points on land. It is achieved by emitting laser pulses towards these points and measuring the distance from the device to the target [15] (Figure 5). The process of aligning multiple TLS scans into a unified 3D model is known as scan registration [35,36,37]. It begins with identifying common features across different scans and using them for initial alignment. Algorithms, such as the Iterative Closest Point (ICP) and Normal Distributions Transform (NDT), are then employed to refine this alignment by minimizing the difference between corresponding points. Manual adjustments and error minimization techniques may be used to ensure alignment quality. Once accurately aligned, the scans are merged into a single cohesive 3D model. This complex process requires a combination of specialized software, automated algorithms, and manual interventions, and it plays a vital role in ensuring that the final 3D model faithfully represents the scanned environment.
TLS has become an industry standard due to its relatively straightforward operation and the sub-centimeter accuracy it can achieve. However, TLS can be considered an expensive approach. Additionally, when surveying large and complex surfaces, TLS must be moved repeatedly to minimize occlusion (unscanned areas) and to ensure sufficient density of the collected data [38]. Clearly, this may pose personnel risks when working in hard-to-reach and/or dangerous environments.
Airborne LiDAR is an alternative method that can overcome some of the limitations of TLS. It involves using a drone to conduct a complete survey without risking the surveyors. However, airborne LiDAR requires more processing data than TLS: TLS collects panoramic data from fixed single points, making it easier to match/register the point cloud. Airborne LiDAR, on the other hand, is mounted on a flying object, which may lead to more data processing cost and potentially errors. Within the processing of airborne LiDAR data, Digital Elevation Models (DEMs) and Digital Surface Models (DSMs) are commonly generated. A DEM provides the bare ground surface without any objects, while a DSM includes all objects on the surface, such as buildings and trees.
3. Outdoor Stockpile Volume Estimation
3.1. Overview
This section will focus on reviewing studies that considered photogrammetry and LiDAR-based methods, as they are the most advanced techniques currently adopted for outdoor stockpile volume estimation. In fact, among stockpile and landfill monitoring and volume-estimation techniques, drone photogrammetry has become widely adopted due to advantages such as easiness to use, and speed and safety, as well as acceptable accuracy, when compared with the standard methods, such as TLS and GNSS. Here, studies utilizing aerial photogrammetry published since 2020 are considered. For less recent contributions to aerial photogrammetry, the reader is referred to previous review contributions such as that by Berra and Peppa [21], the work by Deliry and Avdan [19], and an earlier review study by Colomina and Molina [16]. To the contrary, the selection of studies employing LiDAR-based approaches was not limited to a particular time frame. This was mainly due to the relatively limited number of publications in comparison to those focused on drone photogrammetry.
3.2. Drone Photogrammetry
Unmanned aerial vehicles (UAVs), or drones, comes in/with various sizes, control mechanisms, and design configurations. They range from large-scale drones, similar to the Global Hawk, through miniature systems (e.g., [39,40,41]), to the latest nano and pico air vehicles (e.g., [42,43,44,45]). These platforms have enabled testing of innovative aerial solutions, e.g., control strategies [46,47,48,49], difficult to apply in manned aircraft. Drones are categorized into several types based on mission capabilities, including horizontal take-off and landing (HTOL), vertical take-off and landing (VTOL), various hybrids, helicopters, and unconventional designs [50]. Despite this diversity, fixed-wing (HTOL) and rotary-wing (VTOL) drones are commonly used in research and commercial applications for 3D mapping missions [51]. Fixed-wing drones are often preferred in surveying expansive areas quickly. Conversely, rotary-wing drones possess the unique capability to hover and maneuver in any direction, making them a logical choice for small areas and indoor tasks.
Drone photogrammetry is generally seen as a faster and safer solution for monitoring and volume estimation. For instance, drone photogrammetry was applied in missions for dump and landfill waste management [38], earthwork in mining and quarrying [52,53], and agriculture [10]. Table 1 summarizes drone photogrammetry-based approaches for stockpile/earthwork volume estimation that appeared in the literature since 2020. The table compares these studies taking into account aspects such as application, drone platform, data-processing method, and estimated volumetric error. In the following paragraphs, we will highlight some of the main aspects of the studies considered in Table 1.
In terms of accuracy, most of the studies, in Table 1, reported volumetric errors in the range of ≈0–3% compared to results from TLS, GNSS-RTK, or actual known volume. However, few studies, such as [54,55], reported slightly higher average error values around 7–12%. Remarkably, the most common way to calculate the volumetric difference was by comparing the estimated volume using drone photogrammetry to the ground truth volume obtained using TLS. For example, the study by Ajayi and Ajulo [56] adopted such approach, but to establish a baseline for comparison, they also considered the actual volume determined by the mill machine processing the material. Hence, the volume derived from the mill machine served as a reference or ‘ground truth’ volume, against which the volume estimates obtained from TLS and drone photogrammetry were validated and compared. Their results revealed that the volumetric errors for the TLS and drone photogrammetry methods were +2.9% and −2.3%, respectively. Although the difference in the absolute values of the percentage errors between the two methods is minor (0.6%); the total difference between the two percentage errors is 5.2%.
In another study by Kokamägi et al. [57], volume estimates using drone photogrammetry were compared to both TLS (as ground truth) and GNSS. Their results showed volumetric errors of 1% and 6%, when comparing drone and GNSS to TLS, respectively. Mora et al. [58] showed that obstructions in the collected data while using TLS resulted in occlusions of about 7%, while using aerial photogrammetry provided 100% coverage. Another special study was that by Cho et al. [59], who conducted survey tests using two types of drones: a VTOL fixed-wing drone and a multi-rotor drone. Their results showed a minor difference of only 0.4% in the estimated volume produced when using the two drone platforms. That said, this result could just be an artifact of using different onboard cameras. Moreover, they showed that the difference in the estimated volume, in comparison to the cross-section method, was only 1.1%. Consequently, they argued that aerial photogrammetry can replace the current existing cross-section method, required by regulations such as the engineering instructions and standard of construction estimate.
Other studies, such as those conducted by Idrees and Abdulrahman [60] and Lee and Lee [52], considered estimating the volume of a dam using drone photogrammetry while comparing the results to that produced from the GNSS-RTK method. To ensure accurate volume estimation by the GNSS-RTK, multiple measurements at different locations on the dam were obtained to account for any variations in the shape. Idrees and Abdulrahman [60] conducted the aerial survey at different flight altitudes, and the error in the estimated volume between the two methods was minor (<0.3%). On the other hand, Lee and Lee [52] showed that the estimated volumes from GNSS-RTK and drone photogrammetry had a difference of 2%. However, clearly, the hours of surveying needed while using the GNSS-RTK technology can be avoided when using drones that can reduce the mission time to just few minutes.

Table 1.
Summary of research articles that adopted drone photogrammetry for outdoor stockpile volume estimation, during the period from 2020 to 2023.
Table 1.
Summary of research articles that adopted drone photogrammetry for outdoor stockpile volume estimation, during the period from 2020 to 2023.
| Application | Surveyed Area [m2] | Country | Drone/Platform | Image-Processing Software | Reference Volume [m3] | Volumetric Error [%] | Ground Truth | Reference |
|---|---|---|---|---|---|---|---|---|
| Open sand quarry | ≈145,000 | Italy | DJI Phantom 4 | Agisoft Metashape | ≈45,000 | - | - | [6] |
| Stockpiles | ≈3000 | Malaysia | DJI Phantom 4 Pro | Agisoft Photoscan | 6441 | 2.6 | Manual measuring | [61] |
| Stockpiles | 1530 | Nigeria | DJI Mavic Air | Agisoft Metashape Pro | 2750 | 2.3 | Mill machine | [56] |
| Foundation pit | 61,000 | China | DJI Phantom 4 RTK | Bentley ContextCapture | - | - | - | [62] |
| Stockpiles | 463 | Estonia | DJI Phantom 4 Pro | Agisoft Photoscan | 722.5 | 1.1 | TLS | [57] |
| Aibotix Aibot X6 | 0.7 | |||||||
| Stockpiles | 394 | DJI Phantom 4 Pro | 674 | 2.3 | ||||
| Stockpiles | 345 | USA | KongCopter FQ700X8 PRO + lens | Agisoft Metashape | 487.1 | 1.4 | TLS | [58] |
| Bentley ContextCapture | 1.7 | |||||||
| PixElement | 1.1 | |||||||
| Earthwork | ≈70,000 | Korea | VTOL fixed wing | Agisoft Photoscan | ≈104,000 | 1.3 | Design drawing | [59] |
| Multi-rotor drone | ||||||||
| Dam | 45,840 | Kurdistan-Iraq | DJI Phantom 4 Pro | Agisoft Photoscan Pro | 352,551 | <0.3 | GNSS-RTK | [60] |
| Stockpiles | 393.9 | - | Custom drone and custom ground robot | Visual-SLAM | 470.2 | 0.3 | Dense reconstruction | [63] |
| Landfill | 53,628 | 250,057 | 0.3 | |||||
| Landfill | 82,000 | Russia | DJI Phantom 3 Pro | Agisoft Metashape | 406.7 | 0.8 | TLS | [38] |
| X-FLY (specialized) | 0.9 | |||||||
| Landfill | 119,000 | DJI Phantom 3 Pro | DroneDeploy | 358 | 4.9 (no GCP) | |||
| X-FLY (specialized) | 2.1 (no GCP) | |||||||
| Open pit quarry | ≈20,000 | Malawi | DJI Phantom 3 | Pix4D mapper 2.2 Pro | 265.4 | 2.6 | Mill | [64] |
| Charcoal heaps | 80,000 | Brazil | DJI Phantom 3 | Agisoft Metashape Pro | 1,796,223 | 6.5 | GNSS-RTK | [54] |
| Stockpiles | ≈15,000 | - | DJI Phantom 4 Pro | Agisoft Photomodeler | 63,688 | <0.1 | Mill and GNSS-RTK | [65] |
| Fly ash stockpiles | - | USA | DJI Air 2S | Pix4D Mapper | 0.14 | 53 | Known | [55] |
| 1400 | 1649.1 | 11.9 | Mill | |||||
| Earthwork | 20,000 | Korea | DJI Inspire 1 | Agisoft Metashape | 147,316.2 | 2.1 | GNSS-RTK | [52] |
| Construction site | 100,000 | Korea | DJI Phantom 4 Pro | Pix4D Mapper | 354,399 | 0.7 | GNSS-RTK | [66] |
The exploration of innovative methods to enhance photogrammetry, such as the use of RTK drones, specialized geodetic class of drones, or a collaborative approach involving aerial-ground robots, has been gaining traction in the field. RTK drones, recognized for their superior positional accuracy in aerial mapping, outperform their consumer-grade counterparts by leveraging RTK technology [67]. This technology employs a fixed base station and advanced algorithms to correct GNSS signal errors in real time, as depicted in Figure 3. Despite their higher cost, the accuracy afforded by RTK drones was demonstrated by Jiang et al. [62] while evaluating earthwork volume changes, as they managed to reconstruct the 3D model with an average RMS (Root Mean Square) accuracy of 2–3 cm. When comparing the use of non-specialized low-cost drones with specialized geodetic class drones, Filkin et al. [38] intriguingly found no significant difference in results when using them for a waste disposal site volume estimation. On the other hand, collaborative approaches involving aerial-ground robots have shown promise in improving reconstruction accuracy, as highlighted by Liu et al. [63], whose system improved pile reconstruction accuracy by 61% compared to a single-agent setup, hence enhancing the volume-estimation error for a large landfill to an average error value of 0.27%.
Studies have consistently shown a tendency for increased volumetric errors when estimating the volumes of smaller piles. For instance, Liu et al. [68] focused on estimating the volumes of various small food piles, which had an average volume of 136,610 mm3 (≈136.6 × 10⁻⁶ m3). Their estimations displayed an average error of 7%. In a similar vein, Putra et al. [69] explored the estimation of volumes for small sand piles, which had an average volume of 47.85 mm3 (≈48 × 10−9 m3) and encountered a remarkably high average error of 23%. Kuinkel et al. [55] also, demonstrated this trend by estimating the volume of a comparatively small pile with a volume of 0.14 m3. Even with the smallest recorded error in this study, their error still reached 14%. These findings underscore the ongoing challenges in accurately estimating the volume of small piles using photogrammetry and, hence, the resulting larger volumetric errors.
Ground control points (GCPs) can help photogrammetry software to estimate stockpile volumes with greater accuracy. GCPs are physical points on the ground with known coordinates estimated with methods such as the GNSS. Moreover, GCPs can be used to validate the accuracy of the photogrammetric workflow and ensure that the estimated stockpile volumes are within an acceptable range of error. According to the findings of Kokamägi et al. [57], reducing the number of GCPs from 16 to 7 led to an increase in the volumetric error of estimated volume from 2.3% to 3.2%. Additionally, their research indicated that avoiding GCPs led to a significant decrease in the estimated volume, showing a change of approximately 6.9% when compared to scenarios using seven GCPs. Other studies such as [55] also showed that conducting an aerial survey without utilizing GCPs can lead to volumetric errors of up to 12%. To address this issue, studies such as that by Liu et al. [70] and He et al. [71] developed correction methods for cases where GCPs are not available. Moreover, many studies have taken into account the impact of the flying altitude on the achieved accuracy of volume estimation. As expected, Rohizan et al. [61] showed that a lower altitude setting produces high volumetric error. Conversely, Idrees and Abdulrahman [60] reported that flying at 25 m produced better results than flying at 50 or 100 m. Lee and Lee [52] similarly found that flying at 50 m provided better estimation than flying at 100 m. However, these results are subjective and are potentially misleading, having produced their results in absolute figures. As a result, some researchers have determined altitude requirements in relative rather than absolute terms. To improve volume-estimation accuracy, Kuinkel et al. [55], for instance, concluded that the flight altitude should be 3.5 to 5 times the height of the stockpile. In addition, Idrees and Abdulrahman [60] introduced a new factor and called it the “surface-volume ratio” for volume comparisons, suggesting that smaller surface–volume ratios led to more accurate volume estimations. This was supported by Tucci et al. [72], who also showed that as the surface–volume ratio decreases, the computed volume becomes more accurate. Evidently, there is an expectation for an optimum flight altitude that depends on the mission being conducted: while higher flying altitudes provide wider viewport coverage, they also lead to less texture detail; hence, the optimal flight height will be clearly influenced by the pile scale and texture [63]. In fact, the impact of the flying altitude on the accuracy of volume estimation is a key factor that should be considered in aerial surveys, and, as discussed previously, relative altitude measurements and the surface–volume ratio are useful starting measures in determining this optimal flying altitude.
As a final discussion point in this section, we consider the impact of the captured image quality on volume-estimation accuracy, a topic that has been investigated by several studies. For example, Vacca [6] found that low-quality images never produced a volume difference greater than 1% compared to high-quality images. Similarly, de Carvalho et al. [54] reported that both high- and low-quality images resulted in similar volume estimations, but with vastly different processing times: 687 min for high-quality images versus 24 min for low-quality images. Note that there is no doubt that high-quality images are better for 3D reconstructions, but for volume-estimation purposes, higher quality images have a lesser effect on accuracy enhancement. Vacca’s study [6] also demonstrated the effect of the grid size on 3D surface generation, showing that a 1 m grid size provided similarly accurate estimates as a 0.5 m grid size. However, this result should be considered with caution as the study only considered a large survey area of approximately 145,000 m2. Cho et al. [59] found that changing the image sample size from 4 cm to 10 cm had a minor effect on the estimated volume, with an increase from 103,393 m3 to 105,667 m3: an increase of 2.2% for a surveyed area of 70,000 m2. All in all, the previous discussions show that the quality of captured images can have limited effect on volume estimation. While low-quality images may provide similar volume estimations as high-quality images, they will also require much lower processing times. Finally, the grid size of the generated 3D surface can also have an impact on volume-estimation accuracy, but this may vary depending on the surveyed area.
3.3. LiDAR Surveying
The use of LiDAR-based scanning techniques has found application in various fields. In agriculture, for instance, Zhang and Grift [73] used a LiDAR approach to measure crop height, while Siebers et al. [74] utilized a 3D LiDAR on a rover to monitor plant growth. In soil surface measurement, Foldager et al. [75] used a rail-mounted 3D LiDAR to achieve a narrow measurement of 40 mm and monitor changes over time. For mining and earthwork, Carabassa et al. [76] monitored soil erosion using a drone equipped with a LiDAR sensor, and Liu et al. [77] applied an aerial-borne LiDAR approach to monitor mining. In the context of stockpile monitoring and estimation, LiDAR sensors can be applied in various ways, such as being attached to a drone, rail-mounted, tripod-mounted, or handheld by an operator (Figure 6). Table 2 summarizes LiDAR-based approaches for outdoor stockpile volume estimation. The table compares these studies considering aspects such as application, platform, scanning payload, and estimated volumetric error.
Starting with airborne-LiDAR systems, Amaglo [78] conducted aerial surveying with a drone (customized Matrice 600 Pro) equipped with a 3D LiDAR (Velodyne Ultra Puck) to scan and estimate the volume of a stockpile, comparing its results with that from TLS and drone photogrammetry. While TLS required three times the capturing time taken by both photogrammetry and LiDAR, LiDAR required only half the processing time of the other methods. In terms of the estimated volume, the difference between the volume estimated by TLS compared to that from LiDAR and photogrammetry was around 0.7% and 3%, respectively. Forte et al. [79] also employed a drone equipped with a LiDAR sensor but used online/real-time localization estimation by fusing on-board data (such as IMU and GPS) and the LiDAR data with known environmental factors to correct the estimated altitude of the drone. They applied this approach to estimate the volume of three large coal stockpiles, using a DJI Matrice 100 drone equipped with a 3D LiDAR (SICK LD-MRS420201). The volume estimation obtained without altitude correction resulted in a misaligned point cloud, which subsequently led to a volumetric error exceeding 10% when compared to the point cloud fully aligned via the proposed method. Alsayed et al. [1] conducted a study in a UK cement plant, where they employed a drone equipped with GPS for localization, a 1D LiDAR for mapping, and a barometer for altitude. The system was assessed by mapping a coal pile of unknown volume in an open area and a pile with a known volume in a semi-confined space. Visual inspection of the generated stockpile surface revealed a strong correlation with the actual pile in the open area, and the volume of the pile in the semi-confined area was measured with a volumetric error of around 2.4%. This study was the first to demonstrate the effective use of a single-point range sensor (1D LiDAR) pointed towards the ground for scanning stockpiles, presenting a cost-effective and efficient way of stockpile mapping and is illustrated in Figure 7.
Turning to other approaches for mobilizing a LiDAR sensor, Zhang and Yang [80] and Zhang et al. [81] conducted a LiDAR-based stockpile volume scanning and estimation mission for a coal storage yard in Huanghua Port in China, while walking around the stockpile with a line scanning LiDAR (2D LiDAR) from SICK Company (Waldkirch, Germany) (LD-MRS400001), together with a position sensor based on two GNSS receivers. The 3D modeling was argued to be completed within 30 s after conducting the measurement, with the volume and mass of the coal piles being estimated with an error that is less than 0.8%. However, this approach can be considered expensive due to the requirement of several devices (2D LiDAR sensors, two GNSS receivers, attitude sensor, and an embedded industrial computer). Interestingly, He et al. [71] conducted a comparison of stockpile volume estimation using LiDAR-based walking and aerial photogrammetry. Both methods provided volumetric errors around 1–2% compared to the actual volume. However, the main limitation of the walking approach with a LiDAR scanner is that, if a stockpile is stacked beyond the field of view of the laser beams, the surveyor will need to climb the stockpile to scan the surface and eliminate/minimize occlusions. Note that, in this context, another approach to measuring stockpile volume is to use a 2D profilometer attached to an excavator, as conducted by Niskanen et al. [82]. They conducted a test to measure the volume of a conical soil pile with the reference volume being obtained by two methods: the number of buckets used (which led to a volume of 9.25 m3), and the measurement of the pile’s height and radius (which resulted in a volume of 9.54 m3). The volumetric errors, estimated using Matlab’s alpha shape function and Trimble RealWorks, were 1.5–2.0% and 2.5–5.5%, respectively, depending on the reference volume used in calculating the error. However, notably, GNSS and IMU facilities were still required in this work to generate a 3D model of the stockpile.
Finally, a transmission platform can be used to mobilize the LiDAR sensor while scanning. Bayar [83] employed a 2D LiDAR to scan and measure the volume of a small pile of chickpeas. The LiDAR was mounted on a rail and was moved in a zigzag motion using two stepper motors. The pile volume was estimated with approximately 0.5% error. Zhao et al. [84] also employed a LiDAR scanning approach to estimate stocked objects volume, while attaching a 3D LiDAR (SICK LMS511-10100 PRO) to a transmission platform (a controlled rail). The study included scanner calibration using initial status parameters (IMUs). The approach was validated by estimating the volume of several stacked boxes, demonstrating an approximate 3% volumetric error. However, the scans were conducted from only one side; hence, for complex objects this approach may fail as it may become necessary to scan from several sides.
4. Indoor Stockpile Volume Estimation
4.1. Overview
In this section, we will adopt a different arrangement compared to the previous section. This divergence primarily arises due to the unique challenges inherent to indoor environments and the relative scarcity of studies specifically targeting these scenarios. Unlike outdoor volume estimation, which has been the subject of extensive research and boasts a wealth of established methodologies, the same missions, but in indoor domains, are far less explored. This lack of an extensive knowledge base necessitates the consideration of not only key techniques but also potential practices relevant to indoor stockpile volume estimation.
Aiming to offer a review of the present state and potential future directions for indoor volume estimation, this section adopts a unique structure. In light of the growing utilization of drones for stockpile volume estimation in outdoor applications, this section begins with an examination of the challenges associated with deploying drones in indoor missions. This is followed by a review of current industrial solutions designed for such tasks. Finally, this section explores studies that have been conducted on stockpile volume estimation within indoor environments, categorized into three subsections: aerial, rail, and tripod-mounted systems. This organization is intended to present a comprehensive roadmap for exploring the unique conditions and challenges of indoor volume estimation, thereby fostering advancements in the field.
4.2. Challenges to Missions in Confined Spaces
Conducting robotic missions in confined spaces poses several challenges due to limitations of GPS signals, which affect localization and the usual necessity to operate beyond the line of sight [85]. In fact, the challenges associated with utilizing robotic platforms in confined spaces for stockpile volume-estimation purposes are summarized in Table 3. However, probably the most significant issue of these is operation in GPS-denied environments, and, to address this issue, simultaneous localization and mapping (SLAM) algorithms are typically applied, and have proved to be proficient for localization and mapping in confined spaces. These algorithms use sensors such as cameras or lasers (LiDAR) to detect distances and angles of the surrounding features and build a map of the environment, while simultaneously localizing themselves within that map [86]. Huang et al. [87] provided a comprehensive overview of SLAM algorithms, including LiDAR SLAM, visual SLAM, and their fusion. They discussed that LiDAR-based SLAM is not affected by changes in light conditions, making it the most suitable option for operations in low-illumination environments. However, the required 3D LiDAR sensors are heavier compared to vision sensors, leading to the use of larger and more expensive carrying platforms.
While photogrammetric approaches can be considered economical and effective for stockpile monitoring within outdoor missions, they cannot provide accurate volume estimates within indoor facilities due to several factors. First, altitude is usually limited within indoor missions. Second, automated feature detection and matching of the captured images under low-light conditions is challenging. On the other hand, stockpile storage illumination and texture do not favor visual- or LiDAR-based localization. In fact, illumination can be inconsistent, dim, or even absent in certain areas, making it difficult for visual-based systems to capture clear, accurate images, as visual-based approaches rely heavily on the quality of light to accurately capture images. Moreover, stockpiles in indoor settings can exhibit a wide range of textures, from smooth and uniform to rough and irregular. These variations in texture can create challenges for both visual- and LiDAR-based localization systems. Both systems can struggle to identify and distinguish features in uniform, texture-less surfaces, and LiDAR systems may experience difficulties in accurately capturing the intricate details of highly textured surfaces due to the scattering of the laser light. These challenges, along with other factors, such as narrow clearances and obstructions between the storage ceiling and the stockpile peaks, can be appreciated from the example demonstration in Figure 8. Furthermore, GNSS signals are required for data collected by either aerial or ground approaches, as well as for programmed drone mission flights. Therefore, the use of drones for indoor mapping is not feasible unless the platform is equipped with an obstacle avoidance system and/or real-time SLAM capabilities.
In situations where darkness and dust are present, laser-based sensors, such as LiDAR sensors, are favorable compared to visual-based approaches. Papachristos et al. [88] conducted aerial tests for underground inspection and mapping. Their experimental tests, conducted in a long mine, showed that LiDAR-based SLAM provides less drift in localization than visual-based SLAM. Generally, LiDAR sensors are widely considered in applications within dusty and dark environments, owing to their ability to detect targets despite poor visibility [89,90].
4.3. Present-Day Industrial and Commercial Solutions
Despite the challenges discussed in Section 4.2, several industrial and commercial solutions do exist for mobile indoor stockpile scanning and measuring. For instance, GeoSLAM [91] offers a LiDAR-based technology and software that can map and estimate the volume of stockpiles stored within confined spaces without the existence of a GPS signal. This system relies on a spinning 3D LiDAR scanner that can be handheld or mounted on a drone (Figure 9). In order to operate effectively in GPS-denied environments, GeoSLAM integrates advanced SLAM algorithms that are capable of processing complex environments with high accuracy. This high-performing SLAM technology, combined with the rapid data-acquisition capabilities of the LiDAR scanner, results in high-resolution, accurate, and reliable maps of the indoor environment. Moreover, the system employs an onboard processing unit to handle the immense computational load required by these sophisticated SLAM algorithms. This onboard processing enables real-time operation, ensuring the device can rapidly map its environment and track its location within that environment concurrently.
Another solution comes from a company named “Flyability” [92], specializing in aerial confined space inspection, as they announced their new generation of drones capable of mapping stockpiles within dusty and dark confined spaces, such as cement plants. This capability is mainly due to the upgrade of the drone platform with a 3D LiDAR scanner. Operating in tandem with GeoSLAM Connect, the newly incorporated 3D LiDAR scanner, effectively handles mapping and monitoring tasks, even in GPS-denied environments. Additionally, the drone is equipped with LED lights and a camera to capture images and provide visibility in dark conditions when feasible. It also features a protective cage that enables it to withstand collisions, protecting both the drone and the infrastructure being inspected. When it comes to navigation, operators have the option of utilizing live vision feeds or real-time generated maps, offering flexibility based on mission requirements.
The Hovermap drone, developed by Emesent [93], stands as another example solution for confined space surveying. Emesent’s specialty in drone autonomy and LiDAR mapping is epitomized by the Hovermap’s ability to autonomously fly beyond the line of sight and communication range. Moreover, it can seamlessly transfer from drone to handheld scanning, enabling its use in an array of challenging environments. The centerpiece of this system is an actuated rotary 3D LiDAR scanner and onboard real-time processing, which excels in creating high-definition maps under challenging conditions, including dimly lit or GPS-denied spaces. Alongside its robust mapping capabilities, the Hovermap drone features advanced collision avoidance, which is a vital attribute for safe operations in environments such as mines or intricate infrastructure. The system’s practicality was validated in an underground mining study conducted by Jones et al. [94], where it generated intricate 3D maps, thereby enriching the understanding of the mine’s structure and condition.
In addition to mobile scanners, static 3D-level sensors can be mounted on storage and silo ceilings to measure the height, area, and volume of stockpiles, using 3D laser scanners. These sensors can also account for dust build-up. Some available 3D-level sensor options include BinMaster’s 3DLevelScanner [95] and ABB’s VM3D 3D Volumetric Laser Scanner System [96]. In small areas, such as silos, static 3D-level sensors are prevalent and valuable within the different industries. However, in larger areas, like sheds, multiple scanners are needed to ensure full coverage, significantly increasing costs for initial acquisition and installation. This results in higher capital expenditure (CAPEX) and higher operational expenditure (OPEX) due to routine maintenance and functional testing. Furthermore, costs escalate when managing multiple stockpiles in several storage facilities.
Finally, while numerous industrial and commercial solutions are available for indoor stockpile measuring, these technologies often come with significant limitations. These include having high initial acquisition and installation costs, and that many of these solutions are proprietary, and thus are not open-source, limiting their accessibility and customization options for end-users. Consequently, such drawbacks create barriers for widespread adoption.
4.4. Optimizing Drone Solutions
Recently, multirotor drones have been employed in numerous applications involving confined space inspection, including stockpile volume estimation, e.g., [1,97,98]. Multirotor drones, in particular, possess the ability to hover and fly in all directions, making them well-suited for indoor missions. Moreover, these drones have the potential to reduce risks of entrapment and dust inhalation in confined spaces, thus improving occupational safety and health (OSH) measures by minimizing or eliminating the need for physical human intervention and consequently enhancing overall employee wellbeing. In what follows, we will consider some of the most notable contributions that utilized aerial drones for indoor stockpile volume-estimation missions.
Kumar et al. [97] developed an algorithm for aerial stockpile volume estimation using a stereo depth camera and deep learning. Their approach can be applied to indoor missions as it does not rely on GPS signals. However, it is limited to small piles since the camera must detect the entire pile to establish its boundary and estimate the volume. Furthermore, the estimation error increased from 1% to 9.8% when the volume was increased to around six times the original volume. This is besides the fact that vision-based approaches are not favored in dark environments. Gago et al. [98] demonstrated the development and evaluation of an aerial robotic system for stockpile volume estimation within warehouses. They used a DJI Matrice 100 quadrotor drone and equipped it with a 3D LiDAR (Velodyne VLP 16 Puck Lite). For navigation, the drone relied on the drone controller and the LiDAR point cloud, utilizing the storage walls or ceiling as reference points for autonomous flight. In other words, by continuously scanning and mapping the surrounding environment, the drone identifies these structures, and uses this information to maintain stable flight paths, avoid obstacles, and effectively navigate within the confined space. They tested various SLAM approaches for online mapping (LOAM, BLAM, RTAB-MAP) and found out that, due to the LiDAR’s vertical position and the storage’s high level of symmetry, the SLAM approaches consistently generated a shorter and curved storage representation. Consequently, they applied an offline mapping strategy to reconstruct the 3D model of the warehouse with the help of the warehouse parameters and blueprints. As such, the stockpiles were estimated with volumetric errors of approximately 1.5% within simulation tests and 2.2% within real experimental tests. Alsayed et al. [99,100] presented an efficient scan-matching approach for drone-based mapping in confined spaces. Their method relied on an Iterative Closest Point (ICP) algorithm suitable for low-rate and low-dense LiDAR scans, as it utilized the horizontal layer from a 3D LiDAR scan to estimate the required transformation matrices in a computationally efficient manner. This technique allowed real-time 3D map generation of the scanned environment and was complemented by an indoor navigation path-planning strategy. The approach was tested using simulations only, and the results demonstrated successful scan-matching at various flight speeds and scan rates. In fact, the volume of the mapped stockpile was estimated with an error as low as 3%.
Alsayed and Nabawy [101] proposed a simple and cost-effective solution for stockpile scanning that relied on a single-point LiDAR (1D LiDAR) sensor actuated by a micro servo motor attached to a drone. This method was evaluated through simulations to understand the impact of the various operating conditions on mapping performance. Remarkably, the actuated 1D LiDAR system achieved an average volumetric error of 0.8%, outperforming 2D and 3D LiDAR options while requiring less scanning speed, being lighter, and providing substantial cost savings. In another study, Alsayed et al. [102] demonstrated an autonomous formation control for a multi-drone system designed to map stockpiles in confined spaces using low-cost, lightweight 1D LiDAR sensors (depth sensors). Each drone’s scanning process adhered to the same principle depicted in Figure 7. The objective was to compare the cost–benefit of employing multiple low-cost sensors in a multi-agent system versus a single, advanced laser scanner (2D/3D LiDAR) on-board a single drone. The formation control strategy was analyzed via simulations, revealing that increasing the number of drones up to five agents enhanced the volume-estimation accuracy, yielding results comparable to employing the more sophisticated LiDAR scanners but at a much-reduced cost. However, for real-world applications, these methods would necessitate an external localization system to accurately determine the position and orientation of the drones during the mapping process. This is crucial to enable the integration of the acquired data from the drones into a coherent and precise 3D model of the stockpile. Notably, external localization systems, such as RTK GNSS or ultra-wideband (UWB) systems, can provide the necessary high-precision positioning information required to ensure successful execution of such stockpile mapping and volume-estimation missions.
It is worth highlighting that there is currently a notable lack of research on drone applications for indoor stockpile volume estimation, despite the growing interest in employing drones for various industrial and environmental applications. In fact, the limited number of studies on this specific topic underscores the need for further investigation and development in this relatively underexplored area. The constraints on deploying such missions in indoor environments present unique challenges that require innovative solutions to enable effective drone-based stockpile volume estimation. Exploring novel approaches, algorithms, and sensor technologies could unlock the potential for widespread adoption of drone technologies, improving efficiency and accuracy in stockpile management. Moreover, further research in this subject is expected to simultaneously lead to substantial advancements in multiple other fields, including warehouse management, inventory control, and worker safety.
4.5. Sensors Integrated on Rail Platforms
For indoor areas, it is a typical practice to integrate single or multiple laser scanners on a sliding rail positioned above the stored stockpiles (Figure 10). Zhao et al. [103] employed a 2D LiDAR scanner (Sick LMS200) that moves on a rail above the stockpile. The LiDAR measured the X and Y directions (2D plan), while the travel distance in the Z direction was measured by a laser range finder. The study was applied to a simple and uniform pile shape, then a curve-fitting modeling method was implemented. The volume was estimated with an error ranging between 0.6% to 3.8%. A similar system was developed by Xu et al. [104], but with two LiDAR scanners instead of a single scanner. They also applied a comparison to the GeoSLAM scanner and showed that the maximum volumetric error of the developed system was 1%. Moreover, they argued that their developed system operated 35 times faster than the GeoSLAM scanner. Daofang Chang et al. [105] proposed a 3D LiDAR-based approach to scan stockpiles within a storage facility where the 3D scanning device was installed on the arm of the stacker reclaimer, shifting along the track to scan the stockpiles’ surfaces. Although the proposed system was tested in a real setting, the accuracy of the scanned stockpiles was not investigated. Similarly, Zhang et al. [106] employed a vision-laser based approach to scan stockpiles within a storage facility. Cameras were used to capture the laser line on the surface and estimate the vertical 2D measurement of each stockpile section using projections and epipolar geometry constraints. The system was mounted on a railway. While the estimated volume was not investigated, the vertical depth error was deemed to be approximately 1%. All in all, while rail-based vision or laser sensing is a wide-adopted solution for indoor stockpile volume-estimation tasks, its primary limitation is that it is difficult to mobilize the whole system; hence, it is challenging to use a single setup in multiple facilities. Moreover, in some dark and dusty environments, it is harder to retrieve the sensors for periodic cleaning and maintenance.
4.6. Tripod-Mounted LiDAR Sensors
Similar to the practice adopted with TLS, several studies have mounted scanning sensors on tripods to scan stockpiles from multiple points. Mahlberg et al. [107] developed an image/LiDAR-based system for indoor stockpile volume estimation, called the SMART (Stockpile Management and Reporting Technology) system. The system was applied to over 30 facilities to monitor salt usage during the winter season in the USA. The system consisted of two 3D LiDAR sensors (Velodyne VLP-16) and one camera (GoPro Hero 9 RGB), all mounted on a tripod. To capture more data, the system was rotated manually. If necessary, multiple scanning positions were used. To enhance coverage in some cases, the system was mounted on the ceiling or on a mobile boom. The stockpile volumes were estimated with a volumetric error of less than 0.1%. Notably, the study utilized the work conducted in [108] to apply point cloud registrations, which were then used to determine the stockpile volume. Later, Liu et al. [2] improved the data collected by the SMART system and conducted tests within dome facilities, making use of enhanced scan matching. A simpler platform was also employed by de Lima and Costa [109] to estimate the volume of a cone-shaped pile. They fixed a 2D LiDAR on a tripod, and the laser scanner collected a vertical scan to estimate the volume. They demonstrated that as the pile size (diameter and height) increased, the estimated volume accuracy also increased, ranging from 19.6% to 1.5% for pile diameters ranging from 432 mm to 5616 mm. However, this approach is deemed only valid for single cone-shaped piles. In summary, tripod-mounted LiDAR scanners have been employed to effectively estimate stockpile volumes with good accuracy. However, moving the tripod to multiple locations within confined spaces is needed to enhance coverage, and this, in many cases, can pose safety risks.
4.7. Summary of Indoor Solutions for Stockpile Volume Estimation
In the preceding Section 4.4, Section 4.5 and Section 4.6, various approaches adopted for indoor stockpile volume estimation have been discussed. Table 4 provides a summarized overview of these studies, highlighting their main aspects including solutions, applications, platforms, scanning payloads, and volumetric errors.
5. Discussion and Remarks
5.1. Summary of Techniques
Accurate measurement of stockpile volumes is crucial in various fields and the selection of a suitable survey method depends on several factors, such as the complexity of the site, the level of measurement accuracy required, the time and cost of the survey project, and safety considerations. Manual measuring and satellite imagery techniques, highlighted in Section 2, can be argued to be not suitable for estimating volumes of irregular or constantly changing stockpiles, hence are not considered in our comparisons here. On the other hand, GNSS, drone photogrammetry, TLS, and airborne LiDAR can all be used for such a task, with each method providing different pros and cons, hence summarized in Table 5. Moreover, Figure 11 shows a schematic representation of the Digital Surface Model (DSM) of a complex shape stockpile produced from each of these methods. It is worth noting that the advantages and disadvantages listed in Table 5 are not exhaustive, and may vary depending on the specific context in which a technique is being used for.
In terms of data-acquisition speed, drone solutions such as drone photogrammetry and airborne LiDAR are expected to require less time in the field for collecting data. In contrast, GNSS generally requires the most time because of the many points needed to be collected over the area of interest. Additionally, GNSS poses a higher safety risk to surveyors compared to other methods, as surveyors need to be physically present at multiple locations. Moreover, drone photogrammetry requires GCPs whose positions are estimated using GNSS, which can increase the risk and time involved when placing the GCPs in their positions. This issue is avoided in airborne LiDARs as they do not require GCPs to obtain accurate data. In fact, in terms of accuracy, TLS provides the best accuracy compared to the other techniques. This stems from its method of operation, where the scanner remains stationary and rotates slowly to create a panoramic 360° view of the surroundings, forming a single comprehensive map. This method thus enables the capture of intricate details and complex surfaces with high precision. The stationary position of the TLS also reduces positional errors that might occur with moving systems, adding another layer of reliability to the generated data. However, TLS is an expensive approach and requires several scanning points to ensure a full coverage of the scanned area. Finally, an airborne LiDAR is more advantageous compared to drone photogrammetry when mapping complex terrain with vegetation cover, mapping during low-light or dusty conditions, and when detecting small/narrow objects such as cables. In fact, a LiDAR is known to be more effective compared to cameras, when accuracy is considered crucial.
For indoor applications, laser-based techniques are the best among the different surveying methods, for obvious reasons: they provide accurate data through low-light and/or dusty conditions, known to be prevalent in most confined spaces. However, a laser-based sensor may have limited view from the ground, making it hard to minimize occlusion. This gives advantages to airborne LiDARs, due to their ability to achieve full coverage of the area of interest, in most cases. That said, the operation of airborne LiDARs raises other challenges, required for satisfactory operation, such as drone navigation and localization.
5.2. Photogrammetry- vs. Laser-Based Techniques in Outdoor Surveying Missions
The majority of the available research studies on stockpile volume estimation within outdoor environments have used drone-based photogrammetry, with only a limited number of studies using a LiDAR-based approach. Despite LiDAR sensors being known for their precision, recent advancements in photogrammetry have enabled a high level of accuracy to be achieved. That said, cost and accessibility remain primary reasons for the relatively lower preference for LiDAR-based approaches in outdoor missions. Note that photogrammetry cameras are often readily available in drones, including low-cost options, leading to a more cost-effective system. On the other hand, airborne LiDARs require larger and more specialized drones, compared to drone photogrammetry, hence increasing the expected system cost. Nonetheless, LiDARs can be more effective in surveying areas with high vegetation cover as the LiDAR pulses can penetrate the gaps between leaves and branches reaching the ground surface, hence providing more accurate data than photogrammetry. LiDAR sensors also perform better in low illumination and dusty environments due to their active sensing technology, which is not affected by external lighting conditions or airborne particles in the same way that passive sensing technologies like cameras do. All in all, the selection of a suitable method for stockpile volume estimation in open areas depends on several factors, such as the stockpile size, equipment availability, project requirements, and environmental conditions. While LiDAR-based approaches may be more precise and accurate in some situations, their higher cost and the requirement for specialized equipment can, in many occasions, make photogrammetry a more practical choice.
5.3. Future Directions in Indoor Surveying Missions
The exploitation of the recently developed automated solutions for indoor stockpile volume estimation presents a significant opportunity to improve efficiency, accuracy, and safety in warehouse management, inventory control, and worker safety. Various techniques and solutions, such as SLAM algorithms, LiDAR-based technologies, aerial inspection, and static 3D-level sensors, have been employed to address the challenges associated with indoor stockpile volume estimation. However, these solutions are often costly, proprietary, or lack open-source alternatives, creating barriers for widespread adoption.
Few research studies have investigated the potential of multirotor drones for confined space inspections, demonstrating their ability to improve occupational safety and health measures by minimizing human intervention. Studies have explored vision-based and LiDAR-based approaches, yielding promising results, although there remain limitations regarding accuracy, scalability, and suitability for low-lit and/or dusty environments. While alternative approaches such as rail and tripod-mounted LiDAR sensors have been explored, these methods can be cumbersome and may pose safety risks when moving within confined spaces. In fact, the integration of sensors on rail platforms and/or tripods has demonstrated high accuracy, but also can be challenging to move easily between multiple facilities.
There is a growing need for further research and development in exploiting drone technologies for indoor stockpile volume estimation, as current solutions are either expensive or limited in their applicability. Advancements in this area have the potential to revolutionize warehouse management, inventory control, and worker safety by providing cost-effective and accurate solutions for stockpile volume estimation in confined spaces. In particular, exploring novel approaches, algorithms, and sensor technologies could unlock the potential of drone applications, ultimately leading to substantial advancements in multiple fields.
5.4. Prospective Developments in Aerial Stockpile Scanning for Confined Spaces
Navigating the evolving landscape of autonomous exploration within confined environments presents unique challenges and opportunities for technological advancement. Researchers, like Azpúrua et al. [14], have recently presented comprehensive analyses on this topic, drawing attention to the essential facets of robotic operation in such spaces. This study emphasized that robust and reliable map generation, precise localization, efficient path planning, and safe navigation are critical aspects for successful real-world applications. These key components set the stage for the integration and development of novel solutions, addressing the demand for improved accuracy, efficiency, and safety in indoor stockpile scanning and measurement. Moreover, they highlight the potential for integrating advanced sensor technology, intelligent algorithms, and innovative designs to create future-proof solutions that tackle the specific challenges of confined space exploration, thus forging a path towards the future of aerial stockpile scanning.
Traditional 2D and 3D LiDAR sensors, such as SICK 2D LiDAR and Velodyne 3D LiDAR, typically employ moving parts and motors to increase the field of view, by adjusting single or multiple laser points. However, such a design renders them too bulky for mounting on small drones. On the other hand, solid-state LiDAR, the latest trend in LiDAR technology, offers a solution: these new scanners lack moving parts, resulting in smaller and lighter devices. Figure 12 provides a comparison between solid-state and conventional scanning LiDARs. Solid-state LiDAR sensors can be broadly classified into three categories: flash-based LiDAR, microelectromechanical system (MEMS)-based LiDAR, and optical phased array (OPA)-based LiDAR [110]. For example, Velodyne, a leading LiDAR company, recently introduced VelaBIT, a static 3D LiDAR sensor, at a competitive price of around $100 [111,112]. Weighing only 125 g and featuring a range of up to 100 m, this sensor offers a simultaneously achievable horizontal (90°) and vertical (70°) field of view, together with low power consumption. Such sensors can potentially reduce drone size and cost constraints, expanding their applicability in 3D-LiDAR-equipped settings. LeddarTech is another company that offers a variety of solid-state LiDAR sensors, although their narrower field of view effectively makes them a 2D LiDAR. Despite the solid-state LiDAR potential to revolutionize aerial mapping, they have not yet been applied to indoor stockpile monitoring and volume estimation in any research work, and this is a future direction of research which can be promising.
Indoor localization poses a significant challenge due to the absence of GPS signals in such environments. Techniques such as SLAM algorithms have been employed to localize robots, including drones, in GPS-denied environments. However, featureless indoor environments can make SLAM implementation difficult. Additionally, SLAM algorithms rely on cameras and laser sensors, which increase the drone weight. External indoor localization systems offer a viable alternative, allowing for accurate drone positioning and navigation within indoor missions. These systems utilize external sensors, such as cameras, ultrasonic sensors, or ultra-wideband (UWB) devices, installed within the environment (e.g., on walls or ceilings, Figure 13) to determine the drone position and orientation [113]. Real-time positioning information can be communicated to the drone for navigation and obstacle avoidance, enabling data registration in the global frame without the need for methods like scan matching. Notably here is the work of Kunhoth et al. [114] who conducted a survey on various indoor positioning technologies, including Wi-Fi, Radio Frequency Identification (RFID), visible light, Bluetooth, and UWB. Their findings suggest that UWB offers a low-power consumption solution with centimeter-level accuracy. In fact, Marvelmind Robotics [115] has developed an indoor navigation positioning system based on ultrasound technology that provides precise drone location with ±2 cm accuracy. The system’s beacons have a range of 50 m each and are dust- and water-resistant, making them suitable for harsh environments. Similarly, Nooploop [116], a high-tech enterprise, specializes in developing advanced indoor positioning systems that leverage UWB technology. They have effectively harnessed this technology to facilitate indoor drone swarm shows. A testament to their innovation is the implementation of a streamlined setup requiring merely four beacons, each capable of a substantial range of 1500 m, to accurately control and coordinate the drones within the indoor environment. Hence, by employing such a system, flight paths can be designed in advance, and tests can be repeated with the same path, ultimately improving stockpile inventory monitoring.
In summary, advancements in LiDAR technology, swarm intelligence, and indoor localization systems hold significant promise for the future of aerial stockpile scanning within confined spaces. Further research and real-world applications of these emerging technologies will be essential in determining their full potential and overcoming the inherent challenges of operating robots in confined environments.
Author Contributions
Conceptualization, A.A. and M.R.A.N.; methodology, A.A. and M.R.A.N.; formal analysis, A.A. and M.R.A.N.; investigation, A.A. and M.R.A.N.; writing—original draft preparation, A.A.; writing—review and editing, M.R.A.N.; supervision, M.R.A.N. All authors have read and agreed to the published version of the manuscript.
Funding
This study forms part of Ahmad Alsayed’s PhD research which is funded by Umm Al-Qura University (Makkah, Saudi Arabia).
Data Availability Statement
The data presented in this study are available within the paper.
Conflicts of Interest
The authors declare no conflict of interest.
References
- Alsayed, A.; Yunusa-Kaltungo, A.; Quinn, M.K.; Arvin, F.; Nabawy, M.R.A. Drone-Assisted Confined Space Inspection and Stockpile Volume Estimation. Remote Sens. 2021, 13, 3356. [Google Scholar] [CrossRef]
- Liu, J.; Hasheminasab, S.M.; Zhou, T.; Manish, R.; Habib, A. An Image-Aided Sparse Point Cloud Registration Strategy for Managing Stockpiles in Dome Storage Facilities. Remote Sens. 2023, 15, 504. [Google Scholar] [CrossRef]
- Alsayed, A.; Nabawy, M.R.; Yunusa-Kaltungo, A.; Arvin, F.; Quinn, M.K. Towards Developing an Aerial Mapping System for Stockpile Volume Estimation in Cement Plants. In Proceedings of the AIAA Scitech 2021 Forum, Virtual Event, 11–15 & 19–21 January 2021; American Institute of Aeronautics and Astronautics: Reston, VA, USA, 2021; pp. 1–8. [Google Scholar] [CrossRef]
- Dang, T.; Tranzatto, M.; Khattak, S.; Mascarich, F.; Alexis, K.; Hutter, M. Graph-Based Subterranean Exploration Path Planning Using Aerial and Legged Robots. J. Field Robot. 2020, 37, 1363–1388. [Google Scholar] [CrossRef]
- Cao, D.; Zhang, B.; Zhang, X.; Yin, L.; Man, X. Optimization Methods on Dynamic Monitoring of Mineral Reserves for Open Pit Mine Based on UAV Oblique Photogrammetry. Measurement 2023, 207, 112364. [Google Scholar] [CrossRef]
- Vacca, G. UAV Photogrammetry for Volume Calculations. A Case Study of an Open Sand Quarry. In Computational Science and Its Applications—ICCSA 2022 Workshops; Lecture Notes in Computer Science (including Subseries Lecture Notes in Artificial Intelligence and Lecture Notes in Bioinformatics); Springer: Cham, Switerland, 2022; Volume 13382, pp. 505–518. [Google Scholar]
- Xiao, H.; Jiang, N.; Chen, X.; Hao, M.; Zhou, J. Slope Deformation Detection Using Subpixel Offset Tracking and an Unsupervised Learning Technique Based on Unmanned Aerial Vehicle Photogrammetry Data. Geol. J. 2023, 58, 2342–2352. [Google Scholar] [CrossRef]
- Bircher, A.; Kamel, M.; Alexis, K.; Oleynikova, H.; Siegwart, R. Receding Horizon Path Planning for 3D Exploration and Surface Inspection. Auton. Robot. 2018, 42, 291–306. [Google Scholar] [CrossRef]
- Yin, H.; Tan, C.; Zhang, W.; Cao, C.; Xu, X.; Wang, J.; Chen, J. Rapid Compaction Monitoring and Quality Control of Embankment Dam Construction Based on UAV Photogrammetry Technology: A Case Study. Remote Sens. 2023, 15, 1083. [Google Scholar] [CrossRef]
- Näsi, R.; Mikkola, H.; Honkavaara, E.; Koivumäki, N.; Oliveira, R.A.; Peltonen-Sainio, P.; Keijälä, N.-S.; Änäkkälä, M.; Arkkola, L.; Alakukku, L. Can Basic Soil Quality Indicators and Topography Explain the Spatial Variability in Agricultural Fields Observed from Drone Orthomosaics? Agronomy 2023, 13, 669. [Google Scholar] [CrossRef]
- Korpela, I.; Polvivaara, A.; Hovi, A.; Junttila, S.; Holopainen, M. Influence of Phenology on Waveform Features in Deciduous and Coniferous Trees in Airborne LiDAR. Remote Sens. Environ. 2023, 293, 113618. [Google Scholar] [CrossRef]
- Blistan, P.; Jacko, S.; Kovanič, Ľ.; Kondela, J.; Pukanská, K.; Bartoš, K. TLS and SfM Approach for Bulk Density Determination of Excavated Heterogeneous Raw Materials. Minerals 2020, 10, 174. [Google Scholar] [CrossRef]
- Westoby, M.J.; Brasington, J.; Glasser, N.F.; Hambrey, M.J.; Reynolds, J.M. ‘Structure-from-Motion’ Photogrammetry: A Low-Cost, Effective Tool for Geoscience Applications. Geomorphology 2012, 179, 300–314. [Google Scholar] [CrossRef]
- Azpúrua, H.; Saboia, M.; Freitas, G.M.; Clark, L.; Agha-mohammadi, A.; Pessin, G.; Campos, M.F.M.; Macharet, D.G. A Survey on the Autonomous Exploration of Confined Subterranean Spaces: Perspectives from Real-Word and Industrial Robotic Deployments. Rob. Auton. Syst. 2023, 160, 104304. [Google Scholar] [CrossRef]
- Jaboyedoff, M.; Oppikofer, T.; Abellán, A.; Derron, M.-H.; Loye, A.; Metzger, R.; Pedrazzini, A. Use of LIDAR in Landslide Investigations: A Review. Nat. Hazards 2012, 61, 5–28. [Google Scholar] [CrossRef]
- Colomina, I.; Molina, P. Unmanned Aerial Systems for Photogrammetry and Remote Sensing: A Review. ISPRS J. Photogramm. Remote Sens. 2014, 92, 79–97. [Google Scholar] [CrossRef]
- Sliusar, N.; Filkin, T.; Huber-Humer, M.; Ritzkowski, M. Drone Technology in Municipal Solid Waste Management and Landfilling: A Comprehensive Review. Waste Manag. 2022, 139, 1–16. [Google Scholar] [CrossRef] [PubMed]
- Livers, B.; Lininger, K.B.; Kramer, N.; Sendrowski, A. Porosity Problems: Comparing and Reviewing Methods for Estimating Porosity and Volume of Wood Jams in the Field. Earth Surf. Process Landf. 2020, 45, 3336–3353. [Google Scholar] [CrossRef]
- Deliry, S.I.; Avdan, U. Accuracy of Unmanned Aerial Systems Photogrammetry and Structure from Motion in Surveying and Mapping: A Review. J. Indian Soc. Remote Sens. 2021, 49, 1997–2017. [Google Scholar] [CrossRef]
- Malang, C.; Charoenkwan, P.; Wudhikarn, R. Implementation and Critical Factors of Unmanned Aerial Vehicle (UAV) in Warehouse Management: A Systematic Literature Review. Drones 2023, 7, 80. [Google Scholar] [CrossRef]
- Berra, E.F.; Peppa, M.V. Advances and Challenges of UAV SFM MVS Photogrammetry and Remote Sensing: Short Review. In Proceedings of the 2020 IEEE Latin American GRSS & ISPRS Remote Sensing Conference (LAGIRS), Santiago, Chile, 22–26 March 2020; pp. 533–538. [Google Scholar]
- Son, S.W.; Kim, D.W.; Sung, W.G.; Yu, J.J. Integrating UAV and TLS Approaches for Environmental Management: A Case Study of a Waste Stockpile Area. Remote Sens. 2020, 12, 1615. [Google Scholar] [CrossRef]
- Yakar, M.; Yilmaz, H.M. Using in volume computing of digital close range photogrammetry. In Proceedings of the XXIst ISPRS Congress, Beijing, China, 3–11 July 2008. [Google Scholar]
- d’Autume, M.; Perry, A.; Morel, J.-M.; Meinhardt-Llopis, E.; Facciolo, G. Stockpile Monitoring Using Linear Shape-from-Shading on Planetscope Imagery. ISPRS Ann. Photogramm. Remote Sens. Spat. Inf. Sci. 2020, 2, 427–434. [Google Scholar] [CrossRef]
- Gitau, F.; Maghanga, J.K.; Ondiaka, M.N. Spatial Mapping of the Extents and Volumes of Solid Mine Waste at Samrudha Resources Mine, Kenya: A GIS and Remote Sensing Approach. Model. Earth Syst. Environ. 2022, 8, 1851–1862. [Google Scholar] [CrossRef]
- Mari, R.; de Franchis, C.; Meinhardt-Llopis, E.; Facciolo, G. Automatic Stockpile Volume Monitoring Using Multi-View Stereo from Skysat Imagery. In Proceedings of the 2021 IEEE International Geoscience and Remote Sensing Symposium IGARSS, Brussels, Belgium, 11–16 July 2021; pp. 4384–4387. [Google Scholar]
- Schmidt, B.; Malgesini, M.; Turner, J.; Reinson, J. Satellite Monitoring of a Large Tailings Storage Facility. In Proceedings of the Tailings and Mine Waste Conference (2015: Vancouver, B.C.), Vancouver, Canada, 31 October 2015. [Google Scholar] [CrossRef]
- Sivitskis, A.J.; Lehner, J.W.; Harrower, M.J.; Dumitru, I.A.; Paulsen, P.E.; Nathan, S.; Viete, D.R.; Al-Jabri, S.; Helwing, B.; Wiig, F.; et al. Detecting and Mapping Slag Heaps at Ancient Copper Production Sites in Oman. Remote Sens. 2019, 11, 3014. [Google Scholar] [CrossRef]
- Li, T.; Zhang, H.; Gao, Z.; Chen, Q.; Niu, X. High-Accuracy Positioning in Urban Environments Using Single-Frequency Multi-GNSS RTK/MEMSIMU Integration. Remote Sens. 2018, 10, 205. [Google Scholar] [CrossRef]
- Lewicka, O.; Specht, M.; Stateczny, A.; Specht, C.; Brčić, D.; Jugović, A.; Widźgowski, S.; Wiśniewska, M. Analysis of GNSS, Hydroacoustic and Optoelectronic Data Integration Methods Used in Hydrography. Sensors 2021, 21, 7831. [Google Scholar] [CrossRef]
- Famiglietti, N.A.; Cecere, G.; Grasso, C.; Memmolo, A.; Vicari, A. A Test on the Potential of a Low Cost Unmanned Aerial Vehicle RTK/PPK Solution for Precision Positioning. Sensors 2021, 21, 3882. [Google Scholar] [CrossRef]
- Du, M.; Li, H.; Roshanianfard, A. Design and Experimental Study on an Innovative UAV-LiDAR Topographic Mapping System for Precision Land Levelling. Drones 2022, 6, 403. [Google Scholar] [CrossRef]
- Aber, J.S.; Marzolff, I.; Ries, J.B. Photogrammetry. In Small-Format Aerial Photography; Elsevier: Amsterdam, The Netherlands, 2010; pp. 23–39. [Google Scholar] [CrossRef]
- Szeliski, R. Computer Vision; Springer: London, UK, 2011; ISBN 978-1-84882-934-3. [Google Scholar]
- Dong, Z.; Liang, F.; Yang, B.; Xu, Y.; Zang, Y.; Li, J.; Wang, Y.; Dai, W.; Fan, H.; Hyyppäb, J.; et al. Registration of Large-Scale Terrestrial Laser Scanner Point Clouds: A Review and Benchmark. ISPRS J. Photogramm. Remote Sens. 2020, 163, 327–342. [Google Scholar]
- Cheng, L.; Chen, S.; Liu, X.; Xu, H.; Wu, Y.; Li, M.; Chen, Y. Registration of Laser Scanning Point Clouds: A Review. Sensors 2018, 18, 1641. [Google Scholar] [PubMed]
- Xiong, L.; Wang, G.; Bao, Y.; Zhou, X.; Wang, K.; Liu, H.; Sun, X.; Zhao, R. A Rapid Terrestrial Laser Scanning Method for Coastal Erosion Studies: A Case Study at Freeport, Texas, USA. Sensors 2019, 19, 3252. [Google Scholar] [CrossRef] [PubMed]
- Filkin, T.; Sliusar, N.; Huber-Humer, M.; Ritzkowski, M.; Korotaev, V. Estimation of Dump and Landfill Waste Volumes Using Unmanned Aerial Systems. Waste Manag. 2022, 139, 301–308. [Google Scholar] [CrossRef]
- PS, R.; Jeyan, M.L. Mini Unmanned Aerial Systems (UAV)—A Review of the Parameters for Classification of a Mini UAV. Int. J. Aviat. Aeronaut. Aerosp. 2020, 7, 5. [Google Scholar] [CrossRef]
- Abdelrahman, M.M.; Elnomrossy, M.M.; Ahmed, M.R. Development of Mini Unmanned Air Vehicles. In Proceedings of the 13th International Conference on Aerospace Sciences & Aviation Technology, Cairo, Egypt, 26–28 May 2009. [Google Scholar]
- Goraj, Z.; Cisowski, J.; Frydrychewicz, A.; Grendysa, W.; Jonas, M. Mini UAV Design and Optimization for Long Endurance Mission. In Proceedings of the ICAS Secretariat-26th Congress of International Council of the Aeronautical Sciences 2008, ICAS, Anchorage, AK, USA, 14–19 September 2008; Volume 3, pp. 2636–2647. [Google Scholar]
- Wood, R.; Finio, B.; Karpelson, M.; Ma, K.; Pérez-Arancibia, N.; Sreetharan, P.; Tanaka, H.; Whitney, J. Progress on ‘Pico’ Air Vehicles. Int. J. Rob. Res. 2012, 31, 1292–1302. [Google Scholar] [CrossRef]
- Petricca, L.; Ohlckers, P.; Grinde, C. Micro- and Nano-Air Vehicles: State of the Art. Int. J. Aerosp. Eng. 2011, 2011, 214549. [Google Scholar] [CrossRef]
- Floreano, D.; Wood, R.J. Science, Technology and the Future of Small Autonomous Drones. Nature 2015, 521, 460–466. [Google Scholar] [CrossRef]
- Nabawy, M.R.A.; Marcinkeviciute, R. Scalability of Resonant Motor-Driven Flapping Wing Propulsion Systems. R. Soc. Open Sci. 2021, 8, 210452. [Google Scholar] [CrossRef] [PubMed]
- Shearwood, T.R.; Nabawy, M.R.A.; Crowther, W.J.; Warsop, C. A Novel Control Allocation Method for Yaw Control of Tailless Aircraft. Aerospace 2020, 7, 150. [Google Scholar] [CrossRef]
- Shearwood, T.R.; Nabawy, M.R.A.; Crowther, W.J.; Warsop, C. Coordinated Roll Control of Conformal Finless Flying Wing Aircraft. IEEE Access 2023, 11, 61401–61411. [Google Scholar] [CrossRef]
- Shearwood, T.R.; Nabawy, M.R.; Crowther, W.J.; Warsop, C. Directional Control of Finless Flying Wing Vehicles—An Assessment of Opportunities for Fluidic Actuation. In Proceedings of the AIAA Aviation 2019 Forum, Dallas, TX, USA, 17–21 June 2019; American Institute of Aeronautics and Astronautics: Reston, VA, USA, 2019. [Google Scholar] [CrossRef]
- Shearwood, T.R.; Nabawy, M.R.; Crowther, W.J.; Warsop, C. Three-Axis Control of Tailless Aircraft Using Fluidic Actuators: MAGMA Case Study. In Proceedings of the AIAA AVIATION 2021 Forum, Virtual Event, 2–6 August 2021; American Institute of Aeronautics and Astronautics: Reston, VA, USA, 2021. [Google Scholar] [CrossRef]
- Hassanalian, M.; Abdelkefi, A. Classifications, Applications, and Design Challenges of Drones: A Review. Prog. Aerosp. Sci. 2017, 91, 99–131. [Google Scholar] [CrossRef]
- Shahmoradi, J.; Talebi, E.; Roghanchi, P.; Hassanalian, M. A Comprehensive Review of Applications of Drone Technology in the Mining Industry. Drones 2020, 4, 34. [Google Scholar] [CrossRef]
- Lee, K.; Lee, W.H. Earthwork Volume Calculation, 3D Model Generation, and Comparative Evaluation Using Vertical and High-Oblique Images Acquired by Unmanned Aerial Vehicles. Aerospace 2022, 9, 606. [Google Scholar] [CrossRef]
- Kim, Y.H.; Shin, S.S.; Lee, H.K.; Park, E.S. Field Applicability of Earthwork Volume Calculations Using Unmanned Aerial Vehicle. Sustainability 2022, 14, 9331. [Google Scholar] [CrossRef]
- de Carvalho, L.M.E.; Melo, A.; Umbelino, G.J.M.; Mund, J.-P.; dos Santos, J.G.; Rosette, J.; Silveira, D.; Gorgens, E.B. Charcoal Heaps Volume Estimation Based on Unmanned Aerial Vehicles. South. For. A J. For. Sci. 2021, 83, 303–309. [Google Scholar] [CrossRef]
- Kuinkel, M.S.; Zhang, C.; Liu, P.; Demirkesen, S.; Ksaibati, K. Suitability Study of Using UAVs to Estimate Landfilled Fly Ash Stockpile. Sensors 2023, 23, 1242. [Google Scholar] [CrossRef]
- Ajayi, O.G.; Ajulo, J. Investigating the Applicability of Unmanned Aerial Vehicles (UAV) Photogrammetry for the Estimation of the Volume of Stockpiles. Quaest. Geogr. 2021, 40, 25–38. [Google Scholar] [CrossRef]
- Kokamägi, K.; Türk, K.; Liba, N. UAV Photogrammetry for Volume Calculations. Agron. Res. 2020, 18, 2087–2102. [Google Scholar] [CrossRef]
- Mora, O.E.; Chen, J.; Stoiber, P.; Koppanyi, Z.; Pluta, D.; Josenhans, R.; Okubo, M. Accuracy of Stockpile Estimates Using Low-Cost SUAS Photogrammetry. Int. J. Remote Sens. 2020, 41, 4512–4529. [Google Scholar] [CrossRef]
- Cho, S.; Lim, J.H.; Lim, S.B.; Yun, H.C. A Study on DEM-Based Automatic Calculation of Earthwork Volume for BIM Application. J. Korean Soc. Surv. Geod. Photogramm. Cartogr. 2020, 38, 131–140. [Google Scholar] [CrossRef]
- IDREES, A.; HEETO, F. Evaluation of Uav-Based Dem for Volume Calculation. J. Univ. Duhok 2020, 23, 11–24. [Google Scholar] [CrossRef]
- Rohizan, M.H.; Ibrahim, A.H.; Abidin, C.Z.C.; Ridwan, F.M.; Ishak, R. Application of Photogrammetry Technique for Quarry Stockpile Estimation. IOP Conf. Ser. Earth Environ. Sci. 2021, 920, 012040. [Google Scholar] [CrossRef]
- Jiang, Y.; Liang, W.; Geng, P. Application Research on Slope Deformation Monitoring and Earthwork Calculation of Foundation Pits Based on UAV Oblique Photography. IOP Conf. Ser. Earth Environ. Sci. 2020, 580, 012053. [Google Scholar] [CrossRef]
- Liu, S.; Yu, J.; Ke, Z.; Dai, F.; Chen, Y. Aerial–Ground Collaborative 3D Reconstruction for Fast Pile Volume Estimation with Unexplored Surroundings. Int. J. Adv. Robot. Syst. 2020, 17, 172988142091994. [Google Scholar] [CrossRef]
- Matsimbe, J.; Mdolo, W.; Kapachika, C.; Musonda, I.; Dinka, M. Comparative Utilization of Drone Technology vs. Traditional Methods in Open Pit Stockpile Volumetric Computation: A Case of Njuli Quarry, Malawi. Front Built Environ. 2022, 8, 1037487. [Google Scholar] [CrossRef]
- Mantey, S.; Aduah, M.S. Comparative Analysis of Stockpile Volume Estimation Using UAV and GPS Techniques. Ghana Min. J. 2021, 21, 1–10. [Google Scholar] [CrossRef]
- Park, H.C.; Rachmawati, T.S.N.; Kim, S. UAV-Based High-Rise Buildings Earthwork Monitoring—A Case Study. Sustainability 2022, 14, 10179. [Google Scholar] [CrossRef]
- Matsuura, Y.; Heming, Z.; Nakao, K.; Qiong, C.; Firmansyah, I.; Kawai, S.; Yamaguchi, Y.; Maruyama, T.; Hayashi, H.; Nobuhara, H. High-Precision Plant Height Measurement by Drone with RTK-GNSS and Single Camera for Real-Time Processing. Sci. Rep. 2023, 13, 6329. [Google Scholar] [CrossRef]
- Liu, Z.; Dai, Z.; Zeng, Q.; Liu, J.; Liu, F.; Lu, Q. Detection of Bulk Feed Volume Based on Binocular Stereo Vision. Sci. Rep. 2022, 12, 9318. [Google Scholar] [CrossRef] [PubMed]
- Putra, C.A.; Wahyu Syaifullah, J.; Adila, M. Approximate Volume of Sand Materials Stockpile Based on Structure From Motion (SFM). In Proceedings of the 2020 6th Information Technology International Seminar (ITIS), Surabaya, Indonesia, 14–16 October 2020; pp. 135–139. [Google Scholar]
- Liu, J.; Xu, W.; Guo, B.; Zhou, G.; Zhu, H. Accurate Mapping Method for UAV Photogrammetry Without Ground Control Points in the Map Projection Frame. IEEE Trans. Geosci. Remote Sens. 2021, 59, 9673–9681. [Google Scholar] [CrossRef]
- He, H.; Chen, T.; Zeng, H.; Huang, S. Ground Control Point-Free Unmanned Aerial Vehicle-Based Photogrammetry for Volume Estimation of Stockpiles Carried on Barges. Sensors 2019, 19, 3534. [Google Scholar] [CrossRef]
- Tucci, G.; Gebbia, A.; Conti, A.; Fiorini, L.; Lubello, C. Monitoring and Computation of the Volumes of Stockpiles of Bulk Material by Means of UAV Photogrammetric Surveying. Remote Sens. 2019, 11, 1471. [Google Scholar] [CrossRef]
- Zhang, L.; Grift, T.E. A LIDAR-Based Crop Height Measurement System for Miscanthus Giganteus. Comput. Electron. Agric. 2012, 85, 70–76. [Google Scholar] [CrossRef]
- Siebers, M.; Edwards, E.; Jimenez-Berni, J.; Thomas, M.; Salim, M.; Walker, R. Fast Phenomics in Vineyards: Development of GRover, the Grapevine Rover, and LiDAR for Assessing Grapevine Traits in the Field. Sensors 2018, 18, 2924. [Google Scholar] [CrossRef]
- Foldager, F.; Pedersen, J.; Skov, E.; Evgrafova, A.; Green, O. LiDAR-Based 3D Scans of Soil Surfaces and Furrows in Two Soil Types. Sensors 2019, 19, 661. [Google Scholar] [CrossRef] [PubMed]
- Carabassa, V.; Montero, P.; Alcañiz, J.M.; Padró, J.-C. Soil Erosion Monitoring in Quarry Restoration Using Drones. Minerals 2021, 11, 949. [Google Scholar] [CrossRef]
- Liu, J.; Liu, X.; Lv, X.; Wang, B.; Lian, X. Novel Method for Monitoring Mining Subsidence Featuring Co-Registration of UAV LiDAR Data and Photogrammetry. Appl. Sci. 2022, 12, 9374. [Google Scholar] [CrossRef]
- Amaglo, W.Y. Volume Calculation Based on LiDAR Data. Master’s Thesis, Royal Institute of Technology, Stockholm, Sweden, 2021. [Google Scholar]
- Forte, M.; Neto, P.; Thé, G.; Nogueira, F. Altitude Correction of an UAV Assisted by Point Cloud Registration of LiDAR Scans. In Proceedings of the 18th International Conference on Informatics in Control, Automation and Robotics - ICINCO, Online Streaming, 6–8 July 2021; SciTePress: Setúbal, Portugal, 2021; pp. 485–492, ISBN 978-989-758-522-7. [Google Scholar] [CrossRef]
- Zhang, W.; Yang, D. Lidar-Based Fast 3D Stockpile Modeling. In Proceedings of the 2019 International Conference on Intelligent Computing, Automation and Systems (ICICAS), Chongqing, China, 6–8 December 2019; pp. 703–707. [Google Scholar]
- Zhang, W.; Yang, D.; Li, Y.; Xu, W. Portable 3D Laser Scanner for Volume Measurement of Coal Pile. In Lecture Notes in Electrical Engineering; Springer: Singapore, 2020; Volume 517, pp. 340–347. [Google Scholar]
- Niskanen, I.; Immonen, M.; Hallman, L.; Mikkonen, M.; Hokkanen, V.; Hashimoto, T.; Kostamovaara, J.; Heikkilä, R. Using a 2D Profilometer to Determine Volume and Thickness of Stockpiles and Ground Layers of Roads. J. Transp. Eng. Part B Pavements 2023, 149, 04022074. [Google Scholar] [CrossRef]
- Bayar, G. Increasing Measurement Accuracy of a Chickpea Pile Weight Estimation Tool Using Moore-Neighbor Tracing Algorithm in Sphericity Calculation. J. Food Meas. Charact. 2021, 15, 296–308. [Google Scholar] [CrossRef]
- Zhao, Q.; Wu, Y.; Li, X.; Xu, J.; Meng, Q. A Method of Measuring Stacked Objects Volume Based on Laser Sensing. Meas. Sci. Technol. 2017, 28, 105002. [Google Scholar] [CrossRef]
- de Croon, G.; de Wagter, C. Challenges of Autonomous Flight in Indoor Environments. In Proceedings of the 2018 IEEE/RSJ International Conference on Intelligent Robots and Systems (IROS), Madrid, Spain, 1–5 October 2018; pp. 1003–1009. [Google Scholar]
- Dissanayake, M.W.M.G.; Newman, P.; Clark, S.; Durrant-Whyte, H.F.; Csorba, M. A Solution to the Simultaneous Localization and Map Building (SLAM) Problem. IEEE Trans. Robot. Autom. 2001, 17, 229–241. [Google Scholar] [CrossRef]
- Huang, B.; Zhao, J.; Liu, J. A Survey of Simultaneous Localization and Mapping with an Envision in 6G Wireless Networks. arXiv 2019, arXiv:1909.05214. [Google Scholar]
- Papachristos, C.; Khattak, S.; Mascarich, F.; Dang, T.; Alexis, K. Autonomous Aerial Robotic Exploration of Subterranean Environments Relying on Morphology–Aware Path Planning. In Proceedings of the 2019 International Conference on Unmanned Aircraft Systems (ICUAS), Atlanta, GA, USA, 11–14 June 2019; pp. 299–305. [Google Scholar]
- Phillips, T.G.; Guenther, N.; McAree, P.R. When the Dust Settles: The Four Behaviors of LiDAR in the Presence of Fine Airborne Particulates. J. Field Robot. 2017, 34, 985–1009. [Google Scholar] [CrossRef]
- Ryde, J.; Hillier, N. Performance of Laser and Radar Ranging Devices in Adverse Environmental Conditions. J. Field Robot. 2009, 26, 712–727. [Google Scholar] [CrossRef]
- GeoSLAM Stockpile Volumes: Laser Technology & Software for Mining. Available online: https://geoslam.com/solutions/stockpile-volumes/ (accessed on 28 February 2023).
- Flyability Elios 3-Digitizing the Inaccessible. Available online: https://www.flyability.com/elios-3 (accessed on 22 August 2022).
- Emesent Hovermap, S.T. Available online: https://www.emesent.com/hovermap-st/ (accessed on 28 February 2023).
- Jones, E.; Sofonia, J.; Canales, C.; Hrabar, S.; Kendoul, F. Applications for the Hovermap Autonomous Drone System in Underground Mining Operations. J. South Afr. Inst. Min. Met. 2020, 120, 49–56. [Google Scholar] [CrossRef]
- BinMaster 3DlevelScanner. Available online: https://www.binmaster.com/products/product/3dlevelscanner (accessed on 28 February 2023).
- ABB VM3D 3D Volumetric Laser Scanner System. Available online: www.abb.com/myvm3d (accessed on 28 February 2023).
- Kumar, C.; Mathur, Y.; Jannesari, A. Efficient Volume Estimation for Dynamic Environments Using Deep Learning on the Edge. In Proceedings of the 2022 IEEE International Parallel and Distributed Processing Symposium Workshops (IPDPSW), Lyon, France, 30 May–3 June 2022; pp. 995–1002. [Google Scholar]
- Gago, R.M.; Pereira, M.Y.A.; Pereira, G.A.S. An Aerial Robotic System for Inventory of Stockpile Warehouses. Eng. Rep. 2021, 3, e12396. [Google Scholar] [CrossRef]
- Alsayed, A.; Nabawy, M.R.A.; Yunusa-Kaltungo, A.; Quinn, M.K.; Arvin, F. An Autonomous Mapping Approach for Confined Spaces Using Flying Robots. In Towards Autonomous Robotic Systems; Fox, C., Gao, J., Ghalamzan Esfahani, A., Saaj, M., Hanheide, M., Parsons, S., Eds.; Springer International Publishing: Cham, Switerland, 2021; pp. 326–336. [Google Scholar]
- Alsayed, A.; Nabawy, M.R.; Yunusa-Kaltungo, A.; Quinn, M.K.; Arvin, F. Real-Time Scan Matching for Indoor Mapping with a Drone. In Proceedings of the AIAA SCITECH 2022 Forum, Virtual Event, 3–7 January 2022; American Institute of Aeronautics and Astronautics: Reston, VA, USA, 2022. [Google Scholar] [CrossRef]
- Alsayed, A.; Nabawy, M.R.A. Indoor Stockpile Reconstruction Using Drone-Borne Actuated Single-Point LiDARs. Drones 2022, 6, 386. [Google Scholar] [CrossRef]
- Alsayed, A.; Nabawy, M.R.; Arvin, F. Autonomous Aerial Mapping Using a Swarm of Unmanned Aerial Vehicles. In Proceedings of the AIAA AVIATION 2022 Forum, Virtual Event, 27 June–1 July 2022; American Institute of Aeronautics and Astronautics: Reston, VA, USA, 2022. [Google Scholar] [CrossRef]
- Zhao, S.; Lu, T.-F.; Koch, B.; Hurdsman, A. Stockpile Modelling Using Mobile Laser Scanner for Quality Grade Control in Stockpile Management. In Proceedings of the 2012 12th International Conference on Control Automation Robotics & Vision (ICARCV), Guangzhou, China, 5–7 December 2012; pp. 811–816. [Google Scholar]
- Xu, Z.; Lu, X.; Xu, E.; Xia, L. A Sliding System Based on Single-Pulse Scanner and Rangefinder for Pile Inventory. IEEE Geosci. Remote Sens. Lett. 2022, 19, 1–5. [Google Scholar] [CrossRef]
- Chang, D.; Lu, H.; Mi, W. Bulk Terminal Stockpile Automatic Modeling Based on 3D Scanning Technology. In Proceedings of the 2010 International Conference on Future Information Technology and Management Engineering, Changzhou, China, 9–10 October 2010; Volume 1, pp. 67–70. [Google Scholar]
- Zhang, X.; Ou, J.; Yuan, Y.; Shang, Y.; Yu, Q. Projection-Aided Videometric Method for Shape Measurement of Large-Scale Bulk Material Stockpile. Appl. Opt. 2011, 50, 5178–5184. [Google Scholar] [CrossRef]
- Mahlberg, J.A.; Manish, R.; Koshan, Y.; Joseph, M.; Liu, J.; Wells, T.; McGuffey, J.; Habib, A.; Bullock, D.M. Salt Stockpile Inventory Management Using LiDAR Volumetric Measurements. Remote Sens. 2022, 14, 4802. [Google Scholar] [CrossRef]
- Manish, R.; Hasheminasab, S.M.; Liu, J.; Koshan, Y.; Mahlberg, J.A.; Lin, Y.-C.; Ravi, R.; Zhou, T.; McGuffey, J.; Wells, T.; et al. Image-Aided LiDAR Mapping Platform and Data Processing Strategy for Stockpile Volume Estimation. Remote Sens. 2022, 14, 231. [Google Scholar] [CrossRef]
- de Lima, D.P.; Costa, G.H. On the Stockpiles Volume Measurement Using a 2D Scanner. In Proceedings of the 2021 5th International Symposium on Instrumentation Systems, Circuits and Transducers (INSCIT), Campinas, Brazil, 23–27 August 2021; pp. 1–5. [Google Scholar]
- Li, N.; Ho, C.P.; Xue, J.; Lim, L.W.; Chen, G.; Fu, Y.H.; Lee, L.Y.T. A Progress Review on Solid-State LiDAR and Nanophotonics-Based LiDAR Sensors. Laser Photon. Rev. 2022, 16, 2100511. [Google Scholar] [CrossRef]
- Lauter, C. Velodyne’s ‘$100 Lidar’ Is Reborn with an Improved Field of View. Available online: https://www.geoweeknews.com/news/velodyne-s-100-lidar-is-reborn-with-an-improved-field-of-view (accessed on 28 February 2023).
- Digiflec Velabit. Available online: https://digiflec.com/velabit/ (accessed on 28 February 2023).
- Gyagenda, N.; Hatilima, J.V.; Roth, H.; Zhmud, V. A Review of GNSS-Independent UAV Navigation Techniques. Rob. Auton. Syst. 2022, 152, 104069. [Google Scholar] [CrossRef]
- Kunhoth, J.; Karkar, A.G.; Al-Maadeed, S.; Al-Ali, A. Indoor Positioning and Wayfinding Systems: A Survey. Hum.-Centric Comput. Inf. Sci. 2020, 10, 1–41. [Google Scholar]
- Marvelmind Robotics Precise (±2 cm) Indoor Positioning System. Available online: https://marvelmind.com/ (accessed on 28 February 2023).
- Nooploop Precise Positioning, Enabling Industry. Available online: https://www.nooploop.com/en/ (accessed on 7 June 2023).
Figure 1.
Historical trend of research articles on aerial stockpile volume estimation, based on the search results acquired from Scopus using relevant keywords. The data reveal a marked increase in the application of drones for stockpile volume estimation, starting from 2012. This trend highlights the growing interest and adoption of drone-based solutions for accurate and efficient stockpile volume measurements in various industries.
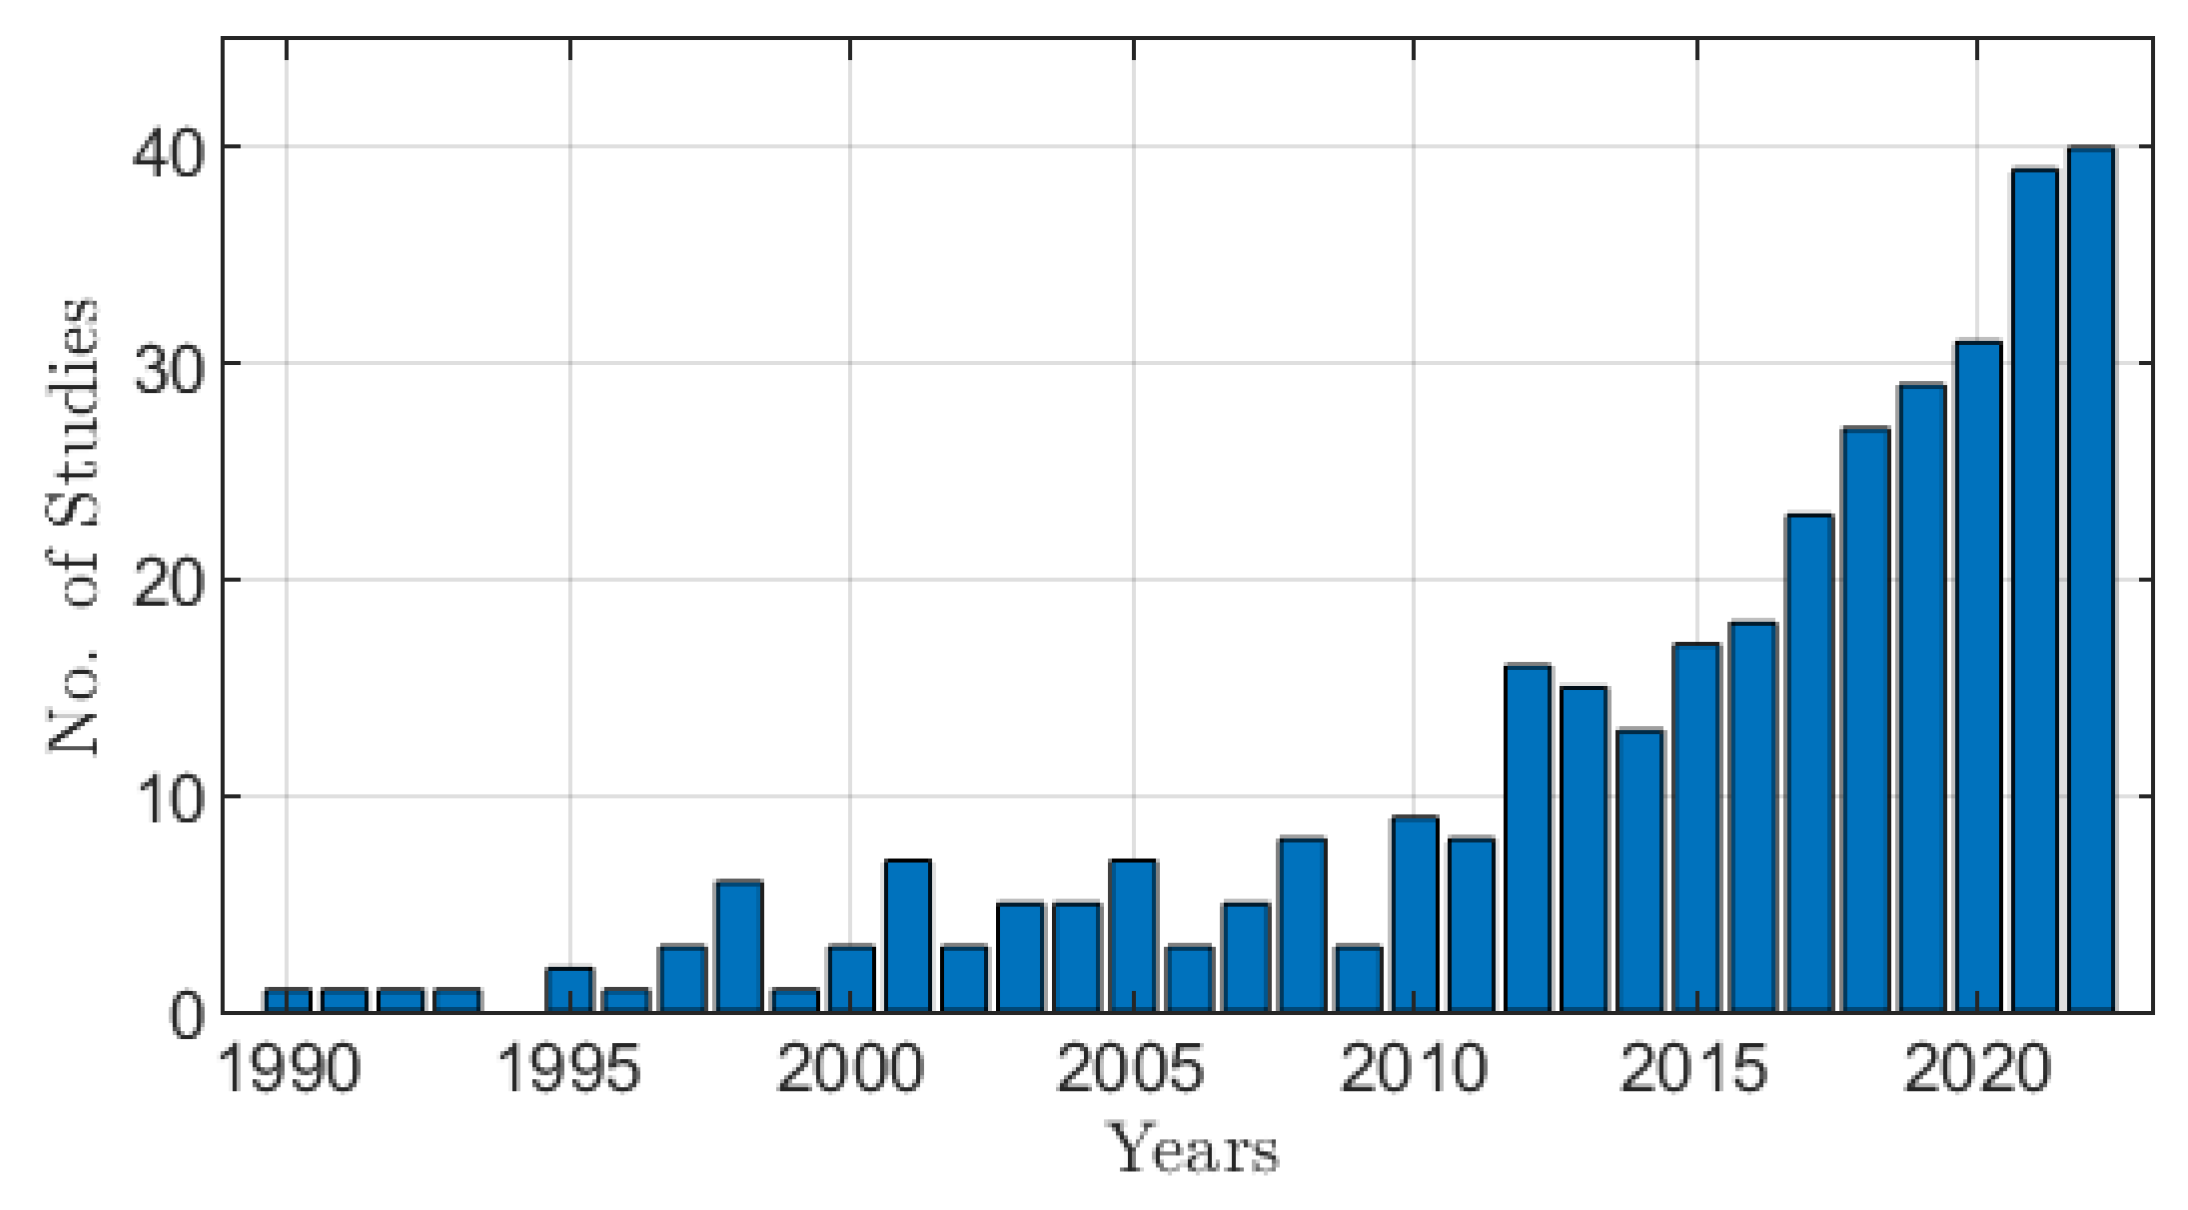
Figure 2.
A flowchart demonstrating techniques used for stockpile volume estimation, along with their typical most commonly applied sub-methods for 3D model reconstruction. Note that, techniques in dash-lined boxes are not extensively reviewed in this work. Techniques in blue boxes represent the focus of this work.
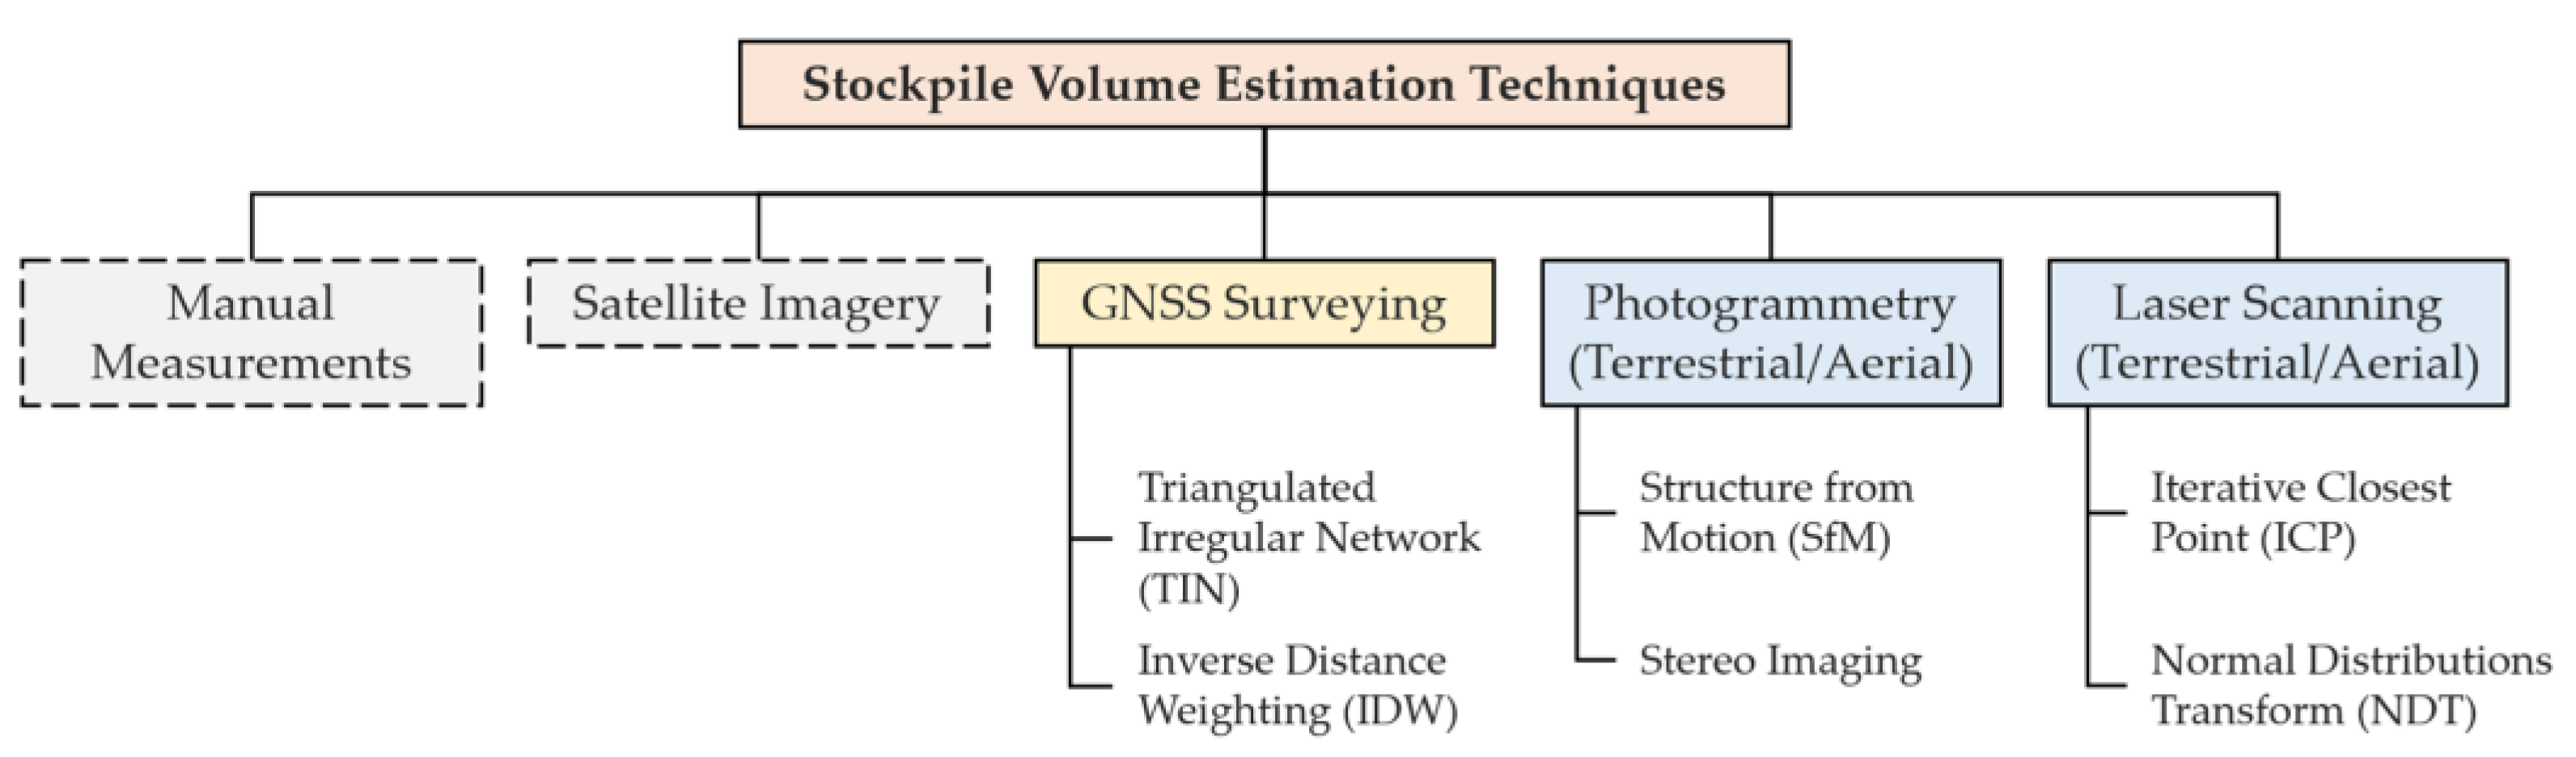
Figure 3.
Visual illustration of the Real-Time Kinematic (RTK) GNSS technique, integrating the interaction between GNSS, base station (providing reference coordinates for correction), and a robot (drone or rover) with RTK module (used for mobile data collection).
Figure 3.
Visual illustration of the Real-Time Kinematic (RTK) GNSS technique, integrating the interaction between GNSS, base station (providing reference coordinates for correction), and a robot (drone or rover) with RTK module (used for mobile data collection).
Figure 4.
Visual demonstration of a drone photogrammetry workflow, showcasing a drone capturing images, satellites providing positioning data, a drone operator controlling the flight, and a Ground Control Point (GCP) for enhancing spatial accuracy. This method is widely used for stockpile volume estimation.
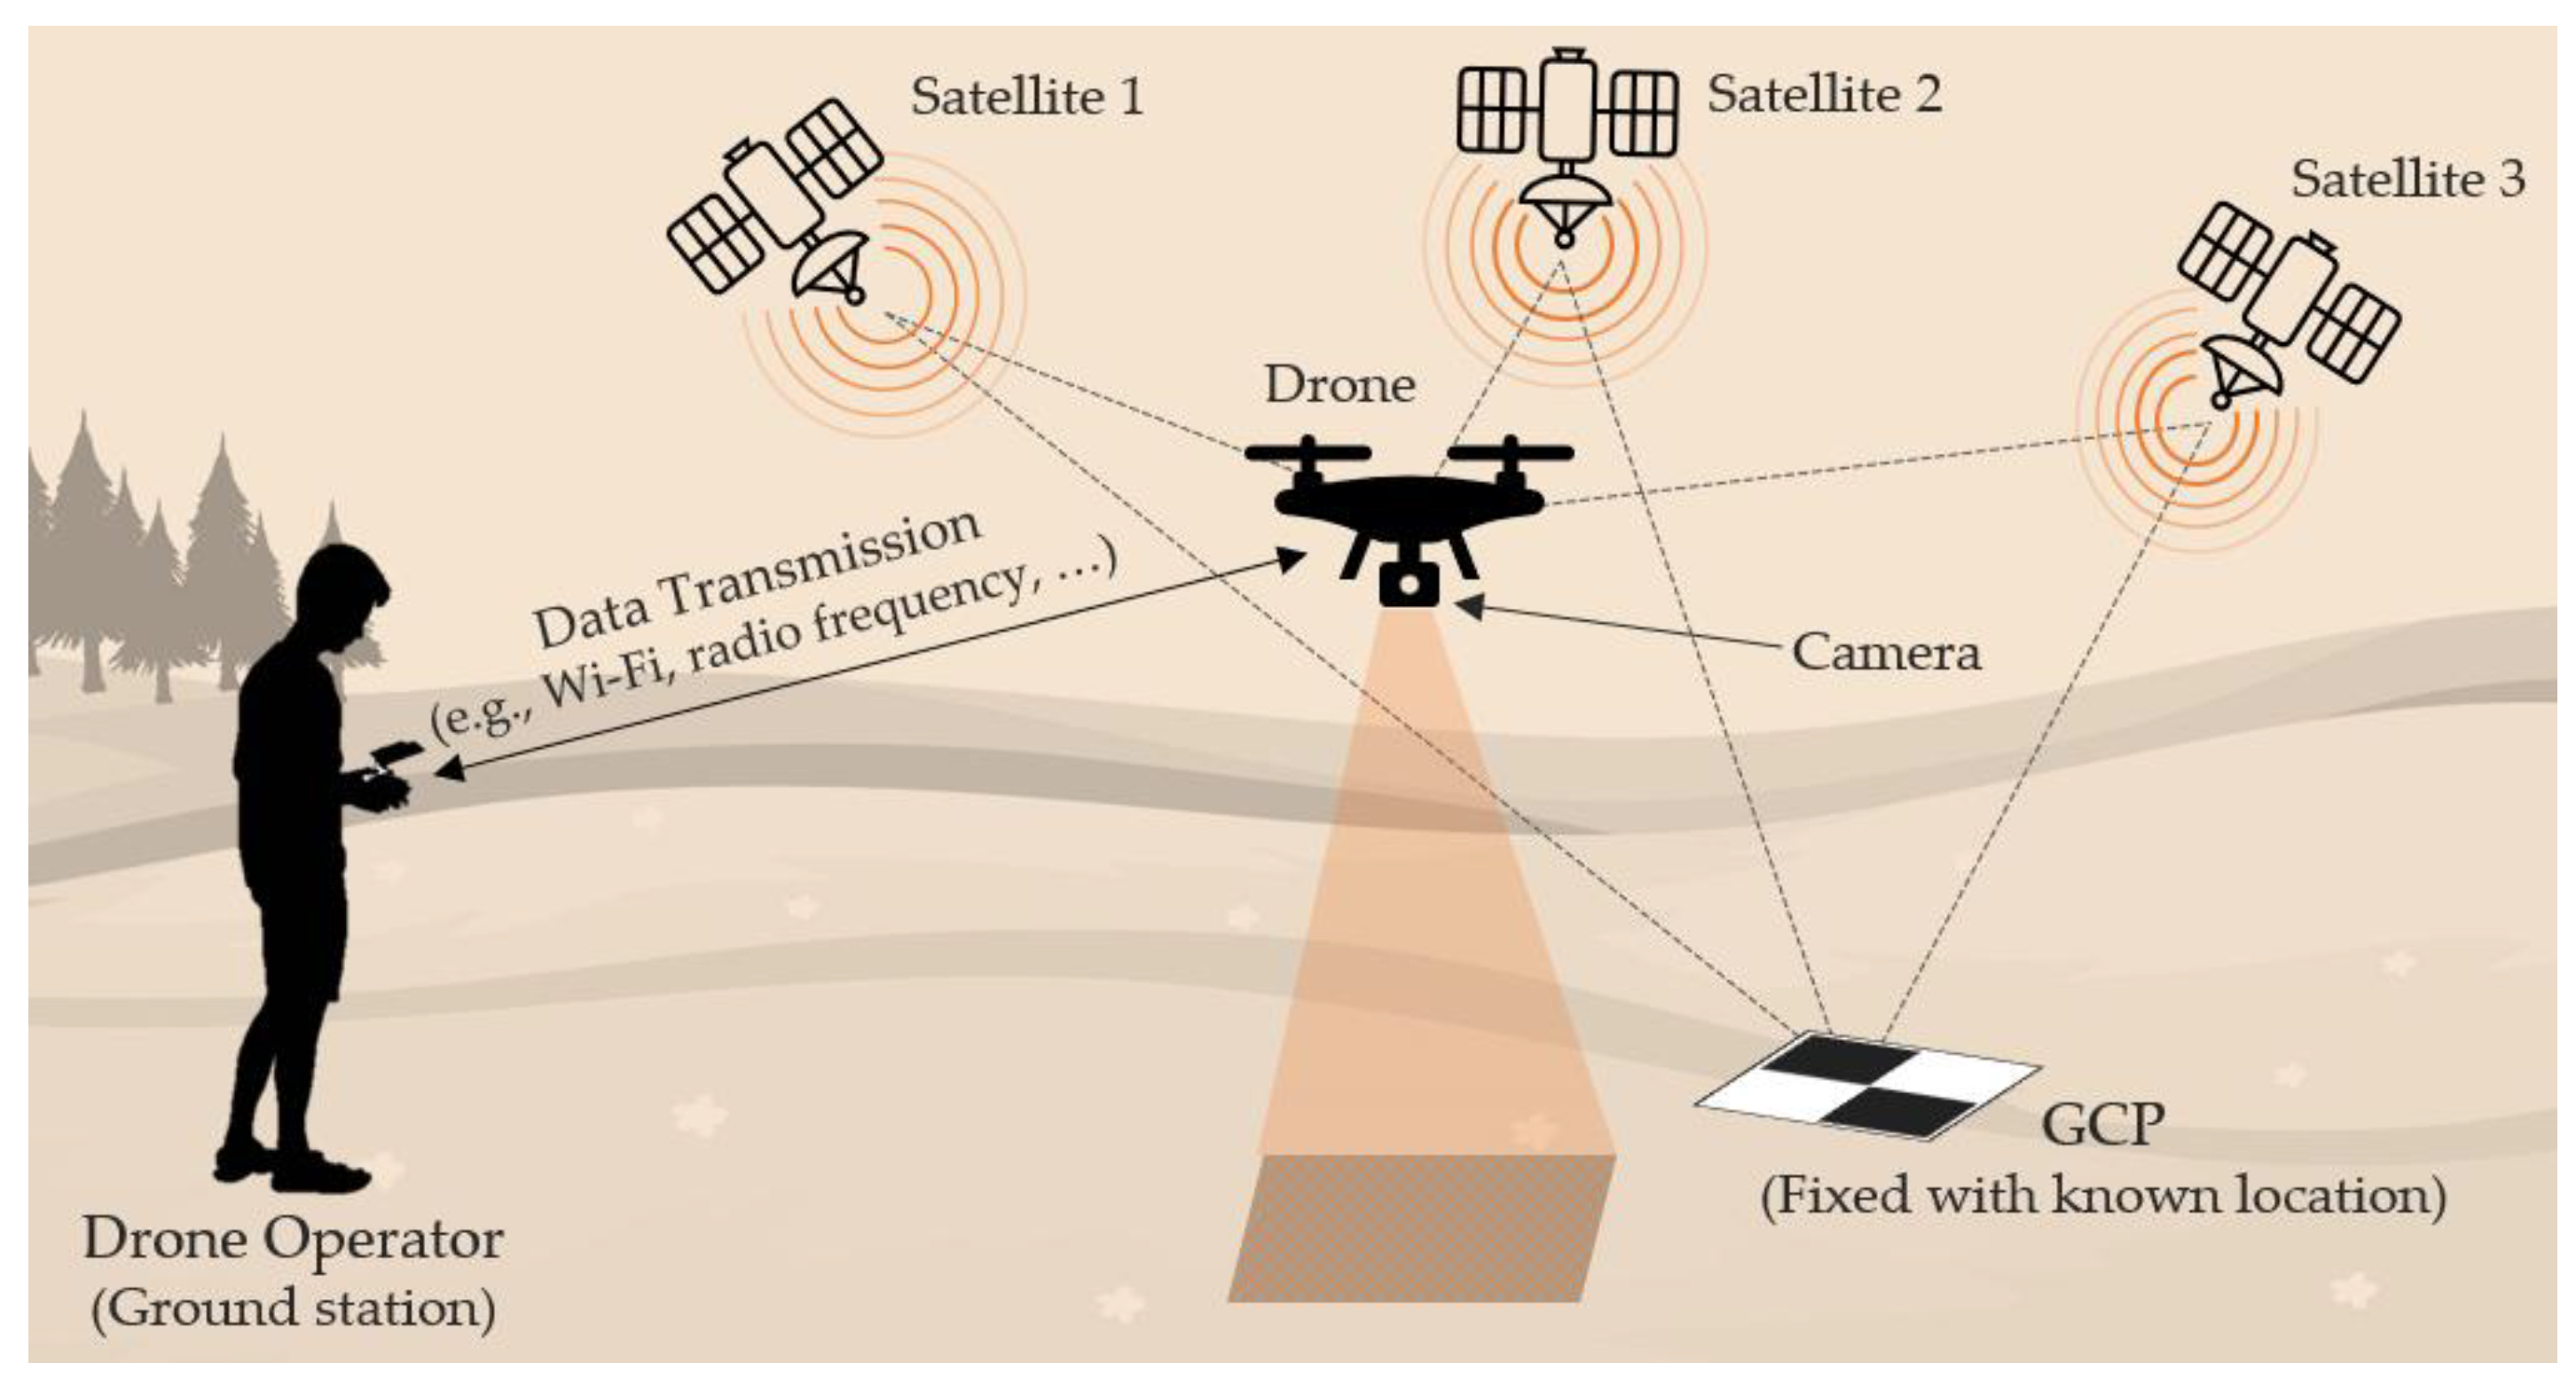
Figure 5.
Visual demonstration of Terrestrial Laser Scanning (TLS) in action, capturing precise 3D point cloud data of a stockpile for accurate volume estimation. The TLS system emits laser pulses to measure distances and create a detailed representation of the stockpile’s shape and dimensions. Colors in the pile represent a visual means to show change of elevation.
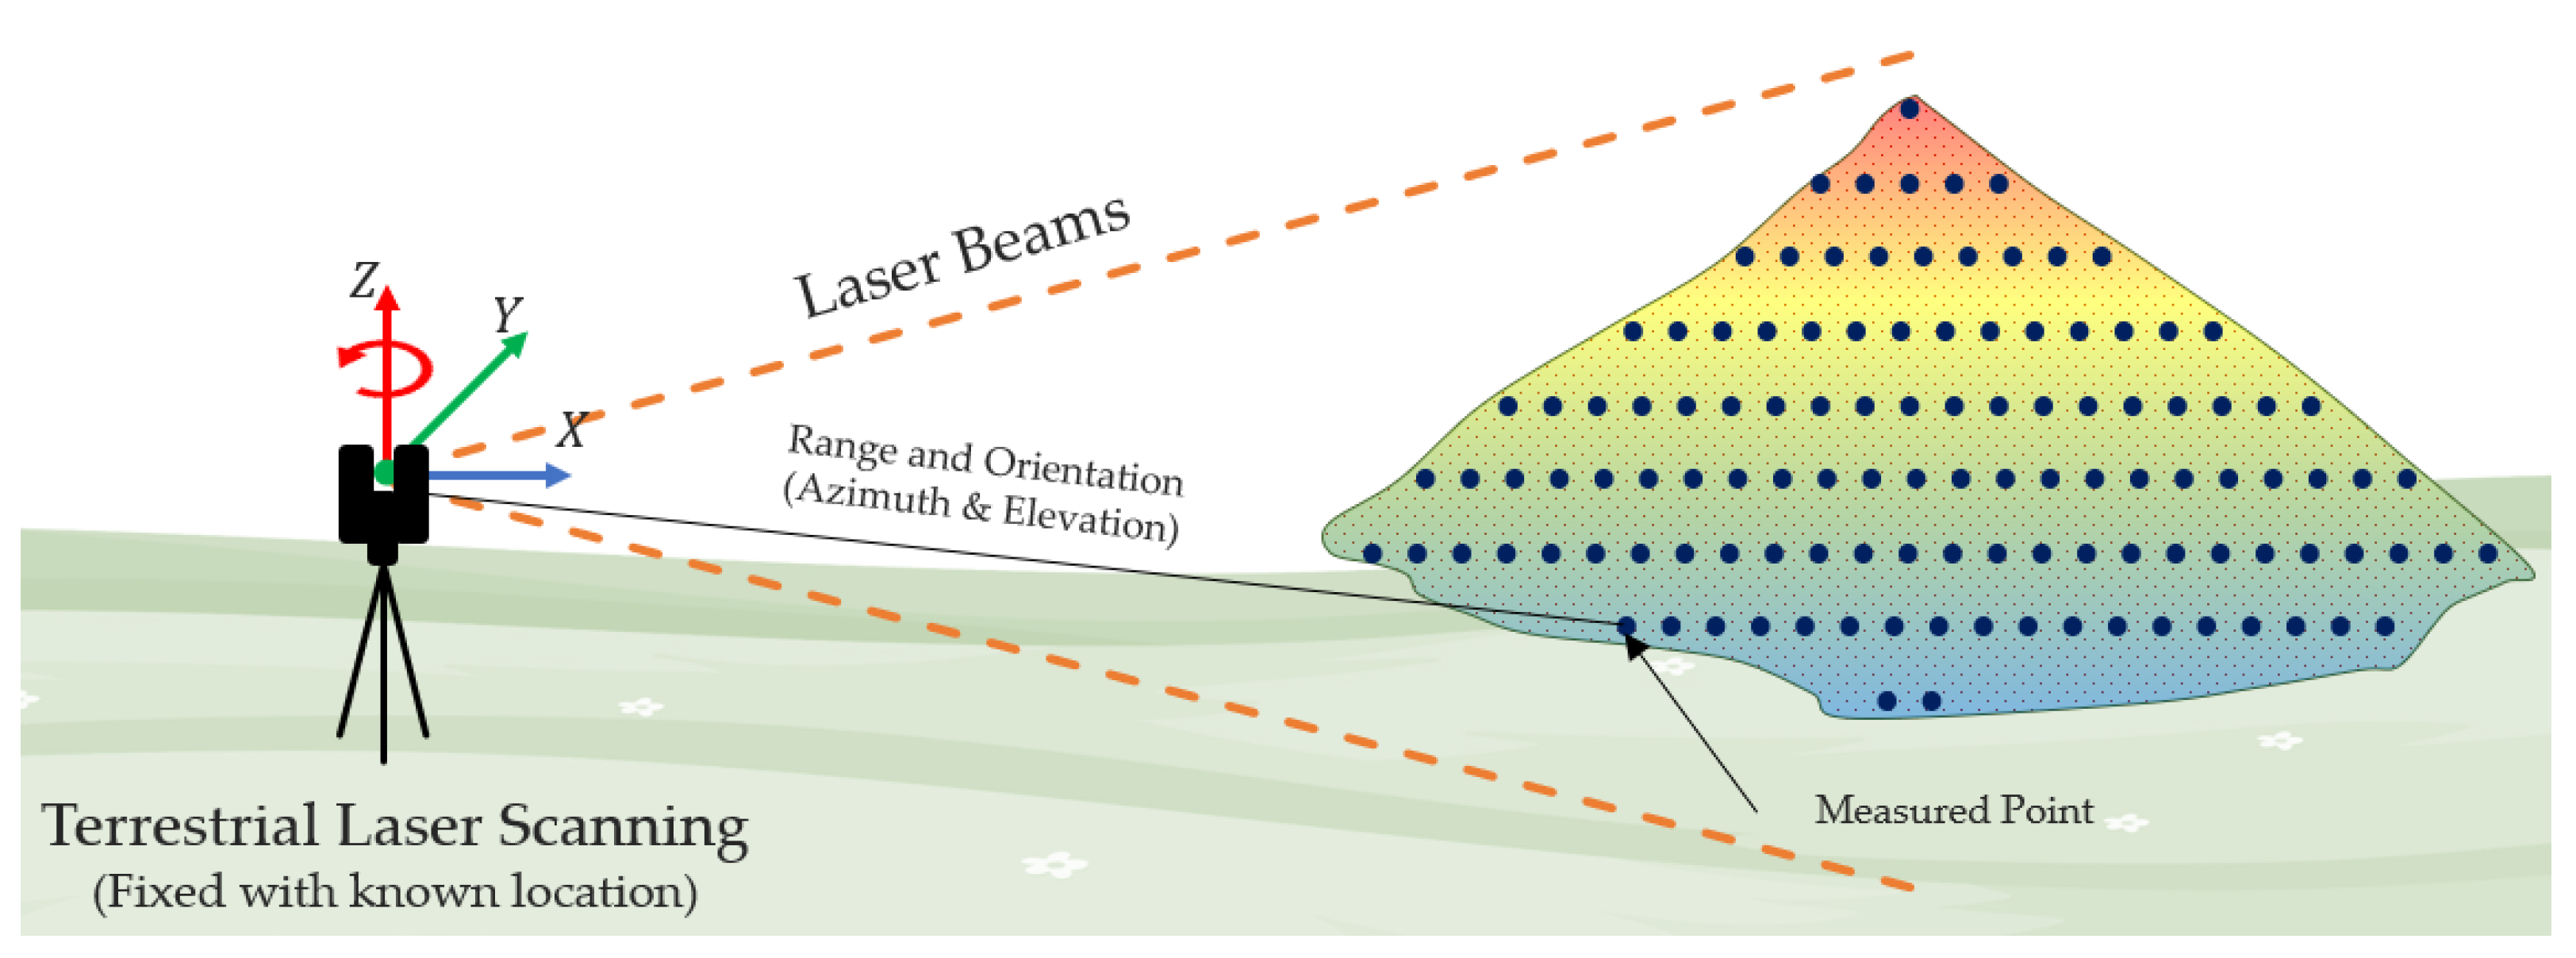
Figure 6.
A visual illustration of the various modes of usage of LiDAR sensors for stockpile monitoring and volume estimation, showcasing an airborne LiDAR system attached to an aerial platform, a rail-mounted LiDAR, a tripod-mounted LiDAR setup, and a portable handheld LiDAR sensor used by a surveyor. Colors in the pile represent a visual means to show change of elevation.
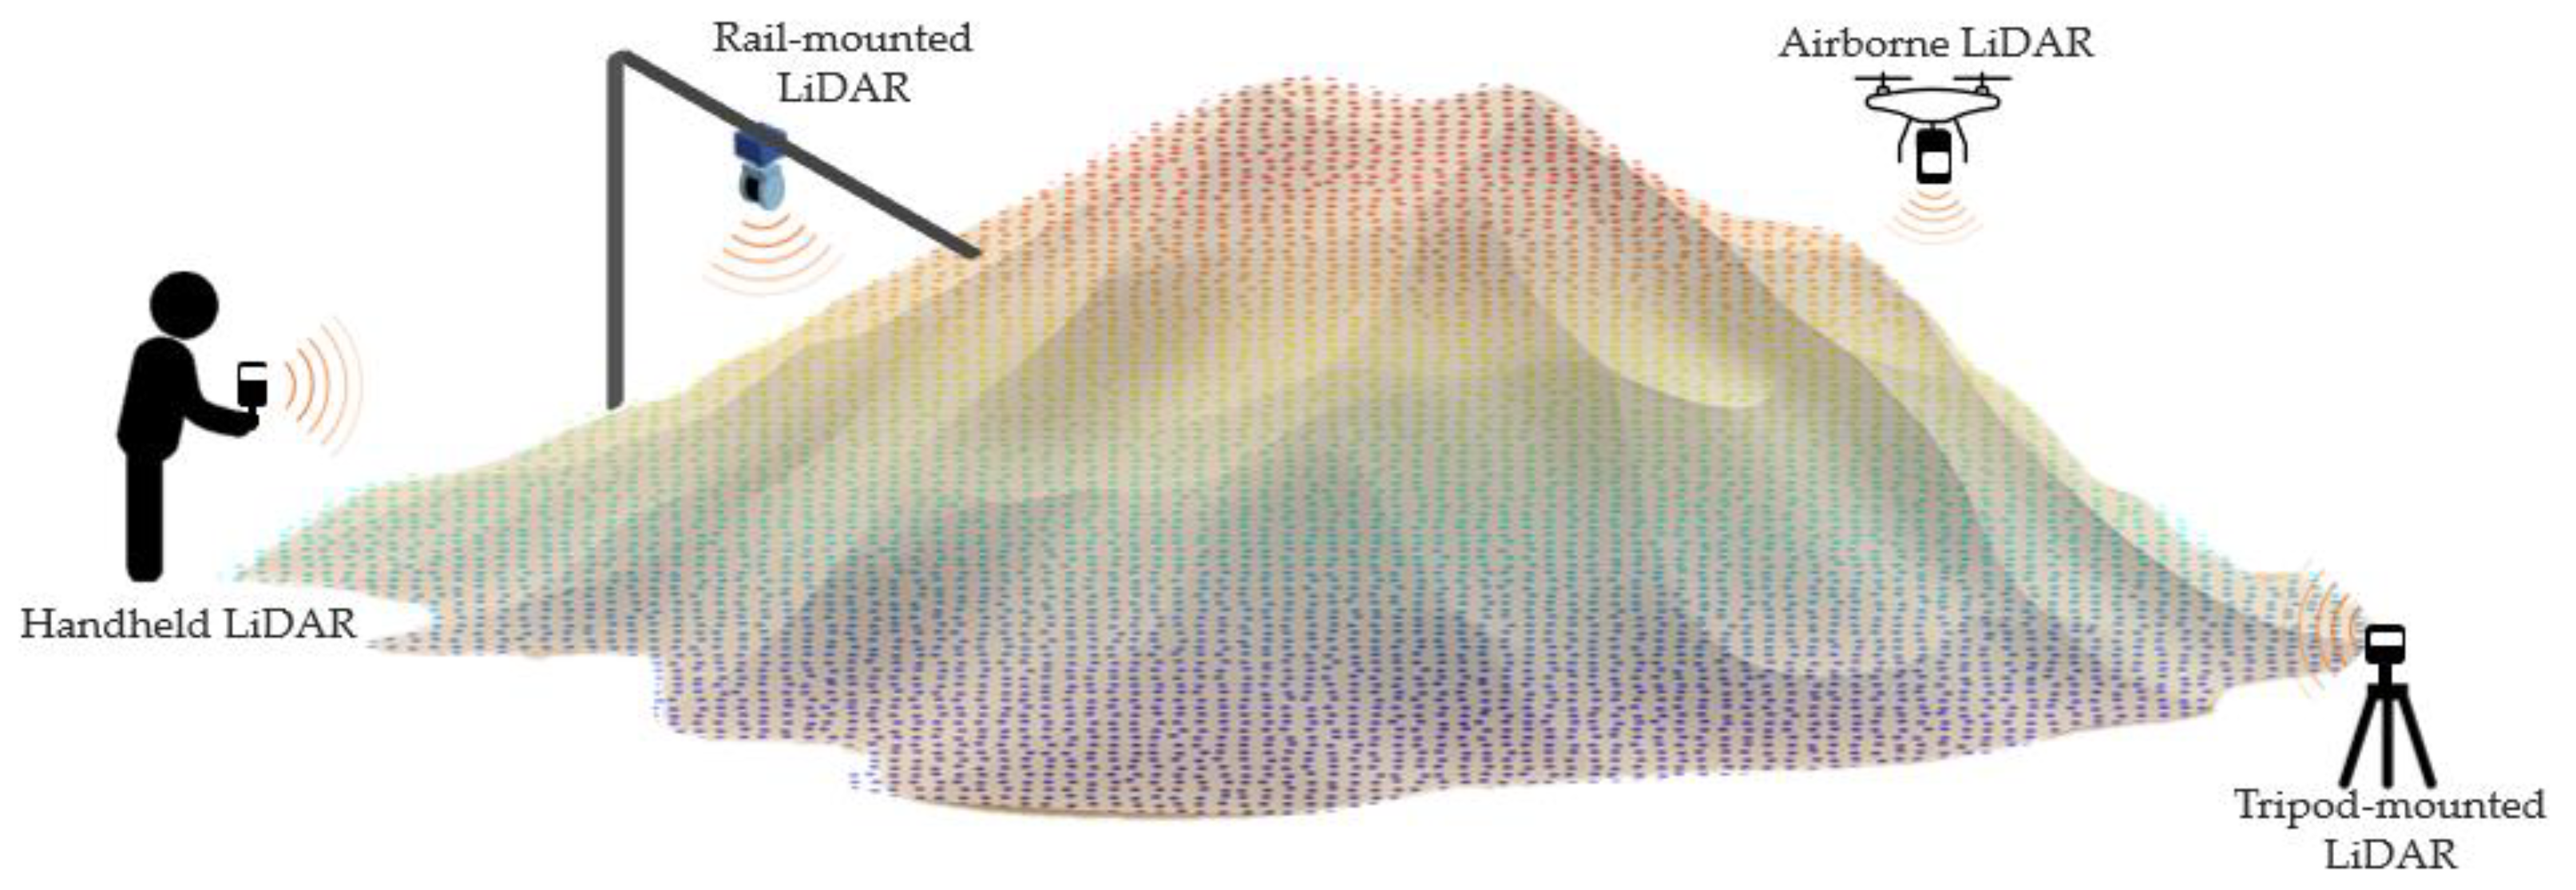
Figure 7.
Visual illustration of a drone following a trajectory path above a stockpile within an area of interest, while capturing 1D LiDAR data projected onto the stockpile for stockpile reconstruction and volume-estimation purposes.
Figure 7.
Visual illustration of a drone following a trajectory path above a stockpile within an area of interest, while capturing 1D LiDAR data projected onto the stockpile for stockpile reconstruction and volume-estimation purposes.
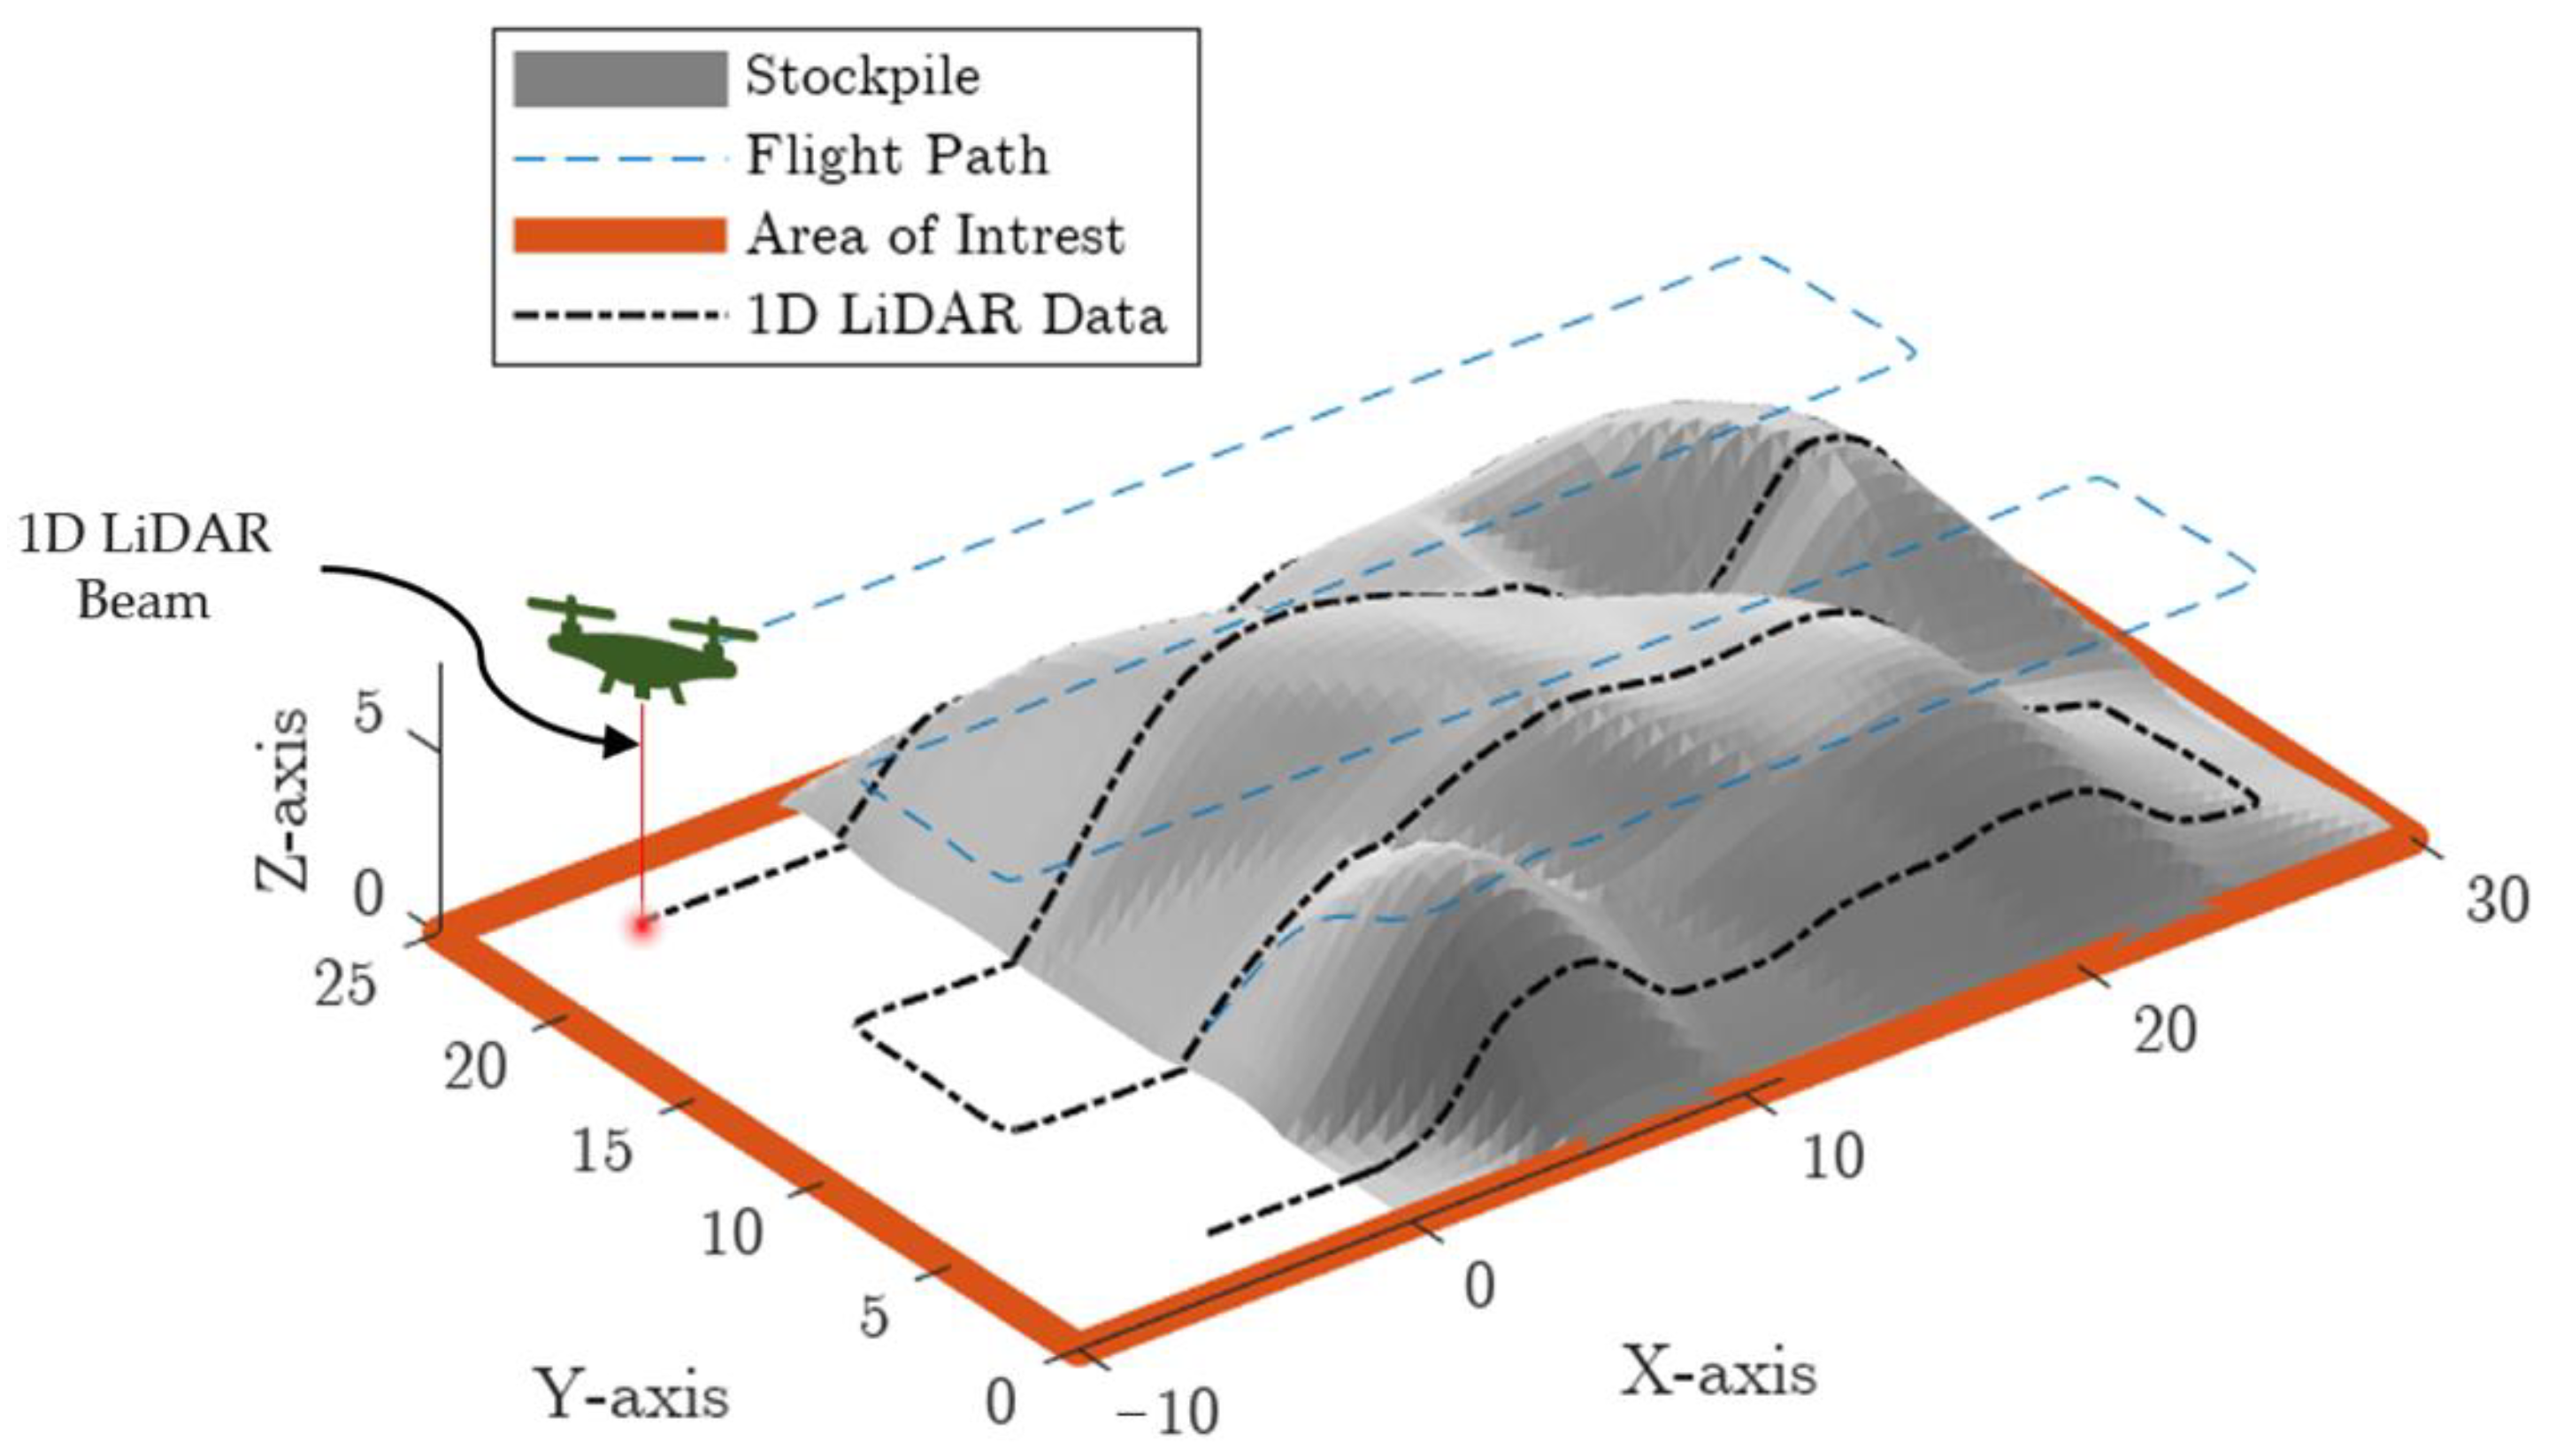
Figure 8.
Illustration of intricate and irregularly shaped stockpiles within warehouses and sheds, featuring narrow clearances and obstructions between the storage ceiling and the stockpile peaks. These challenges can pose difficulties for drone applications in such environments. Furthermore, additional complications may arise in situations where the surroundings are completely dark and dusty.
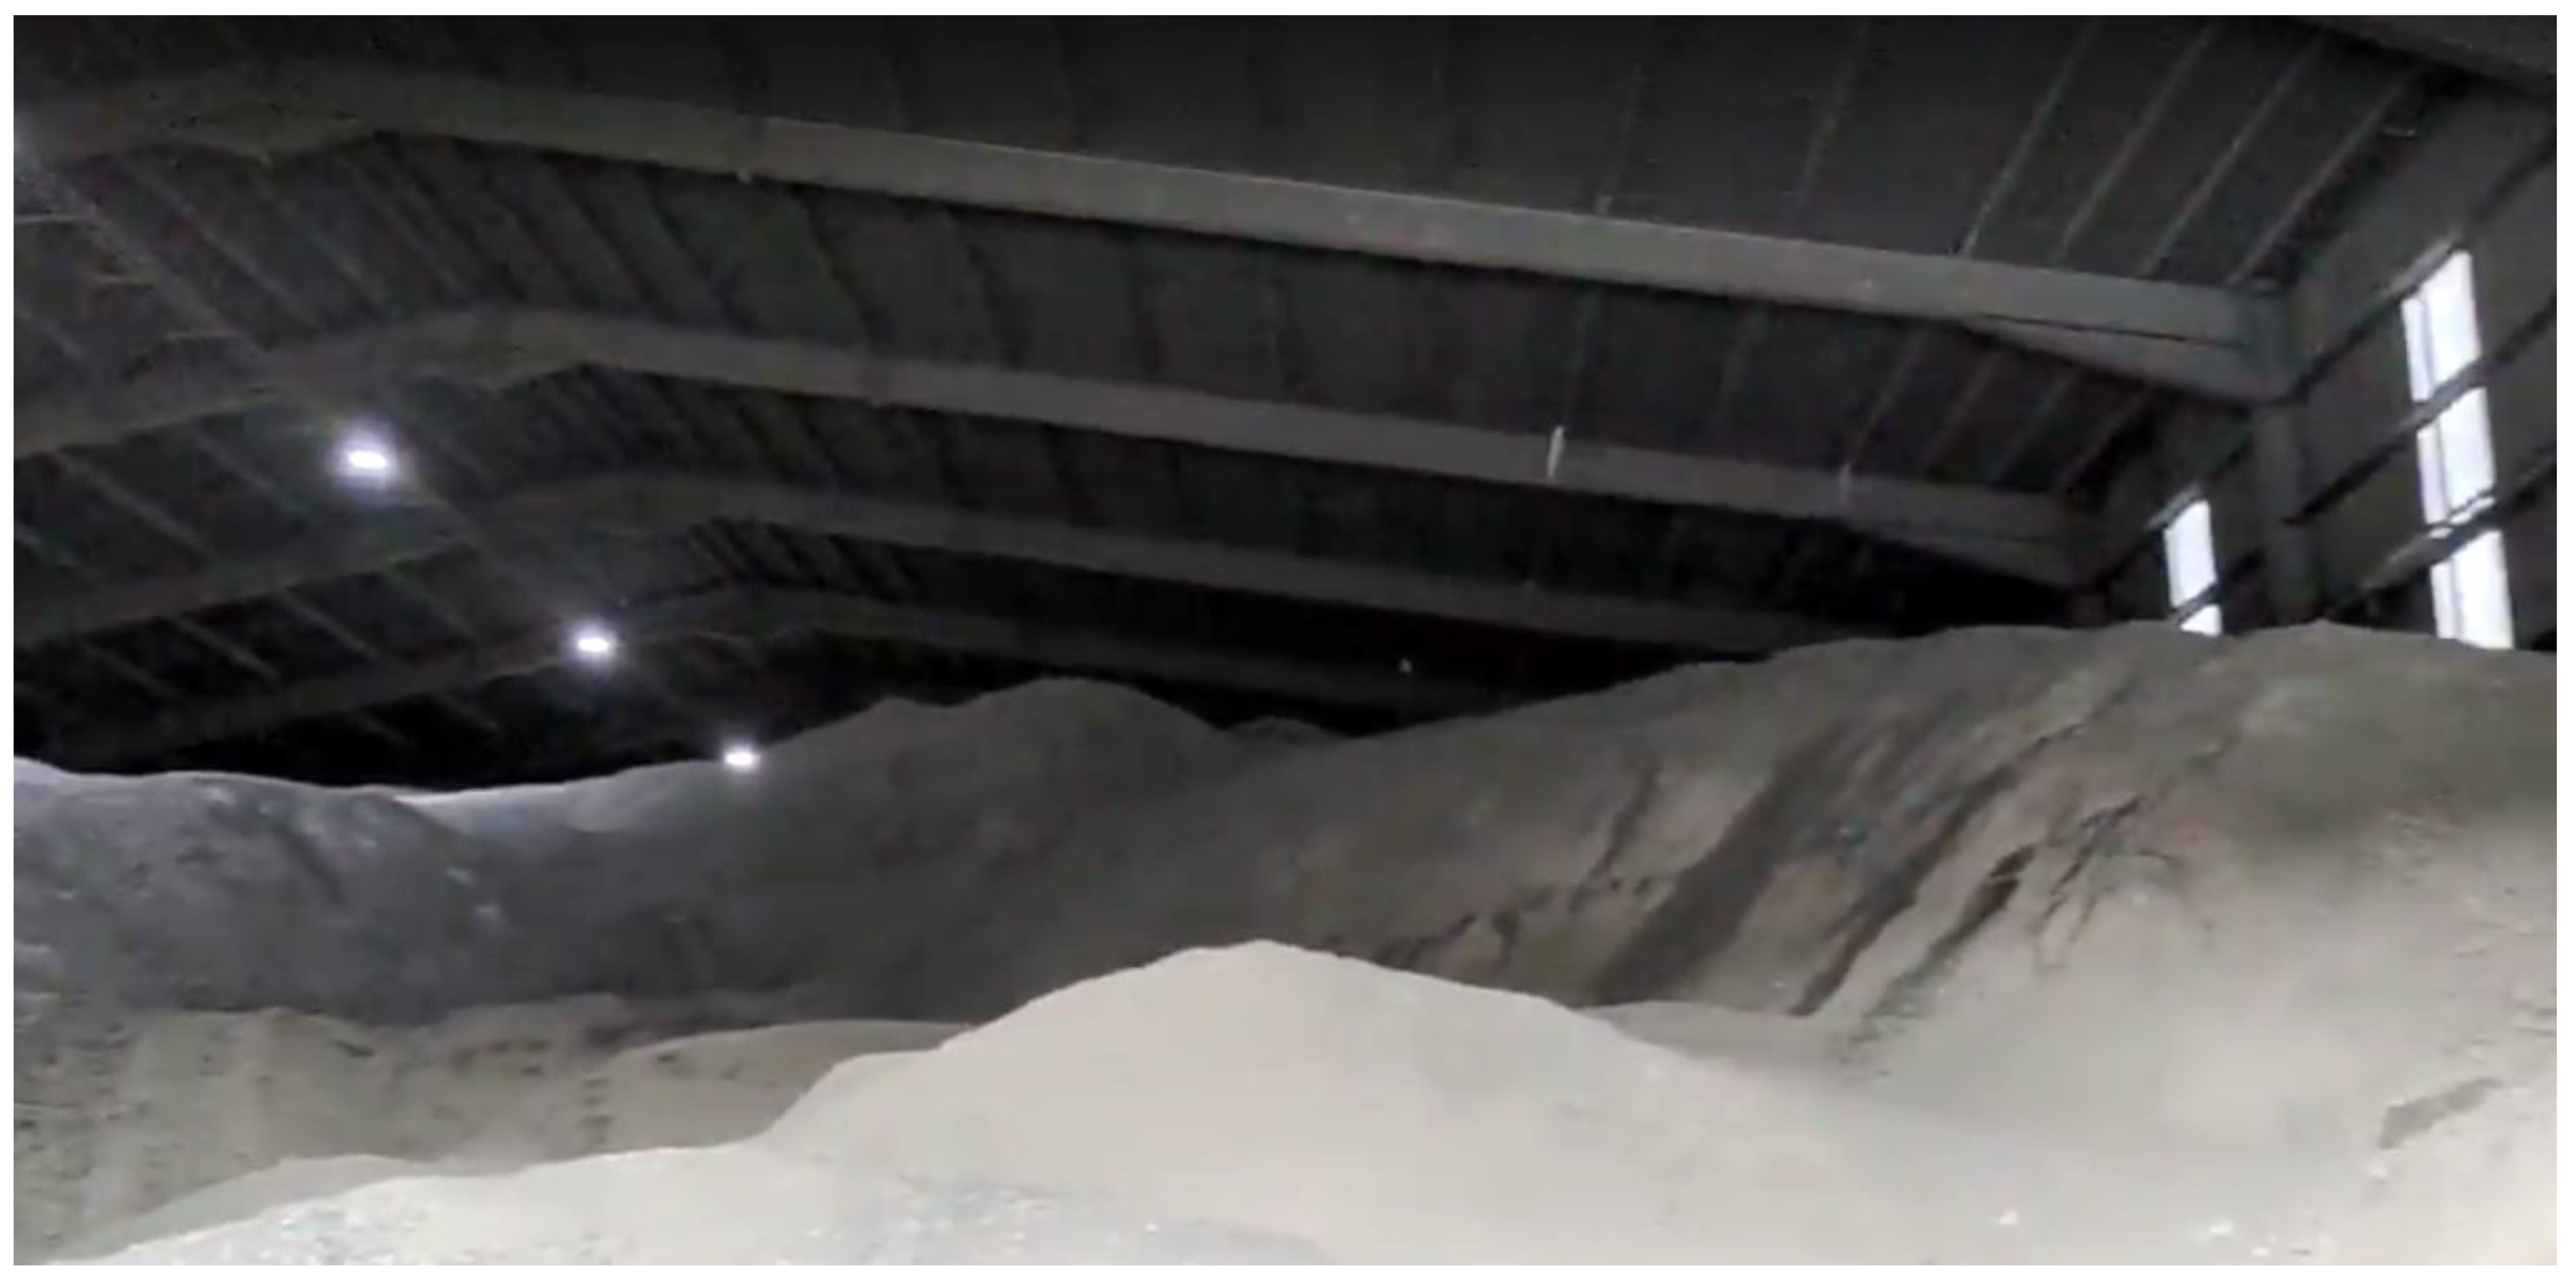
Figure 9.
A versatile spinning 3D LiDAR system with an integrated motor, similar to Hovermap and GeoSLAM devices, designed for compatibility with handheld, vehicle-mounted, drone-mounted, and tripod-mounted setups. Equipping a 3D LiDAR with an integrated motor considerably enhances its capabilities and expands its field of view. For instance, if a LiDAR has a 270-degree horizontal field of view (FOV) and a 30-degree vertical FOV, spinning the LiDAR around its horizontal axis (y-axis in the figure) significantly increases the FOV to 270 degrees in both the horizontal and vertical directions. This adaptability allows for more comprehensive coverage.
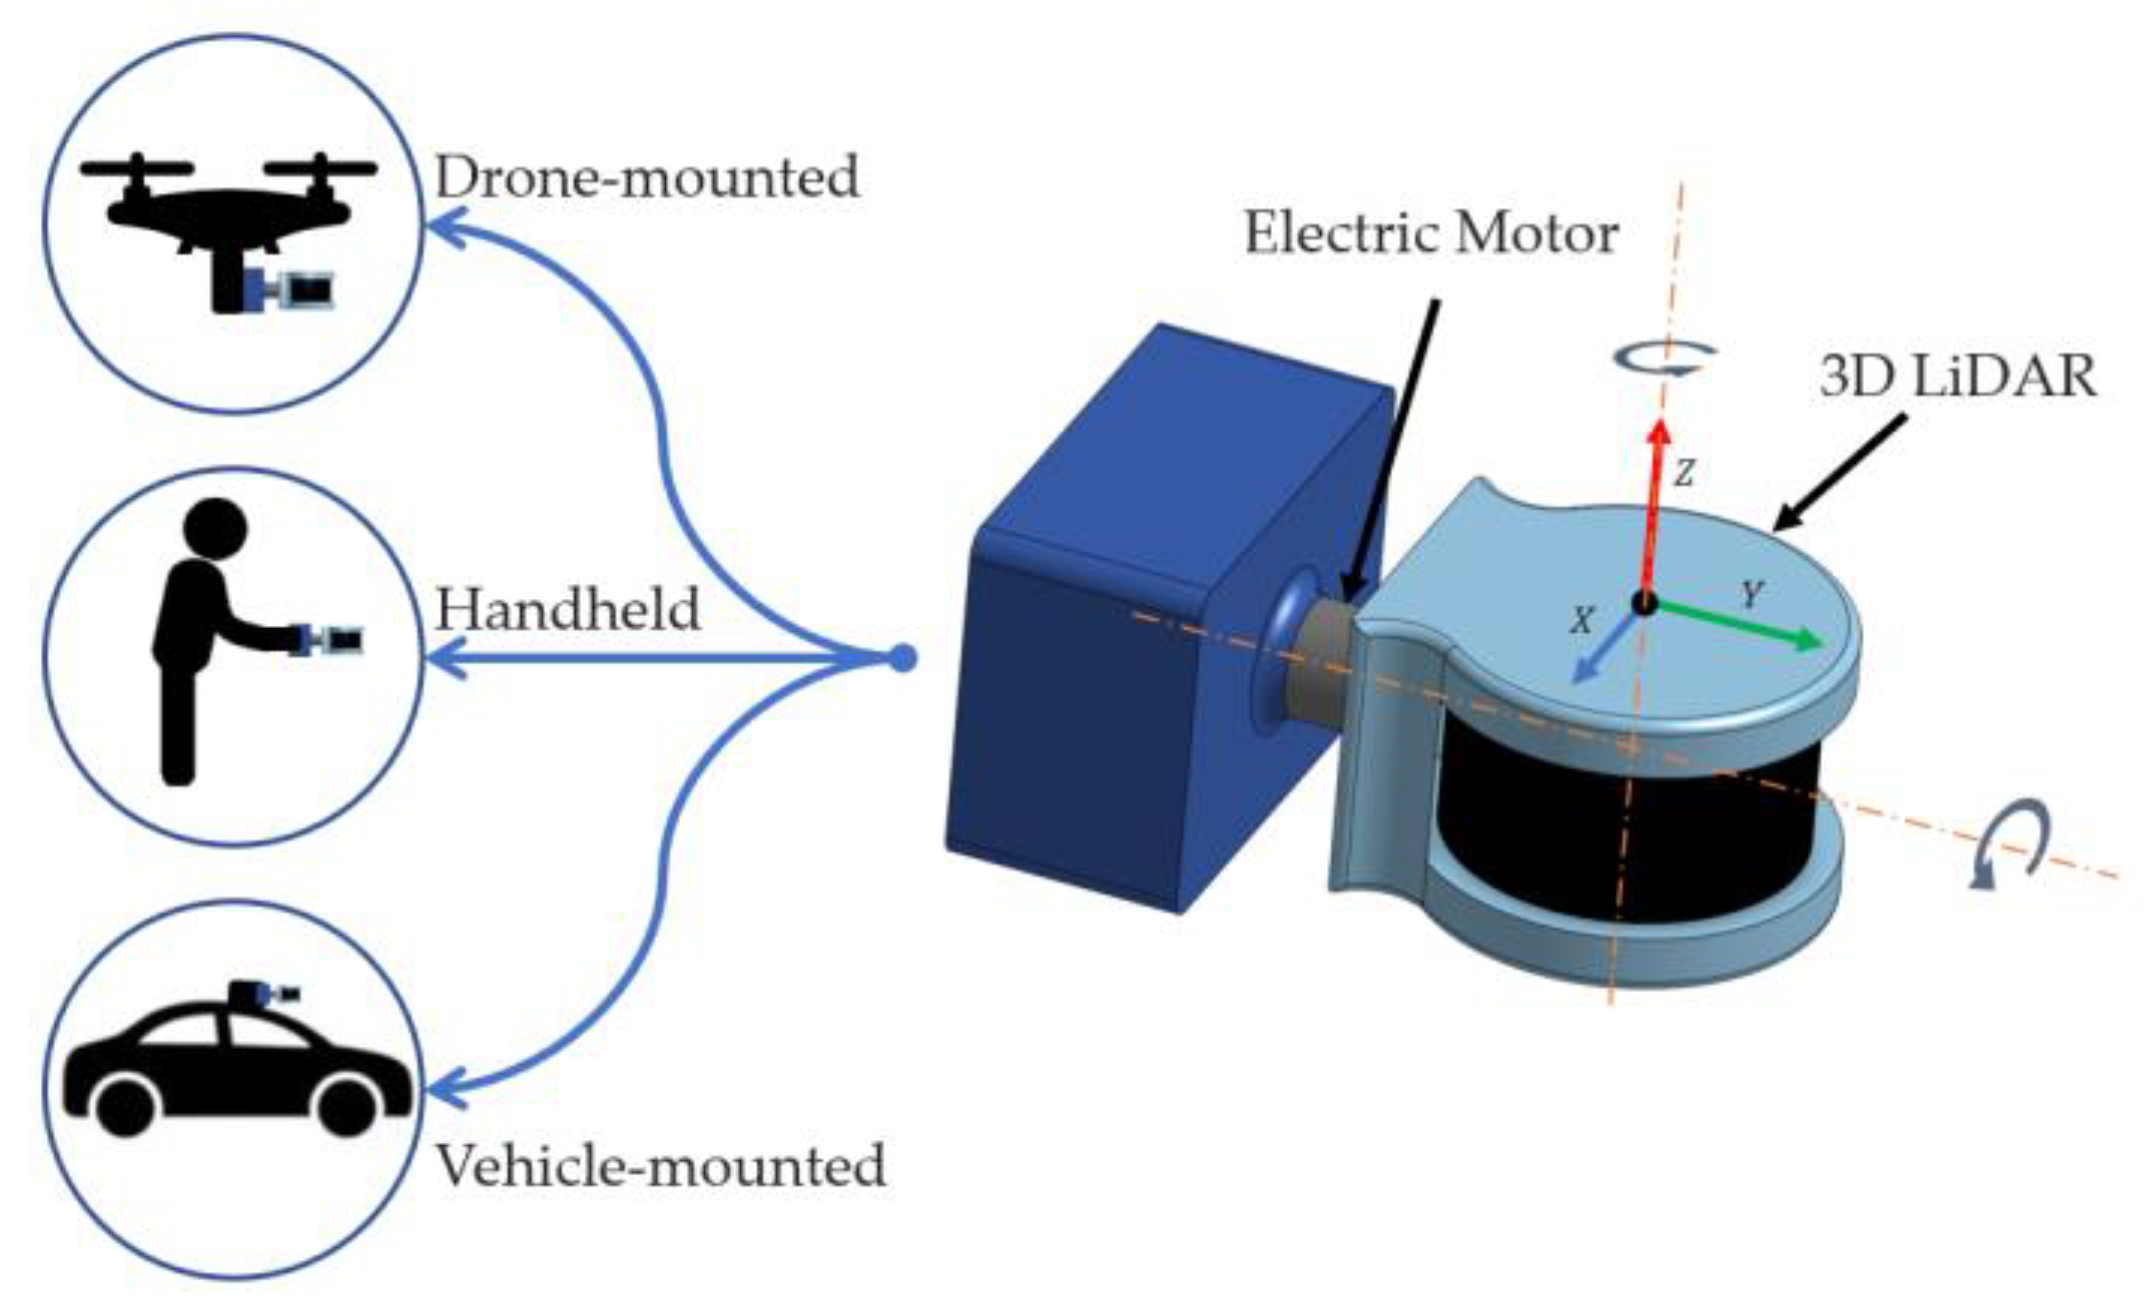
Figure 10.
Visual illustration of a scanning payload, such as single or multiple LiDAR sensor, mounted on a rail system above a stockpile in a warehouse, acquiring data for volume estimation and monitoring. The rail platform enables the LiDAR sensors to traverse along the x-axis, ensuring acceptable indoor coverage of the stockpile area. This approach facilitates efficient and accurate volume assessment in confined spaces, minimizing safety risks and streamlining the monitoring process.
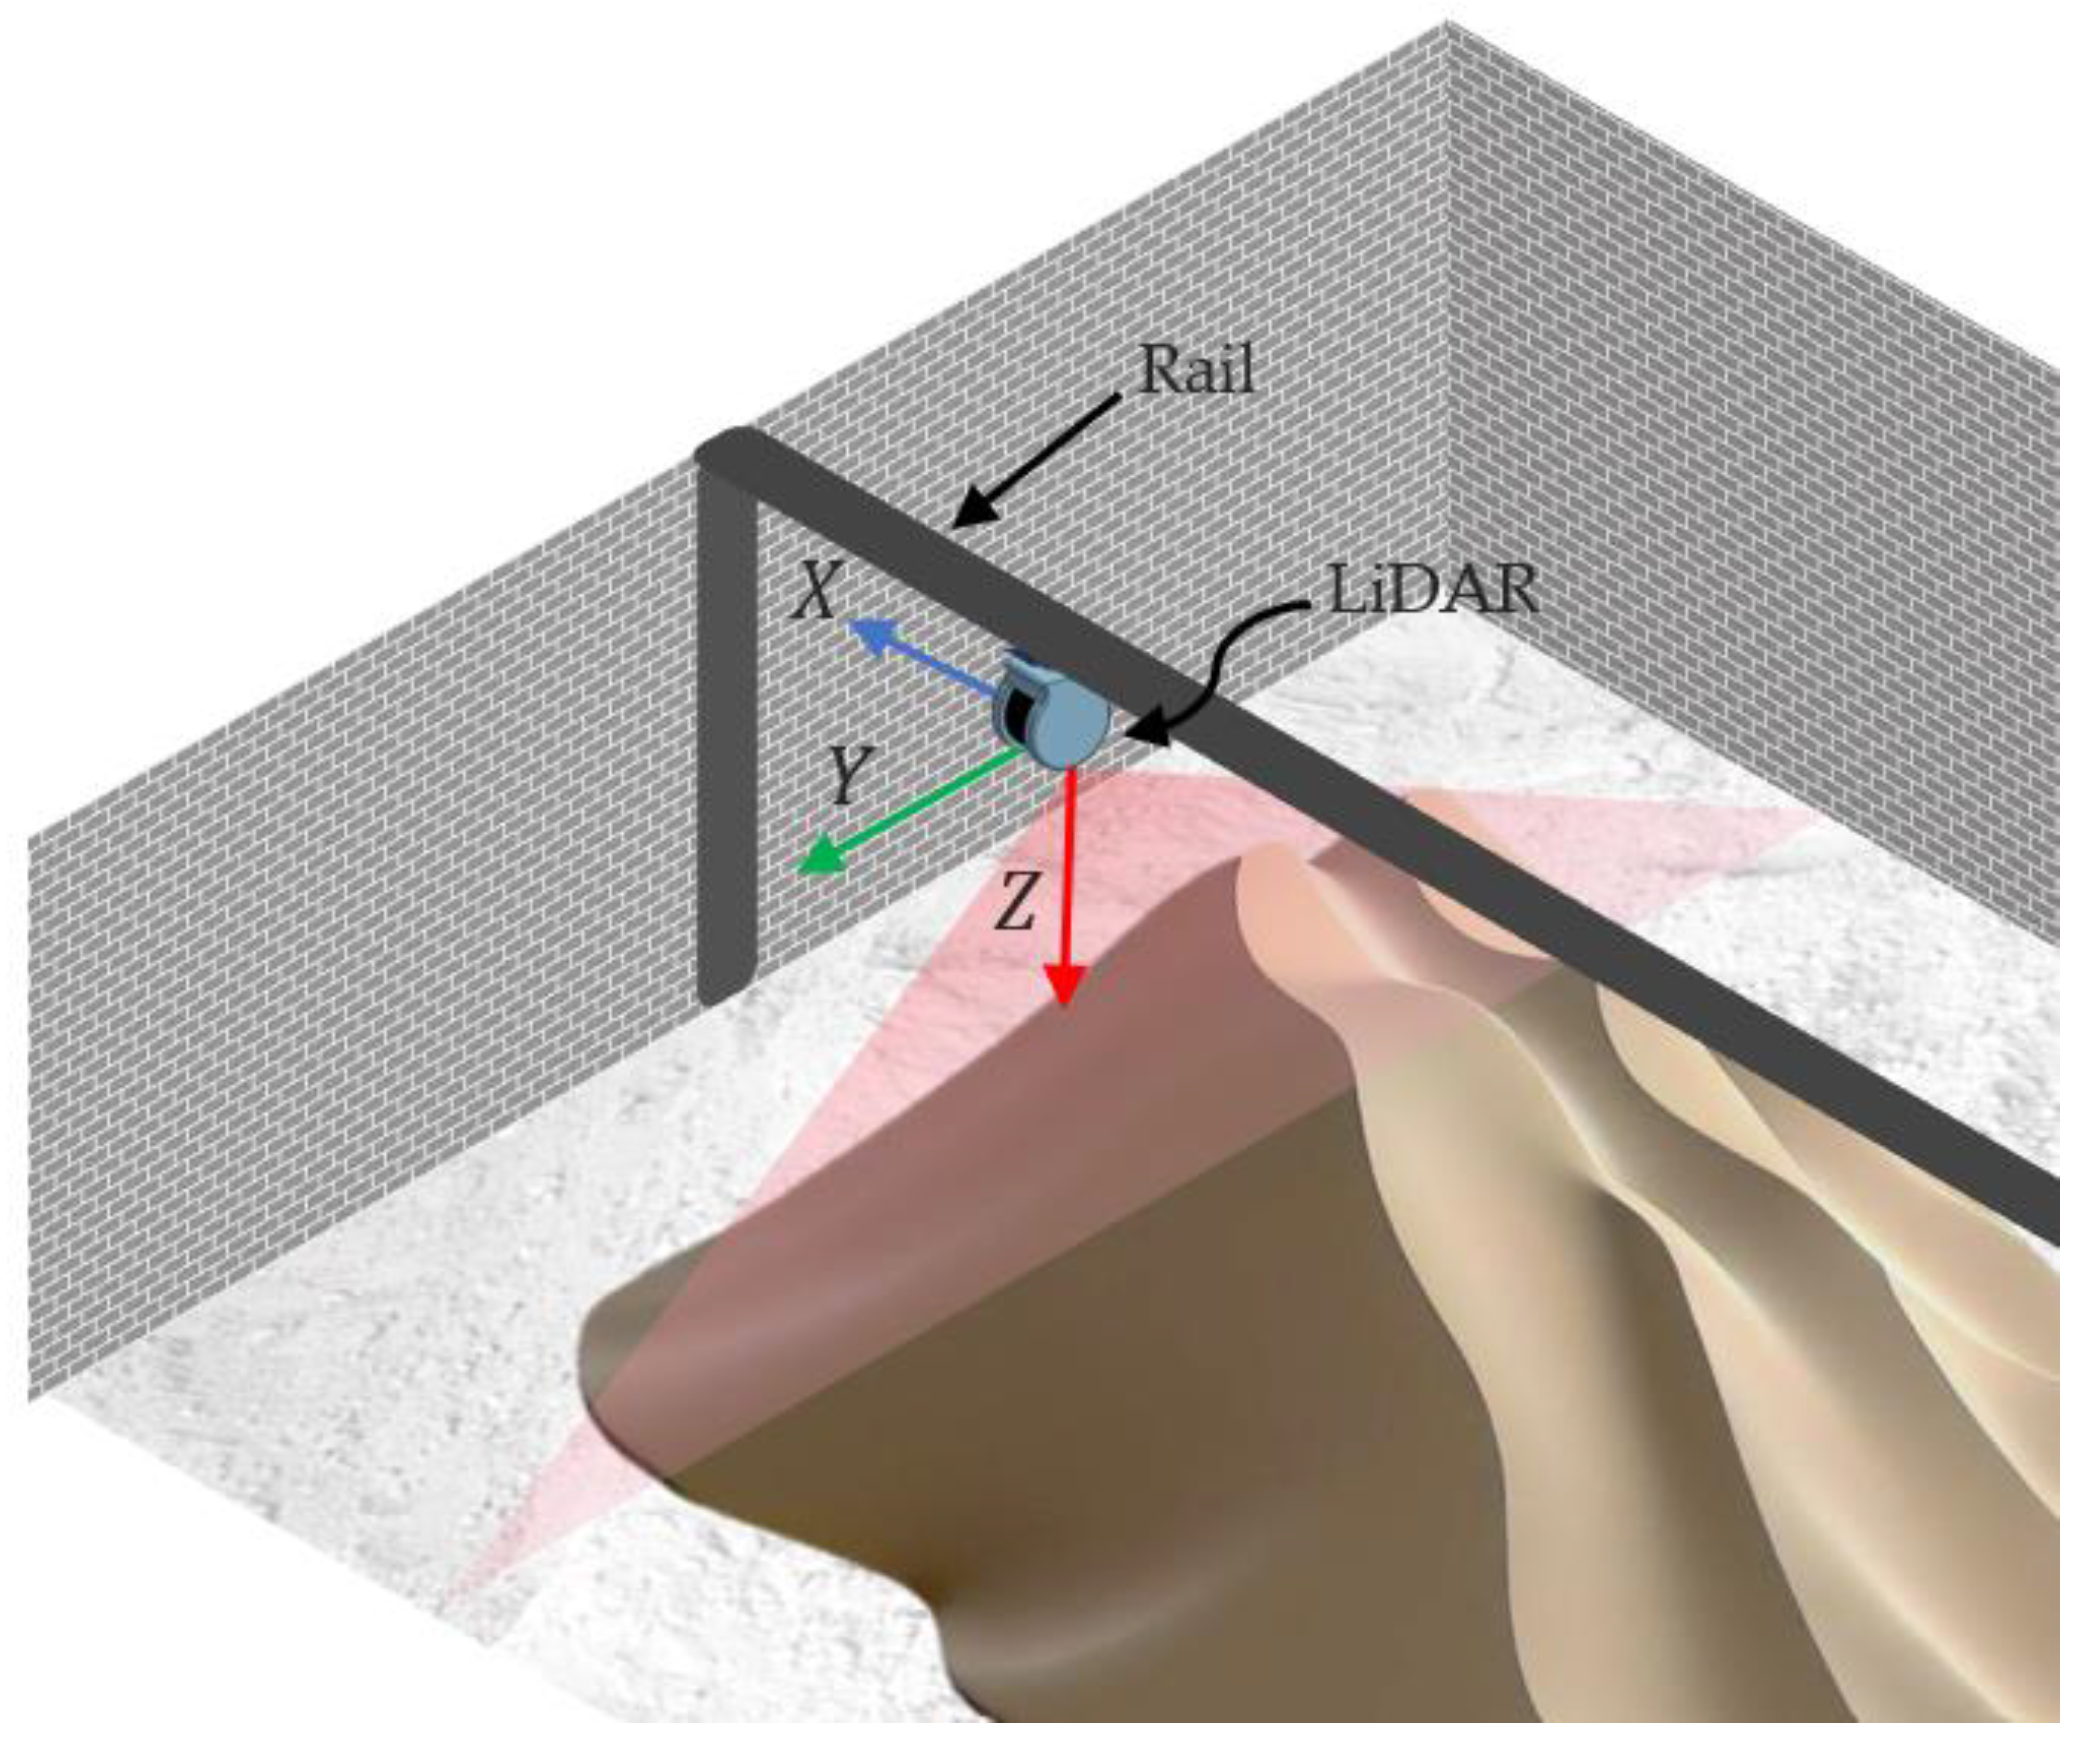
Figure 11.
A visual illustrative comparison of the Digital Surface Model (DSM) generated for a complex-shaped stockpile using different data-acquisition methods: (a) GNSS, (b) terrestrial LiDAR (or TLS), (c) drone photogrammetry, and (d) airborne LiDAR. This illustration highlights the varying levels of coverage obtained from each technique.
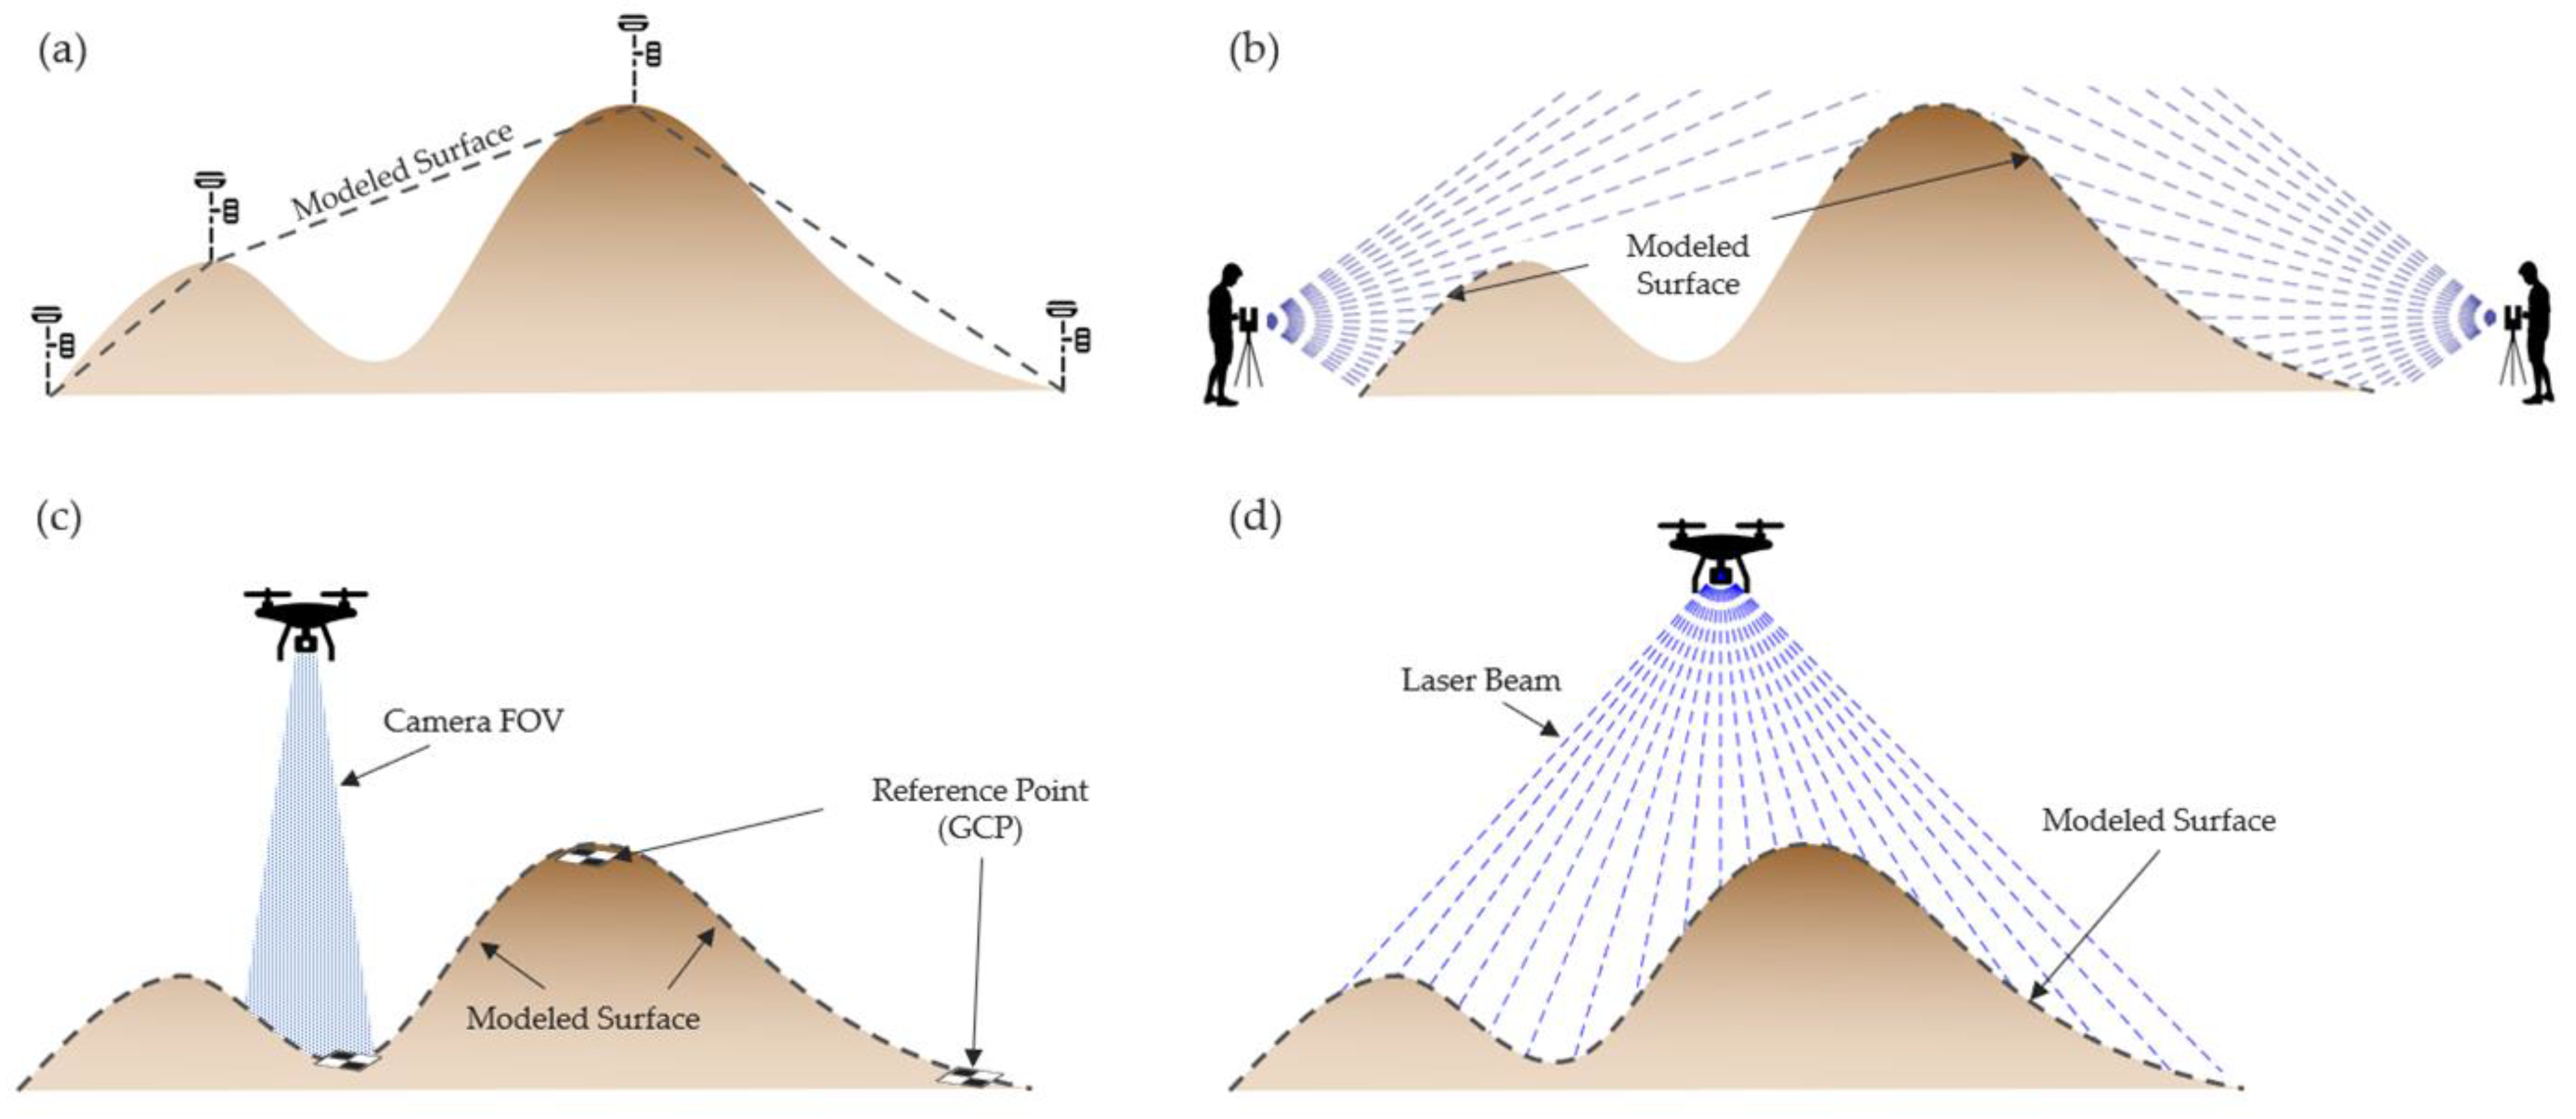
Figure 12.
A visual comparison between a conventional rotary scanning LiDAR (2D/3D LiDAR) and solid-state LiDAR (flash LiDAR), illustrating the distinct emission patterns with multiple smaller laser points from the scanning LiDAR and a single, large laser spot from the flash LiDAR.
Figure 12.
A visual comparison between a conventional rotary scanning LiDAR (2D/3D LiDAR) and solid-state LiDAR (flash LiDAR), illustrating the distinct emission patterns with multiple smaller laser points from the scanning LiDAR and a single, large laser spot from the flash LiDAR.
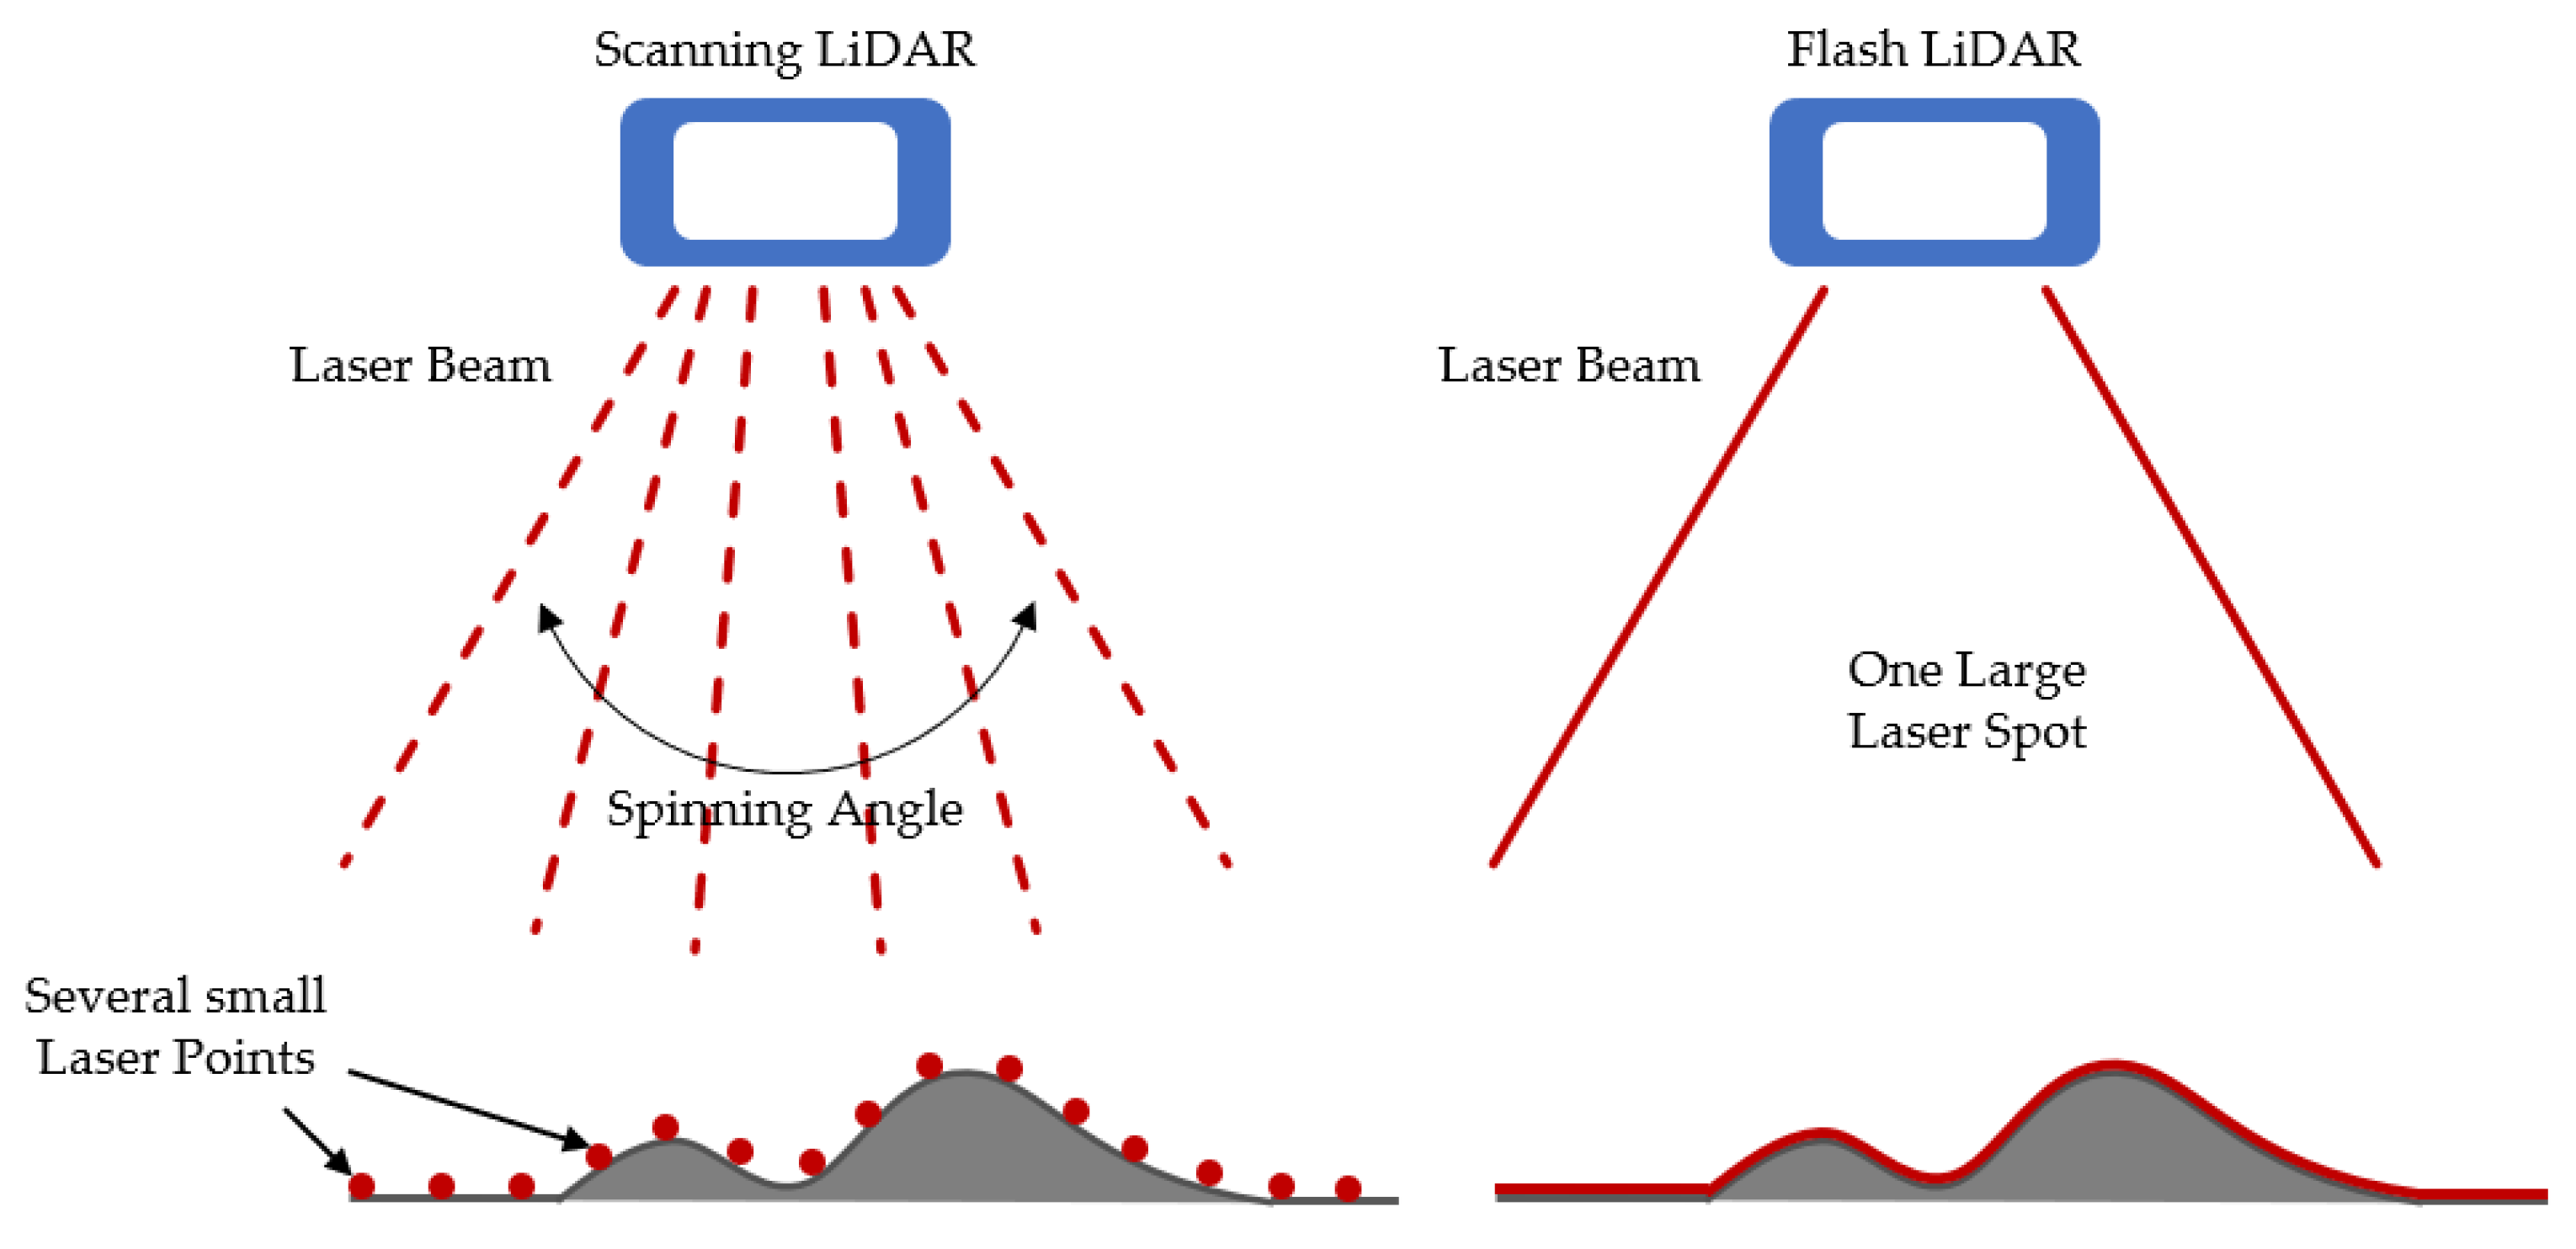
Figure 13.
A visual illustration of a setup, featuring a drone equipped with an advanced sensor system and multiple beacons for precise indoor positioning, enhancing the drone’s ability to accurately estimate and monitor stockpile volumes within confined spaces. The integration of this technology showcases the potential of drone-based solutions for indoor stockpile management.
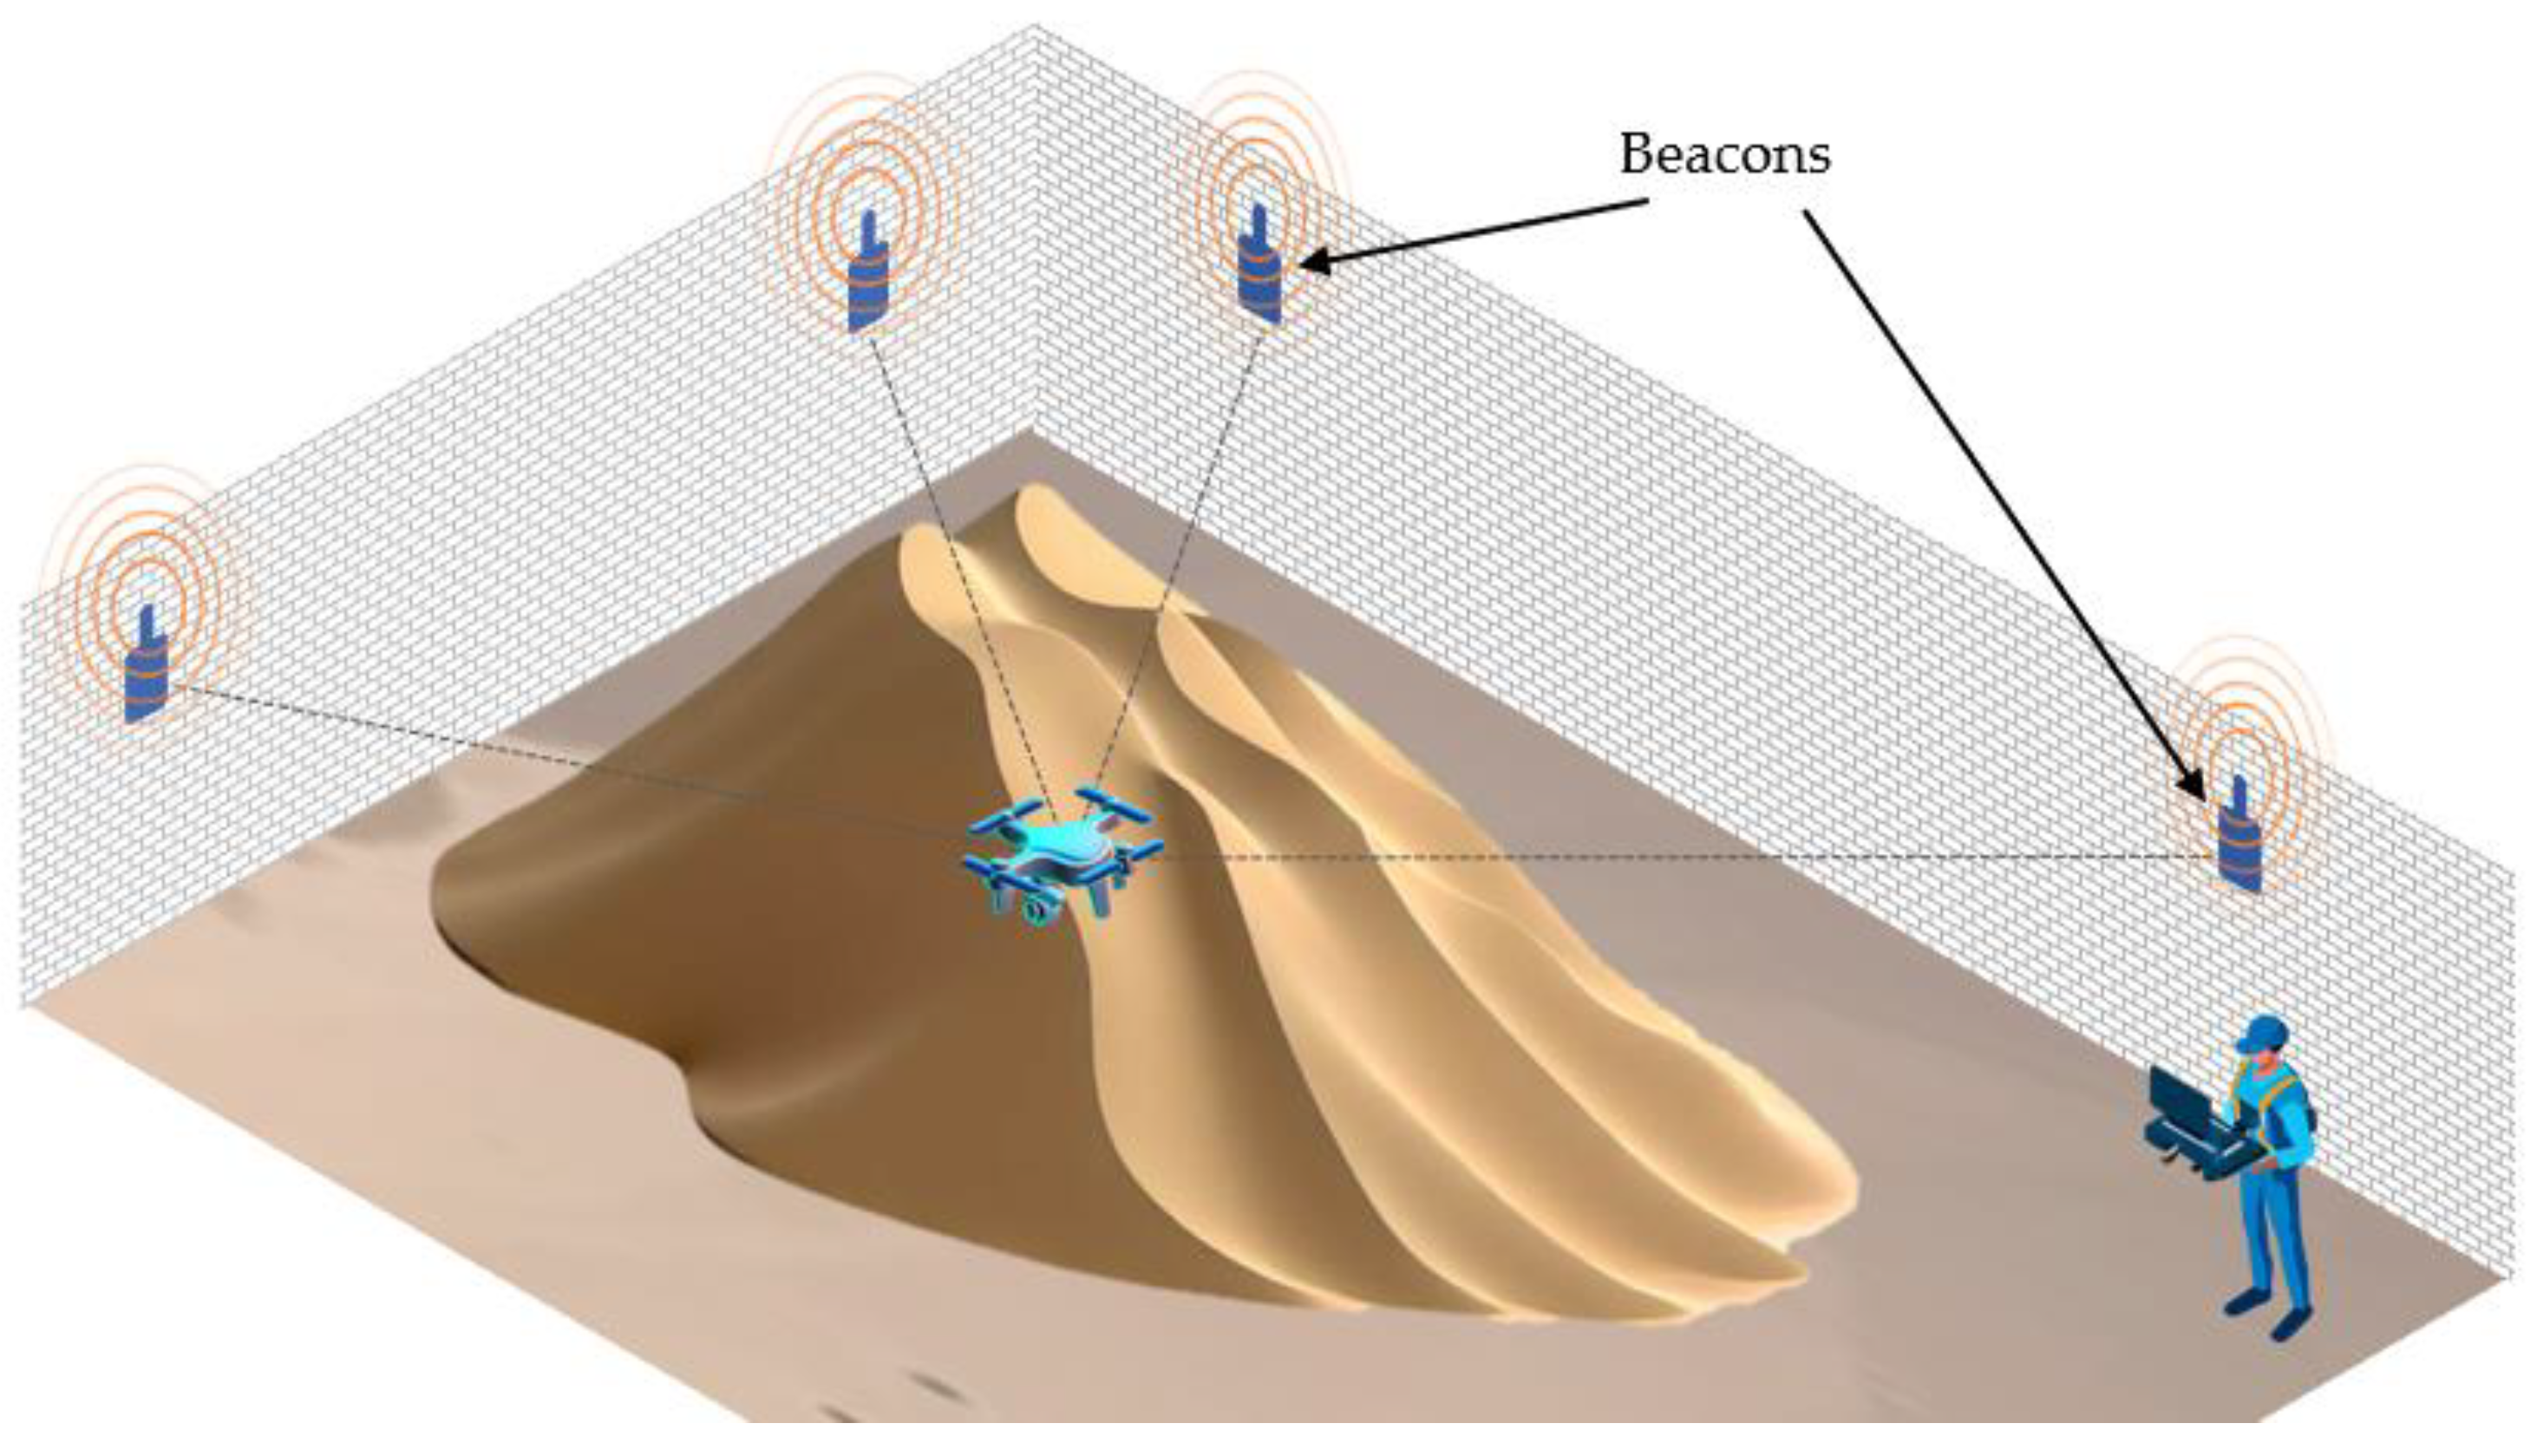
Table 2.
Summary of research articles that adopted LiDAR-based scanning for outdoor stockpile volume estimation.
Table 2.
Summary of research articles that adopted LiDAR-based scanning for outdoor stockpile volume estimation.
| Application | Surveyed Area [m2] | Country | Platform | Scanning Payload | Reference Volume [m3] | Volumetric Error [%] | Ground Truth | Reference |
|---|---|---|---|---|---|---|---|---|
| Quarrying site | 12,300 | Sweden | Drone (Matrice 600 Pro) | 3D LiDAR (Velodyne Ultra Puck) | 366.75 | 0.7 | TLS | [78] |
| Coal stockpiles | 200,000 | Brazil | Drone (DJI Matrice 100) | 3D LiDAR (SICK LD-MRS420201) | - | - | - | [79] |
| Coal stockpiles | 1400 | UK | Custom quadcopter | 1D LiDAR (Benewake TFmini) | - | - | - | [1] |
| Gypsum pile | 62.5 | 3 | 2.4 | Truck load | ||||
| Coal piles | - | China | Handheld | 2D LiDAR (SICK LD-MRS400001) | 3000–30,000 | <0.8 | - | [80,81] |
| Several stockpiles on barges | 728 | China | Handheld | 3D LiDAR (Velodyne HDL-32E) | 9437 | 1.6 | Manual measurement | [71] |
| Soil stockpile | 35 | Finland | Excavator | Solid-state 2D profilometer/LiDAR | 9.4 | 1.5–5.5 | Buckets count | [82] |
| Chickpea pile | 0.07 | Turkey | Rail | 2D LiDAR (Hokuyo URG-04LX-UG01) | 0.00375 | 0.5 | Known weight | [83] |
| Stacked boxes | - | China | Rail | 3D LiDAR (SICK LMS511-10100 PRO) | ≈0.16 | ≈3 | Known volume | [84] |
Table 3.
Challenges related to robotic missions in confined spaces for stockpile volume estimation.
| Challenge | Description |
|---|---|
| GPS Signal | GPS signal loss affects robot/drone localization; however, potential solutions include the use of SLAM algorithms with sensors effective for localization and mapping in GPS-denied environments. |
| Narrow Clearances and Obstructions | Space constraints between the storage ceiling and stockpile peaks, as exemplified in Figure 8, require careful mission planning. |
| Stockpile Texture Variations | Uniform or highly textured surfaces represent a challenge for both visual and LiDAR systems, as uniform surfaces lack distinct features for recognition while highly textured surfaces may lead to uncertainties in identifying unique features. |
| Darkness and Dust | Darkness and dust have significant effects on visual-based approaches; however, LiDAR provides less drift in localization and operates well in poor visibility. |
| Sensor Weight | Most 3D LiDAR sensors can be heavy, requiring larger carrying platforms within aerial missions, which are subsequently harder to fly within confined spaces. |
Table 4.
Summary of research articles that provide solutions for indoor stockpile volume estimation.
Table 4.
Summary of research articles that provide solutions for indoor stockpile volume estimation.
| Solution | Application | Surveyed Area [m2] | Country | Platform | Scanning Payload | Reference Volume [m3] | Volumetric Error [%] | Ground Truth | Reference |
|---|---|---|---|---|---|---|---|---|---|
| Drone | Sand pile | - | USA | Tarot 650 Sport quadcopter | ZED Mini Stereo camera | 4–25 | 1.2–9.8 | Known volume | [97] |
| Stockpiles | 5320 | USA | DJIMatrice 100 quadrotor | 3D LIDAR (Velodyne VLP 16 Puck Lite) | 306.5 | 2.2 | Known volume | [98] | |
| Stockpiles (Simulation) | 1040 | UK | Genetic quadrotor | 3D LiDAR (Rotary) | 2118 | 3 | Known volume | [99,100] | |
| Stockpiles (Simulation) | 2400 | UK | Genetic quadrotor | 1D LiDAR (Actuated) | 7193–8677 | 1.6 | Known volume | [101] | |
| Stockpiles (Simulation) | 1200 | UK | Multi-agent quadcopter | 1D LiDAR (Depth) | 2422 | 0.2–1.5 | Known volume | [102] | |
| Rail Platform | Small gravel pile | 0.32 | Australia | Rail | 2D LiDAR (Sick LMS200) | 0.03 | 0.6–3.8 | Known volume | [103] |
| Ore pile | 2250 | China | Rail | Two 2D LiDAR (SICK LMS-141) | 711–1573 | 1 | GeoSLAM scanner | [104] | |
| Bulk terminal stockpile | 1,729,000 | China | Stacker reclaimer | 3D LiDAR | - | - | - | [105] | |
| Bulk material stockpile | 3 | China | Rail | Two cameras and a leaser projector | - | - | - | [106] | |
| Tripod-Mounted | Salt stockpile management | - | USA | Tripod /Boom lift | Camera (GoPro Hero 9 RGB) and Two 3D LiDAR (Velodyne VLP-16) | 1648 | 0.1 | Bucket count | [107] |
| - | Tripod | 1438 | 0.0 | TLS | [108] | ||||
| - | 968 | 3.2 | |||||||
| Small grain piles | 0.15 | Brazil | Tripod | 2D LiDAR (OMD30M-R2000) | - | 19.6 | Known volume | [109] | |
| 24.8 | - | 1.5 |
Table 5.
Comparison of the advantages and disadvantages of the four main existing stockpiles mapping techniques.
Table 5.
Comparison of the advantages and disadvantages of the four main existing stockpiles mapping techniques.
| Techniques | Advantages | Disadvantages |
| GNSS |
|
|
| Drone Photogrammetry |
|
|
| TLS |
|
|
| Airborne LiDAR |
|
|
Disclaimer/Publisher’s Note: The statements, opinions and data contained in all publications are solely those of the individual author(s) and contributor(s) and not of MDPI and/or the editor(s). MDPI and/or the editor(s) disclaim responsibility for any injury to people or property resulting from any ideas, methods, instructions or products referred to in the content. |
© 2023 by the authors. Licensee MDPI, Basel, Switzerland. This article is an open access article distributed under the terms and conditions of the Creative Commons Attribution (CC BY) license (https://creativecommons.org/licenses/by/4.0/).
Share and Cite
MDPI and ACS Style
Alsayed, A.; Nabawy, M.R.A. Stockpile Volume Estimation in Open and Confined Environments: A Review. Drones 2023, 7, 537. https://doi.org/10.3390/drones7080537
AMA Style
Alsayed A, Nabawy MRA. Stockpile Volume Estimation in Open and Confined Environments: A Review. Drones. 2023; 7(8):537. https://doi.org/10.3390/drones7080537
Chicago/Turabian StyleAlsayed, Ahmad, and Mostafa R. A. Nabawy. 2023. "Stockpile Volume Estimation in Open and Confined Environments: A Review" Drones 7, no. 8: 537. https://doi.org/10.3390/drones7080537