Article

The Application of RGB, Multispectral, and Thermal Imagery to Document and Monitor Archaeological Sites in the Arctic: A Case Study from South Greenland

1
Environmental Archaeology and Materials Science, The National Museum of Denmark, IC Modewegsvej, Brede, DK-2800 Lyngby, Denmark
2
Greenland National Museum & Archives, Hans Egedesvej 8, Boks 145, Nuuk 3900, Greenland
*
Author to whom correspondence should be addressed.
Drones 2023, 7(2), 115; https://doi.org/10.3390/drones7020115
Submission received: 9 January 2023 / Revised: 2 February 2023 / Accepted: 4 February 2023 / Published: 8 February 2023
(This article belongs to the Special Issue (Re)Defining the Archaeological Use of UAVs)

Abstract

:
Over the past decades, climate change has accelerated the deterioration of heritage sites and archaeological resources in Arctic and subarctic landscapes. At the same time, increased tourism and growing numbers of site visitors contribute to the degradation and manipulation of archaeological sites. This situation has created an urgent need for new, quick, and non-invasive tools and methodologies that can help cultural heritage managers detect, monitor, and mitigate vulnerable sites. In this context, remote sensing and the applications of UAVs could play an important role. Here, we used a drone equipped with an RGB camera and a single multispectral/thermal camera to test different possible archeological applications at two well-known archaeological sites in the UNESCO World Heritage area of Kujataa in south Greenland. The data collected were used to test the potential of using the cameras for mapping (1) ruins and structures, (2) the impact of human activity, and (3) soil moisture variability. Our results showed that a combination of RGB and digital surface models offers very useful information to identify and map ruins and structures at the study sites. Furthermore, a combination of RGB and NDVI maps seems to be the best method to monitor wear and tear on the vegetation caused by visitors. Finally, we tried to estimate the surface soil moisture content based on temperature rise and the Temperature Vegetation Dryness Index (TVDI), but did not achieve any meaningful connection between TVDI and on-site soil moisture measurements. Ultimately, our results pointed to a limited archaeological applicability of the TVDI method in Arctic contexts.

1. Introduction

Across the Circumpolar North, low temperatures, moist soil conditions, and minimal human interference have contributed to the high degree of preservation of archaeological artefacts, features, and sites [1]. These elements have provided researchers with unique opportunities to learn about ancient cultures and environments and the origins of indigenous peoples [2,3,4,5]. Out of ~180,000 sites registered across the Arctic, only a small fraction has been properly documented and it is estimated that there are many sites that remain undiscovered [6]. Thus, Arctic archaeological sites have a great potential to reveal further spectacular finds and provide novel contributions to the understanding of past human behavior and habitation in the Arctic. However, this potential is currently waning due to climate-related pressures. Critical, well-known effects include physical destruction due to coastal erosion [7,8] and increased microbial degradation of organic archaeological deposits due to warming temperatures and changing hydrology [8]. Additionally, Arctic warming has promoted a well-documented ‘greening’ [9,10] effect, with negative consequences for archaeological sites occurring both above and below ground [11,12]. Finally, increasing tourism and other human activities may additionally accelerate processes of transformation and decay at these locations [13].
Since it is impossible to visit and monitor every site, there is an urgent need to improve techniques to document, assess, and quantify damage to archaeological sites and artefacts across the Circumpolar North [14]. Remote sensing techniques based on optical and thermal imagery from UAV or satellites provide an attractive alternative to expensive and time-consuming ground surveys and traditional on-site environmental monitoring and data collection. While the coarse spatial resolution of satellite images often limits their application at small archaeological sites, UAV-based solutions can provide the needed high spatial resolution for identifying critical changes occurring over time. Aerial photographs, photogrammetry, and remote sensing have been used in archeological studies for several decades [15]. At the same time, UAV-based systems have become cheaper and more ruggedized with options for integrating new, lightweight thermal and optical sensors. Accessibility to these UAVs, with higher computing power and software, has provided new avenues for the generation of high-resolution mosaics and digital surface models (DSMs) in archaeological contexts [16]. For example, information captured in the near infrared region (NIR) has been successfully used to recognize and gain new levels of insight on archaeological remains in other parts of the globe [17]. Multispectral sensors have been used to derive spectral indices and band combinations that highlight specific features on archeological sites [18] and vegetation properties [19,20] as well as soil properties [21]. Other studies have also combined multispectral and thermal information to identify archeological features [18,22,23,24,25]. Another technique for improved visualization is principal component analysis (PCA), which reduces redundancy in multiband images and produces uncorrelated principal components that enhance different parts of the variation from the original data set [18,26,27].
In this study, we used a tetra copter equipped with an RGB camera and a multispectral/thermal sensor to test the possibilities for identifying ruins and structures, mapping wear on vegetation caused by human activity, and quantifying soil moisture variation. The study was performed in south Greenland at two of the most famous archaeological sites from the Norse Viking Age settlers who inhabited the area from approximately 985–1450 AD.

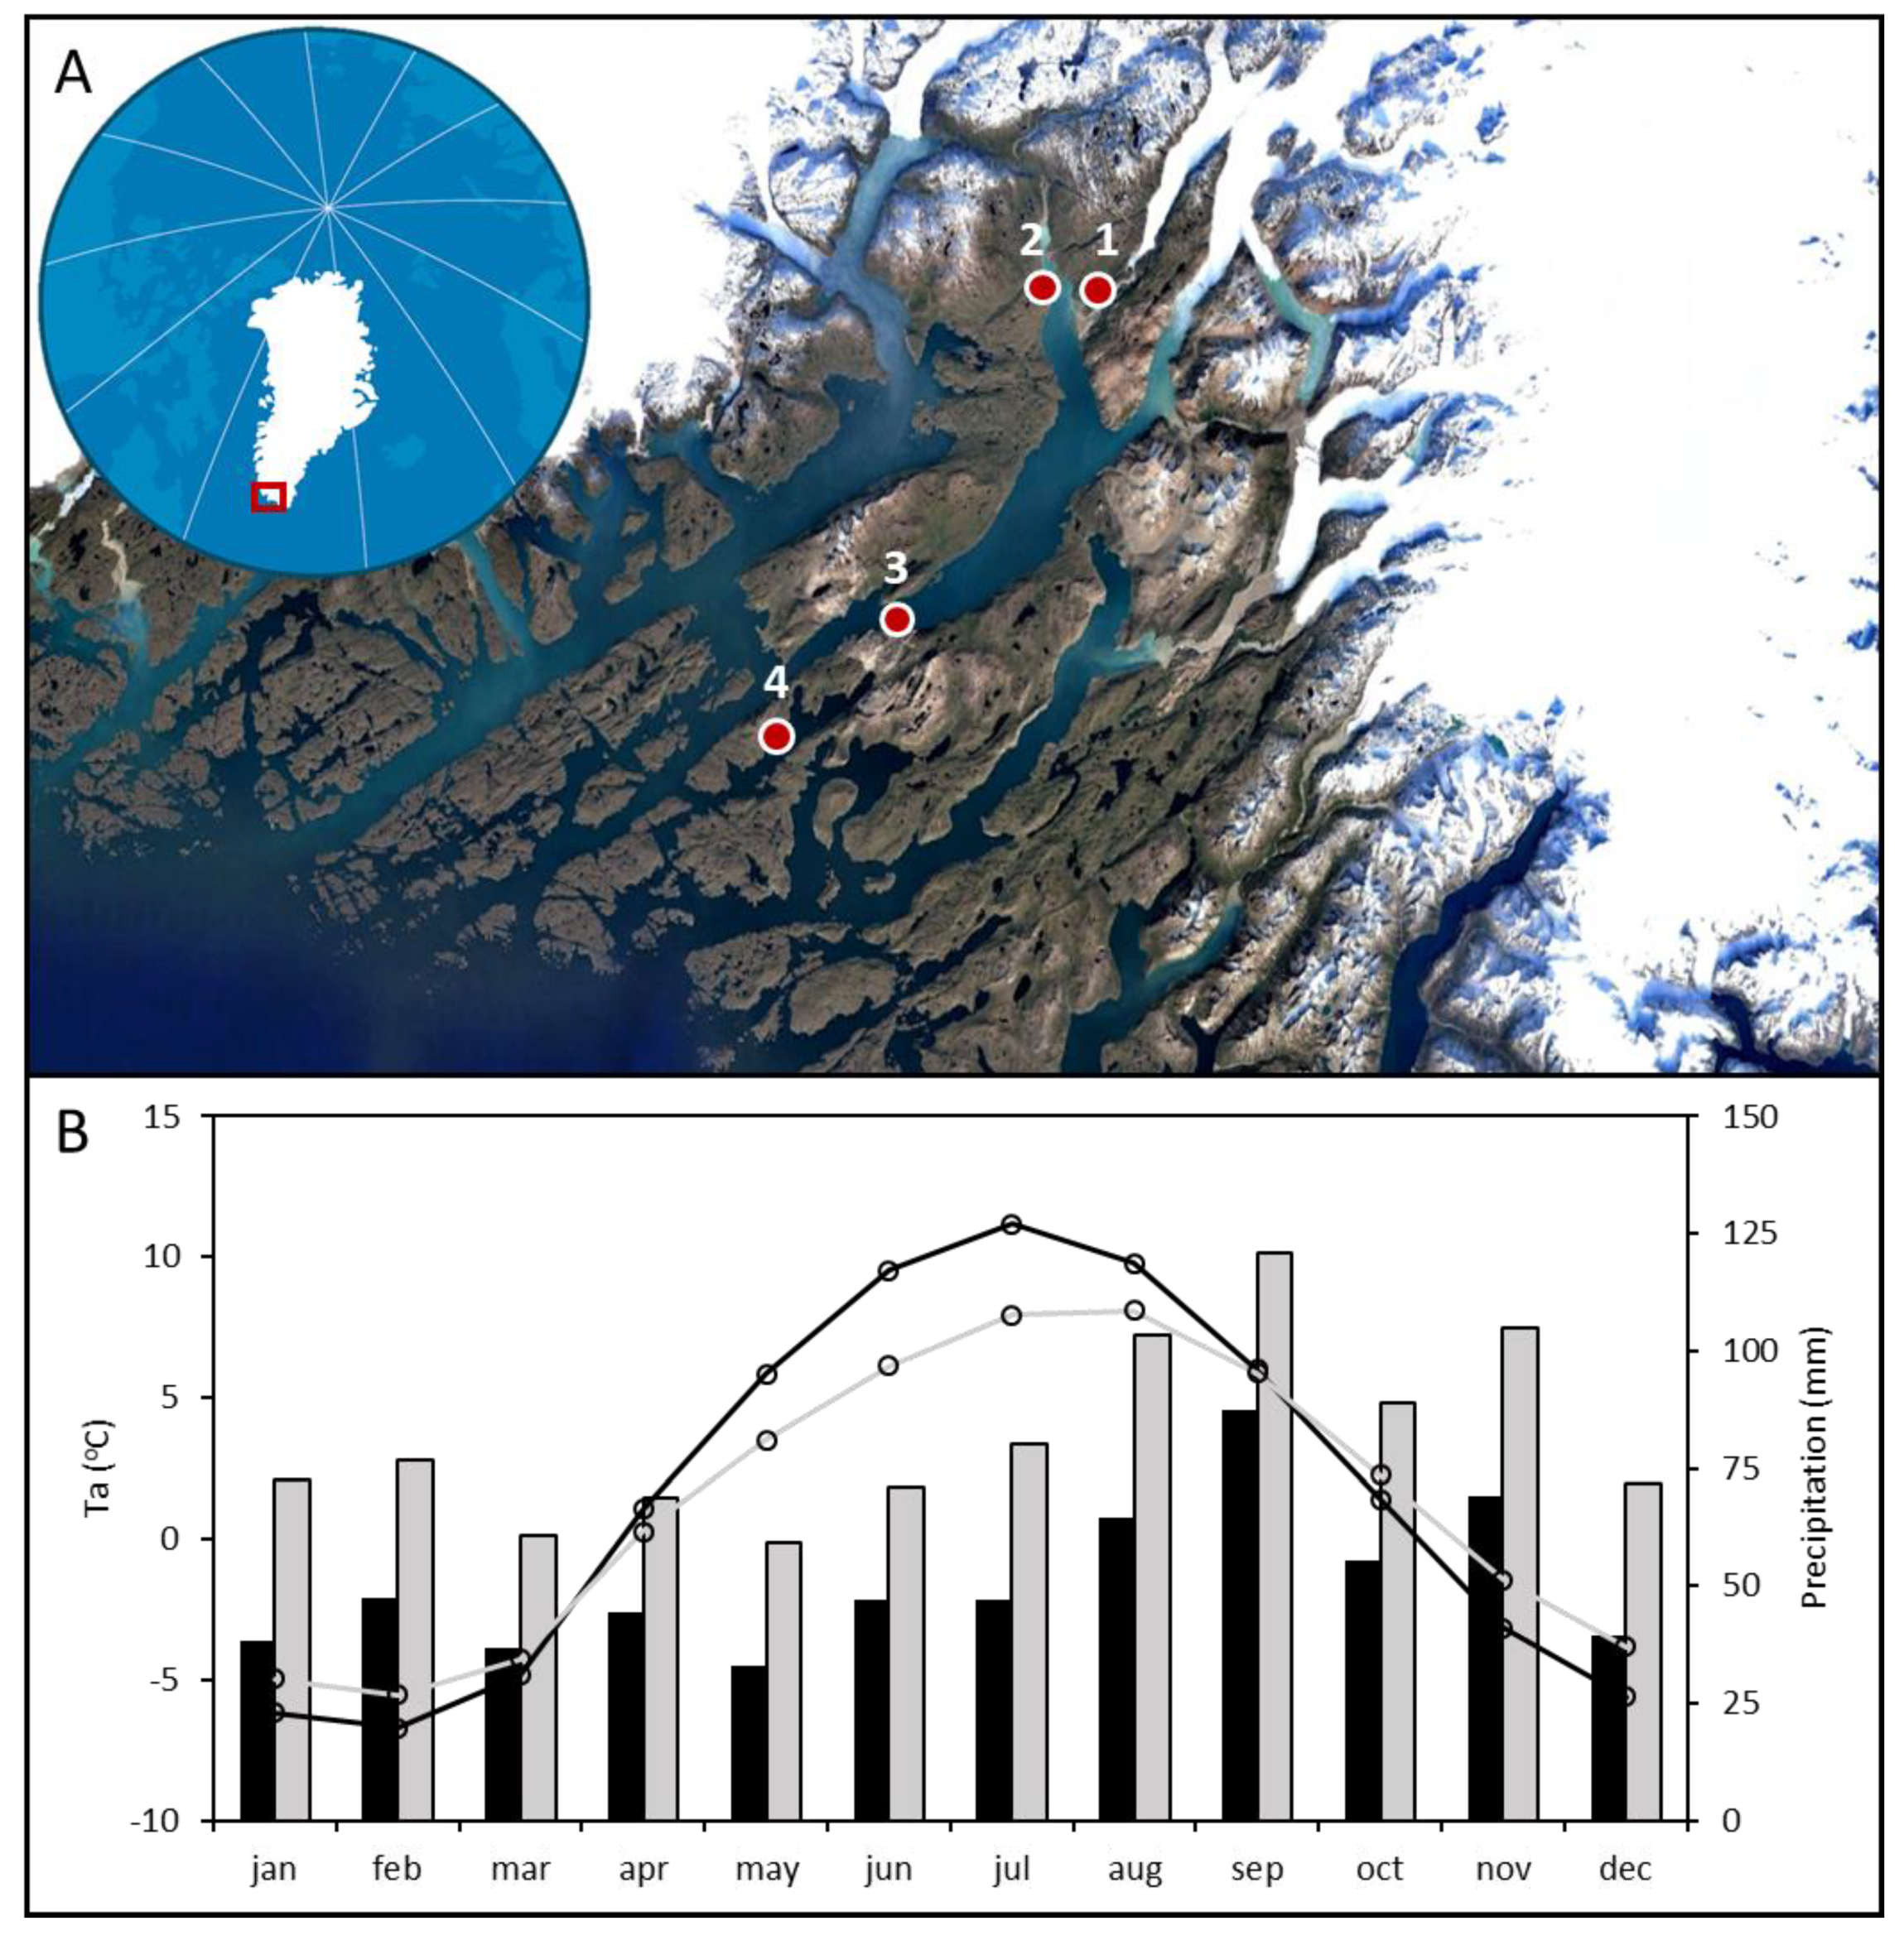
2. Study Sites and Environmental Conditions

The two study sites, Qassiarsuk and Qaqortukulooq (also known as Hvalsey Church), are located within the UNESCO World Cultural Heritage area of Kujataa (Figure 1A), which is recognized as an overlapping medieval Norse and Inuit subarctic agricultural landscape [28]. The geography of this region contains several large-scale natural features: the inland ice sheet to the North, high mountains, deep fjords, and extensive stretches of wild, open land where little evidence of past human activity is observed. Kujataa comprises five individual component areas that stretch across a climatic gradient reaching from the open sea in the west to the head of the fjords and cutting as much as 100 km inland to the east. As shown in Figure 1B, there is a marked climatic gradient when traveling from the outer coast to the inner fjord, with summers in the inner fjord being markedly warmer and drier than the outer coast. It is here in the inner fjords that early Norse colonists established their settlements in the late 10th century AD and where the archaeological remains of their 500-year occupation are still seen today [28].

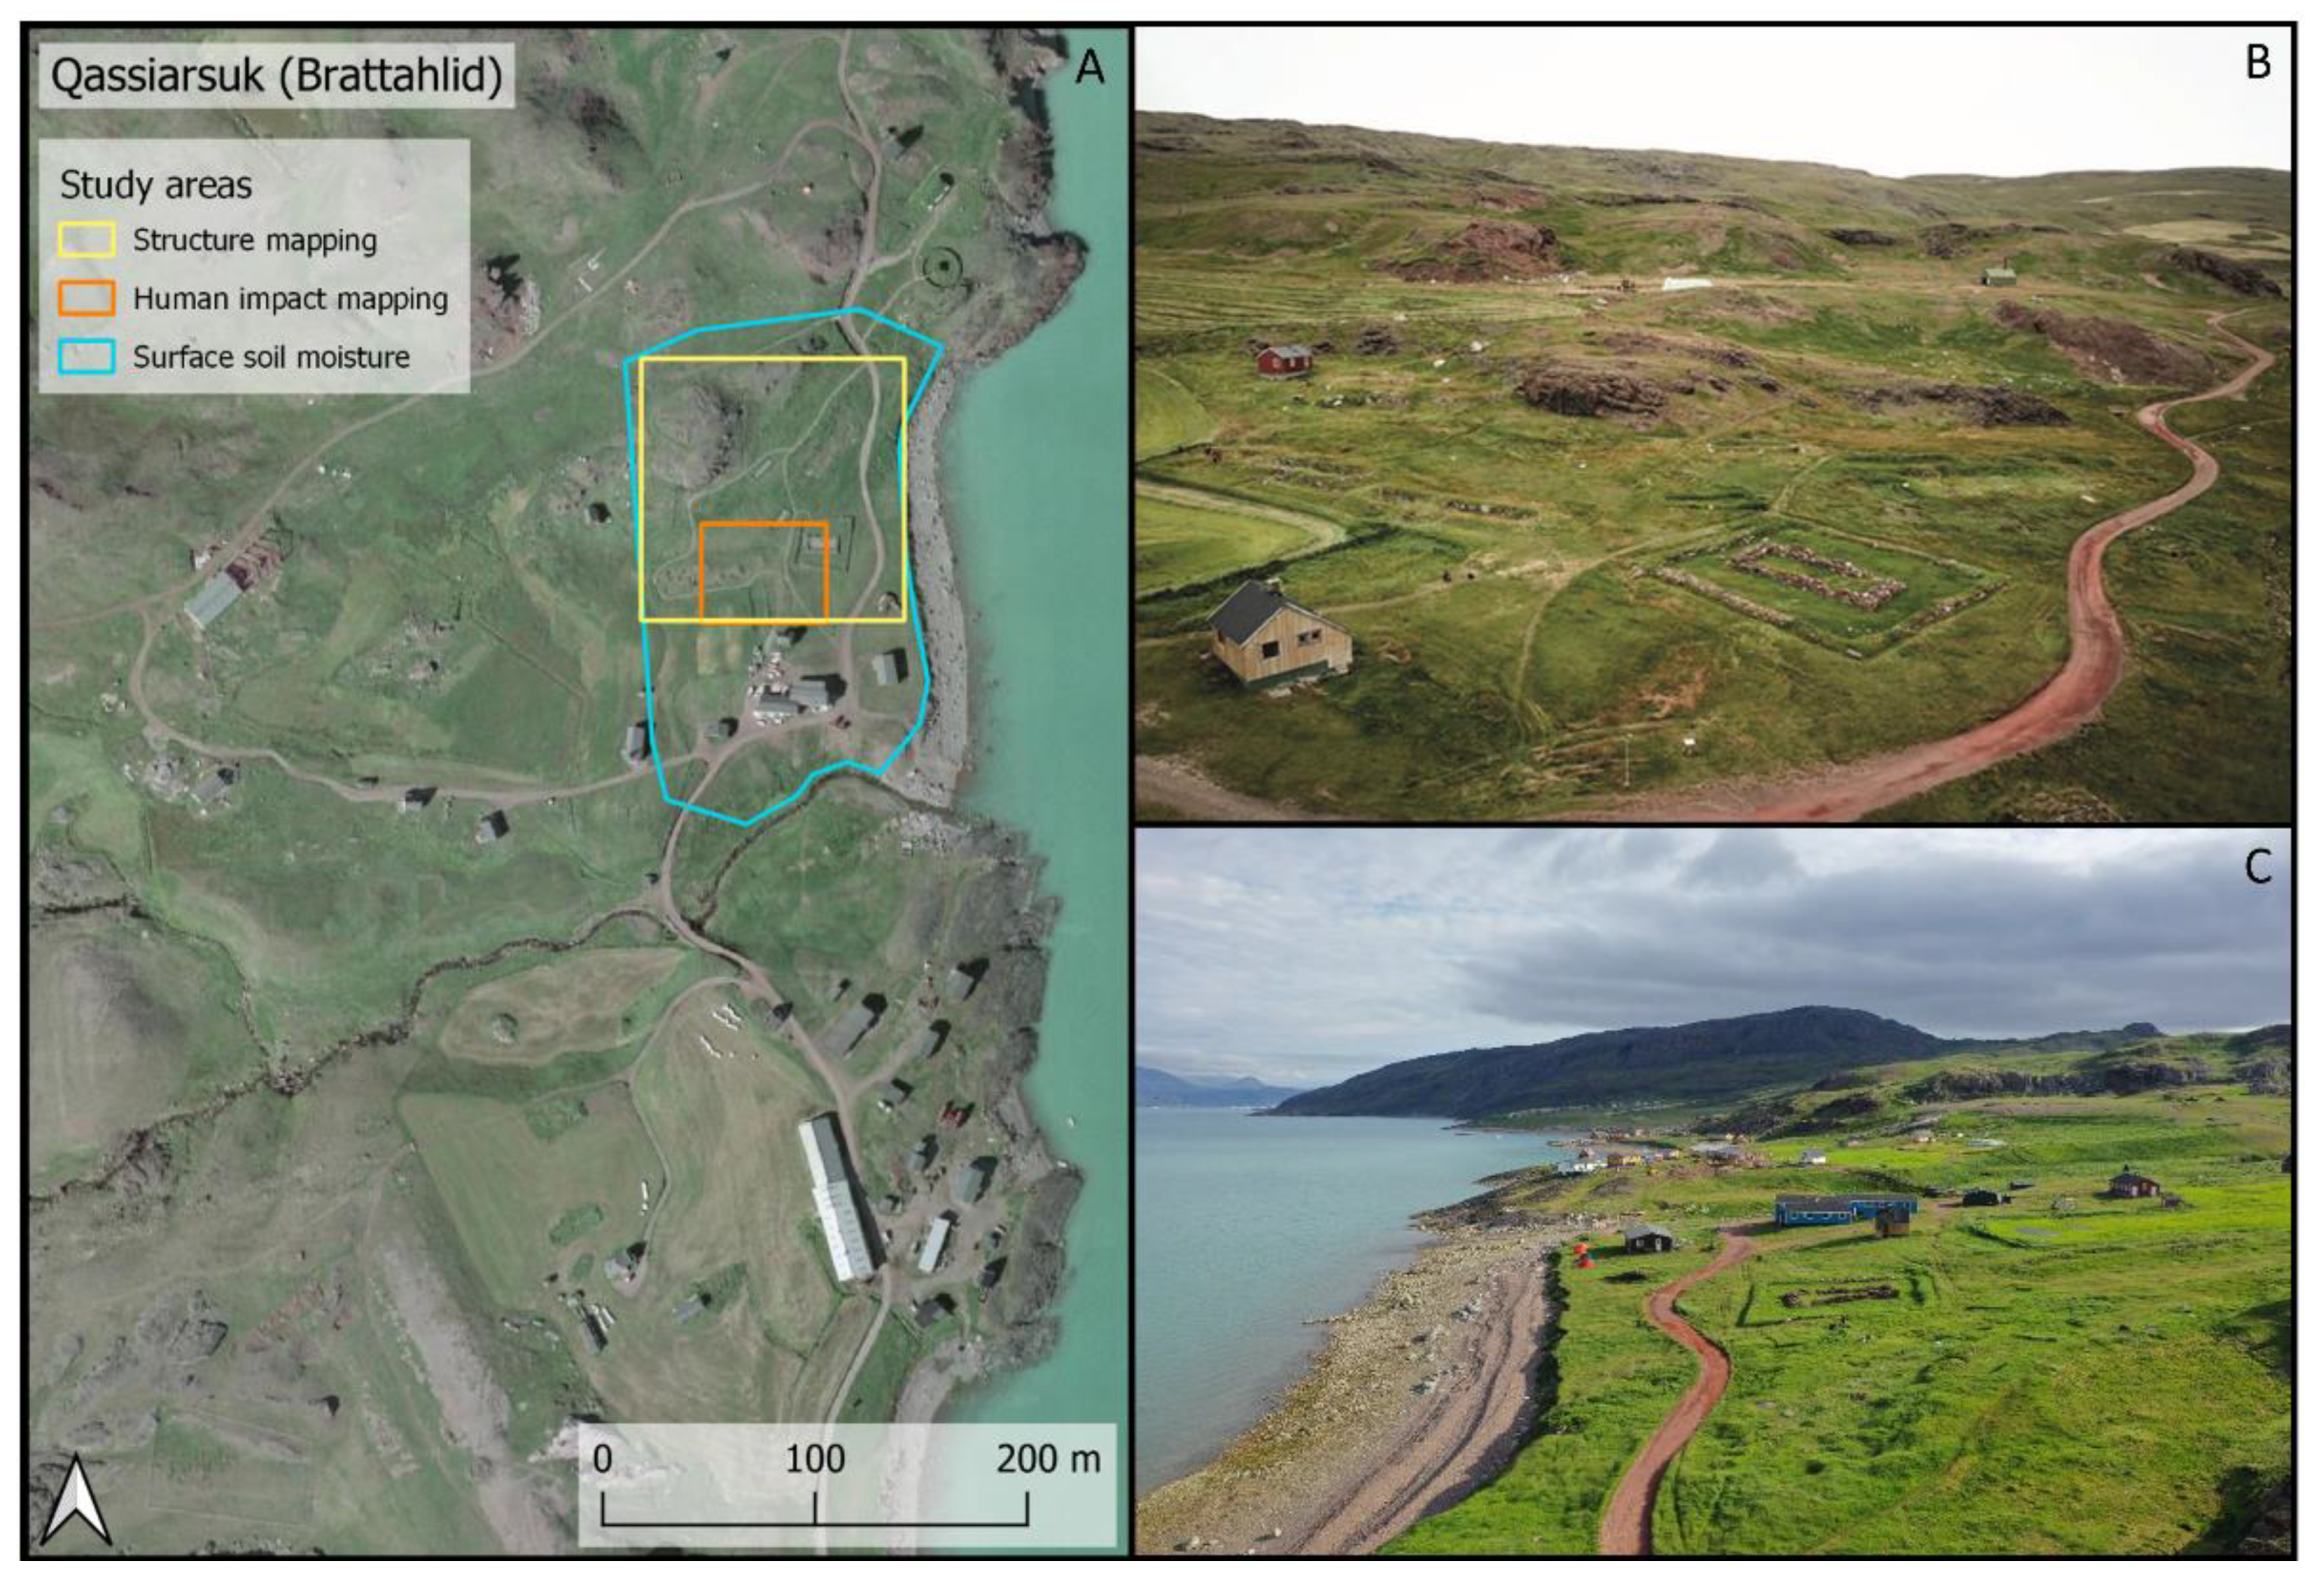
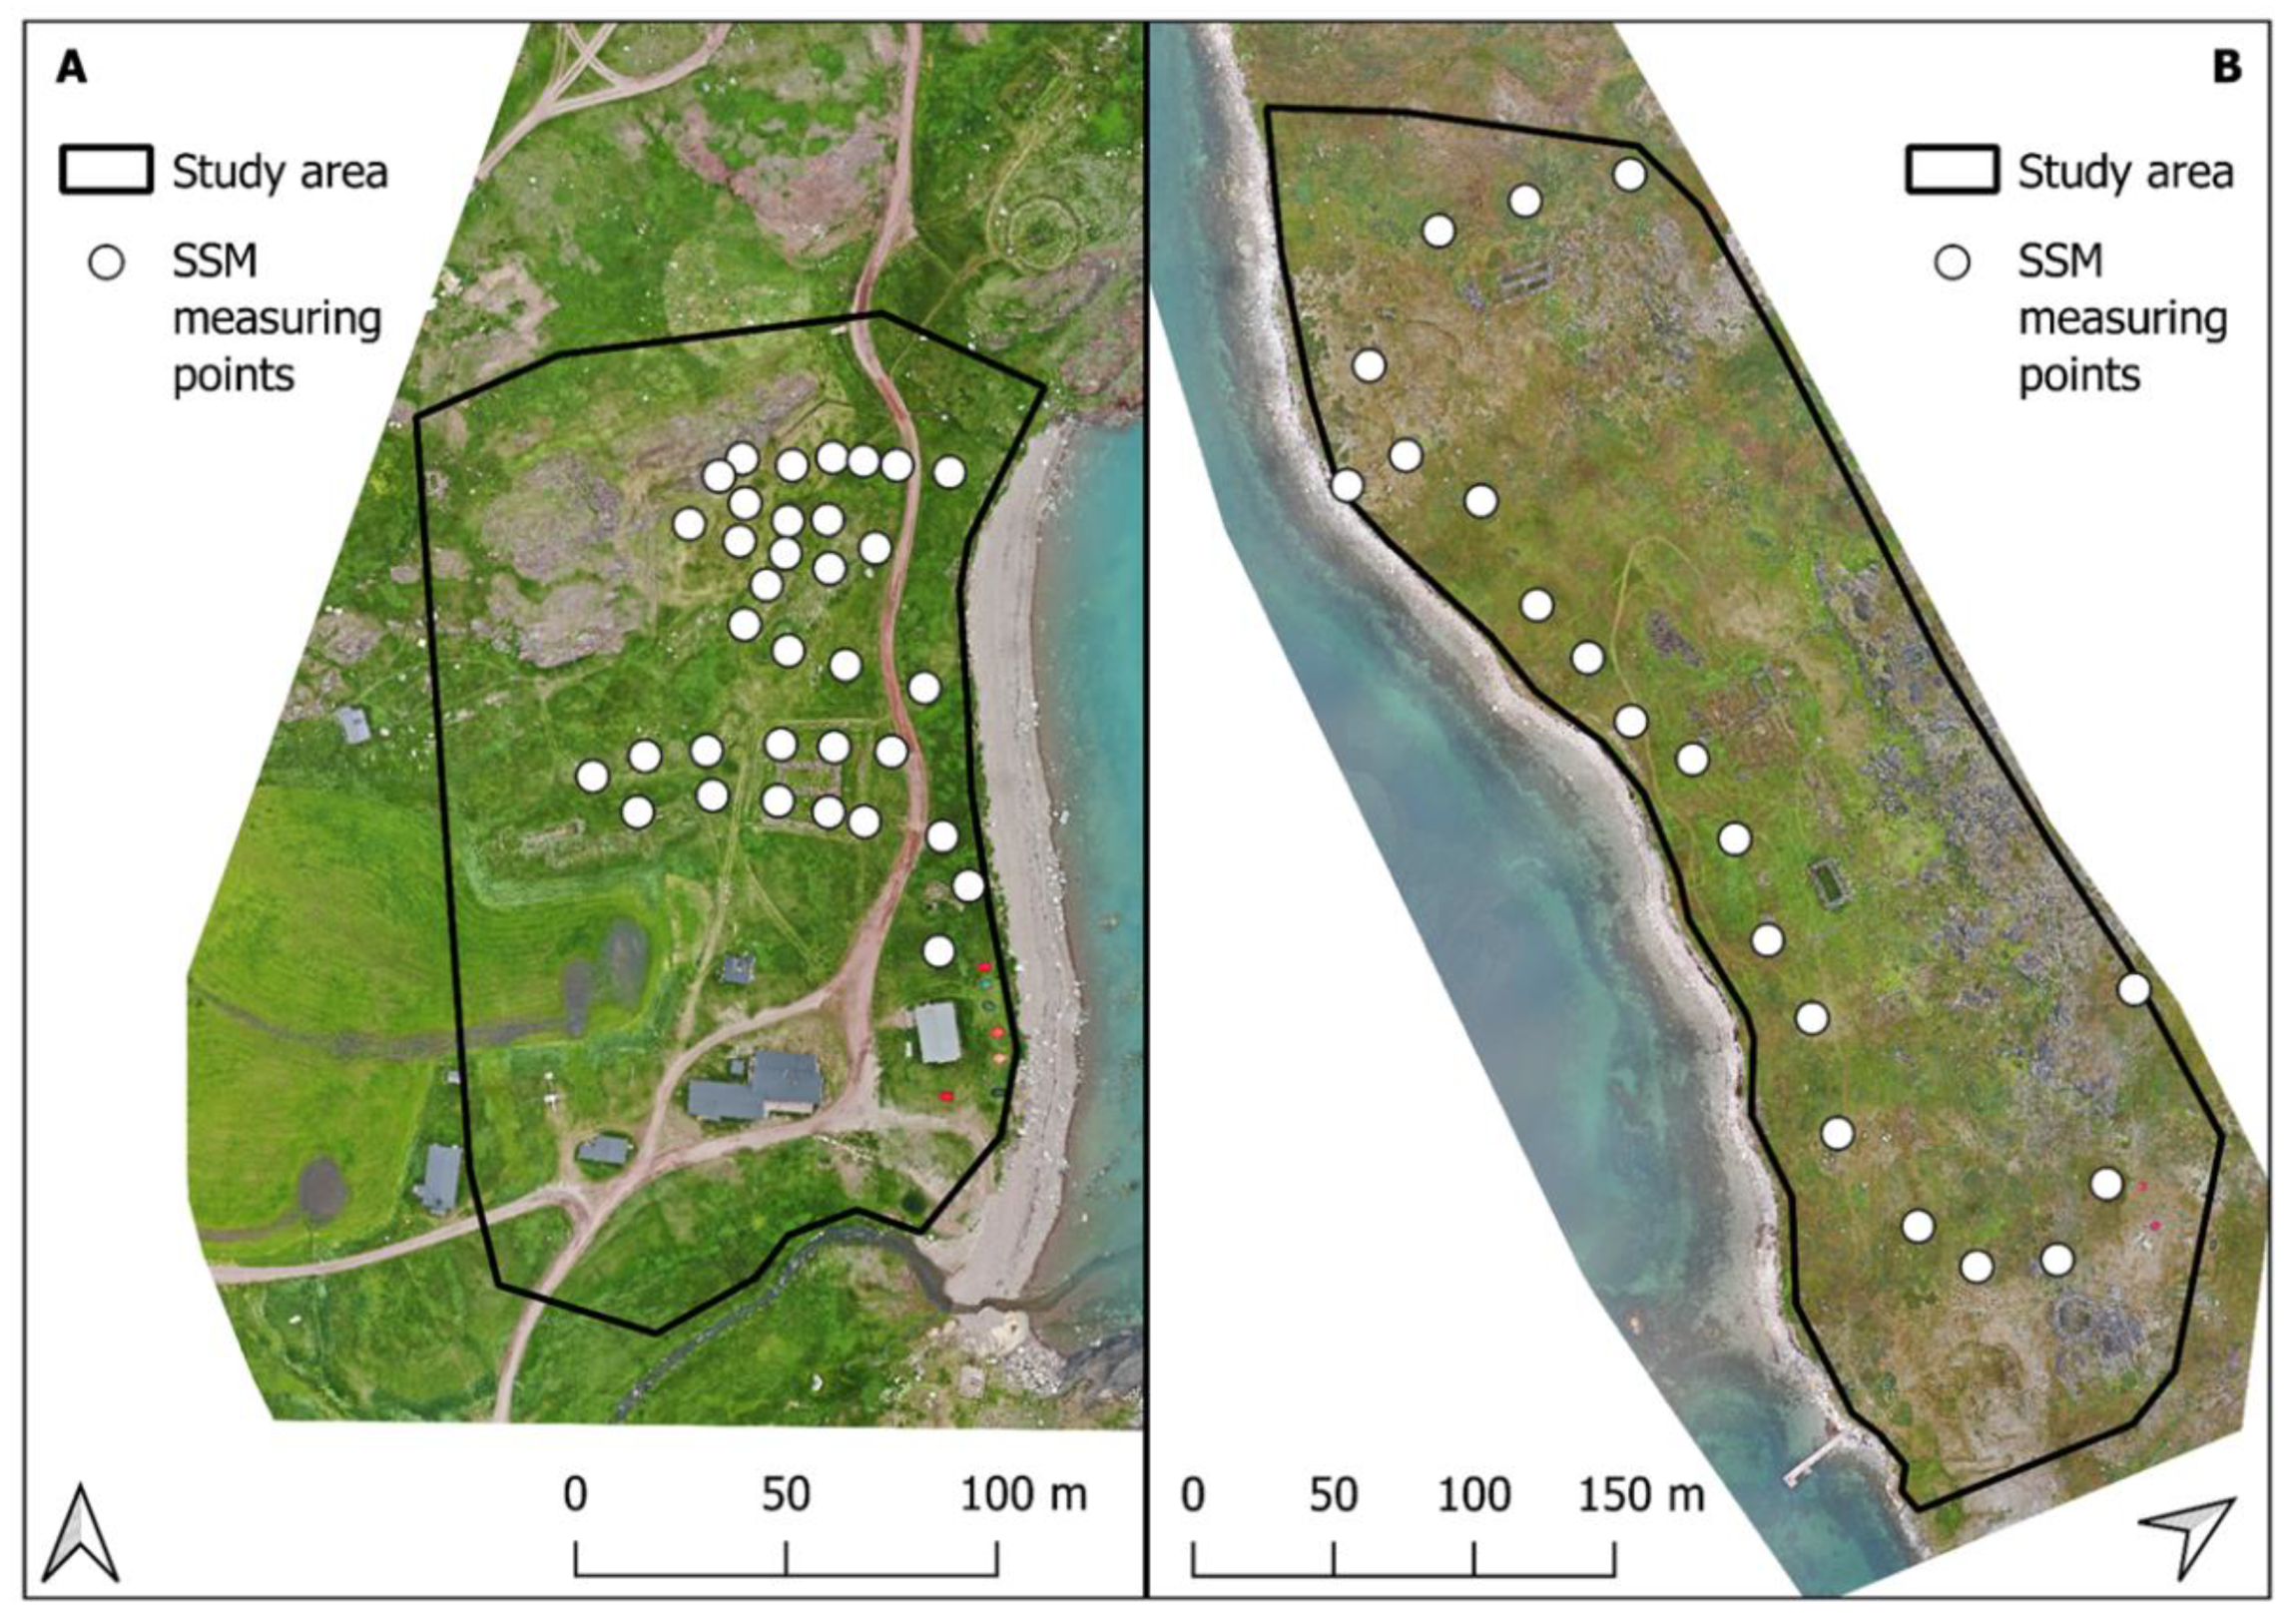
2.1. Qassiarsuk (Brattahlíð)

The archaeological ruins at Qassiarsuk, also known as Eric the Red’s Farm, lies on the coast of the Tunulliarfik Fjord, approximately 20 km from the Greenland Ice Sheet. Narsarsuaq, the region’s only international airport, lies across the fjord to the east. Because of its high-profile status, Qassiarsuk has been one of the most intensively investigated and documented archaeological sites in Norse Greenland. Our study focused on a small part of Erik’s farm, covering the church and some other relevant ruins (Figure 2). The most recently documented excavation at the site was conducted between 2005 and 2006 [30].

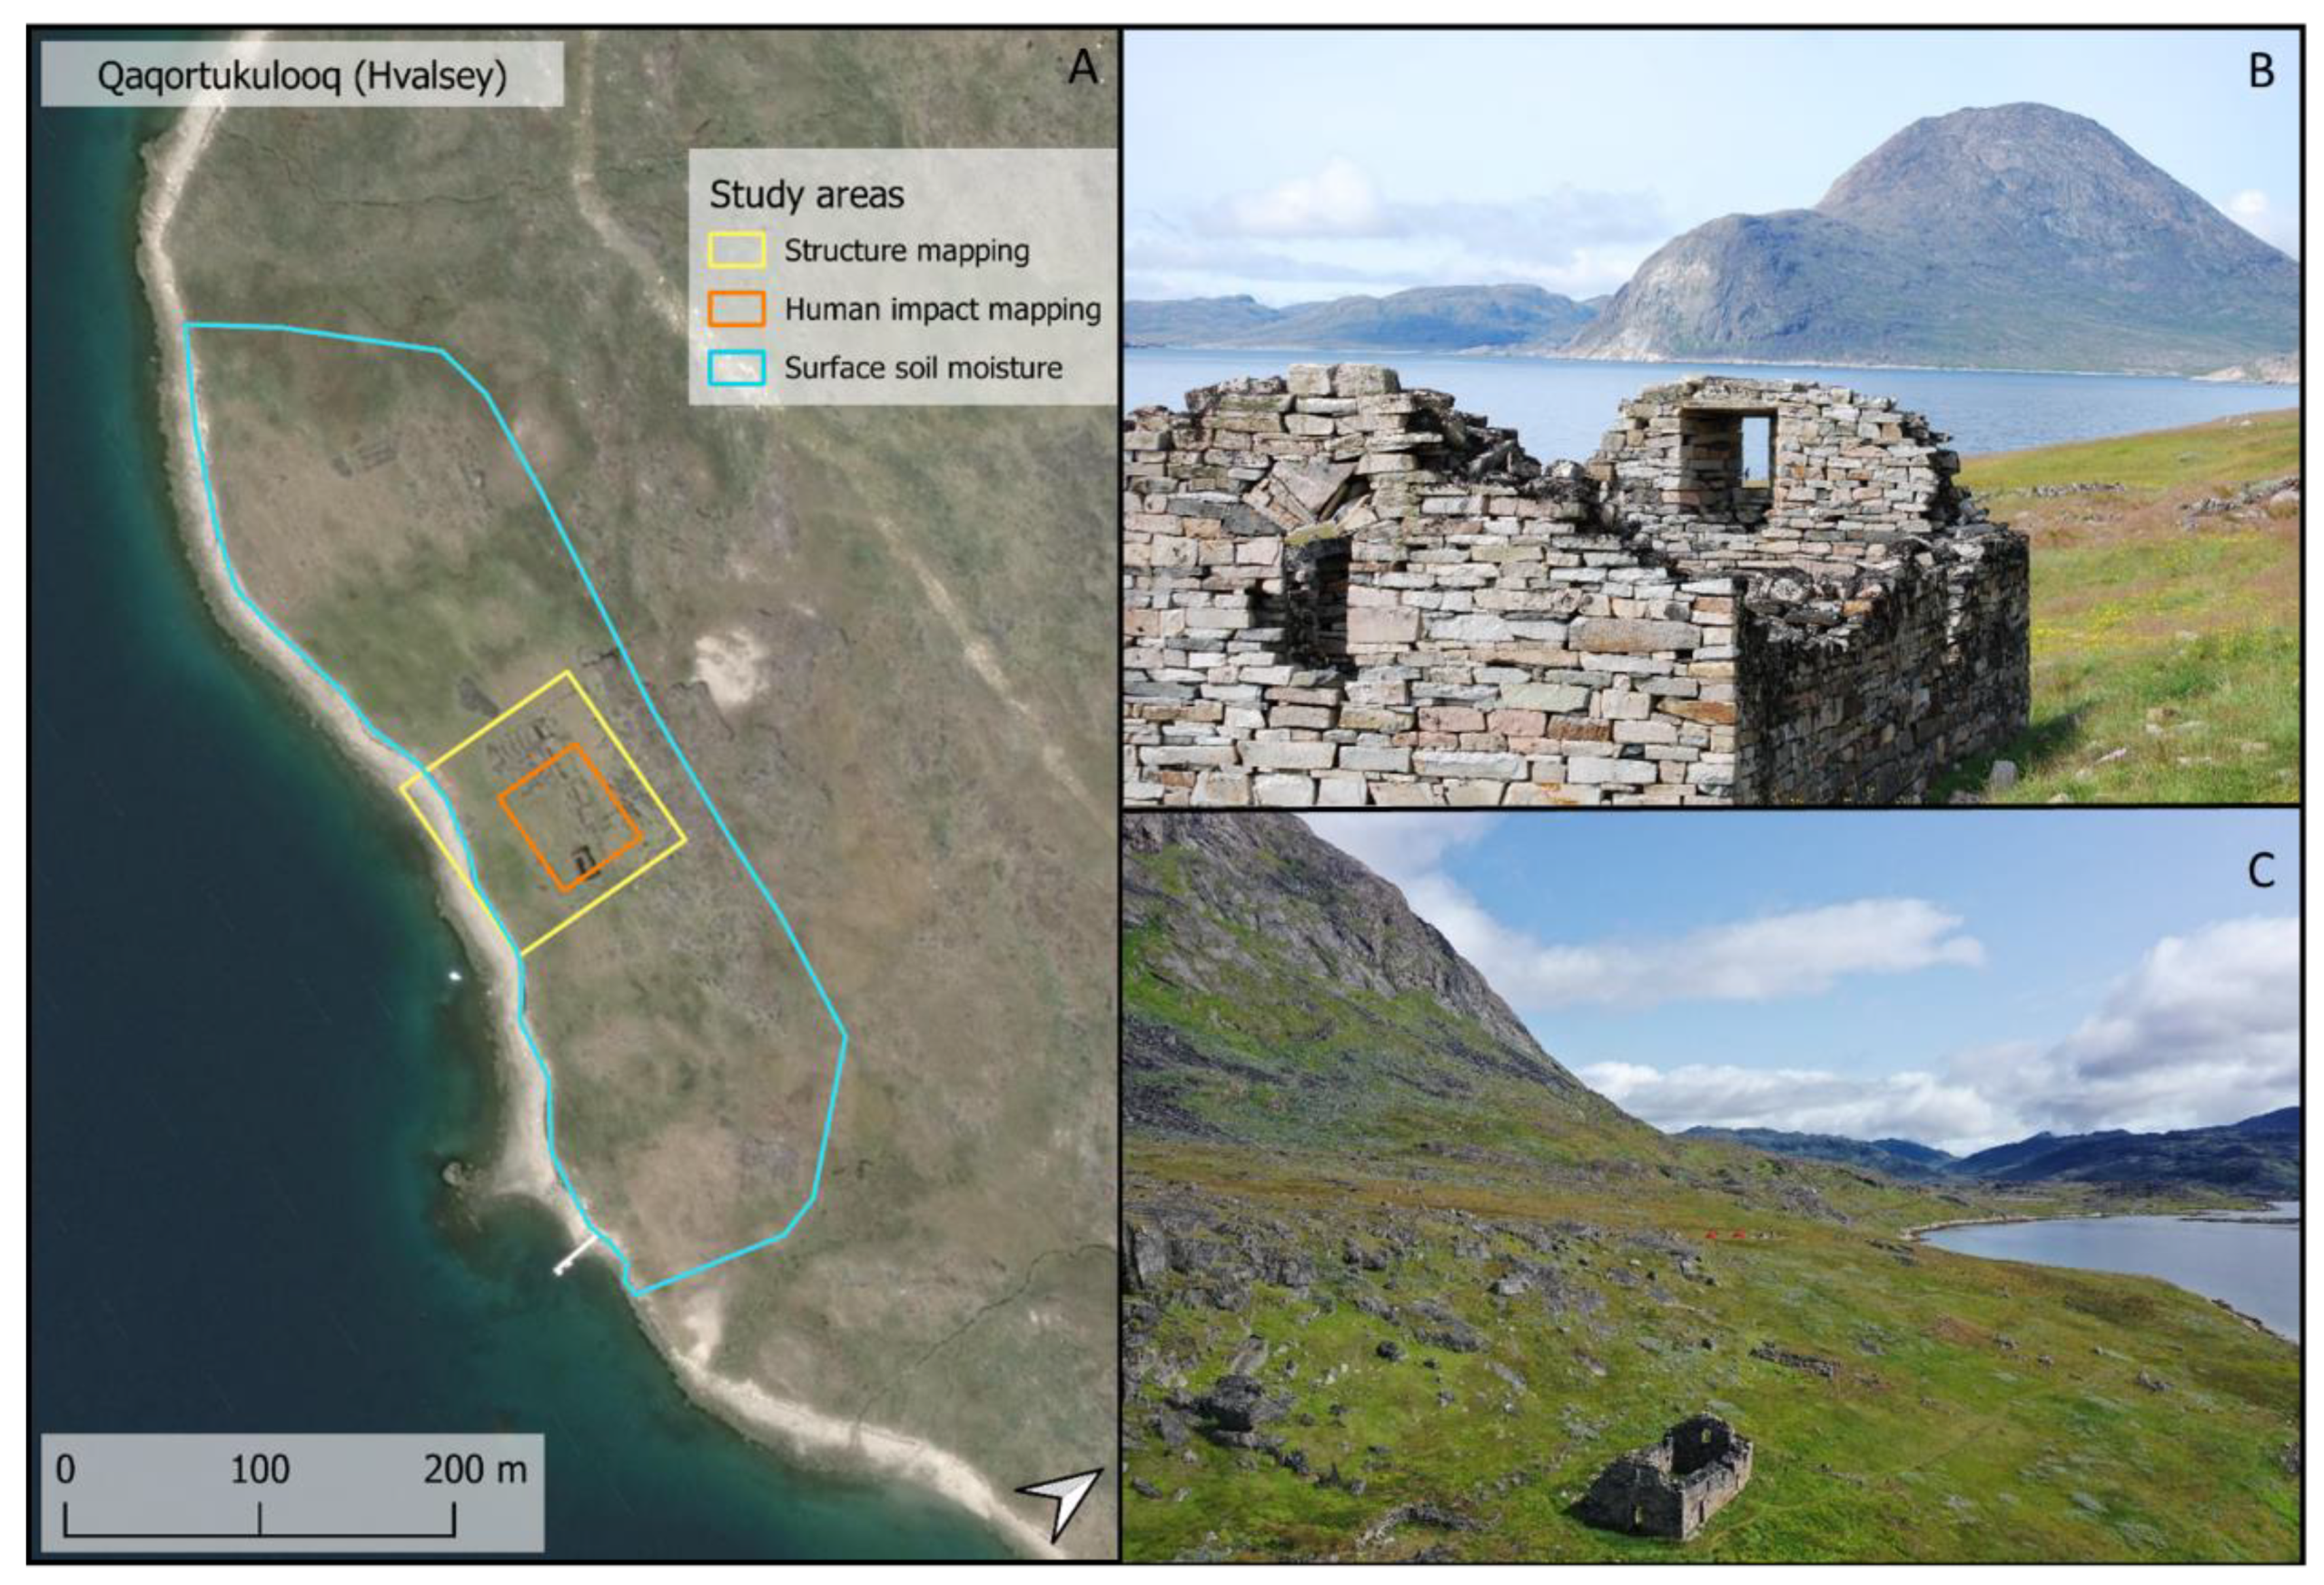
2.2. Qaqortukulooq (Hvalsey Church)

The ruins of the Hvalsey farmstead and church at Qaqortukulooq are located near the town of Qaqortoq. The site lies on a large fertile plain that slopes toward the shore and is bordered by a steep, rocky cliff that rises up behind the farmstead buildings to the north. The church ruin at Hvalsey is considered to be the best-preserved Norse ruin found in Greenland [31] and is a highly popular tourist destination (Figure 3).

3. Materials and Methods

3.1. UAV and Payloads

Fieldwork was performed in July and August 2021 and 2022 (Table 1). However, due to inclement weather, no flights were carried out at Qassiarsuk in 2022. Drone images were captured using a DJI Matrice 300 RTK quadcopter using two different cameras. High-resolution RGB images were captured using a DJI Zenmuse H20 camera that was combined with the DJI Matrice 300 RTK system and a D-RTK Mobile Station to create high-precision reference orthomosaic maps of both study sites. Flight altitude was established at 75 m, resulting in 2.6 cm/pixel images. Multispectral and thermal data were captured using a MicaSense Altum camera. The Altum camera captures six bands defined by different wavelengths and bandwidths on the electromagnetic spectrum: blue (459–491 nm), green (546–574 nm), red (661–675 nm), red-edge (711–723 nm), near infrared (NIR) (813–871 nm), and thermal (5–17 µm). The image resolution in the optical bands was 2064 × 1544 and 160 × 120 in the thermal infrared band. Flight altitude was established at 60 m, leading to 2.6 cm/pixel in the multispectral channels and 40 cm/pixel in the thermal band. Images of a calibrated reflectance panel (MicaSense) were taken before and after each flight and used for radiometric calibration. The Altum camera did not support RTK precision. Consequently, we performed geometric corrections using ground control points (GCPs) from the high-precision reference orthomosaic created with images from the DJI Zenmuse H20 camera.

3.2. Data Processing

Orthorectified image mosaics (RGB, blue, green, red, red-edge, NIR, and thermal), digital surface model (DSM), geometric corrections, conversion to reflectance, and temperature were made in using Pix4DMapper software. All raster image calculations of DSM visualization images, indices, and delta TS images, as well as color composites, were performed in QGIS [32]. SAGA GIS was used for principal component analysis [33]. To optimize the interpretation of the generated height data, we conducted multiple DSM visualizations in Relief Visualization Toolbox (RVT) [34] and achieved the best result using a multi-scale Relief model (MSRM) [35]
We used the RED and NIR bands collected with the MicaSense Altum camera to derive the Normalized Difference Vegetation Index (NDVI):
NDVI = ( N I R R E D ) ( N I R + R E D )
Furthermore, we carried out a principal component analysis (PCA) [36]. For the PCA, the first three components were calculated from a multiband raster containing orthomosaics from all bands collected with the MicaSense Altum camera. The PCA reduced redundancy in the multiband raster by creating principal components (PCs) from uncorrelated variance in the image data set. PC1 included most of the variance across the data set. PC2 included a smaller part of the variance, which was uncorrelated with the PC1. PC3 included an even smaller part of the original variance but was also uncorrelated with the other PCs.
Finally, we tested the possibility of mapping SSM at the two study sites based on a well-described relation between NDVI and land surface temperature. The method of mapping SSM from NDVI and thermal imagery was first suggested by Sandholt et al. [37] as the Temperature Vegetation Dryness Index (TVDI). Stisen et al. [38] suggested an improved TVDI methodology by applying the thermal inertia of mapped surfaces as the difference in thermal images (δTS) between morning and midday:
δ TS = ( F 2 F 1 ) T i m e
where F2 and F1 correspond to the thermal orthomosaic from midday and morning flights, respectively, while Time is the elapsed time between the observations, thus defining the ‘delta(δ)’ state of the expression.
The TVDI is a semi-empirical method that delimitates the triangle formed when plotting surface temperature (ẟTS) versus NVDI [37,39,40,41] (Figure 4). The upper boundary is called “dry-edge” and represents dry soils and stressed vegetation with the surface temperature at its maximum. The lower boundary is called “wet-edge” and represents conditions with minimum surface temperatures and where the evapotranspiration is close to the potential rate. TVDI is calculated from Formula (3):
TVDI = δ T S δ T S M i n δ T S M a x δ T S M i n
where the ẟTS value for each pixel in the scene is related to the lower boundary by ẟTSMin and to the upper boundary by ẟTSMax for the corresponding pixel NDVI value. Dry- and wet-edge calculations for Qassiarsuk 2021 and Qaqortukulooq 2021 were performed using a dedicated TVDI Python tool [42]. The NDVI and ẟTS maps and the TVDI dry- and wet-edge calculations are presented in supporting Figures S1–S4.
In order to test our results, volumetric soil moisture content was measured at both sites in 0–5 cm depth using a Delta-T HH2 Moisture Meter WET sensor. Measuring points were selected and distributed in the field according to site area size and topography and to cover variation in vegetation cover and plant species’ distribution (Figure 5). SSM measurements were conducted immediately after capturing the multispectral/thermal imagery.

4. Results and Discussion

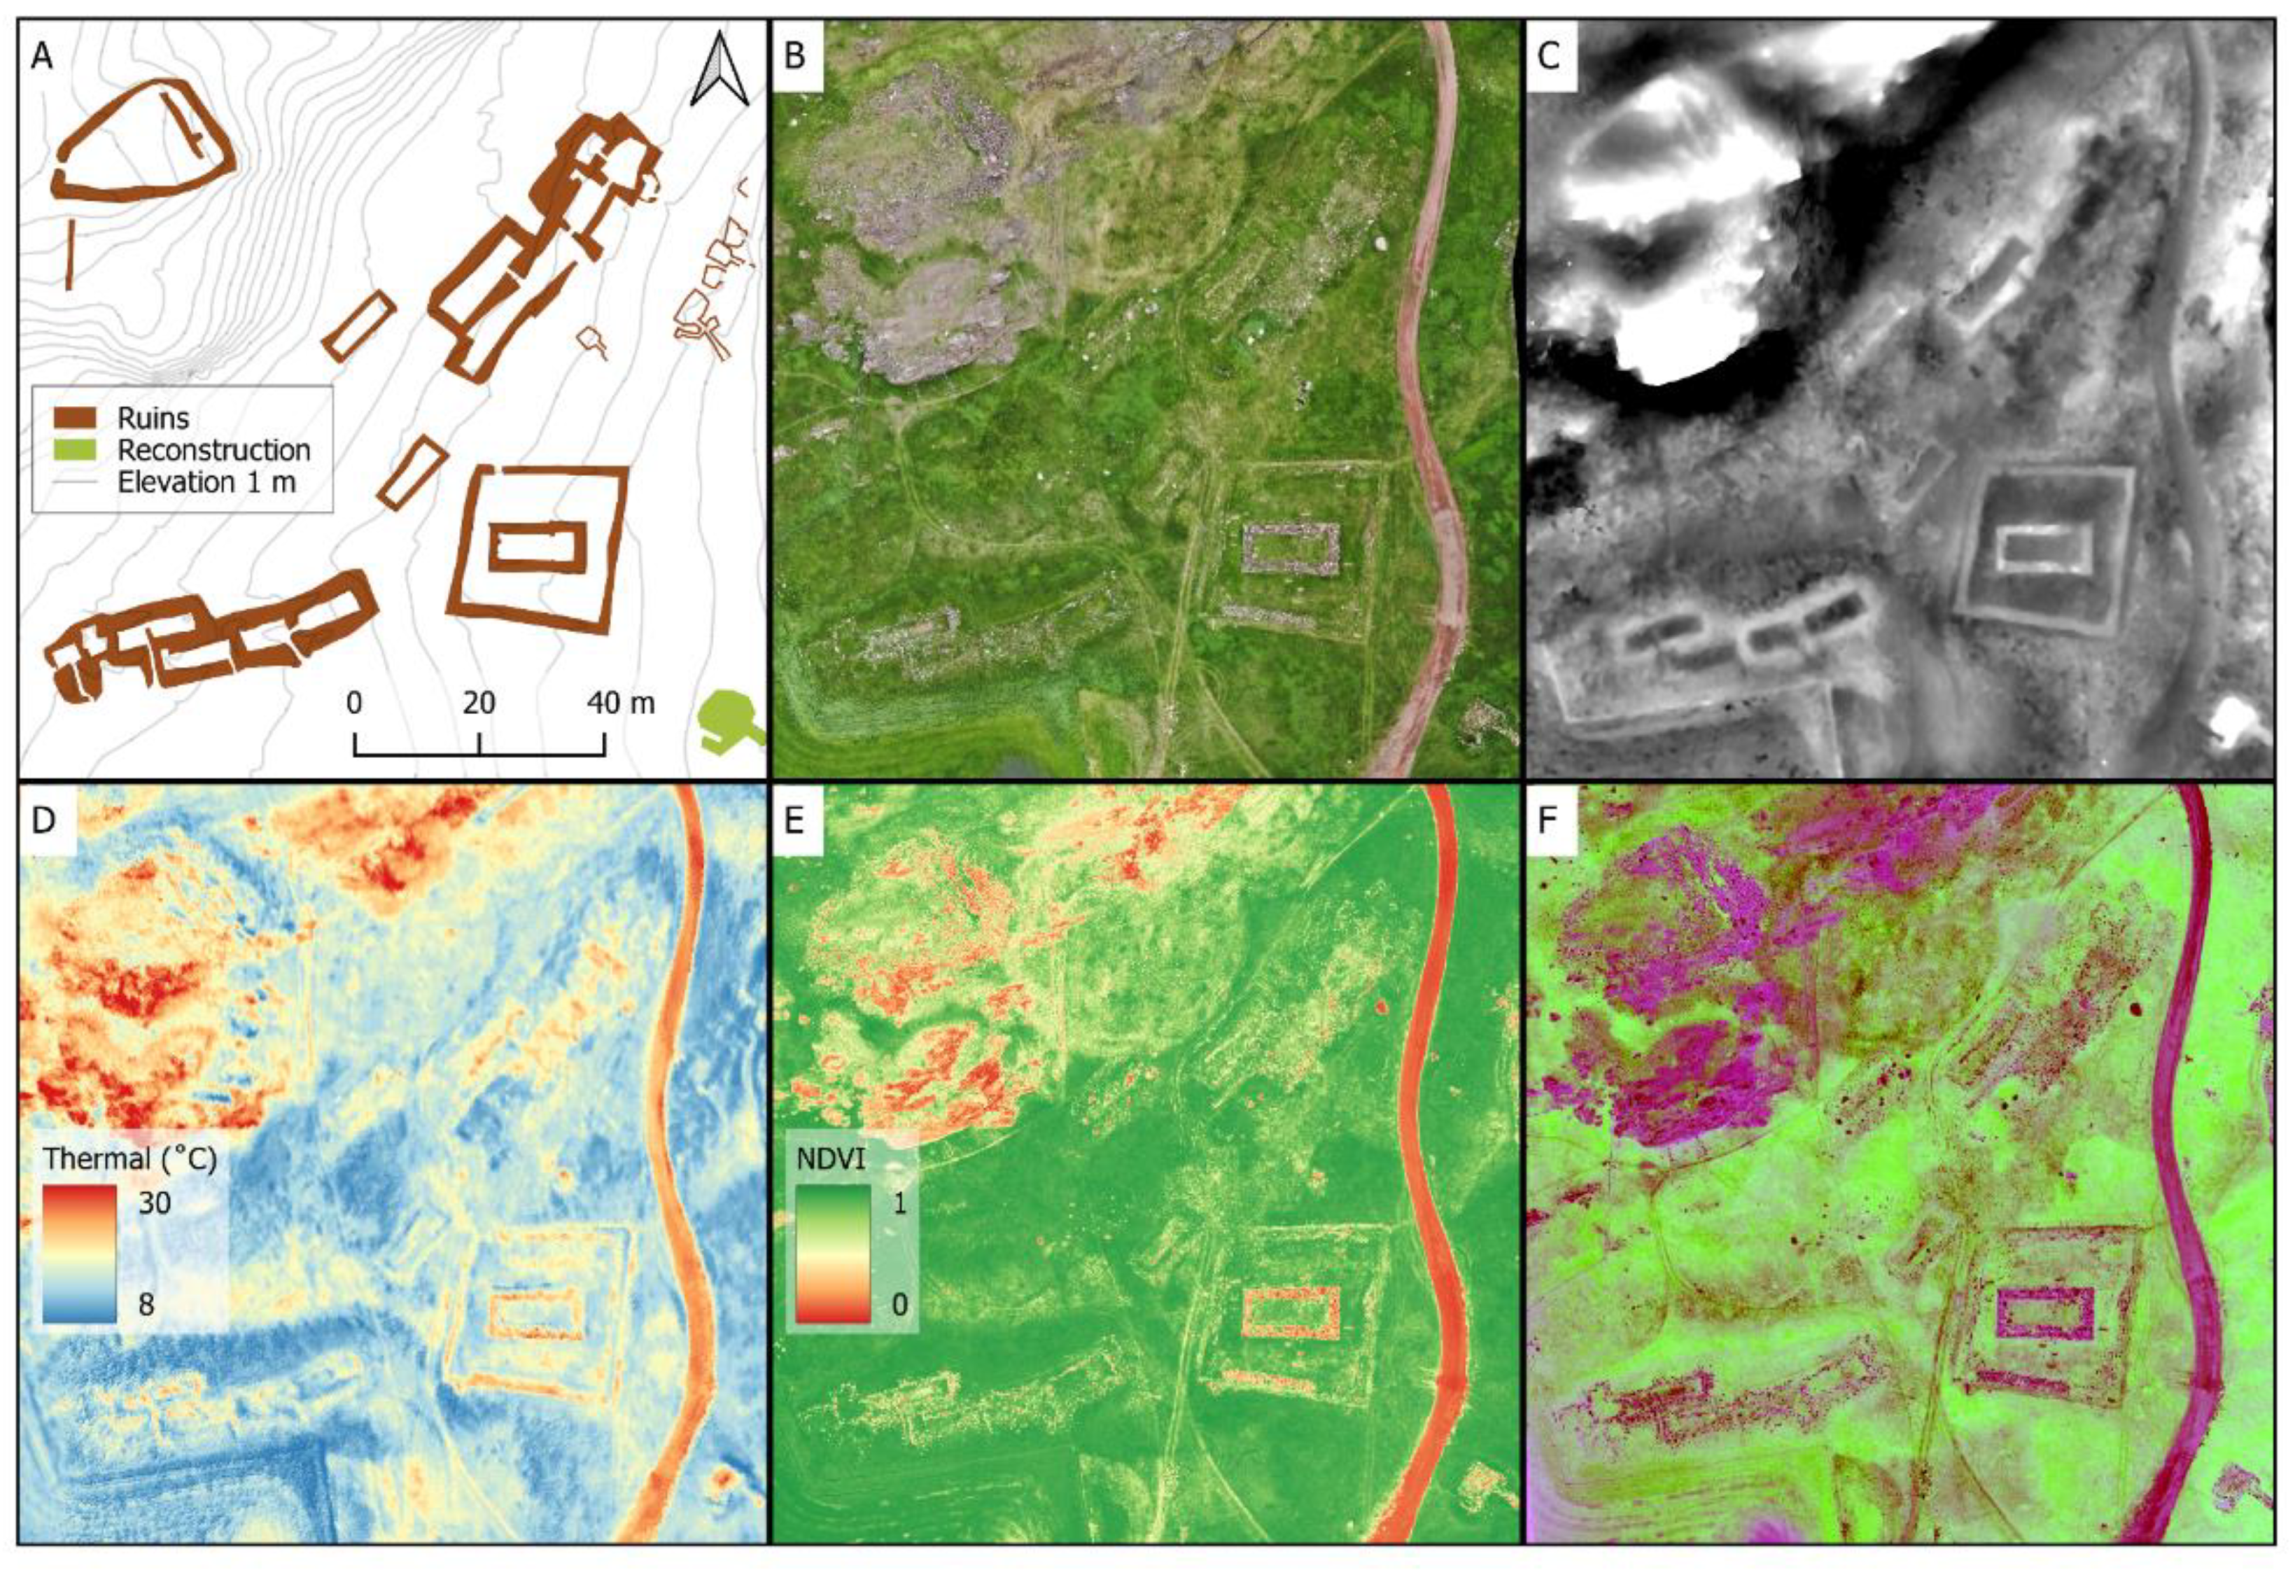
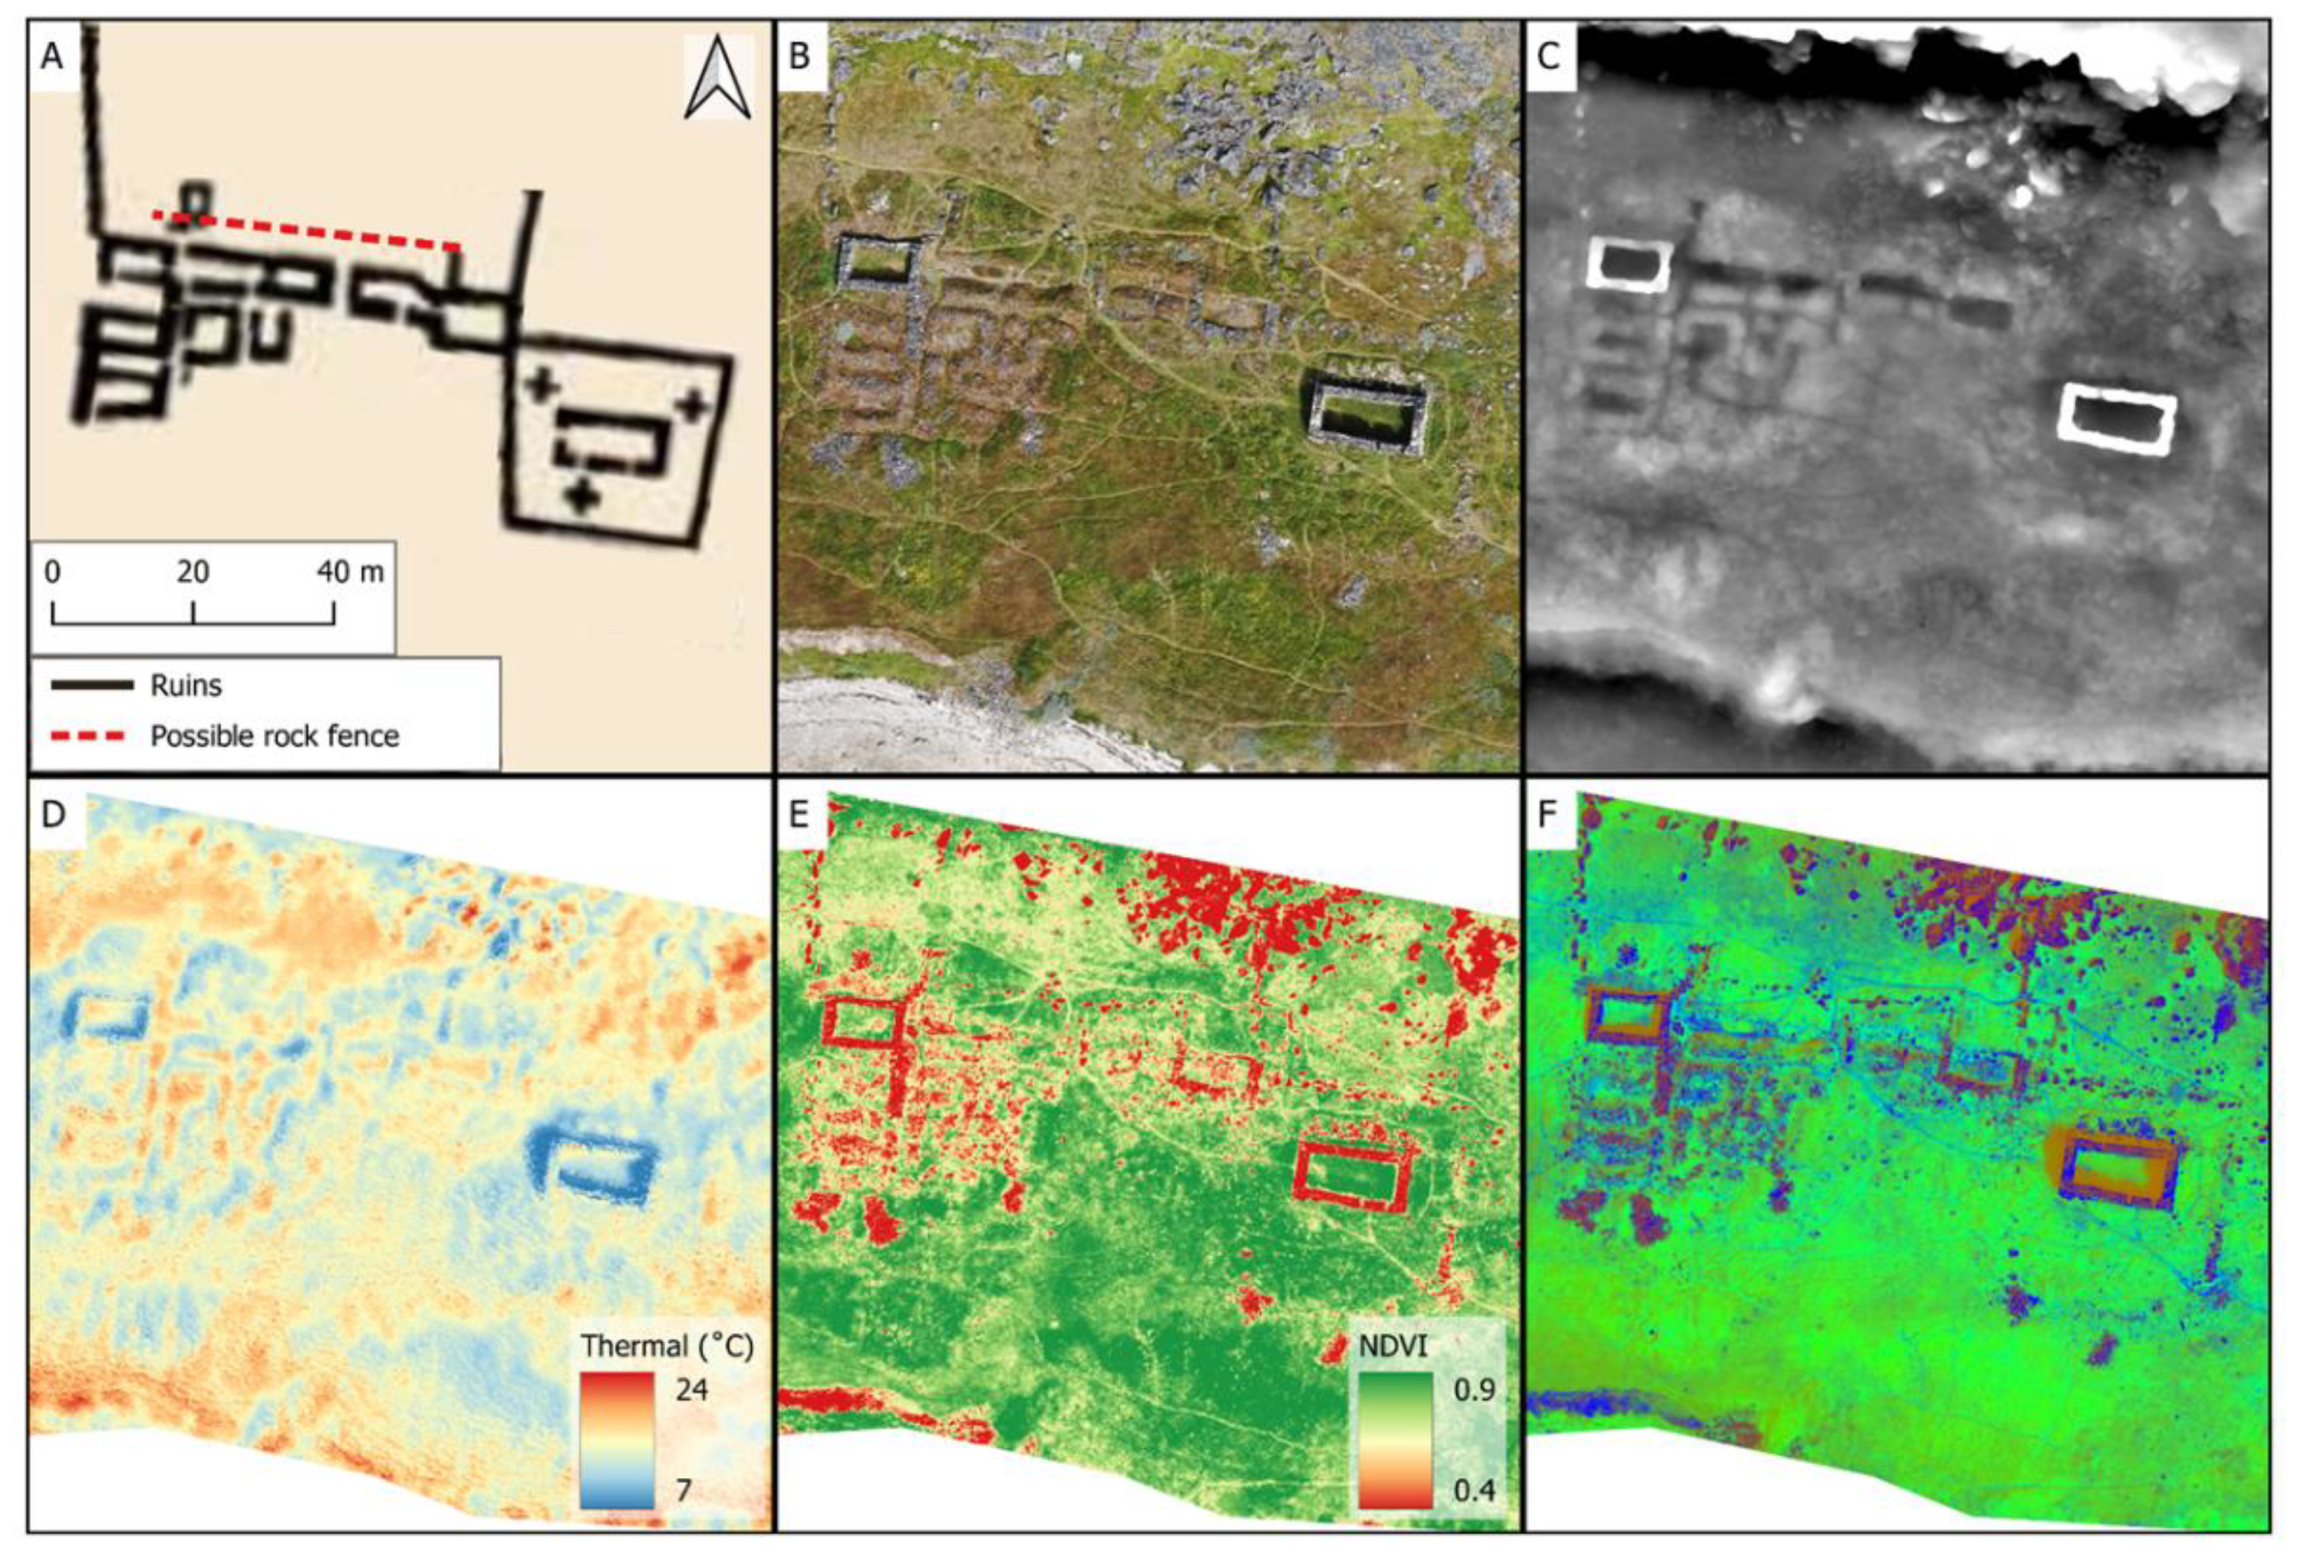
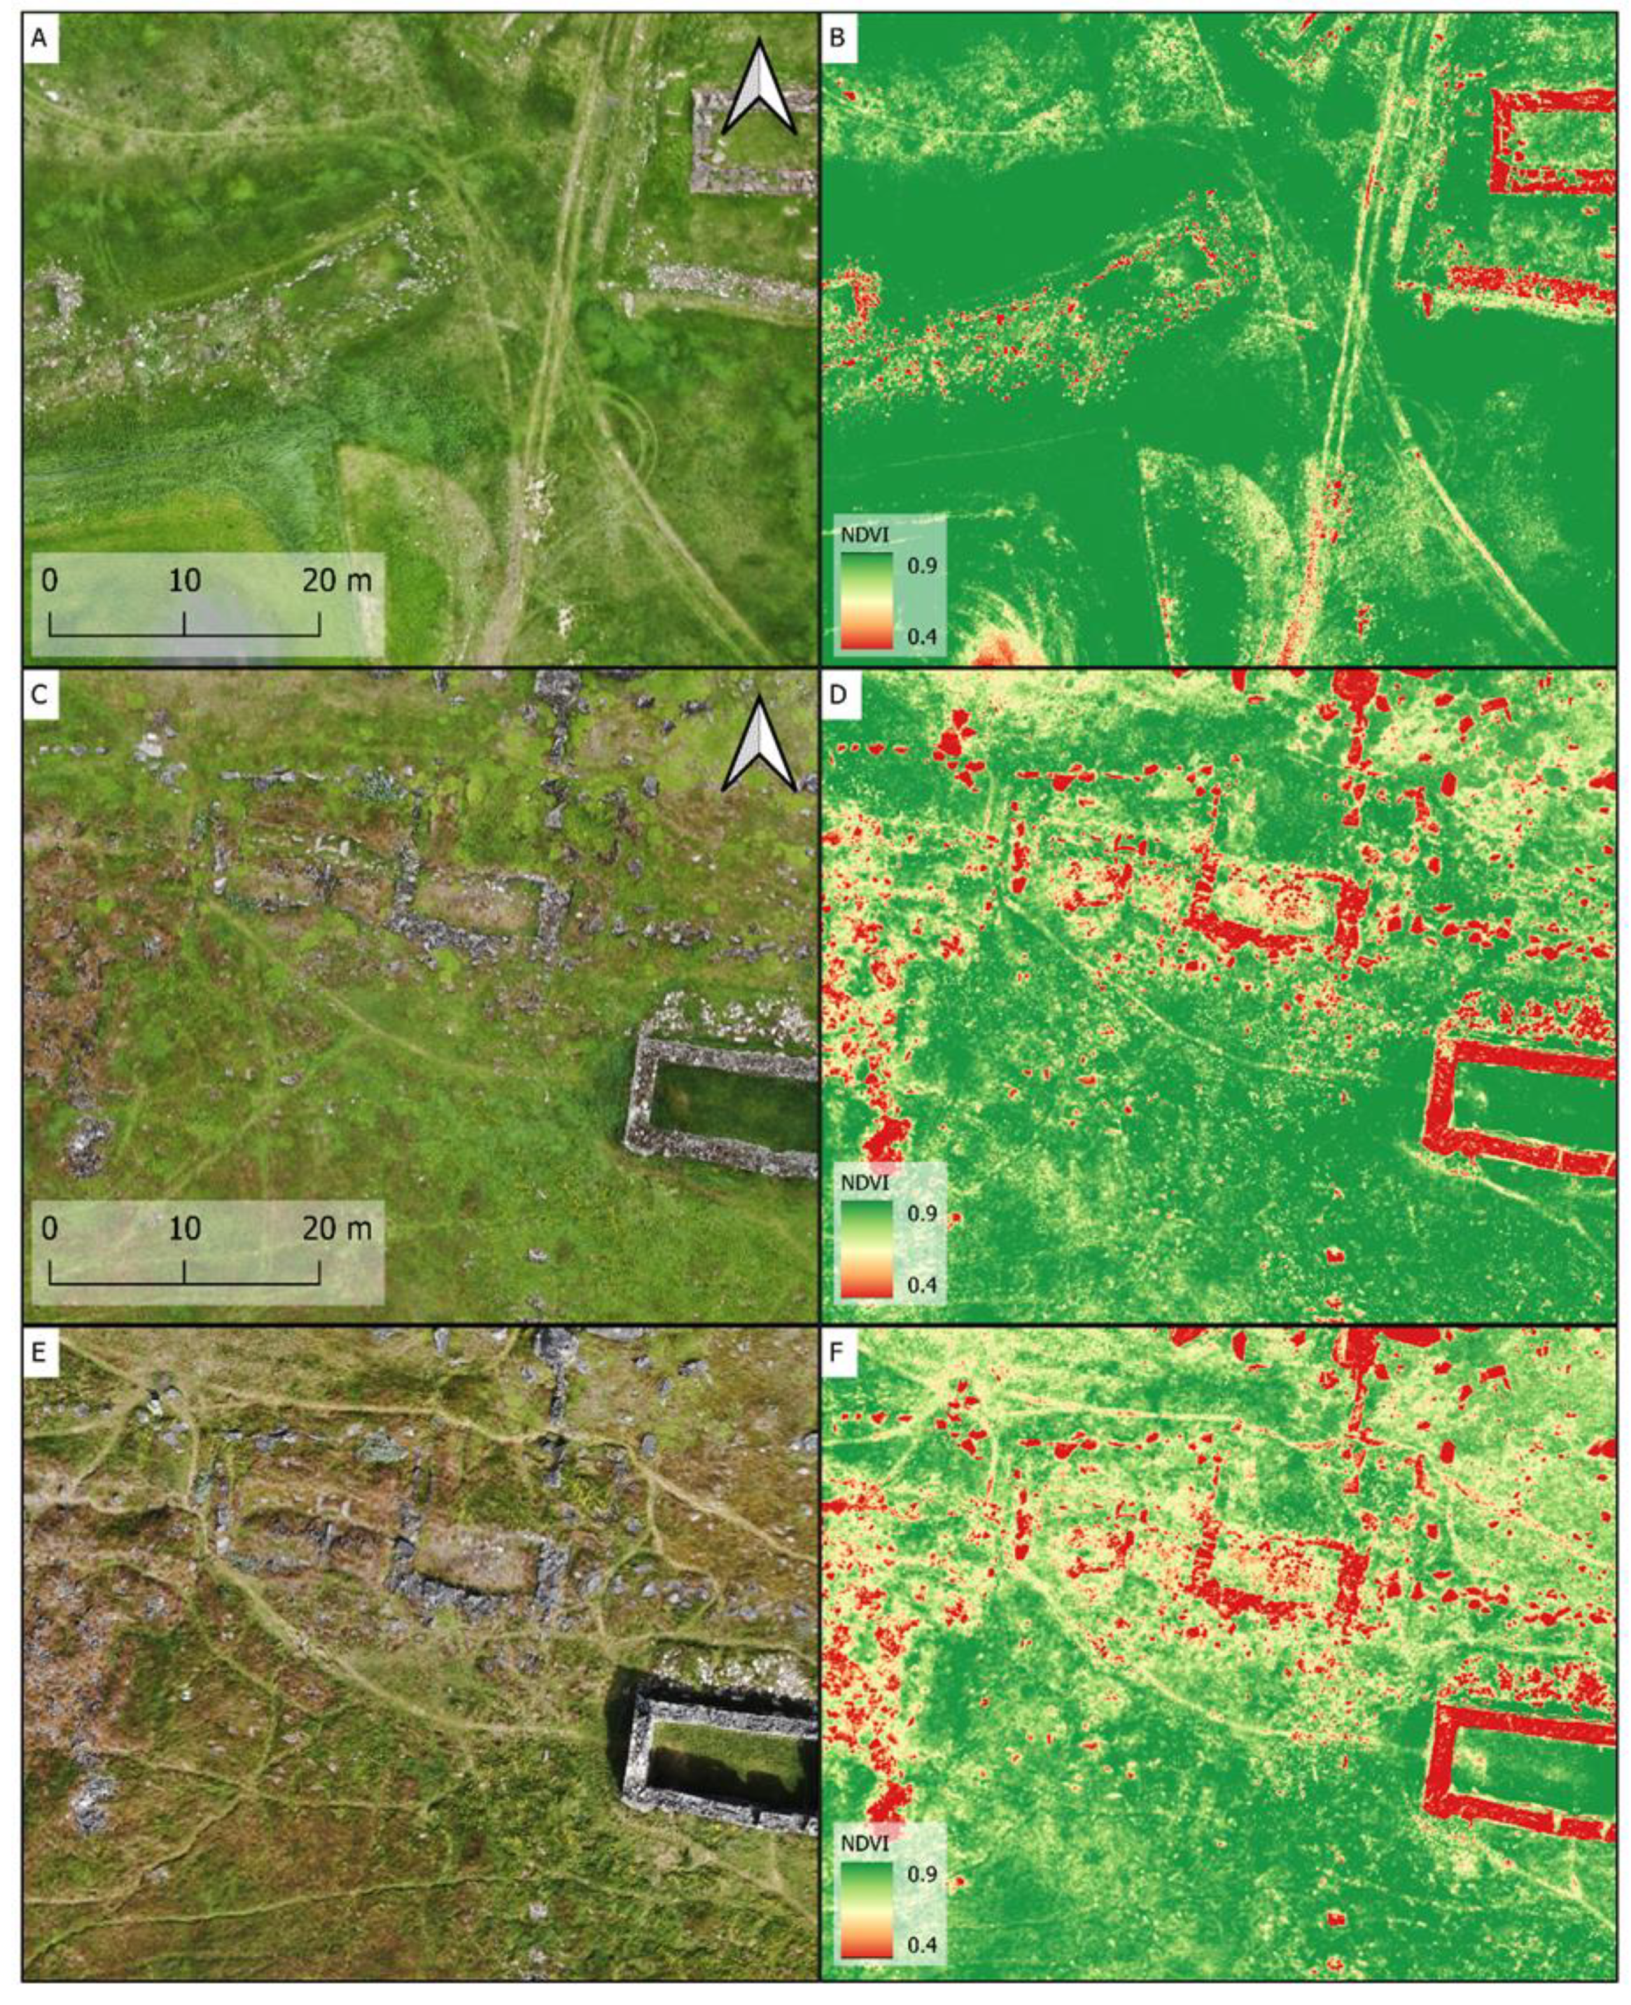
4.1. Mapping Ruins and Structures

Over 5500 registered archaeological sites are scattered throughout Greenland’s ice-free margins. Many of these sites have not been documented properly, and, for sites documented before 2000, the geo-referencing is poor, resulting in high uncertainties in the available spatial data. This lack of suitable “baseline data” limits the possibility of monitoring gradual changes to sites over time. The proliferation of affordable and practically transportable UAVs and new imaging sensors represents an opportunity to improve the spatial accuracy of already documented archaeological sites in Greenland.
Our results showed that it is possible to use a UAV to detect many of the different types of structures found at Qassiarsuk and Qaqortukulooq. Figure 6A and Figure 7A show ruin sketches from previous archaeological investigations at the two sites together with the different types of maps derived from our drone missions. At both sites, the RGB maps revealed many of the structures seen on the sketches, and almost all structures were easily recognized in the MSRM maps. The thermal maps obtained at the two study sites showed that the ruins were clearly recognizable, even though the spatial resolution in the thermal band was much lower than in the optical bands. The information provided by the thermal maps complemented the information from the RGB mosaic and the MSRM but did not contribute any additional information. At Qaqortukulooq, rock fences were visible as linear features in both the NDVI and PCA maps (Figure 7E,F). Most of these fences were also drawn in the sketch, for instance, around the church and in the top, left corner of the map. However, the NDVI and PCA maps also revealed a non-registered linear structure, possibly a rock fence, oriented from east to west just north of the large building compartment (Figure 7A, illustrated with a red, dotted line). This feature was not visible on any of the other drone maps. Whether the found structure was an actual rock fence or just stones piled up during archaeological investigations, performed after the ruin sketch in Figure 7A was drawn, still needs to be examined in the field.
In general, structures were more visible in the late season images taken at Qaqortukulooq on 8 August 2022 compared to those taken in Qassiarsuk from 28–30 July 2021. Although the sites were different and not directly comparable, the NDVI values were generally lower and ancient structures were observed to be less overgrown by vegetation at Qaqortukulooq. This highlights that the timing of drone missions and image acquisition has a great influence on the overall quality of the drone maps. Although vegetation and overgrowth did not have a great influence on the maps created in this study, dense vegetation and overgrowth may be important at other sites in Greenland. This may especially be the case at sites/ruins that have not yet been excavated and, hence, are partly or completely submerged and/or densely covered by vegetation. Under such conditions, it would be interesting to apply technologies such as LIDAR (light detection and ranging) with the ability to map both vegetation surface and the underlying terrain.

4.2. Mapping the Impacts from Human Activity

Accessibility to the Arctic has improved as a direct consequence of increasing seasonal sea ice melt and is expected to drive the development of coastal infrastructure and cruise tourism in many parts of the Circumpolar North in the next decades [43]. In areas that are already accessible by expedition cruise ships such as in south Greenland, tourist visits are anticipated to increase markedly in the coming decades, especially at high-profile sites such as Qassiarsuk and Qaqortukulooq. Tourism is known to be a contributing factor to processes of transformation and decay in cultural heritage [44]. Visitor impacts can be linked to people walking through the archaeological sites, physically disturbing structures and manipulating or removing loose objects lying on the surface. Over time, such activities can irreparably damage or destroy the integrity of cultural heritage features. Therefore, it is important to find a balance among site access, use, and preservation. It has previously been shown that drones equipped with an RGB camera can be used to monitor the wear of vegetation and trail conditions [45].
In this study, we tested the benefits of multispectral data on foot paths. As shown in Figure 6B and Figure 7B, it was possible to visually detect many tracks and paths on the RGB images, whereas only the major paths were visible on the NDVI images (Figure 6E and Figure 7E). This tendency became even clearer when looking more closely at the images (Figure 8) and especially when comparing the images from Qaqortukulooq from 2021 (Figure 8C,D) and 2022 (Figure 8E,F). In 2021, very few tourists visited the site due to COVID-19, whereas, in 2022, tourism was back to normal with many cruise ships in the area. As can be seen on Figure 8, the increase in visitor numbers led to the formation of several new paths in 2022. The RGB images were good at defining the complete variety of paths. However, the NDVI was favorable in separating vegetation from soil; hence, heavily used paths where vegetation was worn away stood out from the vegetated surroundings. This helped in the process of defining areas where the vegetation was heavily damaged from areas where the vegetation can recover. When comparing 2021 with 2022, the vegetation damage from visitors increased in some areas. This was particularly clear in the upper part of the selected area, where a large track was formed. The formation of this track can be linked to the installation of a new interpretive sign overlooking the site. The sign was installed in mid-July 2021 and, since then, most visitors have taken the direct route to read the sign.

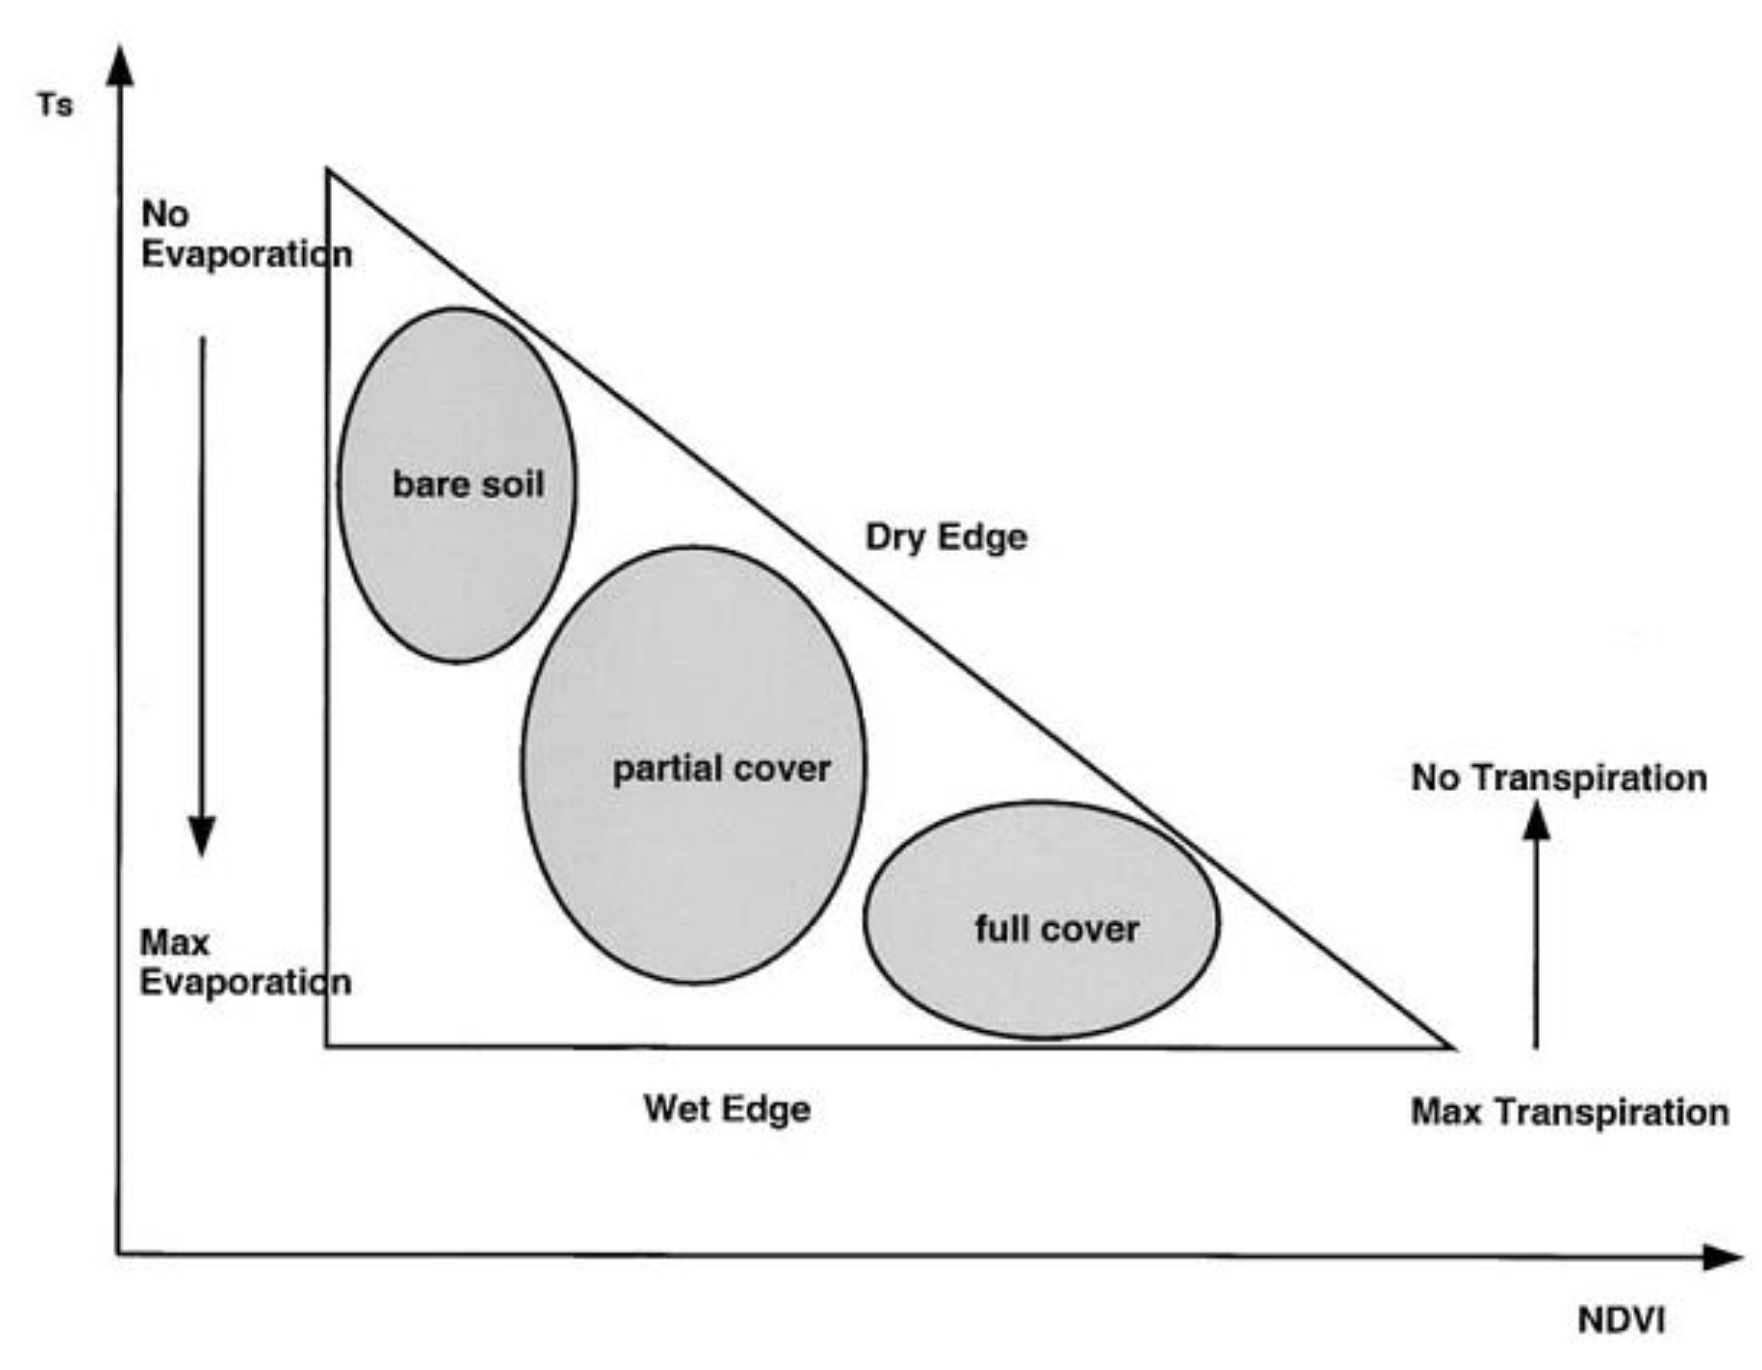
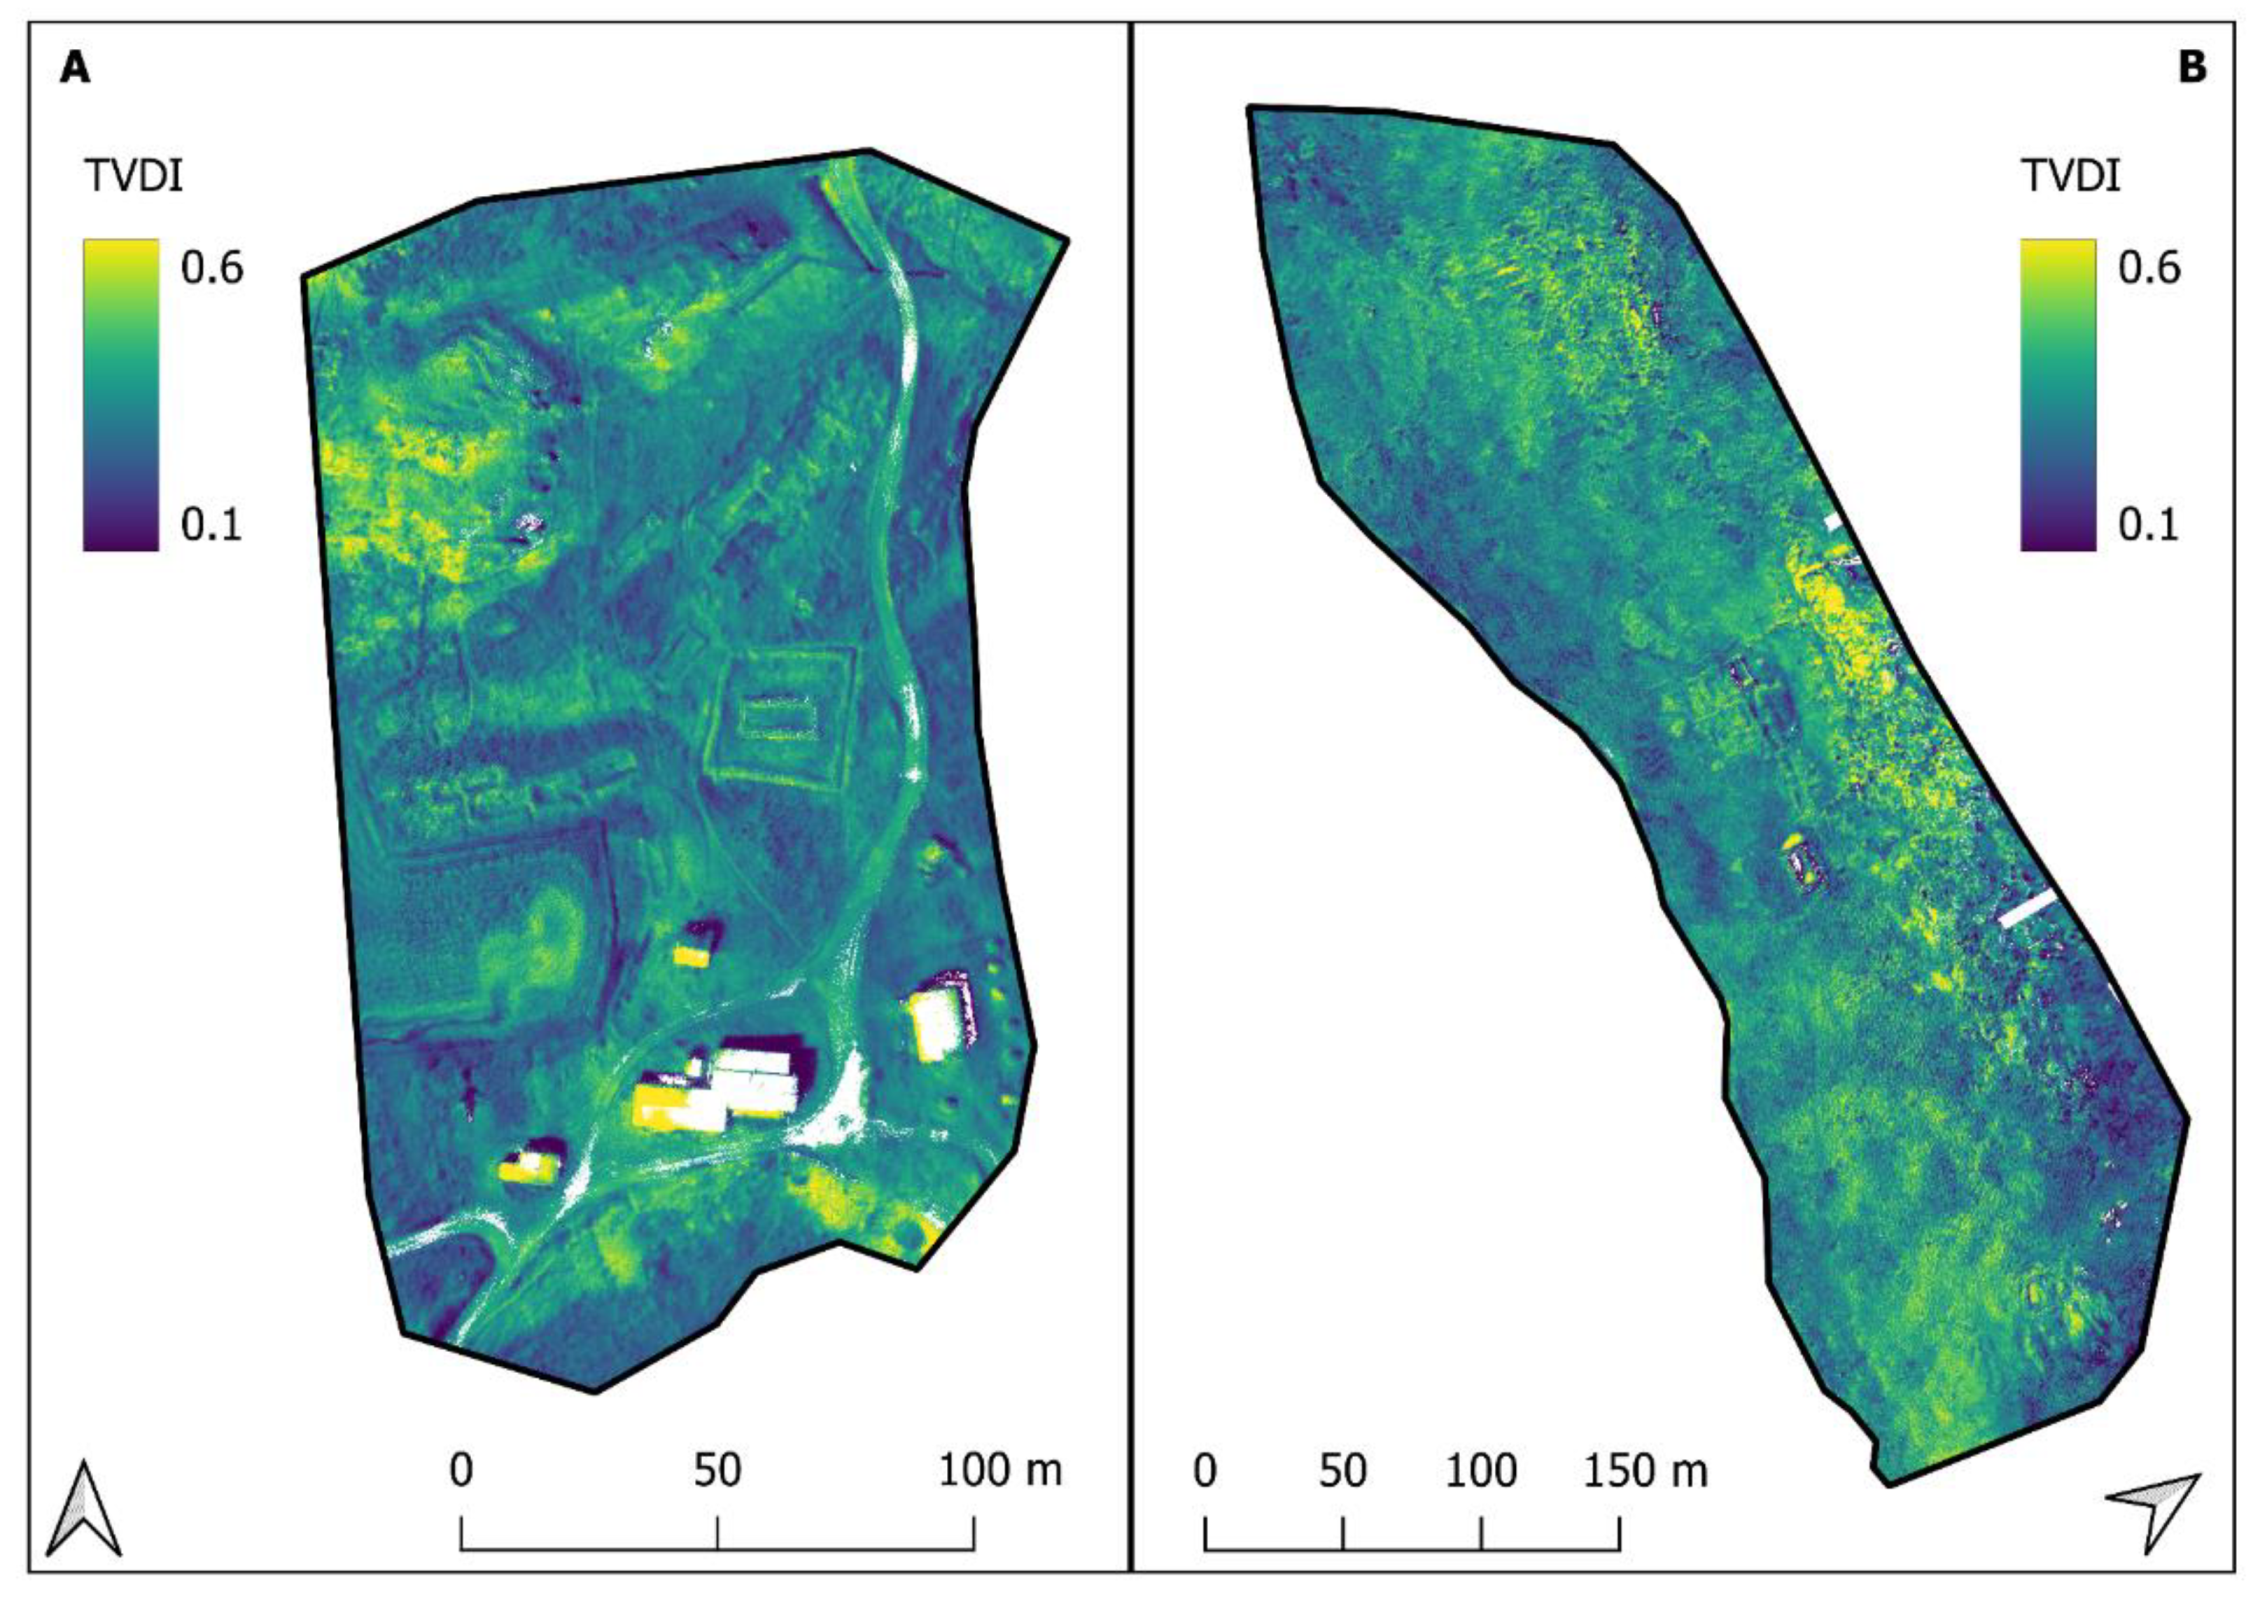
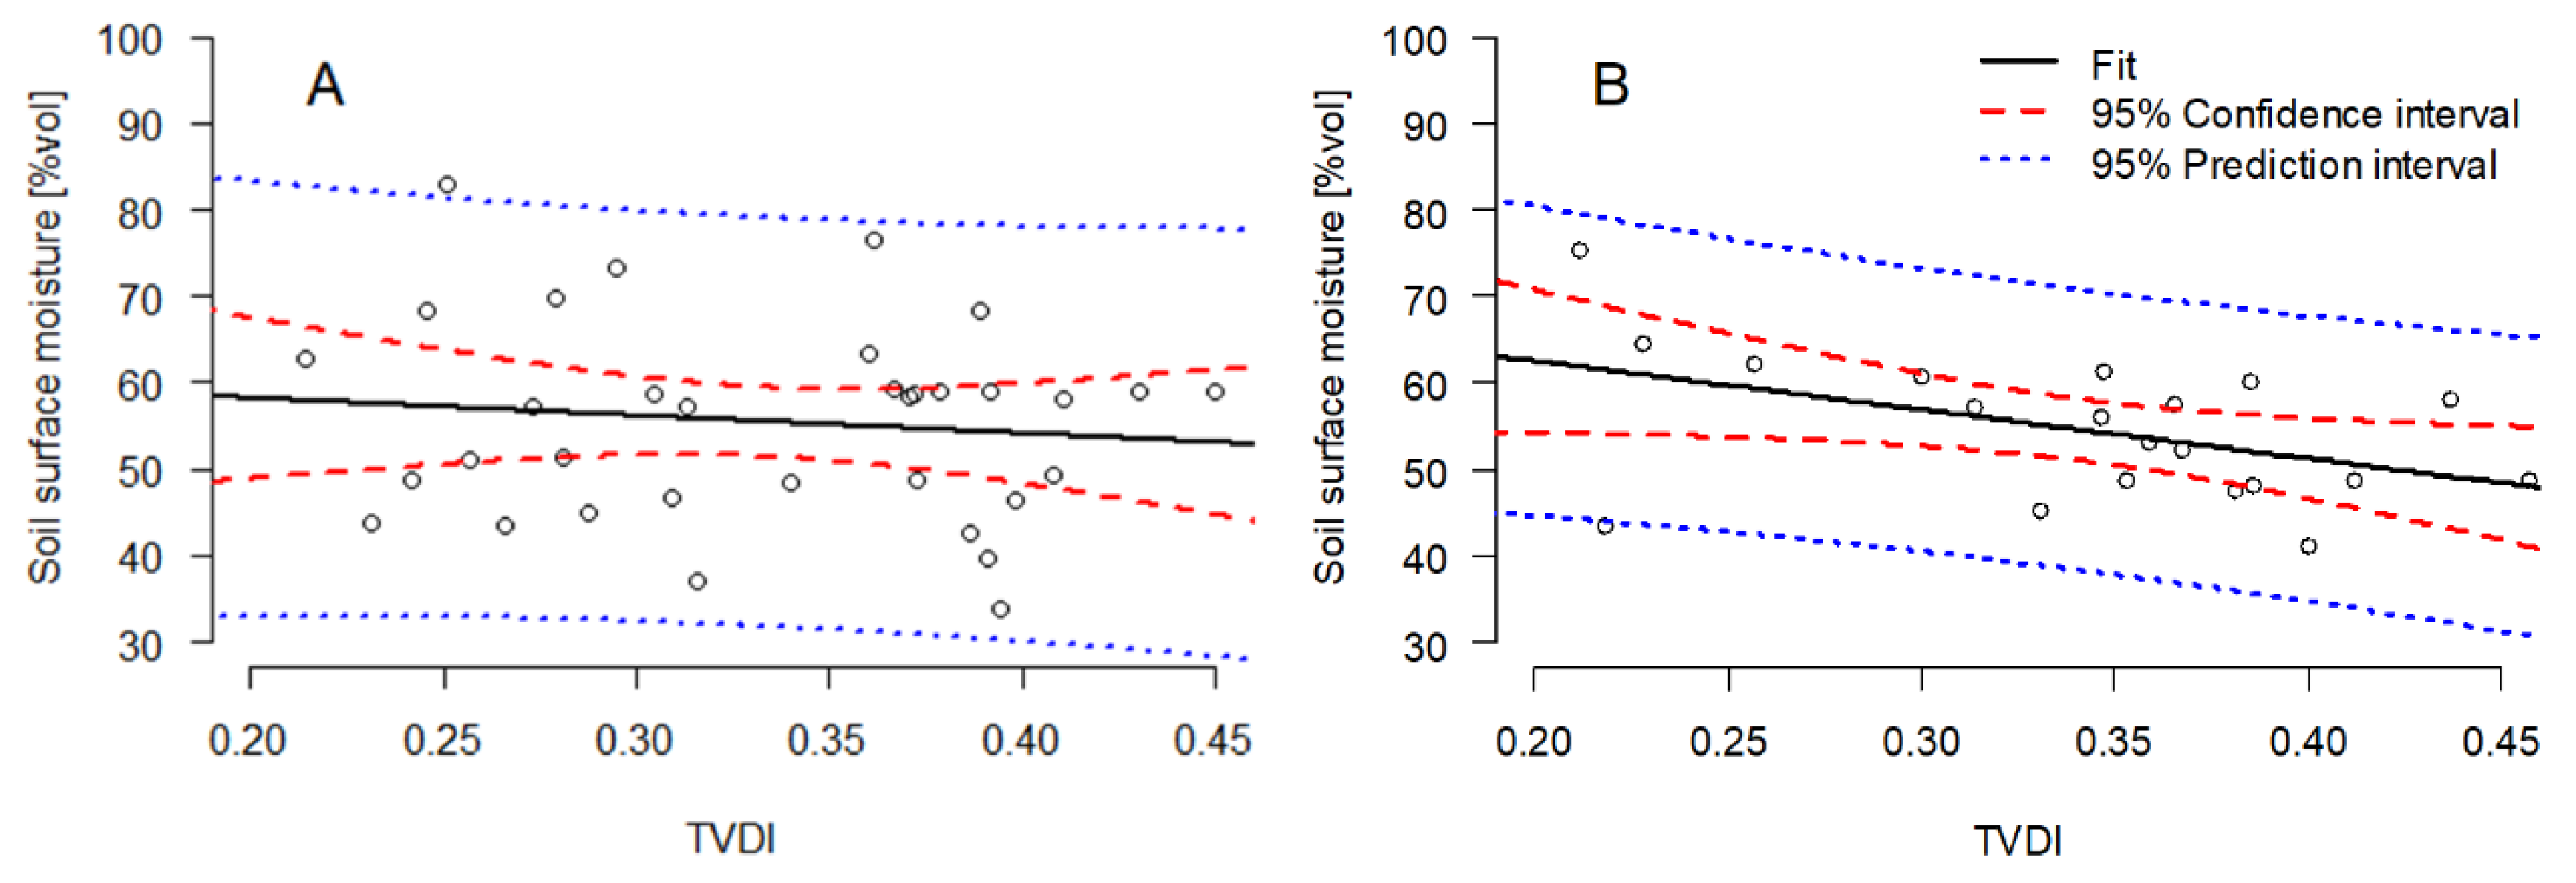
4.3. Soil Water Content

Soil water is a key controlling factor for the degradation of buried archaeological materials as high water content limits the availability of oxygen and the risk for microbial degradation [46,47]. Thus far, the only way to monitor for changes in soil water content in Greenland has been via manual point measurements or via subsurface automatic sensors installed at a single point in the landscape. Consequently, being able to capture high-resolution soil moisture maps via drones would offer a significant improvement in data collection that would make assessments of climate change impacts on archaeological sites much more detailed.
We tested the possibility of mapping surface soil moisture (SSM) at the two study sites according to the method and theory of TVDI. The calculated TVDI maps showed a pronounced difference in TVDI across the two sites (Figure 9). At Qassiarsuk, a marked variation in TVDI was found, primarily due to the abundance of houses, roads, bare rocks, and vegetated areas, whereas at Qaqortukulooq, TVDI was slightly more uniform, with mid to low TVDI values, though with high TVDI values in the rockiest parts of the landscape. At Qassiarsuk, regression analysis between observed SSM and TVDI at the sampling points did not provide any significant correlations between the two variables (Figure 10A) (r = −0.12, p = 0.50, n = 34). At Qaqortukulooq, on the other hand, the correlation was statistically significant (r = 0.47, p = 0.04, n = 20). However, as can be seen from the confidence and prediction intervals for the linear regression, there was a large uncertainty related to the connection between SSM and TVDI (Figure 10B). This means that, although it may be possible to distinguish between dry and wet areas, it was not possible to describe variations in water content within the vegetated archaeological areas. Although the relationship between SSM and δTS/TVDI is well documented [30,31,32,33,34], previous studies were conducted at lower latitudes and in environments with larger variations in both δTS and SSM. At latitudes of appr. 61° N (Kujataa, Greenland), the sun azimuth angle above the horizon is low, even in summer months, resulting in relatively little incoming solar radiation. Hence, the incoming radiation is not controlling the rates of evapotranspiration as dominantly as is observed in lower latitudes. This may allow other variables to have relatively larger effects on the variation in TVDI. The low sun angles also affect the thermal band output as a larger bias from microtopography becomes pronounced. With low sun angels, even at midday, the effect of microtopography leads to shadow-covered areas in the scenes. Hence, large differences in incoming radiation will occur between south- and north-facing surfaces, creating variations in surface temperature. Furthermore, it is difficult to map temperature from a UAV without having some thermal drift within the scene. Although our UAV surveys were conducted over short time intervals of approximately 30 min, the thermal conditions may have varied within this period due to clouds or wind gusts from the cold sea. When calculating the δTS map from two thermal images, the bias from these different factors will be even more pronounced, ultimately leading to discrepancy between the δTS and SSM variables. The two site visits in 2021 and 2022 were carried out during very wet periods. At the same time, vegetation at the sites was dense and without any sign of water stress or drought in the area. Under these conditions, vegetation transpiration is high as water is not a limiting factor, thereby keeping leaf temperature low. Finally, we compared TVDI with SSM from 0–5 cm depth in this study. However, previous studies suggested that the connection between TVDI and soil moisture measurements is highly dependent on the depth of sampling and that the optimal depth for the applicability of TVDI may vary from site to site [48,49].

5. Conclusions and Future Perspectives

In this study, we tested the potential of using RGB, multispectral, and thermal imagery to perform high-resolution site mapping, identify wear on vegetation from human activity, and quantify soil moisture variations. Our results showed that a combination of RGB maps and MSRM maps from DSM orthomosaics offer very good data sets to map ruins and structures in this type of terrain. The thermal band of the multispectral camera did not provide any additional information to the maps, either as a stand-alone image or as a part of a PCA analysis on all bands from the multispectral camera. However, we found some extra features when inspecting the NDVI map created from the multispectral camera. For ruins covered with dense vegetation, ruin identification was difficult, suggesting that it will be worth testing technologies such as LIDAR in future studies. Moreover, the human impacts on the site were distinguishable, making it possible to monitor wear and tear on the vegetation caused by site visitors in the future. Our results showed that combining RGB and NDVI might be the best method to pinpoint and distinguish between areas with temporary and permanent vegetation damage. We also tried to estimate the surface soil moisture based on δTS and TVDI. However, the results were subject to significant uncertainties and, therefore, pointed toward limited applicability of the TVDI method in relation to monitoring soil water variations at archaeological sites under Artic and subarctic conditions.
The results showed the potential of using different types of drone imagery, not just for research applications but also as a management tool to map and monitor archaeological sites in Greenland and the Circumpolar North. However, our investigations also revealed some challenges and concerns. In Greenland, the field season is limited to 2–3 months during the summer (generally June to early September) and, therefore, the window for conducting archaeological fieldwork is short. Being able to map and document site changes without spending too much time and resources at a site is always preferred. Drone surveys may be able to carry out these tasks much more efficiently compared to traditional surveys, but only if suitable flight conditions are met. Throughout our two field campaigns in 2021 and 2022, either unstable weather with large amounts of rain or stable conditions with thick fog in the morning/evening proved to be the greatest challenges. During both visits, we succeeded in acquiring the data for the study. Still, conditions were far from ideal, especially in relation to collecting thermal and multispectral data under stable light conditions. As site visits involve large travel expenses, there is only one way to lower the risk of bad weather and that is by adding a significant time buffer into your plans. The risk of bad weather and the fact that you must be present at each site pose significant limitation to the number of sites that can be monitored using the setup presented here. Other approaches, such as imaging from light aircrafts, could expand the methods’ overall applicability. This is largely a question of resolution and, therefore, it would be interesting to test the resolution requirements for different archaeological purposes in Greenland and the Arctic in general. Currently, the spatial resolution of satellite images is insufficient for most monitoring purposes [14]. However, on a long-time scale high-resolution satellite images may prove to be more applicable than drone recordings, especially when it comes to the continuous monitoring of remote sites. Nevertheless, the current use of drones and development of sensors and methods to map and monitor sites are an important first step towards developing new approaches to collect data at many highly vulnerable archaeological sites in the north. Future work should focus on establishing links between current UAV and satellite remote sensing data.

Supplementary Materials

The following are available online at https://www.mdpi.com/article/10.3390/drones7020115/s1, Figure S1: DeltaTS(ẟTS)(˚C) maps used for NDVI/ẟTS plot for TVDI calculation. (A) Qassiarsuk 2021. (B) Qaqortukulooq 2021. (Notice different ranges of ẟTS between images), Figure S2: NDVI maps used for NDVI/ẟTS plot for TVDI calculation. (A) Qassiarsuk 2021. (B) Qaqortukulooq 2021, Figure S3: Qassiarsuk 2021 TVDI dry- and wet-edge calculation. (A) TVDI calculation area. (B) NDVI/ẟTS scatterplot with pixels (21,923,044 pixels) from TVDI calculation area and dry-edge as a regression line defined by the maximum ẟTS across the NDVI range. Dry-edge: ẟTS = −15.42(NDVI) + 44.64, r = −0.69. Wet-edge: ẟTS = 1.29. (pyTVDI), Figure S4: Qaqortukulooq 2021 TVDI dry- and wet-edge calculation. (A) TVDI calculation area. (B) NDVI/ẟTS plot with pixels (105,928,938 pixels) from TVDI calculation area and dry-edge as a regression line defined by the maximum ẟTS across the NDVI range. Dry-edge: ẟTS = −2.94(NDVI) + 15.90, r = −0.47. Wet-edge: ẟTS = 0.00. (pyTVDI).

Author Contributions

J.H., M.S.J. and H.H. collected data and performed fieldwork activities. M.S.J. carried out the data processing and analyses under the supervision of J.H., J.H. wrote the paper with input from all co-authors. All authors have read and agreed to the published version of the manuscript.

Funding

This research was funded by Carlsberg Foundation, grant number CF18-1106.

Data Availability Statement

The data presented in this study are available on request from the corresponding author.

Acknowledgments

Thanks to the Activating Arctic Heritage Project (AAH) and all project members. A special thanks to Gorka Mendiguren Gonzales.

Conflicts of Interest

The authors declare no conflict of interest.

References

  1. Hollesen, J.; Matthiesen, H.; Møller, A.B.; Westergaard-Nielsen, A.; Elberling, B. Climate change and the loss of organic archaeological deposits in the Arctic. Sci. Rep. 2016, 6, 28690. [Google Scholar] [CrossRef] [PubMed]
  2. Lee, E.J.; Merriwether, D.A.; Kasparov, A.K.; Khartanovich, V.I.; Nikolskiy, P.A.; Shidlovskiy, F.K.; Gromov, A.V.; Chikisheva, T.A.; Chasnyk, V.G.; Timoshin, V.B.; et al. A genetic perspective of prehistoric hunter-gatherers in the Siberian Arctic: Mitochondrial DNA analysis of human remains from 8000years ago. J. Archaeol. Sci. Rep. 2018, 17, 943–949. [Google Scholar] [CrossRef]
  3. Rasmussen, M.; Li, Y.R.; Lindgreen, S.; Pedersen, J.S.; Albrechtsen, A.; Moltke, I.; Metspalu, M.; Metspalu, E.; Kivisild, T.; Gupta, R.; et al. Ancient human genome sequence of an extinct Palaeo-Eskimo. Nature 2010, 463, 757–762. [Google Scholar] [CrossRef] [PubMed]
  4. Pitulko, V.; Nikolskiy, P. Extinction of woolly mammoth in Northeastern Asia and the archaeological record. World Archaeol. 2012, 44, 21–42. [Google Scholar] [CrossRef]
  5. Causey, D.; Corbett, D.G.; LefÈVre, C.; West, D.L.; Savinetsky, A.B.; Kiseleva, N.K.; Khassanov, B.F. The palaeoenvironment of humans and marine birds of the Aleutian Islands: Three millennia of change. Fish. Oceanogr. 2005, 14, 259–276. [Google Scholar] [CrossRef]
  6. Hollesen, J.; Callanan, M.; Dawson, T.; Fenger-Nielsen, R.; Friesen, T.M.; Jensen, A.M.; Markham, A.; Martens, V.V.; Pitulko, V.V.; Rockman, M. Climate change and the deteriorating archaeological and environmental archives of the Arctic. Antiquity 2018, 92, 573–586. [Google Scholar] [CrossRef]
  7. Lantuit, H.; Overduin, P.P.; Couture, N.; Wetterich, S.; Aré, F.; Atkinson, D.; Brown, J.; Cherkashov, G.; Drozdov, D.; Forbes, D.L.; et al. The Arctic Coastal Dynamics Database: A New Classification Scheme and Statistics on Arctic Permafrost Coastlines. Estuaries Coasts 2012, 35, 383–400. [Google Scholar] [CrossRef]
  8. Hollesen, J.; Matthiesen, H.; Fenger-Nielsen, R.; Abermann, J.; Westergaard-Nielsen, A.; Elberling, B. Predicting the loss of organic archaeological deposits at a regional scale in Greenland. Sci. Rep. 2019, 9, 9097. [Google Scholar] [CrossRef] [PubMed]
  9. Myers-Smith, I.H.; Elmendorf, S.C.; Beck, P.S.A.; Wilmking, M.; Hallinger, M.; Blok, D.; Tape, K.D.; Rayback, S.A.; Macias-Fauria, M.; Forbes, B.C.; et al. Climate sensitivity of shrub growth across the tundra biome. Nat. Clim. Change 2015, 5, 887–891. [Google Scholar] [CrossRef]
  10. Epstein, H.E.; Myers-Smith, I.; Walker, D.A. Recent dynamics of arctic and sub-arctic vegetation. Environ. Res. Lett. 2013, 8, 015040. [Google Scholar] [CrossRef] [Green Version]
  11. Fenger-Nielsen, R.; Hollesen, J.; Matthiesen, H.; Andersen, E.A.S.; Westergaard-Nielsen, A.; Harmsen, H.; Michelsen, A.; Elberling, B. Footprints from the past: The influence of past human activities on vegetation and soil across five archaeological sites in Greenland. Sci. Total Environ. 2019, 654, 895–905. [Google Scholar] [CrossRef] [PubMed]
  12. Matthiesen, H.; Fenger-Nielsen, R.; Harmsen, H.; Madsen, C.K.; Hollesen, J. The Impact of Vegetation on Archaeological Sites in the Low Arctic in Light of Climate Change. Arctic 2020, 73, 141–152. [Google Scholar] [CrossRef]
  13. Thuestad, A.E.; Tømmervik, H.; Solbø, S.A. Assessing the impact of human activity on cultural heritage in Svalbard: A remote sensing study of London. Polar J. 2015, 5, 428–445. [Google Scholar] [CrossRef]
  14. Fenger-Nielsen, R.; Elberling, B.; Kroon, A.; Westergaard-Nielsen, A.; Matthiesen, H.; Harmsen, H.; Madsen, C.K.; Stendel, M.; Hollesen, J. Arctic archaeological sites threatened by climate change: A regional multi-threat assessment of sites in south-west Greenland. Archaeometry 2020, 62, 1280–1297. [Google Scholar] [CrossRef]
  15. Kucukkaya, A.G. Photogrammetry and remote sensing in archeology. J. Quant. Spectrosc. Radiat. Transf. 2004, 88, 83–88. [Google Scholar] [CrossRef]
  16. Campana, S. Drones in Archaeology. State-of-the-art and Future Perspectives. Archaeol. Prospect. 2017, 24, 275–296. [Google Scholar] [CrossRef]
  17. Verhoeven, G.J.; Smet, P.F.; Poelman, D.; Vermeulen, F. Spectral Characterization of a Digital Still Camera’s NIR Modification to Enhance Archaeological Observation. IEEE Trans. Geosci. Remote Sens. 2009, 47, 3456–3468. [Google Scholar] [CrossRef]
  18. Agudo, P.U.; Pajas, J.A.; Pérez-Cabello, F.; Redón, J.V.; Lebrón, B.E. The Potential of Drones and Sensors to Enhance Detection of Archaeological Cropmarks: A Comparative Study Between Multi-Spectral and Thermal Imagery. Drones 2018, 2, 29. [Google Scholar]
  19. Candiago, S.; Remondino, F.; De Giglio, M.; Dubbini, M.; Gattelli, M. Evaluating Multispectral Images and Vegetation Indices for Precision Farming Applications from UAV Images. Remote Sens. 2015, 7, 4026–4047. [Google Scholar]
  20. Fawcett, D.; Panigada, C.; Tagliabue, G.; Boschetti, M.; Celesti, M.; Evdokimov, A.; Biriukova, K.; Colombo, R.; Miglietta, F.; Rascher, U.; et al. Multi-Scale Evaluation of Drone-Based Multispectral Surface Reflectance and Vegetation Indices in Operational Conditions. Remote Sens. 2020, 12, 514. [Google Scholar] [CrossRef]
  21. Sonaa, G.; Passoni, D.; Pinto, L.; Pagliari, D.; Masseroni, D.; Ortuani, B.; Facchi, A. Uav Multispectral Survey to Map Soil and Crop for Precision Farming Applications. ISPRS-Int. Arch. Photogramm. Remote Sens. Spat. Inf. Sci. 2016, 41B1, 1023–1029. [Google Scholar] [CrossRef]
  22. Salgado Carmona, J.Á.; Quirós, E.; Mayoral, V.; Charro, C. Assessing the potential of multispectral and thermal UAV imagery from archaeological sites. A case study from the Iron Age hillfort of Villasviejas del Tamuja (Cáceres, Spain). J. Archaeol. Sci. Rep. 2020, 31, 102312. [Google Scholar] [CrossRef]
  23. Casana, J.; Wiewel, A.; Cool, A.; Hill, A.C.; Fisher, K.D.; Laugier, E.J. Archaeological Aerial Thermography in Theory and Practice. Adv. Archaeol. Pract. 2017, 5, 310–327. [Google Scholar] [CrossRef]
  24. Hill, A.C.; Laugier, E.J.; Casana, J. Archaeological Remote Sensing Using Multi-Temporal, Drone-Acquired Thermal and Near Infrared (NIR) Imagery: A Case Study at the Enfield Shaker Village, New Hampshire. Remote Sens. 2020, 12, 690. [Google Scholar]
  25. James, K.; Nichol, C.J.; Wade, T.; Cowley, D.; Gibson Poole, S.; Gray, A.; Gillespie, J. Thermal and Multispectral Remote Sensing for the Detection and Analysis of Archaeologically Induced Crop Stress at a UK Site. Drones 2020, 4, 61. [Google Scholar] [CrossRef]
  26. Pearson, K. LIII. On lines and planes of closest fit to systems of points in space. Lond. Edinb. Dublin Philos. Mag. J. Sci. 1901, 2, 559–572. [Google Scholar] [CrossRef]
  27. Shendryk, Y.; Sofonia, J.; Garrard, R.; Rist, Y.; Skocaj, D.; Thorburn, P. Fine-scale prediction of biomass and leaf nitrogen content in sugarcane using UAV LiDAR and multispectral imaging. Int. J. Appl. Earth Obs. Geoinf. 2020, 92, 102177. [Google Scholar] [CrossRef]
  28. Vésteinsson, O. Kujataa—A Subarctic Farming Landscape in Greenland. A Nomination to UNESCO’s World Heritage List. 2016, p. 265. Available online: https://whc.unesco.org/en/list/1536/documents/ (accessed on 3 February 2023).
  29. Jensen, C.D. Weather Observations from Greenland 1958–2021—Observational Data with Description; Danish Meteorologial Institute: Copenhagen, Denmark, 2022. [Google Scholar]
  30. Paulsen, C.; Church, M.; Simpson, I.; Adderly, P.; Pálsdóttir, A.; McGovern, T.H. Archaeological Excavations at Qassiarsuk 2005–2006 (Field Report); Rafnsson, M., Ed.; Náttúrustofa Vestfjarða, NABO, Grønlands Nationalmuseum & Arkiv: Nuuk, Denmark, 2007. [Google Scholar]
  31. Arneborg, J. SAGA Trails: Brattahlið, Garðar, Hvalsey Fjord’s Church and Herjolfsnes: Four chieftains’ Farmsteads in the Norse Settlements of Greenland; Nanortalik Museum: Nanortalik, Denmark; Narsaq Museum: Narsaq Denmark; Qaqortoq Museum: Qaqortoq, Denmark, 2006. [Google Scholar]
  32. QGIS Team. Geographic Information System. Open Source Geospatial Foundation Project. 2023. Available online: http://qgis.osgeo.org (accessed on 3 February 2023).
  33. Conrad, O.; Bechtel, B.; Bock, M.; Dietrich, H.; Fischer, E.; Gerlitz, L.; Wehberg, J.; Wichmann, V.; Böhner, J. System for Automated Geoscientific Analyses (SAGA) v. 2.1.4. Geosci. Model Dev. 2015, 8, 1991–2007. [Google Scholar] [CrossRef]
  34. Kokalj, Ž.; Somrak, M. Why Not a Single Image? Combining Visualizations to Facilitate Fieldwork and On-Screen Mapping. Remote Sens. 2019, 11, 747. [Google Scholar] [CrossRef]
  35. Orengo, H.A.; Petrie, C.A. Multi-scale relief model (MSRM): A new algorithm for the visualization of subtle topographic change of variable size in digital elevation models. Earth Surf. Process. Landf. 2018, 43, 1361–1369. [Google Scholar] [CrossRef]
  36. Lillesand, T.M.; Kiefer, R.W.; Chipman, J.W. Remote Sensing and Image Interpretation, 7th ed.; Wiley: New York, NY, USA, 2015. [Google Scholar]
  37. Sandholt, I.; Rasmussen, K.; Andersen, J. A simple interpretation of the surface temperature/vegetation index space for assessment of surface moisture status. Remote Sens. Environ. 2002, 79, 213–224. [Google Scholar] [CrossRef]
  38. Stisen, S.; Sandholt, I.; Nørgaard, A.; Fensholt, R.; Eklundh, L. Estimation of diurnal air temperature using MSG SEVIRI data in West Africa. Remote Sens. Environ. 2007, 110, 262–274. [Google Scholar] [CrossRef]
  39. Schmugge, T. Remote Sensing of Surface Soil Moisture. J. Appl. Meteorol. Climatol. 1978, 17, 1549–1557. [Google Scholar] [CrossRef]
  40. Stisen, S.; Sandholt, I.; Nørgaard, A.; Fensholt, R.; Jensen, K.H. Combining the triangle method with thermal inertia to estimate regional evapotranspiration—Applied to MSG-SEVIRI data in the Senegal River basin. Remote Sens. Environ. 2008, 112, 1242–1255. [Google Scholar] [CrossRef]
  41. Carlson, T.N.; Gillies, R.R.; Schmugge, T.J. An interpretation of methodologies for indirect measurement of soil water content. Agric. For. Meteorol. 1995, 77, 191–205. [Google Scholar] [CrossRef]
  42. Nieto, H.; Guzinski, R.; Sandholdt, I. pyTVDI. 2016. Available online: https://github.com/hectornieto/pyTVDI (accessed on 3 February 2023).
  43. Shijin, W.; Yaqiong, M.; Xueyan, Z.; Jia, X. Polar tourism and environment change: Opportunity, impact and adaptation. Polar Sci. 2020, 25, 100544. [Google Scholar] [CrossRef]
  44. Markham, A.; Osipova, E.; Lafrenz Samuels, K.; Caldas, A. World Heritage and Tourism in a Changing Climate; IUCN: Paris, France, 2016. [Google Scholar]
  45. Ancin-Murguzur, F.J.; Munoz, L.; Monz, C.; Hausner, V.H. Drones as a tool to monitor human impacts and vegetation changes in parks and protected areas. Remote Sens. Ecol. Conserv. 2020, 6, 105–113. [Google Scholar] [CrossRef]
  46. Hollesen, J.; Matthiesen, H. The Influence of Soil Moisture, Temperature and Oxygen on the Oxic Decay of Organic Archaeological Deposits. Archaeometry 2015, 57, 362–377. [Google Scholar] [CrossRef]
  47. Matthiesen, H.; Hollesen, J.; Dunlop, R.; Seither, A.; de Beer, J. In situ Measurements of Oxygen Dynamics in Unsaturated Archaeological Deposits. Archaeometry 2015, 57, 1078–1094. [Google Scholar] [CrossRef]
  48. Chen, J.; Wang, C.; Jiang, H.; Mao, L.; Yu, Z. Estimating soil moisture using Temperature–Vegetation Dryness Index (TVDI) in the Huang-huai-hai (HHH) plain. Int. J. Remote Sens. 2011, 32, 1165–1177. [Google Scholar] [CrossRef]
  49. Zhao, H.; Li, Y.; Chen, X.; Wang, H.; Yao, N.; Liu, F. Monitoring monthly soil moisture conditions in China with temperature vegetation dryness indexes based on an enhanced vegetation index and normalized difference vegetation index. Theor. Appl. Climatol. 2021, 143, 159–176. [Google Scholar] [CrossRef]
Figure 1. (A) The study region and the location of Narsarsuaq (1), Qassiarsuk (2), Qaqortukulooq (3), and Qaqortoq (4). Landsat image courtesy of the U.S. Geological Survey. (B) Average monthly values of air temperatures (points) and precipitation (bars) for the period 1990-2020 at two official meteorological stations located in Qaqortoq (grey) and Narsarsuaq (black) [29].
Drones 07 00115 g001
Figure 2. (A) Qassiarsuk, with the locations of study areas. [28]. Background image from Asiaq, Greenland Survey (2019). (B,C) Photos of the study site and the landscape at Quassiarsuk. Photo: © J. Hollesen (2021).
Drones 07 00115 g002
Figure 3. (A) Qaqortukulooq, with the locations of study areas. Background image from Google (Maxar Technologies, 2012). (B,C) Photos of the study site and the landscape at Qaqortukulooq. © J. Hollesen (2021).
Drones 07 00115 g003
Figure 4. Triangle conceptual scheme (Reproduktion of Sandholt et al. [37]).
Drones 07 00115 g004
Figure 5. Soil moisture content was measured in 0–5 cm depth at Qassiarsuk (A) and Qaqortukulooq in 2021 (B). Measuring points (white dots) were selected and distributed in the field according to site area size and topography and to cover variation in vegetation cover and plant species’ distribution.
Drones 07 00115 g005
Figure 6. Qassiarsuk. Comparison of mapping potentials of different maps. (A) Map of structures from the 2005–2006 investigations [30], (B) RGB map 2021, (C) DSM MSRM map 2021, (D) thermal (°C) map 2021, (E) NDVI map 2021, (F) PCA map 2021.
Drones 07 00115 g006
Figure 7. Qaqortukulooq. Comparison of mapping potentials of different maps. (A) Map of structures (after Knud J. Krogh 1982) [31], (B) RGB map 2022, (C) DSM MSRM map 2022, (D) thermal (°C) map 2021, (E) NDVI map 2022, (F) PCA map 2022.
Drones 07 00115 g007
Figure 8. Wear of vegetation and trail conditions at Qassiarsuk in 2021 (A,B) and at Qaqortukulooq in 2021 (C,D) and in 2022 (E,F). The left side of the figure shows RGB images and the right shows NDVI images.
Drones 07 00115 g008
Figure 9. Temperature Vegetation Dryness Index (TVDI) maps of Qassiarsuk 2021 (A) and Qaqortukulooq 2021 (B). Theoretically, values closer to 1 indicate dry areas and values closer to 0 indicate wet areas.
Drones 07 00115 g009
Figure 10. Regression analysis between TVDI and on-site SSM measurements (circles) at Qassiarsuk (A) and Qaqortukulooq (B).
Drones 07 00115 g010
Table 1. Overview of the flights carried out at the two study sites.
LocationDateTimeCameraDerived MapsStudy RelevanceAlt. (m)Pixel Size (cm)
(Thermal)
Weather
Qassiarsuk28 July 202115.00Zenmouse H20RGB, DSMMapping structures, Mapping human impact, High precision GCP reference752.6Cloudy
Qassiarsuk29 July 202108.30MicaSense AltumThermal, NDVI, PCAMapping structures,
Mapping human impact, Mapping SSM
602.6
(40.0)
Sunny/clouds
Qassiarsuk29 July 202112.30MicaSense AltumThermal, NDVIMapping SSM602.6
(40.0)
Sunny/clouds
Qaqortukulooq4 August 202117.30Zenmouse H20RGBMapping human impact, High precision GCP reference752.6Cloudy
Qaqortukulooq6 August 202110.30MicaSense AltumThermalMapping SSM602.6
(40.0)
Sunny, clear sky
Qaqortukulooq6 August 202113.30MicaSense AltumThermal,
NDVI
Mapping human impact, Mapping SSM602.6
(40.0)
Sunny, clear sky
Qaqortukulooq8 August 202213.00MicaSense AltumThermal, NDVI, PCAMapping structures,
Mapping human impact
602.6
(40.0)
Sunny/clouds
Qaqortukulooq8 August 202216.00Zenmouse H20RGB, DSMMapping structures,
Mapping human impact, High precision GCP reference
752.6Sunny, clear sky
Disclaimer/Publisher’s Note: The statements, opinions and data contained in all publications are solely those of the individual author(s) and contributor(s) and not of MDPI and/or the editor(s). MDPI and/or the editor(s) disclaim responsibility for any injury to people or property resulting from any ideas, methods, instructions or products referred to in the content.

