

Texture Analysis to Enhance Drone-Based Multi-Modal Inspection of Structures
by
 , , , , and
Parham Nooralishahi
1,*,† ,
,
Gabriel Ramos
2,†,
Sandra Pozzer
1 ,
,
Clemente Ibarra-Castanedo
1 ,
,
Fernando Lopez
3 and
Xavier P. V. Maldague
1 1
Department of Electrical and Computer Engineering, Université Laval, Québec, QC G1V 0A6, Canada
2
Department of Computer Science and Software Engineering, Université Laval, Québec, QC G1V 0A6, Canada
3
TORNGATS, 5635 Rue Rideau, Quebec City, QC G2E 5V9, Canada
*
Author to whom correspondence should be addressed.
†
These authors contributed equally to this work.
Drones 2022, 6(12), 407; https://doi.org/10.3390/drones6120407
Submission received: 4 October 2022
/
Revised: 25 November 2022
/
Accepted: 8 December 2022
/
Published: 11 December 2022
Abstract
:The drone-based multi-modal inspection of industrial structures is a relatively new field of research gaining interest among companies. Multi-modal inspection can significantly enhance data analysis and provide a more accurate assessment of the components’ operability and structural integrity, which can assist in avoiding data misinterpretation and providing a more comprehensive evaluation, which is one of the NDT4.0 objectives. This paper investigates the use of coupled thermal and visible images to enhance abnormality detection accuracy in drone-based multi-modal inspections. Four use cases are presented, introducing novel process pipelines for enhancing defect detection in different scenarios. The first use case presents a process pipeline to enhance the feature visibility on visible images using thermal images in pavement crack detection. The second use case proposes an abnormality classification method for surface and subsurface defects using both modalities and texture segmentation for piping inspections. The third use case introduces a process pipeline for road inspection using both modalities. A texture segmentation method is proposed to extract the pavement regions in thermal and visible images. Further, the combination of both modalities is used to detect surface and subsurface defects. The texture segmentation approach is employed for bridge inspection in the fourth use case to extract concrete surfaces in both modalities.
1. Introduction
The predictive maintenance of multiple operational assets is one of the responsibilities of infrastructure stakeholders. Regular inspections are mandatory for assessing and preserving the serviceability and safety of components. The lack of effective communication, execution, or interpretation of inspection procedures in large infrastructures can be the cause of terrible incidents, as was the case of the Grenfell Tower fire [1] in London in 2017 and the Deepwater Horizon oil spill [2] in the Gulf of Mexico in 2010. In the first case [1], the external cladding system installed during the building renovation was not compliant with the building regulations in place. The system irregularities may not have been recognized and communicated effectively across the risk management organization and contributed to the combustion process during the fire event. In the oil spill incident [2], operator and contractor personnel misinterpreted a test to assess the integrity of a cement barrier, which triggered a series of events that led to the rig’s explosion, with the massive release of 4 million barrels of hydrocarbons into the ocean. Besides the enormous environmental and financial damages, these catastrophic accidents have the immeasurable cost of human lives. Therefore, regular and efficient inspections of industrial and construction components are essential activities to avoid severe hazards and tragic failures.
Conventionally, the implementation of inspection tasks and the analysis of inspection data rely primarily on human assessment [3,4,5]. However, modern industries demand alternative approaches that can improve the current practices and provide well-timed, safe, systematic, and accurate inspection performance for the large inventory of existing industrial and construction components. In this scenario, aerial platforms can benefit the non-destructive test (NDT) of structures by increasing time efficiency, data consistency, and safety [6,7,8]. Remote inspection using aerial platforms is one of the most beneficial solutions to replace conventional methods. Drone-based inspection can solve challenges such as limited physical access and inspection time and provide new ways to conduct more advanced inspections. As a result, many studies focus on presenting aerial platforms and drone payloads for various industrial inspections [9,10,11,12,13].
With the rise of interest in implementing NDT4.0 in various industries, companies are motivated to invest in finding alternative solutions to reduce the time and cost of inspection and advance assessment and analysis procedures. Processing pipelines for analyzing data acquired during an inspection can benefit from automation to: (a) improve performance, (b) decrease the time of analysis, (c) minimize possible human errors, and (d) increase the quality of the results. Accordingly, these benefits for thedata analysis of industrial inspections have motivated many studies to focus on developing automated process pipelines in recent years [14,15]. Achieving more accurate, time- and cost-efficient solutions can be endorsed by automating repetitive tasks during analysis. More than that, state-of-the-art computational techniques can be used and explored to advance the identification and interpretation of patterns in NDT test results [16,17].
Multi-modal systems use multiple sensors for data acquisition and processing. The combination of multi-modal systems and aerial platforms can be employed to inspect large and complex structures. Multi-modal platforms can effectively cover the weaknesses of individual sensors and provide complementary information from coupling imaging sensors, especially for drone-based inspection [18,19,20]. Such systems can significantly assist inspectors during the acquisition and analysis process for possible maintenance. Furthermore, some scenarios require comprehensive information about the specimen’s geometry and texture to detect and characterize defects. Coupled thermal and visible sensors are one type of multi-modal system that can greatly improve the thermographic inspection of industrial and construction infrastructures. For instance, Lee et al. employed coupled thermal and visible sensors in a multi-modal system for solar panel inspection [21]. Coupled thermal and visible cameras can be employed to enhance the data analysis of acquired data during an inspection.
This research explores new avenues for employing coupled thermal and visible cameras to enhance abnormality detection and provide a more comprehensive data analysis in the drone-based inspection of industrial components. This study uses four case studies to thoroughly describe the targeted challenges as well as proposed solutions using multi-modal data processing.
The first case study focuses on the adverse effect of low illumination and contrast, as well as shadows, on the automatic visual inspection of paved roads. Further, it proposes a method for the automatic crack detection of paved roads using coupled thermal and visible images, which successfully addresses the challenge of the explained visible camera’s vulnerability. The introduced method uses the fusion of thermal and visible modalities to enhance the visibility of visual features in areas affected by shadows, low illumination, or contrast. Furthermore, the method includes a deep learning-based crack detection method using the fused image to detect cracks on pavement surfaces. Finally, the case study presents the proposed method’s effectiveness and reliability based on the experiment conducted in an experimental road inside the Montmorency Forest Laboratory of Université Laval.
The second case study explains the issue of possible data misinterpretation in the remote thermographic inspection of piping systems, where distinguishing between surface and subsurface defects is challenging. It proposes a method using coupled thermal and visible images to detect and classify the possible abnormalities in a piping setup. The introduced method individually segments pre-aligned thermal and visible images based on local texture. Later, the extracted regions are compared and used to classify them into surface and subsurface defects. The proposed method is evaluated using an experiment on an indoor piping setup.
The third and fourth case studies focus on using texture segmentation to enhance the analysis of drone-based industrial and construction infrastructure inspection. A deep learning-based texture segmentation method is introduced. The main idea is to use the proposed texture segmentation method on visible images to extract the regions of interest in both thermal and visible images for further analysis. Additionally, two experiments are conducted to evaluate the presented approaches. The third case study uses the presented approach for drone-based multi-modal pavement inspection. Additionally, the fourth case study investigates the use of the presented method for drone-based multi-modal bridge inspection. In this case study, the texture segmentation method is used to extract concrete components.
The structure of this paper is presented as follows. Section 2 provides a brief description of key concepts and a review of the literature related to the drone-based multi-modal inspection of structures and texture analysis. The introduced method for texture segmentation is explained in Section 3. Lastly, Section 4 describes the four case studies, and Section 5 presents and discusses the results obtained from our experiments.
2. Literature Review
2.1. Multi-Modal Inspection of Industrial and Construction Components Using Drones
Unmanned aerial vehicles (UAVs) can be remotely guided near inspection areas that would be difficult, dangerous, or inaccessible for human assessment [22]. Due to the contemporary expansion of remote device usage, drones’ setup capability has been constantly improved, and commercial drones can fly with more than one sensor and collect multi-modal data for nondestructive inspection. Figure 1 shows an example of a visual inspection being conducted using a drone equipped with multi-modal cameras. Even if a traditional hands-on inspection cannot be fully substituted, remote inspections with drones can assist the inspection management team in assigning the physical work where it is indispensable. Therefore, UAVs represent an attractive tool for the inspection of industrial and construction components.
Theoretical and experimental studies have demonstrated that the use of drones can improve safety, reduce costs, and increase access during infrastructure inspection. For instance, a detailed study carried out by the US Minnesota Department of Transportation [23] between 2015 and 2018 explored the use of drones for bridge inspection. The last report of the study [24] revealed that drone use could provide an average cost savings of 40% compared to the traditional bridge approach that uses under-bridge inspection vehicles and requires traffic control. In addition, it was concluded that aerial inspection could increase the data quality and consistency of temporal inspections, allowing the creation of 3D data that can better communicate the inspection results. Recent reviews of drone use for large infrastructure inspections [25,26] also sustained the drones’ advantages of easy navigation, quicker and consistent data collection, performance, and inspection coverage. Multi-modal setups have been effectively employed for the identification and inspection of large infrastructures, such as industrial components [13], archaeological sites [27], power line systems [28,29], and concrete structures [30]. On the other hand, practical challenges faced by the technique are also acknowledged [31], such as limited flight time, the possibility of communication loss or interference, vibration, the necessity of property flight permission, the difficulty of using the equipment in tight and confined spaces, and the large amount of data collected. Nevertheless, experts constantly highlighted the use of drones for reducing safety risks during inspections of large infrastructures.
2.2. Multi-Modal Registration and Fusion of Visible and Thermal Images
Individual NDT methods have different principles of operation, where their results usually target the investigation and diagnosis of specific characteristics of the material under inspection. The fusion of multi-modal data combines two or more testing results to obtain a single output with a higher information level and easier interpretation than the single test results [32]. The fusion methods can enhance several image characteristics, such as color, contrast, edges, texture, resolution, quality, or perceived experience [33]. A set of consistent steps should be followed to generate relevant fused data, including data acquisition, image registration, and suitable information extraction [34]. First, data acquisition must be correctly planned and performed to acquire appropriate information according to the purpose of the inspection. Then, the multi-modal images should be precisely aligned, i.e., registered. Since the images are acquired from different sensors, the results usually differ in pixel size, perspective, and field of view [34]. The registration process can be performed using two methods according to the nature of the problem: direct-based and feature-based methods [35]. All pixel intensity values are accounted for in the direct-based method, minimizing the distance between pixel correspondences in the two candidate images. The feature-based methods rely on extracting specific features from the candidate images, such as corners, edges or points/objects that are darker or brighter than their surroundings and are easily perceived by an observer [36]. Independent of the applied method, the geometrical alignment between thermal and visible images is a critical pre-processing step for successful image fusion.
Several approaches are available for image fusion, including those that use multi-scale transform, sparse representation, saliency-based methods, subspace-based methods, adaptative-weight blending, hybrid, and neural networks [37]. The multi-scale transform approach decomposes the images into layers and reconstructs a fused image based on the corresponding transform following a set of particular rules [38]. Sparse representation theory relies on the linear combination of sparse bases in an over-complete dictionary. The saliency-based approach is based on the noticeable areas present in the source images, aiming to retain the integrity of these regions through the fusion process [37]. Subspace-based methods include principal component analysis (PCA), independent component analysis (ICA), and non-negative matrix factorization (NMF). Similar to neural networks, this approach assumes that relevant information exists in lower-dimensional subspaces [39]. Neural networks have the advantage of high adaptability and relative denoising capacity [37]. The adaptative weight blending approach produces the combination of two images using weighted transparency [40]. Finally, hybrid methods combine the strengths and weaknesses of the above-mentioned approaches to optimize the fusion results. Figure 2 shows sample results for Multi-scale [41], Hybrid [42], and Saliency-based [43] fusion techniques.
Ultimately, the thermal and visible image fusion is expected to generate enhanced informative images that can facilitate the interpretation of the scene or help with information extraction and decision-making. In addition, by appropriately merging the infrared and visible images, one can save the time needed to analyze multiple images from the same point of view, as the fused images will contain a data combination from the thermal and visible spectra [44]. The fusion process can be applied to individual or sequential images depending on the goal of the process. The fusion process can also be helpful for constructing large panoramas of big infrastructures [45], where it can minimize the alignment error, loss of information, and artifact insertion when stitching multiple images. The fusion of infrared and visible images has also been conducted as a pre-processing step for image-based 3D thermal model reconstruction [46].
2.3. Texture-Based Segmentation for Improving Multi-Modal Analysis of Inspection Data
Texture analysis can be defined as the characterization of image regions based on their texture content, i.e., their local spatial variation in pixel colors and intensities [47]. There are four primary texture analysis approaches: structural, statistical, model-based, and transform-based [48]. Table 1 summarizes the characterization of each approach. Texture analysis is a suitable procedure for many practical applications in the image processing domain, including medical image analysis [49,50], object recognition and tracking, defect detection [51], remote analysis [52], pattern recognition [53], and urban digitization [54].
The use of texture analysis for multi-modal image segmentation has also been explored in prior research. For example, Kakadiaris et al. [55] developed a multi-modal facial recognition approach using data from visible and thermal sensors. The image segmentation, based on texture features, was performed on the thermal images, given the characteristic thermal signatures observed in human skin. Racoviteanu and Williams [56] explored multi-spectral and topographic data to map potential debris-covered ice areas using decision tree and texture analysis. As a result, the texture features helped to detect areas missed by the decision tree algorithm. Another study [57] investigated color and texture analysis in RGB images and temperature patterns in thermal infrared images for rice lodging recognition and distinction. Texture analysis was also tested as an alternative for the registration of infrared and visible images [58]. Texture features were extracted from both images using Laws’ texture coefficients, and the matching was calculated using a criterion function. The results showed that the proposed method outperformed the intensity feature registration approach. The benefits of combining infrared and visible images for the interpretation of infrastructure defects were also reported on previous studies [15,59,60], highlighting the concept that the different targeted defects have enhanced texture and color characteristics registered in visible images, while the thermal data register important temperature differences related to faulty materials or components.
In this study, the texture analysis for drone-based multi-modal visible and infrared image interpretation had three objectives: (i) to facilitate the segmentation of key components in thermal images based on texture-rich information obtained from visible images, (ii) to distinguish normal and abnormal defects, and (iii) to align and fuse thermal and visible images obtained during the multi-modal drone inspection of large infrastructures. Defects in industrial and infrastructure components, as well as objects in a scene, can usually be detected and segmented by high-resolution visual images unless the scene is obstructed or has insufficient illumination. In the latter case, the inspection can benefit from infrared thermography, as it is a robust technique for acquiring information in poor light scenarios [61]. However, infrared images usually lack texture information and cannot provide an intuitive characterization of the scene [62]. In this context, we hypothesize that multi-modal texture analysis can facilitate the integration and interpretation of drone-based images of infrastructure inspection.
3. Texture Segmentation Using Supervised Deep Learning Approach
Deep convolutional neural networks (CNN) have become the staple standard for multiple computer vision tasks, such as image classification and instance and semantic segmentation [63]. Moreover, numerous benchmark cross-domain datasets, such as Cityscapes [64], KiTYY-2012 [65] and IDDA [66], have been proposed in the last decade. The CNN structures used in this study follow a U-Net architecture [67], its later evolution Unet++ [68], an DeepLabV3+ [69], which has been widely used for semantic segmentation tasks, especially in the medical and self-driving vehicle fields. The chosen encoders were ResNet-18, Resnet-50 [69], and DenseNet-121. They were mainly chosen for their small size of 6–23 million parameters and proven capabilities as a feature extractor. The PyTorch implementation of the networks used for this study was provided by Pavel Iakubovskii [70].
The texture segmentation task was modeled as a multi-class classification problem, where each pixel from the input image represented a sample to be classified. The model was trained following a recipe heavily inspired by [71] and modified to follow the segmentation task instead of the classification task. The employed loss function was the multi-class cross-entropy loss function. The classes were equally weighted; however, each image was given a sampling probability equal to the datasets’ inverse squared frequency of class densities. The optimization strategy used the classical stochastic gradient descent with momentum coupled with the cosine annealing with the warm restarts learning rate (CA-LR) scheduler [72].
Furthermore, trivial augment (TA) [73] was used as the default augmentation for all training sessions while being modified for the segmentation setting where only morphological augmentations were applied to both inputs and targets. Otherwise, augmentations were applied only to the input image. The training sessions ran for 300 epochs and were stopped early if necessary to prevent overfitting or if performances were unsatisfactory. All training procedures were implemented with the PyTorch v1.12 library and ran on a server equipped with a RTX2080-Ti GPU and an AMD Ryzen Threadripper 1920X CPU. All the training and validation hyper-parameters are presented in Table 2.
In order to evaluate the trained models, three segmentation metrics were adopted: (a) intersection over union (IoU), (b) F1-score, and (c) structural similarity index metric (SSIM) [74]. As described above, each pixel represented a sample to be classified. From this definition, four possible outcomes exist: (a) true positives (TP) and true negatives (TN), where the pixel is said to be rightly classified, and (b) false positives (FP) and false negatives (FN), where the pixel is attributed to the wrong class. Equation (1) presents the formula for F1-score, where the precision is equal to and the recall is .
The IoU metric relates the overlap ratio between the model’s prediction and the target. As the name suggests, this is accomplished by dividing the intersection of the target and prediction by their union. Equation (2) shows the formula for IoU.
The SSIM metric measures the perceptual structural information difference between two given images or class maps in the texture segmentation case. This metric captures the visual difference by cross-comparing the local luminance and contrast measurements between two samples. For a thorough explanation of the inner workings of this metric, we refer the reader to the original publication [74].
4. Case Studies
This section investigates the benefits of using coupled thermal and visible imagery sensors to enhance the non-destructive testing of industrial and construction structures. The coupled modalities can be combined and analyzed to solve the shortcomings of each sensor. For instance, thermal cameras present a visualization of thermal measurements while being unable to provide texture information. On the other hand, visible cameras can sense color and texture information while being vulnerable to low illumination.
The rise of interest in remote inspection using aerial platforms and automating the analysis of acquired data during recent years motivated different studies to focus on addressing the challenges and advancing the methods and technologies in these areas. The use of coupled sensors is one of the approaches to (a) solve the natural limitations of the involved sensors and (b) provide a more comprehensive analysis based on extra information gathered from the environment using the multi-modal data acquisition approach. This study provides a comprehensive exploratory investigation regarding the use of coupled thermal and visible images to enhance the data analysis in the NDT inspection.
This section includes four case studies of employing coupled thermal and visible cameras aiming toward the enhancement of post-analysis during a drone-based automated process pipeline in different inspection scenarios in different industries. Before explaining the use cases, since the registration of thermal and visible images are a preliminary step for all use cases, the description of manual registration is explained in Section 4.1. The first case study in Section 4.2 explains the benefits of fusing visible images with thermal images to enhance the defect detection process. Section 4.3 explains the multi-modal approach for abnormality classification in piping inspection. Employing visible images to extract the region of interest in thermal images to enhance the drone-based thermographic inspection of roads is described in Section 4.4. Finally, a drone-based inspection of concrete bridges using coupled thermal and visible cameras is investigated in Section 4.5. The source code and part of the employed datasets are available at this study’s GitHub repository (https://github.com/parham/lemanchot-analysis (accessed on 5 October 2022)). Also, the full set of employed hyperparameters, training results, and resulting metrics can be found in this study’s Comet-ML repository (https://www.comet.com/parham/comparative-analysis/view/OIZqWwU2dPR1kOhWH9268msAC/experiments (accessed on 14 November 2022)).
4.1. Manual Registration
Although coupled sensory platforms can be designed to have similar fields of view with considerable overlap, the thermal and visible images need to be aligned to use them as complementary data. Many multi-sensory platforms have a built-in registration process customized based on the system requirement; however, the registration process generally is a preliminary step for multi-modal data processing. The automated registration of thermal and visible images is not in the scope of this study. Therefore, a manual registration approach was employed for aligning the modalities. First, the user manually selected the matched control points in both modalities. Next, the homography matrix was estimated using the matched points. Finally, the matrix was used to align the thermal and visible images.
This study employed two approaches to use manual registration. The first approach was when the relative position of the camera toward the surface was approximately constant. The first coupled images were used to calculate the homography matrix. Later, the matrix was used to align the remaining images. The second approach calculated the homography matrix for all coupled images.
4.2. Case Study 01: Enhancing Visual Inspection of Roads Using Coupled Thermal and Visible Cameras
Thermal cameras capture the thermal radiation emitted from a specimen and surrounding area and present the information as an image. Since they work with emitted thermal radiation, the visible illumination does not affect the thermal visibility. Thus, one of the applications for coupled thermal and visible sensors is to enhance defect detection in visual inspection using thermal images in case of illumination or contrast issues, where the indications of surface defects are visible in thermal and visible images. This section presents a process pipeline for automatic crack detection using coupled thermal and visible images. The objective is to demonstrate the effect of the thermal-visible image fusion on crack detection in typical- and worst-case scenarios. The worst-case scenario occurs when shadows, low illumination, or low contrast disrupt the detection process.
This method consists of two main parts: (a) the fusion of thermal and visible images and (b) automatic crack detection. In order to focus on the main objectives, it is assumed that the modalities are pre-aligned and ready for fusion. As shown in Figure 3, the visible and thermal images were preprocessed to balance the illumination and contrast. The contrast-limited adaptive histogram equalization (CLAHE) method was used to correct and balance the illumination and contrast of visible images [75]. Additionally, the thermal images were enhanced using adaptive plateau equalization (APE) [76], which is a proprietary FLIR method. Later, both modalities were passed to the fusion method.
The resulting image was processed to detect cracks using a deep learning approach. This case study employed a deep learning approach for detecting cracks on road pavements. The deep learning networks available were a U-Net network [67], a Unet++ [68], a FPN [77] and a DeepLabV3+ [69] model. The decoder models were coupled with ResNet-18, ResNet-50 [69] and DenseNet-121 [78] encoders that were pre-trained on the ImageNet dataset.
4.2.1. Fusion of Thermal and Visible Images
In this case study, six multi-modal fusion algorithms were tested for the fusion of pre-aligned thermal and visible images, named DP, classic [79], TIF, MGF, RP, and NSCT. First, a deep learning (DP) method presented in [80] was adopted. This method is a deep learning-based technique that fuses both modalities while preserving their features. Each modality is decomposed into base and detailed parts in this approach using the optimization method introduced in [81]. Later, the base parts were fused using the weighted-averaging method. The multi-layer features were extracted using a deep learning network for the detailed parts. Next, the candidates were generated using -norm and weighted-average methods as fused results. The fusion of detail parts was finalized based on the max selection strategy. Finally, the resulting fusion was reconstructed by combining the fused base and detailed parts. The deep learning network used for extracting multi-layer features was VGG-19 [82] trained on the ImageNet dataset. Next, the two-scale image fusion (TIF) method [43] was tested, which is based on two-scale image decomposition and saliency detection. During the image decomposition, complementary and relevant information from visible and infrared images were extracted. However, only visually significant information from both source images proceeded to the fused image. To that aim, the proposed weight map construction process assigned more weight to pixels with relevant information. Next, weight maps, details, and base layers were integrated to form the fused images.
Another tested method was multi-scale guided filtered-based fusion (MGF) [41], which is a multi-scale image decomposition method that can extract visual saliency using a guided image filter (GF). It consists of decomposing the source images using GF, generating saliency maps based on detail layer information, computing weight maps by normalizing the saliency maps, and combining the detail and base layers to generate the fused images. Other than MGF, two other popular multi-scale transforms were tested: ratio of low-pass pyramid (RP) [83] and nonsubsampled contourlet transform (NSCT) [84]. RP employs multiresolution contrast decomposition to perform hierarchical image fusion. The method preserves the details that are important to human visual perception, such as high local luminance contrast [83]. NSCT is a shift-invariant version of the contourlet transform (CT), which uses non-subsampled pyramid filter banks (NSPFBs) for multi-scale decomposition and non-subsampled directional filter banks (NSDFBs) for directional decomposition [84]. The resulting fused image contained the texture and color information of the visible image, while the areas with low feature visibility were enhanced with the thermal information.
4.2.2. Automated Crack Detection
This case study employed a deep learning approach for detecting cracks on paved roads. Similar to the texture segmentation task, a variety of state-of-the art architectures and encoders were tested, including Unet [67], FPN [77] and Unet++ [68] combined with the Resnet18, Resnet50 [69], and DenseNet-121 [78] encoders. The top five models presenting the best results were chosen as possible candidate models. To do so, two main criteria were analysed: (a) the overall quantitative performance on the validation set and (b) the perceived qualitative quality of the predictions on the validation set. All networks were trained and validated using a combination of publicly available datasets containing segmented cracks on pavement [85,86]. Details on the used datasets are presented in the next section. Similar to the previous training recipe, unweighted multi-class cross-entropy loss was employed to train the models on the visible part of the acquired data. This time, the Adam optimizer [87] was selected as the optimization strategy. In order to manage the learning rate during the training, the cosine annealing method [72] was employed again. Trivial augment (TA) [73] was also used as the default augmentation strategy. Additionally, following [86]’s training procedure, the targets were symmetrically dilated by 1 pixel. The hyperparameters for the crack segmentation models are presented in Table 3. The aforementioned parameters serve as a baseline for optimization, and small variations may occur if a given model needs further optimization.
4.2.3. Dataset
The training and validation set were randomly generated following a 80%/20% split ratio from four datasets found in [85,86], named CrackTree260, CrackLS315, CRKWH100 and Stone331. CrackTree260 was the first dataset employed in this study [85]. It contains 260 visible images of paved surfaces at a monotone distance. Two different resolutions are found in this dataset, and pixels. CRKWH100 is a dataset collected for pavement crack detection [86]. It contains grayscale images of size and manually annotated ground truths. The images were collected at a close range and perpendicular to the pavement. The 100 available images display traces of noise, such as oil spills and shadows. CrackLS315 is comprised of images of laser-illuminated paved roads. The 315 samples were captured by a line-array camera at a controlled ground sampling distance. Stone331 contains 331 visible images, pixels in size, of cracks on stone surfaces [86]. The samples were captured with visible-light illumination by an area-array sensor. Moreover, a mask is provided, identifying the region of interest in each sample.
For testing this case study, a dataset containing the coupled thermal and visible images of a road inspection was employed for training and testing the model and evaluating the multi-modal fusion technique. The road inspection was conducted on an experimental road belonging to the Montmorency Forest Laboratory of Université Laval, located north of Quebec City. The inspection was performed on 27 October 2021, using a FLIR E5-XT Wifi camera that can collect pre-aligned thermal and visible images. In addition to the acquired data, a subset of data was used to create additional images containing augmented shadows and low illumination and contrast. Figure 4 shows samples of the acquired dataset.
An inspector walked along the road at a steady height from the pavement for data acquisition. For this experiment, a total of 330 coupled thermal and visible images were collected, presenting the cracked areas of the road. Parts of the acquired visible images affected by shadows were later used to investigate the effect of using fused images for crack detection. In addition to the images affected by shadows, other samples with augmented shadows and low illumination and contrast conditions were generated to be used for evaluation purposes.
4.3. Case Study 02: Abnormality Classification Using Coupled Thermal and Visible Images
Another area in which coupled thermal and visible images can be beneficial is remote inspection when physical access is limited. In such scenarios, comprehensive information in different modalities is needed to avoid data misinterpretation. In the case of thermographic inspection, the abnormalities are recognizable in thermal images, and several methods exist that can semi-automate the detection process. However, distinguishing between surface and subsurface defects is hard or impossible with only thermal information in an automated process pipeline. To address this challenge, coupled thermal and visible images can be employed to enhance the classification process.
In this case study, thermal and visible images were used to classify detected defects into surface and subsurface abnormalities using texture analysis. To do so, the thermal and visible images were aligned using a manual registration. Later, the region of interest was selected in both modalities. After applying the preprocessing steps to the extracted regions, the thermal image was passed to an unsupervised deep learning-based method to segment the thermal image into regions with different thermal patterns. Next, a conventional texture segmentation algorithm was used on the coupled visible images to segment the areas with similar patterns. Finally, the extracted regions in both modalities were combined to determine surface and subsurface areas. The steps for the processing pipeline are shown in Figure 5.
4.3.1. Unsupervised Thermal Image Segmentation
This case study employed an unsupervised segmentation technique introduced in [88] for segmenting thermal images. The method used a convolutional neural network with random initialization and an iterative training strategy to segment thermal images. The final result was obtained after passing each sample image through the model for a certain amount of iterations. The iterative process continued until the number of extracted classes reached a predefined criterion. Additionally, the method used a loss function that did not need a target to calculate the loss value, as explained in Algorithm 1. The schema of the network architecture is shown in Figure 6.
| Algorithm 1 The loss method for segmenting thermal images. | ||
| 1: procedure Loss for Thermal Image Segmentation(I, c, , ) | ||
| Ensure: The thermal image I cannot be None. | ||
| Require: The number of channel c. | ||
| Require: The similarity factor and continuity factor . | ||
| 2: | ▹ Calculate the maximum matrix across the first dimension (outputś channel). | |
| 3: | ▹ The width w and height h are the size of the image I. | |
| 4: | ||
| 5: | ||
| 6: | ||
| 7: | ||
| 8: | ||
| 9: | ▹ and are used for calculating the continuity factor. | |
| 10: | ▹ Cross-entropy calculates as a similarity factor. | |
| 11: | ▹ Loss is the return value for this method. | |
| 12: end procedure | ||
4.3.2. Texture-Based Image Segmentation
In this case study, the expected abnormalities in the piping setup contain sharp and steady patterns in different shapes and colors. Therefore, an entropy-based segmentation approach based on statistical texture analysis was used for segmentation. Algorithm 2 describes the employed technique for texture segmentation of visible images.
| Algorithm 2 The method for texture segmentation of visible images. | |
| 1: procedure Texture Image Segmentation(I, t, p) | |
| Ensure: The visible image I cannot be None. | |
| Require: The threshold t for binarizing the image should be defined. | |
| Require: The minimum number of pixels p for regions that need to be removed. | |
| 2: convert to grayscale (I). | |
| 3: calculate local entropy of the image (). | |
| 4: | ▹ function forms an output for which each pixel value is the standard deviation of neighboring pixels. |
| 5: | ▹ function forms an output for which each pixel value is the maximum value, with a minimum value of neighboring pixels. |
| 6: | |
| 7: | |
| 8: | ▹ Binarize E using the given threshold value T. |
| 9: | ▹ Remove small regions with numbers of pixels lower than p. |
| 10: | ▹ Close the open regions and fill the holes morphologically using floating windows with a size of 9. |
| 11: | ▹ T is defined as the functionś return. |
| 12: end procedure | |
4.3.3. Dataset
For this case study, a dataset containing coupled thermal and visible images of a piping inspection was used to evaluate the proposed approach. For this experiment, an indoor piping setup was prepared with different carbon steel pipes wrapped with wool isolation. The pipes’ isolation layer was defected manually to create surface defects. During the experiment, the hot oil was pumped into the pipes as a heating mechanism for active thermography. An FLIR T650sc camera was used to collect thermal and visible images with resolution while placed in multiple fixed locations. Figure 7 shows samples of collected thermal and visible images.
4.4. Case Study 03: Enhancing the Analysis of Drone-Based Road Inspection Using Coupled Thermal and Visible Images
Visible images can be employed to segment the region of interest in thermal images in various applications. The visible images can be analyzed to identify different materials based on their textures. The gathered information can be used to segment thermal images and provide more accurate results. This information can help the automated process pipeline to (a) differentiate between materials or (b) extract the region of interest and avoid data misinterpretation. For instance, one of the possible applications of the presented concept is multi-modal road inspection. Thermographic inspection can be used to detect delamination in concrete structures [89] or sinkholes in pavement roads [90]. However, for an automated process pipeline, it is required to extract regions of interest to ensure the accurate analysis of concrete or pavement structures.
In this case study, the use of visible images for helping to extract the region of interest in thermal images was investigated comprehensively for the drone-based inspection of road pavement. Firstly, the thermal images were preprocessed to enhance the visibility of the thermal patterns. Next, the visible and thermal images were aligned via manual alignment. Since the drone’s altitude was fixed during each data session, the homography matrix was calculated for the first coupled images and used for the remaining frames. Later, the visible images were passed to the deep learning-based texture segmentation method explained in Section 3 to detect the regions representing the pavement area. Later, the generated mask was used to filter out regions in thermal images. Finally, the extracted regions were analyzed to detect possible abnormalities.
Dataset
For this case study, an experiment was conducted on an experimental road with a length of 386 m belonging to the Montmorency Forest Laboratory of Université Laval, located in the north of Quebec City. The road was intended to test pavement paints, laying techniques, and simulating inspections. Figure 8 shows the inspection map and the dedicated sections. For this experiment, a DJI M300 drone equipped with a Zenmuse H20T camera was employed for acquiring thermal and visible images. The provided datasets contained 578 and 614 coupled thermal and visible images of the road consecutively for the first and second data sessions at an altitude of 15 m. Table 4 explains the conditions of the inspection. Figure 9 shows sample photos of acquired data from the inspected road.
4.5. Case Study 04: Enhancing the Analysis of Bridge Inspection Using Coupled Thermal and Visible Images
As mentioned in Section 4.4, using visible images to extract the regions of interest in thermal images is one of the main applications of coupled sensors. In addition to using visible images to enhance the analysis of thermal images, extracting regions of interest in thermal images also reduces the complexity of analysis in an automated pipeline by removing extra information that may cause data misinterpretation.
This case study investigated the use of coupled thermal and visible cameras to enhance the drone-based thermographic inspection of concrete bridges. For this case study, firstly, the thermal images were preprocessed to enhance the visibility of thermal patterns. Later, the thermal and visible images were aligned. Next, the visible images were passed to the proposed texture segmentation method explained in Section 3 to find the areas representing the concrete surface. Finally, the segmented images were used to extract the concrete regions in thermal and visible images. Finally, the extracted regions were used to detect possible abnormalities.
Dataset
For this case study, an inspection was conducted on a concrete bridge in Quebec City. A DJI M300 drone equipped with a Zenmuse H20T camera was used for this inspection. Three flight sessions were performed, including two horizontal passes across the bridge girders at a fixed distance and a pass under the bridge while the drone’s camera aimed at the cross beams and the bottom of the bridge deck. The gathered dataset contains a total of 273 coupled thermal and visible images. The inspection conditions are described in Table 5. Figure 10 demonstrates the sample photos of acquired multi-modal data from the bridge inspection.
5. Results and Discussion
This section discusses the results of the conducted case studies. Additionally, the training and testing results for each case study are comprehensively described. Firstly, the result of using the fusion of visible and thermal images is discussed in Section 5.1. Later, the application of multi-modal inspection for abnormal classification is explained in Section 5.2. Section 5.3 discusses the results of the conducted drone-based road inspection and the application of coupled thermal and visible images. Finally, Section 5.4 presents the results of the introduced approach for drone-based bridge inspection.
5.1. Multi-Modal Fusion
The presented method for the first case study includes multi-modal image fusion and automated crack detection techniques. For this experiment, a low-resolution thermal camera was used to investigate the performance of this technique under the worst conditions. Figure 11 presents samples of the resulting fusions. The visual inspection of the resulting fusions demonstrates that this technique can effectively enhance the visibility of defects. Especially in the case of existing shadows, low illumination, or contrast, the interpretation of the results shows that the fused images improve the visual detection of the defects. Despite the significant visibility improvement, the affected areas contain disrupted patterns due to the low quality of the thermal images.
The introduced deep learning methods were applied to the gathered dataset for the next step. Additionally, the deep learning-based and the classic fused images, as well as the test subset of visible images, are used to evaluate the proposed method. Figure 12 presents the metrics for the validation process. The results show that the models can provide acceptable results using only visible images. It is worth mentioning that worst-case samples were not used for training.
Finally, both steps were combined to provide a full solution for multi-modal inspection. For this step, the images were passed through the fusion process and then passed to the trained models to determine the affected areas. Figure 12 demonstrates the results of the comparative study on the acquired dataset. The presented process pipeline is applied to this experiment’s test subset and worst-case dataset. The results show that the fusion-based methods perform similarly when only visible images are processed. One of the reasons behind the small drop in metrics for the fusion-based methods is the different thicknesses of the affected area in thermal images compared to visible and target images. In conclusion, considering the visual assessment and the calculated metrics, the presented method can effectively enhance detection, especially in low illumination, contrast, or shadows. Figure 13 shows sample predictions of the proposed process pipeline.
5.2. Abnormality Classification
The introduced process pipeline for this case study demonstrates the use of texture analysis to enhance thermal analysis. Thermal segmentation is one of the steps in this processing pipeline that needs to be evaluated. An unsupervised method segmented the thermal images based on neighboring thermal patterns for thermal segmentation. Since the results of thermal segmentation contain unnamed classes, a strategy must be provided for evaluation purposes. To do so, the segmented image was compared with the target image. Later, the connected regions with the same class were extracted in both target and segmented images. Next, the regions in both images were coupled where their intersection is larger than a predefined value. Later, the class associated with the target’s region was also assigned to the processed region. If the region had an intersection with multiple target regions, the region’s class with the highest intersection value was assigned. Figure 14 presents the metrics of the employed segmentation method. The results show that the algorithm can successfully segment thermal images into regions with similar thermal patterns.
After applying unsupervised segmentation to thermal images and texture segmentation to visible images, the extracted regions were used to classify the detected defects. Figure 15 presents a sample classification result.
5.3. Drone-Based Road Inspection
For this case study, the proposed texture segmentation methods were employed to segment the visible camera to extract pavement regions. The presented models were trained on the dataset explained in Section 4.4. For this experiment, random crop and rotation augmentation methods were used to: (a) improve the convergence, (b) extend the amount of available data for training, and (c) prevent the model from overfitting. Figure 16 shows sample results of the trained DeepLabv3+ model. Additionally, the resulting metrics of the training process are explained in Table 6, which shows that the training process with the augmentation strategy could reduce the value of the loss function and result in better accuracy and IOU. Despite the significant result in the prediction process, the models’ performances varied for different defined classes due to the unbalanced dataset. Therefore, it can be solved by providing more samples for the unbalanced classes.
For the next step, the visible and thermal images were aligned using manual alignment with control points. Since the drone followed a fixed altitude for each data session, a homography matrix was calculated for one of the coupled samples and used for the remaining frames. Later, the segmented visible images were used to extract the region of interest in thermal images. Finally, the extracted regions in thermal images can be analyzed to detect and classify defects. It is worth mentioning that for this case study, the identified defected regions were classified using visible images into two categories: surface and subsurface defects. Figure 17 shows the sample results of the steps in the proposed process pipeline.
5.4. Drone-Based Bridge Inspection
This case study investigated the application of the proposed multi-modal approach for the drone-based inspection of bridges. To do so, the visible images were employed to train the proposed models for texture segmentation. Similar to the case study explained in Section 5.3, random crop, rotation, and morphological augmentation strategies were used to improve the training process. Table 7 demonstrates the models’ metrics during the training process. Additionally, some sample results are presented in Figure 18.
As explained comprehensively in Section 4.5, firstly, the thermal and visible images acquired during a bridge inspection were aligned manually. Due to the nature of this inspection and the close distance of the drone to the structure, it was very challenging to provide a fixed distance between the drone and the structure; therefore, for this experiment, the homography matrix calculation needed to be done per frame. Later, the segmented image was employed to extract the concrete surface. Finally, the extracted thermal region was analyzed to detect defects. Figure 19 shows the results of the inspection analysis.
6. Conclusions
The aging of existing industrial and civil infrastructure has been a recurrent concern for owners, workers, and users. While public and private agencies aspire to preserve life expectancy and serviceability, the network of assets to be inspected, repaired, and maintained continues to grow. This scenario shows the existing and upcoming demand for innovative approaches to improve the current practices for inspecting and analyzing the large inventory of industrial and construction components.
This study is aimed to investigate the benefits of using coupled thermal and visible modalities for the drone-based multi-modal inspection of industrial and construction components. Additionally, it studies enhancing the interpretation and characterization of abnormalities in a multi-modal inspection using texture analysis. Four case studies were evaluated in this paper, tackling various infrastructure components and inspection requirements. The comprehensive experiment and analysis performed in this study led to the following conclusions:
- (i)
- The outcome of the first case study showed that the use of coupled thermal and visible images in paved roads could effectively enhance the detection of cracks, especially in cases of low illumination, low contrast, or in the presence of shadows. The segmentation metrics for fused images were smaller than the results from visible images, primarily because of the different damage thicknesses segmented in thermal images compared to visible and target images.
- (ii)
- The second case study investigated the use of coupled thermal and visible images and texture analysis to differentiate between surface and subsurface abnormalities during an inspection of piping. The presented method combined an unsupervised segmentation approach to automatically detect faulted regions in thermal images and a texture segmentation method for visible images. As a result, the proposed multi-modal processing pipeline allowed for semi-automated classification of abnormalities during the piping inspection, which can be potentially implemented during drone inspection.
- (iii)
- The third case study introduced a multi-modal processing pipeline for drone-based road inspection. The developed method employed texture segmentation to extract the region of interest in both modalities. The conducted experiment showed that it is possible to detect surface and sub-surface defects during a drone-based road pavement inspection.
- (iv)
- The fourth case study, similar to the third one, investigated the use of texture analysis to enhance the drone-based thermographic inspection of bridges. The processing pipeline extracted the concrete regions in thermal images using the texture analysis of visible images. The findings showed that the proposed solutions on multi-modal inspection analysis are not linear but prone to case-scenario adaptations over the user/client case.
Generally, the results of this study provide supporting evidence that the exploration of texture patterns in visible images can conveniently advance the thermographic inspection of industrial and construction components and avoid possible data misinterpretation, especially in drone-based inspection due to limited physical access. More than that, the use of coupled drone-based thermal and visible images allied with automatic or semi-automatic computational methods is a promising alternative to tackle with efficiency the growing demand for inspection and analysis tasks in the civil and oil and gas infrastructure domains.
Future research should certainly assess whether the texture-based analysis could help register multi-modal images, an open issue for coupled infrared and visible scenes containing few perceptual references. Furthermore, a more extensive data collection depicting a larger variety of worst-case scenarios, where the added value of the thermal imaging acquisition would be more prominent, is necessary. Indeed, similarly to the autonomous vehicle research field, the drone inspection field would greatly benefit from standardizing the creation of benchmark cross-domain datasets.
Author Contributions
Conceptualization, P.N., G.R. and X.P.V.M.; Data curation, P.N., G.R., S.P., C.I.-C., F.L. and X.P.V.M.; Formal analysis, P.N., G.R. and X.P.V.M.; Methodology, P.N., G.R. and X.P.V.M.; Project administration, C.I.-C. and X.P.V.M.; Resources, C.I.-C., F.L. and X.P.V.M.; Software, P.N.; Supervision, X.P.V.M.; Validation, P.N., G.R. and X.P.V.M.; Visualization, P.N. and G.R.; Writing—original draft, P.N., G.R. and S.P.; Writing—review & editing, P.N., G.R., S.P., C.I.-C., F.L. and X.P.V.M. All authors have read and agreed to the published version of the manuscript.
Funding
This research received no external funding.
Informed Consent Statement
Not applicable.
Data Availability Statement
The complete source code, part of the datasets, and trained models with additional prediction samples are accessible at our GitHub repository (https://github.com/parham/lemanchot-analysis (accessed on 5 October 2022)). Additionally, the results can be seen at our Comet.ml repository (https://www.comet.com/parham/comparaWtive-analysis/view/OIZqWwU2dPR1kOhWH9268msAC/experiments (accessed on 14 November 2022)).
Acknowledgments
We acknowledge the support of the Natural Sciences and Engineering Council of Canada (NSERC), CREATE-oN DuTy Program (funding reference number 496439-2017), DG program, the Canada Research Chair in Multipolar Infrared Vision (MIVIM), and the Canada Foundation for Innovation. The authors also want to thank Marcos Paulo Souza for supporting the data acquisition by permitting the use of the piping setup he prepared and maintained. Special thanks go to the TORNGATS company for providing the required equipment and support for performing the experiments. Additionally, we are grateful to Montmorency Forest of Université Laval for the kind authorization received to use their experimental road.
Conflicts of Interest
The authors declare no conflict of interest. The funders had no role in the design of the study; in the collection, analysis, or interpretation of data; in the writing of the manuscript; or in the decision to publish the results.
Abbreviations
The following abbreviations are used in this manuscript:
| UAV | Unmanned Aerial Vehicle |
| NDT | Non-Destructive Testing |
| PCA | Principal Component Analysis |
| ICA | Independent Component Analysis |
| NMF | Negative Matrix Factorization |
| SIFT | Scale-Invariant Feature Transform |
| ResNet | Residual Neural Network |
| CNN | Convolutional Neural Network |
| CA-LR | Cosine Annealing Learning Rate Scheduler |
| TA | Trivial-Augment |
References
- Head of Grenfell Tower Investigation and Review Team. Grenfell Tower Fire: Preliminary Report; Technical Report; London Fire Brigade: London, UK, 2019. [Google Scholar]
- US Chemical Safety and Hazard Investigation Board. Investigation Report Overview: Explosion and Fire at the Macondo Well; Report N°2010-10-I-OS; Technical Report; CSB: Washington, DC, USA, 2014.
- Turksezer, Z.I.; Iacovino, C.; Giordano, P.F.; Limongelli, M.P. Development and implementation of indicators to assess bridge inspection practices. J. Constr. Eng. Manag. 2021, 147, 04021165. [Google Scholar] [CrossRef]
- Afsari, K.; Halder, S.; Ensafi, M.; DeVito, S.; Serdakowski, J. Fundamentals and Prospects of Four-Legged Robot Application in Construction Progress Monitoring. EPiC Ser. Built Environ. 2021, 2, 274–283. [Google Scholar]
- Moradi, S.; Zayed, T.; Golkhoo, F. Review on computer aided sewer pipeline defect detection and condition assessment. Infrastructures 2019, 4, 10. [Google Scholar] [CrossRef] [Green Version]
- Irizarry, J.; Gheisari, M.; Walker, B.N. Usability assessment of drone technology as safety inspection tools. J. Inf. Technol. Constr. (ITcon) 2012, 17, 194–212. [Google Scholar]
- Syed, F.; Gupta, S.K.; Hamood Alsamhi, S.; Rashid, M.; Liu, X. A survey on recent optimal techniques for securing unmanned aerial vehicles applications. Trans. Emerg. Telecommun. Technol. 2021, 32, e4133. [Google Scholar]
- Asadzadeh, S.; de Oliveira, W.J.; de Souza Filho, C.R. UAV-based remote sensing for the petroleum industry and environmental monitoring: State-of-the-art and perspectives. J. Pet. Sci. Eng. 2022, 208, 109633. [Google Scholar] [CrossRef]
- Zhang, D.; Watson, R.; Dobie, G.; MacLeod, C.; Pierce, G. Autonomous ultrasonic inspection using unmanned aerial vehicle. In Proceedings of the 2018 IEEE International Ultrasonics Symposium (IUS), Kobe, Japan, 22–25 October 2018; pp. 1–4. [Google Scholar]
- González-deSantos, L.M.; Martínez-Sánchez, J.; González-Jorge, H.; Arias, P. Active UAV payload based on horizontal propellers for contact inspections tasks. Measurement 2020, 165, 108106. [Google Scholar] [CrossRef]
- Ramon-Soria, P.; Gomez-Tamm, A.E.; Garcia-Rubiales, F.J.; Arrue, B.C.; Ollero, A. Autonomous landing on pipes using soft gripper for inspection and maintenance in outdoor environments. In Proceedings of the 2019 IEEE/RSJ International Conference on Intelligent Robots and Systems (IROS), Macau, China, 3–8 November 2019; pp. 5832–5839. [Google Scholar]
- Carrozzo, M.; De Vito, S.; Esposito, E.; Salvato, M.; Formisano, F.; Massera, E.; Di Francia, G.; Veneri, P.D.; Iadaresta, M.; Mennella, A. UAV intelligent chemical multisensor payload for networked and impromptu gas monitoring tasks. In Proceedings of the 2018 5th IEEE International Workshop on Metrology for AeroSpace (MetroAeroSpace), Rome, Italy, 20–22 June 2018; pp. 112–116. [Google Scholar]
- Nooralishahi, P.; López, F.; Maldague, X.P. Drone-Enabled Multimodal Platform for Inspection of Industrial Components. IEEE Access 2022, 10, 41429–41443. [Google Scholar] [CrossRef]
- Alhammad, M.; Avdelidis, N.P.; Deane, S.; Ibarra-Castanedo, C.; Pant, S.; Nooralishahi, P.; Ahmadi, M.; Genest, M.; Zolotas, A.; Zanotti-Fragonara, L.; et al. Diagnosis of composite materials in aircraft applications: Towards a UAV-based active thermography inspection approach. In Thermosense: Thermal Infrared Applications XLIII; SPIE: Philadelphia, PA, USA, 2021; Volume 11743, pp. 35–41. [Google Scholar]
- Pozzer, S.; Rezazadeh Azar, E.; Dalla Rosa, F.; Chamberlain Pravia, Z.M. Semantic segmentation of defects in infrared thermographic images of highly damaged concrete structures. J. Perform. Constr. Facil. 2021, 35, 04020131. [Google Scholar] [CrossRef]
- Osman, A.; Duan, Y.; Kaftandjian, V. Applied Artificial Intelligence in NDE. In Handbook of Nondestructive Evaluation 4.0; Springer: Cham, Switzerland, 2021; pp. 1–35. [Google Scholar]
- Taheri, H.; Gonzalez Bocanegra, M.; Taheri, M. Artificial Intelligence, Machine Learning and Smart Technologies for Nondestructive Evaluation. Sensors 2022, 22, 4055. [Google Scholar] [CrossRef]
- Farah, I.R.; Boulila, W.; Ettabaa, K.S.; Ahmed, M.B. Multiapproach system based on fusion of multispectral images for land-cover classification. IEEE Trans. Geosci. Remote Sens. 2008, 46, 4153–4161. [Google Scholar] [CrossRef]
- Xiao, X.; Gao, B.; Tian, G.; Wang, K. Fusion model of inductive thermography and ultrasound for nondestructive testing. Infrared Phys. Technol. 2019, 101, 162–170. [Google Scholar] [CrossRef]
- Blum, R.S.; Liu, Z. Multi-Sensor Image Fusion and Its Applications; CRC Press: Boca Raton, FL, USA, 2018. [Google Scholar]
- Lee, S.; An, K.E.; Jeon, B.D.; Cho, K.Y.; Lee, S.J.; Seo, D. Detecting faulty solar panels based on thermal image processing. In Proceedings of the 2018 IEEE International Conference on Consumer Electronics (ICCE), Las Vegas, NV, USA, 12–14 January 2018; pp. 1–2. [Google Scholar]
- Henriques, M.J.; Roque, D. Unmanned aerial vehicles (UAV) as a support to visual inspections of concrete dams. In Proceedings of the Second International Dam World Conference, Lisbon, Portugal, 21–24 April 2015; Laboratorio Nacional De Engenharia Civil Lisbon: Lisbon, Portugal, 2015; pp. 1–12. [Google Scholar]
- MnDOT: Minnesota Department of Transportation. Drone Technology Enhances Bridge Inspections. Available online: https://mntransportationresearch.org/2022/03/15/drone-technology-enhances-bridge-inspections (accessed on 10 September 2022).
- Wells, J.; Lovelace, B. Improving the Quality of Bridge Inspections Using Unmanned Aircraft Systems (UAS). Technical Report, 2018. Available online: http://www.dot.state.mn.us/research/reports/2018/201826.pdf (accessed on 10 September 2022).
- Nooralishahi, P.; Ibarra-Castanedo, C.; Deane, S.; López, F.; Pant, S.; Genest, M.; Avdelidis, N.P.; Maldague, X.P. Drone-Based Non-Destructive Inspection of Industrial Sites: A Review and Case Studies. Drones 2021, 5, 106. [Google Scholar] [CrossRef]
- Sreenath, S.; Malik, H.; Husnu, N.; Kalaichelavan, K. Assessment and use of unmanned aerial vehicle for civil structural health monitoring. Procedia Comput. Sci. 2020, 170, 656–663. [Google Scholar] [CrossRef]
- Khelifi, A.; Ciccone, G.; Altaweel, M.; Basmaji, T.; Ghazal, M. Autonomous Service Drones for Multimodal Detection and Monitoring of Archaeological Sites. Appl. Sci. 2021, 11, 10424. [Google Scholar] [CrossRef]
- Jalil, B.; Moroni, D.; Pascali, M.; Salvetti, O. Multimodal image analysis for power line inspection. In Proceedings of the International Conference on Pattern Recognition and Artificial Intelligence, Montreal, QC, Canada, 14–17 May 2018; pp. 13–17. [Google Scholar]
- Choi, H.; Yun, J.P.; Kim, B.J.; Jang, H.; Kim, S.W. Attention-based Multimodal Image Feature Fusion Module for Transmission Line Detection. IEEE Trans. Ind. Inform. 2022, 18, 7686–7695. [Google Scholar] [CrossRef]
- Chu, X.; Tang, L.; Sun, F.; Chen, X.; Niu, L.; Ren, C.; Li, Q. Defect Detection for a Vertical Shaft Surface Based On Multi-modal Sensors. IEEE J. Sel. Top. Appl. Earth Obs. Remote Sens. 2022, 15, 8109–8117. [Google Scholar] [CrossRef]
- Ciampa, E.; De Vito, L.; Pecce, M.R. Practical issues on the use of drones for construction inspections. J. Phys. Conf. Ser. 2019, 1249, 012016. [Google Scholar] [CrossRef] [Green Version]
- Kumar, N.; Gumhold, S. FuseVis: Interpreting neural networks for image fusion using per-pixel saliency visualization. Computers 2020, 9, 98. [Google Scholar] [CrossRef]
- Huang, B.; Yang, F.; Yin, M.; Mo, X.; Zhong, C. A review of multimodal medical image fusion techniques. Comput. Math. Methods Med. 2020. [Google Scholar] [CrossRef] [Green Version]
- Lahat, D.; Adali, T.; Jutten, C. Multimodal data fusion: An overview of methods, challenges, and prospects. Proc. IEEE 2015, 103, 1449–1477. [Google Scholar] [CrossRef] [Green Version]
- Szeliski, R. Image alignment and stitching: A tutorial. Found. Trends® Comput. Graph. Vis. 2007, 2, 1–104. [Google Scholar] [CrossRef]
- Phogat, R.S.; Dhamecha, H.; Pandya, M.; Chaudhary, B.; Potdar, M. Different image registration methods—An overview. Int. J. Sci. Eng. Res. 2014, 5, 44–49. [Google Scholar]
- Ma, J.; Ma, Y.; Li, C. Infrared and visible image fusion methods and applications: A survey. Inf. Fusion 2019, 45, 153–178. [Google Scholar] [CrossRef]
- Mao, Q.; Zhu, Y.; Lv, C.; Lu, Y.; Yan, X.; Wei, D.; Yan, S.; Liu, J. Image fusion based on multiscale transform and sparse representation to enhance terahertz images. Opt. Express 2020, 28, 25293–25307. [Google Scholar] [CrossRef]
- Ramírez, J.; Vargas, H.; Martínez, J.I.; Arguello, H. Subspace-Based Feature Fusion from Hyperspectral and Multispectral Images for Land Cover Classification. In Proceedings of the 2021 IEEE International Geoscience and Remote Sensing Symposium IGARSS, Brussels, Belgium, 11–16 July 2021; pp. 3003–3006. [Google Scholar]
- Barani, R.; Sumathi, M. PET/CT Fusion using Pixel Level Adaptive Weighted Alpha Blending. Int. J. Sci. Eng. Comput. Technol. 2016, 6, 339. [Google Scholar]
- Bavirisetti, D.P.; Xiao, G.; Zhao, J.; Dhuli, R.; Liu, G. Multi-scale guided image and video fusion: A fast and efficient approach. Circuits, Syst. Signal Process. 2019, 38, 5576–5605. [Google Scholar] [CrossRef]
- Liu, Y.; Liu, S.; Wang, Z. A general framework for image fusion based on multi-scale transform and sparse representation. Inf. Fusion 2015, 24, 147–164. [Google Scholar] [CrossRef]
- Bavirisetti, D.P.; Dhuli, R. Two-scale image fusion of visible and infrared images using saliency detection. Infrared Phys. Technol. 2016, 76, 52–64. [Google Scholar] [CrossRef]
- Pozzer, S.; De Souza, M.P.V.; Hena, B.; Hesam, S.; Rezayiye, R.K.; Azar, E.R.; Lopez, F.; Maldague, X. Effect of different imaging modalities on the performance of a CNN: An experimental study on damage segmentation in infrared, visible, and fused images of concrete structures. NDT E Int. 2022, 132, 102709. [Google Scholar] [CrossRef]
- Al Lafi, G. 3D Thermal Modeling of Built Environments Using Visual and Infrared Sensing. Ph.D. Thesis, Concordia University, Montreal, QC, Canada, 2017. [Google Scholar]
- Lagüela, S.; Armesto, J.; Arias, P.; Herráez, J. Automation of thermographic 3D modelling through image fusion and image matching techniques. Autom. Constr. 2012, 27, 24–31. [Google Scholar] [CrossRef]
- Pietikainen, M.K. Texture Analysis in Machine Vision; World Scientific: Singapore, 2000; Volume 40. [Google Scholar]
- Bharati, M.H.; Liu, J.J.; MacGregor, J.F. Image texture analysis: Methods and comparisons. Chemom. Intell. Lab. Syst. 2004, 72, 57–71. [Google Scholar] [CrossRef]
- Chebbah, N.K.; Ouslim, M.; Benabid, S. New computer aided diagnostic system using deep neural network and SVM to detect breast cancer in thermography. Quant. Infrared Thermogr. J. 2022, 1–16. [Google Scholar] [CrossRef]
- Liu, X.; Wang, Y.; Luan, J. Facial Paralysis Detection in Infrared Thermal Images Using Asymmetry Analysis of Temperature and Texture Features. Diagnostics 2021, 11, 2309. [Google Scholar] [CrossRef] [PubMed]
- Curio, C.; Edelbrunner, J.; Kalinke, T.; Tzomakas, C.; Von Seelen, W. Walking pedestrian recognition. IEEE Trans. Intell. Transp. Syst. 2000, 1, 155–163. [Google Scholar] [CrossRef]
- Feng, Q.; Liu, J.; Gong, J. UAV remote sensing for urban vegetation mapping using random forest and texture analysis. Remote Sens. 2015, 7, 1074–1094. [Google Scholar] [CrossRef] [Green Version]
- Di, H.; Gao, D.; AlRegib, G. Developing a seismic texture analysis neural network for machine-aided seismic pattern recognition and classification. Geophys. J. Int. 2019, 218, 1262–1275. [Google Scholar] [CrossRef]
- Koutsoudis, A.; Ioannakis, G.; Pistofidis, P.; Arnaoutoglou, F.; Kazakis, N.; Pavlidis, G.; Chamzas, C.; Tsirliganis, N. Multispectral aerial imagery-based 3D digitisation, segmentation and annotation of large scale urban areas of significant cultural value. J. Cult. Herit. 2021, 49, 1–9. [Google Scholar] [CrossRef]
- Kakadiaris, I.A.; Passalis, G.; Theoharis, T.; Toderici, G.; Konstantinidis, I.; Murtuza, N. Multimodal face recognition: Combination of geometry with physiological information. In Proceedings of the 2005 IEEE Computer Society Conference on Computer Vision and Pattern Recognition (CVPR’05), San Diego, CA, USA, 20–25 June 2005; Volume 2, pp. 1022–1029. [Google Scholar]
- Racoviteanu, A.; Williams, M.W. Decision tree and texture analysis for mapping debris-covered glaciers in the Kangchenjunga area, Eastern Himalaya. Remote Sens. 2012, 4, 3078–3109. [Google Scholar] [CrossRef] [Green Version]
- Liu, T.; Li, R.; Zhong, X.; Jiang, M.; Jin, X.; Zhou, P.; Liu, S.; Sun, C.; Guo, W. Estimates of rice lodging using indices derived from UAV visible and thermal infrared images. Agric. For. Meteorol. 2018, 252, 144–154. [Google Scholar] [CrossRef]
- Jarc, A.; Perš, J.; Rogelj, P.; Perše, M.; Kovačič, S. Texture Features for Affine Registration of Thermal (FLIR) and Visible Images; Citeseer: St. Lambrecht, Austria, 2007. [Google Scholar]
- Chen, C.; Chandra, S.; Seo, H. Automatic Pavement Defect Detection and Classification Using RGB-Thermal Images Based on Hierarchical Residual Attention Network. Sensors 2022, 22, 5781. [Google Scholar] [CrossRef] [PubMed]
- Jin Lim, H.; Hwang, S.; Kim, H.; Sohn, H. Steel bridge corrosion inspection with combined vision and thermographic images. Struct. Health Monit. 2021, 20, 3424–3435. [Google Scholar] [CrossRef]
- Gallardo-Saavedra, S.; Hernández-Callejo, L.; Alonso-García, M.d.C.; Muñoz-Cruzado-Alba, J.; Ballestín-Fuertes, J. Infrared thermography for the detection and characterization of photovoltaic defects: Comparison between illumination and dark conditions. Sensors 2020, 20, 4395. [Google Scholar] [CrossRef]
- Wang, B.; Zou, Y.; Zhang, L.; Li, Y.; Chen, Q.; Zuo, C. Multimodal super-resolution reconstruction of infrared and visible images via deep learning. Opt. Lasers Eng. 2022, 156, 107078. [Google Scholar] [CrossRef]
- Mo, Y.; Wu, Y.; Yang, X.; Liu, F.; Liao, Y. Review the state-of-the-art technologies of semantic segmentation based on deep learning. Neurocomputing 2022, 493, 626–646. [Google Scholar] [CrossRef]
- Cordts, M.; Omran, M.; Ramos, S.; Rehfeld, T.; Enzweiler, M.; Benenson, R.; Franke, U.; Roth, S.; Schiele, B. The Cityscapes Dataset for Semantic Urban Scene Understanding. In Proceedings of the 2016 IEEE Conference on Computer Vision and Pattern Recognition (CVPR), Las Vegas, NV, USA, 27–30 June 2016; pp. 3213–3223. [Google Scholar] [CrossRef] [Green Version]
- Kuutti, S.; Bowden, R.; Jin, Y.; Barber, P.; Fallah, S. A Survey of Deep Learning Applications to Autonomous Vehicle Control. IEEE Trans. Intell. Transp. Syst. 2021, 22, 712–733. [Google Scholar] [CrossRef]
- Alberti, E.; Tavera, A.; Masone, C.; Caputo, B. IDDA: A Large-Scale Multi-Domain Dataset for Autonomous Driving. IEEE Robot. Autom. Lett. 2020, 5, 5526–5533. [Google Scholar] [CrossRef]
- Ronneberger, O.; Fischer, P.; Brox, T. U-net: Convolutional networks for biomedical image segmentation. In International Conference on Medical Image Computing and Computer-Assisted Intervention; Springer: Munich, Germany, 2015; pp. 234–241. [Google Scholar]
- Zhou, Z.; Siddiquee, M.M.R.; Tajbakhsh, N.; Liang, J. UNet++: A Nested U-Net Architecture for Medical Image Segmentation. In Deep Learning in Medical Image Analysis and Multimodal Learning for Clinical Decision Support; Springer: Cham, Switzerland, 2018; pp. 3–11. [Google Scholar] [CrossRef]
- He, K.; Zhang, X.; Ren, S.; Sun, J. Deep residual learning for image recognition. In Proceedings of the IEEE Conference on Computer Vision and Pattern Recognition, Las Vegas, NV, USA, 27–30 June 2016; pp. 770–778. [Google Scholar]
- Iakubovskii, P. Segmentation Models Pytorch. 2019. Available online: https://github.com/qubvel/segmentation_models.pytorch (accessed on 3 August 2022).
- Wightman, R.; Touvron, H.; Jégou, H. ResNet Strikes Back: An Improved Training Procedure in Timm. arXiv 2021, arXiv:2110.00476. [Google Scholar] [CrossRef]
- Loshchilov, I.; Hutter, F. Sgdr: Stochastic gradient descent with warm restarts. arXiv 2016, arXiv:1608.03983. [Google Scholar]
- Müller, S.G.; Hutter, F. TrivialAugment: Tuning-free Yet State-of-the-Art Data Augmentation. In Proceedings of the IEEE/CVF International Conference on Computer Vision, Virtual, 11–17 October 2021; pp. 774–782. [Google Scholar] [CrossRef]
- Wang, Z.; Bovik, A.; Sheikh, H.; Simoncelli, E. Image quality assessment: From error visibility to structural similarity. IEEE Trans. Image Process. 2004, 13, 600–612. [Google Scholar] [CrossRef] [Green Version]
- Zuiderveld, K. Contrast limited adaptive histogram equalization. Graph. Gems 1994, 474–485. [Google Scholar]
- Astrachan, P.M. Enhanced Histogram Equalization. U.S. Patent 8,698,961, 15 April 2014. [Google Scholar]
- Lin, T.Y.; Dollár, P.; Girshick, R.; He, K.; Hariharan, B.; Belongie, S. Feature Pyramid Networks for Object Detection. In Proceedings of the IEEE Conference on Computer Vision and Pattern Recognition, Las Vegas, NV, USA, 27–30 June 2016; pp. 2117–2125. [Google Scholar] [CrossRef]
- Huang, G.; Liu, Z.; Van Der Maaten, L.; Weinberger, K.Q. Densely Connected Convolutional Networks. In Proceedings of the 2017 IEEE Conference on Computer Vision and Pattern Recognition (CVPR), Honolulu, HI, USA, 21–26 July 2017; pp. 2261–2269. [Google Scholar] [CrossRef] [Green Version]
- Bavirisetti, D.P.; Dhuli, R. Fusion of infrared and visible sensor images based on anisotropic diffusion and Karhunen-Loeve transform. IEEE Sens. J. 2015, 16, 203–209. [Google Scholar] [CrossRef]
- Li, H.; Wu, X.J.; Kittler, J. Infrared and visible image fusion using a deep learning framework. In Proceedings of the 2018 24th international conference on pattern recognition (ICPR), Beijing, China, 20–24 August 2018; pp. 2705–2710. [Google Scholar]
- Li, S.; Kang, X.; Hu, J. Image fusion with guided filtering. IEEE Trans. Image Process. 2013, 22, 2864–2875. [Google Scholar] [PubMed]
- Simonyan, K.; Zisserman, A. Very deep convolutional networks for large-scale image recognition. arXiv 2014, arXiv:1409.1556. [Google Scholar]
- Toet, A. Image fusion by a ratio of low-pass pyramid. Pattern Recognit. Lett. 1989, 9, 245–253. [Google Scholar] [CrossRef]
- Zhang, Q.; Guo, B.l. Multifocus image fusion using the nonsubsampled contourlet transform. Signal Process. 2009, 89, 1334–1346. [Google Scholar] [CrossRef]
- Shi, Y.; Cui, L.; Qi, Z.; Meng, F.; Chen, Z. Automatic road crack detection using random structured forests. IEEE Trans. Intell. Transp. Syst. 2016, 17, 3434–3445. [Google Scholar] [CrossRef]
- Zou, Q.; Zhang, Z.; Li, Q.; Qi, X.; Wang, Q.; Wang, S. Deepcrack: Learning hierarchical convolutional features for crack detection. IEEE Trans. Image Process. 2018, 28, 1498–1512. [Google Scholar] [CrossRef]
- Kingma, D.P.; Ba, J. Adam: A method for stochastic optimization. arXiv 2014, arXiv:1412.6980. [Google Scholar]
- Kim, W.; Kanezaki, A.; Tanaka, M. Unsupervised learning of image segmentation based on differentiable feature clustering. IEEE Trans. Image Process. 2020, 29, 8055–8068. [Google Scholar] [CrossRef]
- Escobar-Wolf, R.; Oommen, T.; Brooks, C.N.; Dobson, R.J.; Ahlborn, T.M. Unmanned aerial vehicle (UAV)-based assessment of concrete bridge deck delamination using thermal and visible camera sensors: A preliminary analysis. Res. Nondestruct. Eval. 2018, 29, 183–198. [Google Scholar] [CrossRef]
- Lee, E.J.; Shin, S.Y.; Ko, B.C.; Chang, C. Early sinkhole detection using a drone-based thermal camera and image processing. Infrared Phys. Technol. 2016, 78, 223–232. [Google Scholar] [CrossRef]
Figure 1.
Nondestructive inspection of a concrete bridge using a multi-sensor drone. The left image shows a visual inspection being performed with a drone equipped with multi-modal camera, and the right images show an example of the inspection results: top right image shows the output from the visible camera, and bottom right image shows the corespondent output from the thermal camera.
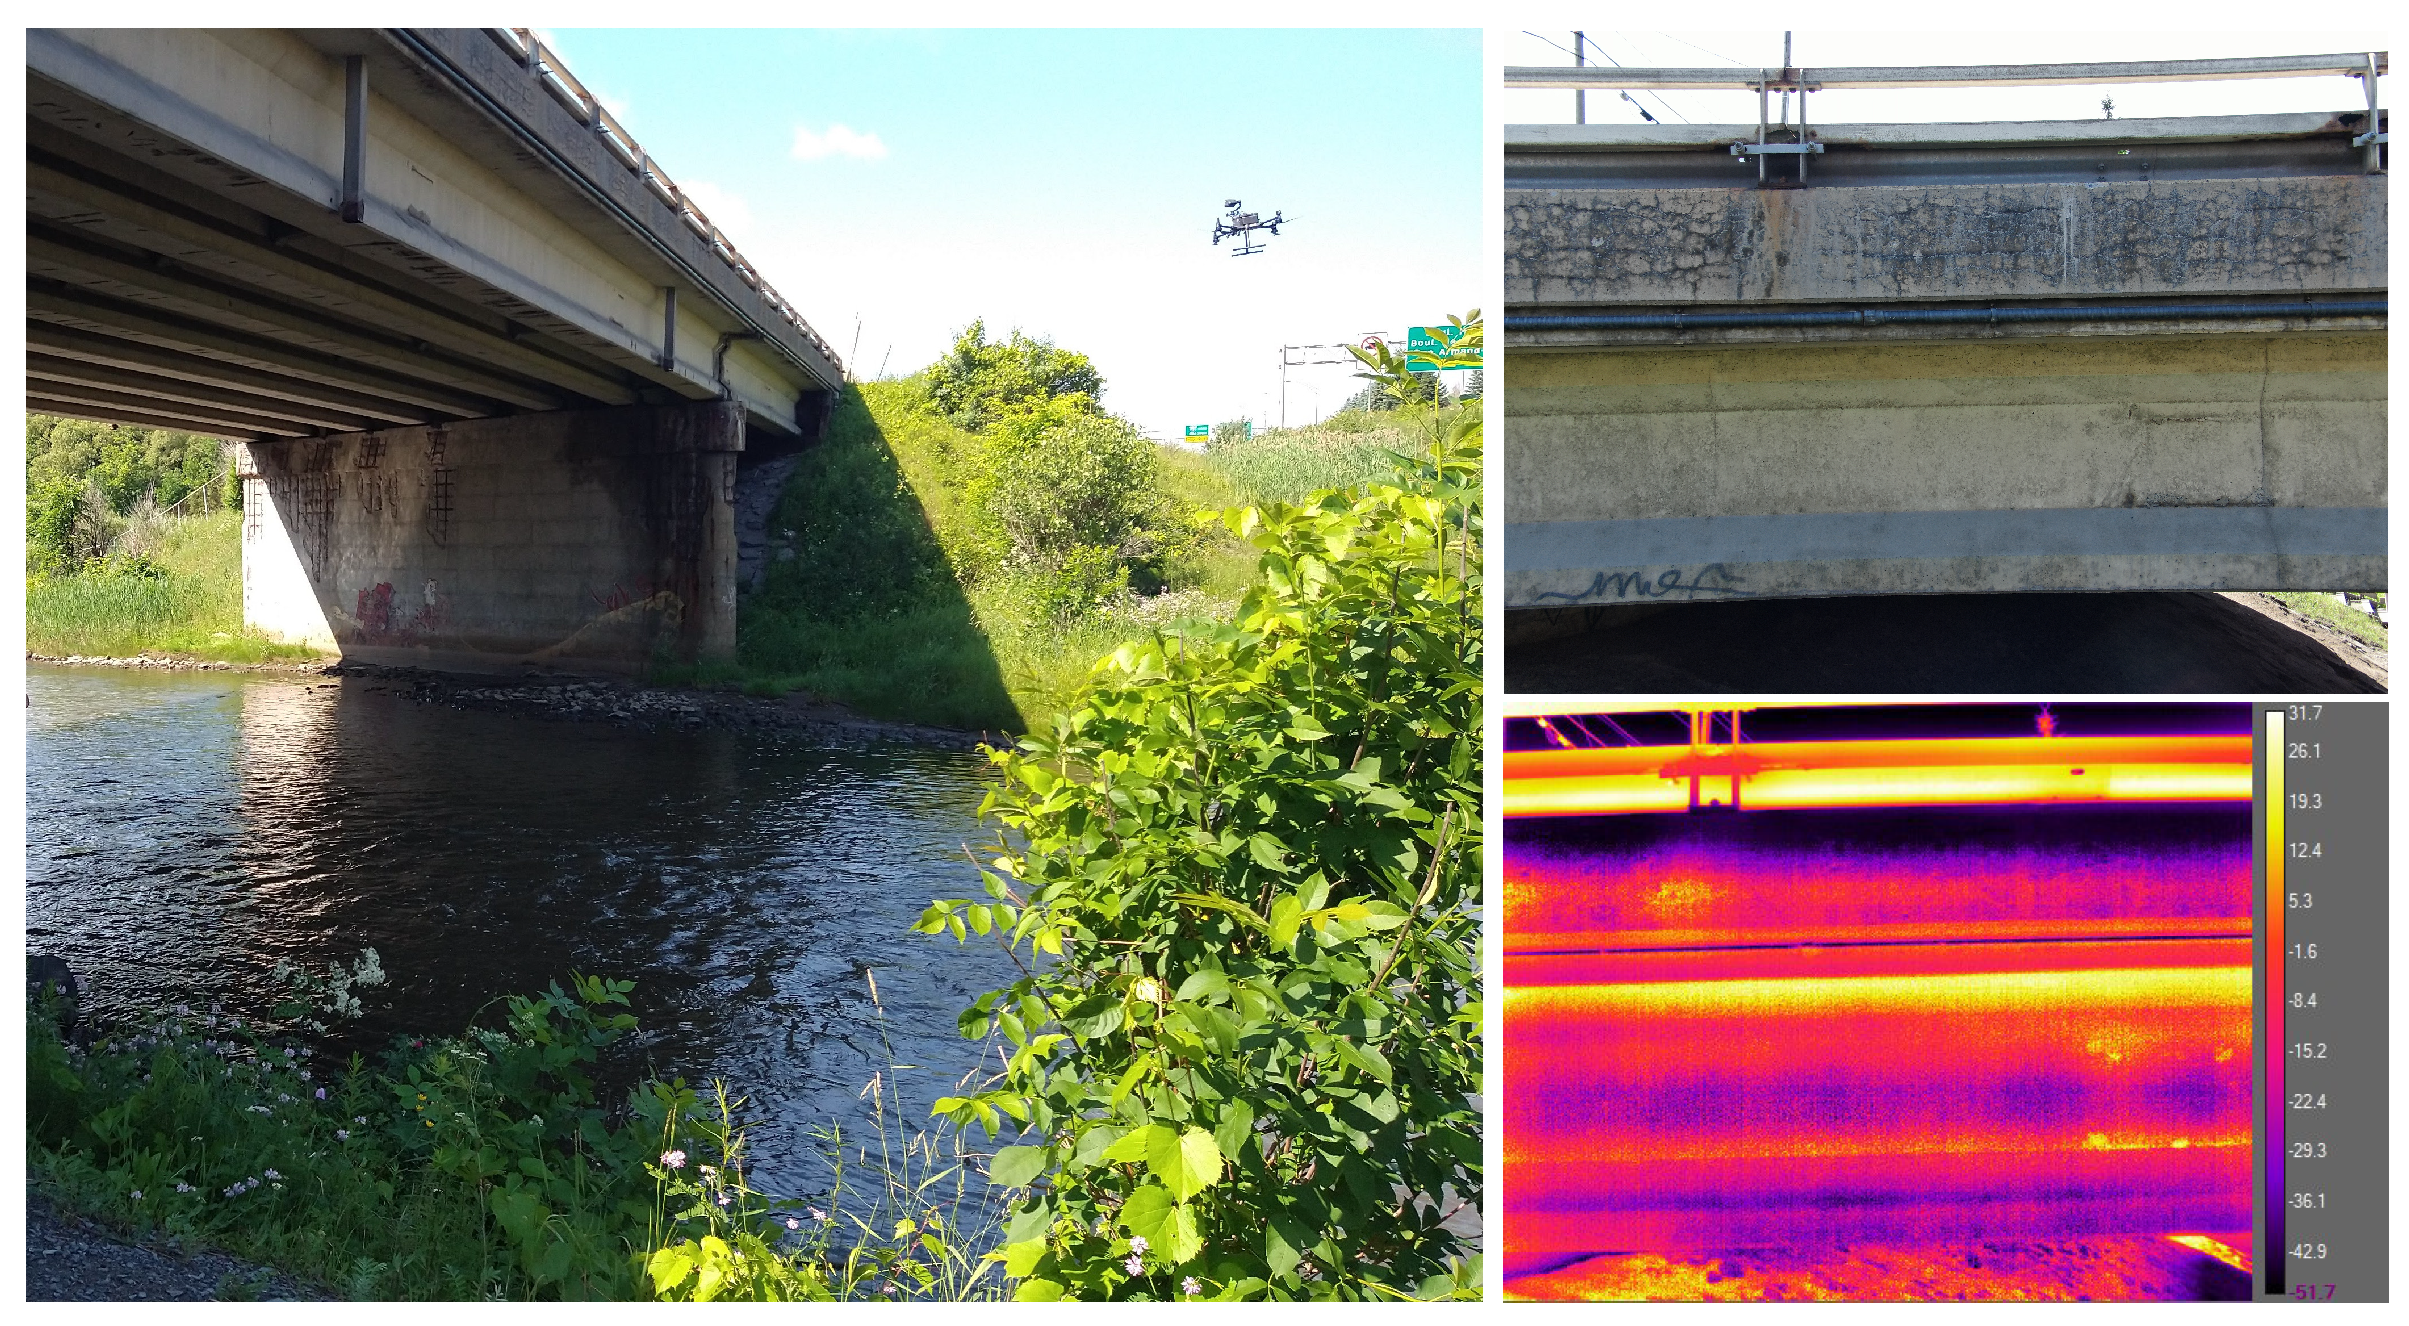
Figure 2.
Results from different fusion methods using correspondent thermal and visible images. The top row shows thermal, visible and overlaid images, and the bottom row is the results of Multi-scale [41], Hybrid [42], and Saliency-based [43] fusion techniques.

Figure 3.
Process pipeline for the fusion of thermal and visible images.
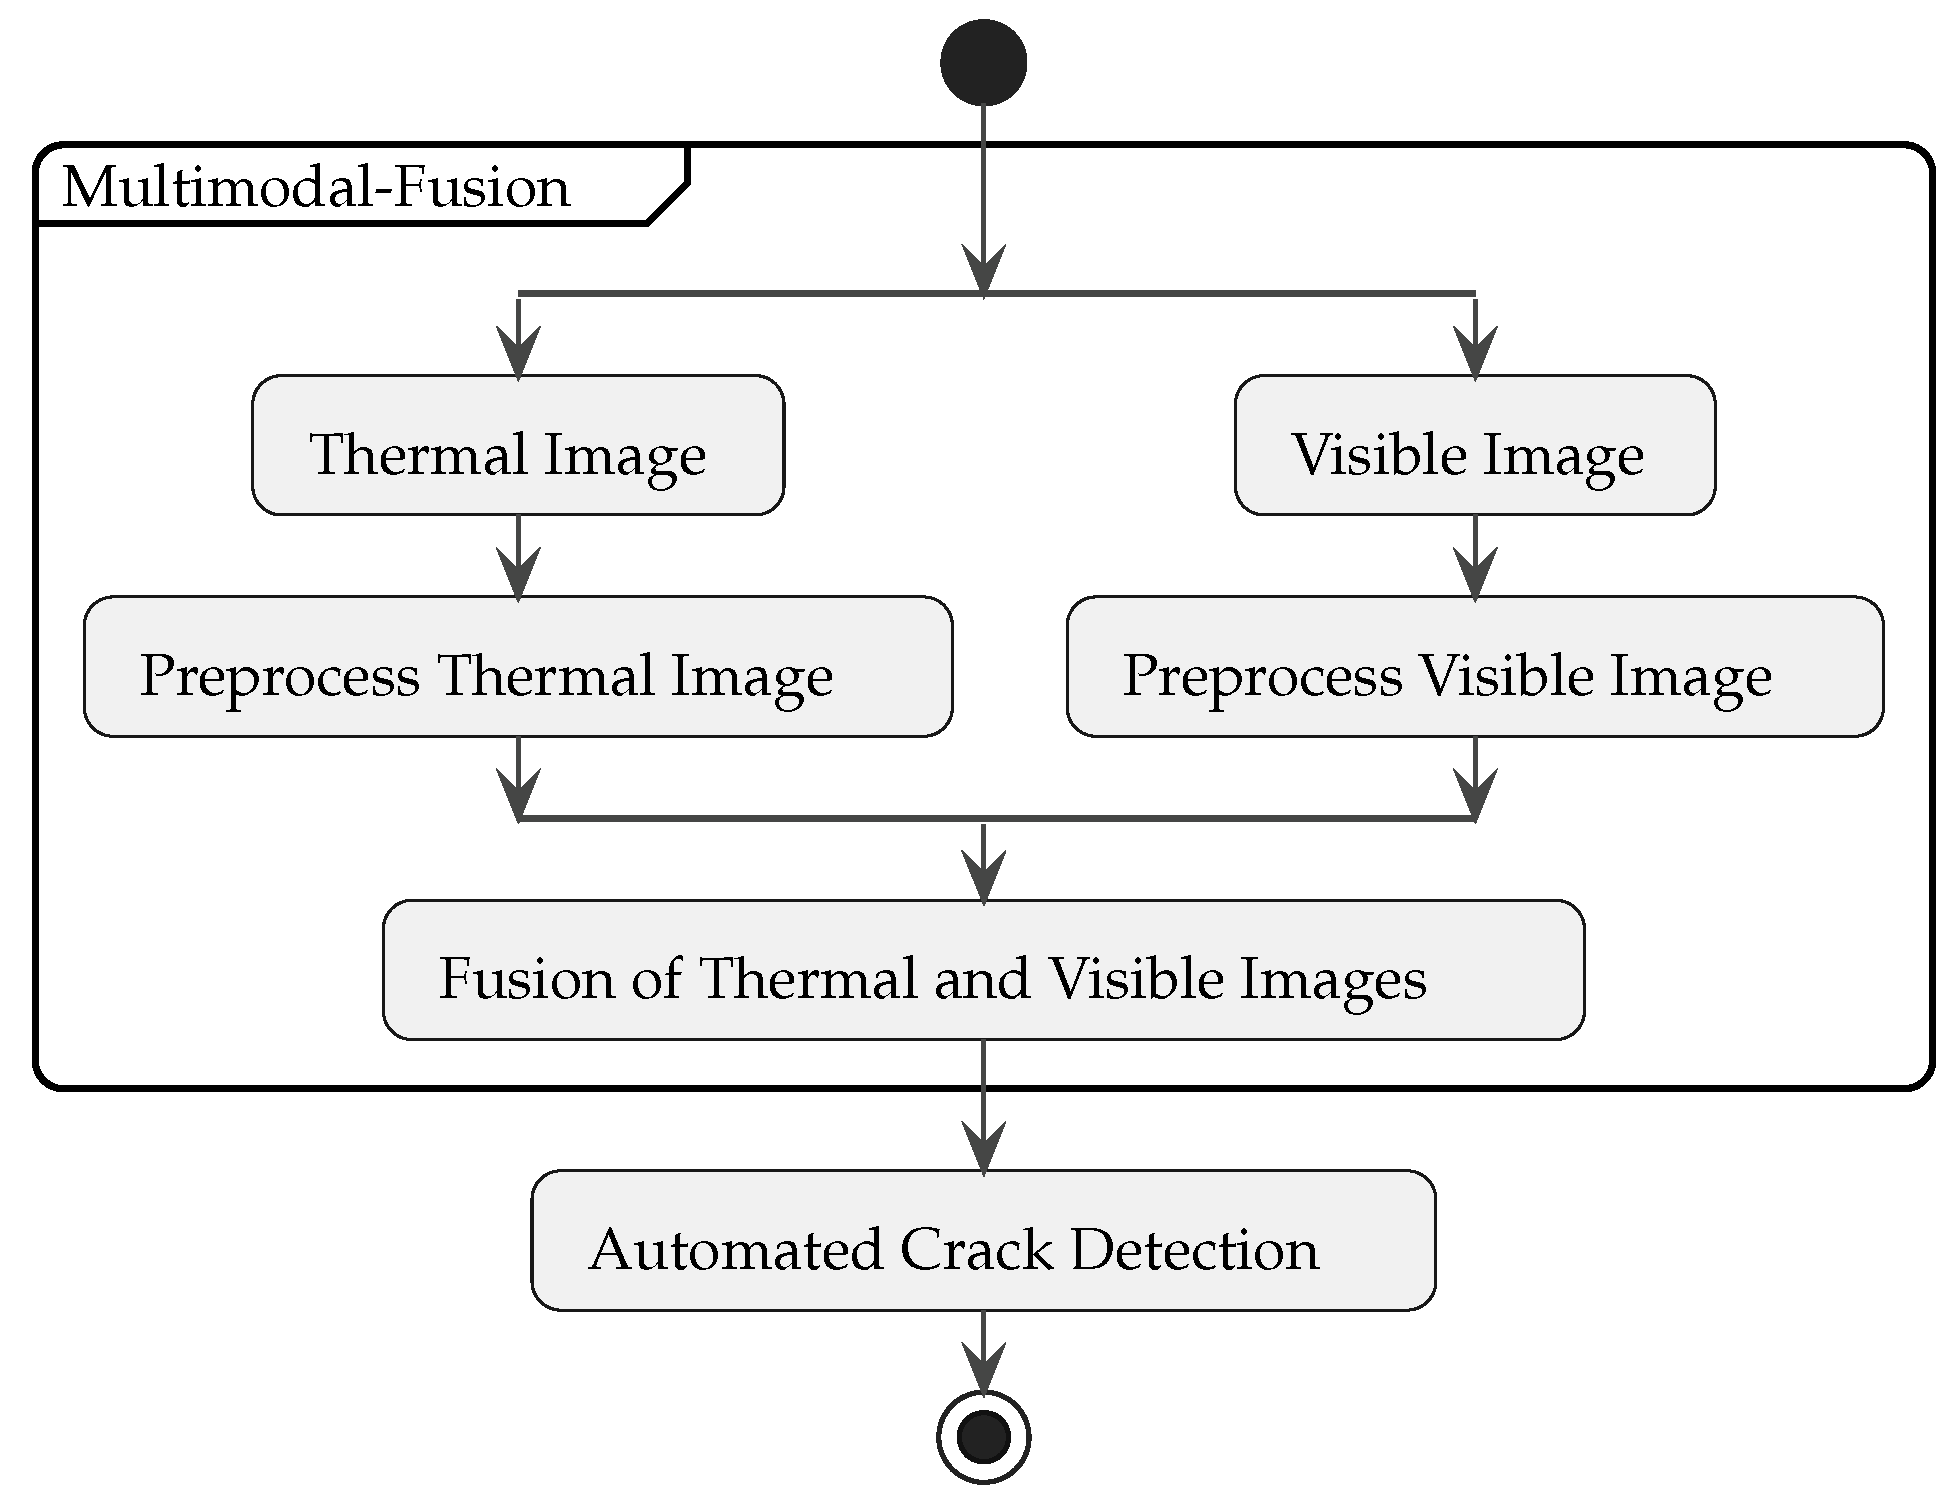
Figure 4.
The sample photos of the acquired dataset and the augmented data. The first, second, and third columns are the real samples from the inspection. In these three columns, the first row images are visible samples, and the second row images are thermal samples. The last column presents two augmented samples: the top image is an augmented shadow, and the bottom image is the augmented low-contrast image.

Figure 5.
Process pipeline for multi-modal abnormal classification.

Figure 6.
The architecture of unsupervised segmentation neural network.

Figure 7.
The sample photos of the multi-modal data acquired from the piping setup.
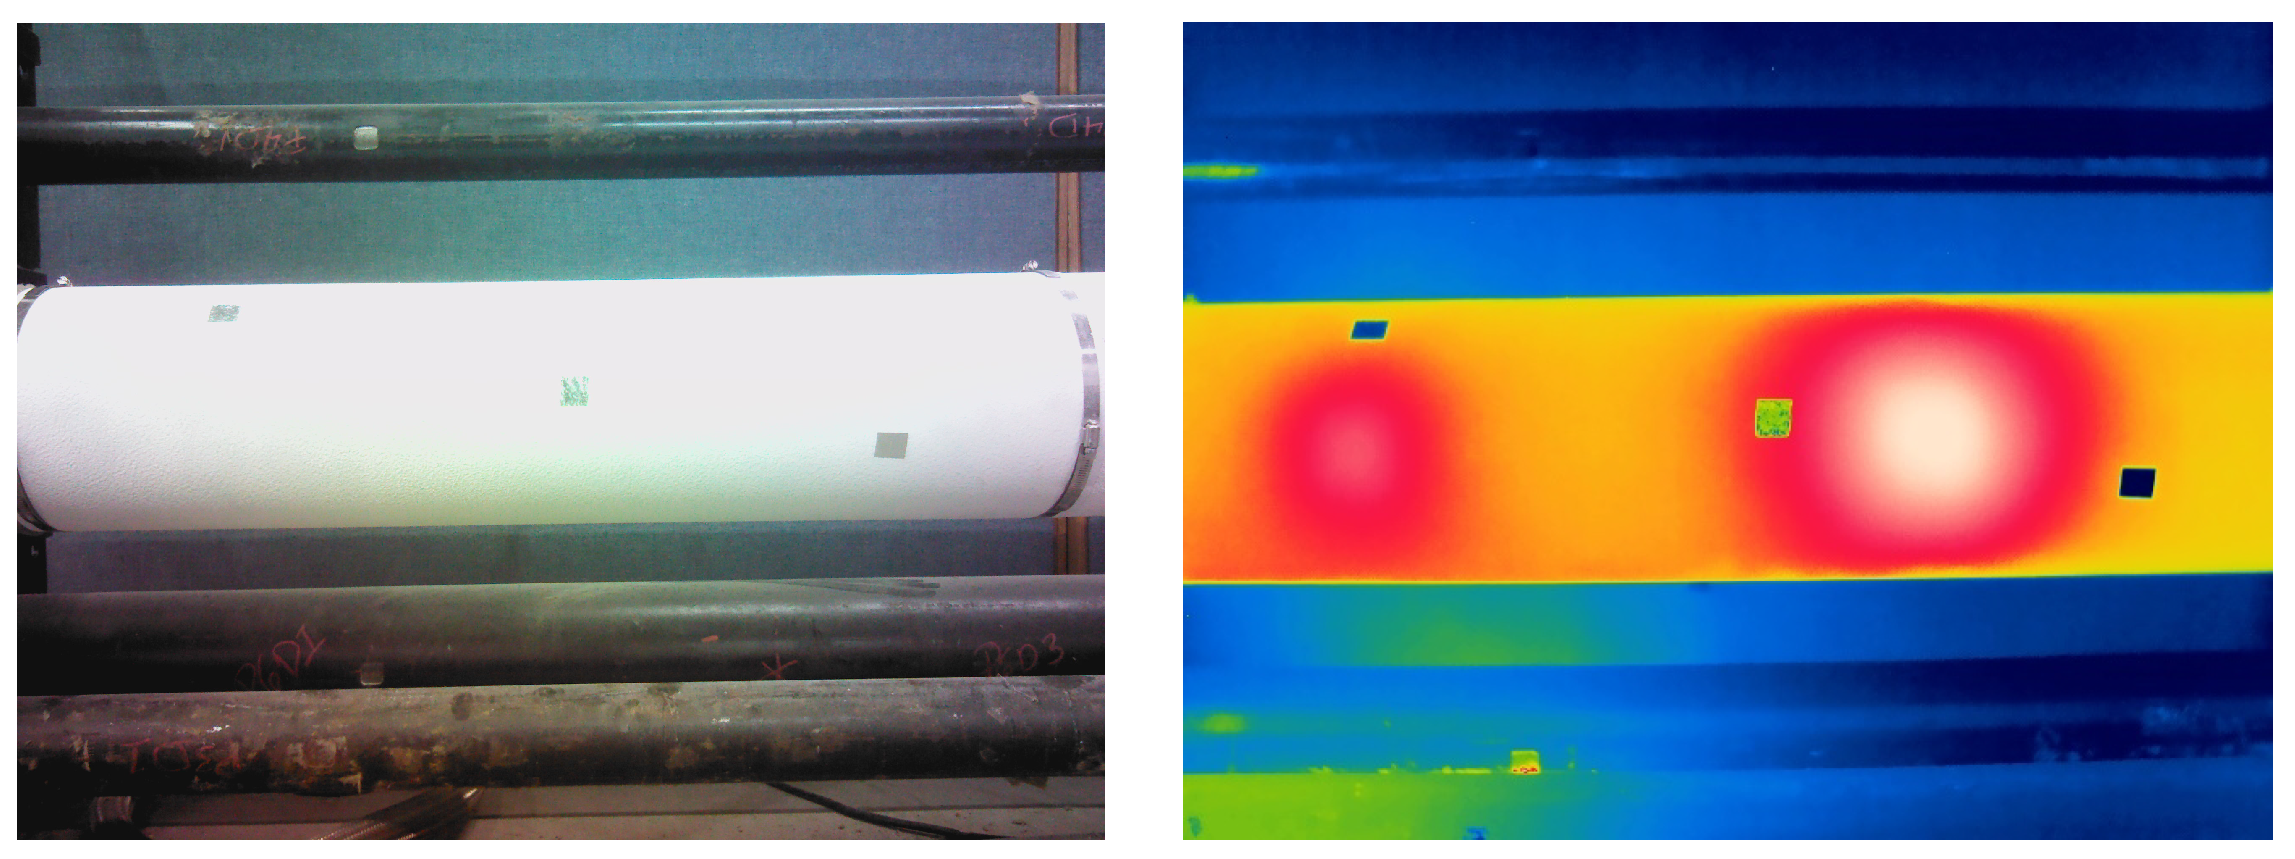
Figure 8.
The inspection plan for the experimental road of Laval Université. Section A presents an operatable section of the road. Additionally, Sections B and C are the damaged parts of the road. The map was created by stitching some of the collected samples. The yellow arrow shows the flight direction.
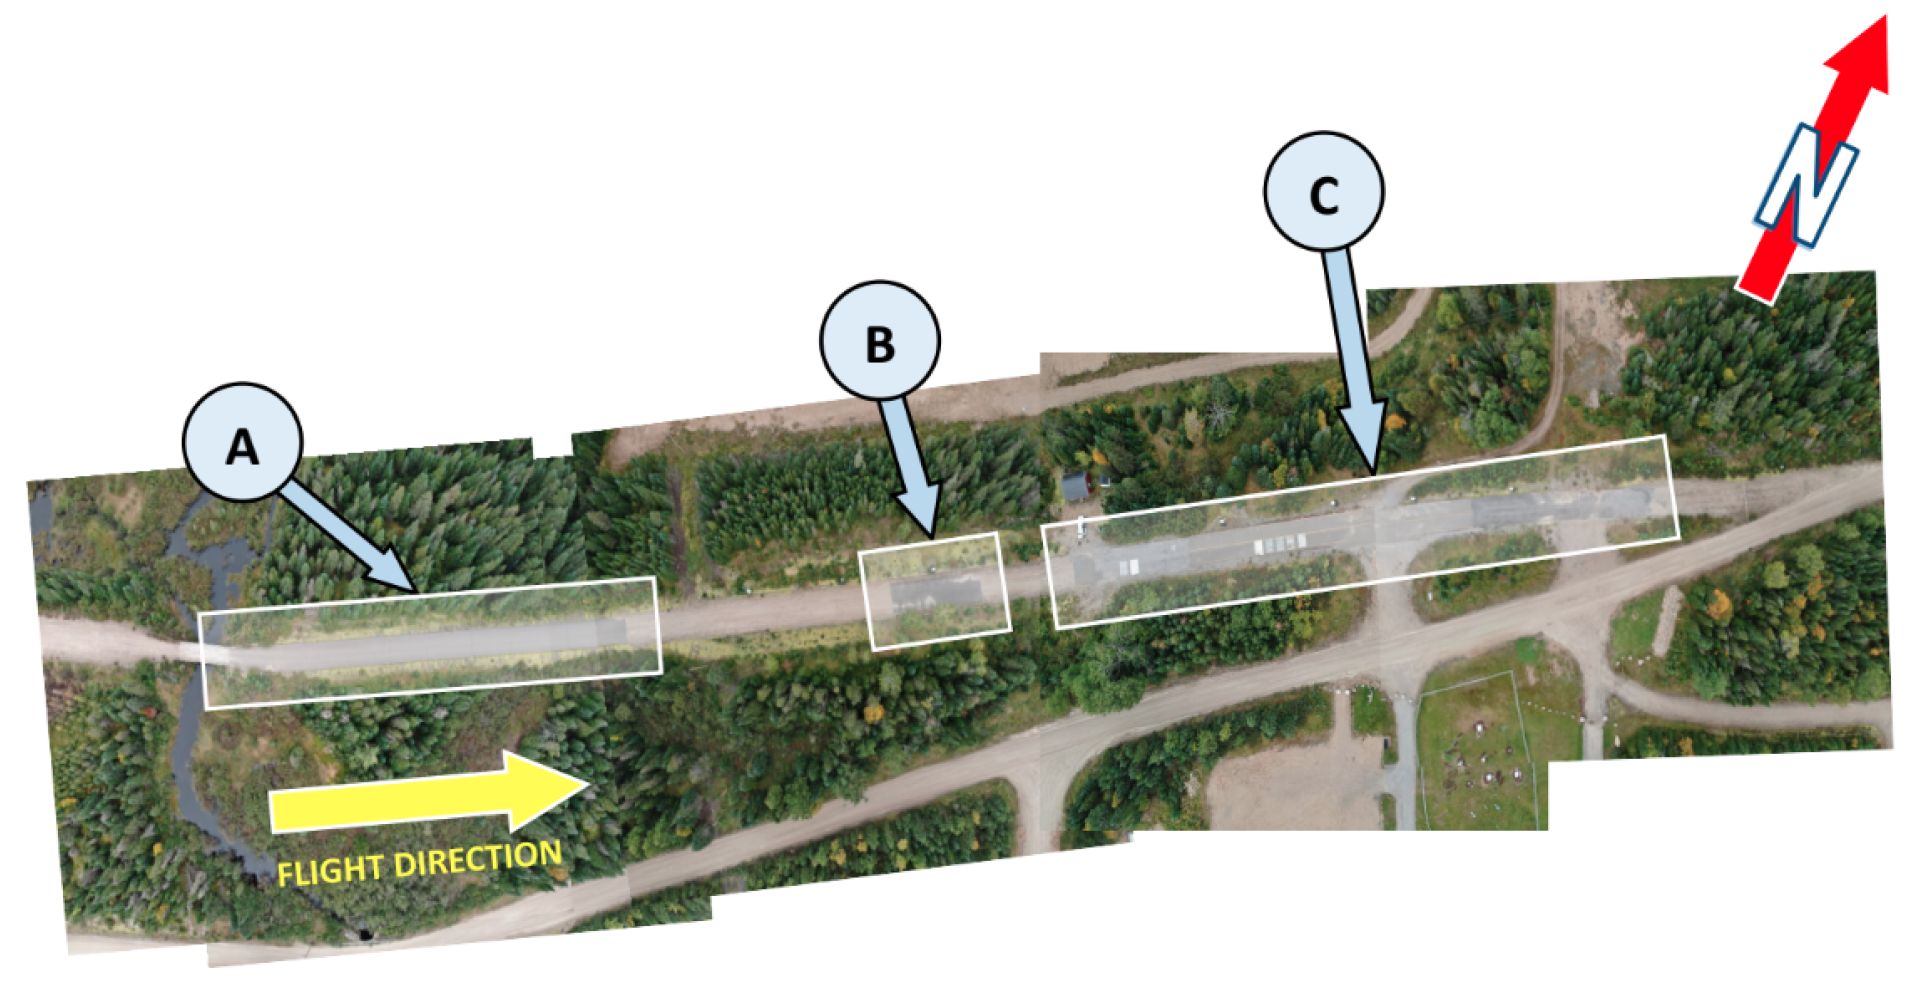
Figure 9.
The sample photos of acquired multi-modal data of paved roads. The first row is the samples of visible images, and the second is the thermal image samples.
Figure 9.
The sample photos of acquired multi-modal data of paved roads. The first row is the samples of visible images, and the second is the thermal image samples.

Figure 10.
The sample photos of acquired multi-modal data of concrete bridge.
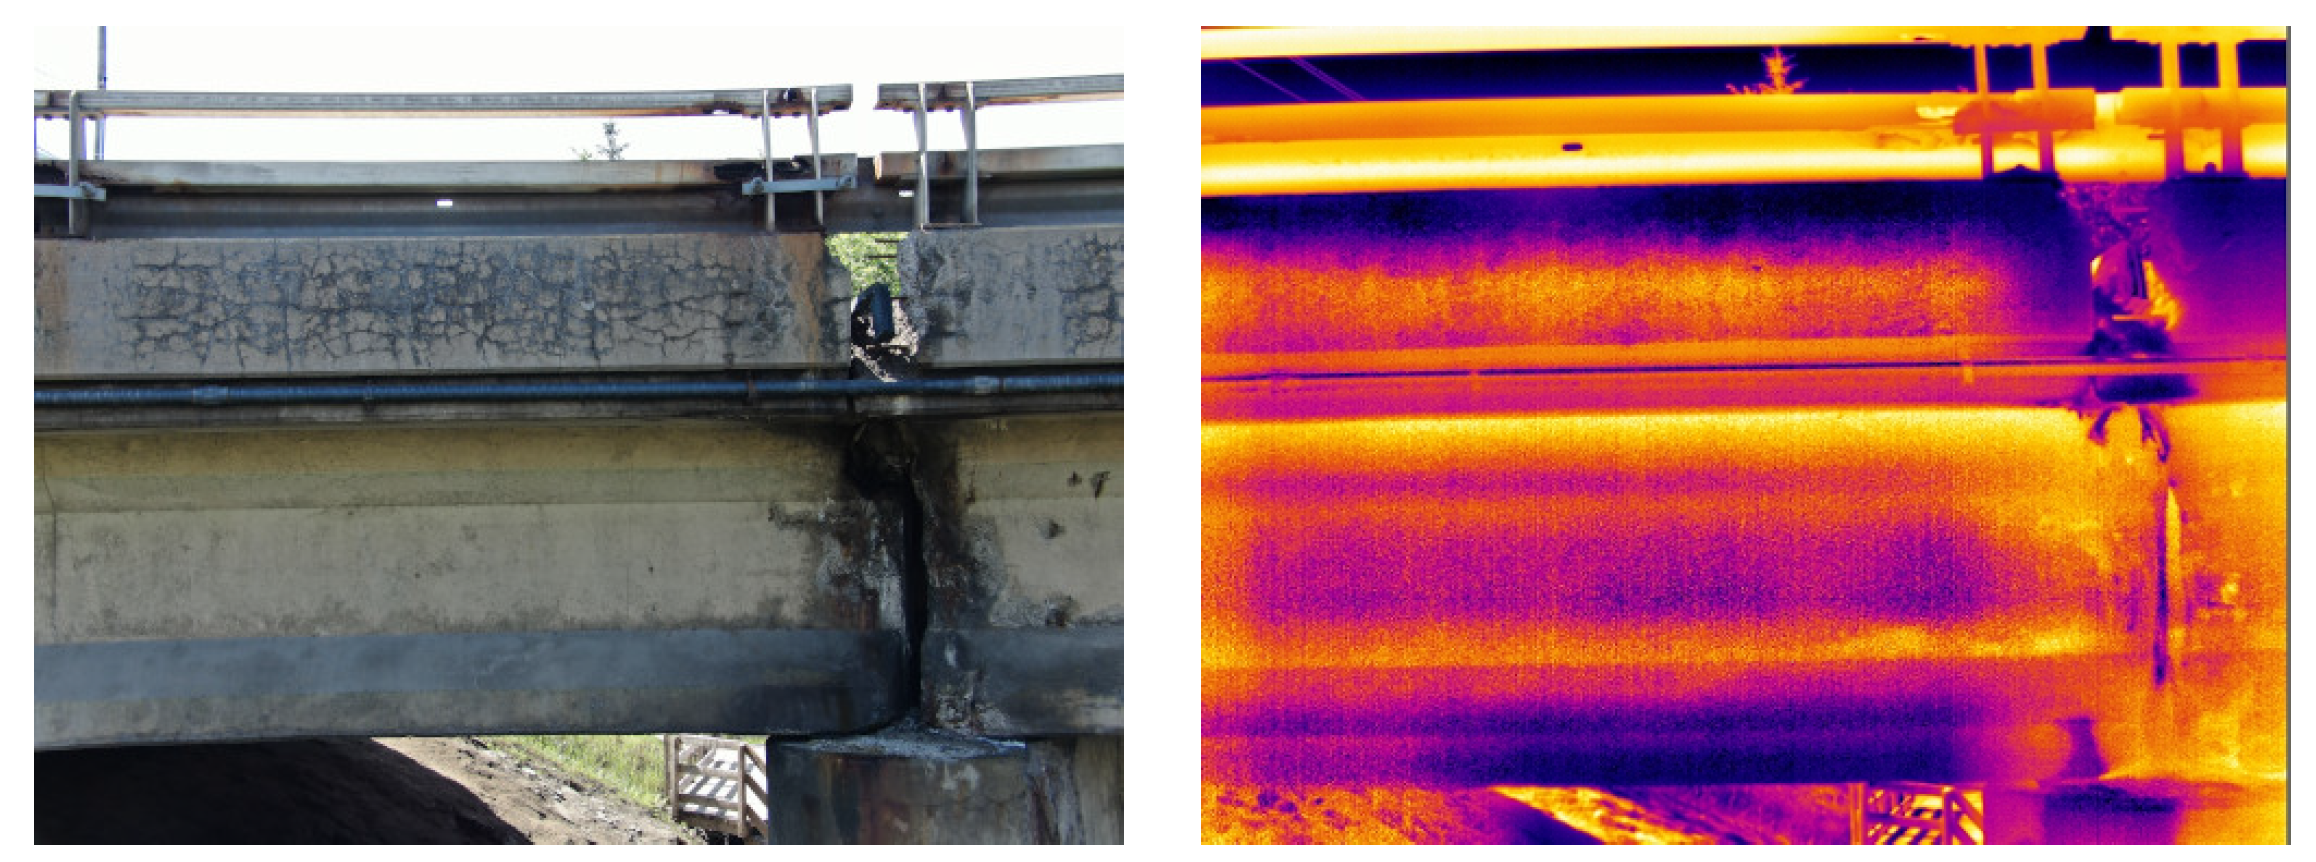
Figure 11.
This figure shows the sample results of fusion methods.
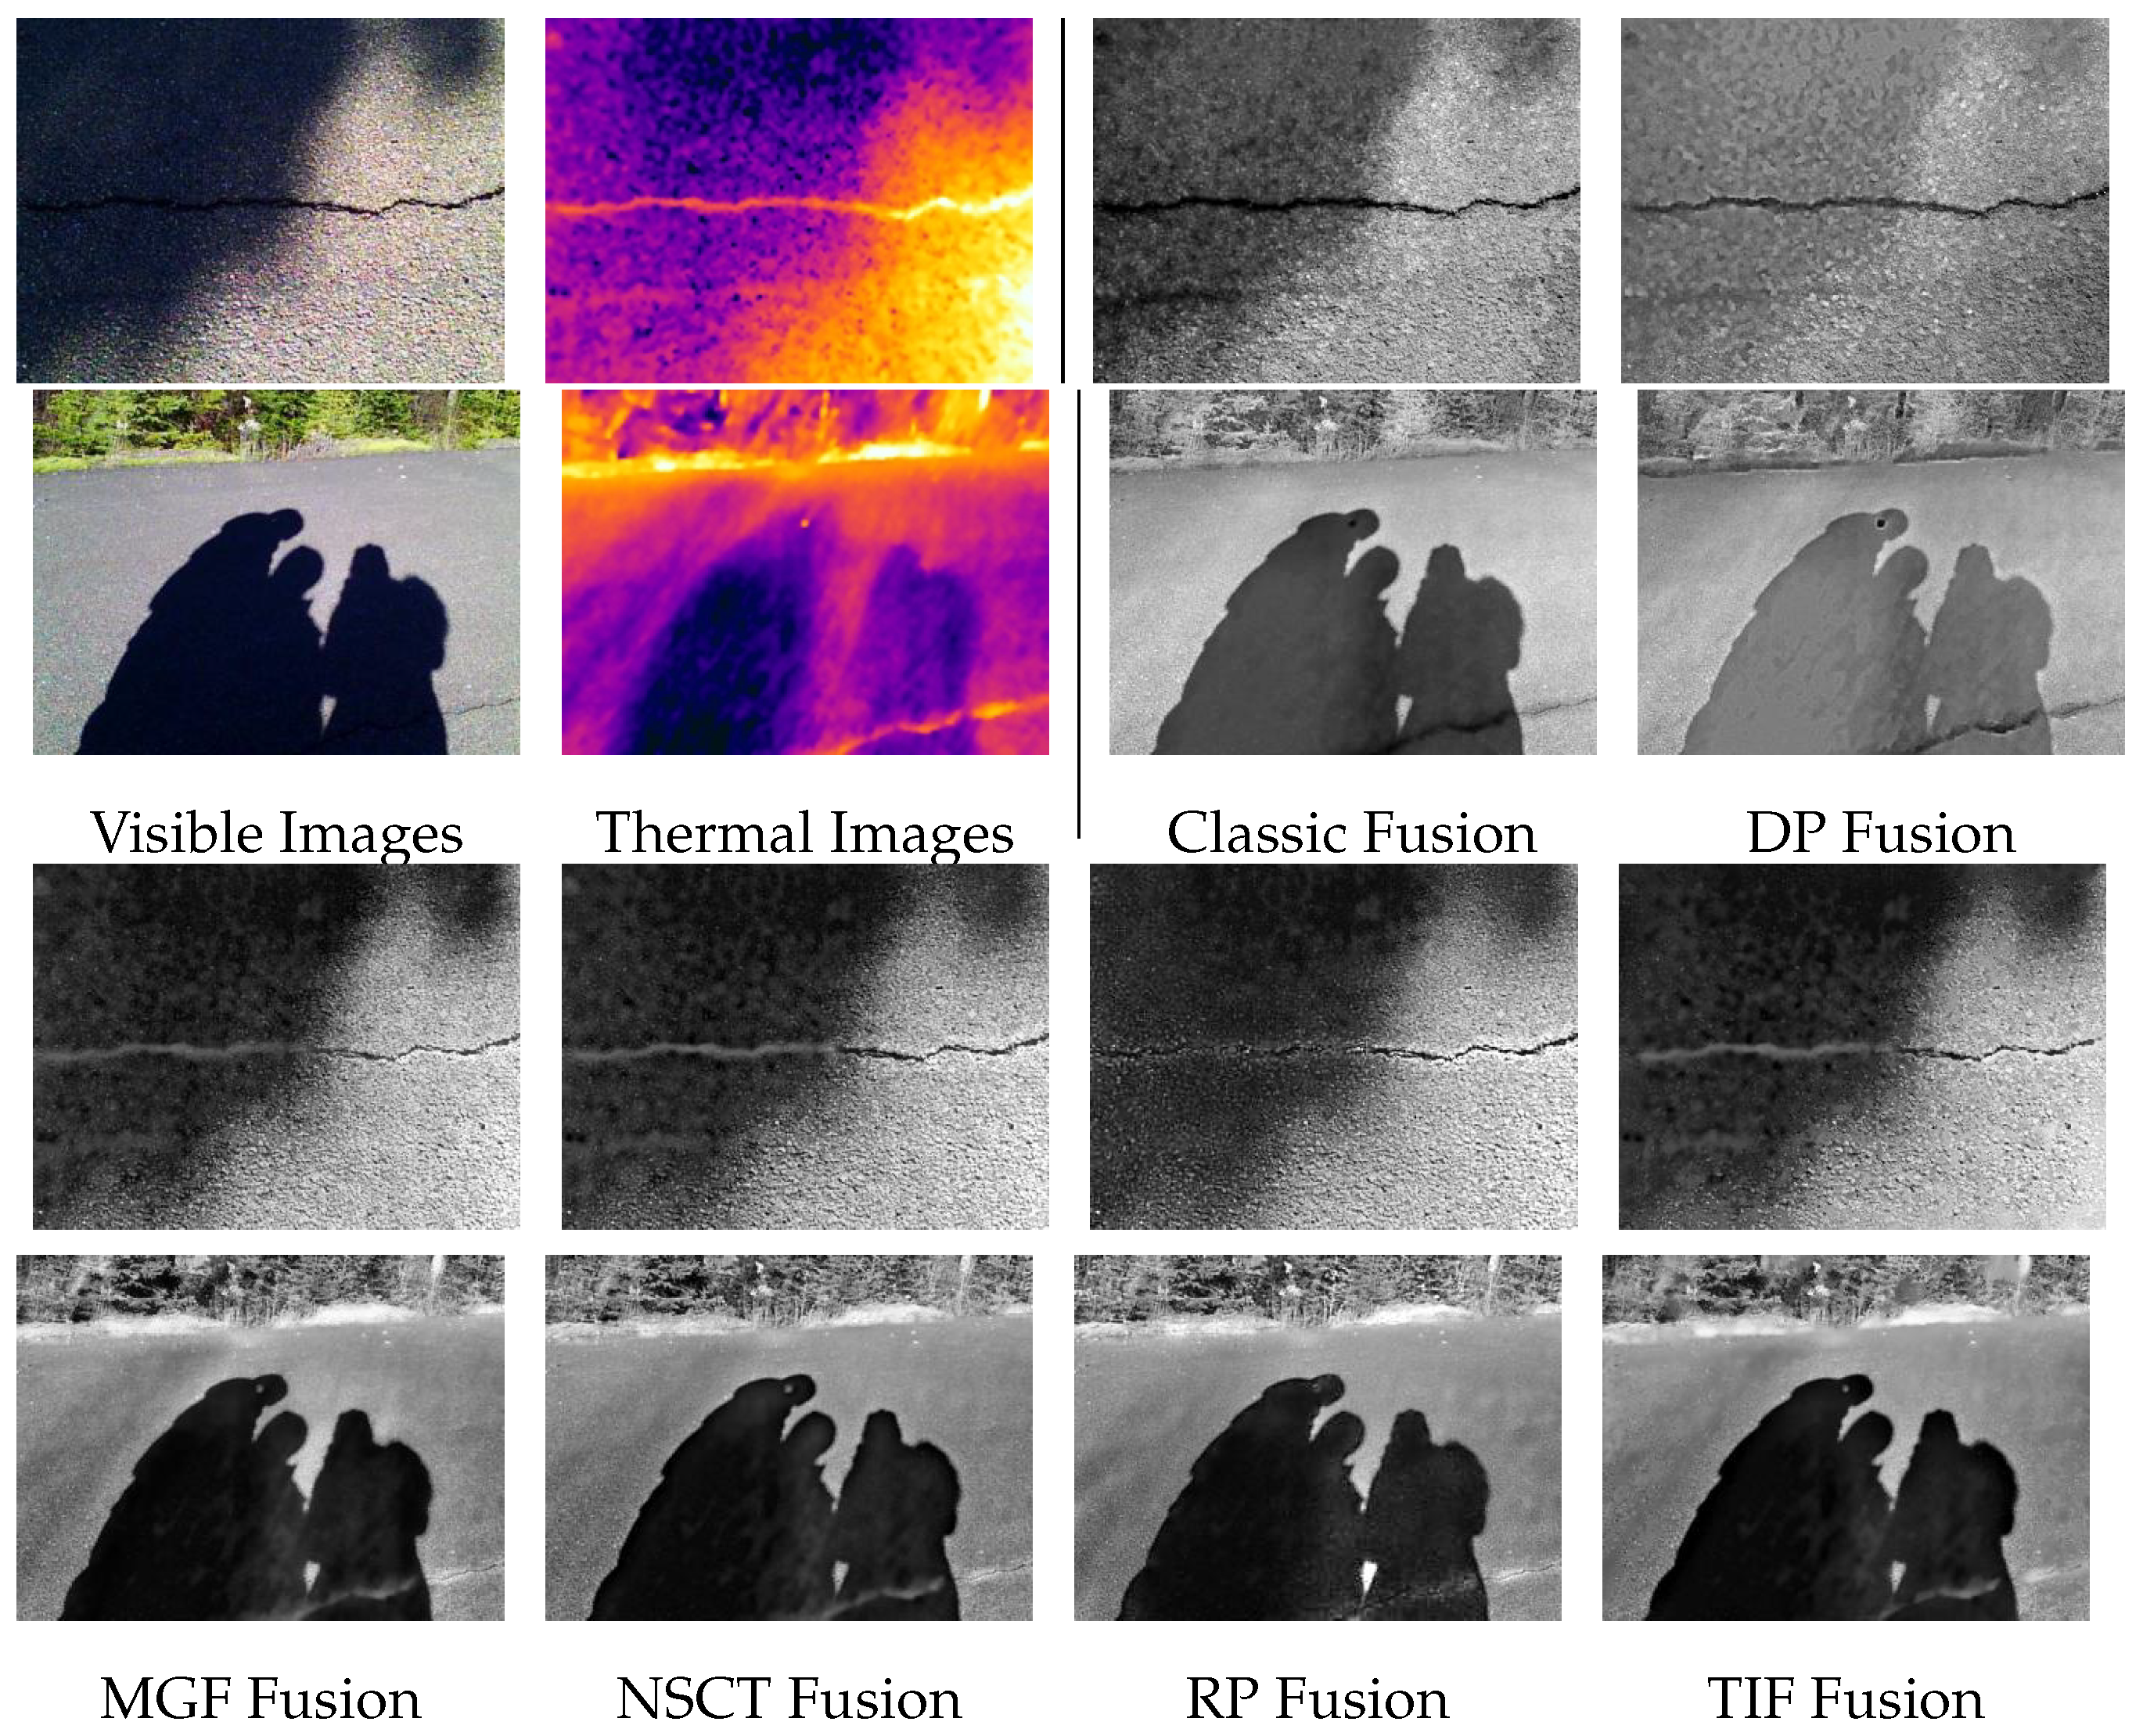
Figure 12.
The training metrics for the automated fusion + crack detection method. Visible column shows the results of crack detection method without any multi-modal fusion.
Figure 12.
The training metrics for the automated fusion + crack detection method. Visible column shows the results of crack detection method without any multi-modal fusion.
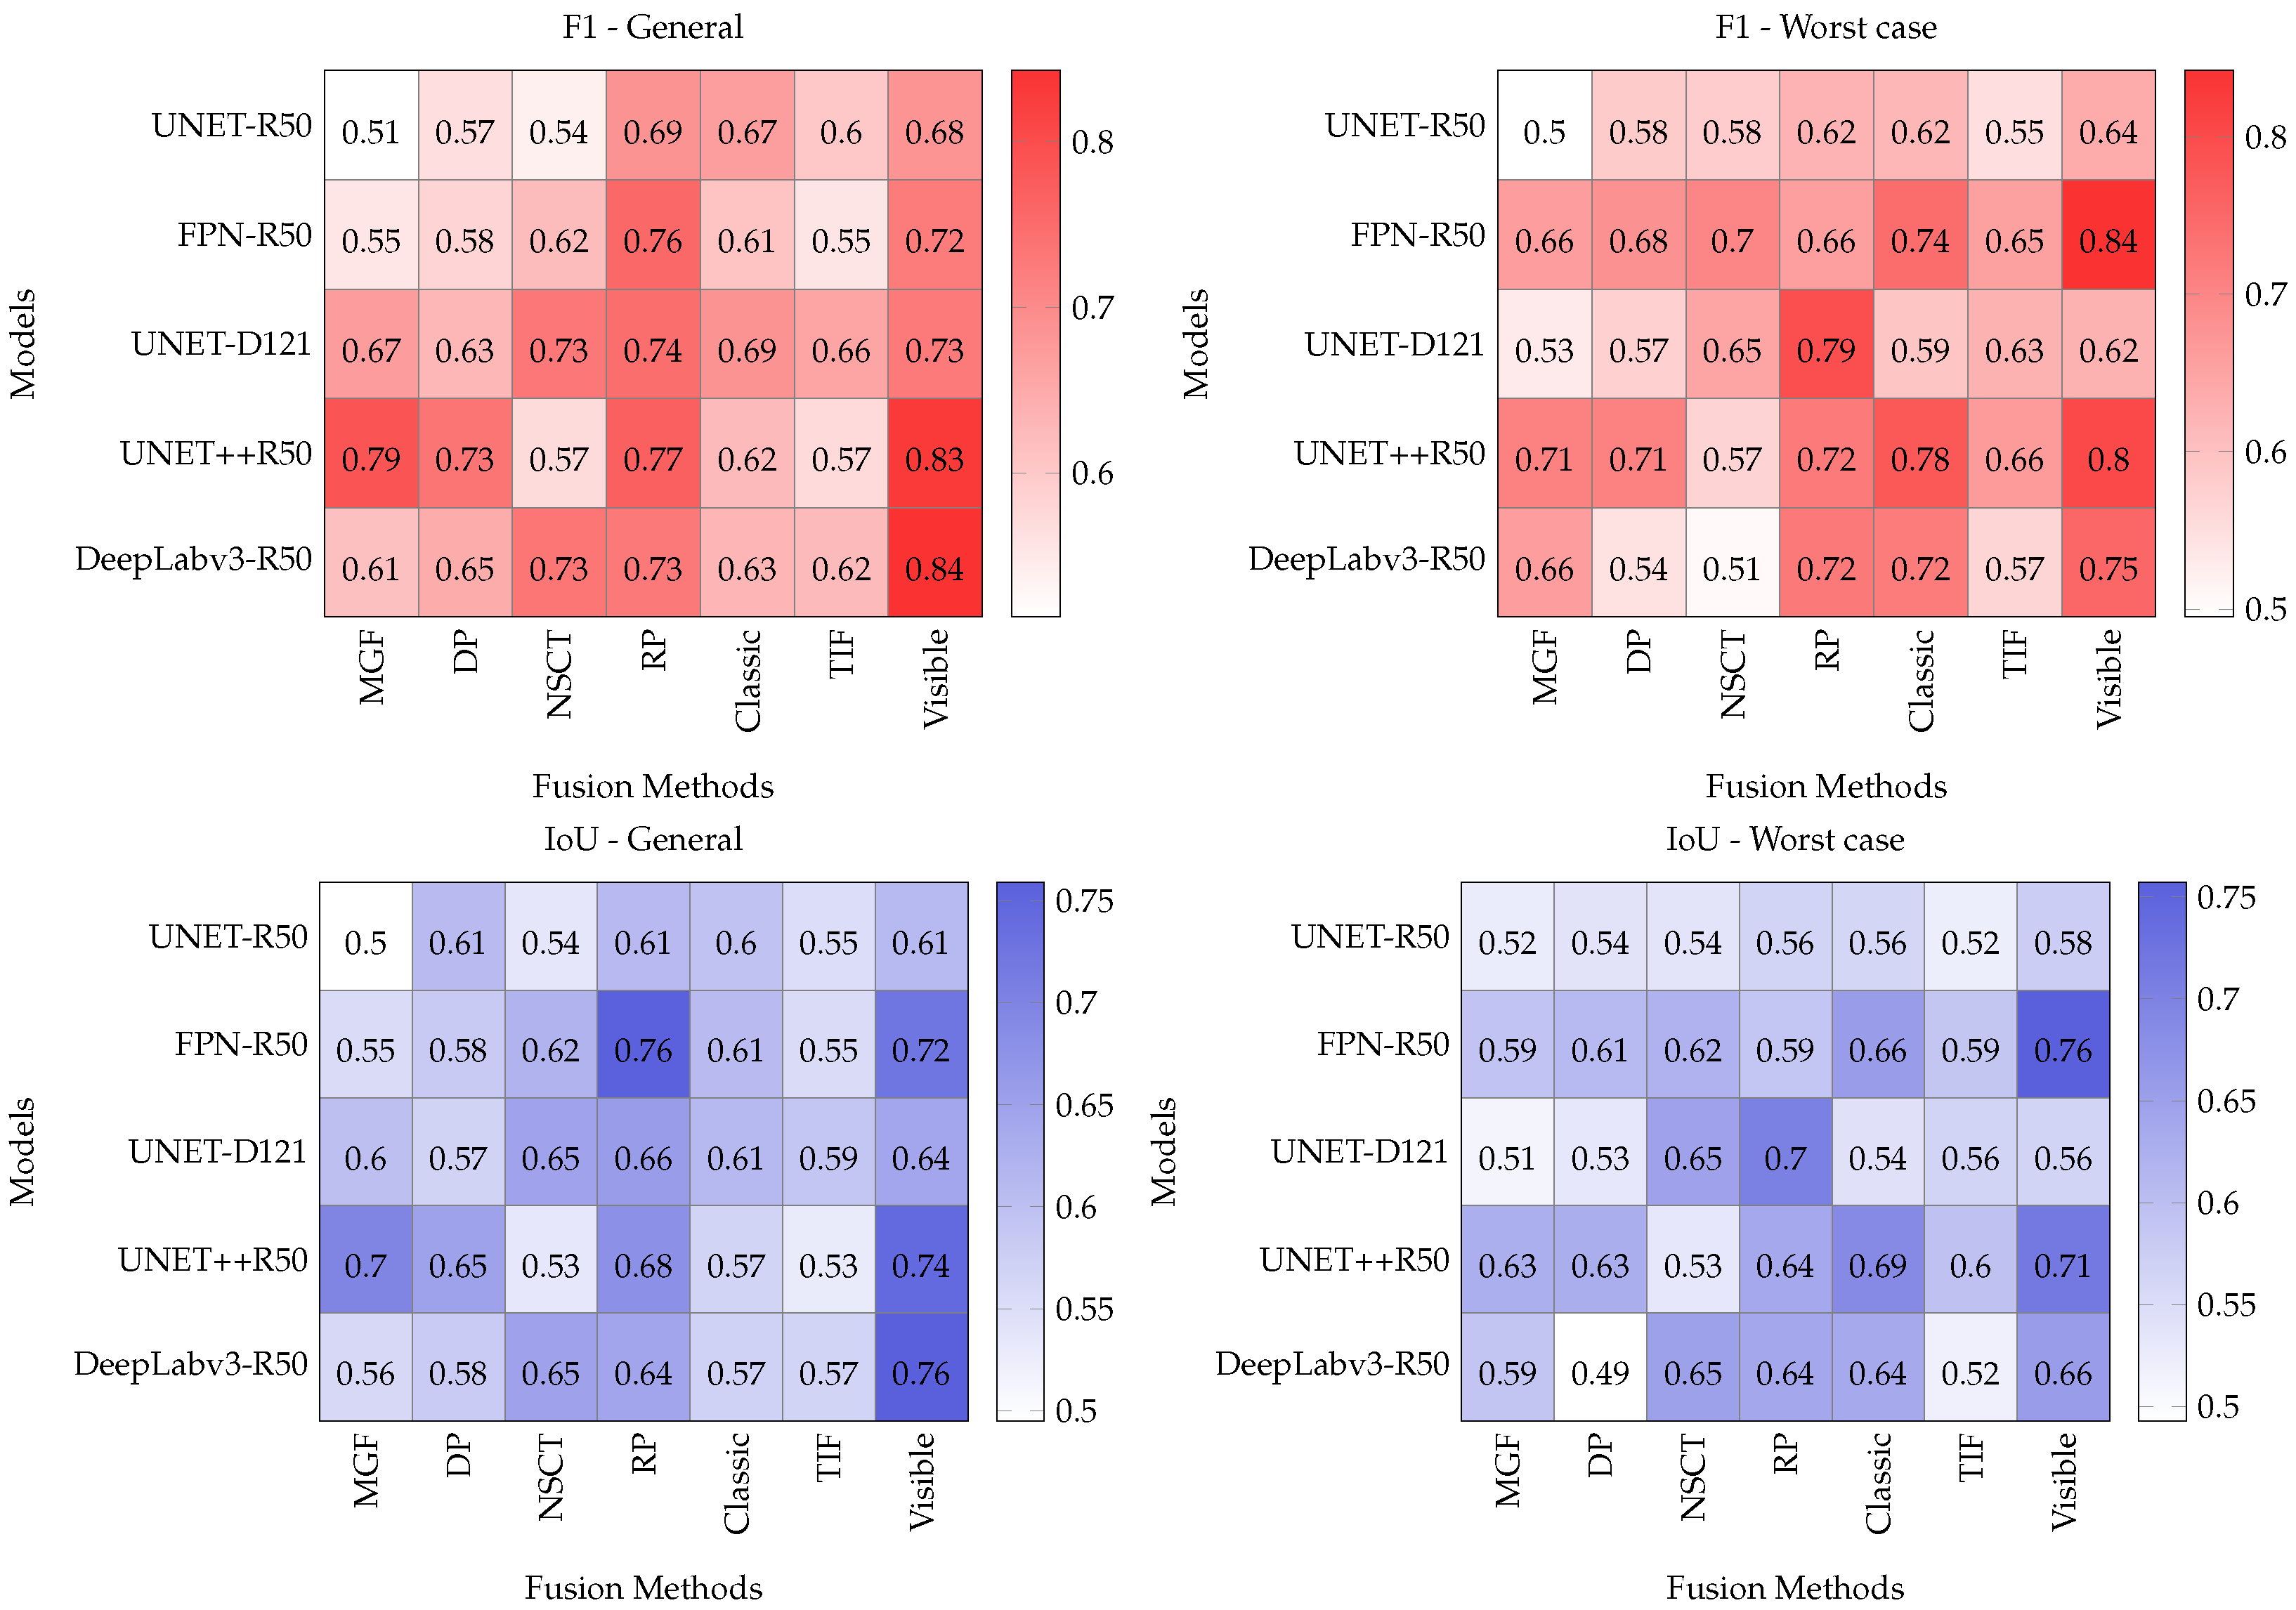
Figure 13.
The sample results of the first case study. The presented masks are skeletonized output of the Unet++50 model.
Figure 13.
The sample results of the first case study. The presented masks are skeletonized output of the Unet++50 model.
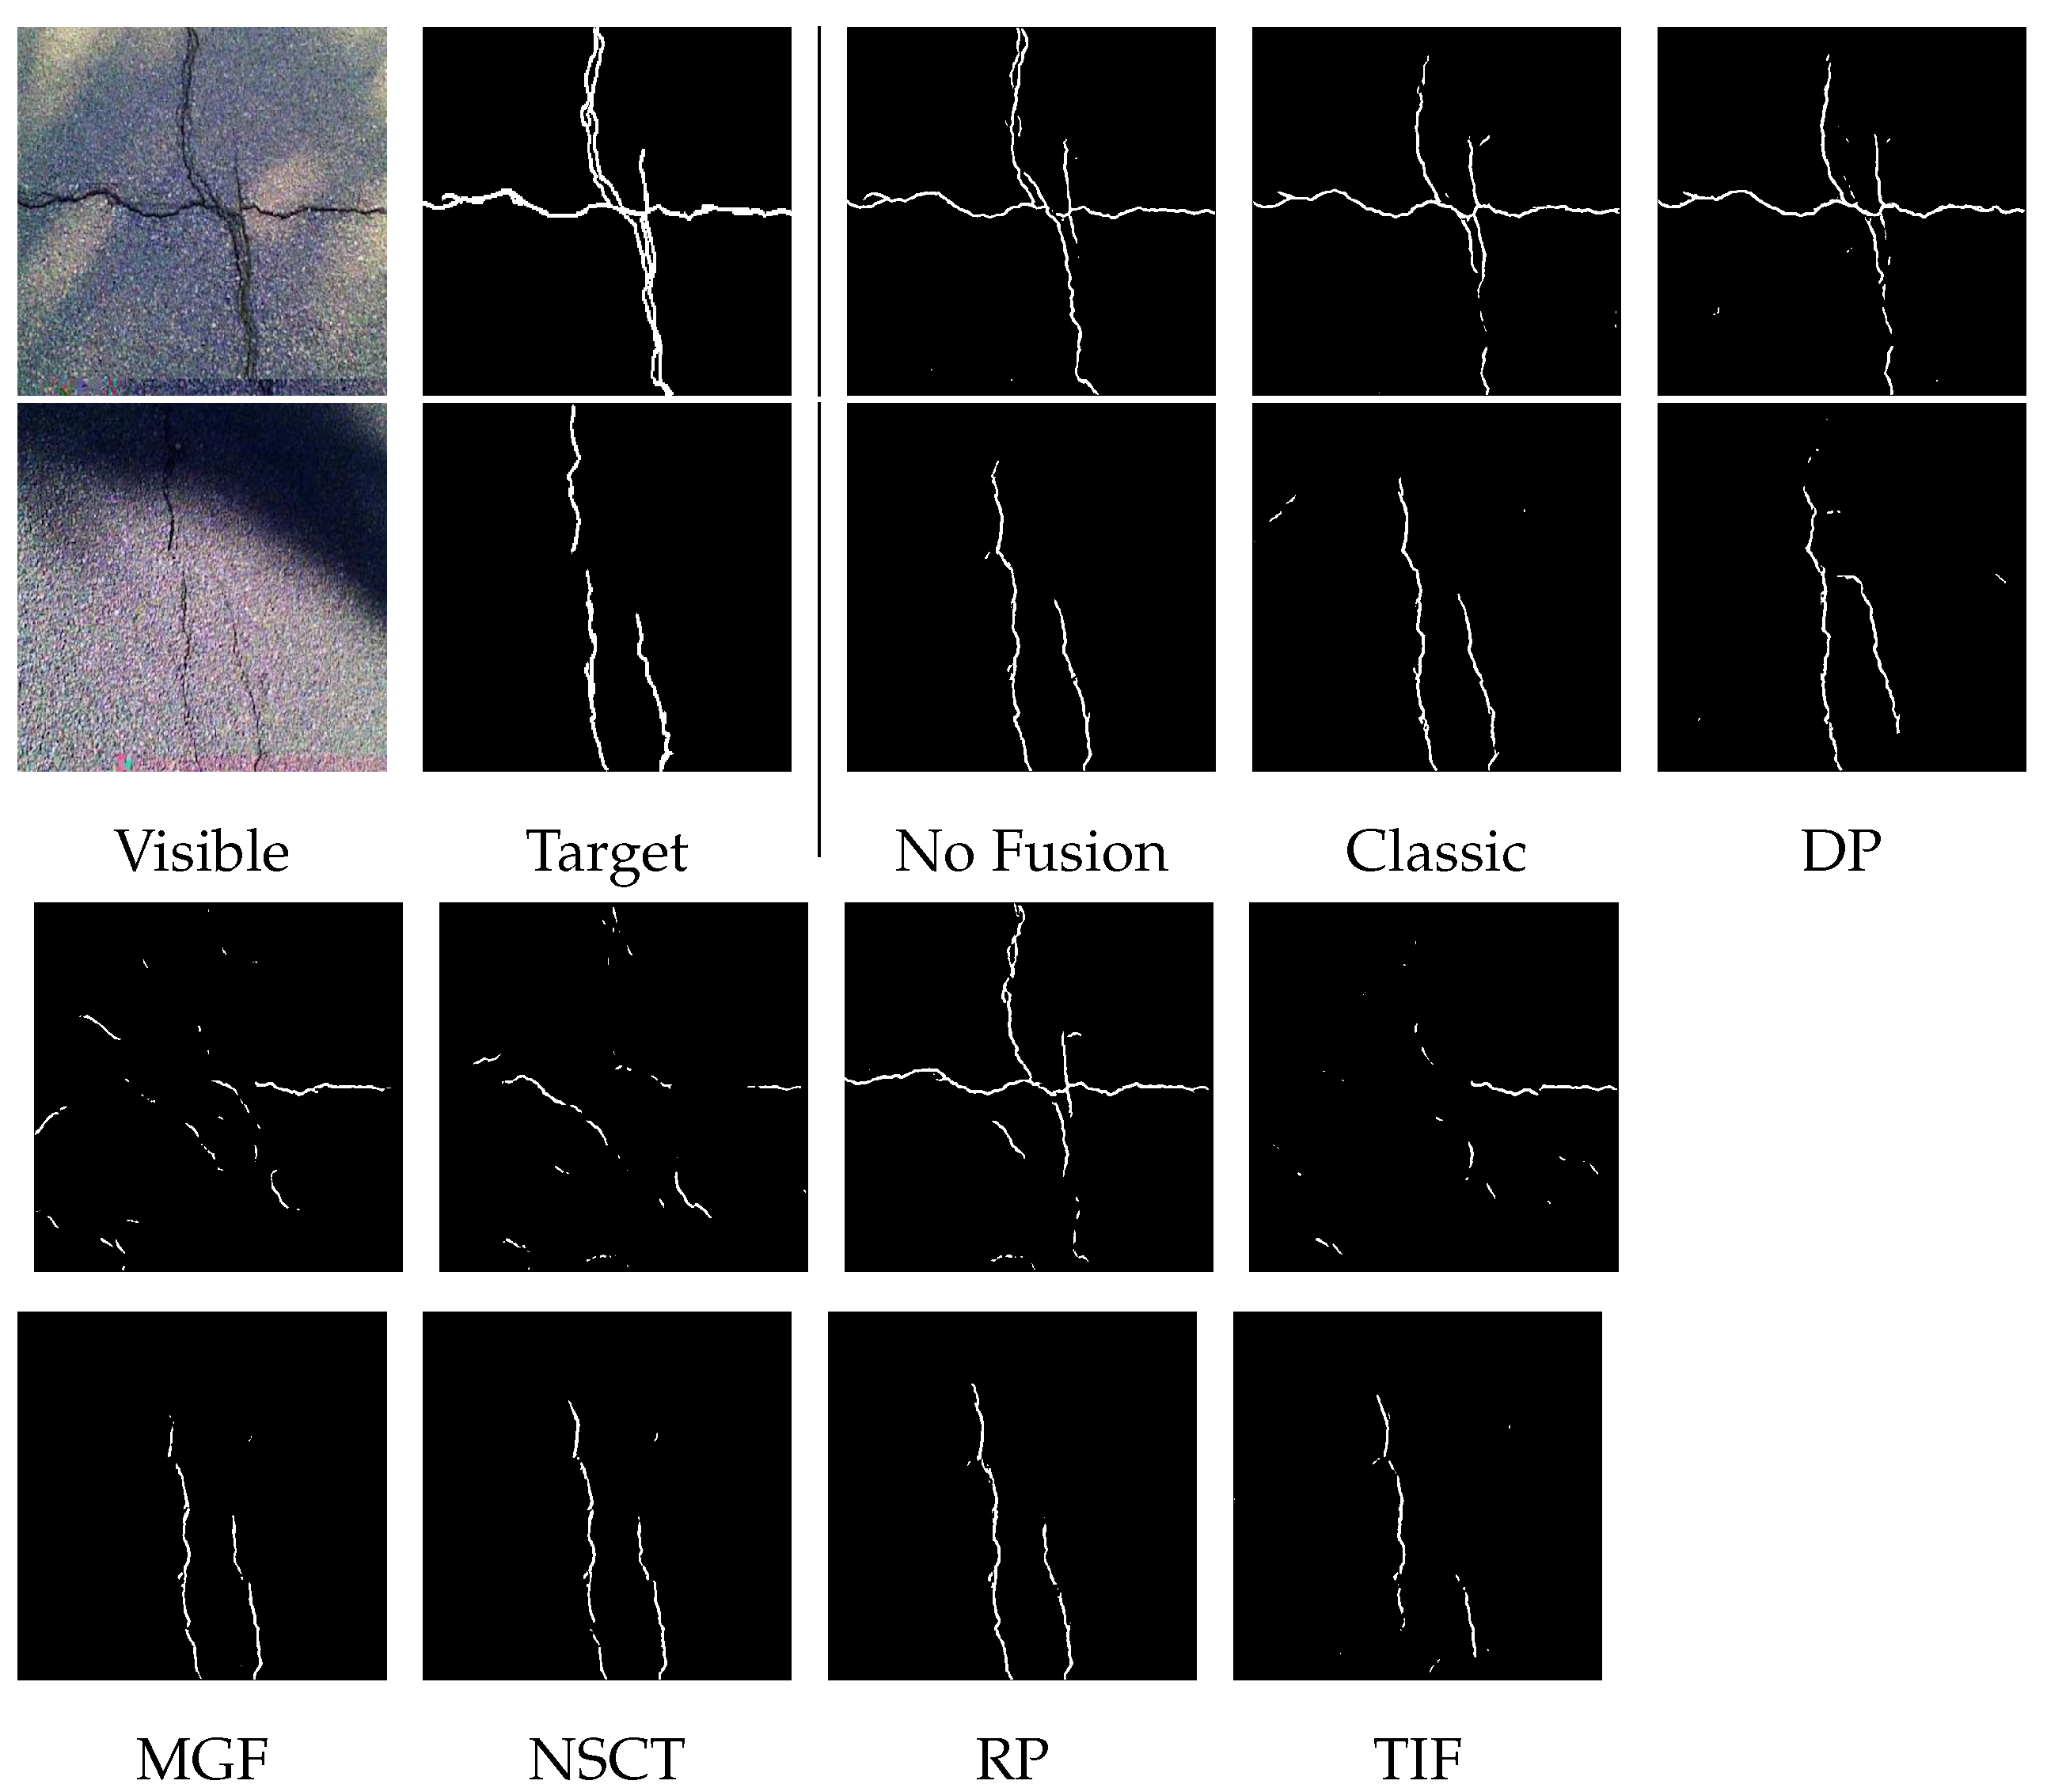
Figure 14.
The metrics for the thermal segmentation method for piping inspection. This figure shows sample metrics of the iterative segmentation approach for one sample during 20 iterations.
Figure 14.
The metrics for the thermal segmentation method for piping inspection. This figure shows sample metrics of the iterative segmentation approach for one sample during 20 iterations.

Figure 15.
The figure shows the result of abnormality classification.

Figure 16.
The sample results of the trained model.

Figure 17.
The figure shows the results of each step in the processing pipeline. The right top photo is the sample result of the aligned thermal and visible image. The right bottom is the extracted region of interest in a thermal image using the segmented visible image. The left photo demonstrates the analyzed thermal image, where the red regions are the subsurface defects and the yellow regions are the surface defects.
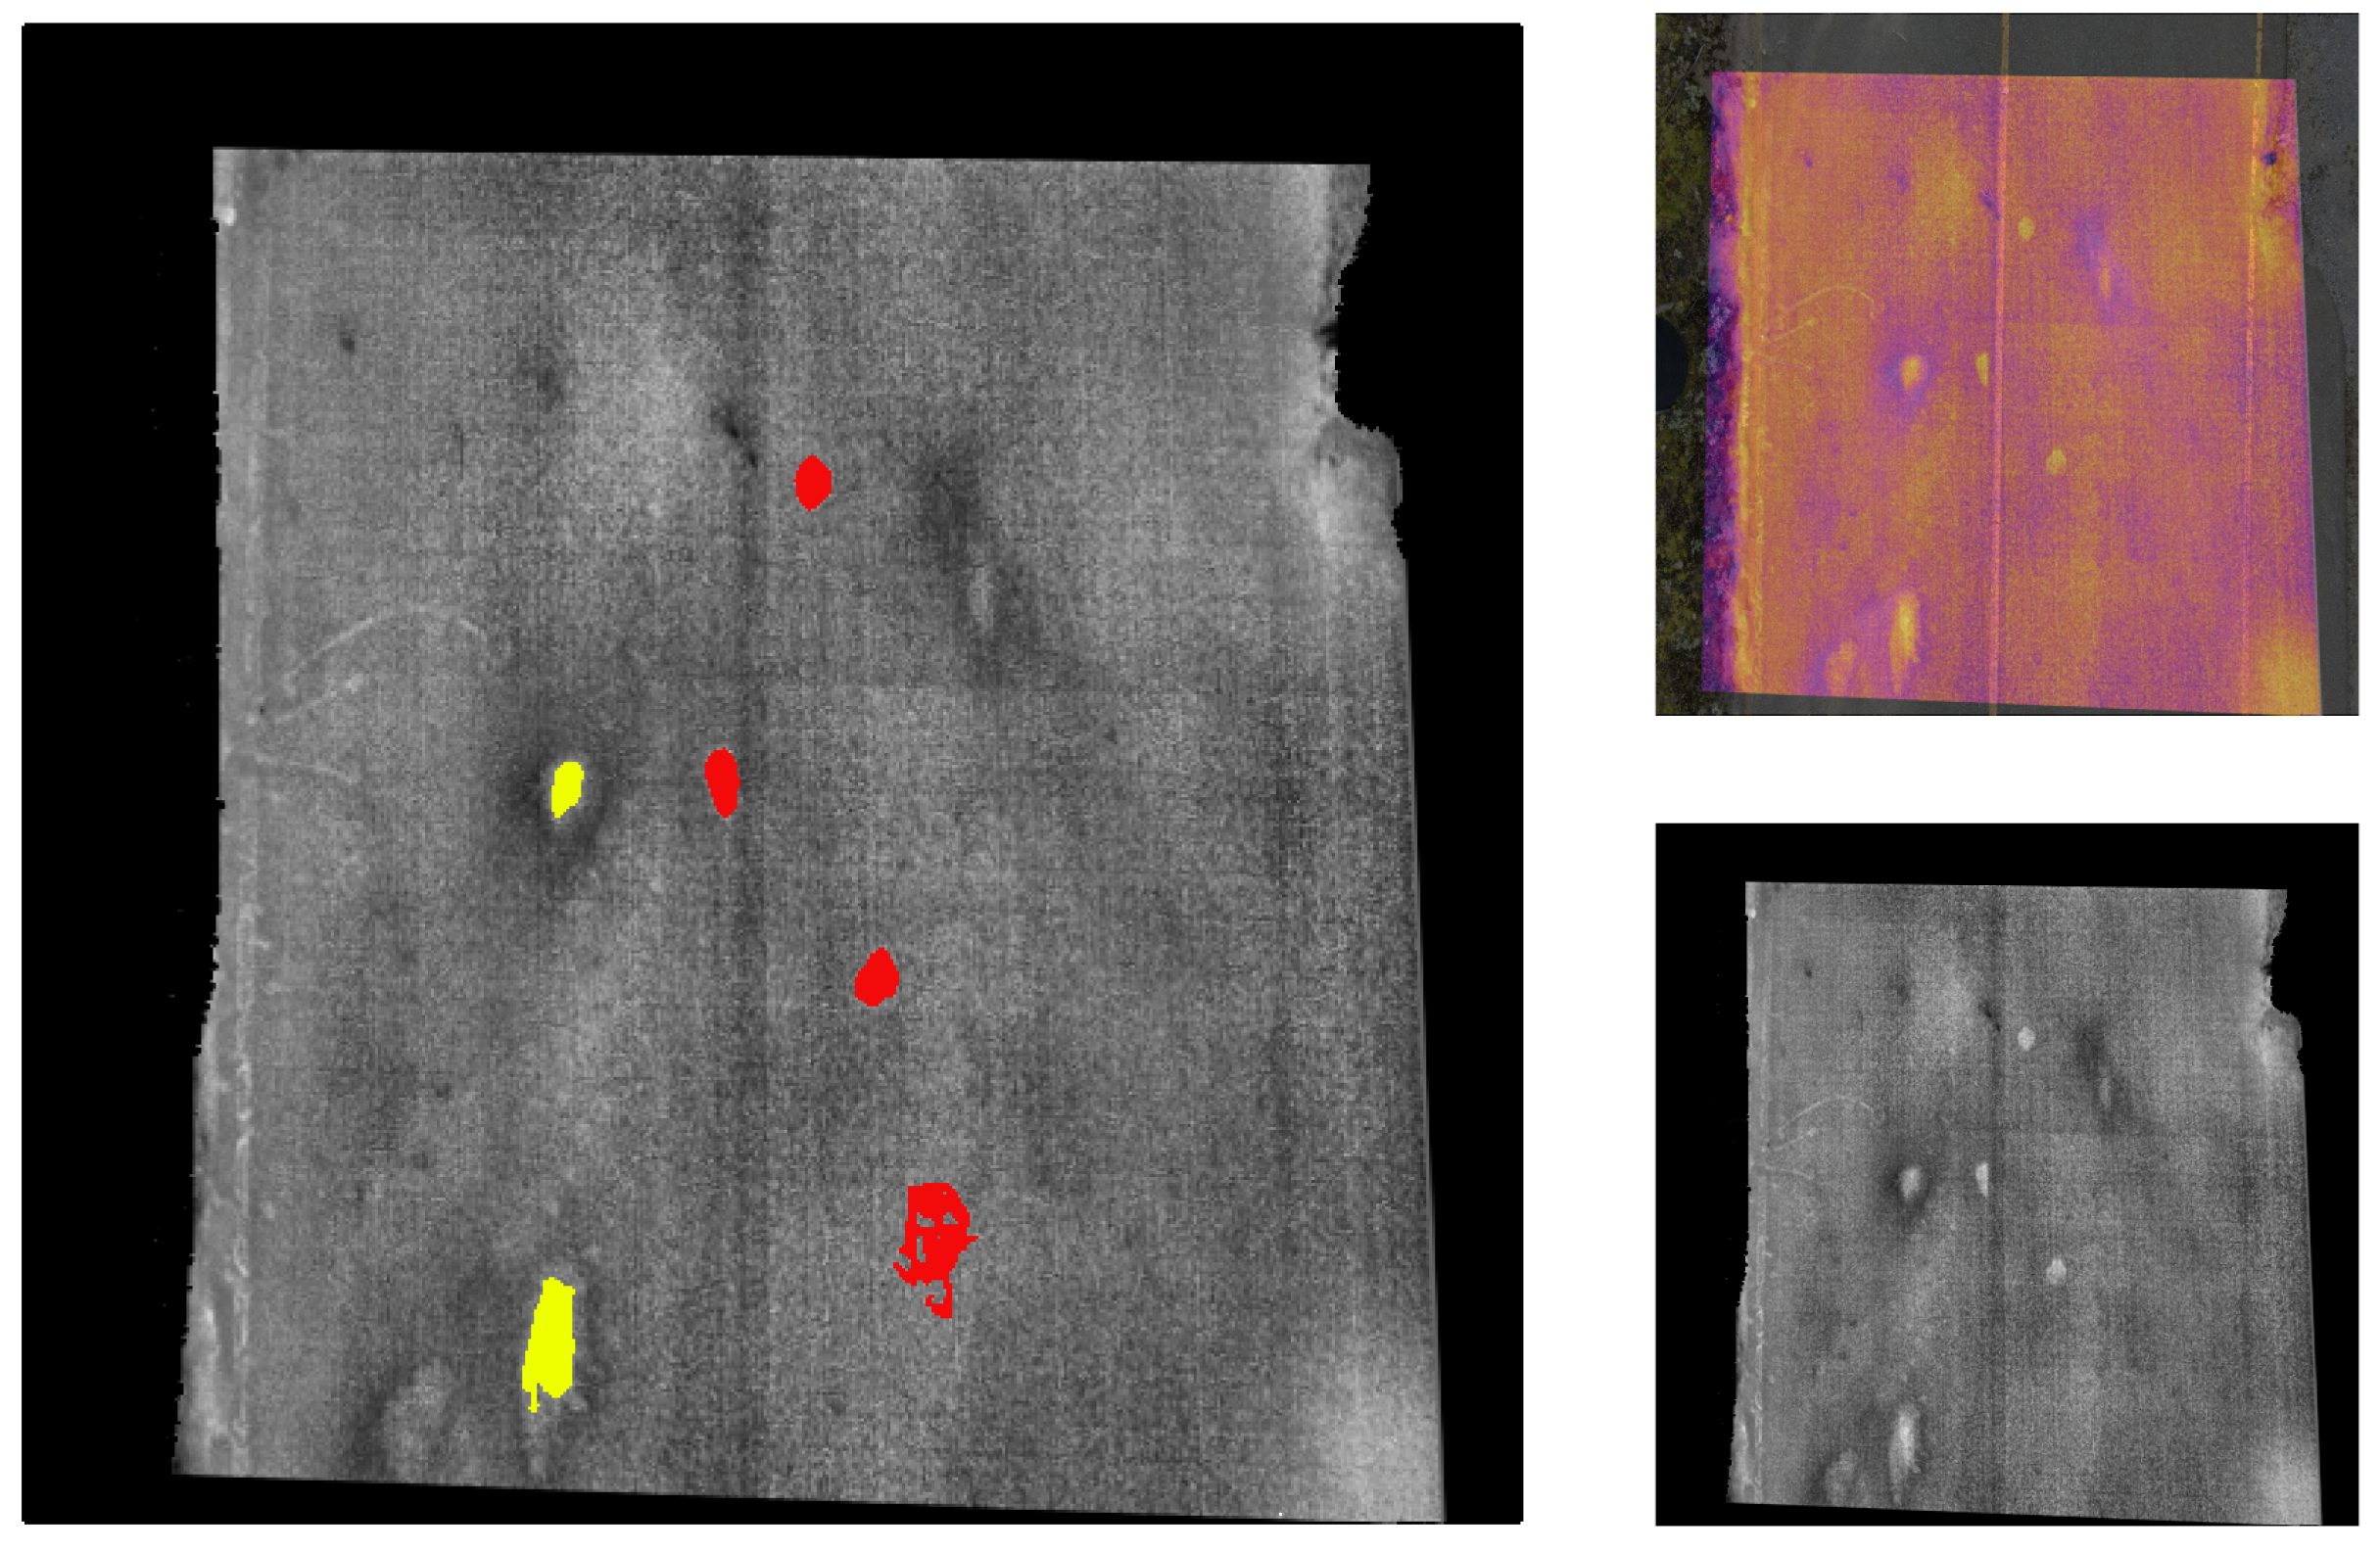
Figure 18.
The sample results for the DeepLabV3 model for the bridge inspection.
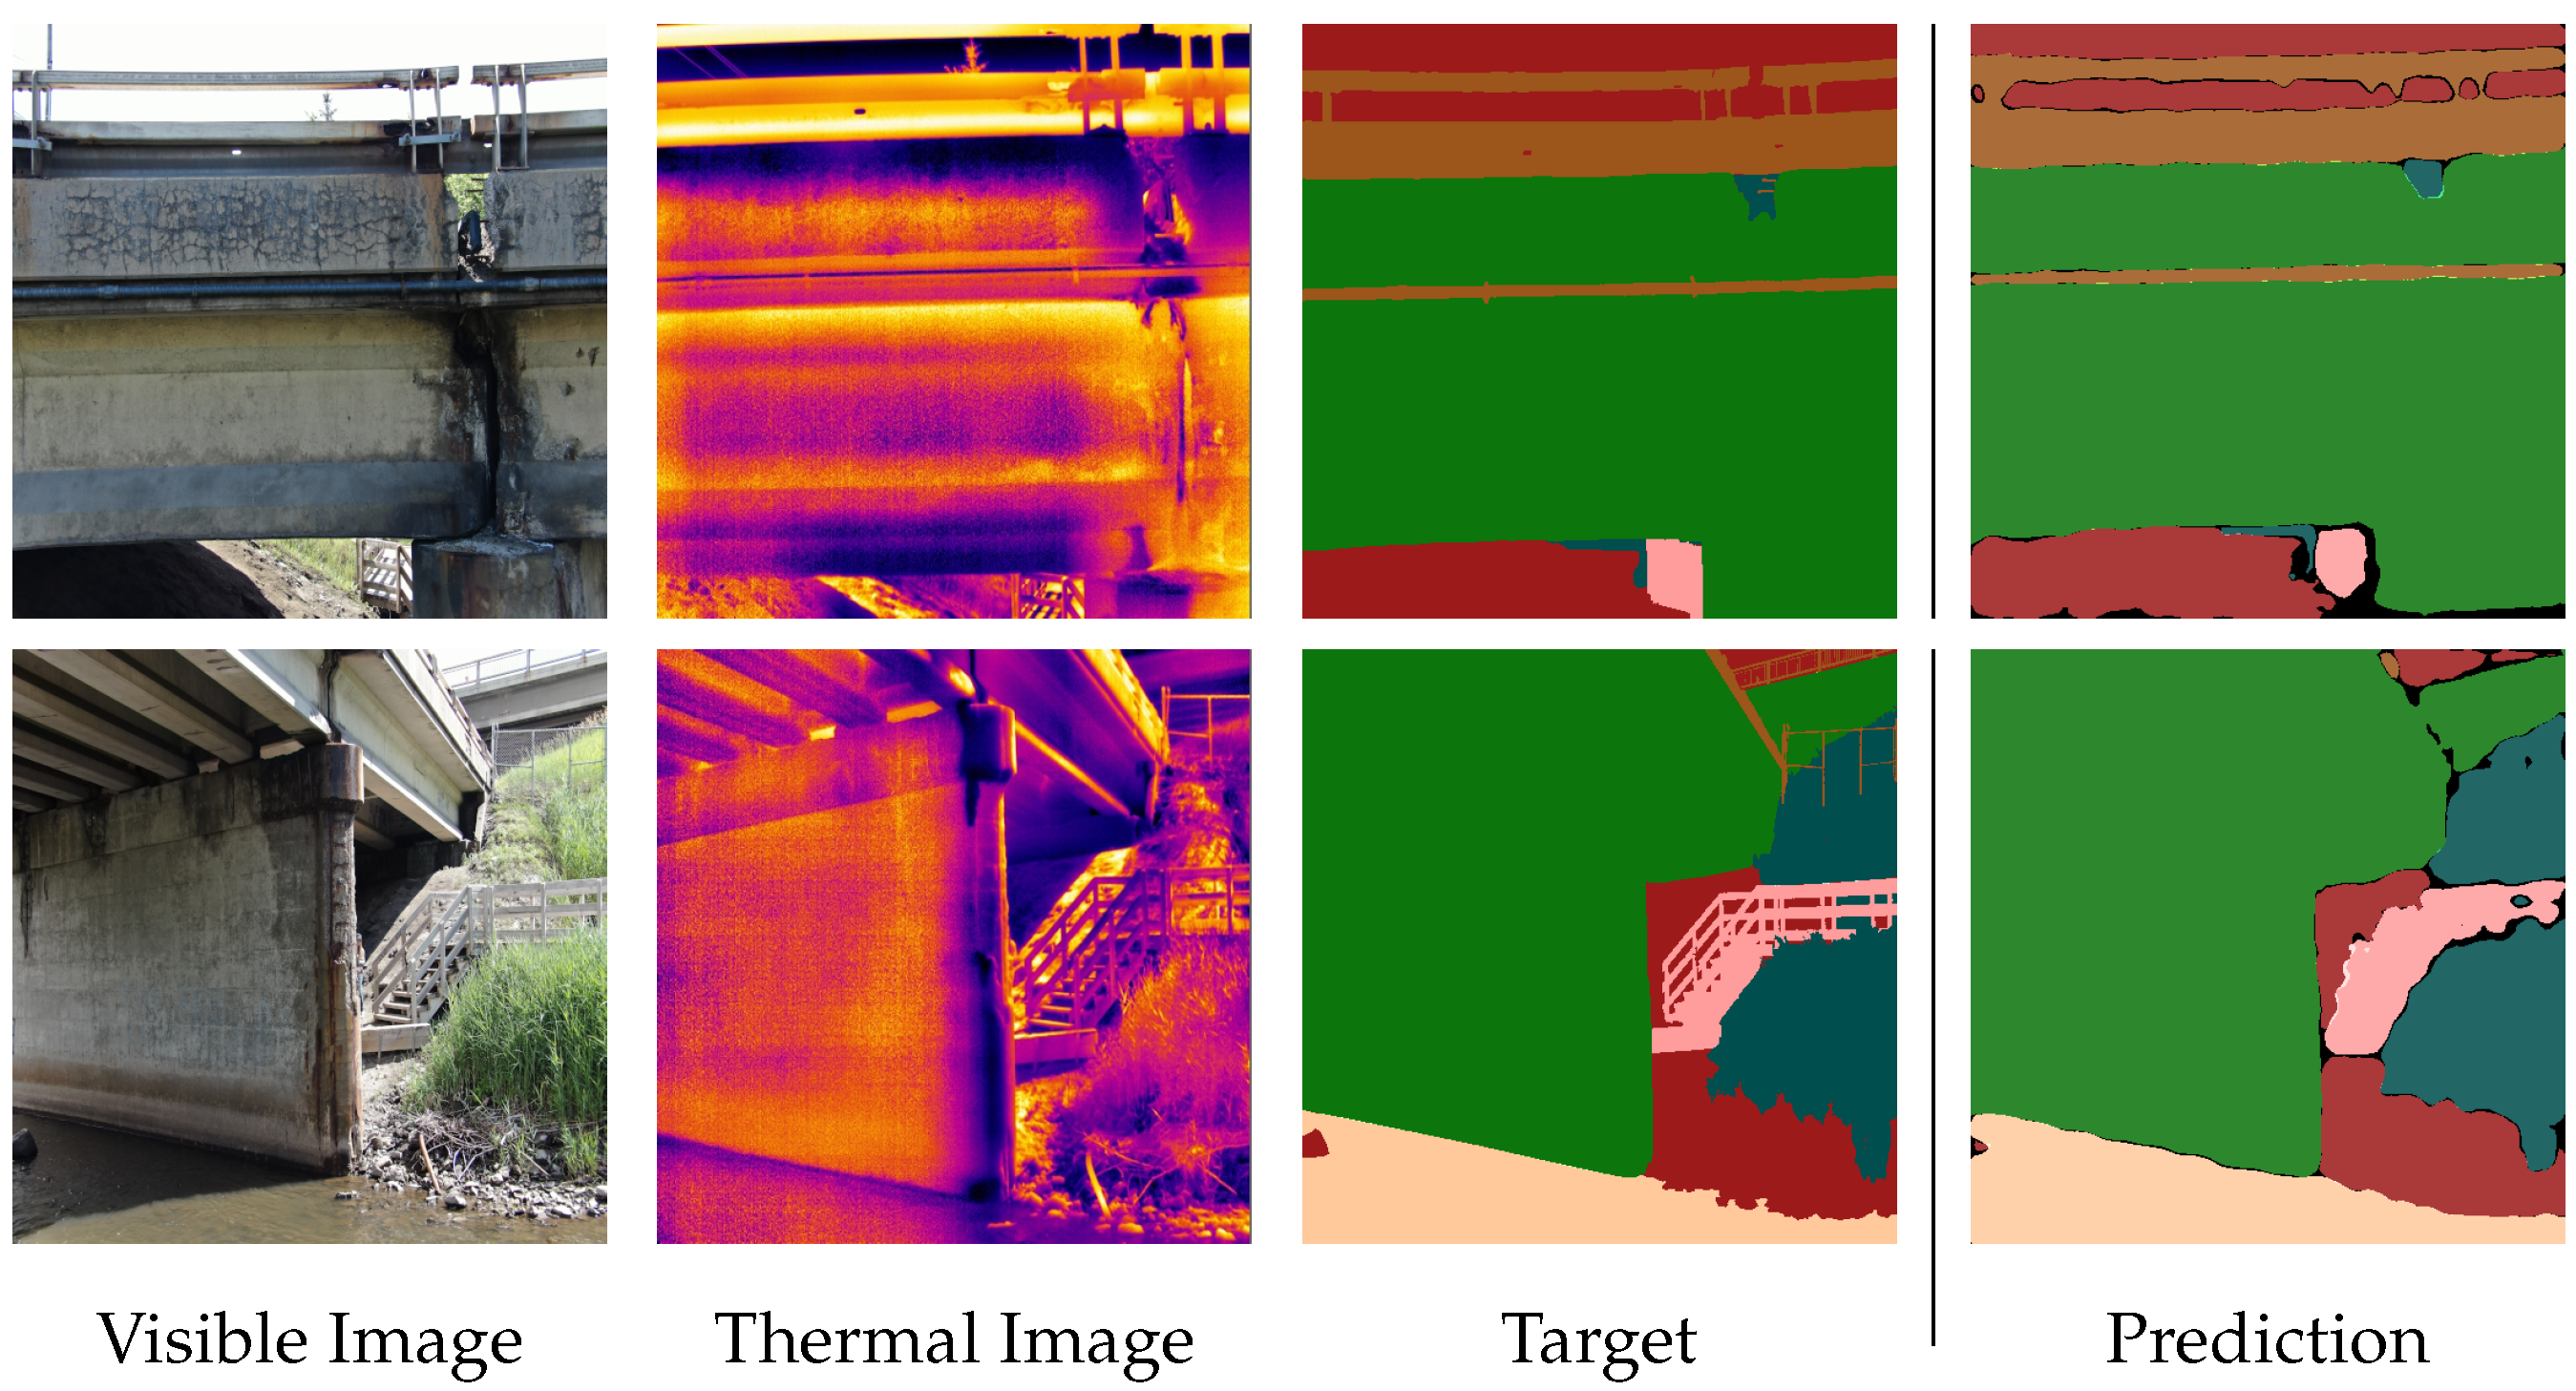
Figure 19.
The sample results of the proposed processing pipeline for drone-based bridge inspection.
Figure 19.
The sample results of the proposed processing pipeline for drone-based bridge inspection.


Table 1.
Categorization of texture analysis approaches.
| Categories | Description | Methods |
|---|---|---|
| Structural | Relies on well-defined texture elements, such as the spatial layout of pixels, regions, or lines. After being established, these patterns are described and grouped by geometric and statistical properties. Better performance is reported for images with regular structures. | Edge detector, SIFT, skeleton representation, primitive measurement, morphological operations. |
| Statistical | Quantitative description of texture regions based on the magnitude of local intensity distributions. The method usually derives a vector of features from the statistical calculations. | Histogram characteristics, grey-level co-occurrence matrix, entropy, local binary descriptors, singular value decomposition. |
| Model-based | In this method, a model is built for a specific texture pattern. The empirical model is generated upon the information of individual pixel intensities and its neighborhood. | Markov random field, multi-orientation wavelet pyramid, multifractal analysis, autoregressive models. |
| Transform-based | This approach converts the image regions into the frequency space, where in some cases, the pixel variations can be distinguished more easily. | Fourier transform, Gabor filters, wavelet transforms, skeleton primitive and wavelets. |
Table 2.
Baseline training hyper-parameters for the texture segmentation models.
| Parameter | Value | Parameter | Value |
|---|---|---|---|
| Epochs | 100 | Weight Decay | 0.005 |
| Batch Size | 8 | LR Cycle Size | 8 |
| Input Size | LR Cycle Multiplier | 2 | |
| Input Format | RGB | LR Multiplier | 0.5 |
| Learning Rate | TA—Bins | 31 | |
| Momentum | 0.9 | TA—Interpolation | Nearest |
Table 3.
Baseline training hyperparameters for the crack segmentation models.
| Parameter | Value | Parameter | Value |
|---|---|---|---|
| Epochs | 100 | Weight Decay | 0.005 |
| Batch Size | 8 | LR Cycle Size | 200 |
| Input Size | LR Cycle Multiplier | 2 | |
| Input Format | Grayscale | LR Multiplier | 0.5 |
| Learning Rate | 0.001 to 0 | TA—Bins | 31 |
| Momentum | 0.9 | TA—Interpolation | Nearest |
Table 4.
This table describes the inspection conditions. Since both data sessions were acquired at a relatively similar time, the environmental conditions are considered the same.
Table 4.
This table describes the inspection conditions. Since both data sessions were acquired at a relatively similar time, the environmental conditions are considered the same.
| Date | 22 September 2021 | ||
|---|---|---|---|
| Time | 9:45 (D1) & 9:10 (D2) | Location | Montmorency Forest |
| Temperature | 16.1 °C | Humidity | 82% |
| Wind speed | 9 kph | Condition | Mostly Cloudy |
| Air Pressure | 100.91 kPa | ||
Table 5.
The table describes the inspection conditions.
| Date | 8 July 2021 | ||
|---|---|---|---|
| Time | 10:30 | Location | Quebec City |
| Temperature | 21.1 °C | Humidity | 73% |
| Wind Speed | 16.01 kph | Condition | Sunny |
| Air Pressure | 100.30 kPa | ||
Table 6.
Paved roads models’ texture segmentation performance.
| Models | F1-Score | IOU |
|---|---|---|
| Unet++ R50 | 0.791 | 0.743 |
| DeepLabv3-R50 | 0.847 | 0.837 |
| Unet-D121 | 0.842 | 0.829 |
Table 7.
Concrete bridge models’ texture segmentation performance.
| Models | F1-Score | IOU |
|---|---|---|
| Unet++ R50 | 0.791 | 0.743 |
| DeepLabv3-R50 | 0.927 | 0.872 |
| Unet-D121 | 0.800 | 0.754 |
Publisher’s Note: MDPI stays neutral with regard to jurisdictional claims in published maps and institutional affiliations. |
© 2022 by the authors. Licensee MDPI, Basel, Switzerland. This article is an open access article distributed under the terms and conditions of the Creative Commons Attribution (CC BY) license (https://creativecommons.org/licenses/by/4.0/).
Share and Cite
MDPI and ACS Style
Nooralishahi, P.; Ramos, G.; Pozzer, S.; Ibarra-Castanedo, C.; Lopez, F.; Maldague, X.P.V. Texture Analysis to Enhance Drone-Based Multi-Modal Inspection of Structures. Drones 2022, 6, 407. https://doi.org/10.3390/drones6120407
AMA Style
Nooralishahi P, Ramos G, Pozzer S, Ibarra-Castanedo C, Lopez F, Maldague XPV. Texture Analysis to Enhance Drone-Based Multi-Modal Inspection of Structures. Drones. 2022; 6(12):407. https://doi.org/10.3390/drones6120407
Chicago/Turabian StyleNooralishahi, Parham, Gabriel Ramos, Sandra Pozzer, Clemente Ibarra-Castanedo, Fernando Lopez, and Xavier P. V. Maldague. 2022. "Texture Analysis to Enhance Drone-Based Multi-Modal Inspection of Structures" Drones 6, no. 12: 407. https://doi.org/10.3390/drones6120407