
FRCNN-Based Reinforcement Learning for Real-Time Vehicle Detection, Tracking and Geolocation from UAS


1
Department of Civil Engineering, Indian Institute of Technology Roorkee, Roorkee 247667, Uttarakhand, India
2
Centre of Excellence Disaster Mitigation and Management, Indian Institute of Technology Roorkee, Roorkee 247667, Uttarakhand, India
3
Manipal School of Architecture and Planning, Manipal Academy of Higher Education, Manipal 576104, Karnataka, India
*
Author to whom correspondence should be addressed.
Drones 2022, 6(12), 406; https://doi.org/10.3390/drones6120406
Submission received: 31 October 2022
/
Revised: 28 November 2022
/
Accepted: 29 November 2022
/
Published: 9 December 2022
(This article belongs to the Special Issue Advances in Deep Learning for Drones and Its Applications)
Abstract
:In the last few years, uncrewed aerial systems (UASs) have been broadly employed for many applications including urban traffic monitoring. However, in the detection, tracking, and geolocation of moving vehicles using UAVs there are problems to be encountered such as low-accuracy sensors, complex scenes, small object sizes, and motion-induced noises. To address these problems, this study presents an intelligent, self-optimised, real-time framework for automated vehicle detection, tracking, and geolocation in UAV-acquired images which enlist detection, location, and tracking features to improve the final decision. The noise is initially reduced by applying the proposed adaptive filtering, which makes the detection algorithm more versatile. Thereafter, in the detection step, top-hat and bottom-hat transformations are used, assisted by the Overlapped Segmentation-Based Morphological Operation (OSBMO). Following the detection phase, the background regions are obliterated through an analysis of the motion feature points of the obtained object regions using a method that is a conjugation between the Kanade–Lucas–Tomasi (KLT) trackers and Density-Based Spatial Clustering of Applications with Noise (DBSCAN) clustering. The procured object features are clustered into separate objects on the basis of their motion characteristics. Finally, the vehicle labels are designated to their corresponding cluster trajectories by employing an efficient reinforcement connecting algorithm. The policy-making possibilities of the reinforcement connecting algorithm are evaluated. The Fast Regional Convolutional Neural Network (Fast-RCNN) is designed and trained on a small collection of samples, then utilised for removing the wrong targets. The proposed framework was tested on videos acquired through various scenarios. The methodology illustrates its capacity through the automatic supervision of target vehicles in real-world trials, which demonstrates its potential applications in intelligent transport systems and other surveillance applications.
1. Introduction
The success of automated airborne vehicles (UAVs) coupled with picture-handling calculations has prompted the extension of the application fields of UAVs. Utilising UAVs to recognise, track, or geolocate moving vehicles has drawn attention to a legitimate concern for scientists. These types of robots with following and geolocating structures have accomplished vast achievements in a rush-hour gridlock well-being assessment, a street surface check, traffic stream observations, and metropolitan security assurance [1,2] due to these robots being unaffected by ground gridlock. Additionally, they can deftly respond to scene changes as soon as it is possible to do so [3,4].
The ability to locate and follow vehicles is significant for security and reconnaissance applications as well as for Intelligent Transportation Systems. Recently, there has been an expanded utilisation of automated airborne vehicles (UAVs) or drones for a reconnaissance due to their ability to observe far-off scenes [5,6]. However, with an increasing number of applications many challenges have appeared. The resolution of objects situated at long distances from the camera is low. Additionally, obscured parts and noise can deteriorate the picture quality. Different examinations have been focused on visual recognition and the following of moving articles and have used techniques such as background deduction and edge distinction. Recently, researchers have tried to address these concerns using many computer vision and deep learning methods. The Gaussian Mixture Model (GMM) was utilised to dissect the foundation and target districts in [7,8]. A Scale-Invariant Feature Transformation (Filter) was used to extricate closer-view objects from the background scene in [9]. The background was removed under Gaussian Mixture supposition, which was followed by the use of morphological channels [3,10]. Speculation fitting was embraced for vehicle recognition. Long-range moving items were distinguished using background deduction [4,11].
Notwithstanding the previously mentioned research, many investigations have been directed at following numerous objects [12,13]. Attempting to easily find numerous fast-moving objects causes a weighty mess (phony problem), and there is a low likelihood of discovery. The switching Kalman filter provides a solution for continuously assessing the condition of an objective [14,15]. Knowing—rather than assuming—the free Gaussian noise element is ideal. At the point where different estimations are distinguished at the edge, the information affiliation is expected to dole out the estimations to the laid-out tracks [6].
Despite different investigations having been conducted on acquiring vehicle locations from UAVs, some problems still remain. For example:
- The object density is high in complex urban scenarios such as densely filled parking areas, at intersections, or in clogged streets, and determining the location of an individual vehicle can become troublesome [16]. Additionally, vehicles might be blocked by trees, boards, or different developments to some extent. Different variables that plague the recognition of vehicles include complex backgrounds, shadows, shifting light conditions, and distinctions in the vehicles’ types, appearances, and directions. This multitude of variables lessens the adequacy of the usual methods such as an optical stream, outline distinction, and foundation deduction.
- Differences in the top aerial view and the terrestrial view of the vehicle make detection more challenging. The airborne pictures lack the front-view physiognomy of the vehicle and vehicles show rectilinear shapes in the top view. Another change observed in the aerial imagery is that of scale (resolution). The size of vehicles when captured from UAVs is small compared to normal ground images. For instance, in a 5K × 3K pixel image captured from a UAS, a vehicle might appear at 50 × 50 pixels. Therefore, it becomes challenging to detect the vehicle as it is difficult to find the variations in its features that distinguish it from other similar-looking vehicles. Resolution also makes it challenging to differentiate vehicles from other objects such as big containers, garbage bins, street signs, and other rectilinear objects.
- Low-elevation UAVs are more plagued by sudden movements and natural variables. Given that the camera perspectives and flying elevations of more modest UAVs change quickly, the information they acquire fluctuates significantly. Moreover, the carrying capacity of small UAVs restricts the weight of the computational hardware they can fly with onboard.
To overcome the above challenges for the precise execution of detecting, tracking, and geolocating a vehicle, an intelligent, self-improved, constant methodology was developed for automated vehicle identification, following, and geolocation in UAS-acquired images that utilise recognitions, area, and following elements to upgrade an ultimate choice. This work aims to present an intelligent, self-optimised, real-time approach for automated vehicle detection, tracking, and geolocation in UAV images that utilise detections, location, and tracking features to strengthen the final decision. The main contributions of this research are:
- (1)
- A proposed adaptive filtering method for reducing noise which enhances the reliability of the detection algorithm;
- (2)
- To develop a top–bottom-hat transformation assisted by the Overlapped Segmentation-Based Morphological Operation, which is to be employed in the detection phase;
- (3)
- To initiate the elimination of background regions by motion–feature point analysis of the obtained object regions using a conjugated technique of DBSCAN clustering and KLT trackers;
- (4)
- To develop an efficient reinforcement-connecting algorithm for assigning the vehicle labels corresponding to their cluster trajectories.
2. Previous Studies
Zhao et al. [17] developed a system for moving vehicle recognition, following, and geolocation using a monocular camera, a Global Positioning System (GPS) collector, and sensors for inertial measurement units (IMUs). Initially, the strategy utilised YOLOv3 [18] for vehicle recognition due to its adequacy and proficiency in discovering small objects in complex scenes. Subsequently, a visual tracking strategy considering connection channels was presented, and a latent geolocation technique was introduced to compute the GPS directions of the moving vehicle. Finally, a flight-control technique was introduced to lead the UAV that follows the vehicle of interest. This methodology was implemented on a DJI M100 stage to which a microcomputer Jetson TX1 and a monocular camera were added. The exploratory outcomes showed that the UAV was equipped for identifying, following, and geolocating the vehicle of interest with high accuracy. The structure exhibited its ability in programmed oversight on tracked vehicles with genuine analyses, which recommended its possible applications in urban rush-hour gridlock, planned operations, and security.
Avola et al. [13] presented an efficient, novel multi-stream (MS) algorithm. The algorithm included the application of different kernel sizes to each stream for performing image analysis on multiple scales. The proposed design was then utilised as the spine for the notable Faster R-CNN processing, characterising a MS–Faster R-CNN object locator that reliably identifies objects in video groupings. This locator was mutually utilised with the Basic On the Web and Continuous Following a Profound Affiliation Metric (Profound SORT) calculation to accomplish constant following capacities for UAV pictures. Extensive tests were performed on the different UAV datasets to assess the proposed methodology. The introduced pipeline has achieved best-in-class performance, confirming that the proposed multi-stream strategy is robust and can accurately mimic the multiscale picture examination worldview.
A technique based on the Kanade–Lucas optical flow method was proposed by Valappil et al. [19] for detecting a moving object. This was followed by isolating the objects by building connected graphs. This was then followed by a convolutional neural network (CNN), trailed by a Support Vector Machine (SVM) for definite grouping. The optical stream created contains foundation (and small) objects identified as vehicles as the camera stage moves. The classifier presented here prevents the presence of some other (moving) objects from being identified as vehicles. The method being described was tested on stationary videos and moving aerial recordings.
Li et al. [20] fostered a methodology that included: (1) a deep deterministic policy gradient (DDPG)-based control system to provide learning and independent dynamic capacity for UAVs; (2) a superior technique named MN-DDPG that presented a kind of blended noise to help UAVs with stochastic policies for ideal online preparation; and (3) a calculation of errand decay and pre-preparing for proficient exchange, determining how to further develop the speculation capacity of a UAV’s control model constructed in view of MN-DDPG. The results of the trial recreation verified that the methodology yielded a significant improvement in the ability to anticipate critical self-manoeuvrability changes in the UAV’s flight behaviour and the effectiveness of the UAV designed to operate in regulatory ventures in suspicious environments.
A hybrid vision-based framework was proposed by Espsoito et al. [21] to independently recognise and follow a UAV with a moving camera. A Faster Region-based Convolutional Neural Network (Faster R-CNN) was designed and exploited in the detection stage to distinguish the Region of Interest (RoI). The UAV’s location in the image plane was determined by this RoI. The moving object was followed by an optical flow-based tracking framework and a Kalman filter was utilised to give fleeting consistency between back-to-back estimations. The global positioning framework was intended to have the option to accomplish constant picture handling on implanted frameworks; therefore a slack pay calculation for the deferral due to the Faster R-CNN calculation time was carried out. The performance of the proposed model was assessed by the deviation between the genuine UAV position in the image plane and the assessed position estimated from the positioning framework.
Shao et al. [22] developed a group-movement assessment framework due to the variable-scale corner detection and optical stream that utilised the infrared cameras and high adaptability of the UAV. An airborne infrared imager, TAU2-336, was used to capture the original images. Median filtering was used for pre-processing the infrared images. Afterwards, multiscale analysis was employed for corner detection and tracking. The average velocity of the crowd was estimated in the final stage. The trial results showed that the methodology was viable for assessing the crowd movement speed and behaviour.
However, in [13,17,19], the research does not focus on the detection, tracking, and geolocation of moving vehicles based on the airborne platform; it has been suffering from small object sizes and, in some of the studies [20,21], scene complexity was a major problem. In [22], the research falls short of precise detection and contains low-accuracy sensors. Given the consideration mentioned above, there is a great necessity to develop a novel strategy for the superior expansion of UAVs. Table 1 encapsulates the novelty and shortcomings of the existing studies.
Moreover, the conventional methods that were utilised in the existing literature are lacking in many aspects and therefore novel techniques are very much needed for further processing and improvement. Hence, this work employs reinforcement learning to overcome these issues. Reinforcement learning (RL) is a subset of the machine learning concept that deals with the multi-state decision-making of a software agent (in this case, a UAV) as it interacts with its surroundings. The proposed framework employs RL as it will maximise resource utilisation to carry out intelligent vehicle recognition and localisation more effectively. It blends the decision-making skill of reinforcement learning with the perceptual capacity of deep learning.
With the aim of developing a faster algorithm for real-time automated detection of vehicles from UAVs, we have developed a framework based on FRCNN [23]. To improve its performance we have introduced an adaptive filter, enhanced the detection by utilising top-hat and bottom-hat transformations assisted by the OSBMO, and finally employed a conjugated technique of DBSCAN clustering and KLT trackers to eliminate the background regions. After these steps, RL based on a Fast R CNN-OMDP was used for vehicle identification. We evaluated this framework on our collected UAV-viewed test dataset and classical dataset.
3. Proposed Methodology
The utilisation of UAV-acquired images (video frames) for real-time automatic detection and tracking of moving vehicles is a challenging issue due to vehicle impediments, camera development, and high computational expense. This work presents an intelligent, self-optimised, continuous methodology for programmed vehicle identification, following, and geolocation in elevated pictures that utilises recognitions, areas, and following highlights to upgrade an official choice, as is displayed in Figure 1.
3.1. Noise Reduction
Initially, the quality of the images was upgraded by pre-processing. The pre-processing further contributes to developing precise vehicle identification and following. Pre-processing is completed by utilising this strategy, for example.
The pre-processing of the image is given as:
where is the pre-processing function performed over an image .
- (a)
- Denoising
Denoising, as is evident from the term, is the process is performed to remove noise from a picture to re-establish its primary information. The denoising of a loud image provides a productive method for recognising the essence of the image. The denoising of an image is provided by:
where is the number of denoising functions used in the proposed work.
This work utilises a Standard Deviation-based Middle Channel (SD-MF+BF) and respective separating to denoise the picture.
First, the image is handled under pre-processing to expel drive noise, etc. Motivation noise defiles the sharpness of the data and will, in general, corrupt the nature of the picture. Regardless of different noise removal methods that have been established, some imperfections always remain, for example, the loss of information, wavers when the likelihood of drive clamour is high, etc. This framework has employed a Standard Deviation-based Versatile Middle Channel (SD-MF+BF) to capture the current strategies.
Initially, the picture is transformed into a grey-level picture. This grey-level data is represented by and the grey levels of a noisy image are represented by . indicate the powerful scope of picture dim levels. In the first 8-cycle changes, (variance) and (standard deviation) are assessed for every original pixel. The range of evaluation lies between and for variance observed, and it is standardised with a value of .
On the basis of the standard deviation, an ordinary conveyance bend is estimated and, considering the bend, 95% of the information lies in between the first and second standard deviations and whose exact formulae are observed and assessed by:
Following this, the formulation of noise is performed based on 95% of picture pixels with the likelihood that are depicted in the following function:
where signifies the ordinarily dispersed pixels inside the reach , and can be any number between and .
The median values are used by the filter to replace noisy pixels. The median value is the figure lying in the middle of the arranged grouping of values. The grey values of any pixel value in any window of size are characterised by , which becomes subsequent to arranging the values in ascending or in descending phenomenon.
Finally, the derived image is freed from drive noise with nearly no adulteration of values.
A reciprocal channel is a non-direct channel which has an edge-defending property, close-by clatter clearing. This channel is good for wiping out upheaval contents without over-darkening the image as well as protecting the image quality. The essential reason behind using an equal channel is that two pixels should be close to each other rather than expecting that they are accessible in nearby regions; moreover, their resemblance should be in photometric reach. The advantage of using an individual channel over an equivalent Gaussian channel is that the two-sided channel includes power assortments to defend its edges. It registers the weighted measure of pixels in a close-by region. For each adjacent pixel, a weighted ordinary is used for replacing the pixel regard. The consequence of a proportional channel for a pixel X can be framed using Equation (8) as:
This is a normalised, weighted typical where and are the pixel co-ordinates, addresses the spatial neighbourhood of , is a spatial Gaussian that reduces the effect of distant pixels, and is an approach at a Gaussian that decreases the effect of pixels when their power values differ from the power of pixel , . is the normalisation factor which can be enlisted using Equation (9) as:
Consider a pixel with coordinates (i, j) which is to be denoised utilising the two-sided channel and let (k, l) be the adjoining pixel co-ordinate. The load to be appointed to pixel (k, l) to denoise the pixel at (i, j) is determined utilising Equation (10) as:
Here, and are the smoothing boundaries, and and are the pixel powers. and are the two boundaries that control the behaviour of the respective channel. determines the power–area conduct of the two-sided channel and indicates the spatial conduct of the reciprocal channel.
3.2. Object Detector
The denoising may compel an overlapping of vehicles. If the covering vehicle is not considered, then there may be a probability of a high error rate while identifying the vehicle. A measurable examination has been performed in view of the denoised picture utilising a t-test to assess the covering object.
First, the covering clusters are viewed as edges that demand completely, to some degree, ordinary and ¼-object covering over some haphazard outlines. is chosen in light of the group size of (). In view of the populace mean and test mean , the t-test is used. The distinction between the two clusters is estimated by t-test () figures. Following null hypothesis H0, an alternative hypothesis is formulated prior to figuring out the t-test:
H0 :
There is a vast difference between the population mean and sample mean; that is, the cells are overlapped.
H1 :
There is no difference between the population mean and sample mean; that is, the cells are not overlapped.
There is a ‘significant value’, also called a p-value, in the obtained t-test, which is a likelihood that comes from the sample information occurred by some coincidence. The overlapping of cells is estimated on the basis of the p-value. The magnitude of the p-value determines the affirmation of the null hypothesis. If it exceeds the value of 0.05, the alternate hypothesis is rejected and the null hypothesis is approved. Therefore, overlying cells can be determined due to the t-test.
From the results of the t-test, the covered cell from the particular populace is isolated to shape a solitary cell utilising dilation and erosion operations. At this point, a high blunder rate may occur in the unlikely instance that the covered objects are not isolated. The covered objects are isolated utilising disintegration and widening.
- (a)
- Erosion:
The covered picture goes through an erosion with an organising component (meant Θ), making another picture Θ in all places in which that organising component matches the information picture . For example, if fits , is generally zero in any remaining spots, and replays for all the pixels.
Erosion takes out limited-scope data from a paired picture while lessening the area of concern at the same time. The limits of every region might be found by eliminating the dissolved picture from the first picture:
where is an image of the regions, is a 3-3 structure variable, and is an image of regional boundaries.
- (b)
- Dilation:
The clustered picture goes through a dilation with an organising component making another parallel picture in all spots in which that organising component matches the info picture . For example, if fits , is otherwise zero in any remaining spots, and goes on for all pixel–arrays. The erosion and dilation produce a solitary cell. Furthermore, the cells are tested using the t-test to determine if there are any covered cells present and, if there are not, the extraction of highlights is finished for the picture.
3.3. Feature Point Descriptor
The Kanade–Lucas–Tomasi (KLT) highlight tracker is a methodology utilised to identify movement by feature selection and extraction. A component, or a focal point, is a point or collection of places where the algorithm can search and track the movement through outlines. For tracking features across image frames it is of utmost importance for the purpose of error minimisation that “good” features are selected. The matrix for choosing Shi–Tomasi features is as follows:
where is the second framework of the picture about a point with the window of size . The points in the picture , where is non-solitary and the base eigenvalue of is over a particular edge, , are considered to be the interest points. In the wake of recognising the interest points in outlines and , an interest point can be followed from time to time with the Kanade–Lucas calculation for optical stream. For following points across distances on the request for a few pixels, an iterative execution with picture pyramids was utilised. Consider the pyramidal picture of at the pyramid level .
where is any point in . The ideal dislodging can then be assessed by limiting the blunder capability ∈:
The mistake capability is:
3.4. Geolocation Motion Detector
The feature point descriptor from the discovery strategy is trailed by geolocation movement detection. Movement identification assists with finding the vehicle district from a unique region. This work has fostered an introduced thickness-based spatial grouping of utilisation with commotion. The technique is equipped for following movement in the picture as well as video outlines. It gives a grouping of the comparable area and recognises the geolocation and, from that point, plays out the bounding box creation over the movement region.
Initially, generation of the histogram information of the picture is performed and, following discovery, is transferred to a semi-administered multi-object that distinguishes the exceptional similitudes between the pixel points in an image and groups them per likeness.
Two parameters that dictate this methodology are minimum points (MinPts) and Epsilon. The radius of a circle is stated by Epsilon () by considering a one-pixel point from the image. The number of points at which the condition of formation of clusters is satisfied is defined by MinPts.
Given the MinPts and Eps, three significant points are defined; namely, noise points, boundary points, and core points. A pixel point is intended to be the centre point on the chance that it fulfils the MinPts inside the Eps Distance. A pixel point is designated as a boundary point on the chance that it is a neighbour of the centre point. If a point does not belong to the category of core point or boundary point then it is categorised as a noise point.
Euclidean distance forms the basis of the computation of the core point (), boundary point (), and noise point. Initially, a random pixel point is selected (). The pixel point is then checked by drawing a circle of distance with a condition of satisfying the MinPts using Euclidean distance that is computed by:
The authenticated image clusters will be formed based on the boundary points and core points, and the change of motion is stated as an outlier .
Based on the distance between the truth and the predicted bounding box, the distance loss value is evaluated and the motion is detected.
3.5. Decision Making
Navigation outlines the marking of the item found through distinguishing the movement and the article. To furnish this strategy with ideal dynamics, a Fast R CNN-OMDP (Markov Decision Process with Option [24]) strategy for identifying the vehicles precisely has been developed. The portrayal of the proposed dynamic method is shown in Figure 2.
3.6. GKMF (Gaussian Kernel Membership Function) -OMDP Approach for Interval-Valued Decision Dystem (IDS)
Initially, the environments are categorised into three states: “Normally Operating (),” “Crowded (),” and “Overcrowded ().” Consider the respective actions performed over each state labelled as: “labelling (),” “unlabelled (),” and “reset (),”as are illustrated in Figure 3. Let be the probability of transition for state–action pair (), i.e., , and let a reward function be allotted for the correct state–action pair and respective discount factor . A policy maps for each period is assigned, and a state–action history up to time to a probability distribution over the set of actions () is initiated. In general, the policy is history-dependent. The goal is to find a policy π that maximises the infinite horizon discounted expected reward :
where represents the state at time period and illustrates the action chosen at time that follows the probability distribution of . The vector is a given initial probability distribution over the set of states . it is assumed that for all states s and that the rewards are non-negative. It is also assumed that the set of states and the set of actions are finite. The OMDP architecture has been depicted in Figure 3.
The object-detection system is built based on the transition among the states and the respective action outputs that will explicate whether the environment is normal or abnormal. Initially, under the “labelling” action (control ), there are self-transitions in the state that represent a secure environment and which illustrate the normal execution of the process. However, when there is a transition from state to occurring at per-stage probability , then an intrusion attempt begins. Thereafter, self-transitions in the state are unlabelled. Eventually, a transition from state to occurs with per-stage probability , which represents the starting of the reset that persists indefinitely. The cost of the transition beginning at the state is cost-free, whereas for the transition beginning at the state and there exists costs of and . These same probabilities or cost parameters apply under the “unlabelled” action (control ) but with two differences: first, the possible transition from the state back to (occurring with per-stage probability ) represents the successful disruption of the intrusion attempt via reducing the intrusion cost; and second, the cost of disruption is incurred in addition to the transition cost under control . Finally, under the “reset” action (control ), a transition back to state occurs with a probability of one, incurring at the beginning of the decision stage a cost of no matter the state.
3.6.1. Optimal Policy for Decision Making
Based on the OMDP choice, an ideal strategy is implemented, which eventually positions the qualities from the picture () and video stage () to be given to the extremity characterisation, a move toward in training the dataset to rely on the extremity of the position value of the information. The current extremity characterisation will, in general, accomplish an erroneous recognition because of the low quality of the picture and the off-base division of the picture. To overcome these difficulties, a Mask R-CNN assembly to analyse the movement based on the geolocation has been developed (Figure 4). The created approach is split into specific layers, such as:
- (1)
- Convolution layer
- (2)
- RPN Layer
- (3)
- ROI layer
- (4)
- Segmentation mask layer
- (5)
- Fully connected layer
3.6.2. Convolution Layer
Convolutional neural networks are a profound learning technique that take input text, grids, and pictures and convolve them with channels or pieces to extricate highlights. The information text network and the picture are convolved with a channel, and this convolution activity learns a similar component of the whole picture. The size of the resulting network with no padding is represented by:
The window slides after every activity and the highlights are advanced by the component maps. The element maps catch the neighbourhood’s open field of the picture and work with shared loads and predispositions. The convolution activity is given by:
Padding is utilised to safeguard the size of the information picture. In ‘SAME’ padding, the resultant picture size is equivalent to the information picture size and ’VALID’ cushioning is regarded as no cushioning. The size of the resulting network with padding is stated as:
Here, is the output, p is the padding, is the stride, b is the bias, is the sigmoid activation function, represents the weight matrix of shared weights and is the input activation at the position .
After the padding of the resulting array, the convolution layer receives an element map for the concerning picture. The acquired component map is given by:
3.6.3. RPN Layer
A Region Proposal Network (RPN) takes the element map as input and predicts whether the names and movements are present or not. The RPN utilises a sliding window to filter the component guides and track down the return for value-invested regions (cells) where the object exists. Each obtained return for value invested region is a square shape (anchor) on the image.
After the RPN network handling and forecast, a progression of bounding boxes can be obtained and their situation and size are remedied. On the slight chance that different bounding boxes cross over one another, the Non-max Suppression (NMS) is applied to obtain the jumping box with a higher forefront score and pass it on to the following stage.
There are two result layers for each RPN, i.e., a text/non-text characterisation layer and a rectangular bounding box relapse layer. The loss function of the RPN can be indicated as follows:
where , and are the predicted labels of text, images, and boxes for RPN, , and are the ground truth values of labels of text, image and boxes, and are, respectively, the losses of classifier and regressor, and is the learning rate.
Thus, bounding boxes are obtained by evaluating the loss and preceding the next stage.
3.6.4. ROI Layer
At this stage, the picture from the RPN is of various shapes, so the pooling layer is acquired to reshape it into a similar size. It adjusts the separated highlights to the first district proposition network appropriately and assists with delivering better pixel division results. The ROI layer assists with working on the exactness of the model.
For every one of the anticipated districts, the Intersection over Union () with the ground truth boxes for both text and picture input is figured. The is given by:
Thereafter, provided that the IoU is more prominent than or equivalent to 0.5, it will be considered a region of interest. In any case, that specific region is dismissed. This process is repeated for every one of the locales and a few districts for which the IoU is more prominent than 0.5 are selected.
3.6.5. Segmentation Mask Layer
A resultant mask layer is added based on the previous layer. This provides the segmentation mask for every region that contains an item. The segmentation mask layer acquires the expectation of cover for all articles in a picture.
Finally, the division cover object is levelled and given as a contribution to a completely associated layer.
3.6.6. Fully Connected Layer
The contribution to the completely associated layer results from the past division veil layer, which is levelled and afterwards taken care of by the completely associated layer. The straightened vector prepares the completely associated layer, such as that of ANN. The preparation of the vector is finished utilising:
where represents the bias (initialised randomly), is the corresponding input node weight, and represents the activation function The fully connected layer uses the SoftMax activation function to determine the probabilities of the object labelling observed in the input image.
4. Results and Discussion
The developed algorithm for a vehicle- and motion-tracking prediction system is implemented in Python and the results are analysed for the proposed object, geolocation, and decision-making algorithms. The framework runs on a PC with an Intel(R) i7-8700 CPU @3.20GHz, NVIDIA GTX-2070 GPU (8 GB), and 16 GB RAM. In the test, 90% of the data is used for training and 10% is used for testing. The sample frames showing input and decision making are shown in Figure 5.
4.1. Dataset
The VisDrone2019 dataset was gathered at the Lab of Machine Learning and Data Mining by the AISKYEYE team at Tianjin University in China. The standard dataset involved 288 video clips designed by 10,209 static images and 261,908 frames, monitored by several drone-mounted cameras and covering an extensive range of features incorporating location (gathered from 14 diverse cities detached by thousands of kilometres in China), objects (vehicles, pedestrian, and bicycles, etc.), environment (country and urban), and density (sparse and crowded scenes). It should be noted that the dataset was gathered under several drone platforms (i.e., drones with diverse methods), in various situations, and under different lighting and weather conditions.
4.2. Performance Analysis of Proposed OSBMO for Object Detection
The proposed OSBMO object-detection technique is analysed based on Global Consistency Error, Rand Index, and Variation of Information. It is compared to the existing techniques such as Watershed, LevelSet, and Region Growing in order to determine whether the proposed scheme outperforms the current deep learning methods for object detection. The metrics on which the evaluation of the proposed method is performed are tabulated in Table 2.
Table 2 represents the assessment of the proposed OSBMO object-detection strategy with different existing techniques in light of the measurements such as Global Consistency Error (GCE), Rand Index (RI), and Variation of Information (VOI). The assessment expresses the dependability of the proposed method in light of different datasets, uneven datasets, and delicate information, etc. The observed result shows that the proposed calculation will, in general, accomplish superior exhibition measurements values; for example, a GCR of 0.00789, RI of 0.95678, and a VOI value of 0.05883 which ranges between 0.00783–0.05883, though the current strategies accomplish a general presentation measurements value running between 0.034-0.89. The running value indicates that the proposed calculation ranges between the most minor and extreme values when contrasted with the current techniques. The proposed strategy will, in general, accomplish a better item identification output by limiting the blunder rate and covering intricacy when contrasted with current techniques. The graphical examination of the proposed work is illustrated in Figure 5.
Figure 6 represents the visual examination of the proposed calculation with different existing algorithms considering the presentation measurements. The measurements address the proficiency of the proposed strategy. The proposed OSBMO calculation accomplishes superior measurements values when contrasted with state-of-the-art methods. The proposed calculation distinguishes the item precisely, even in packed regions, with a lower error rate.
4.3. Performance Analysis of Proposed DBSCAN for Geolocation Motion Detection
In light of the measurements—for example, clustering error rate, bunching time, precision, and MSE—the proposed DBSCAN is examined with different existing methods. The examination is mainly completed to break down the geolocation of the articles inside various edges. The assessment of the measurements is arranged in Table 3.
Table 3 delineates the clustering time taken to identify the target movement for various casings. The proposed DBSCAN procedure takes a grouping time running between 38,705 s and 79,447 s for Object 1 for outlines ranging from 100 to 500. The proposed strategy will generally perform in a generally comparable way for various items. The movement and geolocation following is achieved due to the Manhattan distance. Inside low time, the work is fit for accomplishing a high reaction movement following common clustering error and mean square error, as is displayed in Table 4.
Table 3 delineates the metric examination of the proposed DBSCAN with the existing strategies to assess movement detection. The misleading recognition emerges predominantly due to ill-advised algorithm learning, system intricacy, etc.; reasons for which there is a possibility of misdetection. The proposed DBSCAN, in general, accomplished a lower Clustering Error Rate of 0.822, MSE value of 0.58392, and a higher accuracy of 86.78%. However, the existing CLARA, FCM, K-Means Grouping, and PAM methods accomplish a higher benefit of clustering error rate, an MSE in the middle between 11.87 and 276.7, and a lower precision value ranging between 79.10% and 80.99%. Based on the observed measurement values, it may be expressed that the proposed strategy performs better than the existing techniques and will generally distinguish the geolocation of the articles for various objects more precisely. The graphical portrayal of the proposed calculation is represented in Figure 6.
Figure 7 graphically represents the clustering error rate, accuracy, and MSE metrics analysis of the proposed DBSCAN with various existing algorithms such as CLARA, FCM, K-Means Clustering, and PAM. The analysis states that the proposed method avoids false detection and obtains an accurate result compared to the existing techniques.
4.4. Performance Analysis of Proposed RL for Object Detection
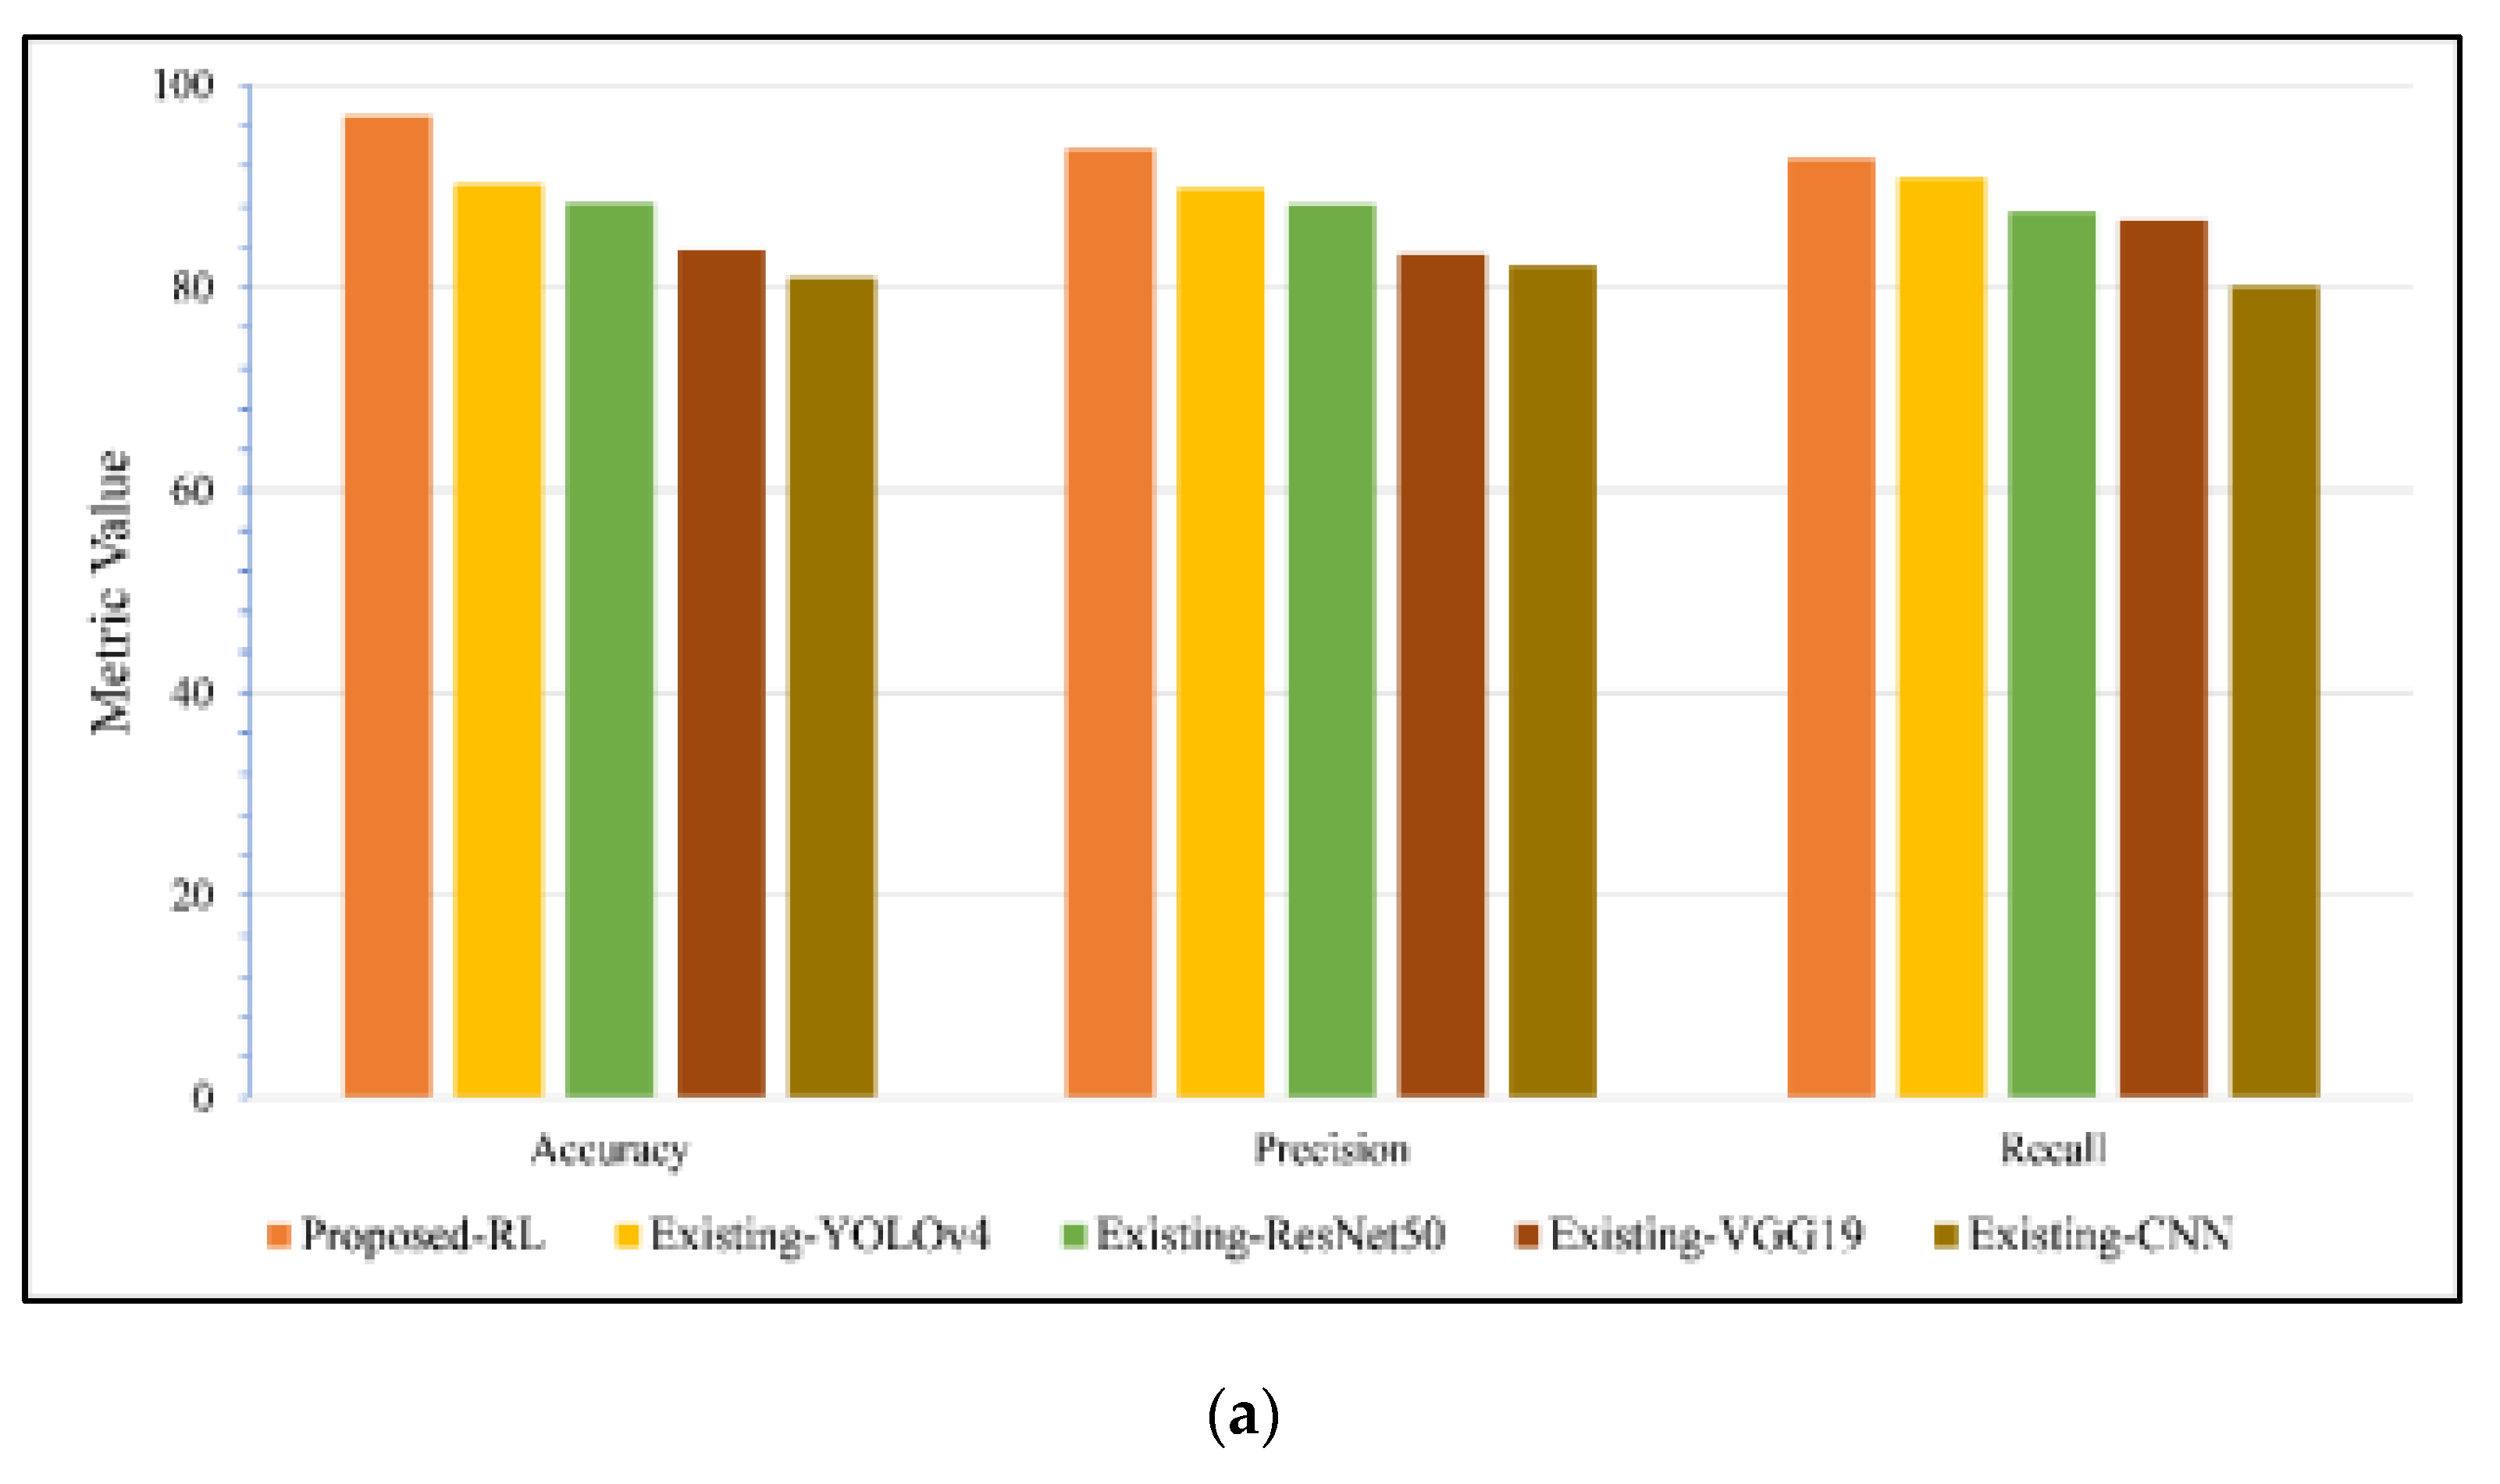
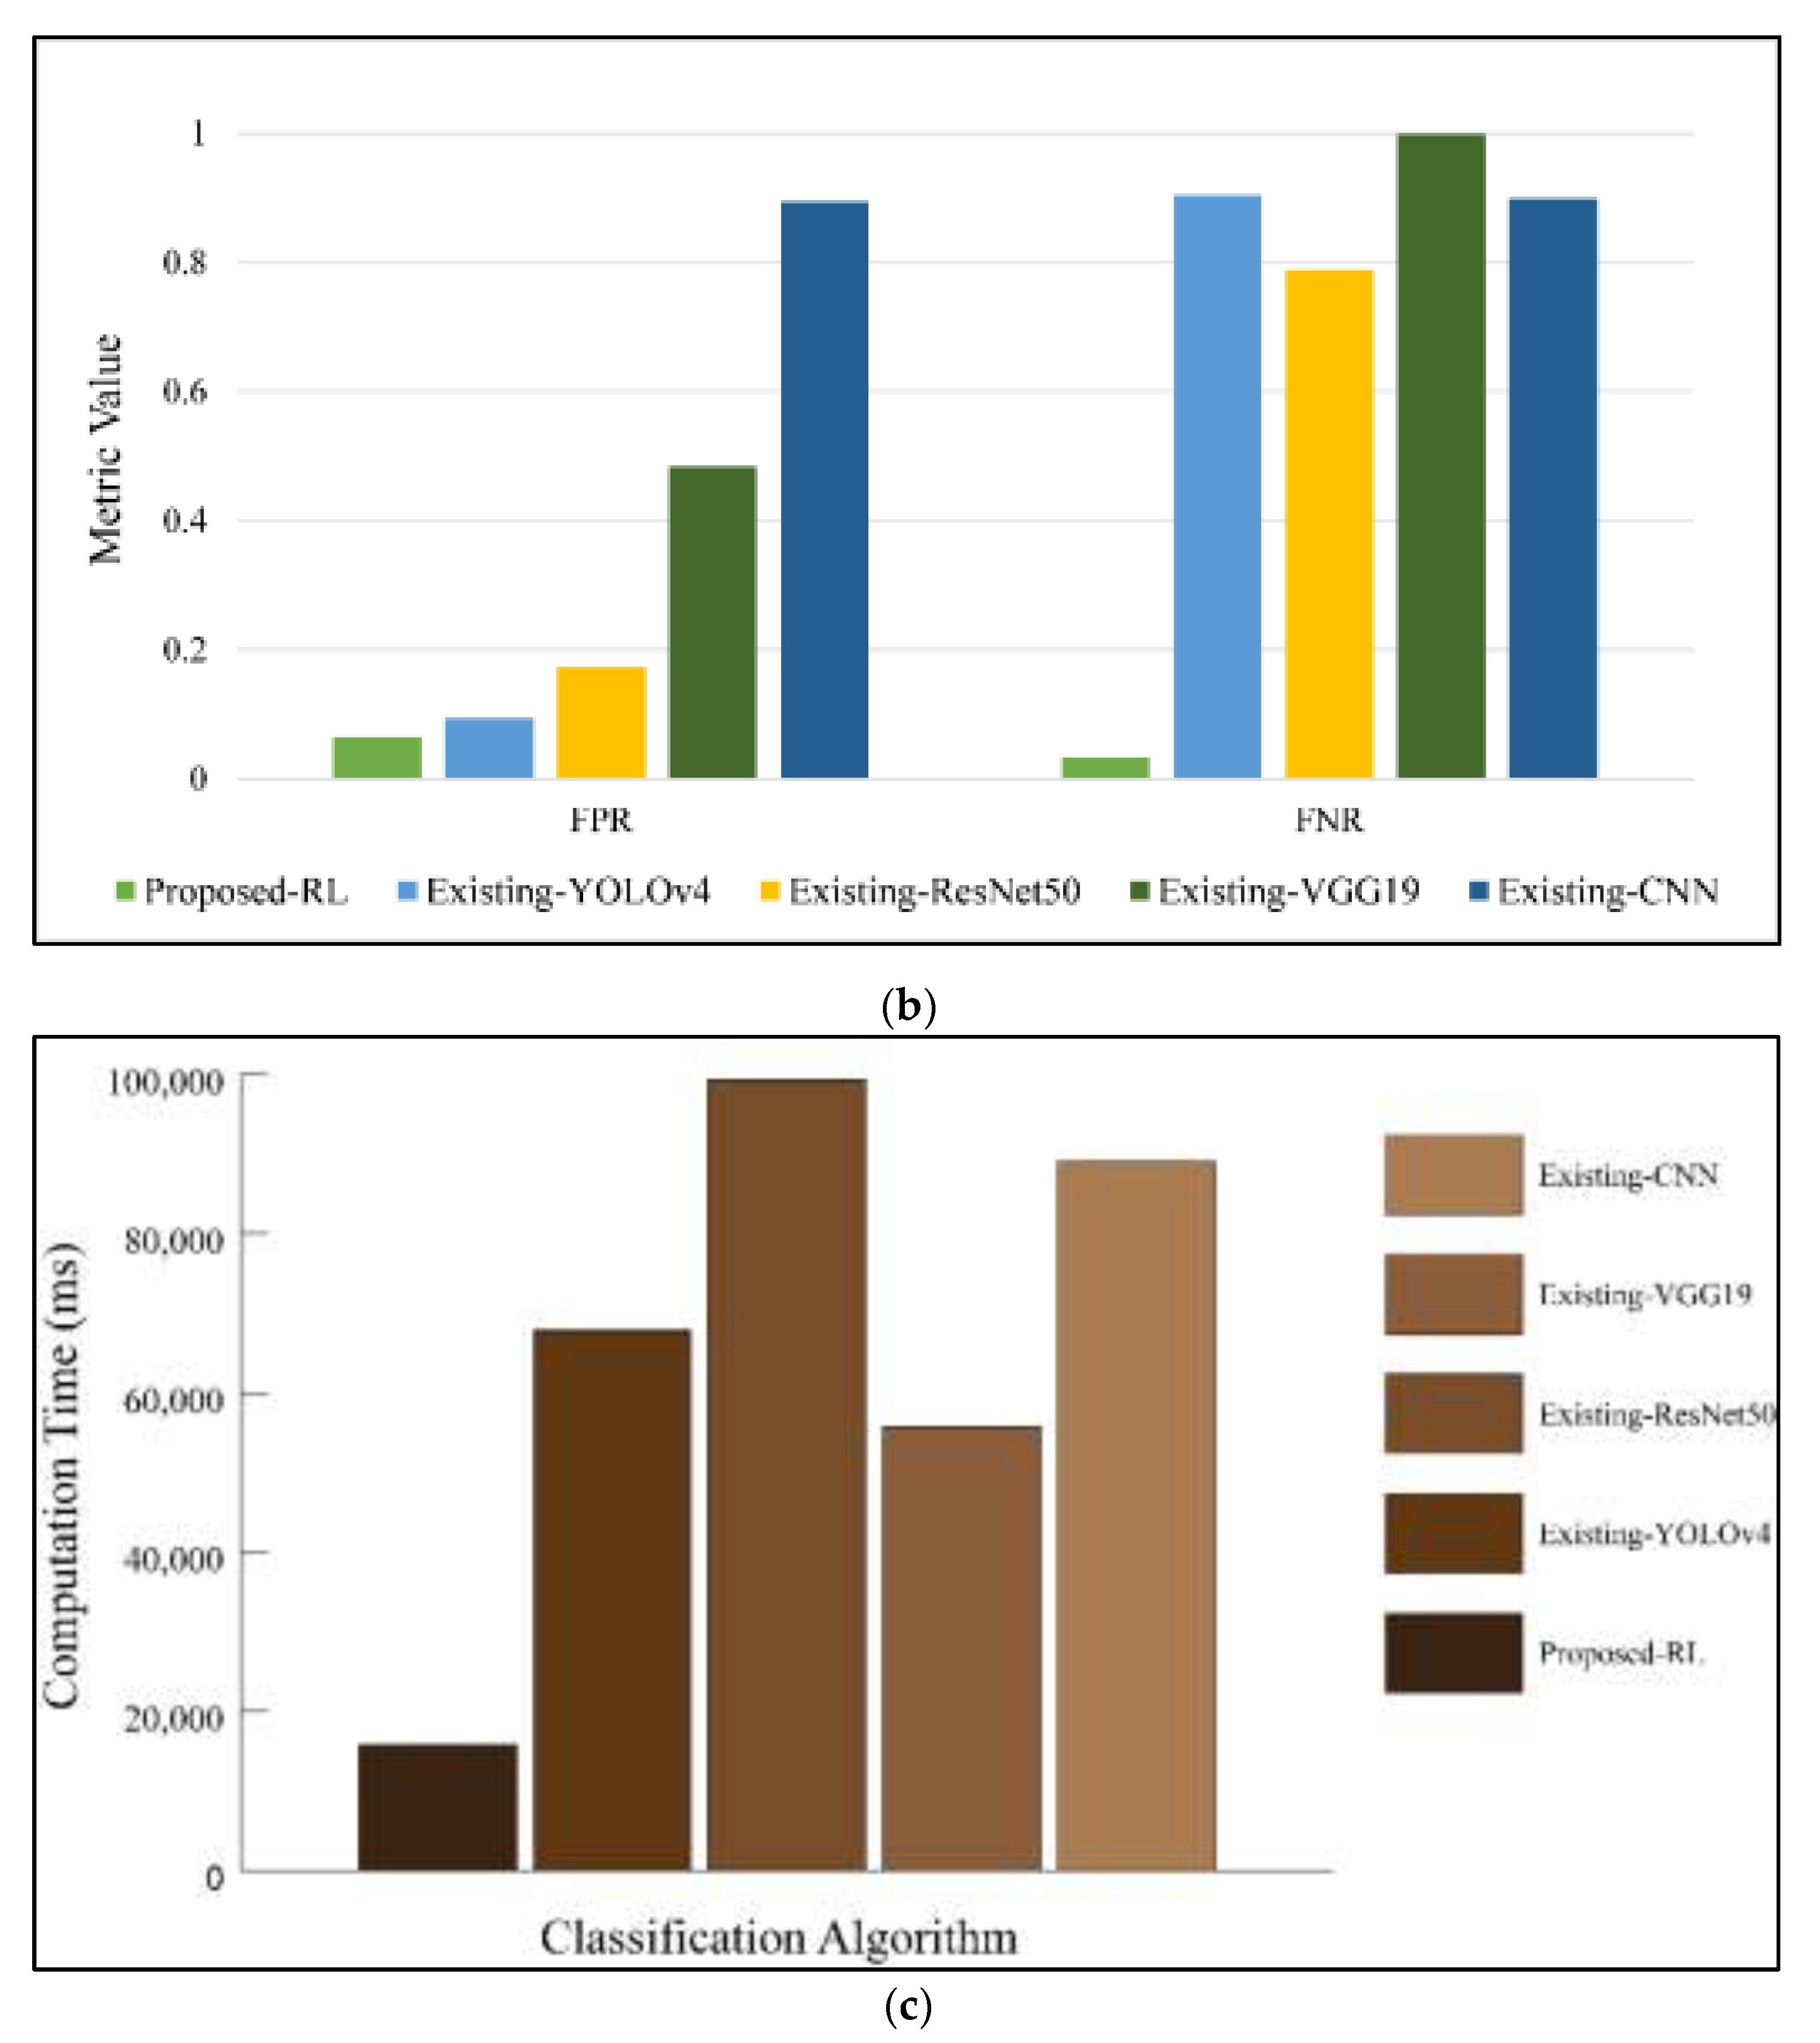
The proposed RL is inspected and fixated on the measurements such as accuracy, recall, precision, computation time, FPR, and FNR with various existent techniques such as YOLOv4, Resnet50, VGG19, and CNN. Table 5 arranges the proposed strategy’s assessment along with the standard techniques focused on vehicle detection.
Table 5 displays the proposed RL along with various existing techniques such as YOLOv4, Resnet50, VGG19, and CNN, focusing on measurements, i.e., accuracy, recall, precision, computation time, FPR, and FNR. The four fundamental parameters such as true negative (TN), true positive (TP), false negative (FN), and false positive (FP), form the basis of the performance assessment metrics. The previously mentioned boundaries are the premise focused on the exhibition measurements. As a TP characterises that the real value is an object and the value anticipated matches the same; a TN describes that the genuine value is not an object and the value anticipated likewise yields something similar; an FP establishes that the actual value is not an object, yet the value anticipated is showing an object, and an FN characterises that the actual value is an object, but the predicted value is not detecting the object. Thus, an object-detection assessment is dependent on the four indices mentioned earlier. Indeed, the proposed algorithm is very robust and has overcome the previous algorithms. Benjdira et al. [25] compared the Fast R CNN with YOLOv3 for car detection in UAV images and concluded that the former was slower than YOLOv3. However, our proposed algorithm based on FRCNN has surpassed the next version of YOLOv3.
Figure 8 shows the proposed RL along with the various existent techniques, such as YOLOv4, Resnet50, VGG19, and CNN, focused on measurements, i.e., accuracy, recall, precision, computation time, FPR, and FNR. The measurement accuracy and review symbolise the work’s satisfactoriness on the assorted dataset, i.e., the proposed order strategies’ unwavering quality. When compared to other state-of-the-art deep learning architectures, the proposed framework achieves a more remarkable accuracy, recall, precision, FPR, FNR, and computation time of 96.83%, 92.64%, 93.67%, 0.0646%, 0.0337%, and 15785s, respectively. In any case, the existent method accomplishes the metric value running in between 0.1736% and 90.76% that embodies a lesser plan viability as analogised to the procedure proposed. In addition, the proposed method is broken down and fixated on computation time measurements that depict the exactness of unbalanced dispersion probability. With respect to quantifying measures, the strategy presented yields a higher worth of object detection and tracking and avoids a false detection rate, leading to a low error rate. In this way, the proposed strategy yields proficient unwavering quality and sidesteps object detection as analogised to existing procedures.
5. Conclusions
The proposed work introduced a challenging UAV benchmark containing various UAV recordings acquired in complex scenarios. To expand the cues, e.g., appearance and movement in following given UAV information, the work has proposed an intelligent, self-advanced, and consistent methodology for programmed vehicle identification, following and geolocation in UAS-acquired images that utilise recognitions, area and following highlights to upgrade an ultimate conclusion. A productive, ideal reinforcement learning calculation due to a Fast RCNN has made an ideal approach to precise vehicle identification. The proposed work performs well in a thickly filled parking garage, an intersection, a crowded street, and so on. The work handles identifying small objects by overcoming the problems of finding a reasonable element space and causing various vehicles to resemble each other.
Finally, the work was evaluated alongside several cutting-edge identification and following methodologies on the benchmark information with notable credits for UAVs. The trial results demonstrated how the proposed model could make the following outcomes more potent in both single- and numerous- object following. As the characteristics of UAV stage information are alterable in various conditions, the scene priors ought to be viewed in identification and following techniques.
Author Contributions
Conceptualisation, C.H.S., V.M.; methodology, C.H.S., V.M. and A.K.S.; validation, C.H.S., V.M.; formal analysis, C.H.S., V.M. and A.K.S.; writing—original draft preparation, C.H.S., V.M. and A.K.S.; writing—review and editing, C.H.S., V.M., K.J. and A.K.S.; supervision, K.J. and A.K.S. All authors have read and agreed to the published version of the manuscript.
Funding
This research received no external funding.
Institutional Review Board Statement
Not applicable.
Informed Consent Statement
Not applicable.
Data Availability Statement
The data supporting this study’s findings are available from the corresponding author upon reasonable request.
Acknowledgments
The authors thank to the Indian Institute of Technology, Roorkee for the use of their resources. The authors are also thankful to the anonymous reviewers for their constructive suggestions for improving the quality of the present work.
Conflicts of Interest
This manuscript has not been published or presented elsewhere in part or in entirety and is not under consideration by another journal. There are no conflicts of interest to declare.
References
- Kelechi, A.H.; Alsharif, M.H.; Oluwole, D.A.; Achimugu, P.; Ubadike, O.; Nebhen, J.; Aaron-Anthony, A.; Uthansakul, P. The Recent Advancement in Unmanned Aerial Vehicle Tracking Antenna: A Review. Sensors 2021, 21, 5662. [Google Scholar] [CrossRef] [PubMed]
- Chen, R.; Li, X.; Li, S. A lightweight CNN model for refining moving vehicle detection from satellite videos. IEEE Access 2020, 8, 221897–221917. [Google Scholar] [CrossRef]
- Chen, Y.; Zhao, D.; Er, M.J.; Zhuang, Y.; Hu, H. A novel vehicle tracking and speed estimation with varying UAV altitude and video resolution. Int. J. Remote Sens. 2021, 42, 4441–4466. [Google Scholar] [CrossRef]
- Balamuralidhar, N.; Tilon, S.; Nex, F. MultEYE: Monitoring system for real-time vehicle detection, tracking and speed estimation from UAV imagery on edge-computing platforms. Remote Sens. 2021, 13, 573. [Google Scholar] [CrossRef]
- Butilă, E.V.; Boboc, R.G. Urban Traffic Monitoring and Analysis Using Unmanned Aerial Vehicles (UAVs): A Systematic Literature Review. Remote Sens. 2022, 14, 620. [Google Scholar] [CrossRef]
- Shan, D.; Lei, T.; Yin, X.; Luo, Q.; Gong, L. Extracting key traffic parameters from UAV video with on-board vehicle data validation. Sensors 2021, 21, 5620. [Google Scholar] [CrossRef]
- Zhou, W.; Liu, Z.; Li, J.; Xu, X.; Shen, L. Multi-target tracking for unmanned aerial vehicle swarms using deep reinforcement learning. Neurocomputing 2021, 466, 285–297. [Google Scholar] [CrossRef]
- Byun, S.; Shin, I.-K.; Moon, J.; Kang, J.; Choi, S.-I. Road traffic monitoring from UAV images using deep learning networks. Remote Sens. 2021, 13, 4027. [Google Scholar] [CrossRef]
- Srivastava, S.; Narayan, S.; Mittal, S. A survey of deep learning techniques for vehicle detection from UAV images. J. Syst. Archit. 2021, 117, 102152. [Google Scholar] [CrossRef]
- Darehnaei, Z.G.; Fatemi, S.M.J.R.; Mirhassani, S.M.; Fouladian, M. Ensemble Deep Learning Using Faster R-CNN and Genetic Algorithm for Vehicle Detection in UAV Images. IETE J. Res. 2021, 1–10. [Google Scholar] [CrossRef]
- Abdelmalek, B.; Zarzour, H.; Kechida, A.; Taberkit, A.M. Vehicle detection from UAV imagery with deep learning: A review. IEEE Trans. Neural Netw. Learn. Syst. 2021, 33, 6047–6067. [Google Scholar]
- Wu, X.; Li, W.; Hong, D.; Tao, R.; Du, Q. Deep learning for unmanned aerial vehicle-based object detection and tracking: A survey. IEEE Geosci. Remote Sens. Mag. 2021, 10, 91–124. [Google Scholar] [CrossRef]
- Avola, D.; Cinque, L.; Diko, A.; Fagioli, A.; Foresti, G.; Mecca, A.; Pannone, D.; Piciarelli, C. MS-Faster R-CNN: Multi-stream backbone for improved Faster R-CNN object detection and aerial tracking from UAV images. Remote Sens. 2021, 13, 1670. [Google Scholar] [CrossRef]
- Memon, S.A.; Ullah, I. Detection and tracking of the trajectories of dynamic UAVs in restricted and cluttered environment. Expert Syst. Appl. 2021, 183, 115309. [Google Scholar] [CrossRef]
- Xin, L.; Zhang, Z. A vision-based target detection, tracking, and positioning algorithm for unmanned aerial vehicle. Wirel. Commun. Mob. Comput. 2021, 2021, 5565589. [Google Scholar]
- Boudjit, K.; Ramzan, N. Human detection based on deep learning YOLO-v2 for real-time UAV applications. J. Exp. Theor. Artif. Intell. 2022, 34, 527–544. [Google Scholar] [CrossRef]
- Zhao, X.; Pu, F.; Wang, Z.; Chen, H.; Xu, Z. Detection, tracking, and geolocation of moving vehicle from uav using monocular camera. IEEE Access 2019, 7, 101160–101170. [Google Scholar] [CrossRef]
- Redmon, J.; Farhadi, A. Yolov3: An incremental improvement. arXiv 2018, arXiv:1804.02767. [Google Scholar]
- Valappil, N.K.; Memon, Q.A. CNN-SVM based vehicle detection for UAV platform. Int. J. Hybrid Intell. Syst. 2021, preprint. [Google Scholar]
- Li, B.; Yang, Z.-P.; Chen, D.-Q.; Liang, S.-Y.; Ma, H. Maneuvering target tracking of UAV based on MN-DDPG and transfer learning. Def. Technol. 2021, 17, 457–466. [Google Scholar] [CrossRef]
- Espsoito, N.; Fontana, U.; D’Autilia, G.; Bianchi, L.; Alibani, M.; Pollini, L. A hybrid approach to detection and tracking of unmanned aerial vehicles. In Proceedings of the AIAA Scitech 2020 Forum, Orlando, FL, USA, 6–10 January 2020; p. 1345. [Google Scholar]
- Shao, Y.; Mei, Y.; Chu, H.; Chang, Z.; Jing, Q.; Huang, Q.; Zhan, H.; Rao, Y. Using Multiscale Infrared Optical Flow-based Crowd motion estimation for Autonomous Monitoring UAV. In Proceedings of the 2018 Chinese Automation Congress (CAC), Xi’an, China, 30 November–2 December 2018; IEEE: Piscataway, NJ, USA, 2018; pp. 589–593. [Google Scholar]
- Quanfu, F.; Brown, L.; Smith, J. A closer look at Faster R-CNN for vehicle detection. In Proceedings of the 2016 IEEE Intelligent Vehicles Symposium (IV), Gotenburg, Sweden, 19–22 June 2016; IEEE: Piscataway, NJ, USA, 2016; pp. 124–129. [Google Scholar]
- Sutton, R.S.; Precup, D.; Singh, S. Between MDPs and semi-MDPs: A framework for temporal abstraction in reinforcement learning. Artif. Intell. 1999, 1, 181–211. [Google Scholar] [CrossRef] [Green Version]
- Benjdira, B.; Khursheed, T.; Koubaa, A.; Ammar, A.; Ouni, K. Car detection using unmanned aerial vehicles: Comparison between faster r-cnn and yolov3. In Proceedings of the 2019 1st International Conference on Unmanned Vehicle Systems-Oman (UVS), Muscat, Oman, 5–7 February 2019; IEEE: Piscataway, NJ, USA, 2019; pp. 1–6. [Google Scholar]
Figure 1.
Proposed methodology.
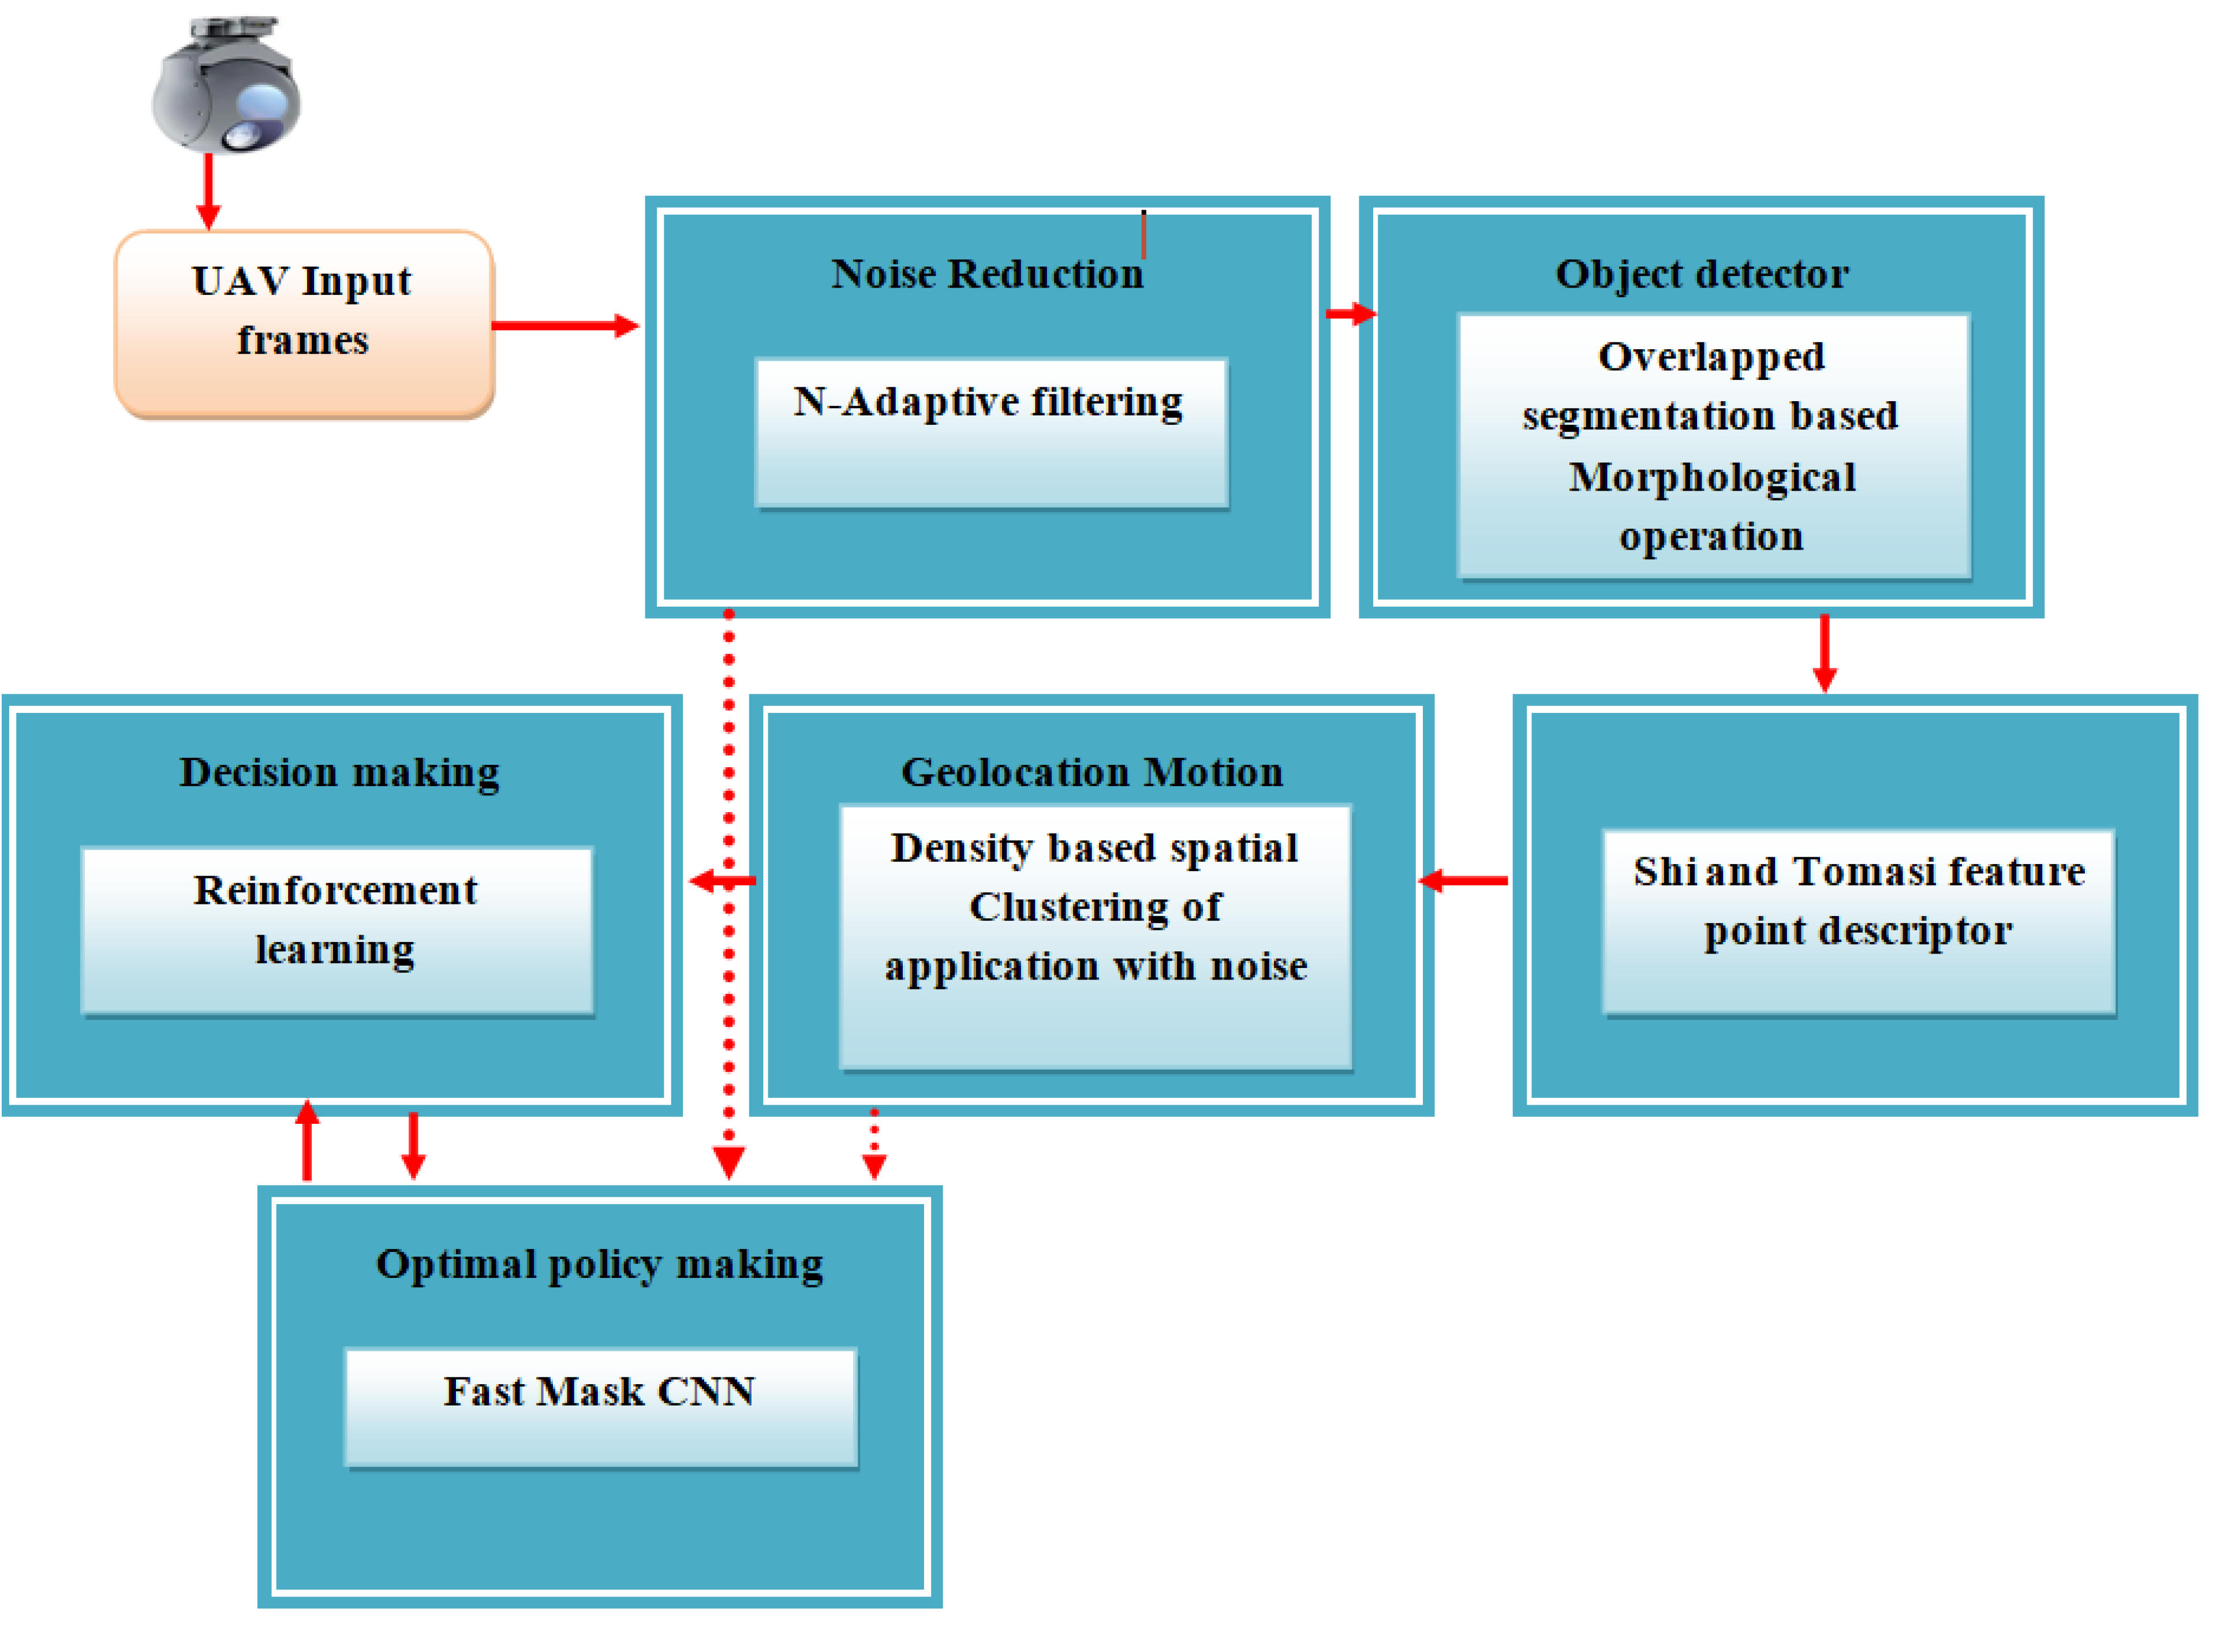
Figure 2.
Proposed optimal reinforcement learning.

Figure 3.
OMDP Architecture.
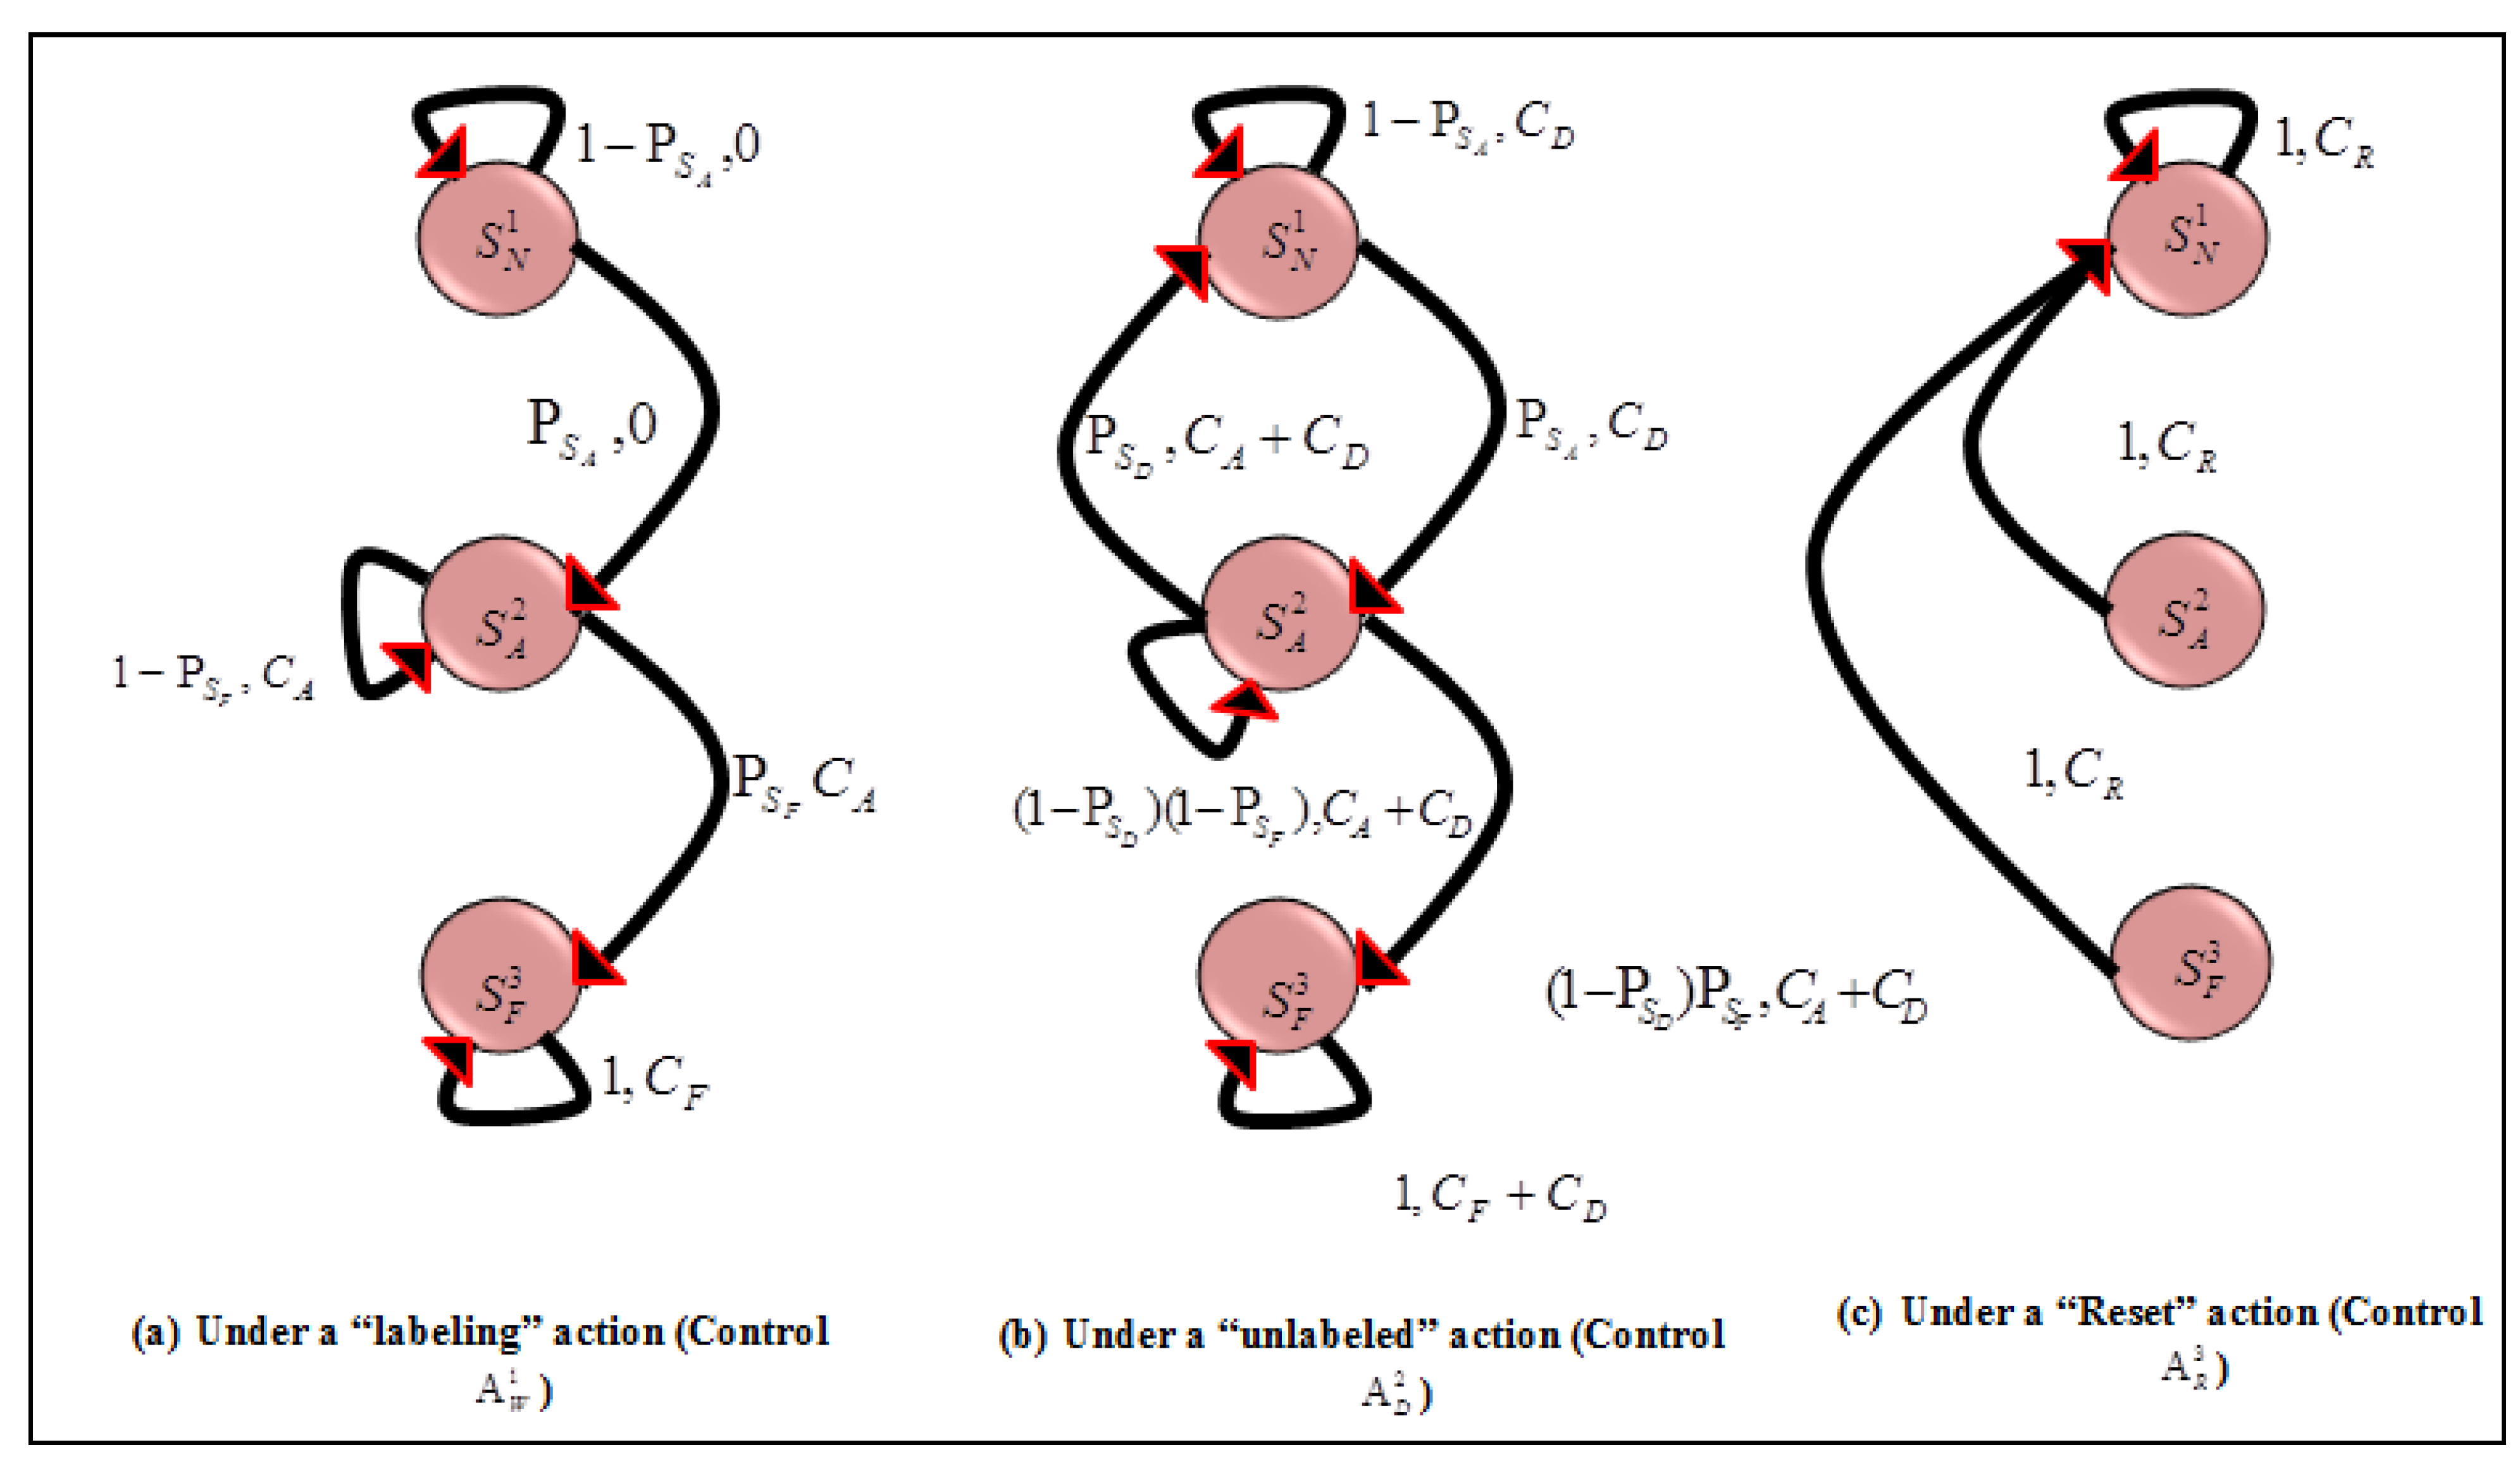
Figure 4.
Fast RCNN.
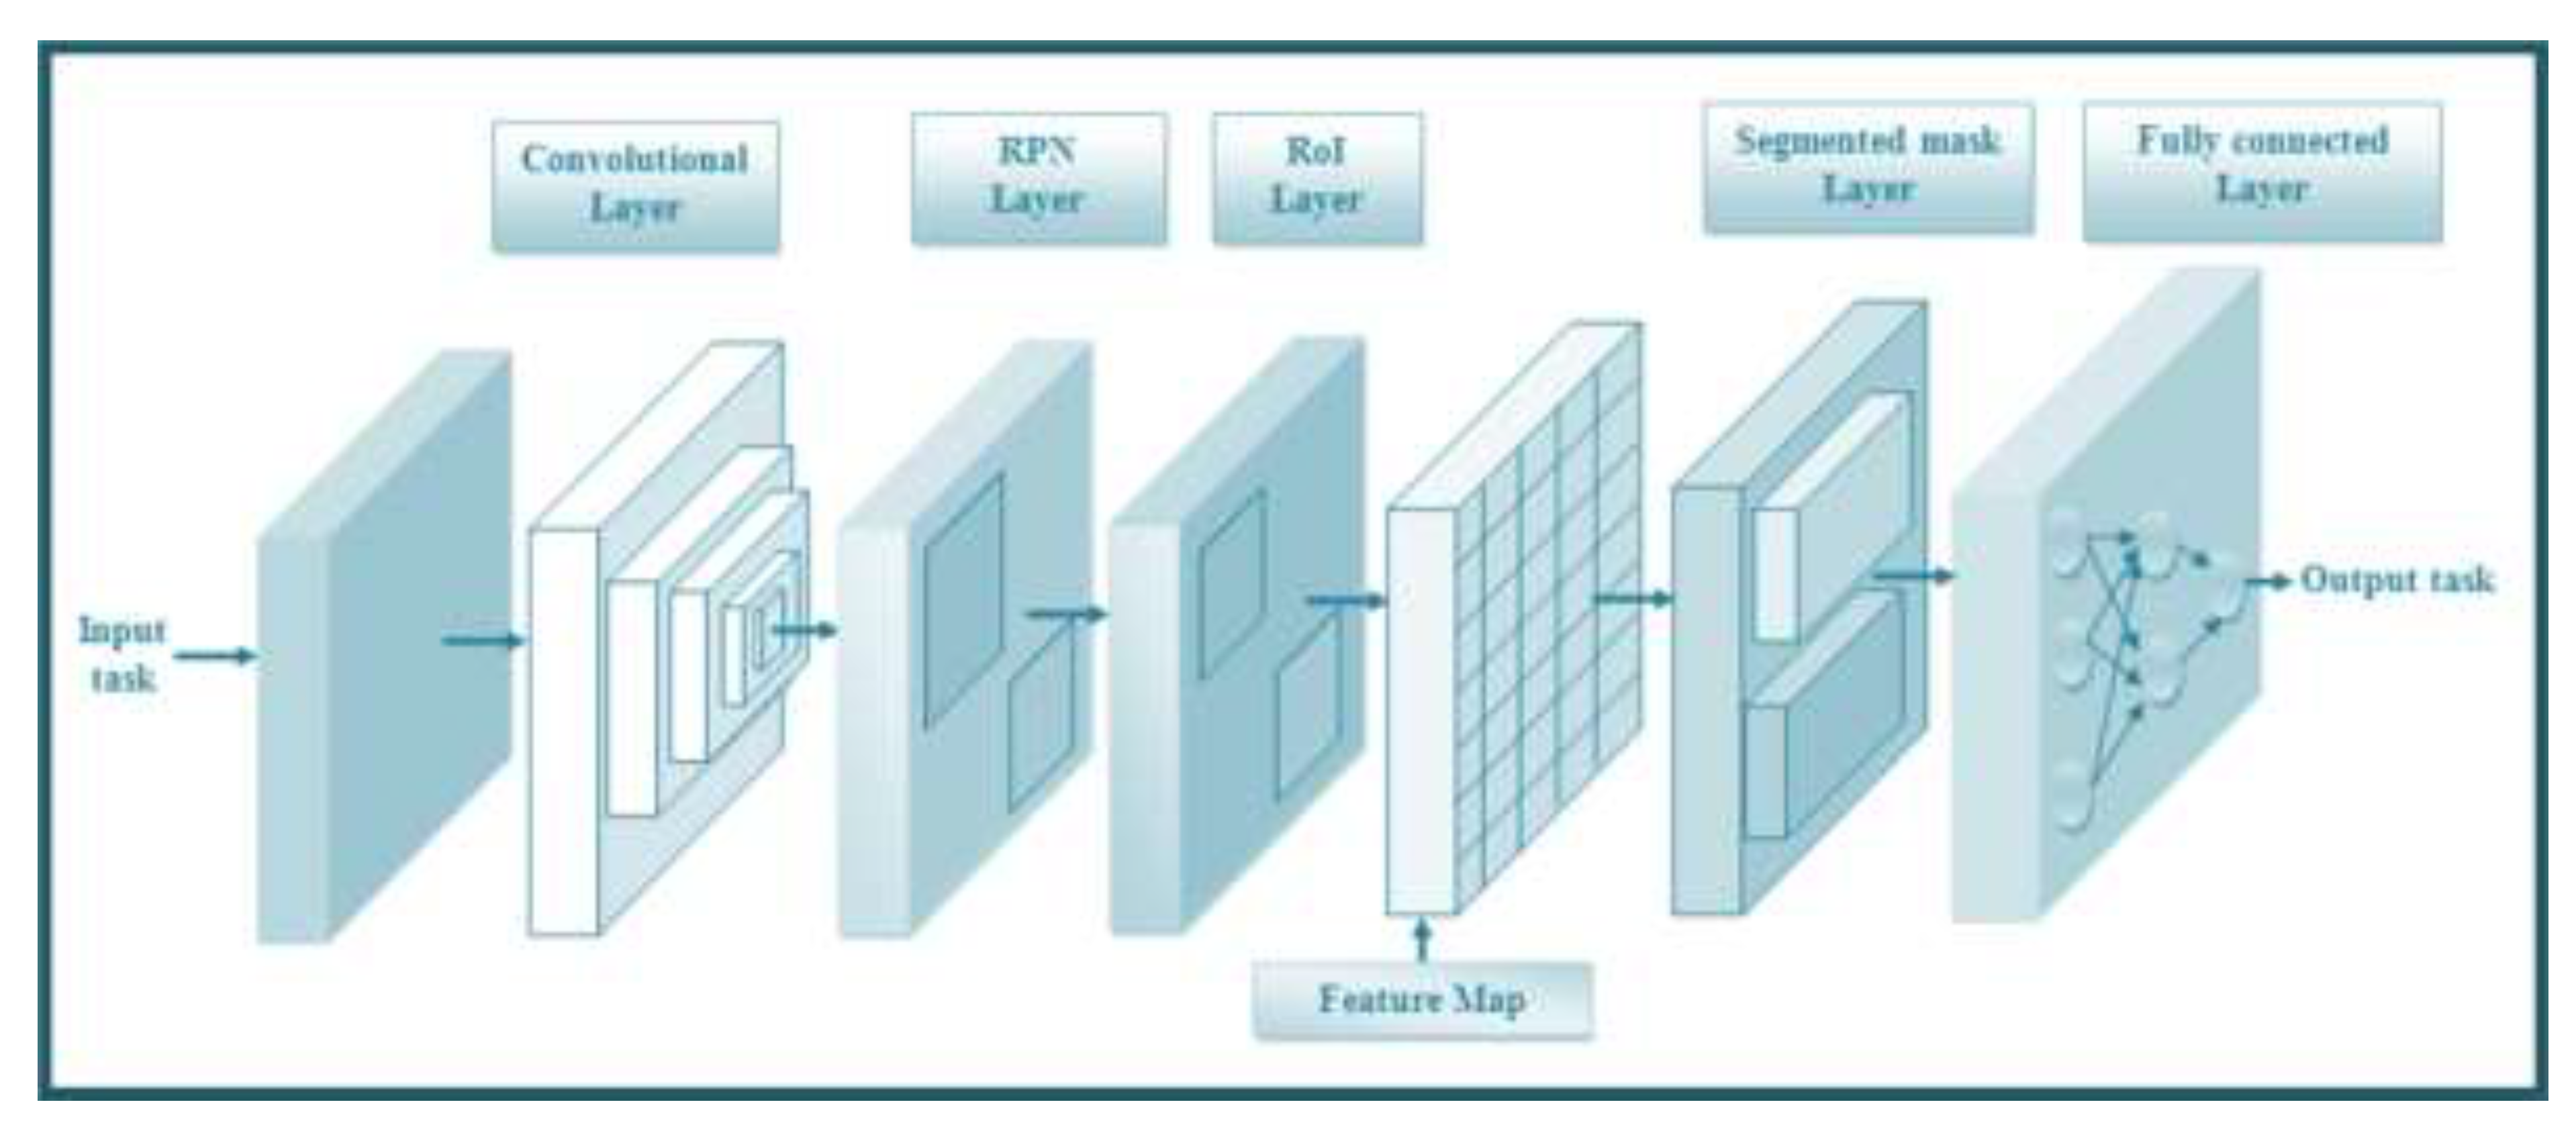
Figure 5.
Proposed vehicle detection and motion detection sample frames. (a) Input image; and (b) detected image.
Figure 5.
Proposed vehicle detection and motion detection sample frames. (a) Input image; and (b) detected image.
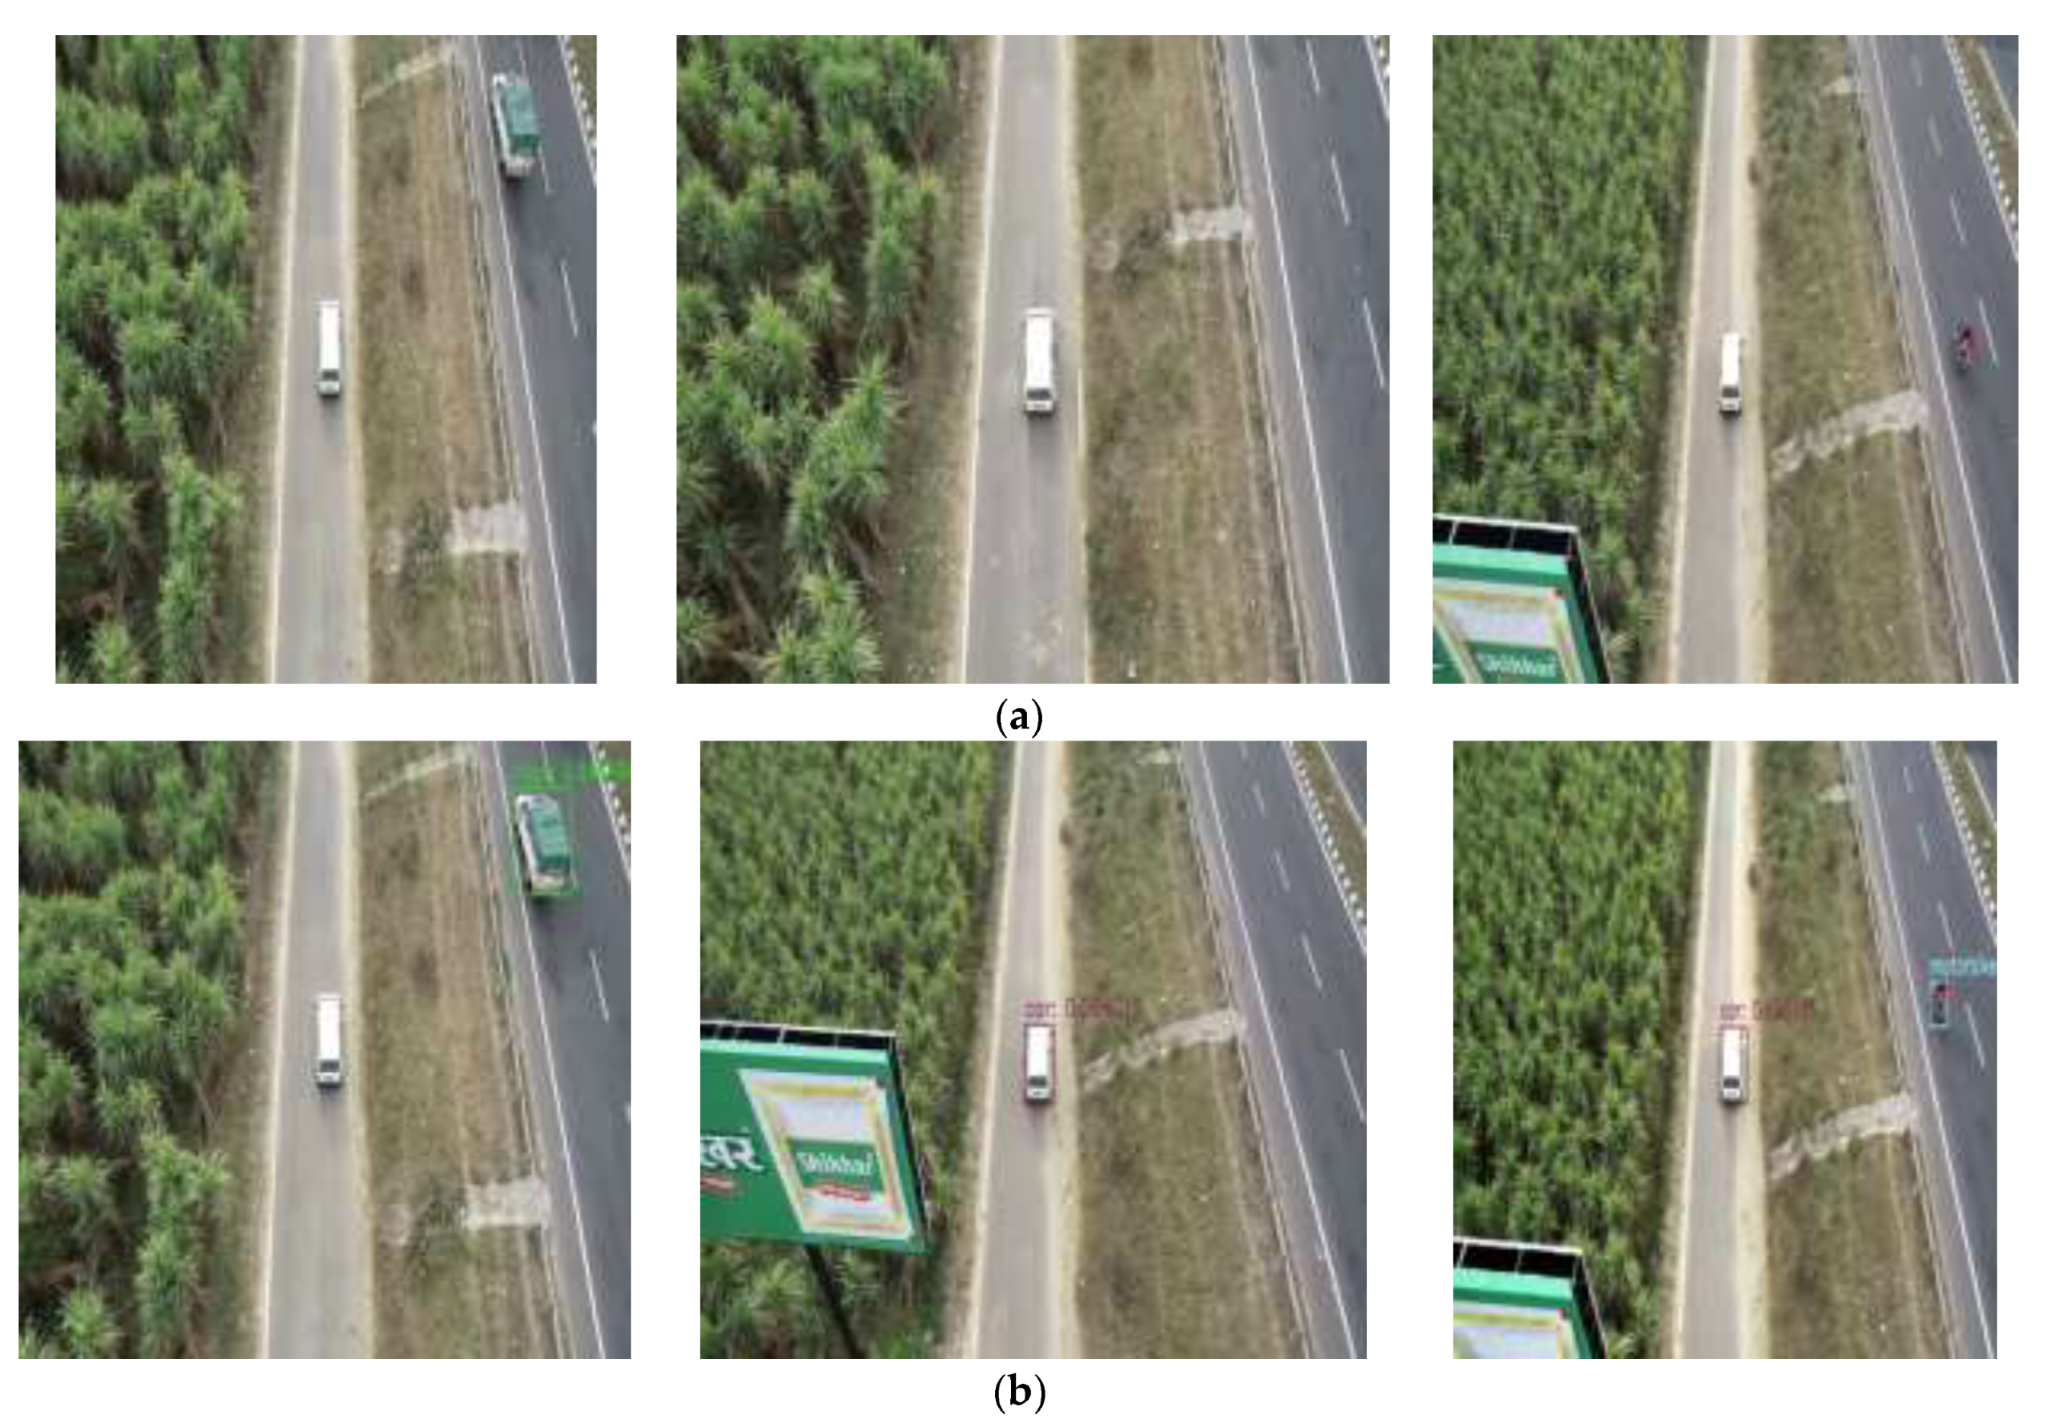
Figure 6.
Graphical demonstration of proposed OSBMO algorithm regarding (a) Global consistency error; (b) Rand index; and (c) Variation of Information.
Figure 6.
Graphical demonstration of proposed OSBMO algorithm regarding (a) Global consistency error; (b) Rand index; and (c) Variation of Information.
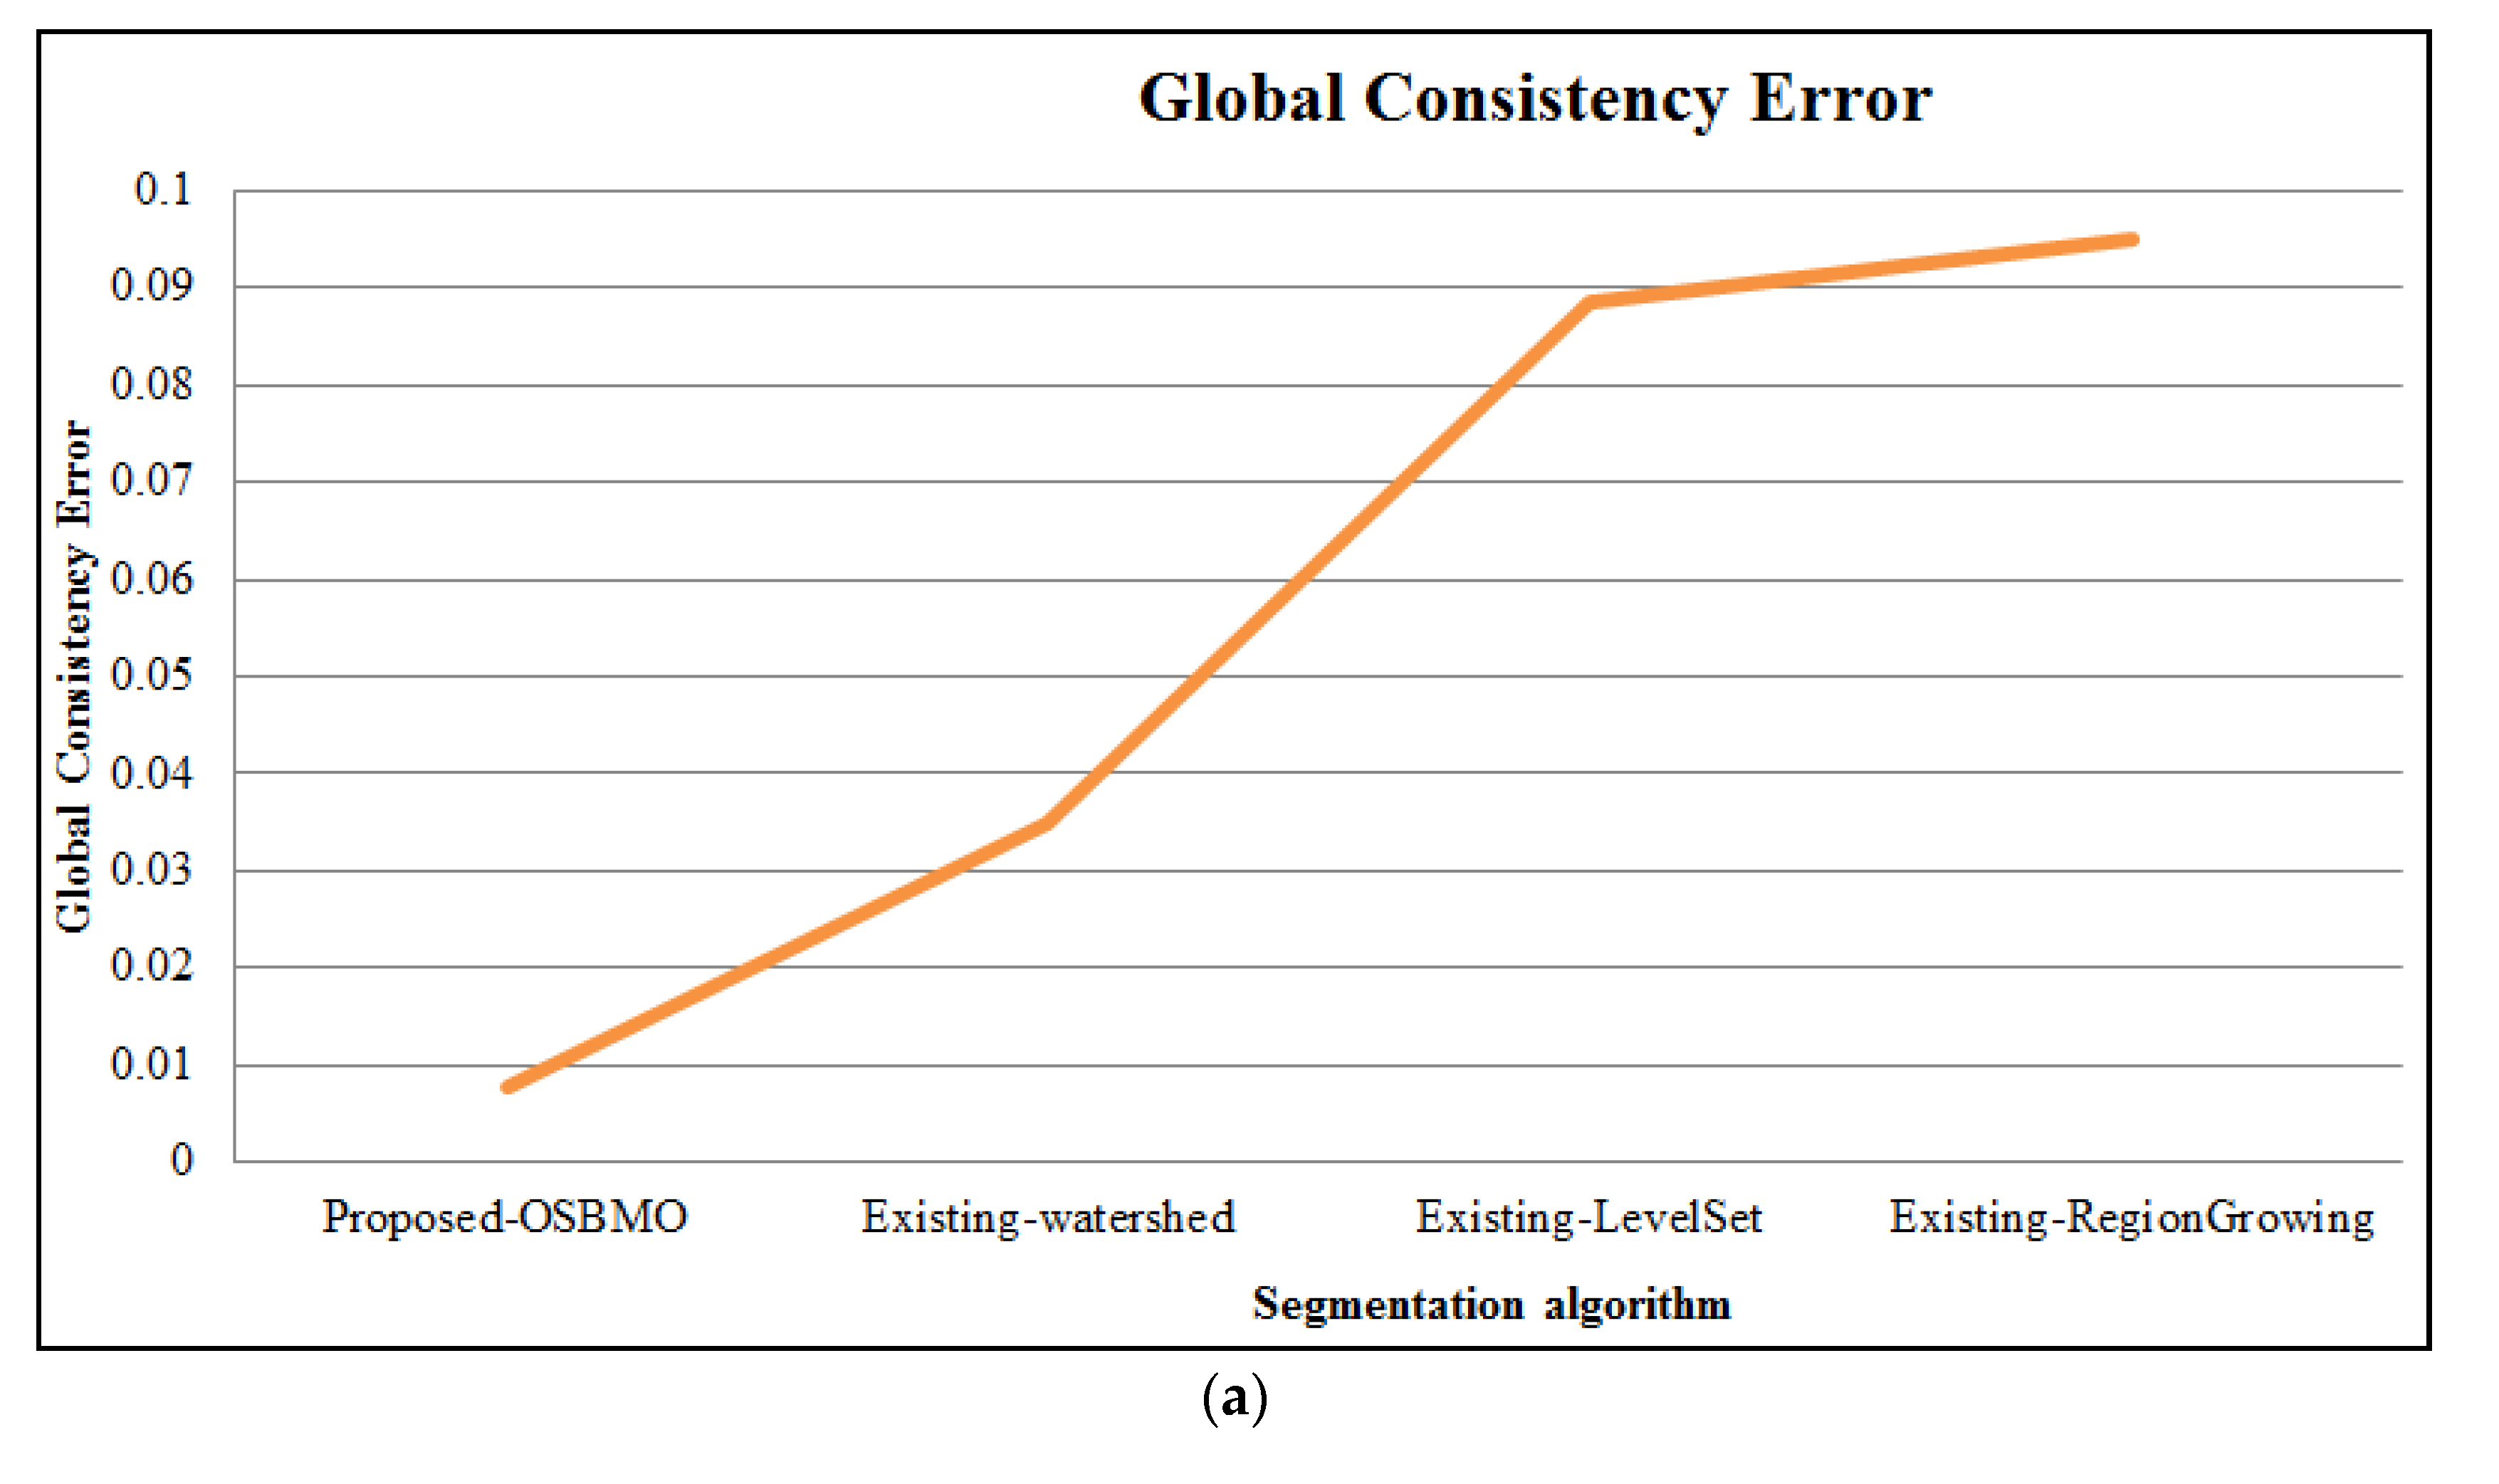
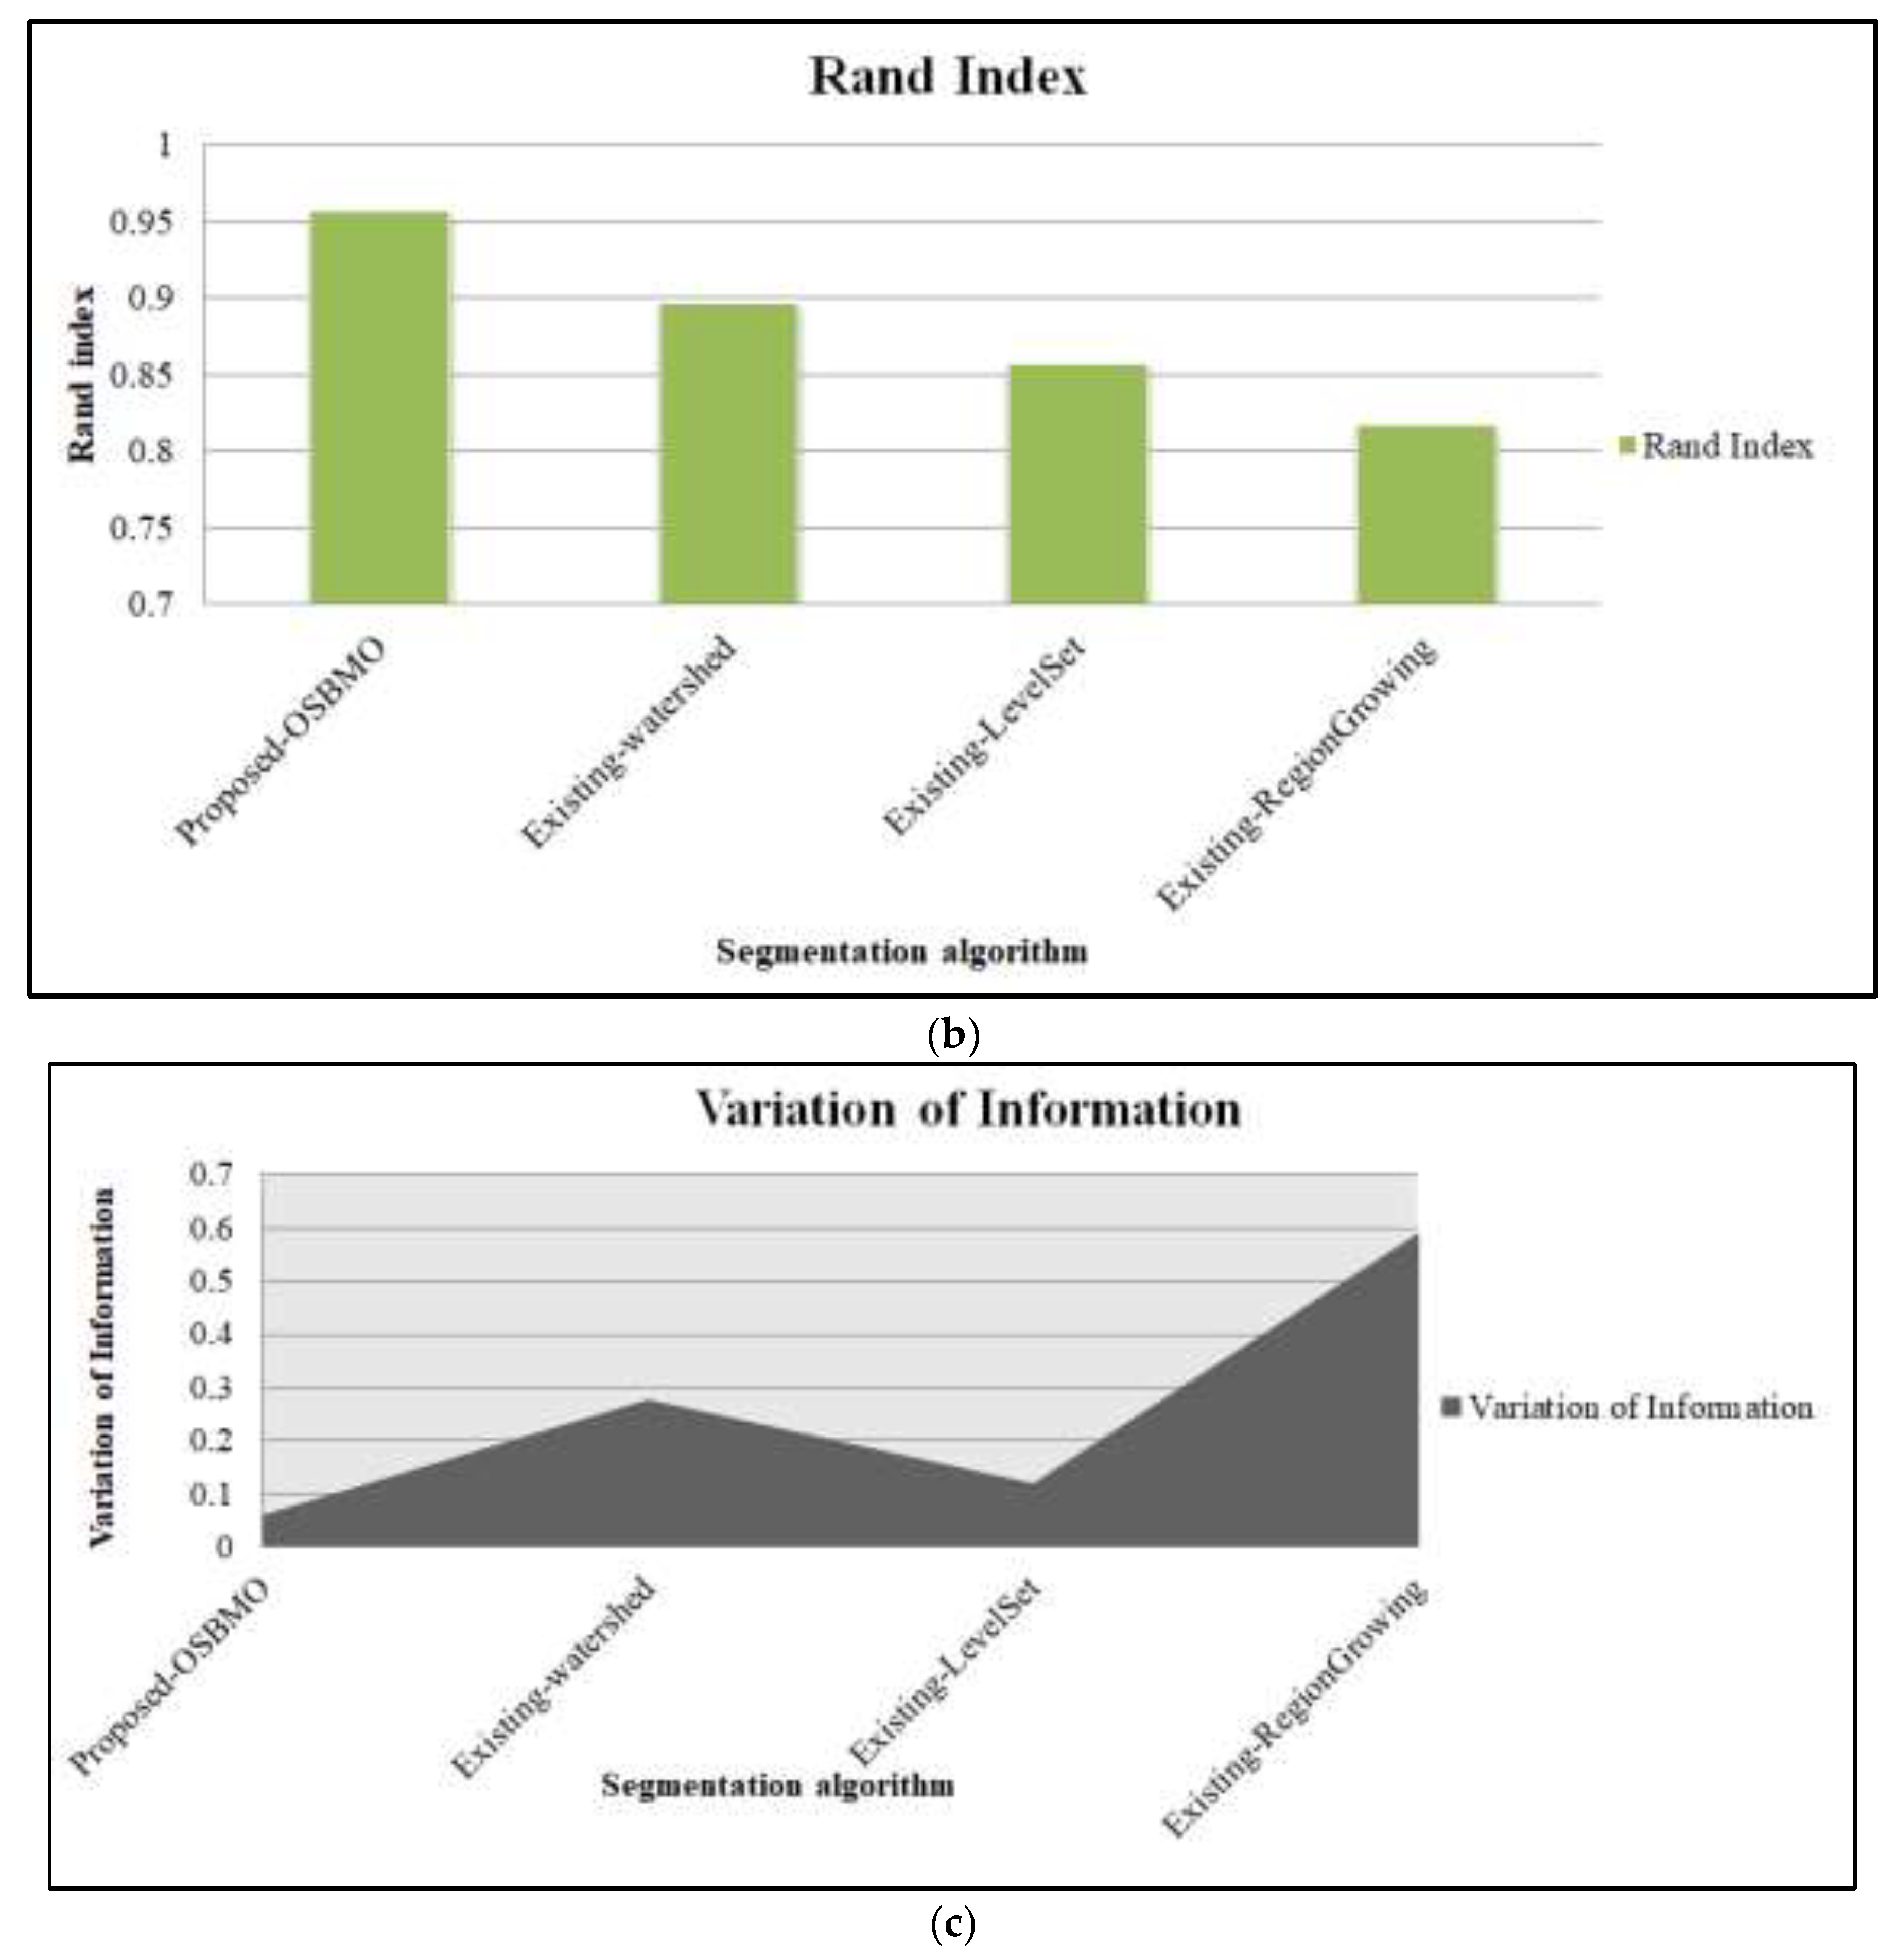
Figure 7.
Graphical demonstration of proposed DBSCAN regarding (a) error rate; (b) accuracy; and (c) mean square error.
Figure 7.
Graphical demonstration of proposed DBSCAN regarding (a) error rate; (b) accuracy; and (c) mean square error.
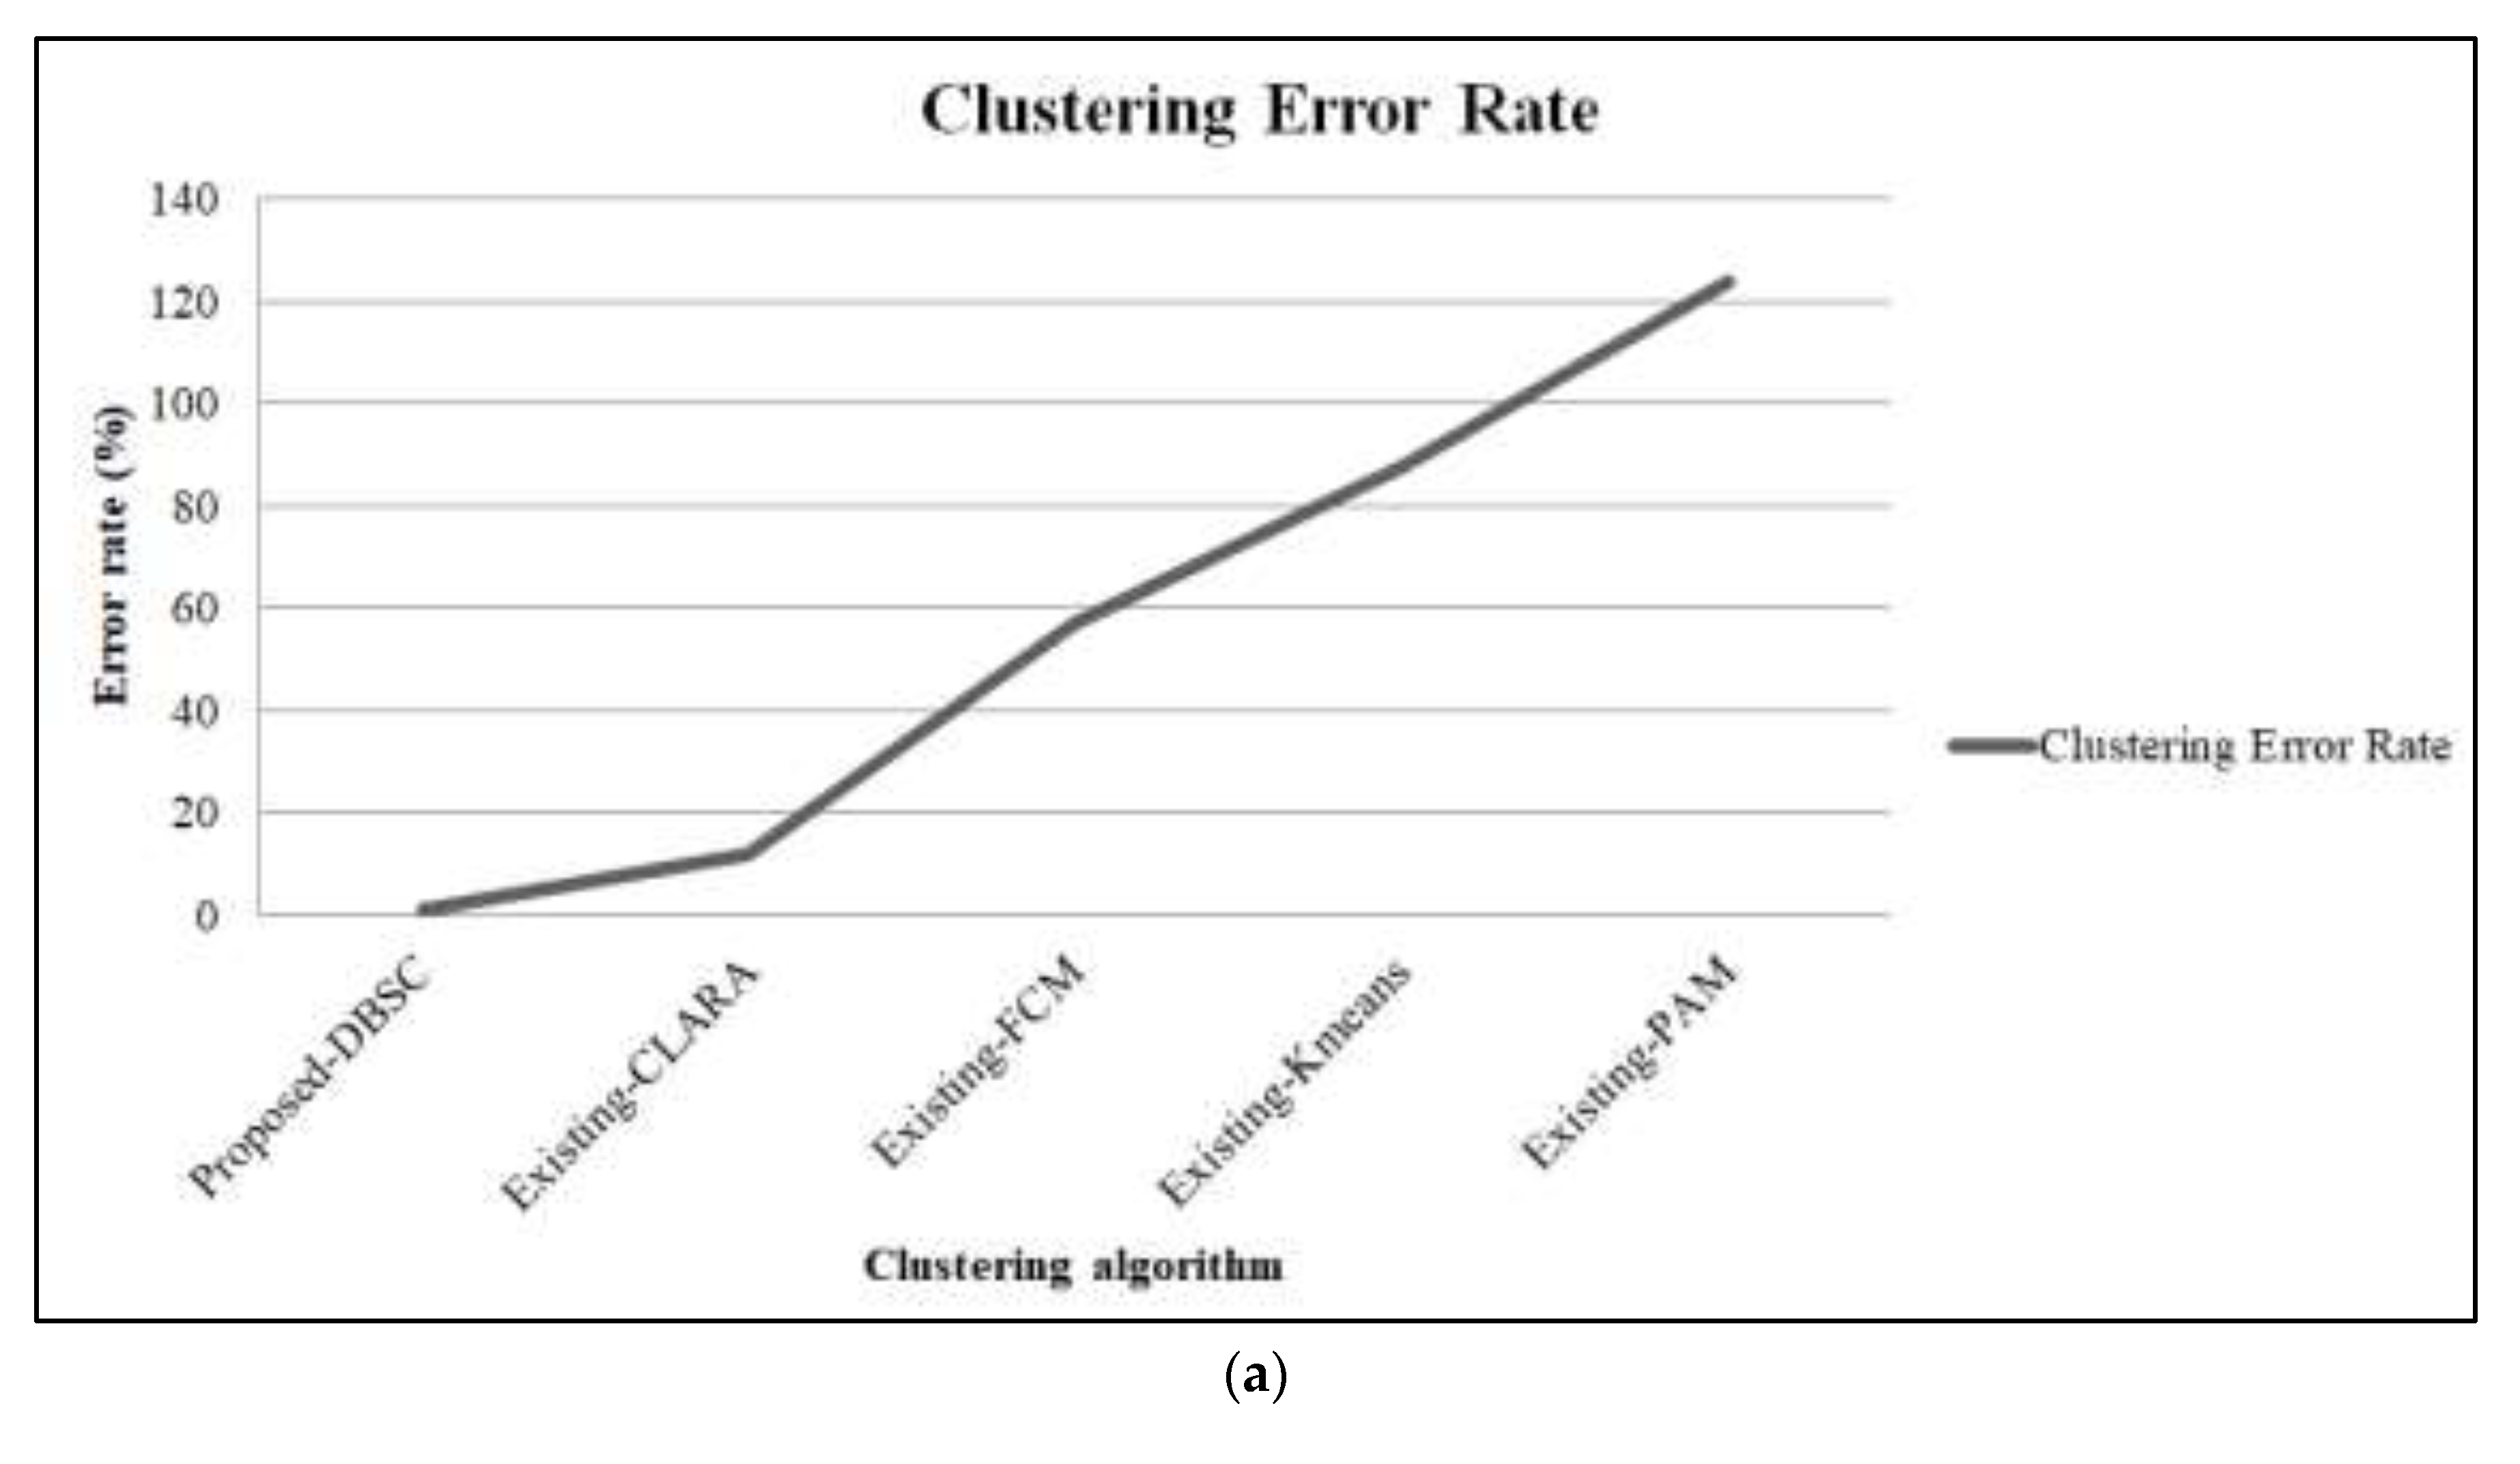

Figure 8.
Graphical demonstration of the proposed RL technique regarding the statistical analysis (a) Positive measure; (b) negative measure; and (c) computation time.
Figure 8.
Graphical demonstration of the proposed RL technique regarding the statistical analysis (a) Positive measure; (b) negative measure; and (c) computation time.

Table 1.
Features and challenges of the existing studies.
| Author [Citation] | Techniques | Features | Challenges |
|---|---|---|---|
| Avola et al. [13] | Faster R-CNN |
|
|
| Zhao et al. [17] | YOLOv3 |
|
|
| Valappil et al. [19] | CNN-SVM |
|
|
| Li et al. [20] | MN-DDPG |
|
|
| Espsoito et al. [21] | Faster R-CNN |
|
|
| Shao et al. [22] | Crowd motion estimation system |
|
|
Table 2.
Assessment of proposed OSBMO object-detection technique based on Global Consistency Error, Rand Index, and Variation of Information.
Table 2.
Assessment of proposed OSBMO object-detection technique based on Global Consistency Error, Rand Index, and Variation of Information.
| Method | Global Consistency Error | Rand Index | Variation of Information |
|---|---|---|---|
| Proposed: OSBMO | 0.00789 | 0.95678 | 0.05883 |
| Existing: Watershed | 0.03482 | 0.89675 | 0.27554 |
| Existing: LevelSet | 0.08834 | 0.85678 | 0.11784 |
| Existing: Region Growing | 0.09499 | 0.81739 | 0.58831 |
Table 3.
Performance analysis of Proposed DBSCAN based on clustering time for different frames.
| No. of Frames | Object 1 | Object 2 | Object 3 | Object 4 | Object 5 |
|---|---|---|---|---|---|
| 100 | 38,705 | 26,314 | 21,754 | 19,474 | 9994 |
| 200 | 43,705 | 47,247 | 35,475 | 35,147 | 15,225 |
| 300 | 55,754 | 58,331 | 47,475 | 47,247 | 20,435 |
| 400 | 64,648 | 66,341 | 57,741 | 52,201 | 36,634 |
| 500 | 79,447 | 79,224 | 77,485 | 79,024 | 47,291 |
Table 4.
Performance analysis of Proposed DBSCAN based on clustering time, accuracy, and MSE.
| Method | Clustering Error Rate | Accuracy | Mean Squared Error |
|---|---|---|---|
| Proposed DBSC | 0.82201 | 86.7866 | 0.58392 |
| Existing CLARA | 11.87632 | 80.4481 | 12.77381 |
| Existing FCM | 56.94459 | 80.9932 | 180.483 |
| Existing K-means clustering | 87.89034 | 79.1002 | 58.92581 |
| Existing PAM | 123.8477 | 79.6883 | 276.7011 |
Table 5.
Performance Analysis of Proposed RL Based on Classification metrics.
| Method | Accuracy | Precision | Recall | FPR | FNR | Computation Time |
|---|---|---|---|---|---|---|
| Proposed: RL | 96.8342 | 93.6754 | 92.6482 | 0.0646 | 0.03396 | 15,785 |
| Existing: YOLOv4 | 90.1843 | 89.7643 | 90.7653 | 0.0939 | 0.90403 | 67,823 |
| Existing: ResNet50 | 88.3834 | 88.2242 | 87.522 | 0.1736 | 0.78891 | 99,234 |
| Existing: VGG19 | 83.7456 | 83.3146 | 86.7103 | 0.4829 | 0.99905 | 55,746 |
| Existing: CNN | 80.9933 | 82.1318 | 80.2295 | 0.8943 | 0.89932 | 89,003 |
Publisher’s Note: MDPI stays neutral with regard to jurisdictional claims in published maps and institutional affiliations. |
© 2022 by the authors. Licensee MDPI, Basel, Switzerland. This article is an open access article distributed under the terms and conditions of the Creative Commons Attribution (CC BY) license (https://creativecommons.org/licenses/by/4.0/).
Share and Cite
MDPI and ACS Style
Singh, C.H.; Mishra, V.; Jain, K.; Shukla, A.K. FRCNN-Based Reinforcement Learning for Real-Time Vehicle Detection, Tracking and Geolocation from UAS. Drones 2022, 6, 406. https://doi.org/10.3390/drones6120406
AMA Style
Singh CH, Mishra V, Jain K, Shukla AK. FRCNN-Based Reinforcement Learning for Real-Time Vehicle Detection, Tracking and Geolocation from UAS. Drones. 2022; 6(12):406. https://doi.org/10.3390/drones6120406
Chicago/Turabian StyleSingh, Chandra Has, Vishal Mishra, Kamal Jain, and Anoop Kumar Shukla. 2022. "FRCNN-Based Reinforcement Learning for Real-Time Vehicle Detection, Tracking and Geolocation from UAS" Drones 6, no. 12: 406. https://doi.org/10.3390/drones6120406