Article

Effects of the Spatial Resolution of UAV Images on the Prediction and Transferability of Nitrogen Content Model for Winter Wheat

1
Institution of Agricultural Economy and Information, Henan Academy of Agricultural Sciences, Zhengzhou 450002, China
2
Key Laboratory of Huang-Huai-Hai Smart Agricultural Technology, Ministry of Agriculture and Rural Affairs, Zhengzhou 450002, China
3
Henan Engineering Laboratory of Crop Planting Monitoring and Warning, Zhengzhou 450002, China
4
Department of Soil Science, University of Wisconsin-Madison, Madison, WI 53706, USA
5
Agronomy College of Henan Agriculture, University/State Key Laboratory of Wheat and Maize Crop Science, Zhengzhou 450046, China
*
Authors to whom correspondence should be addressed.
These authors contributed equally to this work.
Drones 2022, 6(10), 299; https://doi.org/10.3390/drones6100299
Submission received: 14 September 2022 / Revised: 10 October 2022 / Accepted: 10 October 2022 / Published: 13 October 2022

Abstract

:
UAV imaging provides an efficient and non-destructive tool for characterizing farm information, but the quality of the UAV model is often affected by the image’s spatial resolution. In this paper, the predictability of models established using UAV multispectral images with different spatial resolutions for nitrogen content of winter wheat was evaluated during the critical growth stages of winter wheat over the period 2021–2022. Feature selection based on UAV image reflectance, vegetation indices, and texture was conducted using the competitive adaptive reweighted sampling, and the random forest machine learning method was used to construct the prediction model with the optimized features. Results showed that model performance increased with decreasing image spatial resolution with a R2, a RMSE, a MAE and a RPD of 0.84, 4.57 g m−2, 2.50 g m−2 and 2.34 (0.01 m spatial resolution image), 0.86, 4.15 g m−2, 2.82 g m−2 and 2.65 (0.02 m), and 0.92, 3.17 g m−2, 2.45 g m−2 and 2.86 (0.05 m), respectively. Further, the transferability of models differed when applied to images with coarser (upscaling) or finer (downscaling) resolutions. For upscaling, the model established with the 0.01 m images had a R2 of 0.84 and 0.89 when applied to images with 0.02 m and 0.05 m resolutions, respectively. For downscaling, the model established with the 0.05 m image features had a R2 of 0.86 and 0.83 when applied to images of 0.01 m and 0.02 m resolutions. Though the image spatial resolution affects image texture features more than the spectral features and the effects of image spatial resolution on model performance and transferability decrease with increasing plant wetness under irrigation treatment, it can be concluded that all the UAV images acquired in this study with different resolutions could achieve good predictions and transferability of the nitrogen content of winter wheat plants.

1. Introduction

Nitrogen regulates the growth of wheat at different growth stages and has a significant impact on wheat yield and quality [1,2] and thus, timely and accurate monitoring of nitrogen is important to guide variable fertilization [3,4]. When wheat plants are nitrogen deficient, both external morphology and internal metabolism differ from normal plants, and therefore the nitrogen nutrition status can be monitored and diagnosed by easily accessible phenological information [5,6,7,8,9].
Previous studies have shown that remote sensing platforms from satellites, UAVs, and near-ground can be used for rapid and non-destructive acquisition of information on crop physiological and biochemical parameters, which in turn enables monitoring of plant nutrients such as nitrogen content [9,10,11,12,13]. Among all the platforms, UAV remote sensing has the advantages of convenience, adaptability, and suitability for precise observation of crop phenology at the field scale, and has become an important technical means in precision agriculture management [8,14,15,16]. It has been shown in various studies that ratio indices and/or normalized difference indices perform very well in estimating nitrogen content. For example, the Excessive Green Index (EXG), the modified chlorophyll absorption in reflectance index (MCARI), the Normalized Difference Vegetation Index (NDVI), the Normalized Green–Red Difference Index (NGRDI), the Soil Adjusted Vegetation Index (SAVI), the Transformed Chlorophyll Absorption Ratio Index (TCARI), The Rededge Soil Adjusted Vegetation Index (RESAVI), the Renormalized Difference Vegetation Index for Rededge (RERDVI), and the Ratio Vegetation Index (RVI) have been proposed for estimating canopy nitrogen content and indicated good estimation accuracy [2,17,18,19,20].
However, the spatial resolution of UAV images is directly correlated with the estimation accuracy and negatively related to flight height. As a standard practice, the UAV flight height used in the monitoring of nitrogen content of maize, soybean, and cotton plants varies from 30 to 100 m. This leads to different spatial resolutions of the images collected by the UAV sensors. Previous studies mostly used single-resolution image feature data for monitoring crop canopy. For example, Liu et al. [19] and Wang et al. [21] collected UAV-borne multispectral and hyperspectral images with resolutions of 0.05 m and 0.3 m and established nitrogen index prediction models for winter wheat with a validation R2 up to 0.96. Li et al. [22] acquired canopy spectral data at flight heights of 8, 10, 12, 14, 16, and 55 m for winter wheat, and found that 16 m was the optimal UAV imaging height for monitoring winter wheat nitrogen status at the jointing stage. Though successful, these studies ignored the rich information stored in the ultra-high-resolution UAV images acquired at a low flight height, which contains not only spectral but also texture information related to canopy structure and physiochemical properties [23,24]. Previous literature has demonstrated that combining spectral and texture information, physiological and biochemical parameters such as leaf area index, crop nitrogen content, and biomass can be better quantified [19,20,23,24,25,26,27]. For example, Jia and Chen [23] established a model using principal component regression analysis for predicting the nitrogen content of winter wheat using UAV image features at a spectral resolution of 0.06 m; the accuracy of the model established via fusing the spectral and texture features (R2 = 0.68) of UAV multispectral images was improved by more than 10% compared with that established by a single vegetation index (R2 = 0.66) or texture feature (R2 = 0.65); Fu et al. [26] examined the ability of multiple image features derived from UAV RGB images for winter wheat nitrogen estimation across multiple critical growth stages. The results indicated that compared with the RGB-based vegetation indices (VIs) and texture features, the partial least square regression (PLSR) model based on the combination of grayscale co-occurrence matrix (GLCM)-based textures, VIs, and color parameters yielded the highest estimation accuracy of plant nitrogen content, with a R2 of 0.67, a RMSE of 0.39%, and a RPD of 1.58; the PLSR models based on VIs and texture features had a R2 of 0.14~0.39 and 0.19~0.64, respectively; Zheng et al. [27] evaluated the potential of integrating texture and spectral information from UAV-based multispectral imagery for improving the quantification of nitrogen status in rice crops, indicating model VIs with a R2 of 0.14, texture features with a R2 of 0.41 and the combination of VIs and texture features with a R2 of 0.68. The results revealed the potential of image textures derived from UAV images for winter wheat nitrogen status estimation; furthermore, such image texture features obtained from the ultra-high-resolution UAV platforms are often scale-dependent and may lead to different performance and transferability of models established at one resolution while applied to another resolution.
In recent years, with the advancement of data mining techniques, such as support vector machines (SVR), neural networks, genetic algorithms (GA), random forest (RF), and other methods have been increasingly applied to the prediction of crop nitrogen content, which outperform traditional models in terms of accuracy [13,28,29,30]. For example, Chlingaryan et al. [28] compared the analysis of traditional statistical analysis methods and machine learning methods in crop nitrogen content and yield prediction and found that machine learning methods such as RF and decision tree (DT) have achieved a higher accuracy. In addition, different machine learning methods differ in prediction accuracy [31,32,33]. For example, Qiu et al. [32] used Adaboost, artificial neural network (ANN), K-neighborhood (KNN), PLSR, RF and SVR machine learning regression methods for the prediction of rice nitrogen nutrient index, and found the RF and Adaboost methods achieved the highest model accuracy, with a R2 of the RF model of 0.98 during the filling stage. Although machine learning methods are proven to be superior to traditional statistical analysis methods, few studies investigated the transferability of the models when applied to UAV images with different spatial resolutions.
In this study, we aimed at investigating the effects of the spatial resolutions (i.e., 0.01, 0.02, and 0.05 m) of the ultra-high-spatial-resolution UAV images on modeling nitrogen content in winter wheat. We firstly combined feature selection and machine learning to construct the nitrogen content prediction models and then compared the model performance achieved using images with different spatial resolutions. To evaluate the effect of image resolution on model transferability, we studied how model performance will change when applied to upscaled and downscaled UAV images. The case study can be used by the research community to select the optimal flight height and image resolution for efficient and accurate monitoring of nitrogen in plants.

2. Materials and Methods

2.1. Study Site and Experiment Design

The study site is located in the 14th branch of the state farm in Shangshui County, Zhoukou City, Henan Province (33° 32′ 2.9″ N, 114° 29′ 1.0′′ E), China (Figure 1). The soil type is sandy ginger black soil (Chinese soil classification system). Five nitrogen levels were set in the plots: N0 (0 kg hm−2), N6 (60 kg hm−2), N12 (120 kg hm−2), N18 (180 kg hm−2), and N24 (240 kg hm−2), of which 50% was applied as a base fertilizer and the remaining 50% was applied at the jointing stage. All treatments had 150 and 90 kg hm−2 of phosphorus and potassium fertilizer, all of which were applied as base fertilizers. Two levels of soil moisture management were used: W0 (rainfed) and W1 (irrigated). The area of each experiment plot is approximately 42 m2, with the spatial distribution of the plot shown in Figure 1.

2.2. Data Collection and Pre-Processing

2.2.1. UAV Remote Sensing Image Data Acquisition and Pre-Processing

During the two winter wheat growth cycles from 2021 to 2022, the DJI M600 UAV mounted with a K6 multispectral sensor (Anzhou Technology, Beijing, Co., Ltd., Beijing, China) was used to acquire canopy images of key growth stages (jointing, booting, and filling) under clear weather conditions from 10:00 to 14:00. The K6 multispectral sensor includes five bands: blue (B), green (G), red (R), Rededge, and near-infrared (Nir) bands with central wavelengths of 450, 550, 668, 685, and 780 nm, respectively and each camera module is a stand-alone Linux computer with a sensor and memory [33]. To reduce the influence of solar angle and other factors on the canopy spectral reflectance, the radiometric calibration and reflectance conversion of UAV images are often performed by laying radiometric calibration clothes (plates) on the ground. The lower the reflectance, the darker the plate. In general, when placing the radiation calibration clothes (plates) for hovering shooting, the hovering height is 7-fold the distance of the width of the plate. There is no standard rule between the number of radiation calibration cloths (plates) and the number of wave bands [34]. In this study, the radiometric calibration plates with standard reflectivity of 5%, 20%, 40%, and 70% were laid on the ground for image reflectance correction before the flight. Real-time kinematics was used to determine the precise position of the test area during the flight, and a heading and lateral overlap rate was set to 70% and 75%, respectively.
The canopy reflectance data of winter wheat were extracted by format conversion, image mosaicing, geographic information correction, and radiometric calibration. The basic characteristics of the images are shown in Table 1. For the same data acquisition area, the flight time was significantly reduced with the decrease in image spatial resolution (an increase in flight height), as well as the number of photos and the image post-processing time.

2.2.2. Collection of Winter Wheat Plant Samples and Determination of Nitrogen Content

Ground data collection was carried out simultaneously with the acquisition of UAV images. In each plot, an area of 2 rows (0.2 m) × 1 m with uniform growth was selected, and 20 samples of above-ground plants were placed in sealed bags. 90 samples were obtained each year, with a total of 180 samples obtained in 2 years. The samples were killed at 105 °C and dried at 80 °C to a constant mass. After pulverization, the nitrogen content was determined using the Kjeldahl method [35].

2.3. Vegetation Indices Selection

Various VIs have been widely used for qualitative and quantitative evaluation of vegetation cover and crop growth dynamics [36,37,38]. Based on the relevant literature [2,17,18,19,20,21,22,23,24,25,39,40,41,42,43,44,45,46], nine commonly used nitrogen content prediction vegetation indices were selected in this study with the formula shown in Table 2.

2.4. Image Texture Features Extraction

Texture features are extracted from five bands of the multispectral images by using the grayscale co-occurrence matrix. The grayscale co-occurrence matrix (GLCM) method is currently recognized as an image recognition technique with strong robustness and adaptation characteristics, which can effectively improve the classification and retrieval of images and maximize the accuracy of remote sensing image classification [47,48], during the texture feature extraction processing, a fixed area of each plot was selected (Figure 1), and the average value of UAV image extraction was used as the feature values of winter wheat samples in each plot. The extracted texture features mainly include mean, contrast (con), second moment (sm), variance (var), correlation (cor), difference (dis), homogeneity (hom) and entropy (ent). mean indicates the degree of regularity of the texture, and the more regular, the larger the value. con responds to the total amount of local gray changes in the image, and the larger the change, the larger the value. sm is also called energy, which describes the image gray distribution; the more uniform the distribution of grayscale in the local area, the larger the value. cor is the similarity between the image row or column elements, and responds to the extension length of a certain grayscale value along a certain direction; the longer the extension, the larger the cor value. var responds to the deviation of the image element value from the mean value; the larger the image grayscale change, the larger the value. dis is similar to con, but increases linearly, and the higher the local contrast, the larger the value. hom, also known as the “inverse difference moment”, is a measure of the local grayscale uniformity of an image, and the more uniform the grayscale, the larger the value. ent is a measure of the amount of information the image has, and the more complex the texture, the larger the value. The specific calculation formula is as follows [41].
mean = i = 0 k j = 0 k p ( i , j ) × i
con = i = 0 k j = 0 k p ( i , j ) × ( i j ) 2
sm = i = 0 k j = 0 k p ( i , j ) 2
var = i = 0 k j = 0 k p ( i , j ) × ( i mean ) 2
cor = i = 0 k j = 0 k ( i mean ) × ( j mean ) × p ( i , j ) 2 var
dis = i = 0 k j = 0 k p ( i , j ) × i j
hom = i = 0 k j = 0 k p ( i , j ) × 1 1 + ( i j ) 2
ent = i = 0 k j = 0 k p ( i , j ) × ln p ( i , j )
where i and j are the row and column number of images, respectively; p(i, j) is the relative frequency of two neighboring pixels.

2.5. Feature Selection and Machine Learning Modeling

2.5.1. Competitive Adaptive Reweighted Sampling Method

The competitive adaptive reweighted sampling (CARS) was used for feature selection during the plant nitrogen content model construction. The CARS is a feature selection method that combines Monte Carlo sampling with regression coefficients from a partial least squares model and is widely used for sensitive feature selection of multiple independent variable models [49,50]. In the CARS algorithm, each feature selection is performed by adaptive reweighted sampling to retain the points with larger weights of the absolute values of regression coefficients in the partial least squares model as a new subset and to remove the points with smaller weights. Then, a partial least squares model is built based on the new subset, and after several calculations, the variables in the subset with the smallest root mean square error of cross-validation (RMSECV) of the partial least squares model are selected as the preferred features.

2.5.2. Random Forest

The random forest (RF) machine learning method was used to construct the plant nitrogen prediction model RF has advantages in crop yield model construction and prediction of physical and chemical parameters [39,51,52,53,54]. The specific algorithm steps are as follows.
(i)
Draw the training dataset from the original sample dataset. Each round draws n training samples (with put-back sampling) from the original sample dataset using the Bootstrap method. A total of k rounds of extraction are performed to obtain k training datasets.
(ii)
One model is obtained using one training dataset at a time, and a total of k models are obtained for k training sets.
(iii)
For the classification problem: the k models obtained in the previous step are used to obtain the classification results by voting, and the mean value of the above models is calculated as the final result.

2.5.3. Model Performance Evaluation

The model evaluation is conducted using a number of metrics including the coefficient of determination (R2), the root mean square error (RMSE), the mean absolute error (MAE), and the relative predictive error (RPD) between the field measured and model predicted plant nitrogen content. The larger the R2 and the PRD, the smaller the RMSE and the MAE, and the better the model prediction and transferability. When the predicted value matches exactly with the measured value, MAE = 0, i.e., perfect model. When the RPD ≥ 2, it indicates that the model has an excellent predictive ability, when 1.4 ≤ RPD < 2, it indicates that the model can make a rough estimation of the sample, while the RPD < 1.4, it indicates that the model cannot be to predict the sample [26,55].
R 2 = i = 1 n ( y ^ i y ¯ ) 2 i = 1 n ( y i y ¯ ) 2
RMSE = 1 n i = 1 n ( y ^ i y i ) 2
MAE = 1 n i = 1 n y ^ i y i
RPD = i = 1 n ( y i y ¯ ) 2 i = 1 n ( y i y ^ i ) 2
where yi and ŷi are measured and predicted values of the nitrogen content of the ith sample, respectively, and y ¯ indicates the mean value of the measured nitrogen content, and n is the number of samples. In this study, the models established with UAV image features with different spatial resolutions were compared.

2.5.4. Evaluation of the Effect of Image Resolution on Model Transferability

The generalization ability of models has been one of the key research directions in the field of machine learning, and transferability is an effective means to evaluate the generalization of machine learning models [56]. In this study, an RF regression model of plant nitrogen content was developed with different training datasets, and the model was directly “transferred” to another dataset for model evaluation. 0.01, 0.02, and 0.05 m UAV image feature data were recorded as datasets A, B, and C, respectively, and the model transferring prediction can be described in Figure 2.

3. Results and Analysis

3.1. Correlation Analysis between Spectral Features of Different Resolution Images and Nitrogen Content in Winter Wheat Plants

The results of the correlation analysis between spectral features of different image spatial resolutions and nitrogen content in winter wheat plants are shown in Table 3. Among the five bands, the correlation between canopy reflectance and plant nitrogen content in the Nir band was the highest, with a correlation coefficient (r) of 0.95 at a spatial resolution of 0.01 m. This indicates that plant nitrogen content is closely related to canopy reflectance, and the order of response to plant nitrogen content is Nir > Red > Blue > Green > Rededge. For canopy reflectance, the r value between canopy reflectance and plant nitrogen content decreased as the spatial resolution of the images decreased (coarser).
The correlations between the nine vegetation indices constructed based on canopy reflectance and plant nitrogen content showed different trends as the spatial resolution of the images decreased. r values between the NDVI, the RDVI, the RERDVI, the GBNDVI, the CARI, the OSAVI and plant nitrogen content decreased first and then increased with the decrease of UAV image spatial resolution, and r values were largest at a spatial resolution of 0.05 m with the values of 0.82, 0.87, 0.82, 0.83, 0.65 and 0.85, respectively; while the RVI and the EXG showed an increasing correlation with plant nitrogen content as the spatial resolution decreased. The r values of nine vegetation indices and plant nitrogen content all reached a significance at the level of 0.05, and r values of the NDVI, the RDVI, the RERDVI, the GBNDVI, the RVI, the OSAVI, the EXG, and plant nitrogen content reached an extreme significance at the level 0.01; the r values of the NGBDI and plant nitrogen content were the smallest with r values were less than 0.5 and the correlation also decreased rapidly with the decrease of spatial resolution. In addition, different vegetation indices also responded to nitrogen content in different directions, the EXG was negatively correlated with plant nitrogen content, and the NDVI, the RDVI, the RERDVI, the GBNDVI, the CARI, the RVI, and the OSAVI were positively correlated with plant nitrogen content. In summary, this difference in the strength of the response of different spectral features to plant nitrogen content provided data to support the construction of the plant nitrogen content prediction model and the transferring prediction ability of the model.

3.2. Correlation Analysis between Texture Features of Different Resolution Images and Nitrogen Content in Winter Wheat Plants

The results of the correlation analysis between texture features of different image spatial resolutions and plant nitrogen content in winter wheat are shown in Table 4. With the increase of image spatial resolution, the response of texture features to resolution varied in different bands. At a resolution of 0.01 m, the absolute r values between mean, con, sm, dis, hom, ent, and plant nitrogen content were larger for the bands of B, R, and Nir, with the largest r values of 0.87 in the Nir band. The r values for var and dis were smaller. With the increase of image spatial resolution, r values between mean and plant nitrogen content in Nir band changed little, which indicated that this type of texture of the image had strong texture regularity and was relatively less affected by the image resolution. However, r values for con, var, and dis changed more drastically and decreased from 0.71~0.73 to –0.16~–0.13 with decreasing image resolutions.
In terms of the magnitude of change in the correlation coefficient, the r values between B, G, and R bands and plant nitrogen content varied little when changing the image resolutions, among which con and sm in the B band were the most stable. While the r values between Rededge and plant nitrogen content were relatively small, the values for con, var, cor, dis, and hom varied greatly as the spatial resolution of the image increased, and when the resolution was 0.05 m, the magnitudes of change were 0.64, 0.78, 0.76 and −0.55, respectively. In summary, except for var and dis of G-band, and cor of Rededge-band, the r values between texture features and nitrogen content all passed the significance test at the level of 0.05. Compared to spectral features (Table 3), the texture features (especially for Nir and Rededge bands) were more sensitive to image resolutions when modeling the plant nitrogen content.

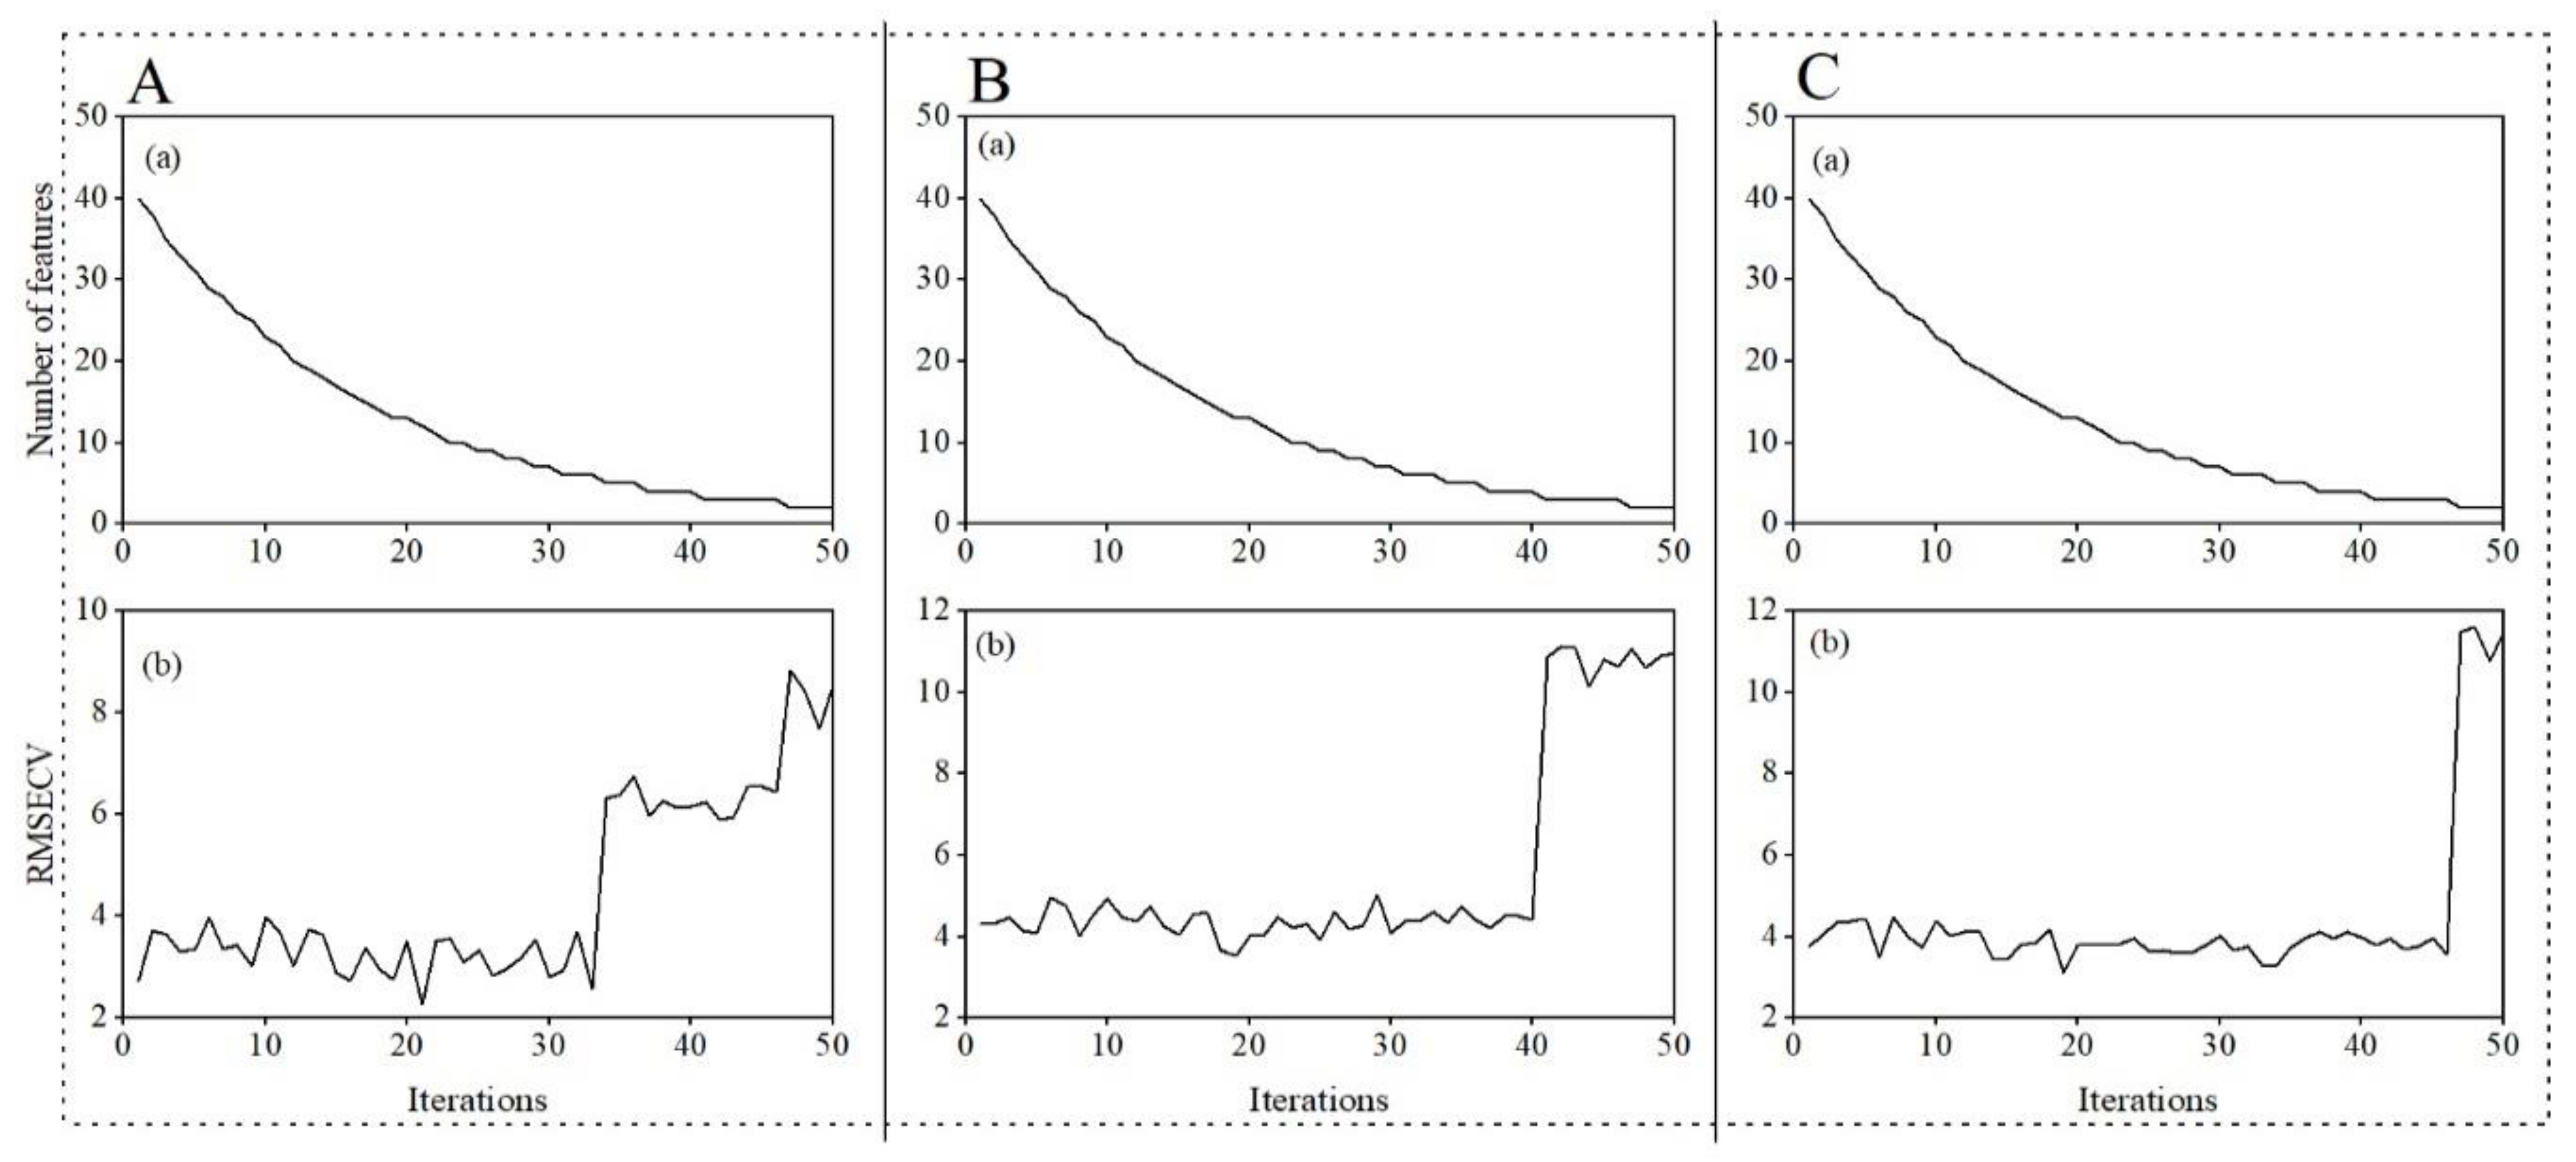
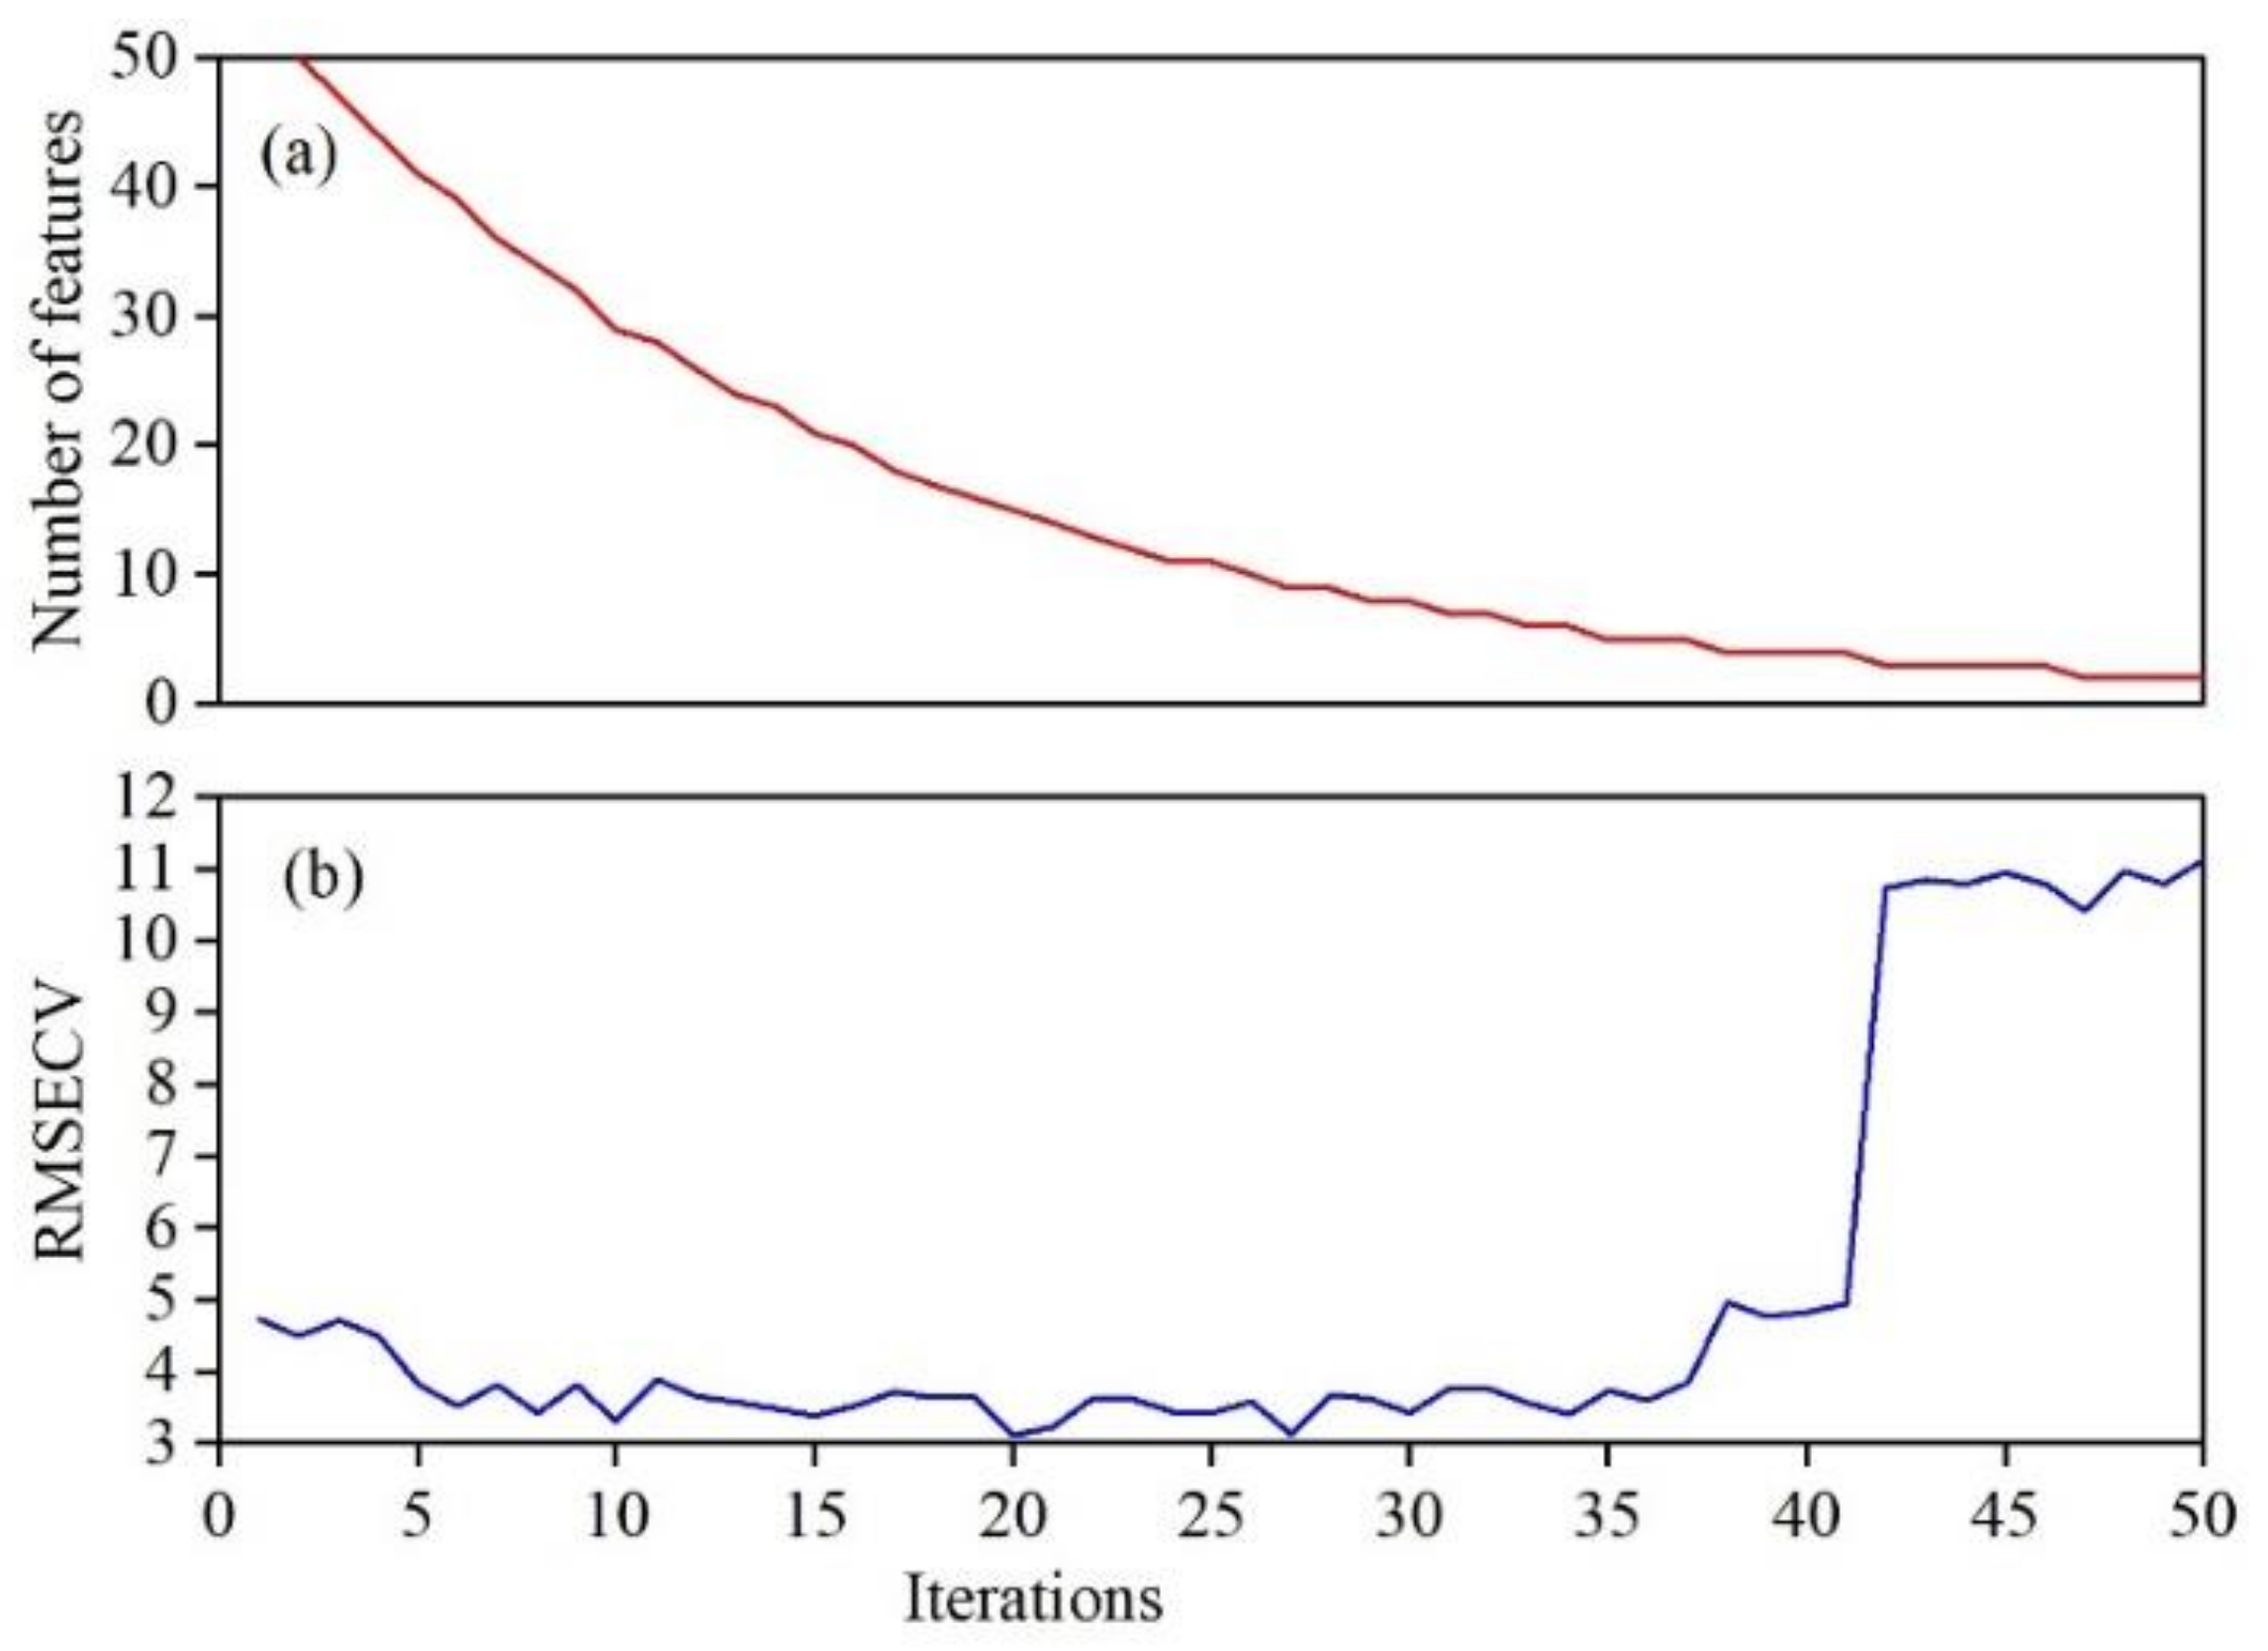
3.3. Sensitive Feature Optimization for Plant Nitrogen Content Prediction Models

With a total of 13 spectral features (Table 3) and 40 texture features (Table 4) of three-resolution datasets as inputs, the CARS method was used to optimize the sensitive features to plant nitrogen content in winter wheat (feature selection results for the different resolutions shown in the Supplementary Materials). The optimal results were reached at 50 iterations of Monte Carlo method sampling and are shown in Figure 3. It can be seen from Figure 3a that the number of selected plant nitrogen content sensitive features decreased with the increase of the number of iterations, first fast and then slowly. In Figure 3b, the RMSECV values decreased first and then increased as the number of iterations increased, i.e., the number of selected sensitive features for plant nitrogen content gradually decreased and the RMSECV value also decreased, indicating that the variables with little correlation with plant nitrogen content were eliminated in CARS preferential selection, and then the RMSECV value increased, caused by the elimination of variables related to plant nitrogen content. Seeing from the extraction results, the minimum RMSECV value was 3.13 at the 19th iteration, and a total of 16 sensitive features were finally selected, including R, Rededge, Nir band reflectance, the RDVI, the RERDVI, the GBNDVI, the OSAVI, con_B, sm_B, var_Nir, mean_R, mean_Nir, dis_B, dis_G, dis_Nir, and hom_B.
To further demonstrate and analyze the predictability and transferability of the models, we provided the feature selection results for the different resolution datasets, the results can be seen in Appendix A. The result showed that the data of the single resolution showed consistent results across the three resolutions when the CARS method was used for sensitive feature screening.

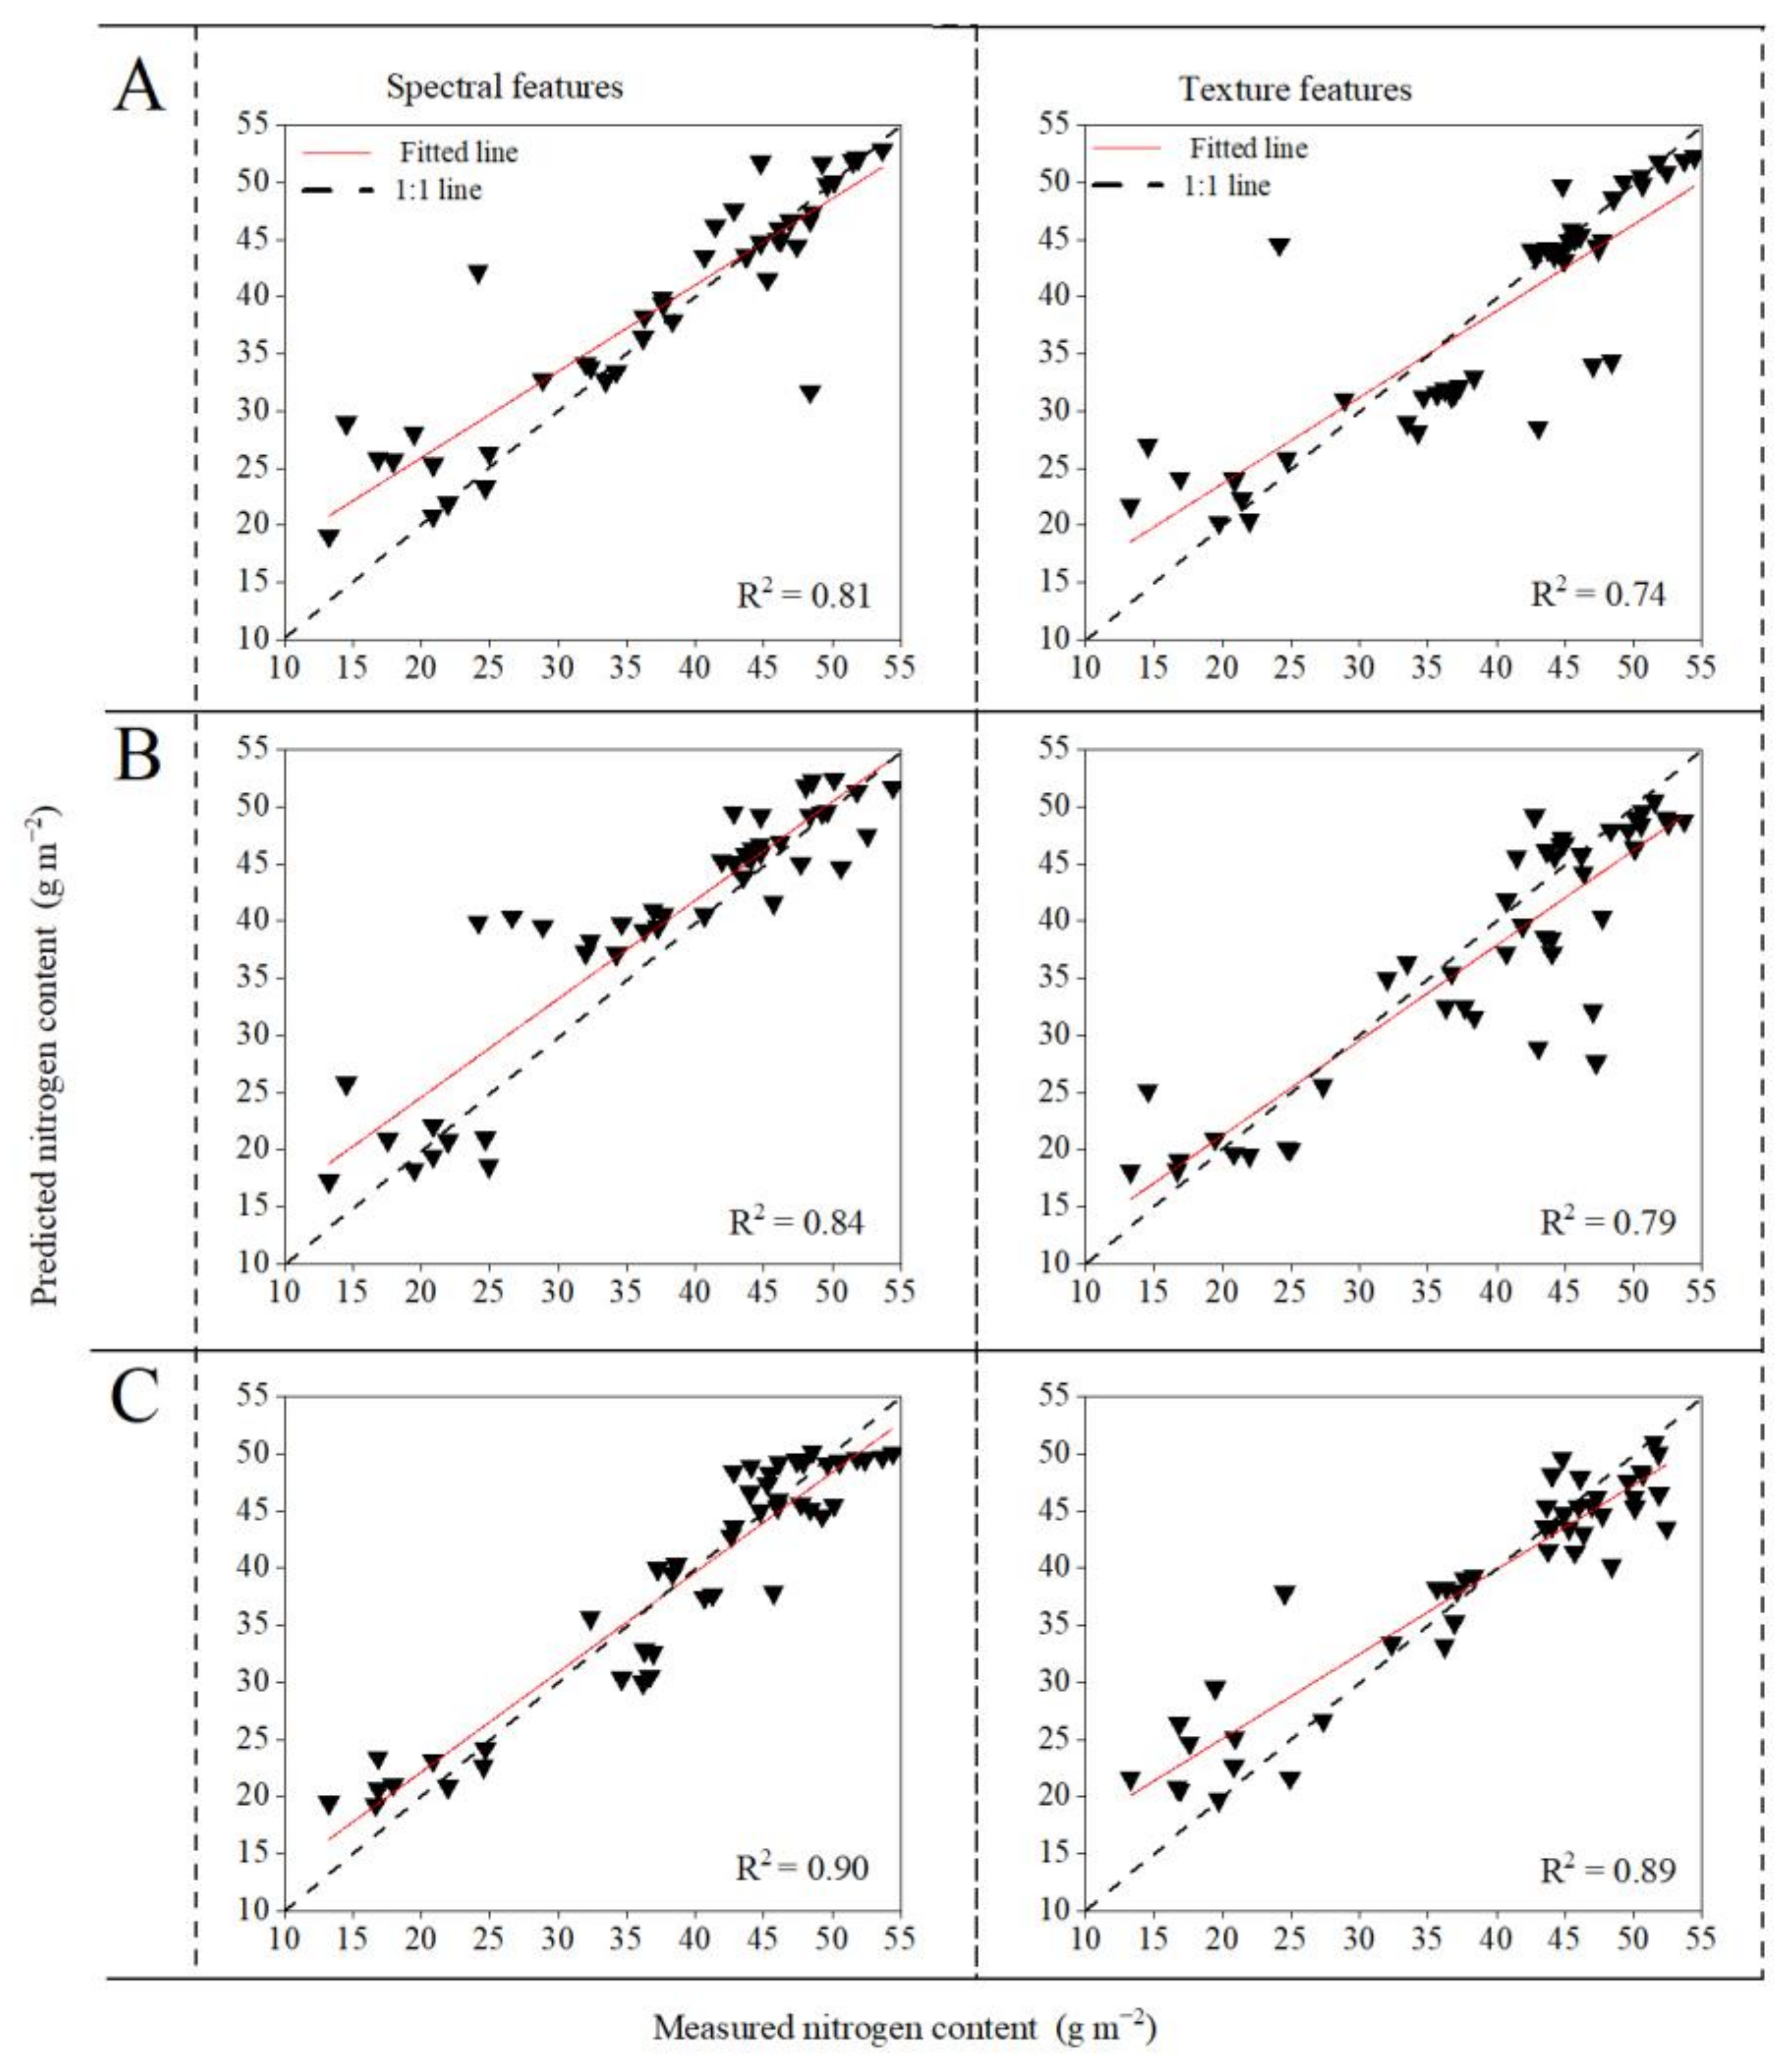
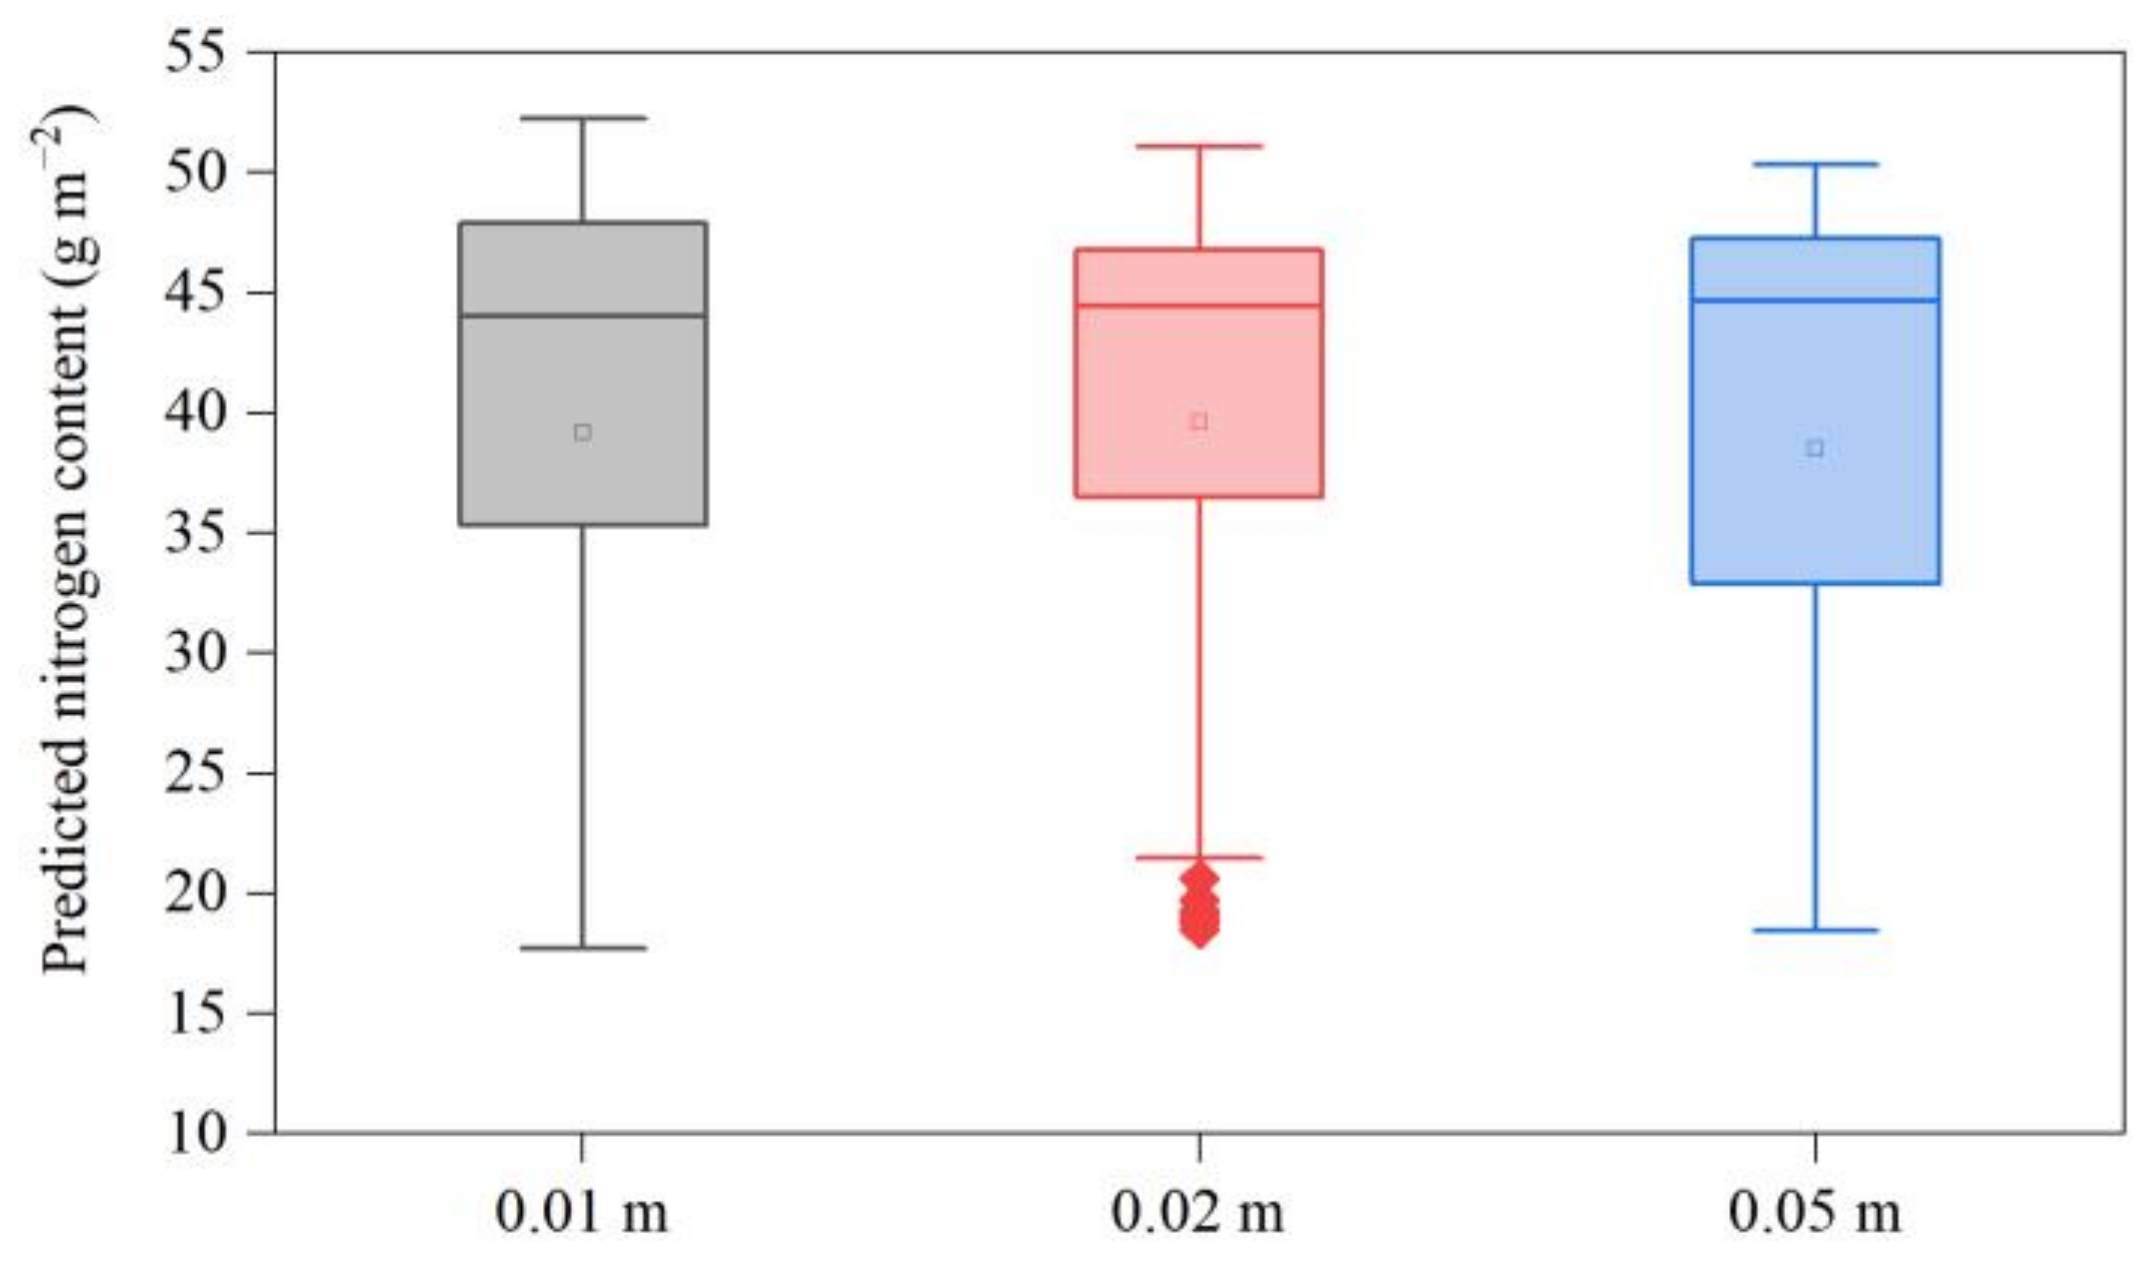
3.4. Nitrogen Content Prediction of Winter Wheat Plants at Different Image Spatial Resolutions Based on the Preferred Features

The 16 spectral and texture features were used by the RF method to construct the prediction models for plant nitrogen content in winter wheat at different image spatial resolutions. The scatterplots between the measured and predicted values are shown in Figure 4. The performance of the models constructed differed with different image spatial resolutions. The R2, the RMSE, the MAE and the RPD of plant nitrogen content prediction model constructed with 0.01 m resolution image features were 0.84, 4.57 g m−2, 2.50 g m−2 and 2.34, respectively; they were 0.86, 4.15 g m−2, 2.82 g m−2 and 2.65 for 0.02 m resolution image features, and 0.92, 3.17 g m−2, 2.45 g m−2 and 2.86 for 0.05 m. Considering the R2, the RMSE, the MAE, and the RPD of the three resolution models, the model constructed by 0.05 m resolution image features was the best. In addition, the results of one-way ANONA (Figure 5) indicated that the differences in the plant nitrogen content predicted by the three models were not significant.

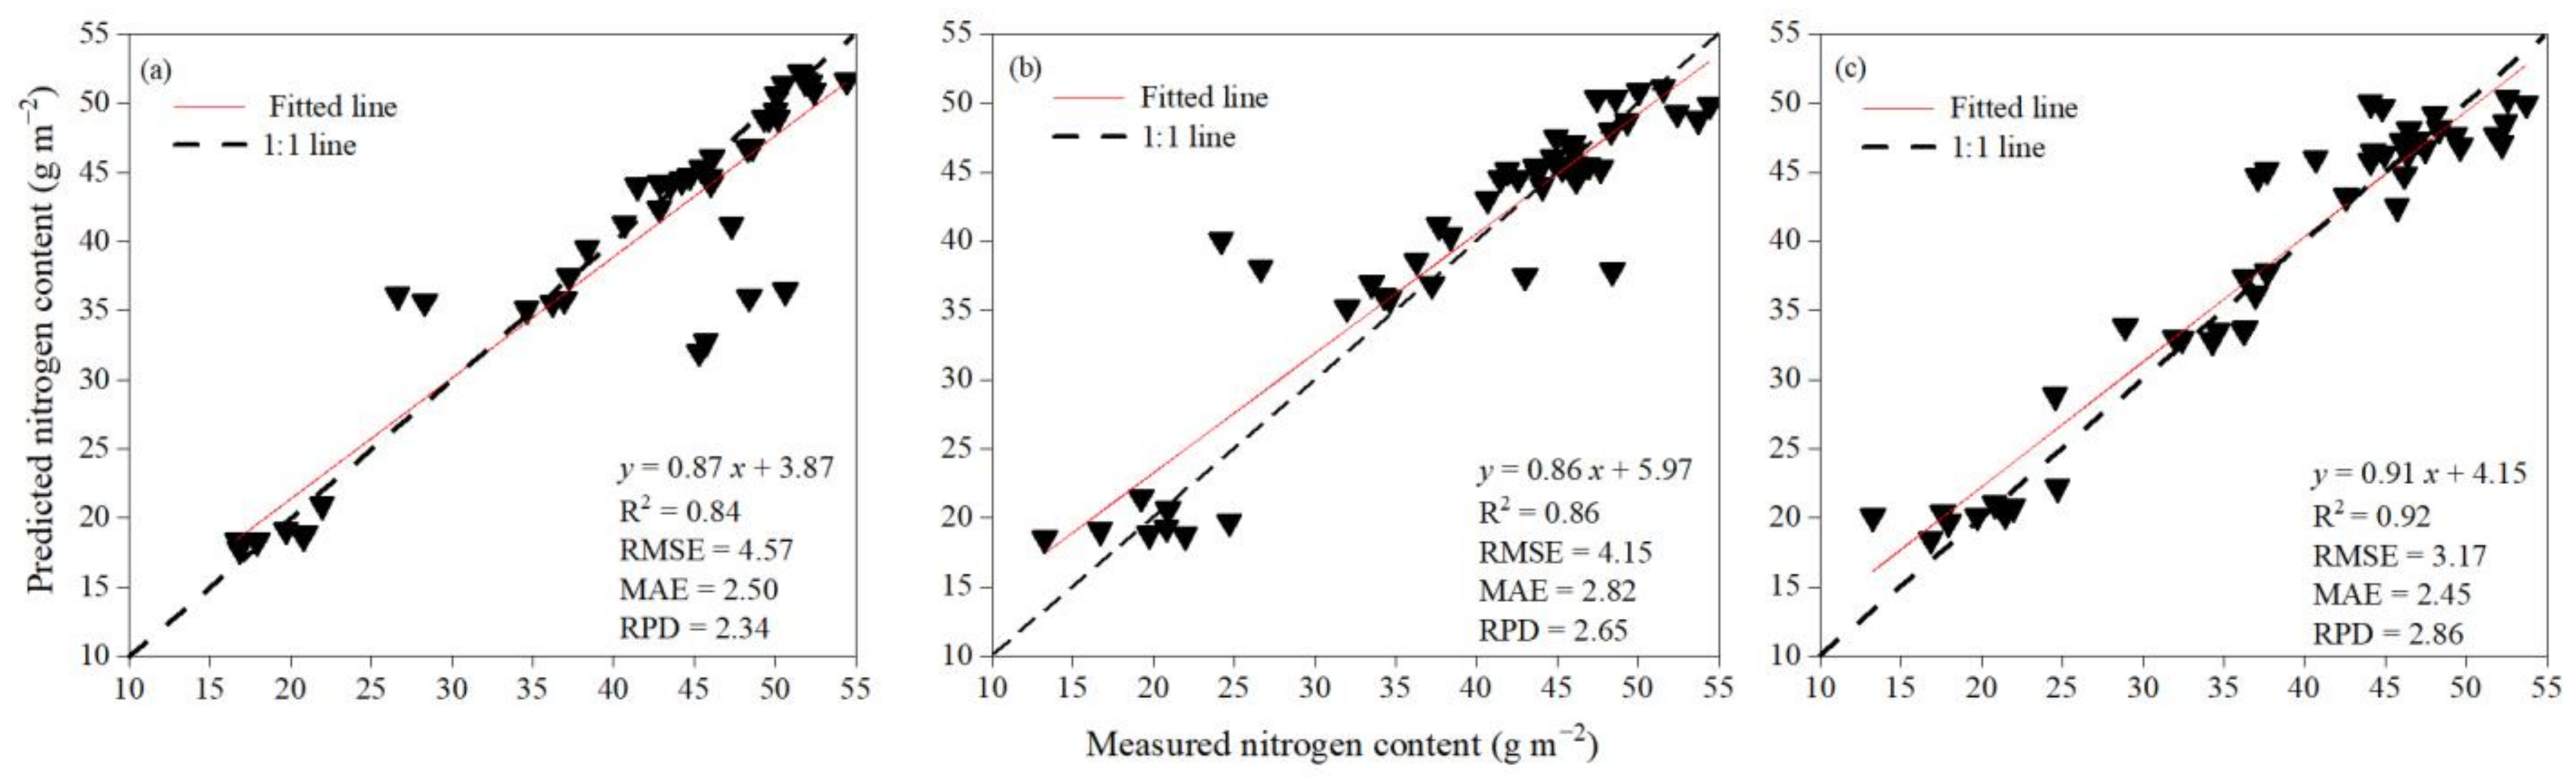
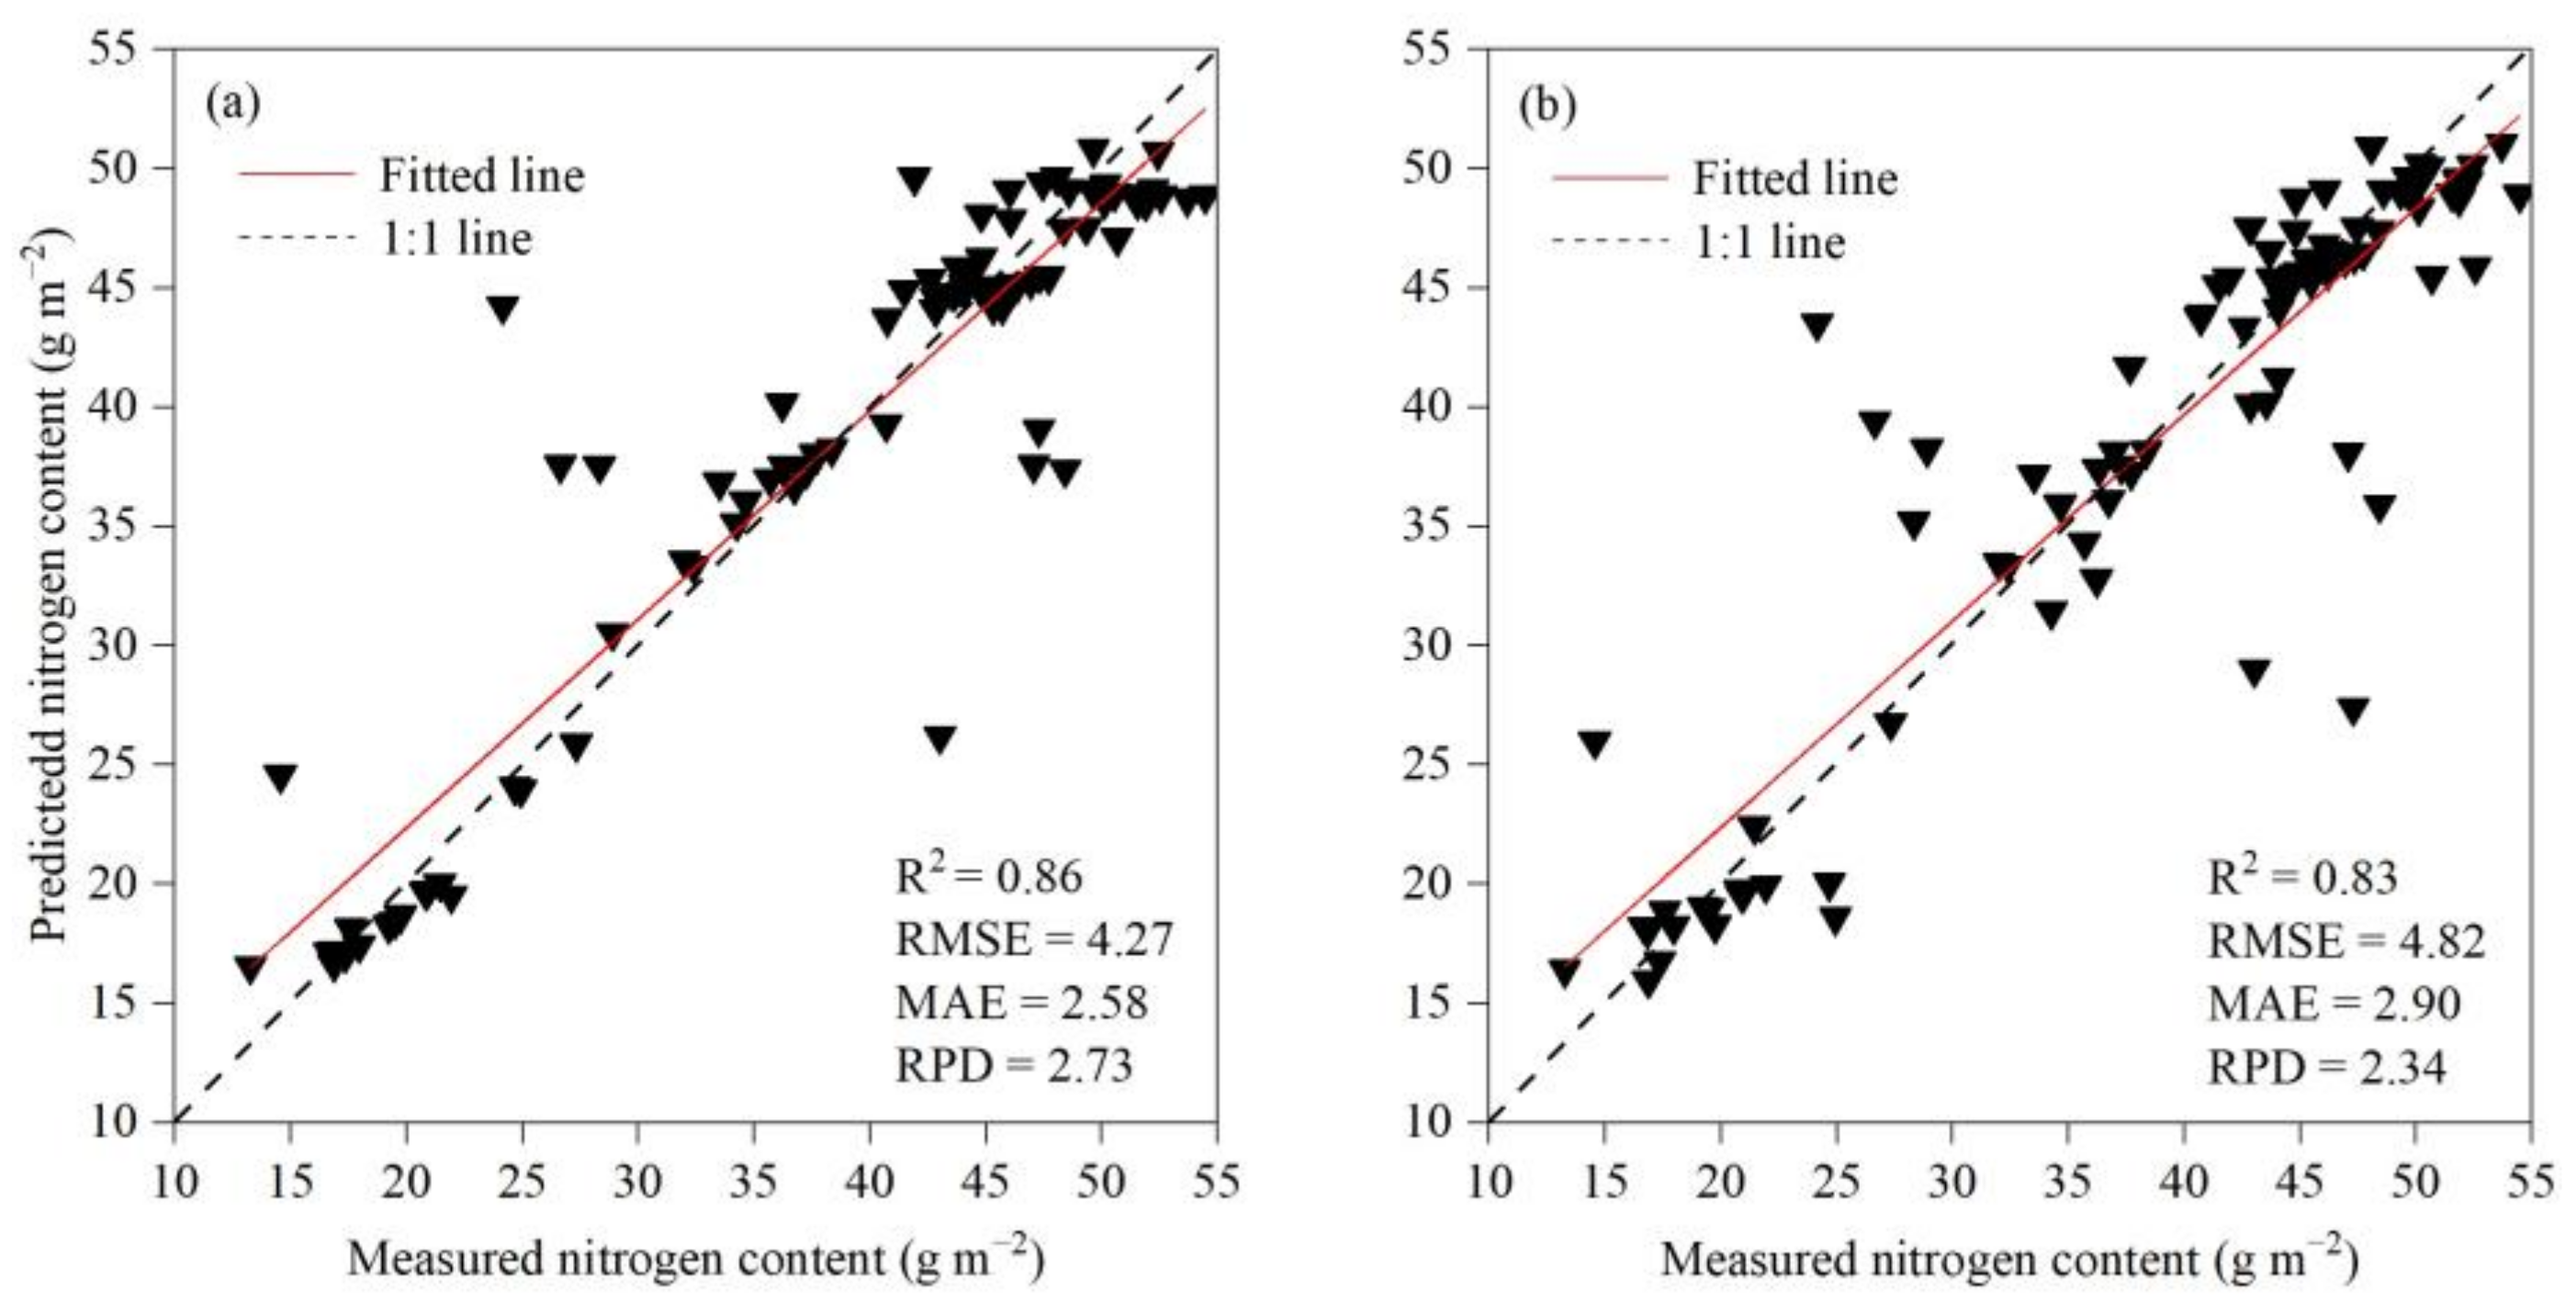
3.5. Upscaling Plant Nitrogen Content Prediction Models

The transferability of the model is a key factor to measure the model’s robustness. In this study, the models constructed with different resolution image features showed good prediction performance of plant nitrogen content, and the R2 of the models was above 0.84. What will happen if the models established with the coarsest resolution images (0.01 m) are applied to other UAV images obtained at a different spatial resolution? To answer this question, a model was firstly developed from the 0.01 m dataset only using sensitive features (Appendix A) selected with the CARS method and then applied to 0.02 m and 0.05 m UAV images with their corresponding sensitive features to evaluate the transferability. The scatterplots between the measured and predicted values are shown in Figure 6. The model constructed by 0.01 m resolution image features predicted the nitrogen content with a R2, a RMSE, a MAE, and a RPD of 0.84, 4.70 g m−2, 3.17 g m−2, and 2.38, respectively, at 0.02 m resolution; and the prediction results at 0.05 m resolution with a R2, a RMSE, a MAE and a RPD of 0.89, 3.68 g m−2, 2.87 g m−2, and 2.94, respectively. Compared to the similar model (Figure 4a) performance at the 0.01 m resolution (R2, RMSE, MAE, and RPD = 0.84, 4.57 g m−2, 2.50 g m−2, and 2.34, respectively), this indicates that the model constructed with 0.01 m resolution image features has a reasonably good transferability when upscaling to coarser resolutions.
Moreover, the transferability of the model for plant nitrogen content at 0.05 m image spatial resolution was slightly better than that of 0.02 m. This result is similar to Jia and Chen [23] who used different flight heights for the inversion of winter wheat nitrogen concentration, i.e., the R2 of the plant nitrogen content prediction model showed an increasing trend as the resolution decreased. The reason could be closely related to the acquired canopy images, as the spatial resolution decreases, the image pixels cover a larger area, with the increased numbers of “pure pixels”, reduced edge effect, and less noisy images.

3.6. Downscaling Plant Nitrogen Content Prediction Models

Similarly, the model was developed using the sensitive features selected from the 0.05 m dataset only with the CARS method and applied to 0.01 m and 0.02 m UAV images with their corresponding sensitive features to evaluate the model transferability (Figure 7). The model predicted the nitrogen content with a R2, a RMSE, a MAE, and a RPD of 0.86, 4.27 g m−2, 2.58 g m−2, and 2.73, respectively, at 0.01 m resolution and of 0.83, 4.82 g m−2, 2.90 g m−2 and 2.34, respectively, at 0.02 m. Because the model established with the 0.05 m images only had a slightly better performance than the transferred models, with a R2, a RMSE, a MAE, and a RPD of 0.92, 3.17 g m−2, 2.45 g m−2, and 2.86 (Figure 4c), respectively, this indicates that the model constructed with 0.05 m resolution image features also has a reasonably good transferability in the downscaling case. Therefore, these results showed that all the UAV images acquired in this study with different resolutions could achieve good predictions and transferability of the nitrogen content of winter wheat plants. In addition, the model predicted the plant nitrogen content at 0.01 m image spatial resolution better than that at 0.02 m. This result is similar to Yue et al. [25], who reported that the winter-wheat above-ground biomass was better estimated by combining image textures from 0.01 and 0.30 m ground resolution images with vegetation indices, compared with 0.01, 0.02, 0.05, 0.10, 0.15, 0.20, 0.25, and 0.30 m resolution images acquired by UAV. While some studies also showed that there was uncertainty in the relationship between vegetation index and UAV flight altitude. For example, Stow et al. [57] used the 10~25 m UAV-acquired images at different times to address the effect on the NDVI and found that there were higher reflectance values for Nir and Rededge bands as the image resolution decreased with increasing flying height over a range of heights, one factor that might have influenced these measurements was downdraft from the UAV causing ripples to form in the fabric, possibly changing its apparent reflectance.

4. Discussion

4.1. Transferability of Models as Affected by Image Resolutions

The image spatial resolution (flight height) of the images acquired by the UAV is closely related to the monitoring efficiency and accuracy. In this study, the time taken to acquire 0.05 m resolution remote sensing images in the fixed study area is approximately 1/10 of 0.01 m, the number of photos reduced from 235 to 20 sheets, and the splicing time reduced from 6.2 to 0.5 h. Decreasing the image resolution greatly improves the monitoring efficiency of plant nitrogen content in winter wheat, with an even slightly improved prediction accuracy. Regardless of whether the CARS features are selected with a single-resolution dataset or multiresolution datasets, the model established using the 0.05 m images also has good transferability, indicating that it can be easily downscaled to 0.01 m without losing much of the prediction accuracy.
Interestingly, the model constructed with 0.05 m image features can be better transferred to images of 0.01 m resolution (R2 = 0.86) than 0.02 m (R2 = 0.83). However, when upscaling the model established at 0.01 m, the model performed better at 0.05 m (R2 = 0.89) than that at 0.02 m (R2 = 0.84). These results indicate that the optimal/most stable image resolution varies during upscaling and downscaling, and it is not always true that the higher the resolution the better the prediction effect and transferability of the model. This is consistent with the results of modeling winter wheat nitrogen concentration using UAV images obtained at different flight heights (different resolutions) by Jia and Chen [23] and with the yield estimation models constructed by Geipel et al. [58] and Awais et al. [59]. For example, Jia and Chen [23] used 0.01, 0.02, 0.03, and 0.06 m images for predicting nitrogen content in winter wheat plants, the R2 of the models constructed with spectral features were 0.65, 0.63, 0.63, and 0.66, respectively; the R2 of the models constructed with texture features were 0.68, 0.66, 0.66 and 0.65, respectively; the R2 of the models combing spectral and texture feature components were 0.79, 0.71, 0.68 and 0.68, respectively. Geipel et al. [58] compared and analyzed corn yield estimation models with 0.02, 0.04, 0.06, 0.08, and 0.10 m resolution UAV images, and the 0.04 m resolution image feature had the best model accuracy with a R2 of 0.74; Awais et al. [59] established the model between canopy temperature and plant variable using 25, 40, and 60 m flight heights orthoimages, and the results showed that data collected at 11:00 h and 60 m altitude provided the best predictive relationships and accurate canopy temperatures with a R2 of 0.98.

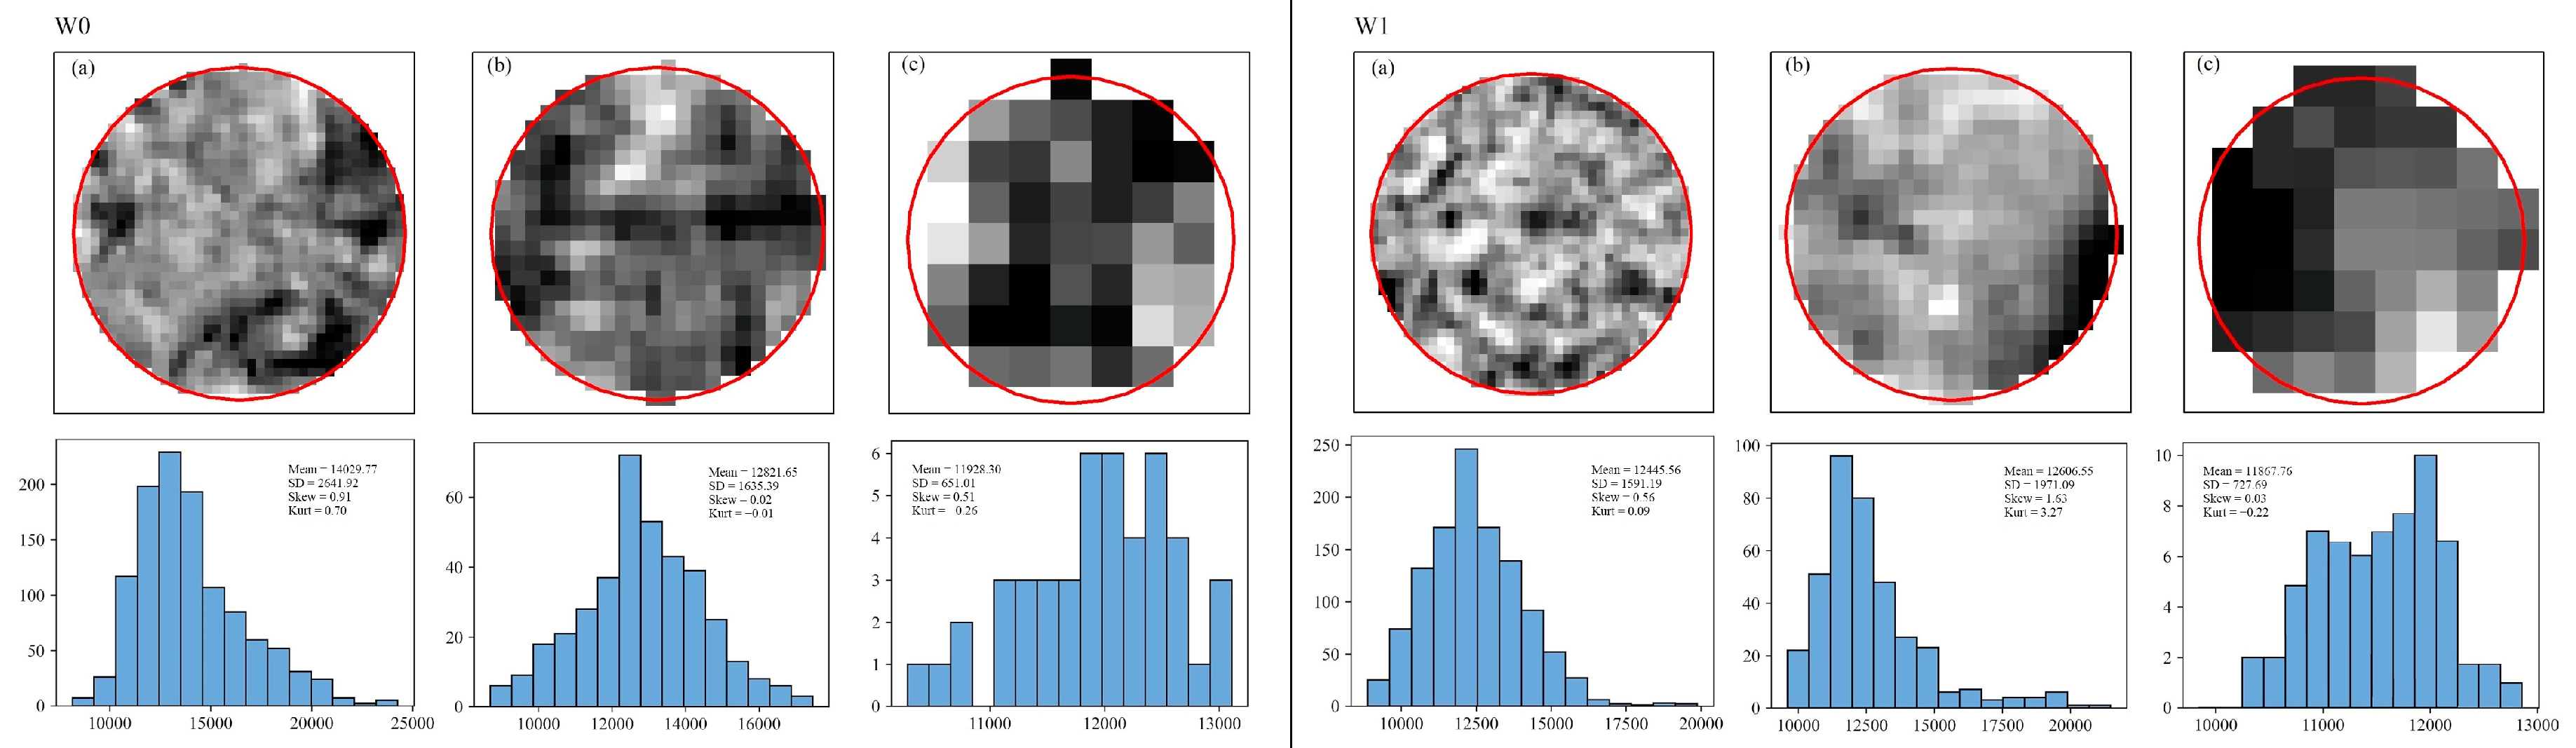
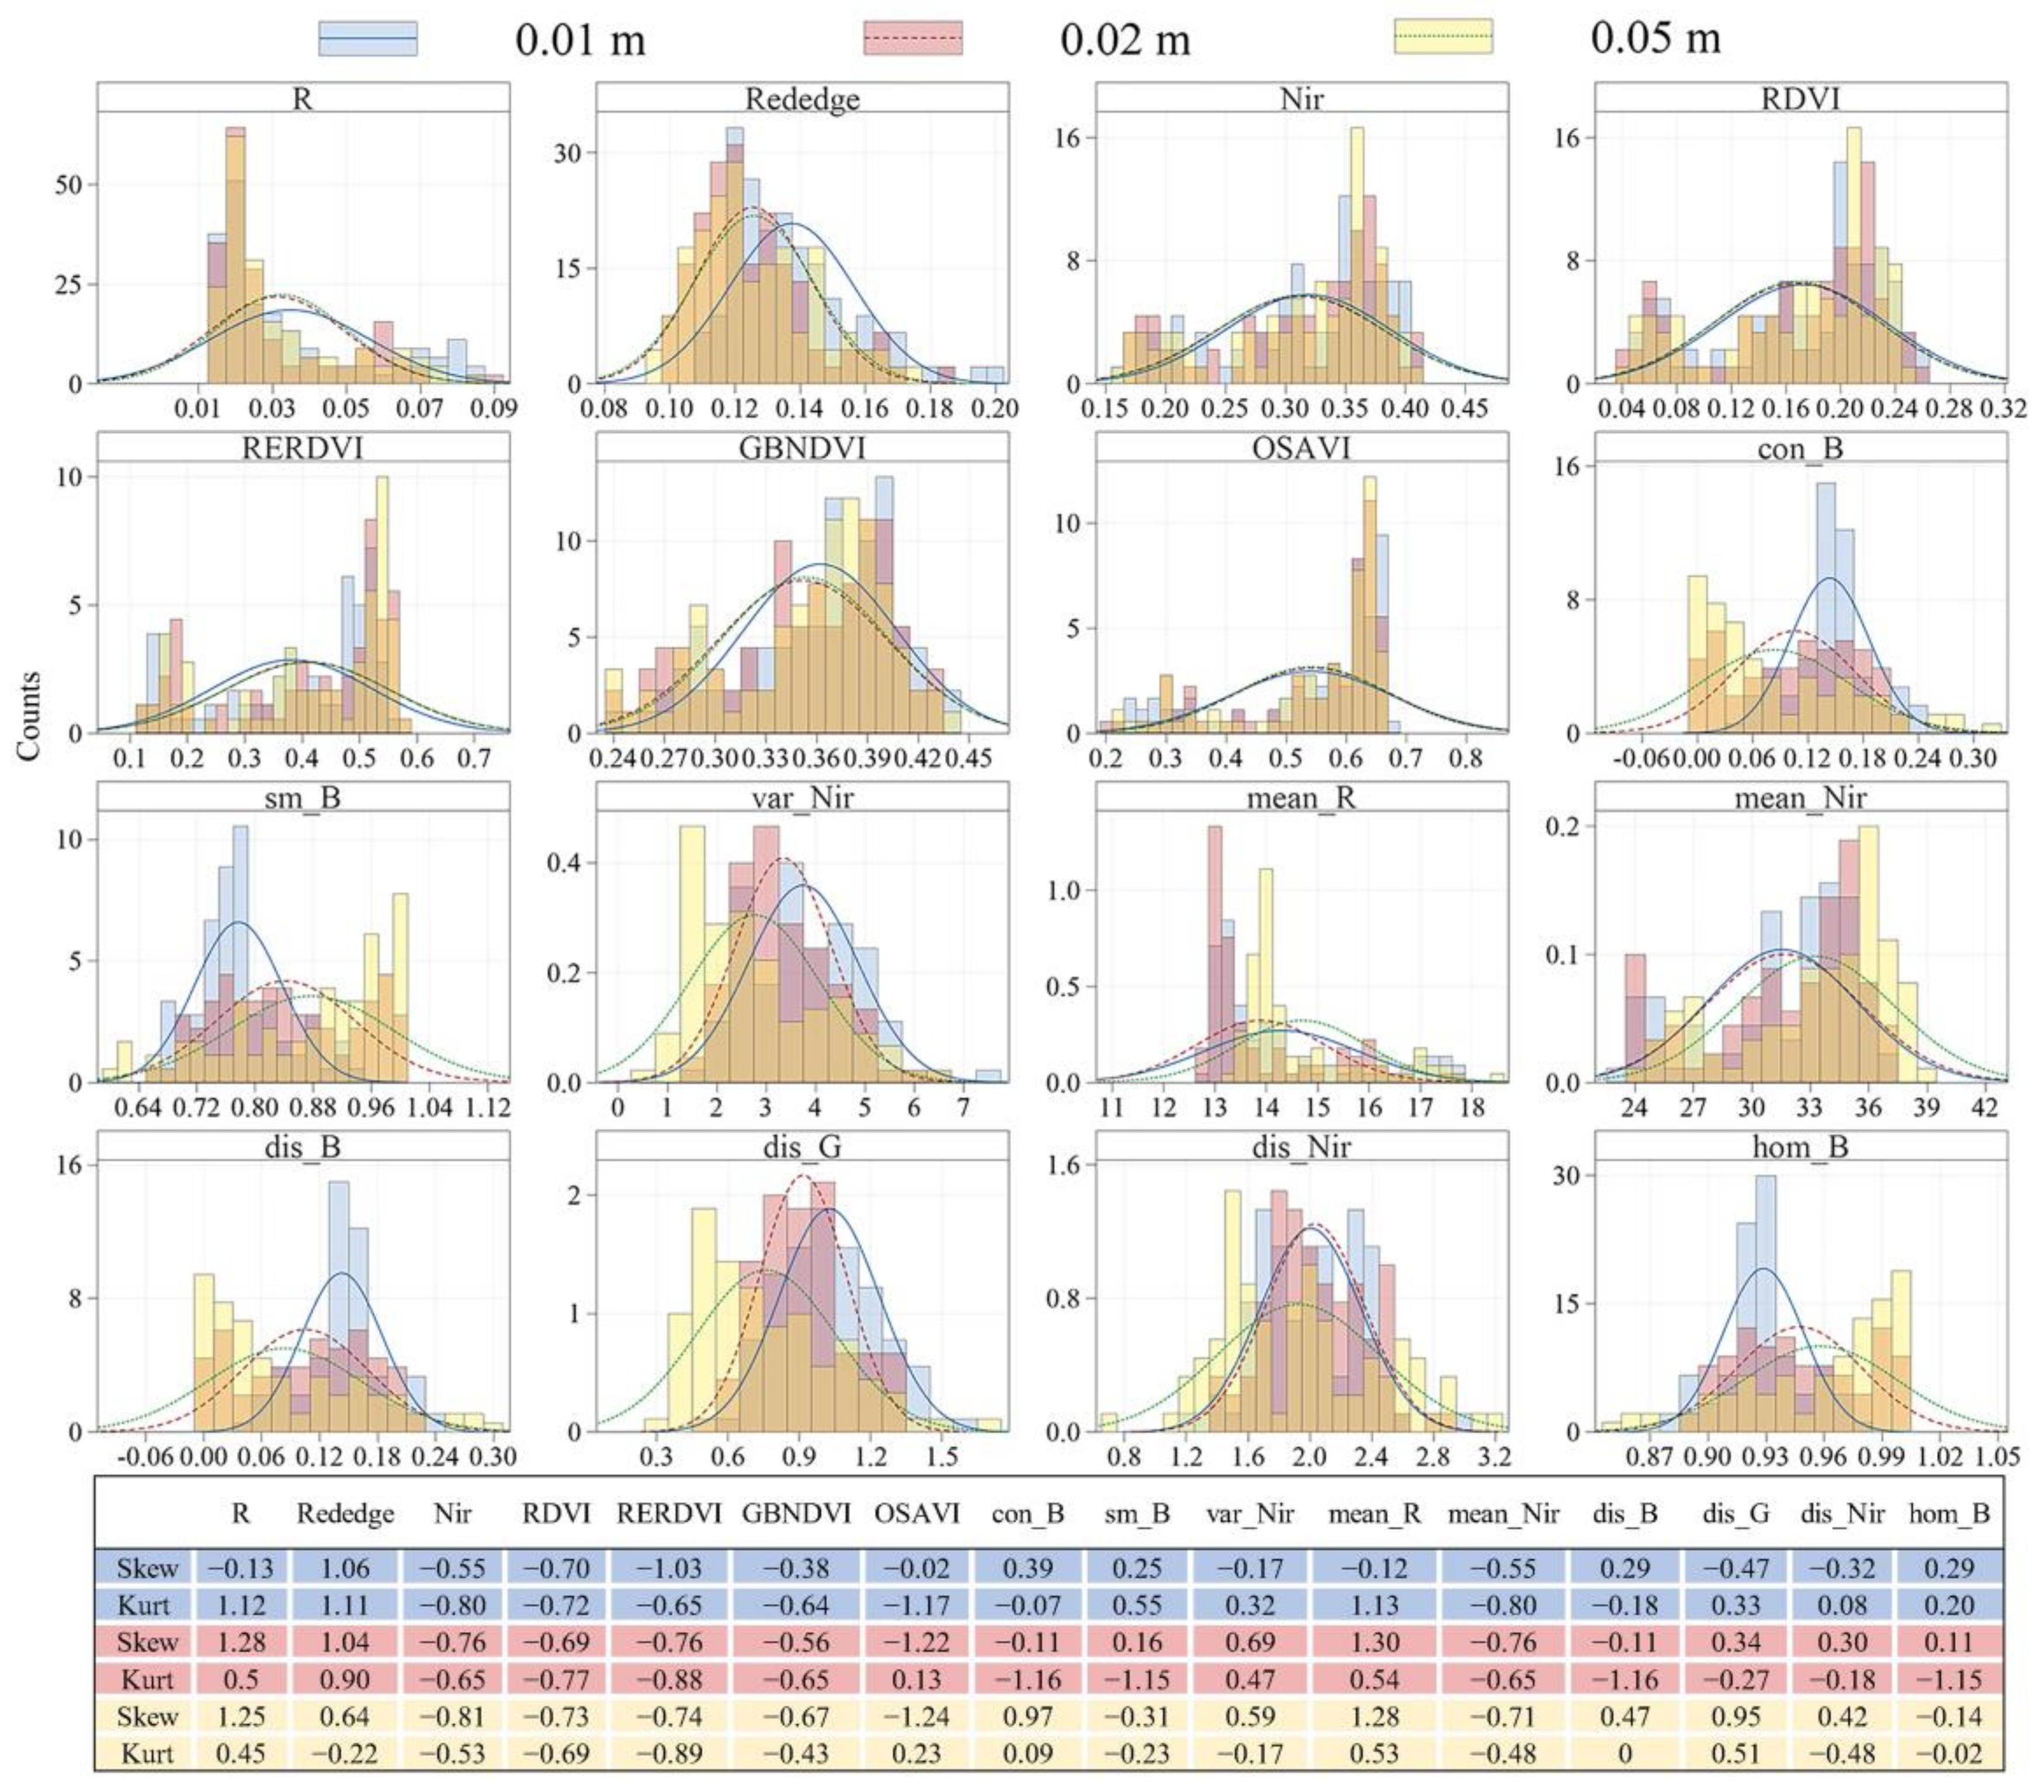
4.2. Effect of Image Resolutions on Spectral and Texture Features

The UAV images contain canopy information, which is easily affected by the mutual shading between the leaves, the size of the leaves, and the degree of leaf curl [60,61]. As the image spatial resolution decreases with increasing flight height, the boundaries between soil and vegetation, canopy shading, and vegetation are blurred. This changes the spectral and texture characteristics of the image as well as the relatively “pure pixels”, which reduces the influence of edge effects when extracting spectral and texture features. In this study, the r values between spectral, texture features, and plant nitrogen content differed. In general, the r values between spectral features and plant nitrogen content were higher than those of texture features, and there were significant differences between different bands. The reason for the difference in the magnitude of the correlation coefficients between reflectance and plant nitrogen content for the 5 bands is mainly due to the presence of red valleys in the canopy spectrum at the red-edge position, which was reflected in the study of Lu et al. [62]. On the other hand, it may be due to the fluctuation of the red-edge position influenced by external environmental conditions (e.g., water stress) at the time of image acquisition [63,64].
In addition, taking the calibrated image of the Redege band as an example, Figure 8 shows the spatial characteristics and corresponding histograms of the winter wheat canopy with different image spatial resolutions in the same region with a fixed center and a radius of 0.2 m under W0 and W1 treatments. It can be seen that the high-resolution image has richer canopy structure information; however, as the spatial resolution decreases, the image characteristics become relatively “pure pixels”. When a circular polygon with a radius of 0.2 m is used to clip the Redege band images of 0.01, 0.02, and 0.05 m spatial resolutions, it covers 126, 71, and 25 edge pixels, respectively, which are related to the useful information from image spectral and texture features (Table 4). Additionally, other studies showed that the leaf area index, transpiration, biomass, and plant height of the crop change with different water conditions [57,58,59]. In this study, the texture features of the images with different water treatments in Figure 8 also showed that there were differences in the canopy characteristics of winter wheat between the W0 and W1 treatments. For example, the mean calibrated Rededge image DN values of the W0 treatment were 14,029.77, 12,821.65, and 11,928.30 for 0.01, 0.02, and 0.05 m spatial resolution UAV images, respectively, and the mean DN values of the W1 treatment were 12,445.56, 12,606.55 and 11,467.76, respectively. The difference between the two DN values were 1584.21, 215.1, and 60.54, respectively; this suggests that water treatment (irrigation) has a more pronounced effect on images with high resolutions (0.01 m) than low resolutions (e.g., 0.05 m).
When comparing the differences in mean DN values across different spatial resolutions, the mean DN values of 0.02 and 0.05 m images under W0 treatments were smaller than that of the 0.01 m image (by 1208.12 and 2101.47, respectively); however, the differences between mean DN values of 0.02 and 0.05 m images with 0.01 m image under W0 treatments were 160.99 and 977.8, respectively. This suggests that the effects of image spatial resolution on image reflectance and eventually the model performance and transferability will become less significant when the plants are wet as the overall reflectance decreases under irrigation.
Moreover, this is also demonstrated in Figure 9 using the histograms of the selected spectral and texture features by CARS. As the image resolution decreases, the Skew and Kurt differences of the spectral and texture features tend to decrease, indicating that the data itself tends to be more “normally distributed”, and the good data characteristics also provide a guarantee for the construction of models with better prediction and transferability.
The Kruskal–Wallis non-parametric normal distribution test was applied at different resolutions, and the results showed that the 16 image features selected from the three spatial resolutions, R and Nir band canopy reflectance, and vegetation indices (the RDVI, the RERDVI, the GBNDVI, and the OSAVI) selected by CARS did not differ significantly from each other under different resolutions, while some of the texture features were significantly different such as dis_Nir, and the others including con_B, and sm_B, con_B, sm_B, var_Nir, mean_R, mean_Nir, dis_B, dis_G, and hom_B. This suggests that the image resolution affects the texture features more than the spectral features (e.g., reflectance and vegetation indices). The differences in the texture features at different image resolutions are incorporated into the models and can lead to differences in model performance and transferability.
Other studies also showed that the prediction models constructed with single spectral features outperformed texture features, but models constructed by fusing spectral and texture features outperformed those constructed with single spectral or texture features [23,24,65,66,67]. To further illustrate the effects of image resolution on spectral and texture features, Figure 8 and Figure 9 showed that the effect of image resolutions on spectral features is less than that of texture features. In addition, as shown in Appendix B, the R2 values between the measured and predicted plant nitrogen of the texture feature models varied more across different image resolutions than those of the spectral feature model, and the accuracy of the plant nitrogen prediction model constructed by spectral features was higher than that of the model constructed by texture features. These results are consistent with the previous studies but provide further evidence to improve our understanding of the control of image resolutions on image spectral and texture features and the corresponding models.

5. Conclusions

In this study, the effect of different resolution images on the prediction model and transferability of winter wheat plant nitrogen content was carried out by setting different flight heights. The results showed that ① the impact of image features on the prediction model of wheat plant nitrogen content was little when the image spatial resolution varied from 0.01, 0.02 to 0.05 m. The R2 of the plant nitrogen content models constructed with three resolutions were 0.84, 0.86, and 0.92, respectively. ② The model constructed with different resolution features showed different prediction accuracy but a reasonably good transferability when applied to coarser (upscaling) or finer (downscaling) images. ③ The effects of image resolutions on model performance and transferability are because image resolutions mostly affect texture features rather than spectral features. ④ The image resolution affects image texture features more than the spectral features and the effects of image resolution on model performance and transferability decrease with increasing plant wetness under irrigation treatment.
Therefore, to balance the survey efficiency and accuracy, a moderate increase in UAV flight height could achieve a fast and accurate prediction of plant nitrogen content during the growing season.

Supplementary Materials

The following supporting information can be downloaded at: https://www.mdpi.com/article/10.3390/drones6100299/s1, Figure S1. Plots of CARS variable selection for the sensitive characteristics of nitrogen content in winter wheat plant based on the three resolution image features; Figure S2. Transferring nitrogen prediction models constructed with 0.01 m resolution image features to 0.02 m (a) and 0.05 m (b) resolutions; Figure S3. Transferring nitrogen prediction models constructed with 0.05 m resolution image features to 0.01 m (a) and 0.02 m (b) resolutions.

Author Contributions

All authors have made significant contributions to this research. Conceptualization, writing—original draft, Y.G., J.H. (Jia He) and J.H. (Jingyi Huang); experiment designs and data curation, Y.J. and S.L.; validation, Y.G., G.Z. and S.X.; funding acquisition, Y.G. and J.H. (Jia He); discussed the results and revised the manuscript, Y.G., L.W. and J.H. (Jingyi Huang). All authors have read and agreed to the published version of the manuscript.

Funding

This research was funded by the National Natural Science Foundation of China (41601213), the Outstanding Youth Program of Henan Academy of Agricultural Sciences (2021JQ02), and the Science and Technology Innovation Leading Talent Cultivation Program of the Institute of Agricultural Economics and Information, Henan Academy of Agricultural Sciences (2022KJCX01).

Institutional Review Board Statement

This paper does not involve any ethical guidelines.

Informed Consent Statement

Not applicable.

Data Availability Statement

The datasets for this manuscript are not publicly available because our team is working on other publications with them and they are not ready yet for sharing. Requests to access the datasets should be directed to Yan Guo at [email protected].

Acknowledgments

We would like to thank Wei Feng, Xiuzhong Yang, Yongzheng Cheng, Hongli Zhang for their help in the data collection. The authors also thank the anonymous reviewers for their suggestions on improving the manuscript.

Conflicts of Interest

The authors declare no conflict of interest.

Appendix A

For the 0.01m resolution dataset (Figure A1A), the minimum RMSECV value was 2.26 at the 21st iteration, and a total of 15 sensitive features were finally selected, including G, R, Rededge, Nir, the NDVI, the RERDVI, the OSAVI, con_B, con_R, sm_B, var_Rededge, var_Nir, mean_G, mean_Redege, cor_G.
Figure A1. Plots of CARS variable selection for the sensitive characteristics of nitrogen content in the winter wheat plant based on the three-resolution image features. (A): 0.01 m; (B): 0.02 m; (C): 0.05 m. (a) The number of selected plant nitrogen content sensitive features changed as the number of iterations; (b) the RMSECV values changed as the number of iterations.
Drones 06 00299 g0a1
For the 0.02m resolution dataset (Figure A1B), the minimum RMSECV value was 3.67 at the 18th iteration, and a total of 15 sensitive features were finally selected, including the NDVI, the RDVI, the RERDVI, con_B, con_R, sm_B, sm_Rededge, sm_Nir, var_G, var_Nir, mean_R, mean_Redege, mean_Nir, dis_B, dis_G.
For the 0.05m resolution dataset (Figure A1C), the minimum RMSECV value was 3.12 at the 19th iteration, and a total of 15 sensitive features were finally selected, including G, R, Rededge, Nir, the NDVI, the RERDVI, the GBNDVI, con_B, sm_B, var_Nir, mean_B, mean_G, mean_Redege, mean_Nir, dis_Nir, hom_B.

Appendix B

Based on the spectral features and texture features selected by the CARS, the RF method was used to construct the prediction models of the nitrogen content of winter wheat plants at different resolutions using spectral or texture features only, and the relationships between the measured and predicted values are shown in Figure A2. The measured and predicted R2 values of 0.81, 0.84, and 0.90 for the 0.01, 0.02, and 0.05 m resolutions of the spectral feature and 0.74, 0.79, and 0.89 for the 0.01, 0.02, and 0.05 m resolutions of the textural feature, respectively. Combined with the results in part 2.4 of this study, it can be concluded that (1) the plant nitrogen content prediction model constructed by fusing spectral features and texture features has higher accuracy than the model constructed by single image features; (2) the plant nitrogen content prediction model constructed by spectral features has higher accuracy than the model constructed by texture features; (3) compared with the plant nitrogen content prediction model constructed by spectral features and texture features, the difference between the maximum and minimum values of the R2 of the texture feature model (0.15) was larger than that of the spectral feature (0.09), and the difference between the R2 of the plant nitrogen content prediction models of adjacent resolutions also showed that the difference of texture features was larger than that of the spectral feature. In summary, the variation of image resolution has more influence on texture features than spectral features.
Figure A2. Relationship between the predicted and observed canopy N content for the validation datasets. (A): 0.01 m; (B): 0.02 m; (C): 0.05 m.
Drones 06 00299 g0a2

References

  1. Lu, Z.G.; Dai, T.B.; Jiang, D.; Jing, Q.; Wu, Z.G.; Cao, W.X. Effects of nitrogen strategies on population quality index and grain yield & quality in weak-gluten wheat. Acta Agron. Sin. 2007, 33, 590–597. (In Chinese) [Google Scholar]
  2. Jiang, J.; Atkinson, P.M.; Zhang, J.; Lu, R.; Zhou, Y.; Cao, Q.; Tian, Y.; Zhu, Y.; Cao, W.; Liu, X. Combining fixed-wing UAV multispectral imagery and machine learning to diagnose winter wheat nitrogen status at the farm scale. Eur. J. Agron. 2022, 138, 126537. [Google Scholar] [CrossRef]
  3. Walsh, O.S.; Shafian, S.; Marshall, J.M.; Jackson, C.; Mcclintick-Chess, J.R.; Blanscet, S.M.; Swoboda, K.; Thompson, C.; Belmont, K.M.; Walsh, W.L. Assessment of UAV based vegetation indices for nitrogen concentration estimation in spring wheat. Adv. Remote Sens. 2018, 77, 71–90. [Google Scholar] [CrossRef] [Green Version]
  4. Argento, F.; Anken, T.; Abt, F.; Vogelsanger, E.; Walter, A.; Liebisch, F. Site-specific nitrogen management in winter wheat supported by low-altitude remote sensing and soil data. Precis. Agric. 2021, 22, 364–386. [Google Scholar] [CrossRef]
  5. Li, D.; Wang, X.; Zheng, H.; Zhou, K.; Yao, X.; Tian, Y.; Zhu, Y.; Cao, W.; Cheng, T. Estimation of area-and mass-based leaf nitrogen contents of wheat and rice crops from water-removed spectra using continuous wavelet analysis. Plant Methods 2018, 14, 76. [Google Scholar] [CrossRef] [PubMed]
  6. Zhang, L.; Chen, X.P.; Jia, L.L. Study on nitrogen nutrition dynamic diagnostic parameters of summer maize based on visible light remote sensing. Plant Nutr. Ferti. Sci. 2018, 24, 261–269. (In Chinese) [Google Scholar]
  7. Montgomery, K.; Henry, J.B.; Vann, M.C.; Whipker, B.E.; Huseth, A.S.; Mitasova, H. Measures of canopy structure from low-cost uas for monitoring crop nutrient status. Drones 2020, 4, 36. [Google Scholar] [CrossRef]
  8. Jiang, J.; Zhu, J.; Wang, X.; Cheng, T.; Yao, X. Estimating the leaf nitrogen content with a new feature extracted from the ultra-high spectral and spatial resolution images in wheat. Remote Sens. 2021, 13, 739. [Google Scholar] [CrossRef]
  9. Lu, N.; Wu, Y.; Zheng, H.; Yao, X.; Zhu, Y.; Cao, W.; Cheng, T. An assessment of multi-view spectral information from UAV-based color-infrared images for improved estimation of nitrogen nutrition status in winter wheat. Precis. Agric. 2022, 23, 1653–1674. [Google Scholar] [CrossRef]
  10. Fitzgerald, G.; Rodriguez, D.; O’leary, G. Measuring and predicting canopy nitrogen nutrition in wheat using a spectral index—The canopy chlorophyll content index (CC-CI). Field Crops. Res. 2010, 116, 318. [Google Scholar] [CrossRef]
  11. Zhao, C.J. The development of agricultural remote sensing research and application. Trans. Chin. Soc. Agric. Mach. 2014, 45, 277–293. (In Chinese) [Google Scholar]
  12. Wang, L.A.; Zhou, X.D.; Zhu, X.K.; Guo, W.S. Estimation of leaf nitrogen concentration in wheat using the MK-SVR algorithm and satellite remote sensing data. Comput. Electron. Agric. 2017, 140, 327. [Google Scholar] [CrossRef]
  13. Sabzi, S.; Pourdarbani, R.; Rohban, M.H.; García-Mateos, G.; Arribas, J.I. Estimation of nitrogen content in cucumber plant (Cucumis sativus L.) leaves using hyperspectral imaging data with neural network and partial least squares regressions. Chemometr. Intell. Lab. 2021, 217, 104404. [Google Scholar] [CrossRef]
  14. Li, Z.; Li, Z.; Fairbairn, D.; Li, N.; Li, B.; Feng, H.; Yang, G. Multi-LUTs method for canopy nitrogen density estimation in winter wheat by field and UAV hyperspectral. Comput. Electron. Agric. 2019, 162, 174–182. [Google Scholar] [CrossRef]
  15. Colorado, J.D.; Cera-bornacelli, N.; Caldas, J.S.; Petro, E.; Jaramillo-Botero, A. Estimation of nitrogen in rice crops from UAV-captured images. Remote Sens. 2020, 12, 3396. [Google Scholar] [CrossRef]
  16. Messina, G.; Praticò, S.; Badagliacca, G.; Di Fazio, S.; Monti, M.; Modica, G. Monitoring onion crop “cipolla rossa di tropea calabria igp” growth and yield response to varying nitrogen fertilizer application rates using UAV imagery. Drones 2021, 5, 61. [Google Scholar] [CrossRef]
  17. Schirrmann, M.; Giebel, A.; Gleiniger, F.; Pflanz, M.; Lentschke, J.; Dammer, K. Monitoring agronomic parameters of winter wheat crops with low-cost UAV imagery. Remote Sens. 2016, 8, 706. [Google Scholar] [CrossRef] [Green Version]
  18. Dong, C.; Zhao, G.X.; Su, B.W.; Chen, X.N.; Zhang, S.M. Decision model of variable nitrogen fertilizer in winter wheat returning green stage based on UAV multi-spectral images. Spectrosc. Spect. Anal. 2019, 39, 3599–3605. [Google Scholar]
  19. Liu, C.H.; Ma, W.Y.; Chen, Z.C.; Wang, C.Y.; Lu, J.J.; Yue, X.Z.; Wang, Z.; Fang, Z.; Miao, Y.X. Nutrient nutrition diagnosis of winter wheat based on remote sensing of unmanned aerial vehicle. J. Henan Univ. Technol. 2018, 37, 45–53. (In Chinese) [Google Scholar]
  20. Zhang, J.; Cheng, T.; Shi, L.; Wang, W.; Niu, Z.; Guo, W.; Ma, X. Combining spectral and texture features of UAV hyperspectral images for leaf nitrogen content monitoring in winter wheat. Int. J. Remote Sens. 2022, 43, 2335–2356. [Google Scholar] [CrossRef]
  21. Wang, Y.N.; Li, F.L.; Wang, W.D.; Chen, X.K.; Chang, Q.R. Monitoring of winter wheat nitrogen nutrition based on UAV hyper-spectral images. Trans. Chin. Soc. Agric. Eng. 2020, 36, 31–39. (In Chinese) [Google Scholar]
  22. Li, H.J.; Li, J.Z.; Lei, Y.P.; Zhang, Y.M. Diagnosis of nitrogen nutrition of winter wheat and summer corn using images from digital camera equipped on unmanned aerial vehicle. Chin. J. Eco-Agric. 2017, 25, 1832–1841. (In Chinese) [Google Scholar]
  23. Jia, D.; Chen, P.F. Effect of low altitude UAV image resolution on inversion of winter wheat nitrogen concentration. Trans. Chin. Soc. Agric. Mach. 2020, 51, 164–169. (In Chinese) [Google Scholar]
  24. Zhang, X.W.; Zhang, K.; Sun, Y.; Zhao, Y.; Zhuang, H.; Ban, W.; Chen, Y.; Fu, E.; Chen, S.; Liu, J.; et al. Combining spectral and texture features of uas-based multispectral images for maize leaf area index estimation. Remote Sens. 2022, 14, 331. [Google Scholar] [CrossRef]
  25. Yue, J.; Yang, G.; Tian, Q.; Feng, H.; Xu, K.; Zhou, C. Estimate of winter-wheat above-ground biomass based on UAV ultrahigh-ground-resolution image textures and vegetation indices. ISPRS J. Photogramm. Remote Sens. 2019, 150, 226–244. [Google Scholar] [CrossRef]
  26. Fu, Y.Y.; Yang, G.J.; Li, Z.H.; Song, X.Y.; Li, Z.H.; Xu, X.G.; Wang, P.; Zhao, C.J. Winter wheat nitrogen status estimation using UAV-Based RGB imagery and Gaussian processes regression. Remote Sens. 2020, 12, 3778. [Google Scholar] [CrossRef]
  27. Zheng, H.B.; Ma, J.F.; Zhou, M.; Li, D.; Yao, X.; Cao, W.X.; Zhu, Y.; Cheng, T. Enhancing the nitrogen signals of rice canopies across critical growth stages through the integration of textural and spectral information from Unmanned Aerial Vehicle (UAV) multispectral imagery. Remote Sens. 2020, 12, 957. [Google Scholar] [CrossRef] [Green Version]
  28. Chlingaryan, A.; Sukkarieh, S.; Whelan, B. Machine learning approaches for crop yield prediction and nitrogen status estimation in precision agriculture: A review. Comput. Electron. Agric. 2018, 151, 61–69. [Google Scholar] [CrossRef]
  29. Berger, K.; Verrelst, J.; Féret, J.; Hank, T.B.; Wocher, M.; Mauser, W.; Camps-Valls, G. Retrieval of aboveground crop nitrogen content with a hybrid machine learning method. Int. J. Appl. Earth Obs. 2020, 92, 102174. [Google Scholar] [CrossRef]
  30. Shi, P.H.; Wang, Y.; Xu, J.M.; Zhao, Y.L.; Yang, B.L.; Yuan, Z.M.; Sun, Q.H. Rice nitrogen nutrition estimation with RGB images and machine learning methods. Comput. Electron. Agric. 2021, 180, 105860. [Google Scholar] [CrossRef]
  31. Li, J.M.; Chen, X.Q.; Yang, Q.; Shi, L.S. Deep learning models for estimation of paddy rice leaf nitrogen concentration based on canopy hyperspectral data. Acta Agron Sin. 2021, 47, 1342–1350. (In Chinese) [Google Scholar]
  32. Qiu, Z.C.; Ma, F.; Li, Z.W.; Xu, X.B.; Ge, H.X.; Du, C. Estimation of nitrogen nutrition index in rice from UAV RGB images coupled with machine learning algorithms. Comput. Electron. Agric. 2021, 189, 106421. [Google Scholar] [CrossRef]
  33. Zhang, S.H.; Duan, J.Z.; He, L.; Jing, Y.H.; Schulthess, U.C.; Lashkari, A.; Guo, T.C.; Wang, Y.H.; Feng, W. Wheat yield estimation from UAV platform based on multi-modal remote sensing data fusion. Acta Agron. Sin. 2022, 48, 1746–1760. (In Chinese) [Google Scholar]
  34. Pozo, S.D.; Rodríguez-Gonzálvez, P.; Hernández-López, D.; Felipe-García, B. Vicarious Radiometric Calibration of a Multispectral Camera on Board an Unmanned Aerial System. Remote Sens. 2014, 6, 1918–1937. [Google Scholar]
  35. Bao, S.D. Soil Agrochemical Analysis; China Agricultural Press: Beijing, China, 2008. [Google Scholar]
  36. Gamon, J.A.; Penuelas, J.; Field, C.B. A narrow-waveband spectral index that tracks diurnal changes in photosynthetic efficiency. Remote Sens. Environ. 1992, 41, 35–44. [Google Scholar] [CrossRef]
  37. Xiao, X.M.; He, L.; Salas, W.; Li, C.S.; Moore, B.; Zhao, R.; Frolking, S.; Boles, S. Quantitative relationships between field-measured leaf area index and vegetation index derived from vegetation images for paddy rice fields. Int. J. Remote Sens. 2002, 23, 3595–3604. [Google Scholar] [CrossRef]
  38. Zhou, Y.C.; Lao, C.C.; Yang, Y.L.; Zhang, Z.T.; Chen, H.Y.; Chen, Y.W.; Chen, J.Y.; Ning, J.; Yang, N. Diagnosis of winter-wheat water stress based on UAV-borne multispectral image texture and vegetation indices. Agric. Water Manag. 2021, 256, 107076. [Google Scholar] [CrossRef]
  39. Osco, L.P.; Ramos, A.P.; Pereira, D.R.; Moriya, É.A.; Imai, N.N.; Matsubara, E.T.; Estrabis, N.; Souza, M.D.; Junior, J.M.; Gonçalves, W.N.; et al. Predicting canopy nitrogen content in citrus-trees using random forest algorithm associated to spectral vegetation indices from UAV-imagery. Remote Sens. 2019, 11, 2925. [Google Scholar]
  40. Rasmussen, J.; Ntakos, G.; Nielsen, J.; Svensgaard, J.; Poulsen, R.N.; Christensen, S. Are vegetation indices derived from consumer-grade cameras mounted on UAVs sufficiently reliable for assessing experimental plots? Eur. J. Agron. 2016, 74, 75–92. [Google Scholar] [CrossRef]
  41. Rouse, J.W. Monitoring the Vernal Advancement of Retrogradation (Green Wave Effect) of Natural Vegetation; NASA/GSFC Type III. Final Report; NASA/GSFC: Greenbelt, MD, USA, 1974; p. 371.
  42. Gitelson, A.A.; Kaufman, Y.J.; Merzlyak, M.N. Use of a green channel in remote sensing of global vegetation from EOS-MODIS. Remote Sens. Environ. 1996, 58, 289–298. [Google Scholar] [CrossRef]
  43. Rondeaux, G.; Baret, F.; Steven, M. Optimization of soil-adjusted vegetation indices. Remote Sens. Environ. 1996, 55, 95–107. [Google Scholar] [CrossRef]
  44. Gitelson, A.A.; Viña, A.; Ciganda, V.S.; Rundquist, D.; Arkebauer, T.J. Remote estimation of canopy content in crops. Geophys. Res. Lett. 2005, 32, L08403. [Google Scholar] [CrossRef]
  45. Erunova, M.; Pisman, T.I.; Shevyrnogov, A.P. The technology for detecting weeds in agricultural crops based on vegetation index VARI (PlanetScope). J. Sib. Fed. Univ. Eng. Technol. 2021, 14, 347–353. [Google Scholar] [CrossRef]
  46. Lamm, R.D.; Slaughter, D.C.; Giles, D.K. Precision weed control system for cotton. J. Electron. Packag. Trans. ASME 2002, 45, 231–238. [Google Scholar]
  47. Zhou, J.; Mou, H.; Zhou, J.; Ali, M.L.; Ye, H.; Chen, P.; Nguyen, H.T. Qualification of soybean responses to flooding stress using UAV-based imagery and deep learning. Plant Phenomics 2021, 2021, 9892570. [Google Scholar] [CrossRef]
  48. Aouat, S.; Ait-Hammi, I.; Hamouchene, I. A new approach for texture segmentation based on the Gray Level Co-occurrence Matrix. Multimed. Tools Appl. 2021, 80, 24027–24052. [Google Scholar] [CrossRef]
  49. Xia, Z.; Yang, J.; Wang, J.; Wang, S.; Liu, Y. Optimizing rice near-infrared models using fractional order savitzky–golay derivation (FOSGD) combined with competitive adaptive reweighted sampling (CARS). Appl. Spectrosc. 2020, 74, 417–426. [Google Scholar] [CrossRef]
  50. Rose, D.C.; Mair, J.F.; Garrahan, J.P. A reinforcement learning approach to rare trajectory sampling. New J. Phys. 2021, 23, 013013. [Google Scholar] [CrossRef]
  51. Jeung, M.; Baek, S.; Beom, J.; Cho, K.H.; Her, Y.; Yoon, K. Evaluation of random forest and regression tree methods for estimation of mass first flush ratio in urban catchments. J. Hydrol. 2019, 575, 1099–1110. [Google Scholar] [CrossRef]
  52. Fernández-Habas, J.; Cañada, M.C.; Moreno, A.M.G.; Leal-Murillo, J.R.; González-Dugo, M.P.; Oar, B.A.; Gómez-Giráldez, P.J.; Fernández-Rebollo, P. Estimating pasture quality of Mediterranean grasslands using hyperspectral narrow bands from field spectroscopy by random forest and pls regressions. Comput. Electron. Agric. 2022, 192, 106614. [Google Scholar] [CrossRef]
  53. Alabi, T.R.; Abebe, A.T.; Chigeza, G.; Fowobaje, K.R. Estimation of soybean grain yield from multispectral high-resolution UAV data with machine learning models in West Africa. Remote Sens. Appl. 2022, 27, 100782. [Google Scholar] [CrossRef]
  54. Wang, L.G.; Zheng, G.Q.; Guo, Y.; He, J.; Cheng, Y.Z. Prediction of winter wheat yield based on fusing multi-source spatio-temporal data. Trans. Chin. Soc. Agric. Mach. 2022, 53, 198–204, 458. (In Chinese) [Google Scholar]
  55. Guo, Y.; Ji, W.J.; Wu, H.H.; Shi, Z. Estimation and mapping of soil organic matter based on Vis-NIR reflectance spectroscopy. Spectrosc. Spect. Anal. 2013, 33, 1135–1140. [Google Scholar]
  56. Wang, J.D.; Chen, Y.Q. An Introduction to Transfer Learning; Publishing House of Electronics Industry: Beijing, China, 2022. [Google Scholar]
  57. Stow, D.; Nichol, C.J.; Wade, T.; Assmann, J.J.; Simpson, G.; Helfter, C. Illumination geometry and flying height influence surface reflectance and NDVI derived from multispectral UAS imagery. Drones 2019, 3, 55. [Google Scholar] [CrossRef] [Green Version]
  58. Geipel, J.; Link, J.; Claupein, W. Combined spectral and spatial modeling of corn yield based on aerial images and crop surface models acquired with an unmanned aircraft system. Remote Sens. 2014, 6, 10335–10355. [Google Scholar] [CrossRef]
  59. Awais, M.; Li, W.J.; Cheema, M.J.; Hussain, S.; Shaheen, A.; Aslam, B.; Liu, C.; Ali, A. Assessment of optimal flying height and timing using high-resolution unmanned aerial vehicle images in precision agriculture. Int. J. Environ. Sci. Technol. 2021, 19, 2703–2720. [Google Scholar] [CrossRef]
  60. Nguyen, T.H.; Langensiepen, M.; Gaiser, T.; Webber, H.; Ahrends, H.; Hueging, H.; Ewert, F. Winter wheat and maize under varying soil moisture: From leaf to canopy. In Proceedings of the EGU General Assembly 2021, Online, 19–30 April 2021. EGU21-11716. [Google Scholar]
  61. Mulugeta Aneley, G.; Haas, M.; Köhl, K. LIDAR-based phenotyping for drought response and drought tolerance in potato. Potato Res. 2022. [Google Scholar] [CrossRef]
  62. Lu, Y.L.; Li, S.K.; Bai, Y.L.; Xie, R.Z.; Gong, Y.M. Spectral red edge parametric variation and correlation analysis with N content in winter wheat. Remote Sens. Techn. Appl. 2007, 1, 1–7. (In Chinese) [Google Scholar]
  63. Li, Q.; Gao, M.F.; Zhao, L.L. Ground hyper-spectral remote-sensing monitoring of wheat water stress during different growing stages. Agronmy 2022, 12, 2267. [Google Scholar] [CrossRef]
  64. Sun, H.Y.; Zhang, X.Y.; Chen, S.Y.; Chen, S.L.; Sun, Z.S. Study on characters in winter wheat canopy structure under different soil water stress. J. Irrig. Drain. 2005, 24, 31–34. (In Chinese) [Google Scholar]
  65. Jiang, Q.; Xu, L.; Sun, S.; Wang, M.; Xiao, H. Retrieval model for total nitrogen concentration based on UAV hyper spectral remote sensing data and machine learning algorithms–A case study in the Miyun Reservoir, China. Ecol. Indic. 2021, 124, 107356. [Google Scholar]
  66. Liu, C.; Yang, G.J.; Li, Z.H.; Tang, F.Q.; Wang, J.W.; Zhang, C.L.; Zhang, L.Y. Estimation of winter wheat biomass based on spectral information and texture information of UAV. Sci. Agric. Sin. 2018, 51, 3060–3073. (In Chinese) [Google Scholar]
  67. Zhang, Y.; Ta, N.; Guo, S.; Chen, Q.; Zhao, L.; Li, F.; Chang, Q. Combining spectral and textural information from UAV RGB images for leaf area index monitoring in Kiwifruit Orchard. Remote Sens. 2022, 14, 1063. [Google Scholar] [CrossRef]
Figure 1. Study site and the spatial distribution of the experiment plot. W0: Rainfed; W1: Irrigated.
Drones 06 00299 g001
Figure 2. Flowchart of the transferability evaluation for plant nitrogen content.
Drones 06 00299 g002
Figure 3. Plots of CARS variable selection for the sensitive characteristics of nitrogen content in winter wheat plant. (a) The number of selected plant nitrogen content sensitive features changed as the number of iterations; (b) the RMSECV values changed as the number of iterations.
Drones 06 00299 g003
Figure 4. The scatterplots between the measured and predicted nitrogen values. (a) 0.01 m resolution; (b) 0.02 m resolution; (c) 0.05 m resolution.
Drones 06 00299 g004
Figure 5. One-way ANOVA of predictive nitrogen content in winter wheat plants from different resolution image features.
Drones 06 00299 g005
Figure 6. Transferring nitrogen prediction models constructed with 0.01 m resolution image features to 0.02 m (a) and 0.05 m (b) resolutions.
Drones 06 00299 g006
Figure 7. Transferring nitrogen prediction models constructed with 0.05 m resolution image features to 0.01 m (a) and 0.02 m (b) resolutions.
Drones 06 00299 g007
Figure 8. Pixel characteristics of 0.01 m (a), 0.02 m (b), 0.05 m (c) resolution images under W0 and W1 treatments.
Drones 06 00299 g008
Figure 9. Histogram of the optimized features at different resolutions.
Drones 06 00299 g009
Table 1. Statistics for the UAV images at different heights.
Flight Height (m)Image Spatial Resolution (m)Flying Time (s)Number of Images (Sheet)Pre-Processing (h)
300.015662356.3
600.02155953.4
1000.0555200.5
Table 2. Vegetation index and calculating formula.
Vegetation IndexFormulaReferences
Normalized Difference Vegetation Index, NDVI(RNir − RRed)/(RNir + RRed)[41]
Renormalized Difference Vegetation Index for Red, RDVI(RNir − RRed)(RNir + RRed)0.5[41]
Renormalized Difference Vegetation Index for Rededge, RERDVI(RNir − RRededge)/(RNir + RRededge)[42]
Normalized Blue–Green Band Difference Vegetation Index, GBNDVIRNir − (RGreen + RBlue) × RNir + (RGreen + RBlue)[42]
Chlorophyll Absorption Ratio Index, CARI(RRededge − RRed) − 0.2 × (RRededge + RRed)[43]
Normalized Blue–Green Difference Index, NGBDI(RBlue)/(RGreen + RBlue)[44]
Ratio Vegetation Index, RVIRNir/RRed[45]
Optimized Soil Adjusted Vegetation Index, OSAVI(RNir − RRed)/(RNir + RRed + 0.16)[43]
Excessive Green Index, EXG2RGreen − RRed − RBlue[46]
Table 3. Correlation analysis between spectral features of different image spatial resolutions and plant nitrogen content in winter wheat.
Vegetation IndexImage Spatial Resolution (m)
0.010.020.05
B−0.82 **−0.79 **−0.75 **
G−0.81 **−0.80 **−0.77 **
R−0.83 **−0.81 **−0.79 **
Rededge−0.39 **−0.47 **−0.42 **
Nir0.95 **0.92 *0.94 **
NDVI0.80 **0.77 **0.82 **
RDVI0.85 **0.81 **0.87 **
RERDVI0.80 **0.79 **0.82 **
GBNDVI0.81 **0.78 **0.83 **
CARI0.69 **0.58 *0.65 **
NGBDI0.47 **−0.38 *−0.48 *
RVI0.76 **0.76 **0.78 **
OSAVI0.82 **0.79 **0.85 **
EXG−0.59 **−0.65 **−0.66 **
Note: ** represents significance at p < 0.01 level and * represents significance at p < 0.05 level.
Table 4. Correlation analysis between texture features of different image spatial resolutions and plant nitrogen content in winter wheat.
Image Spatial Resolution (m)BandMeanConSmVarCorDisHomEnt
0.01B0.35 **−0.59 **0.51 **−0.10 *0.17 *−0.56 **0.61 **−0.20 *
G0.22 **−0.35 *−0.34 *−0.07−0.48 **0.11 *0.27 *0.39 **
R0.12 **−0.77 **0.72 **−0.62 **0.15 *−0.48 **0.71 **−0.39 *
Rededge0.44 **0.23 *0.43 **0.20 **0.24 **0.42 **0.18 **0.52 **
Nir0.87 **0.71 *0.41 **0.71 *0.43 *0.73 *0.55 **0.61 **
0.02B0.38 **−0.54 **0.49 *0.13 *0.11 *−0.41 *0.54 **−0.21 *
G0.18 **−0.33 *−0.26 *−0.31 *−0.45 **−0.010.40 *0.24 *
R0.19 **−0.69 **0.77 **−0.75 **0.23 *−0.54 **0.72 **−0.54 *
Rededge0.43 **−0.08 *0.58 **−0.37 *−0.10 *0.05 *0.52 **0.32 **
Nir0.87 **0.32 **0.49 *0.30 *0.21 *0.36 *0.47 **0.52 *
0.05B0.41 **−0.56 **0.50 *0.33 *0.13 *−0.36 *0.53 *−0.16 *
G0.22 **−0.33 *0.05 *−0.40 *−0.40 **−0.34 *0.55 *−0.04 *
R0.19 **−0.66 **0.65 **−0.71 *0.31 *−0.51 **0.76 **−0.47 *
Rededge0.42 **−0.41 *0.63 **−0.58 **−0.02−0.34 **0.73 **0.17 *
Nir0.86 **−0.13 *0.56 **−0.16 *0.30 *−0.15 *0.68 **0.45 **
Note: ** represents significance at p < 0.01 level and * represents significance at p < 0.05 level.
Publisher’s Note: MDPI stays neutral with regard to jurisdictional claims in published maps and institutional affiliations.

