Proposal to Standardize Fatigue Delamination Growth Tests Using Double Cantilever Beam Specimens without Fibre Bridging †

Aerospace Structures and Materials Department, Faculty of Aerospace Engineering, Delft University of Technology, Delft 2629HS, The Netherlands
†
Presented at the 18th International Conference on Experimental Mechanics, Brussels, Belgium, 1–5 July 2018.
Proceedings 2018, 2(8), 385; https://doi.org/10.3390/ICEM18-05194
Published: 9 May 2018
(This article belongs to the Proceedings of The 18th International Conference on Experimental Mechanics)
Abstract
:Up until today, mode-I fatigue delamination testing has not been standardized, because no consensus exists on best practices to reduce the observed scatter in data, and on the proper parameter describing similitude. A dominant contributor to the scatter seems the fibre bridging observed in the tests. This paper proposes a straightforward experimental and analysis approach to derive zero-bridging delamination resistance curves from each tested specimen without requiring a theoretical model.
1. Introduction
Although quasi-static fracture toughness tests have been standardized for various opening modes [1,2,3], no agreement exists yet on a standard to correctly obtain fatigue delamination data. Most researchers adopt specimen geometries defined in standardized fracture toughness tests. However, no consensus exists on the proper parameters for similitude [4,5,6,7]. Aside from various factors causing scatter in the data, the most dominant reason for the absence of a test standard seems the observed fibre bridging. Where fibre bridging is rarely observed in practice, it is a dominant phenomenon shielding the delamination tip in laboratory tests, resulting in unconservative data [8].
To come to data excluding this bridging contribution, various methods and approaches have been proposed in literature [9,10,11]. Most of these approaches require a theoretical model for bridging, or numerical simulations, to rework data to zero-bridging delamination resistance curves. The objection to these approaches is that because data depends on the adopted models, it cannot or should not be treated as experimental data. Therefore, this paper proposes an alternative approach that allows to derive the zero-bridging curves straightforwardly from fatigue delamination tests without requiring a model. The procedure is explained and illustrated with fatigue delamination data obtained from double cantilever beam tests at R = 0.1 [12,13], to show how this approach could be standardized unambiguously.
2. Problem Statement
Fibre bridging is a mechanism where, as result of fibre ‘nesting’, fibres my remain connected to both fracture surfaces of a double cantilever beam specimen effectively provide a load path over the delamination in the crack tip wake. This load path reduces the stress intensity, or strain energy density, at the crack tip, for which reason it is often referred to as crack shielding mechanism.
The influence of fibre bridging on the delamination resistance curve is first of all introduced via the initial crack length. A little variation of few millimetres in the initial crack length changes the position of the curves. Multiple curves generated with a variation in initial crack length, therefore appear to exhibit apparent scatter, see Figure 1.
This scatter obviously is unwanted, but it seems not easily eliminated. As the length of delamination increases, the amount of fibre bridging increases. This becomes apparent with the shift of delamination resistance curves to the right in Figure 1. However, because the crack length increases throughout the test, this also means that the slope of the curve is affected; without fibre bridging the slope of the curve would be less steep. In particular towards lower crack growth rates, this means the curve is unconservative for practical cases where bridging does not occur.
3. Proposed Experimental Procedure
The trend in Figure 1, can also be generated with a single specimen. After a test is terminated when very slow crack growth or even retardation is achieved, a new pre-crack could be created and the loads could be increased to repeat the test on the same specimen. Depending on specimen dimensions, this procedure can be repeated multiple times, as illustrated in Figure 2.
Through each of the curves in Figure 2, one can fit a standard Paris relationship between the measured delamination growth and the preferred similitude parameter. For the similitude parameter Δ√G this relationship is then given by
With these relationships one can subsequently establish a mean value of Δ√G for a selected value of the crack growth rate da/dN. The procedure for determining the mean value and the standard deviation is similar to what is common practice in establishing S-N curves. Along the slope defined by the exponent n in Equation (1) all data points can be translated to the desired level of da/dN following
in which Δ√GT is the value of each data point after translation. Hence, for each curve in Figure 2, the statistical distribution can be obtained. A simple method of doing so, is to reorder the values for Δ√G from low to high, and to assign a probability Pf following [13]
in which n is the rank number and ntot the total amount of data points per curve. With this procedure cumulative density functions can be plotted as illustrated in Figure 3.
What becomes apparent from Figure 2 is that the influence of fibre bridging can be expressed as influence of the effective crack length (a − a0). Hence, the strain energy release rate Δ√G is a function of the crack length and crack growth rate, i.e., Δ√G = f(a − a0, da/dN). This relationship can be obtained by regression through the data. Linear regression will not work, because of the power law relationship between Δ√G and da/dN (Equation (1)), and the non-linear relationship between Δ√G and (a − a0) [15,16]. The best surface fit through the data is obtained following the relation
The theoretical trend line at (a − a0) = 0, i.e., the trend line at zero fibre bridging, is obtained by reducing Equation (4) by setting (a − a0) = 0. Translating all data using Equation (4) while preserving the original scatter can be achieved by maintaining the relative error between each data point and its corresponding position on the surface fit, when translating it to (a − a0) = 0. Applying this translation for the data in Figure 2, results in the delamination resistance curve given in Figure 4.
Several observations can be made in Figure 4. First, the scatter and the distribution is greater than in the individual curves. This is however similar to what is obtained when performing multiple delamination growth tests and combining all individual curves together. The other more important observation relates to the slope of the curve. As mentioned before, the fibre bridging relates to the crack length, which increases throughout a test. Hence the crack length at high da/dN is smaller compared to the low da/dN data, which means that the shielding at small crack growth rates is greater. The presented procedure here eliminates this shielding contribution, yielding a curve with lower slope.
To illustrate the reproducibility of the above described methodology the translated curve is compared to a curve obtained from another specimen, where seven respective curves were obtained, and fitted to Equation (4) to generate the zero-bridging curve, see Figure 5.
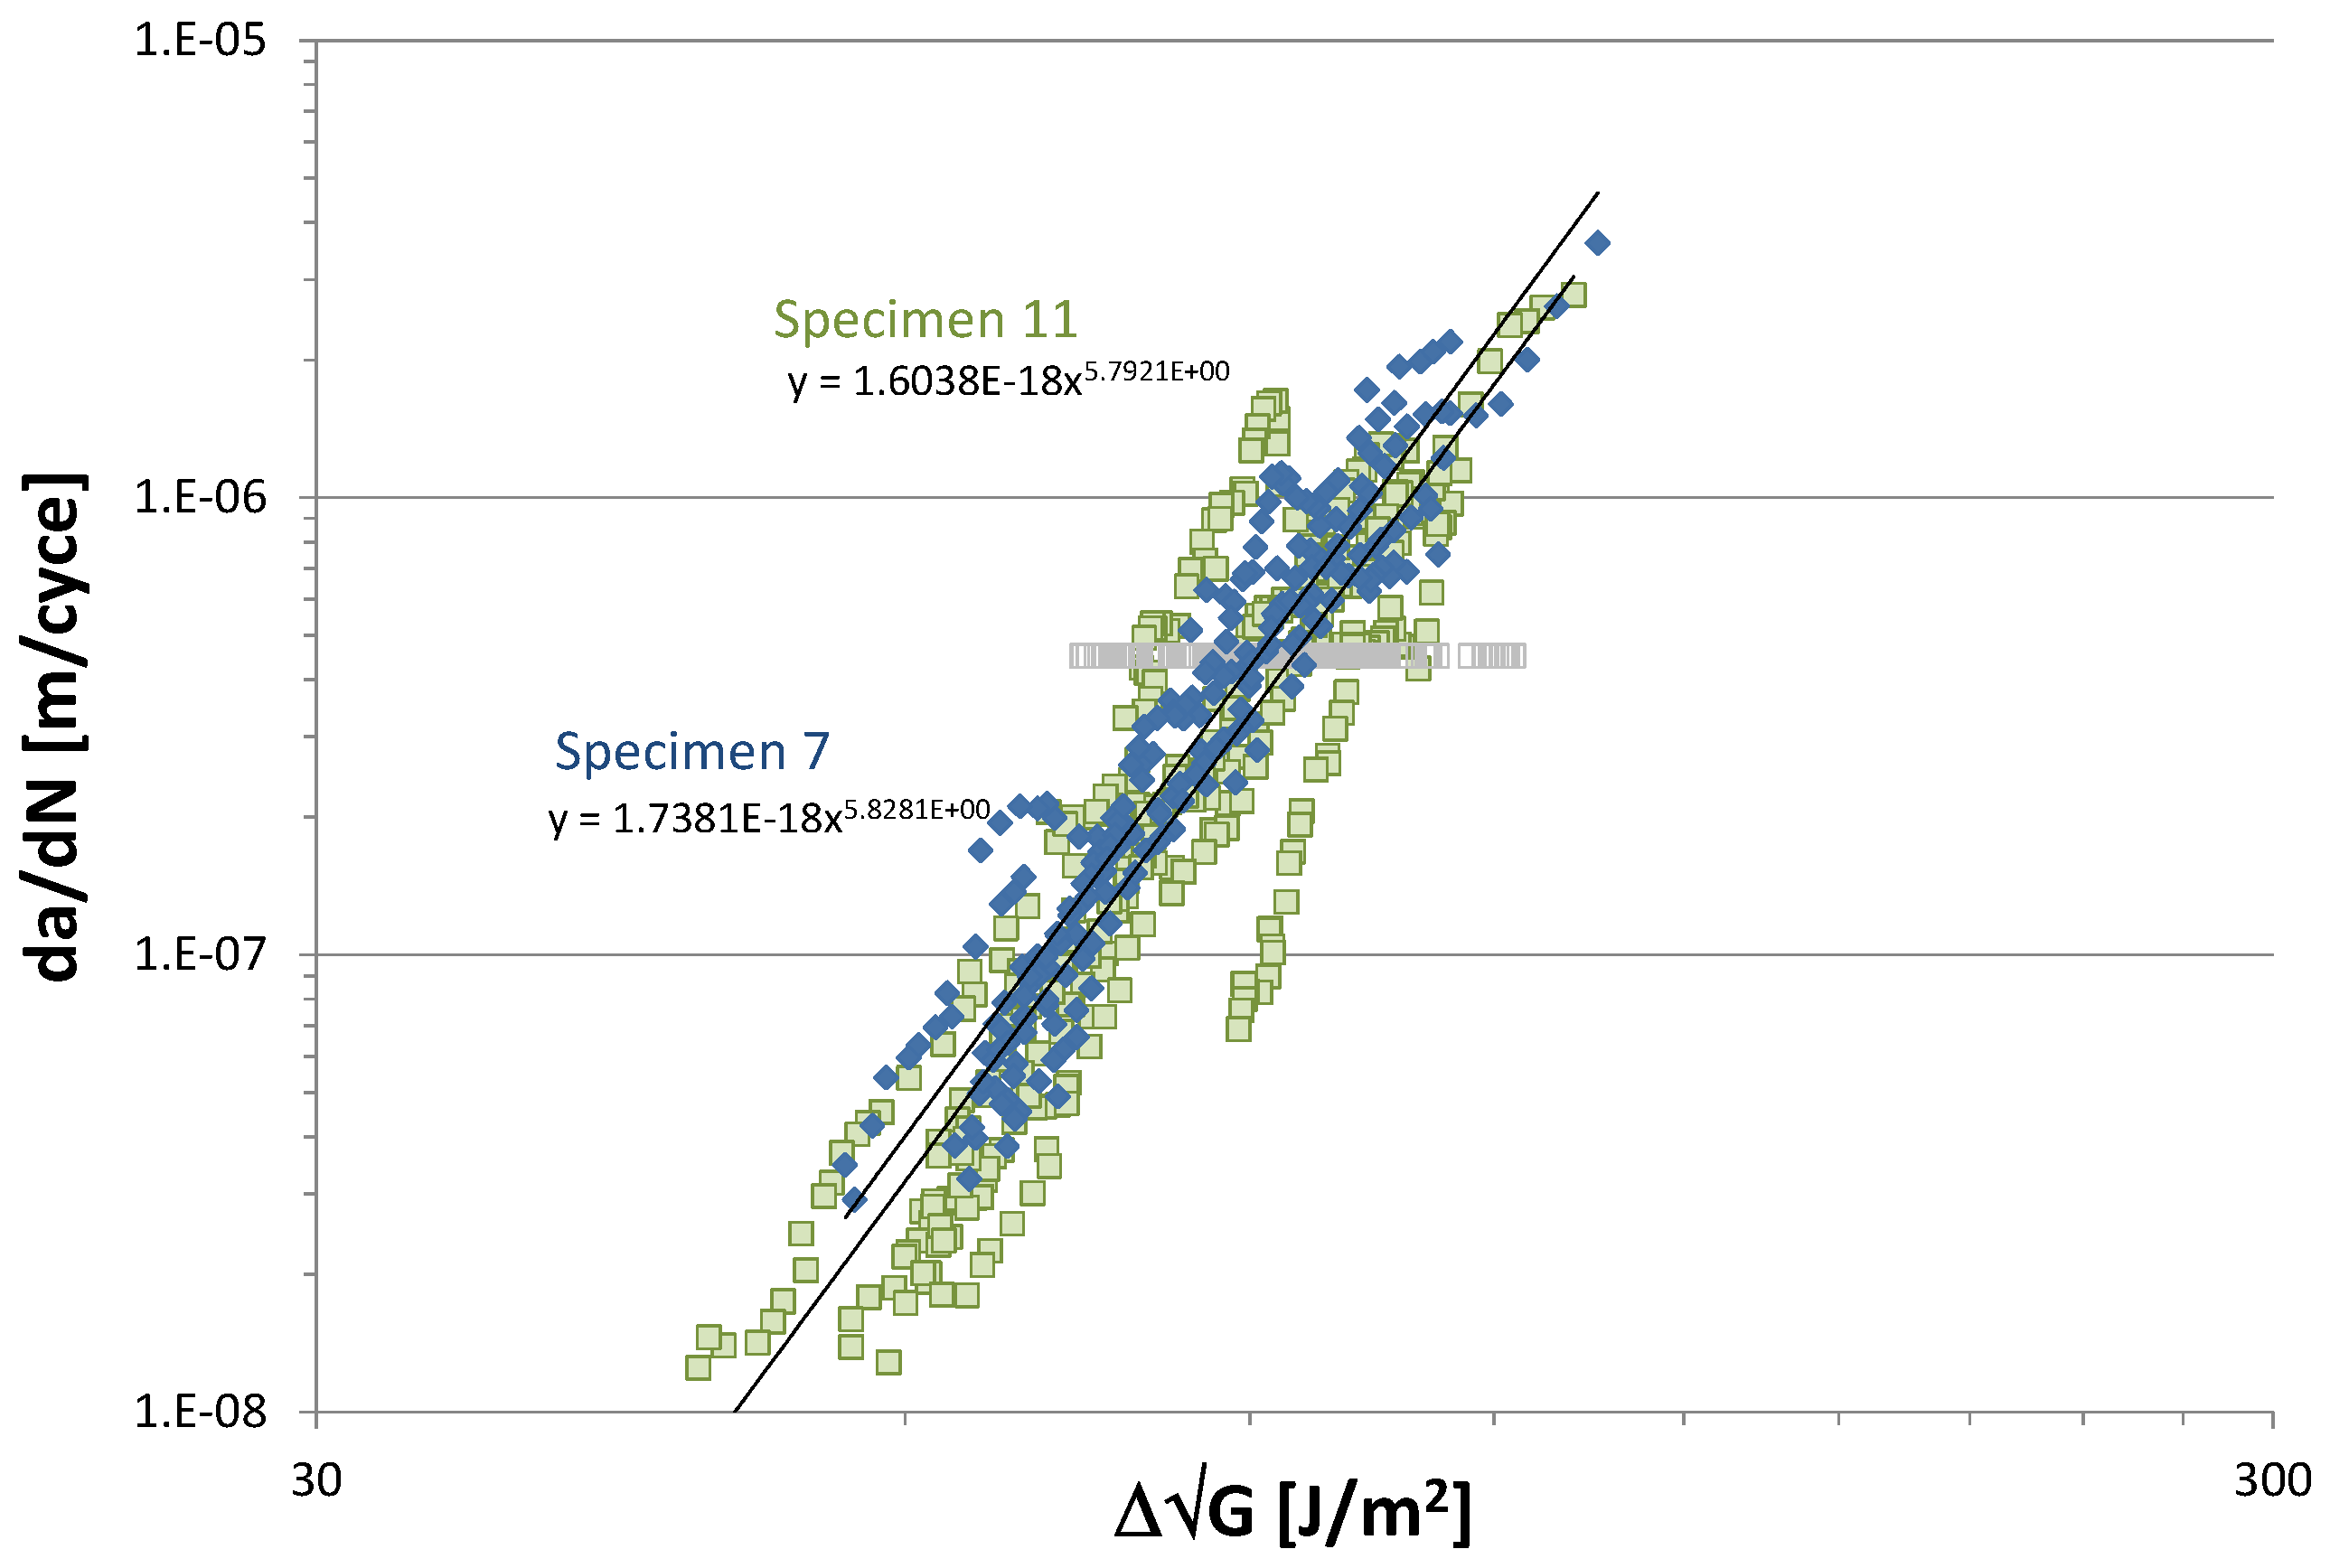
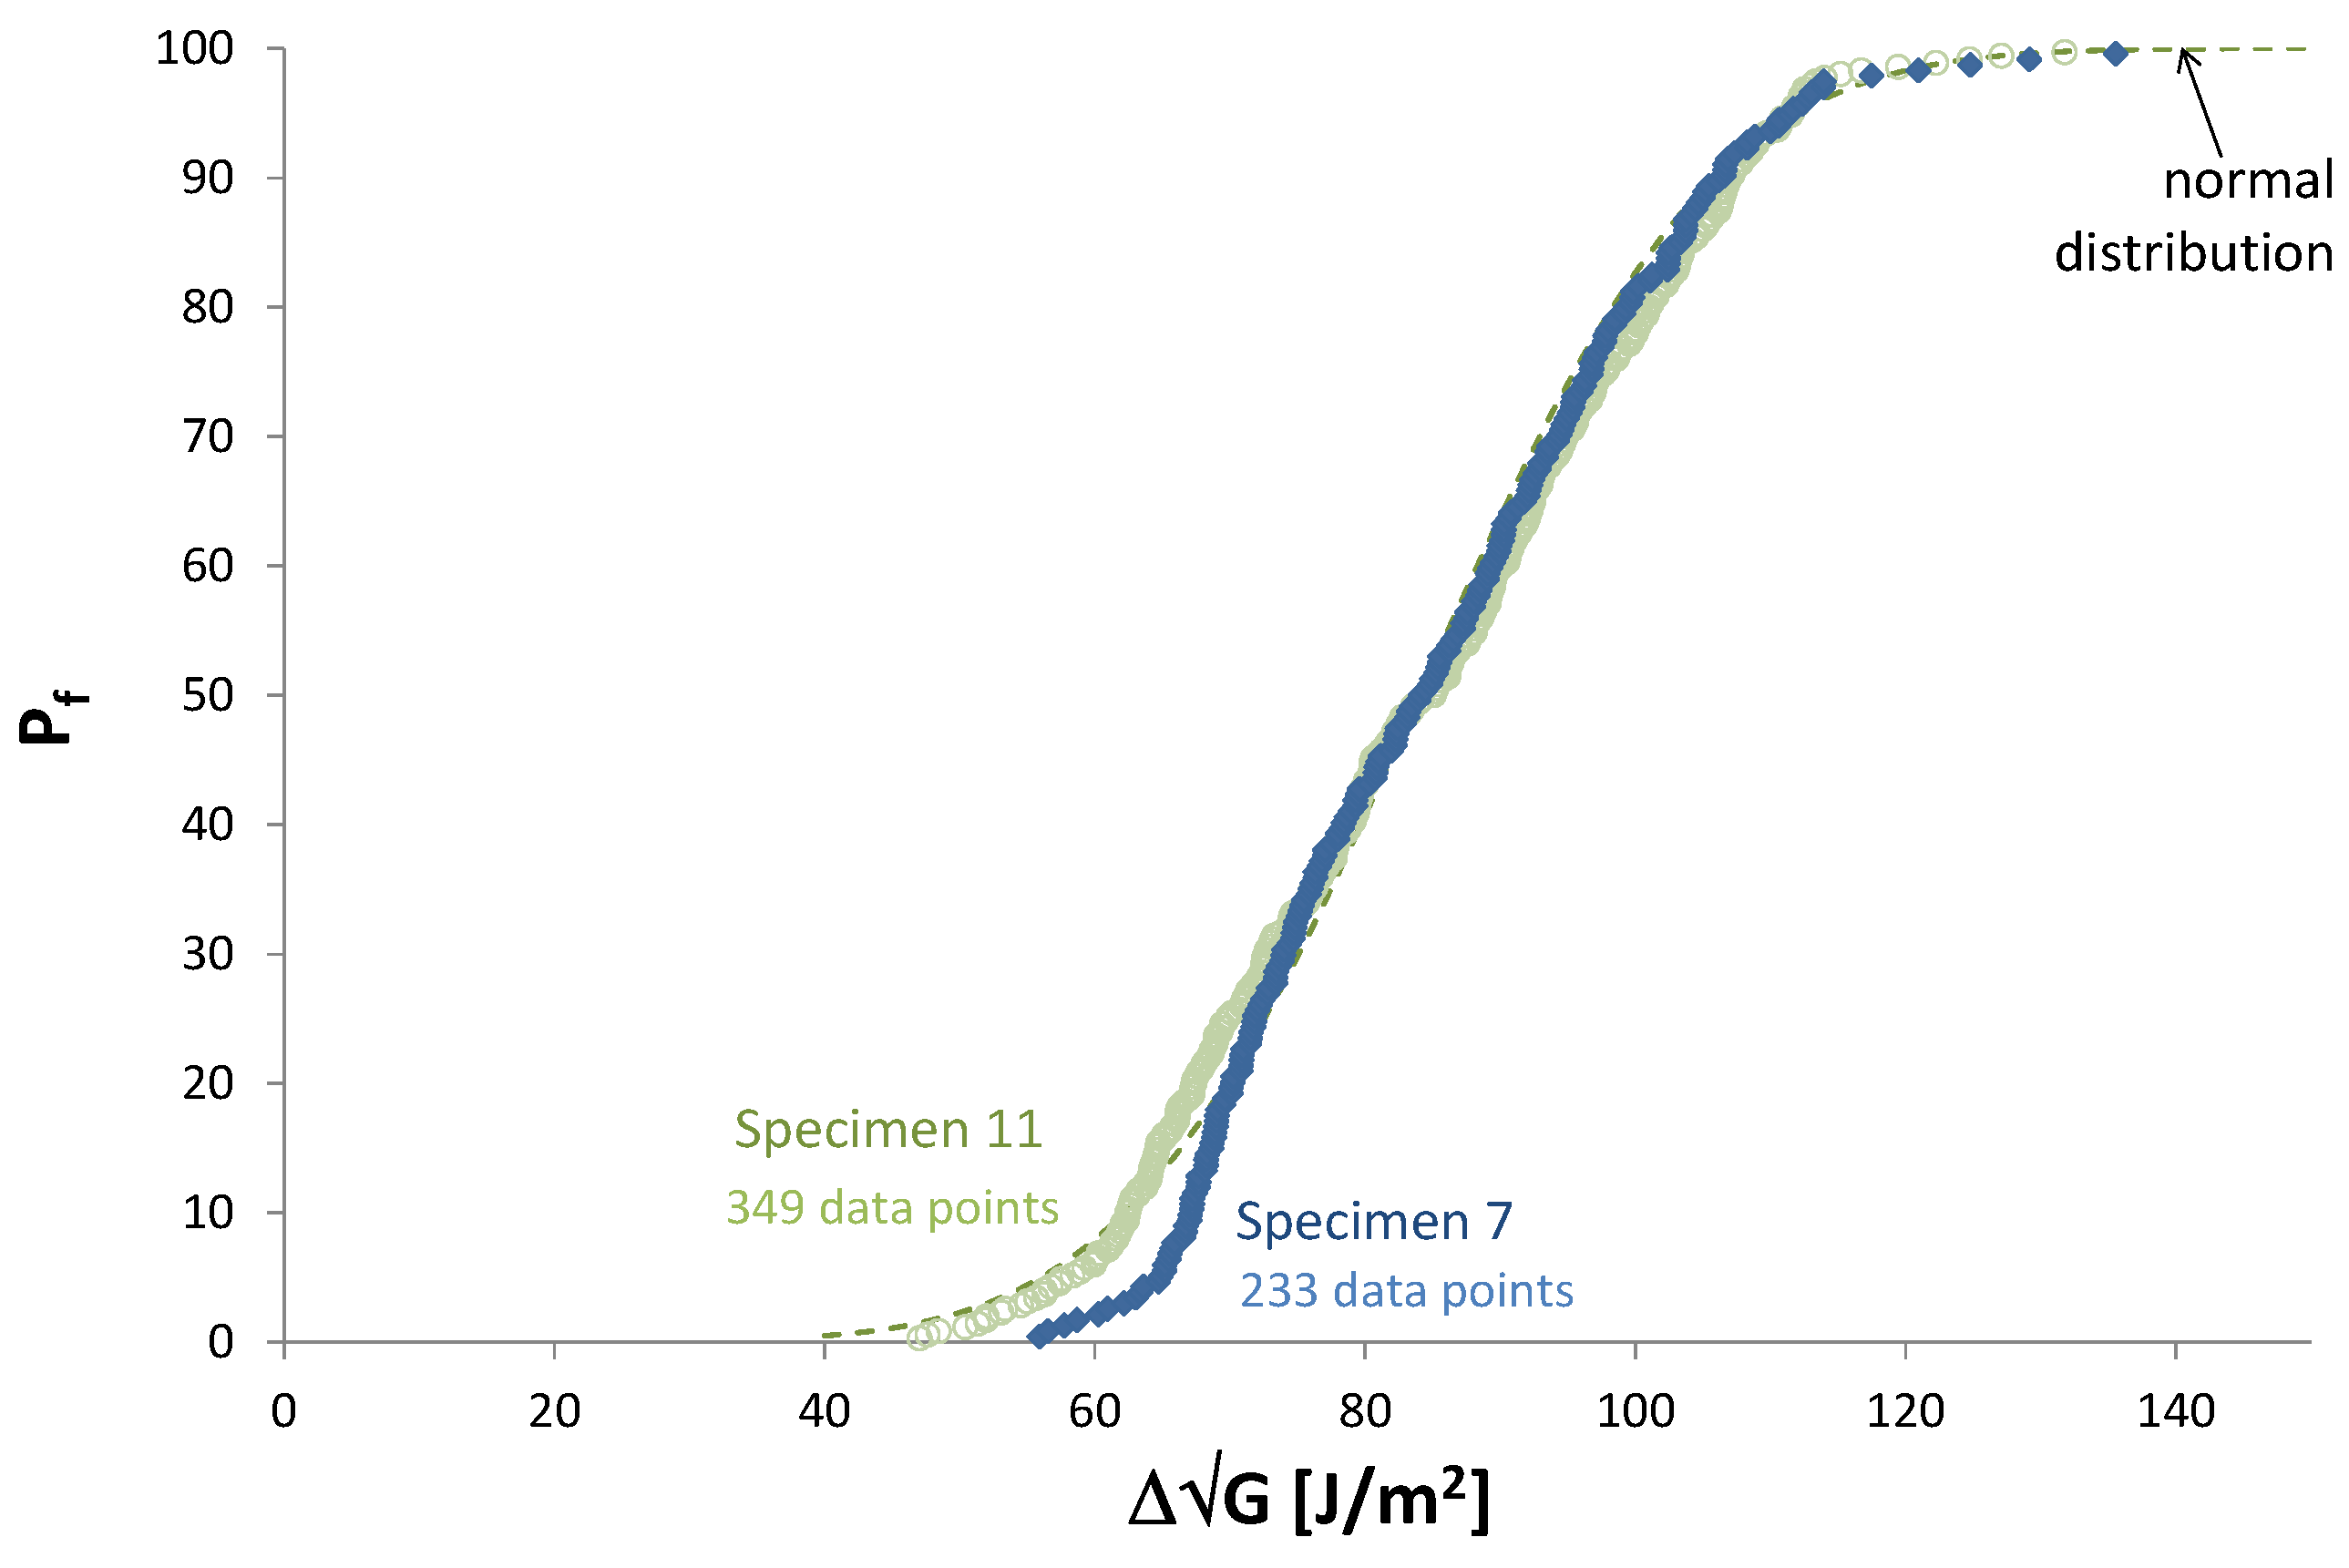
Both zero-bridging curves are compared in Figure 6, illustrating the excellent correlation between the two average curves. Only little variation between the constants and exponents is observed. The scatter associated to both curves is illustrated in Figure 7 through the cumulative density function. Again, excellent correlation is obtained.
4. Conclusions
The proposed methodology to evaluate fatigue delamination growth constitutes two major differences compared to current practice: Firstly, per specimen multiple delamination resistance curves are generated by repeating the delamination procedure each time after retardation is achieved. Secondly, per specimen the data is fitted to a surface given by Equation (4), after which all data is translated to (a − a0) = 0. This results in zero-bridging curves comprising substantially more data per specimen, that maintain all scatter associated to various sources except fibre bridging. These curves can be statistically correlated subsequently to curves obtained from other specimen.
Acknowledgments
For this paper, the author analysed the data from [13], generated by Liaojun Yao, under the author’s supervision in the period of 2012–2015. The author is thankful for the many discussions on the subject and on the interpretation of results. These discussions are greatly appreciated.
Conflicts of Interest
The author declares no conflict of interest.
References
- American Society for Testing and Materials. Standard Test Method for Mode I Interlaminar Fracture Toughness of Unidirectional Fiber-Reinforced Polymer Matrix Composites; ASTM D5528-01; ASTM: West Conshohocken, PA, USA, 1994. [Google Scholar]
- International Organization for Standardization. Fibre-Reinforced Plastic Composites—Determination of Mode I Interlaminar Fracture Toughness, GIC, for Unidirectionally Reinforced Materials; ISO 15024; ISO: Geneva, Switzerland, 2001. [Google Scholar]
- American Society for Testing and Materials. Standard Test Method for Determination of the Mode II Interlaminar Fracture Toughness of Unidirectional Fiber-Reinforced Polymer Matrix Composites; ASTM D7905-14; ASTM: West Conshohocken, PA, USA, 2014. [Google Scholar]
- Jones, R.; Kinloch, A.J.; Hu, W. Cyclic-fatigue crack growth in composite and adhesively-bonded structures: The FAA slow crack growth approach to certification and the problem of similitude. Int. J. Fatigue 2016, 88, 10–18. [Google Scholar] [CrossRef]
- Rans, C.D.; Alderliesten, R.C.; Benedictus, R. Misinterpreting the results: How similitude can improve our understanding of fatigue delamination growth. Compos. Sci. Technol. 2011, 71, 230–238. [Google Scholar]
- Alderliesten, R.C. How proper similitude can improve our understanding of crack closure and plasticity in fatigue. Int. J. Fatigue 2016, 82, 263–273. [Google Scholar] [CrossRef]
- Cano, A.J.; Salazar, J.A. Rodriguez, Evaluation of different crack driving forces for describing the fatigue crack growth behaviour of PET-G. Int. J. Fatigue 2018, 107, 27–32. [Google Scholar] [CrossRef]
- Jones, R.; Kinloch, A.J.; Yao, L.; Alderliesten, R.C. Delamination Fatigue Growth in Polymer-Matrix Fibre Composites: A Methodology for Determining the Design and Lifing Allowables. Compos. Struct. 2018. under review. [Google Scholar]
- Sørensen, B.F.; Jacobsen, T.K. Large-scale bridging in composite: R-curves and bridging laws. Compos. Part A 1998, 29, 1443–1451. [Google Scholar] [CrossRef]
- Jacobsen, T.K.; Sørensen, B.F. Mode I intra-laminar crack growth in composites-modelling of R-curves from measured bridging laws. Compos. Part A 2001, 32, 1–11. [Google Scholar] [CrossRef]
- Gregory, J.R.; Spearing, S.M. A fibre bridging model for fatigue delamination in composite materials. Acta Mater. 2004, 52, 5493–5502. [Google Scholar] [CrossRef]
- Yao, L.; Alderliesten, R.C.; Zhao, M.; Benedictus, R. Discussion on the use of the strain energy release rate for fatigue delamination characterization. Compos. Part A 2014, 66, 65–72. [Google Scholar] [CrossRef]
- Yao, L.; Alderliesten, R.C. Mode I Fatigue Delamination Growth in Composite Laminates with Fibre Bridging–Datasets, Collection of Datasets; TU Delft: Delft, The Netherlands, 2014. [Google Scholar]
- Van Lipzig, H. Spreiding bij Vermoeiing en Levensduur, Hoofdstuk 12 PAO cursus Vermoeiing van Constructies, PAO Techniek en Management, Delft. Available online: https://paotm.nl/nl/cursus/vermoeiing-van-constructies/?interest=431 (accessed on 24 May 2018). (in Dutch).
- Yao, L.; Alderliesten, R.C.; Zhao, M.; Benedictus, R. Bridging effect on mode I fatigue delamination behavior in composite laminates. Compos. Part A 2014 63, 101–109. [CrossRef]
- Yao, L.; Alderliesten, R.C.; Benedictus, R. The effect of fibre bridging on the Paris relation for mode I fatigue delamination growth in composites. Compos. Struct. 2016, 140, 125–135. [Google Scholar] [CrossRef]
Figure 1.
Delamination resistance curves obtained from specimens 1, 2, 4, 7 and 11 (R = 0.1) [13] illustrating the influence of the initial crack length on the location of the curve.
Figure 1.
Delamination resistance curves obtained from specimens 1, 2, 4, 7 and 11 (R = 0.1) [13] illustrating the influence of the initial crack length on the location of the curve.
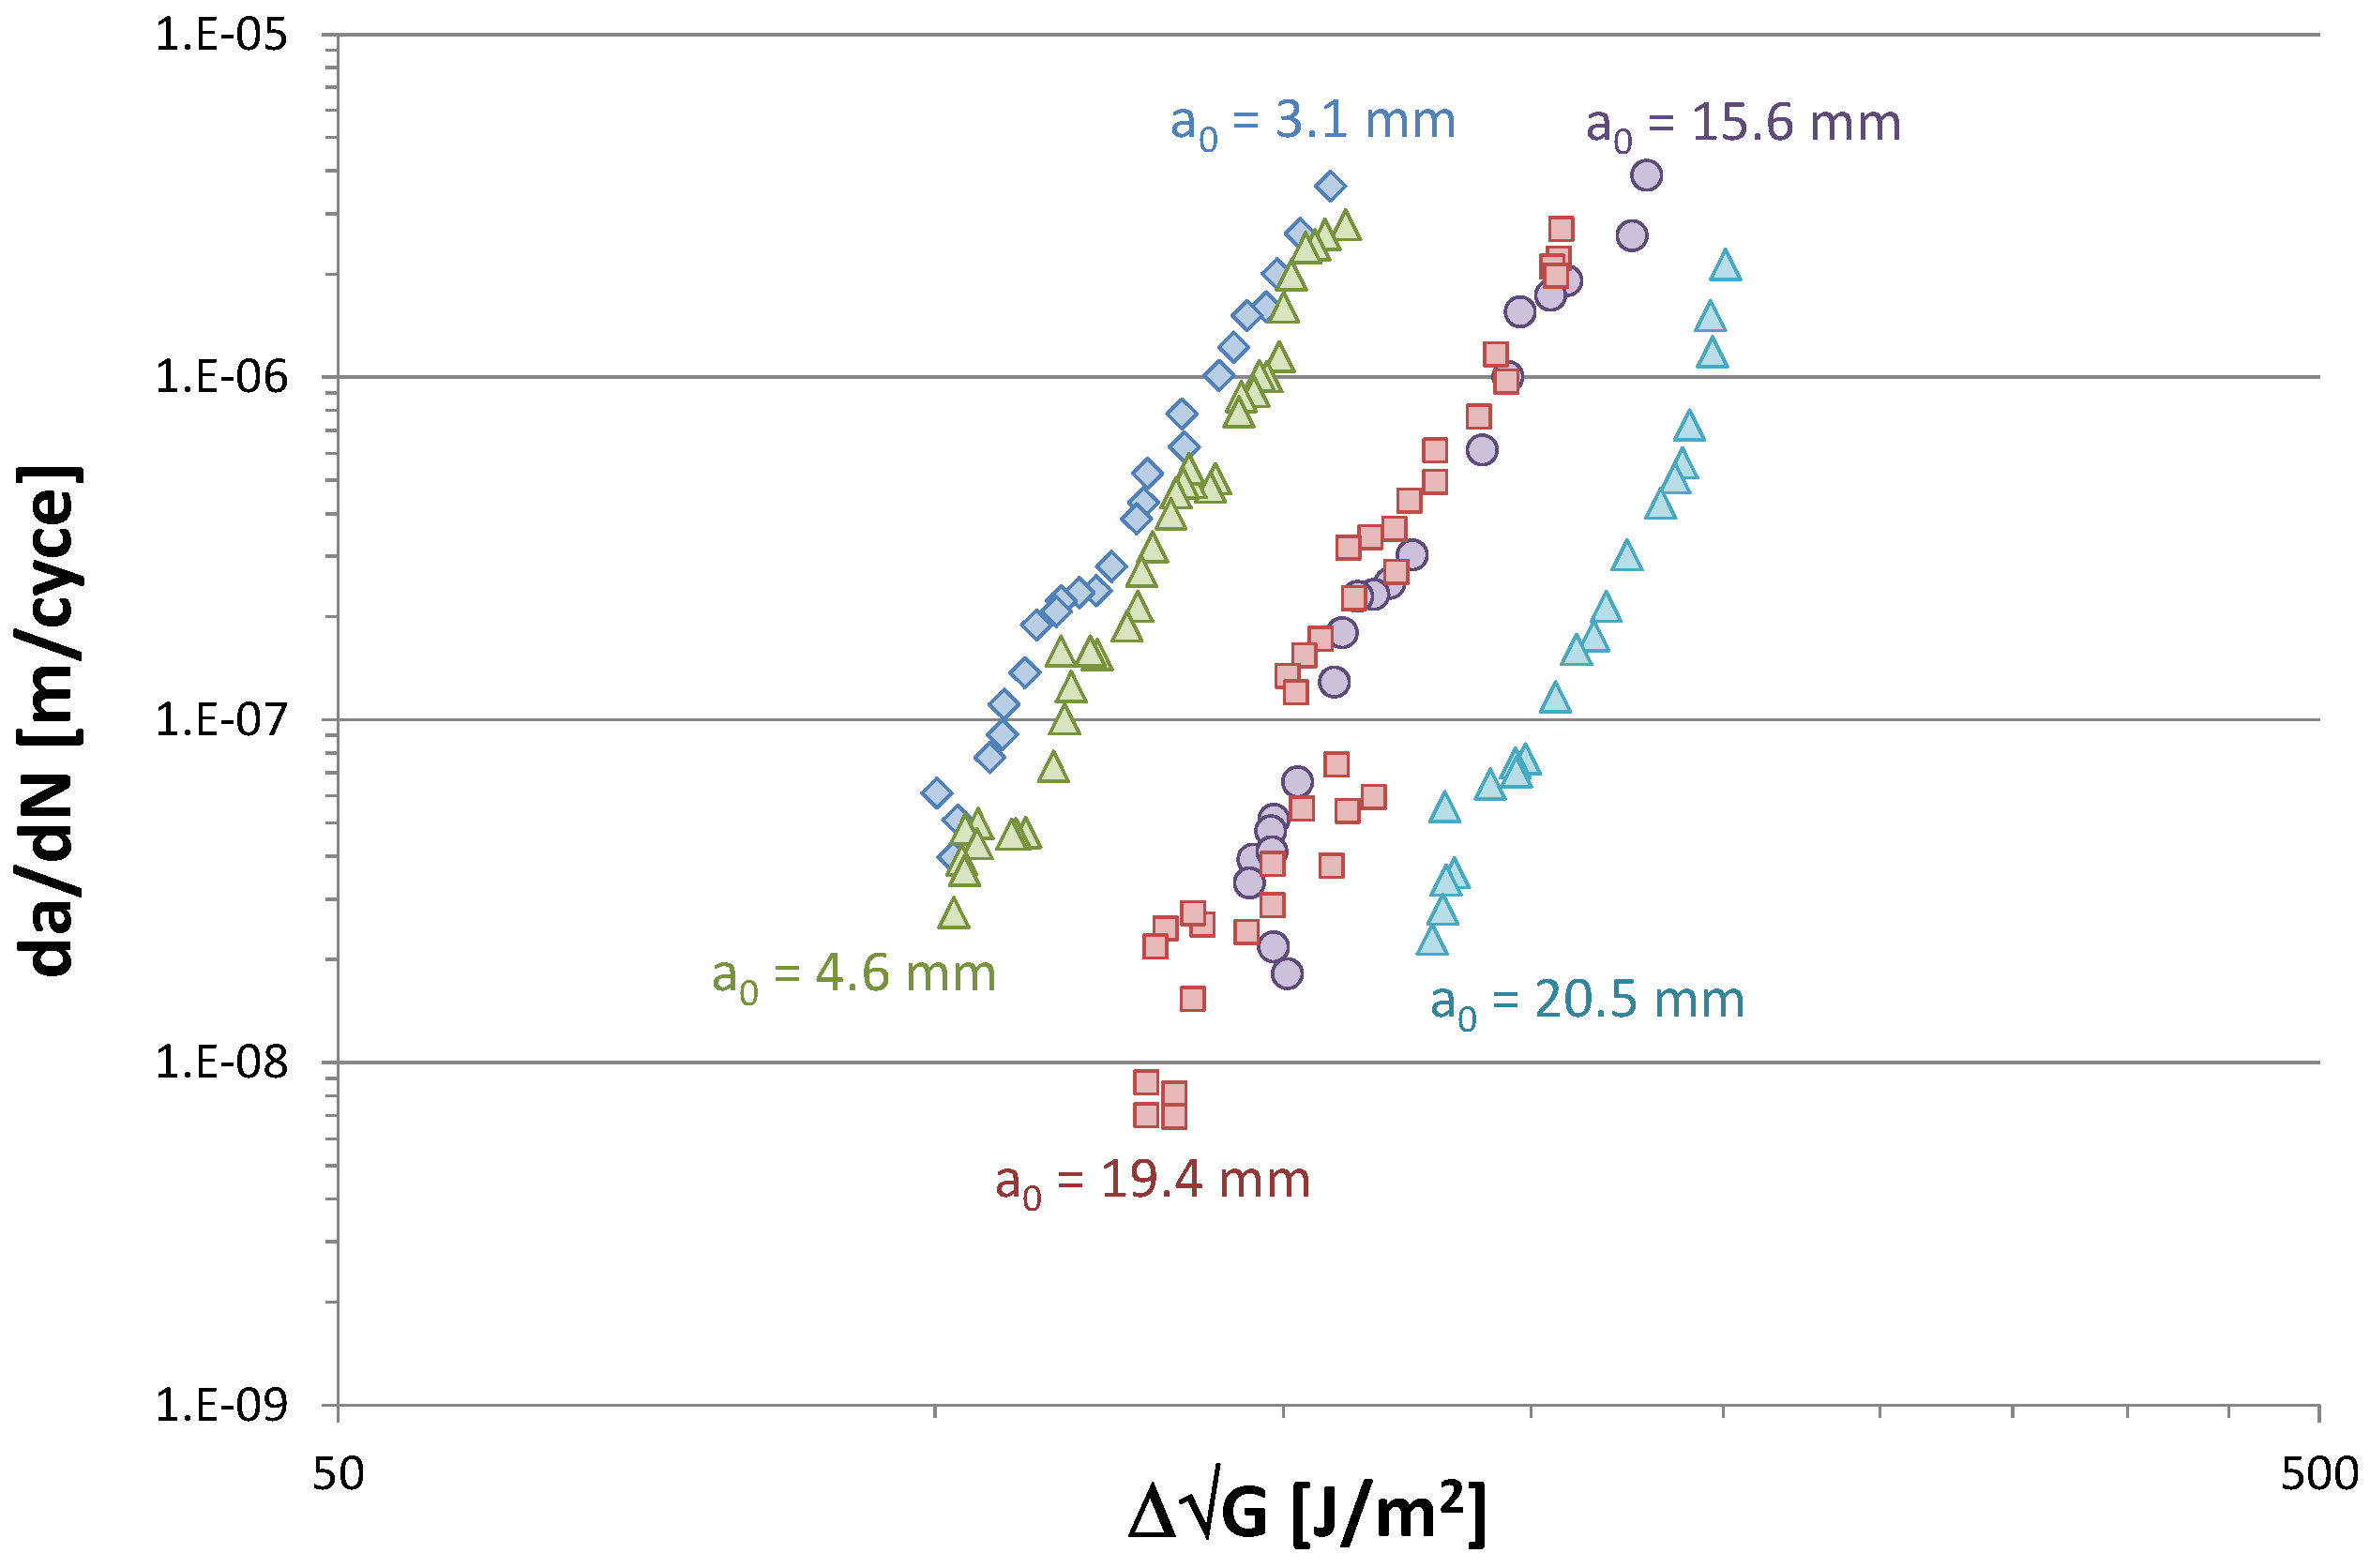
Figure 2.
Delamination resistance curves obtained from specimen 7 [13] illustrating the influence of the initial crack length on the location of the curve.
Figure 2.
Delamination resistance curves obtained from specimen 7 [13] illustrating the influence of the initial crack length on the location of the curve.
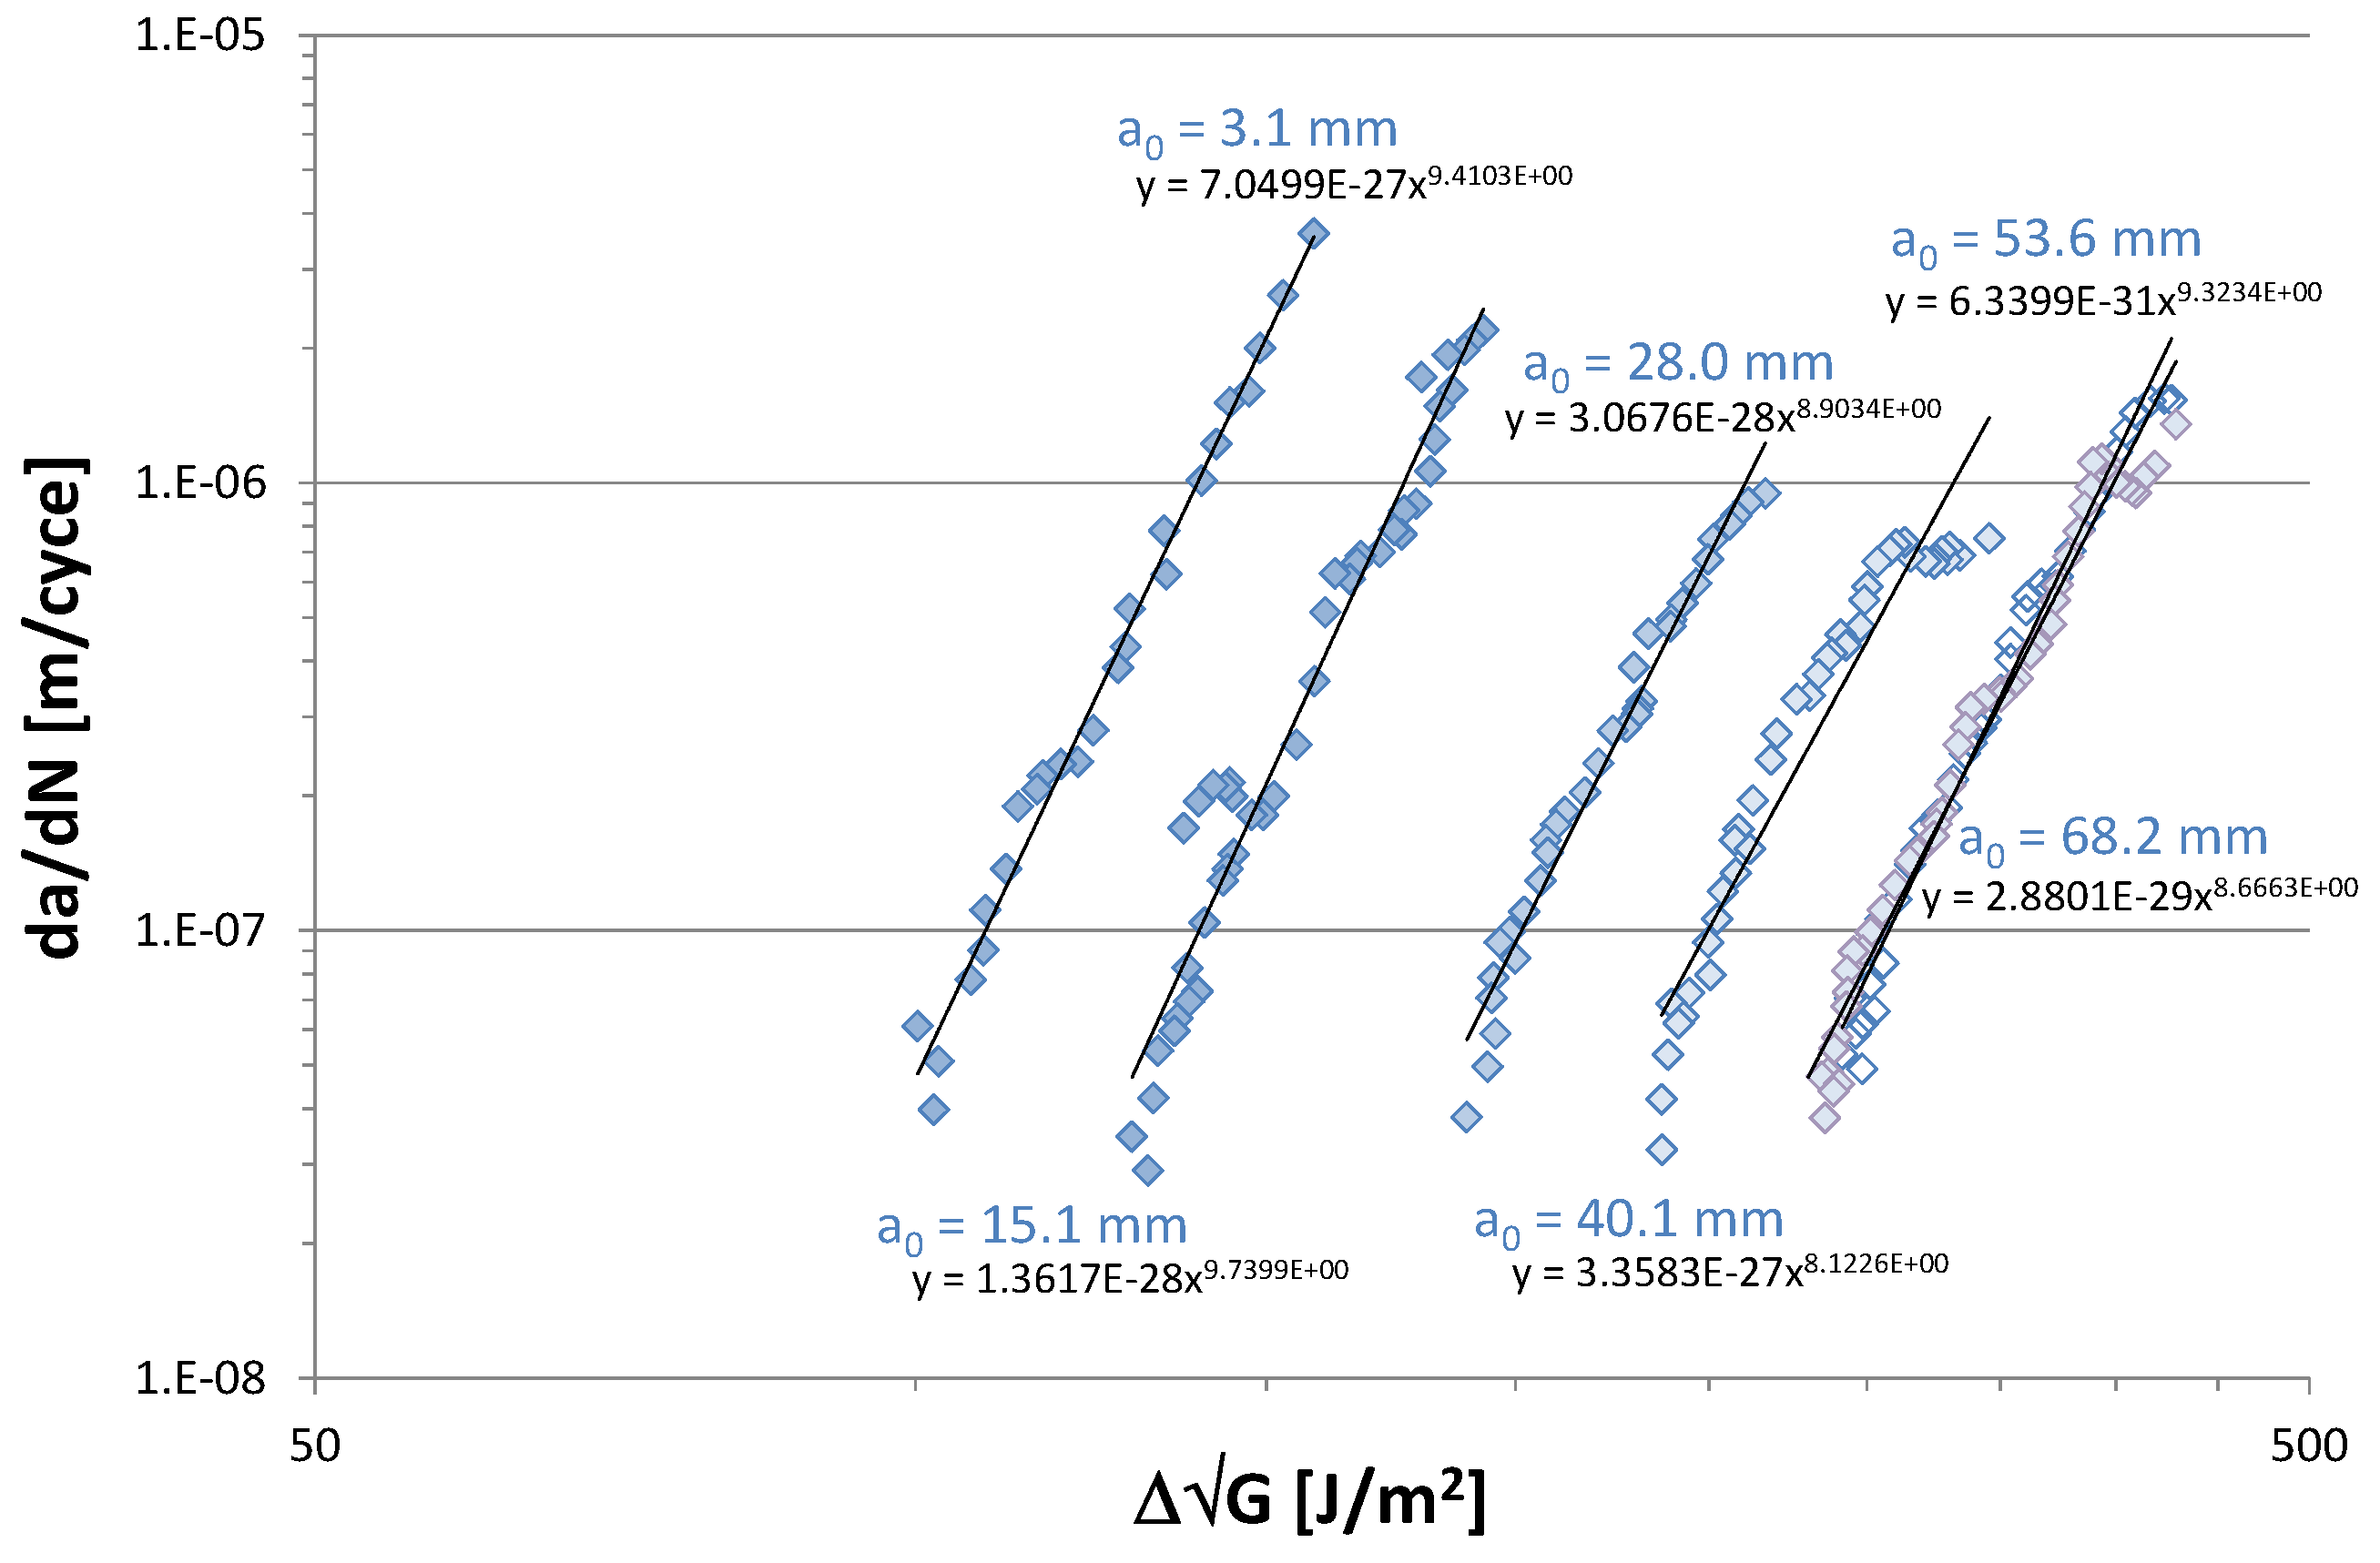
Figure 3.
Cumulative density function at da/dN = 4.5 × 10⁻⁷ for the delamination resistance curves from specimen 7 [13] illustrated in Figure 2.

Figure 4.
Zero-bridging delamination resistance curve obtained from specimen 7 [13] after translating all curves from Figure 2 to (a − a0) = 0. Grey data points at da/dN = 4.5 × 10⁻⁷ m/cycle indicate scatter band per curve.
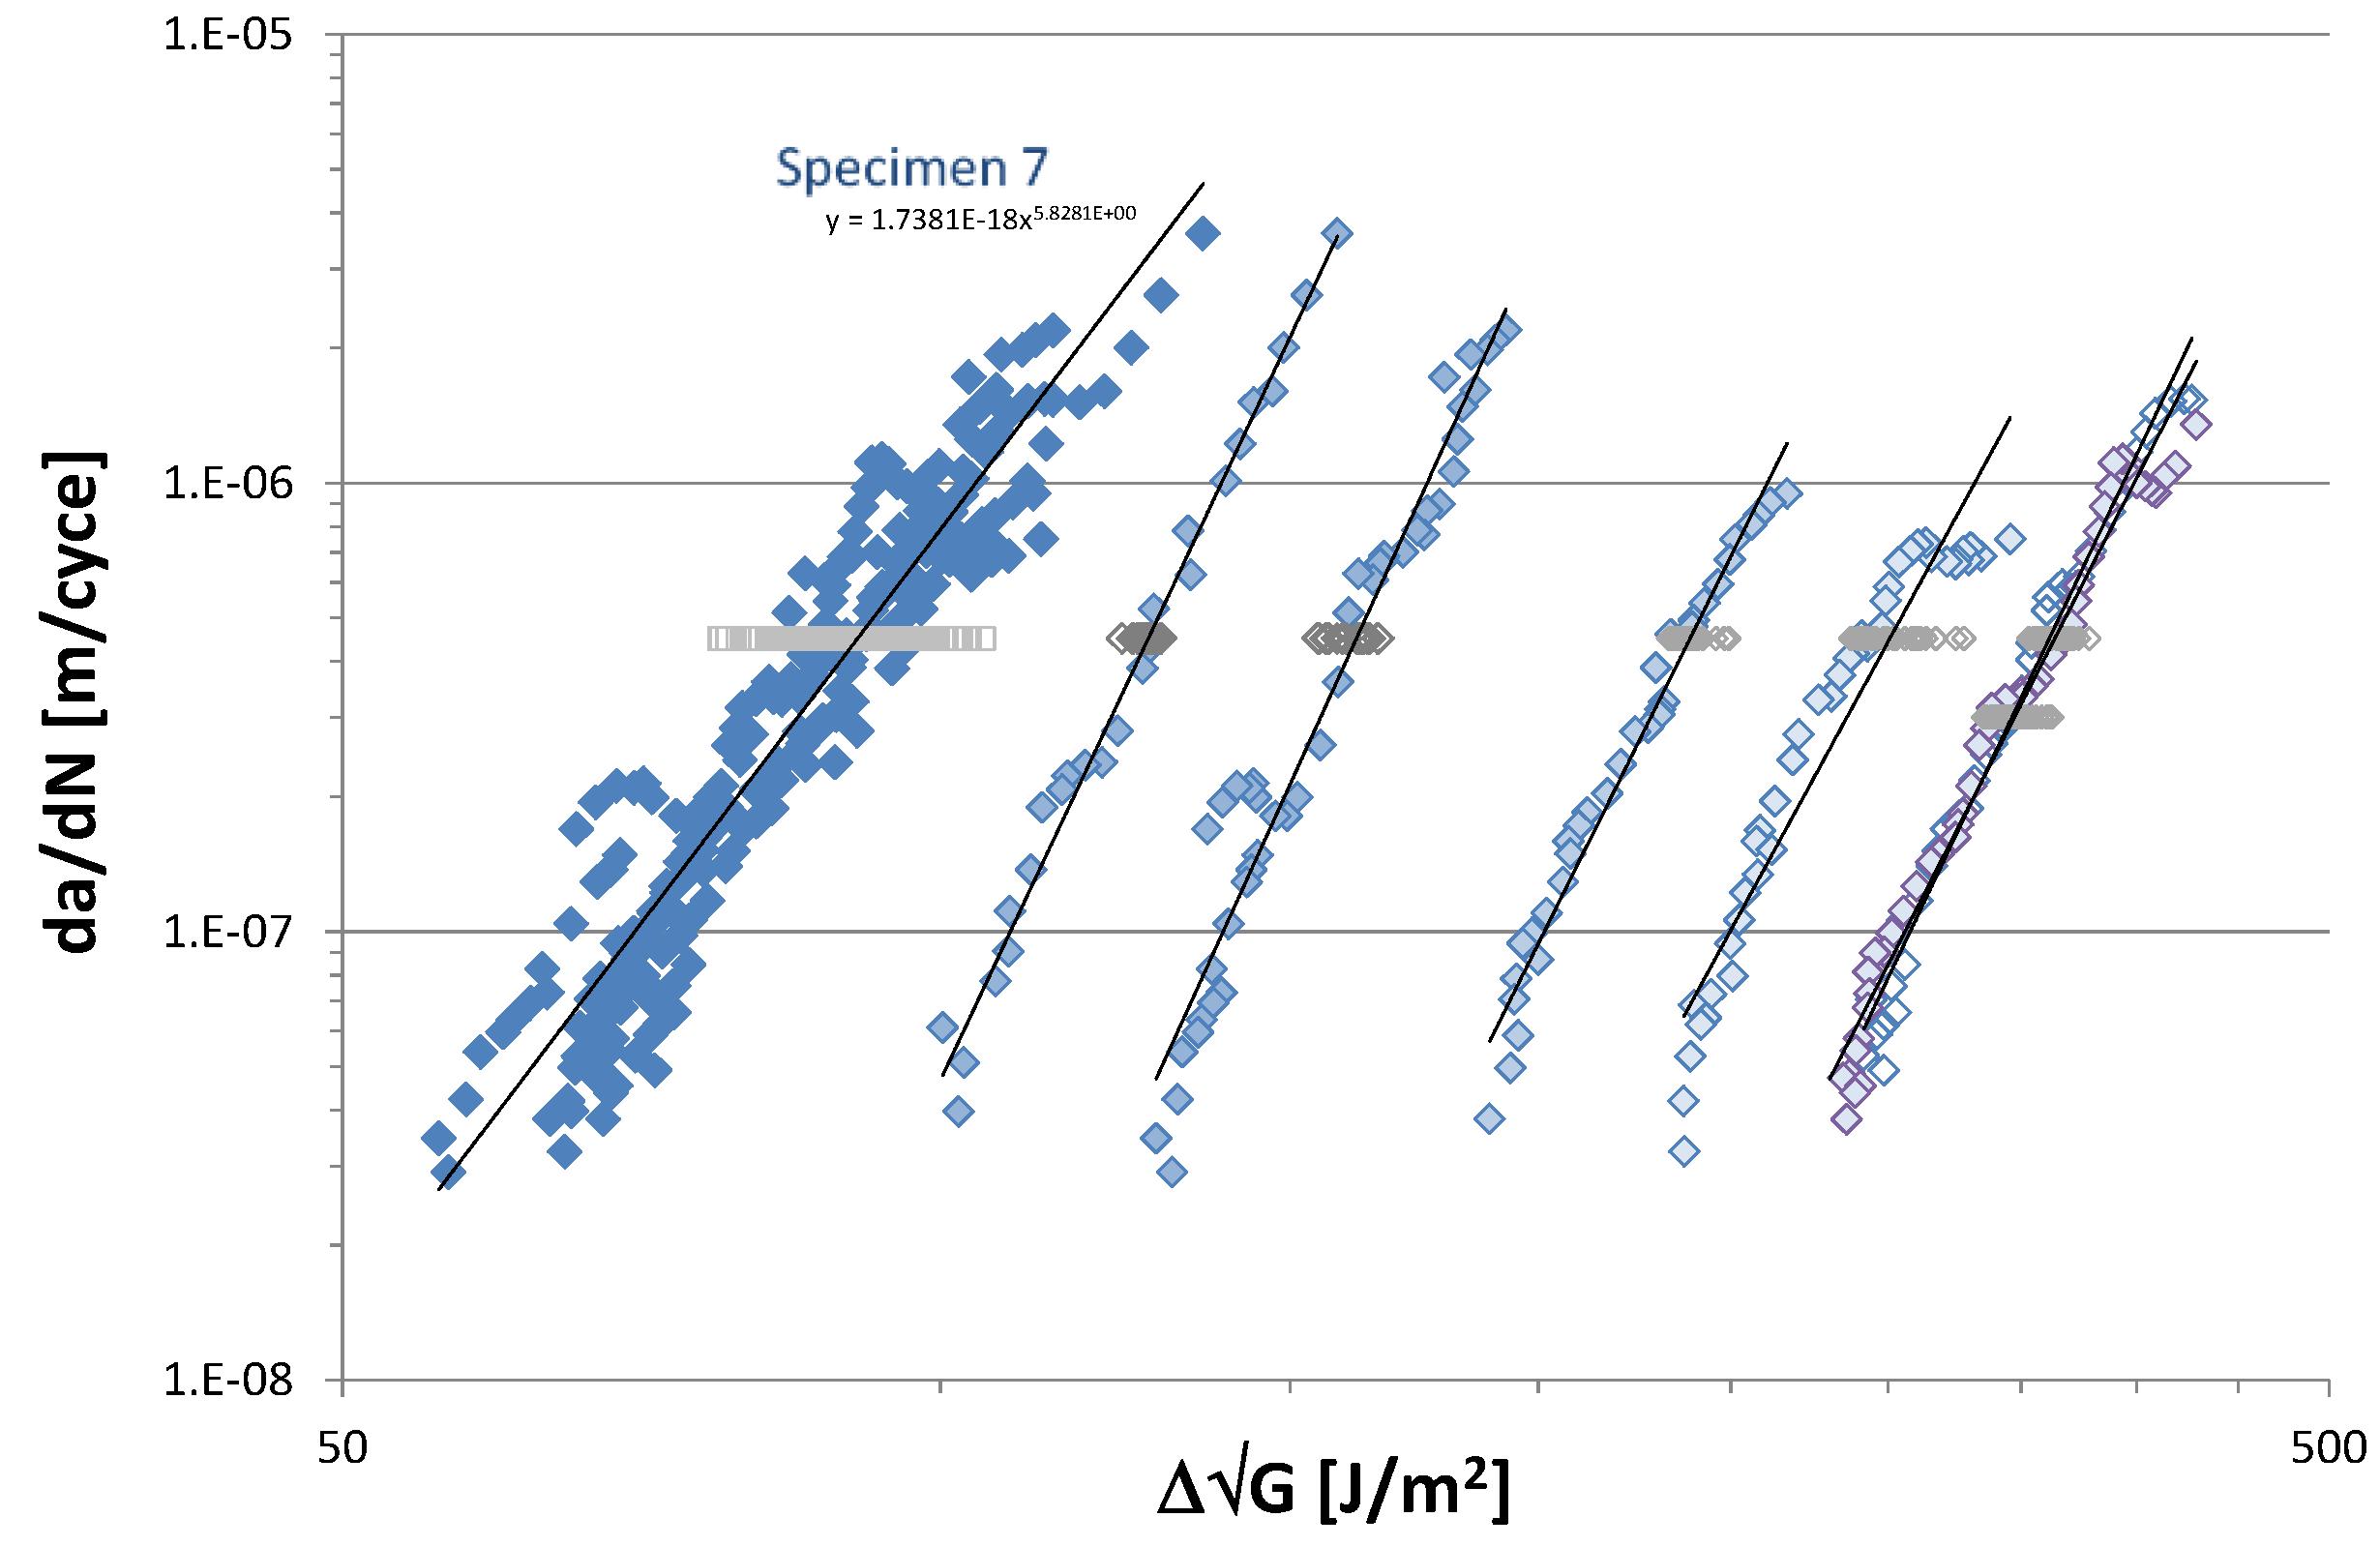
Figure 5.
Zero-bridging delamination resistance curve obtained from specimen 11 [13] after translating all individual curves to (a − a0) = 0. Grey data points at da/dN = 4.5 × 10⁻⁷ m/cycle indicate scatter band per curve.
Figure 5.
Zero-bridging delamination resistance curve obtained from specimen 11 [13] after translating all individual curves to (a − a0) = 0. Grey data points at da/dN = 4.5 × 10⁻⁷ m/cycle indicate scatter band per curve.
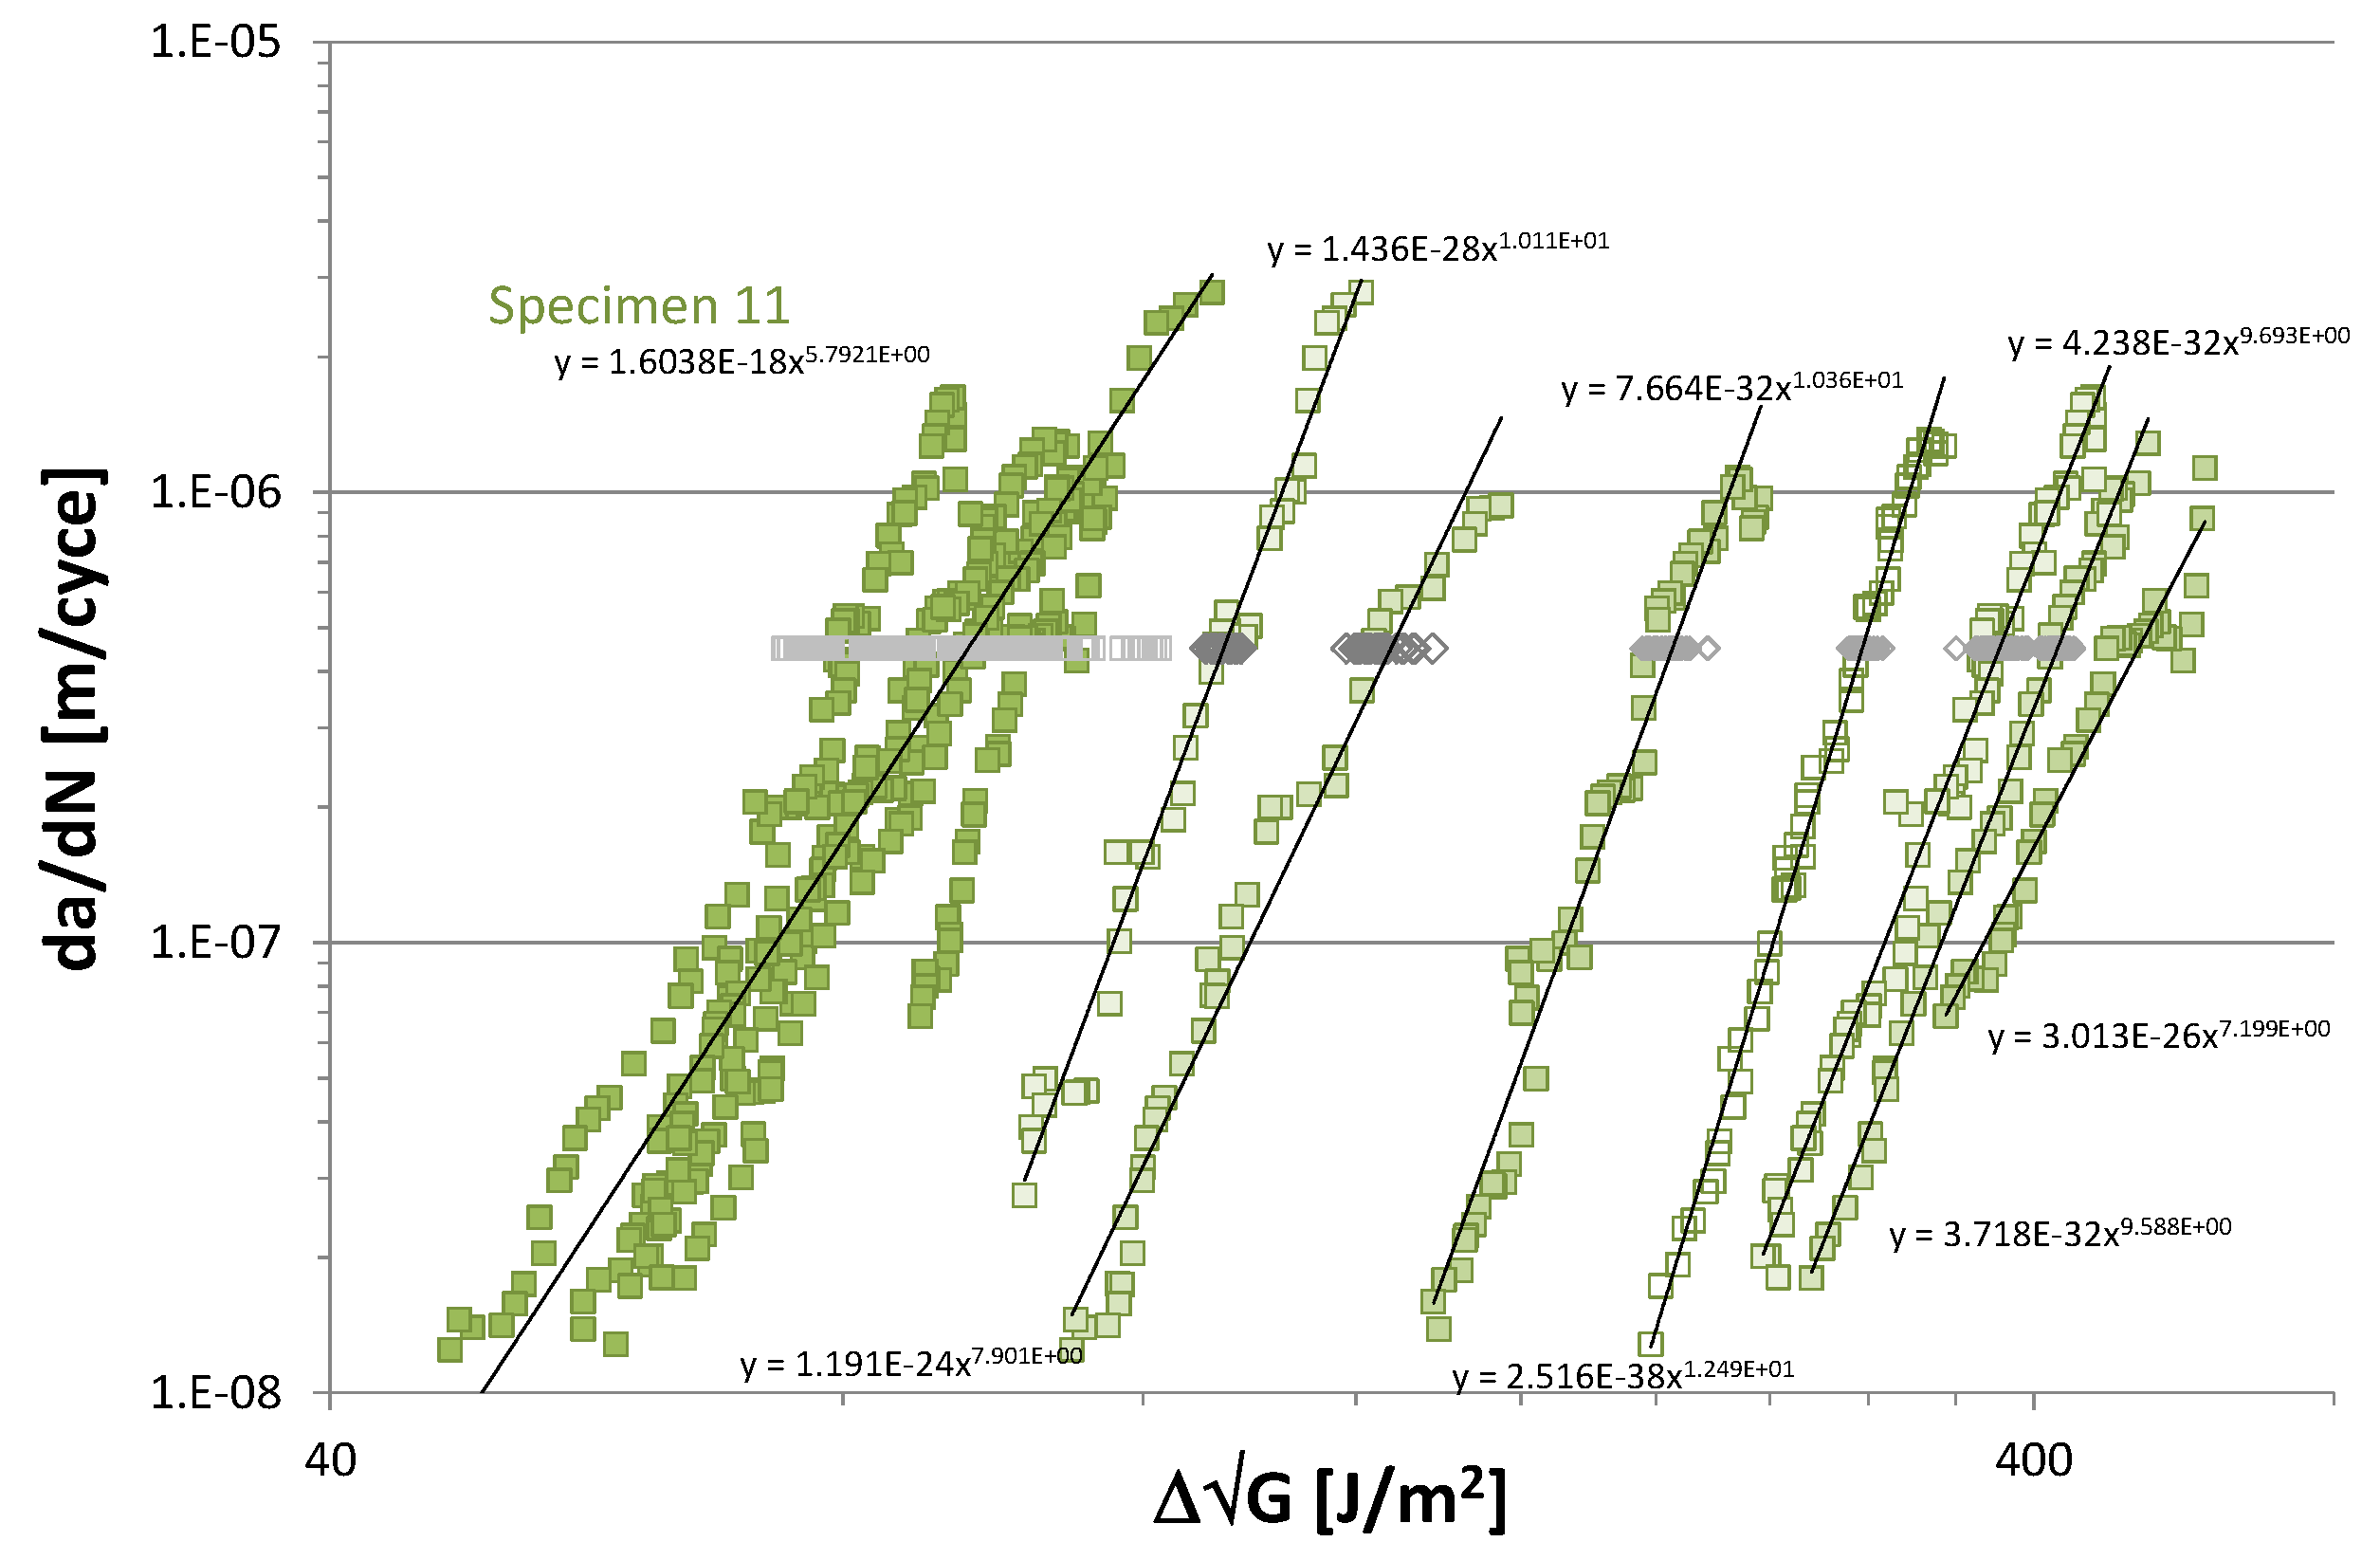
Figure 6.
Comparison between the zero-bridging delamination resistance curve obtained from specimens 7 and 11 [13] after translating all curves to (a − a0) = 0. Grey data points at da/dN = 4.5 × 10⁻⁷ m/cycle indicate scatter band per curve.
Figure 6.
Comparison between the zero-bridging delamination resistance curve obtained from specimens 7 and 11 [13] after translating all curves to (a − a0) = 0. Grey data points at da/dN = 4.5 × 10⁻⁷ m/cycle indicate scatter band per curve.
Publisher’s Note: MDPI stays neutral with regard to jurisdictional claims in published maps and institutional affiliations. |
© 2018 by the author. Licensee MDPI, Basel, Switzerland. This article is an open access article distributed under the terms and conditions of the Creative Commons Attribution (CC BY) license (https://creativecommons.org/licenses/by/4.0/).
Share and Cite
MDPI and ACS Style
Alderliesten, R. Proposal to Standardize Fatigue Delamination Growth Tests Using Double Cantilever Beam Specimens without Fibre Bridging. Proceedings 2018, 2, 385. https://doi.org/10.3390/ICEM18-05194
AMA Style
Alderliesten R. Proposal to Standardize Fatigue Delamination Growth Tests Using Double Cantilever Beam Specimens without Fibre Bridging. Proceedings. 2018; 2(8):385. https://doi.org/10.3390/ICEM18-05194
Chicago/Turabian StyleAlderliesten, René. 2018. "Proposal to Standardize Fatigue Delamination Growth Tests Using Double Cantilever Beam Specimens without Fibre Bridging" Proceedings 2, no. 8: 385. https://doi.org/10.3390/ICEM18-05194