Long-Term In-Situ Study of Mild Steel Stress Corrosion Cracking Kinetics in a Carbonate-Rich Solution †


Department of Materials Science and Metallurgical Engineering, University of Pretoria, Pretoria 0002, South Africa
†
Presented at the 18th International Conference on Experimental Mechanics, Brussels, Belgium, 1–5 July 2018.
Proceedings 2018, 2(8), 377; https://doi.org/10.3390/ICEM18-05197
Published: 9 May 2018
(This article belongs to the Proceedings of The 18th International Conference on Experimental Mechanics)
Abstract
:A long-term SCC crack growth kinetics study, using precracked WOL samples, was performed. The samples were exposed in a mild steel storage tank containing a solution with high levels of ammonium and carbonate ions. Some samples were fully immersed in the tank content, while in other cases, intermittent drying took place in the tank upper regions. At short times, the highest (intergranular) crack growth rates were obtained at immersed regions and initially, the region with intermittent drying showed considerably slower growth rates. With pronounced exposure times, the trend however reversed and the growth in the intermittent drying region accelerated while the samples in the immersed location experienced a retardation in the SCC growth velocities. It was found that the SCC mechanism progressed through a process where small cracks first formed at the fatigue crack front and thereafter merged to form a continuous SCC crack front.
1. Introduction
The synthetic production of natural gas, including production from dry biofuels, requires gas-cleaning processes [1], which often produce carbonate-rich high pH solutions contained in steel storage tanks. In the case of mild steel tanks, this necessitates the need to manage the risk of stress corrosion cracking. Stress corrosion cracking (SCC) has been reported for mild steel exposed to this type of liquid as early as 1959 [2] and subsequently it has been realized that the same mechanism is operative in several other applications, including the cracking of high-pressure buried pipeline steels [3]. The kinetics of SCC of mild steel in high-pH carbonate/bicarbonate solutions have therefore been investigated in some detail in laboratory studies [4], but relatively little has been reported regarding long-term in-situ behavior of precracked samples in service conditions. In addition, the variable of alternate wetting and drying on SCC kinetics, have not received much research attention in this context. This paper summarizes a long-term study aimed at investigating the kinetics of stress corrosion cracking of precracked samples in a storage tank environment, with alternate wetting and drying being a variable, as part of a programme aimed at mitigating SCC effects.
2. Literature
The laboratory simulations of this manifestation of SCC demonstrated that the active species were carbonates and bicarbonates, occurring at neutral to high levels of pH (6.7 to 11), where interganular cracking was found in a narrow band (~300 mV wide), with the values ranging from −0.2 V (SCE) to −0.5 V (SCE) at a pH of 9.0 [5].
Some research has been performed aimed at evaluating SCC velocities, and maximum crack velocities in the order of 1E−06 mm/s has been reported at pH levels of ~7.7 in slow rate strain testing [6]. Such crack velocities are very high due to the nature of the test method (equivalent to 31.5 mm/year) and cannot be equated to the case of a service application such as buried pipeline or storage tank environments.
In another study by Sato and Murata, exposure trials for two years were performed in a coal gas transport line, using U-bend specimens [7]. The tests were supplemented with SSRT testing at different potentials in a coke oven gas liquid (see Table 1 for chemistry). Exposure temperatures were varied from 40 to 80 °C. The exposure results indicated that corrosion pits initiated on the U-bend sample surfaces, underneath a thick coal tar buildup, typically after six to 12 months. A critical crack depth of ~70 micron was found, at which depth intergranular cracks initiated at the pit tips. Maximum crack growth rates of 125 micron/year was observed, with the average crack velocity being ~70 micron/year (2.22 × 10⁻⁹ mm/s). In contrast, their SSRT testing produced intergranular crack rates of 0.86 mm/day at 50 °C. The study proposed that controlling the pH to above 9.5 and the temperature below 40 °C should be used to avoid SCC in the gas lines.
The reviewed literature did not provide clear guidelines regarding what levels of crack propagation velocities could be expected for service applications of SCC in mild steel storage tanks, propagating from pre-existing cracks. Research performed on the kinetics of this type of cracking concluded that SCC progresses by a dissolution mechanism, which takes place at grain boundaries, and together with the opposing processes of film forming and film rupture determine the average SCC growth velocity [8]. Crack tip strain rate, the number of active cracks and crack coalescence have been shown to be important variables influencing SCC velocity [4] and a model has been proposed to describe SCC growth kinetics for this system [4,9]. Accordingly, Stage 1 establishes the required conditions for SCC crack initiation, and in Stage 2 the average crack velocity decreases with increasing time, due to many cracks initiating and the effective crack tip strain decreasing consequently. In Stage 3 the crack velocity remains constant with time, as the crack initiation rate diminishes and coalescence increases. Stage 4 is dominated by crack coalescence, resulting in the crack tip strain rate and crack velocity increasing with time.
3. Specific Conditions
The welded storage tank in question was constructed from structural steel plate with strake thicknesses ranging from 35 mm to 6 mm (top strake). After some service, cracking typical of SCC were discovered on the tank floor and strake inner surfaces. The tank service temperature was in the order of 40 °C. The cracks were mostly associated with the strake welded joints, with cracking typically occurring at the weld toe location.
The typical chemistry of the tank liquid is given in Table 1, where it is compared to the coal gas liquid studied in the Sato and Murata study.
4. Experimental
4.1. Objectives
The following criteria for the experimental method were decided upon:
- The SCC crack growth kinetics from pre-existing cracks would be established. This approach would eliminate the “Stage 1” period in the SCC growth, where the required conditions for cracking are first established.
- SCC crack growth velocities in three distinct tank zones would be studied; close to the floor where permanent wetting would take place, at the “surface zone” where the steel is mostly covered by the tank content but where alternate wetting and drying will take place as tank levels vary (27% of tank height, immersed for ~80 per cent of the time), as well as in the “top zone” (50% of tank height) where the samples would be fully immersed for only ~40% of the time.
- Four successive exposure periods would be utilized, with the full study covering 13,080 h.
4.2. Technique
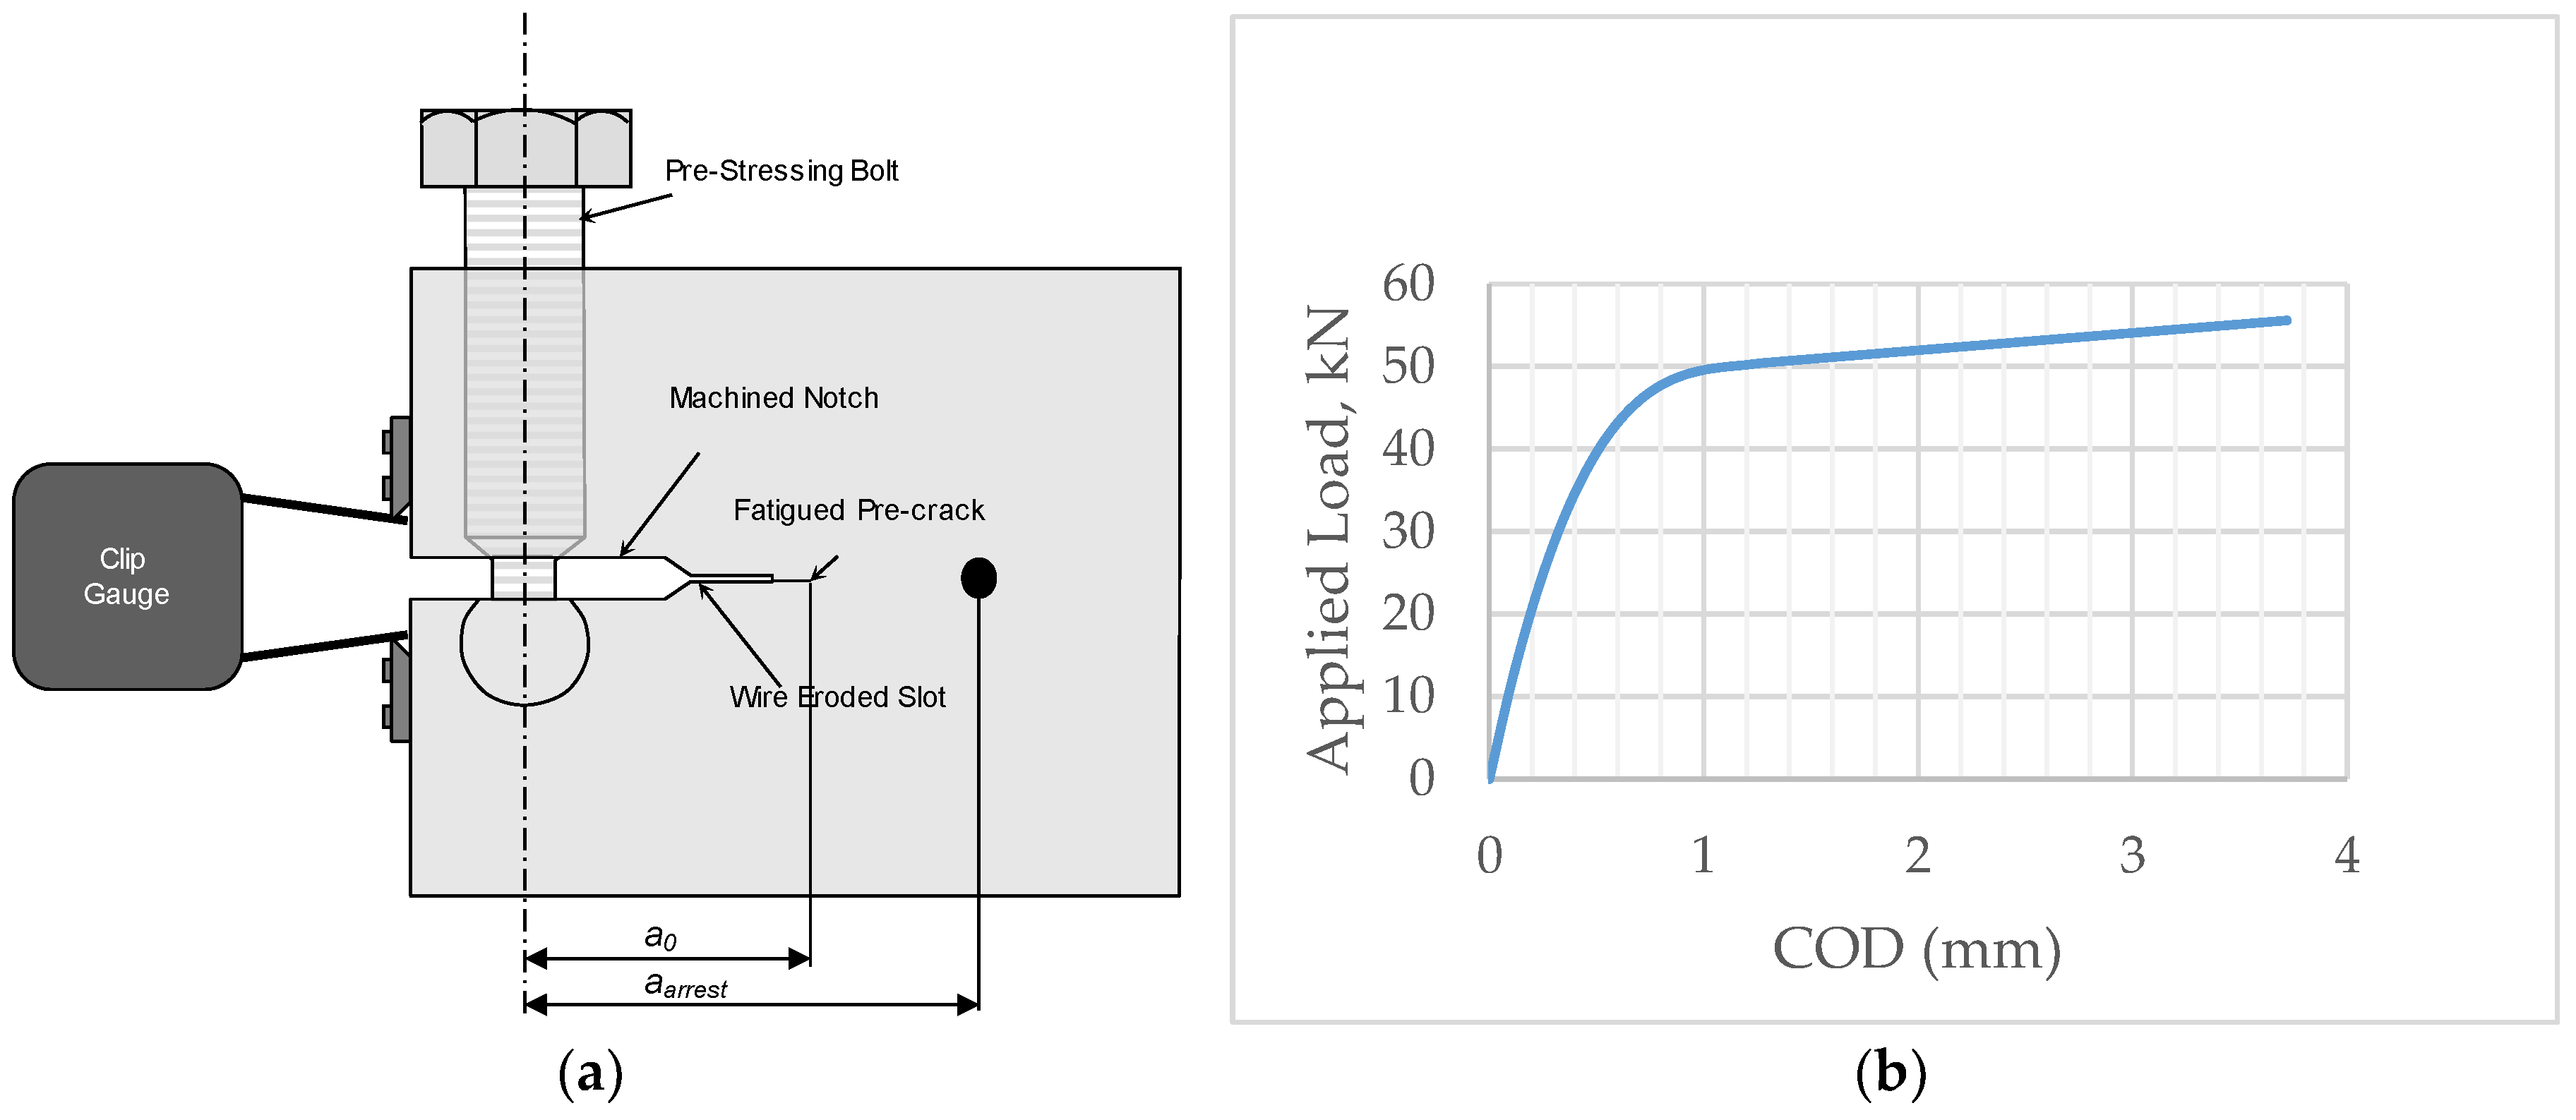
Laboratory precracked (in fatigue) and self-stressed WOL (Wedge Opening Loading) were used (Figure 1a). After the exposure to the medium, average (at nine positions, to BS 7448) and maximum SCC crack depths were determined by fracturing the samples cooled to liquid nitrogen temperatures. Metallographic evaluation of etched samples were performed on the polished sides of the samples. Manufacture of the WOL samples was performed from steel plate with similar chemistry to that of the strakes, as recorded in Table 2.
5. Experimental Results
5.1. First Exposure Period
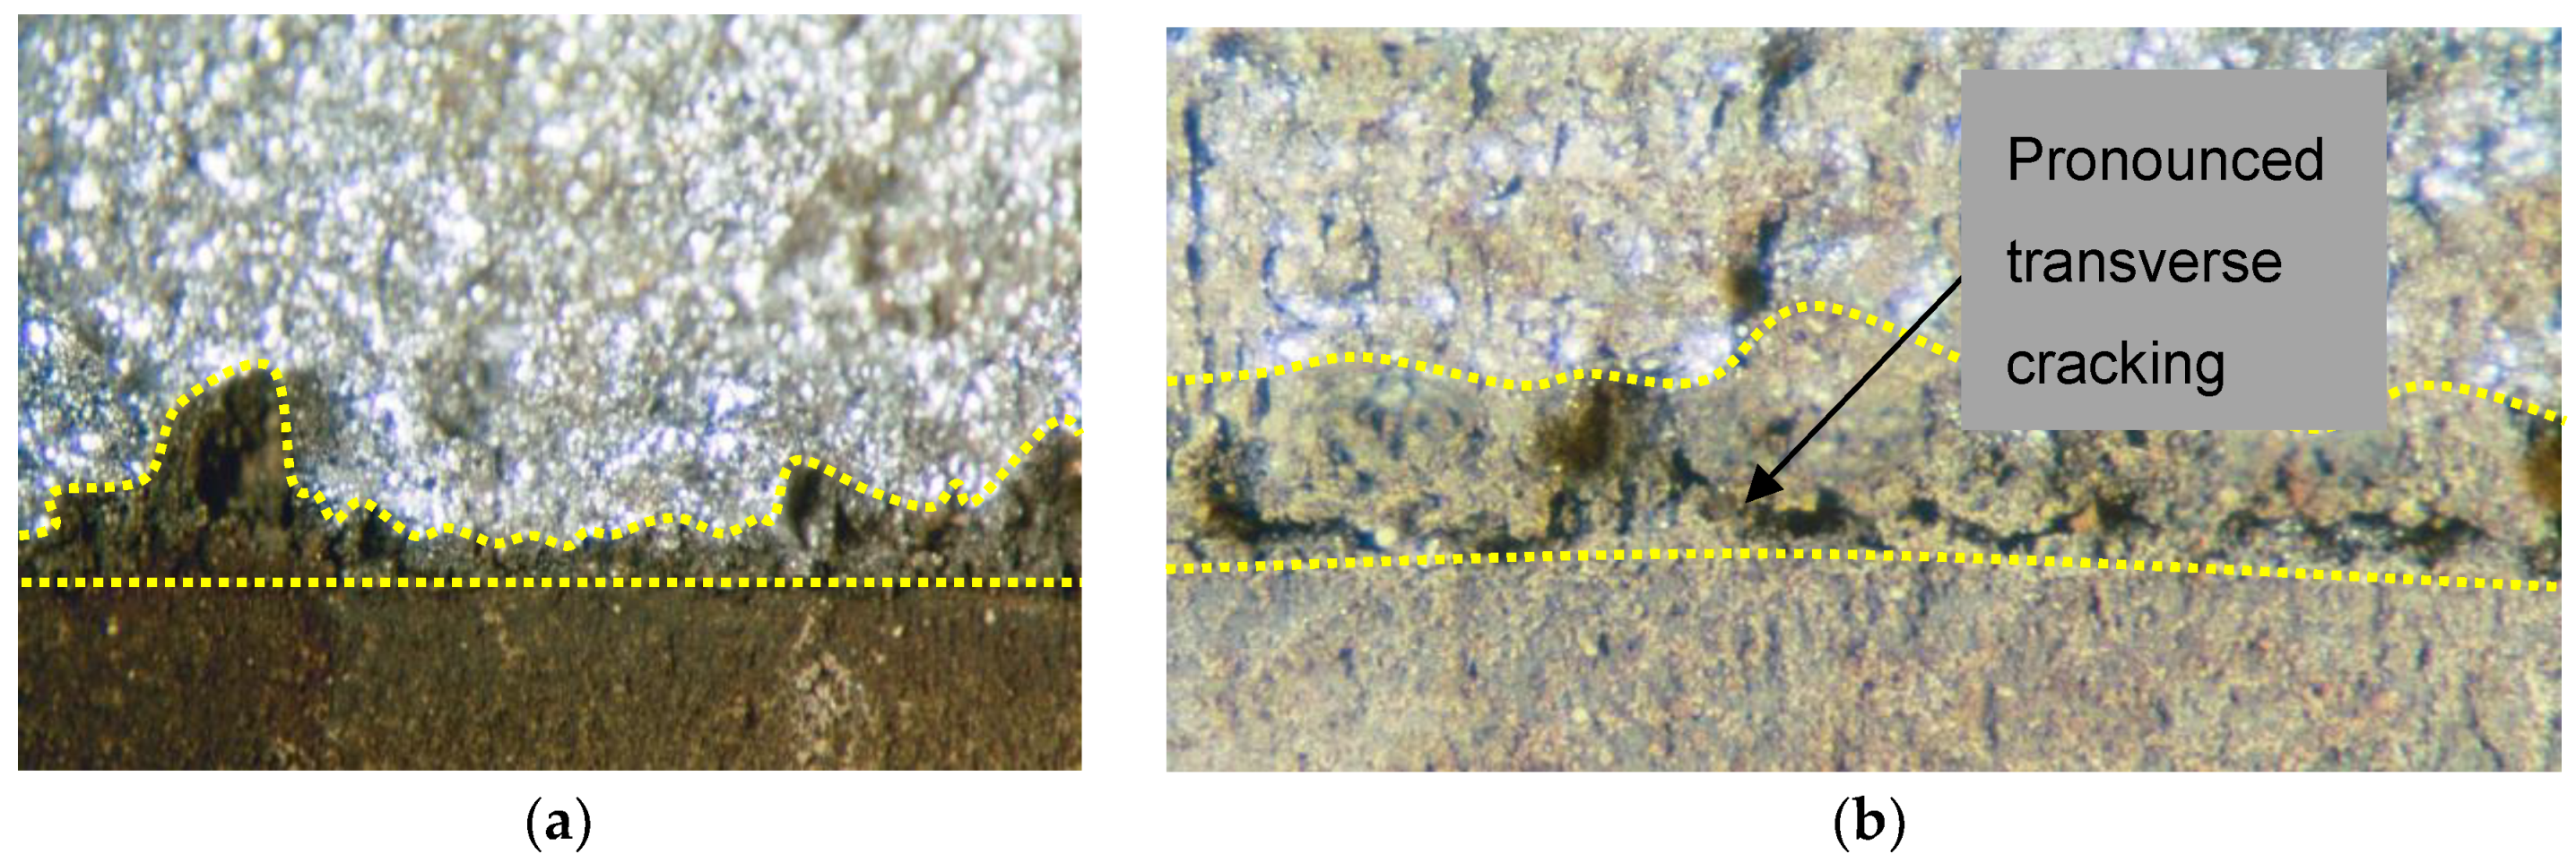
The first samples were removed after an exposure period of 670 h. The SCC crack depths were determined and are reported in Table 4 and shown in Figure 2. It was observed that the first steps of SCC propagation was the development of single small cracks from the fatigue crack tip, as seen in the case of the “vapour zone” sample.
5.2. Longer Exposure Periods
As the exposure times increased, the individual cracks merged and formed continuous crack fronts with reduced amax/aave ratios (after 5904 h, the ratios ranged from 1.24 to 1.38). The average crack depths over time are shown in Figure 3.
For most of the immersion times, it was found that samples at the floor level and those at the “surface level” (see Section 4.1) behaved similarly in terms of SCC growth, with the floor level average growth rates being slightly higher than those at the “liquid level”, where some intermittent drying occurred. The samples in the top zone, however, initially showed slow growth rates, with growth rates rapidly increasing after exposure times of 5940 h.
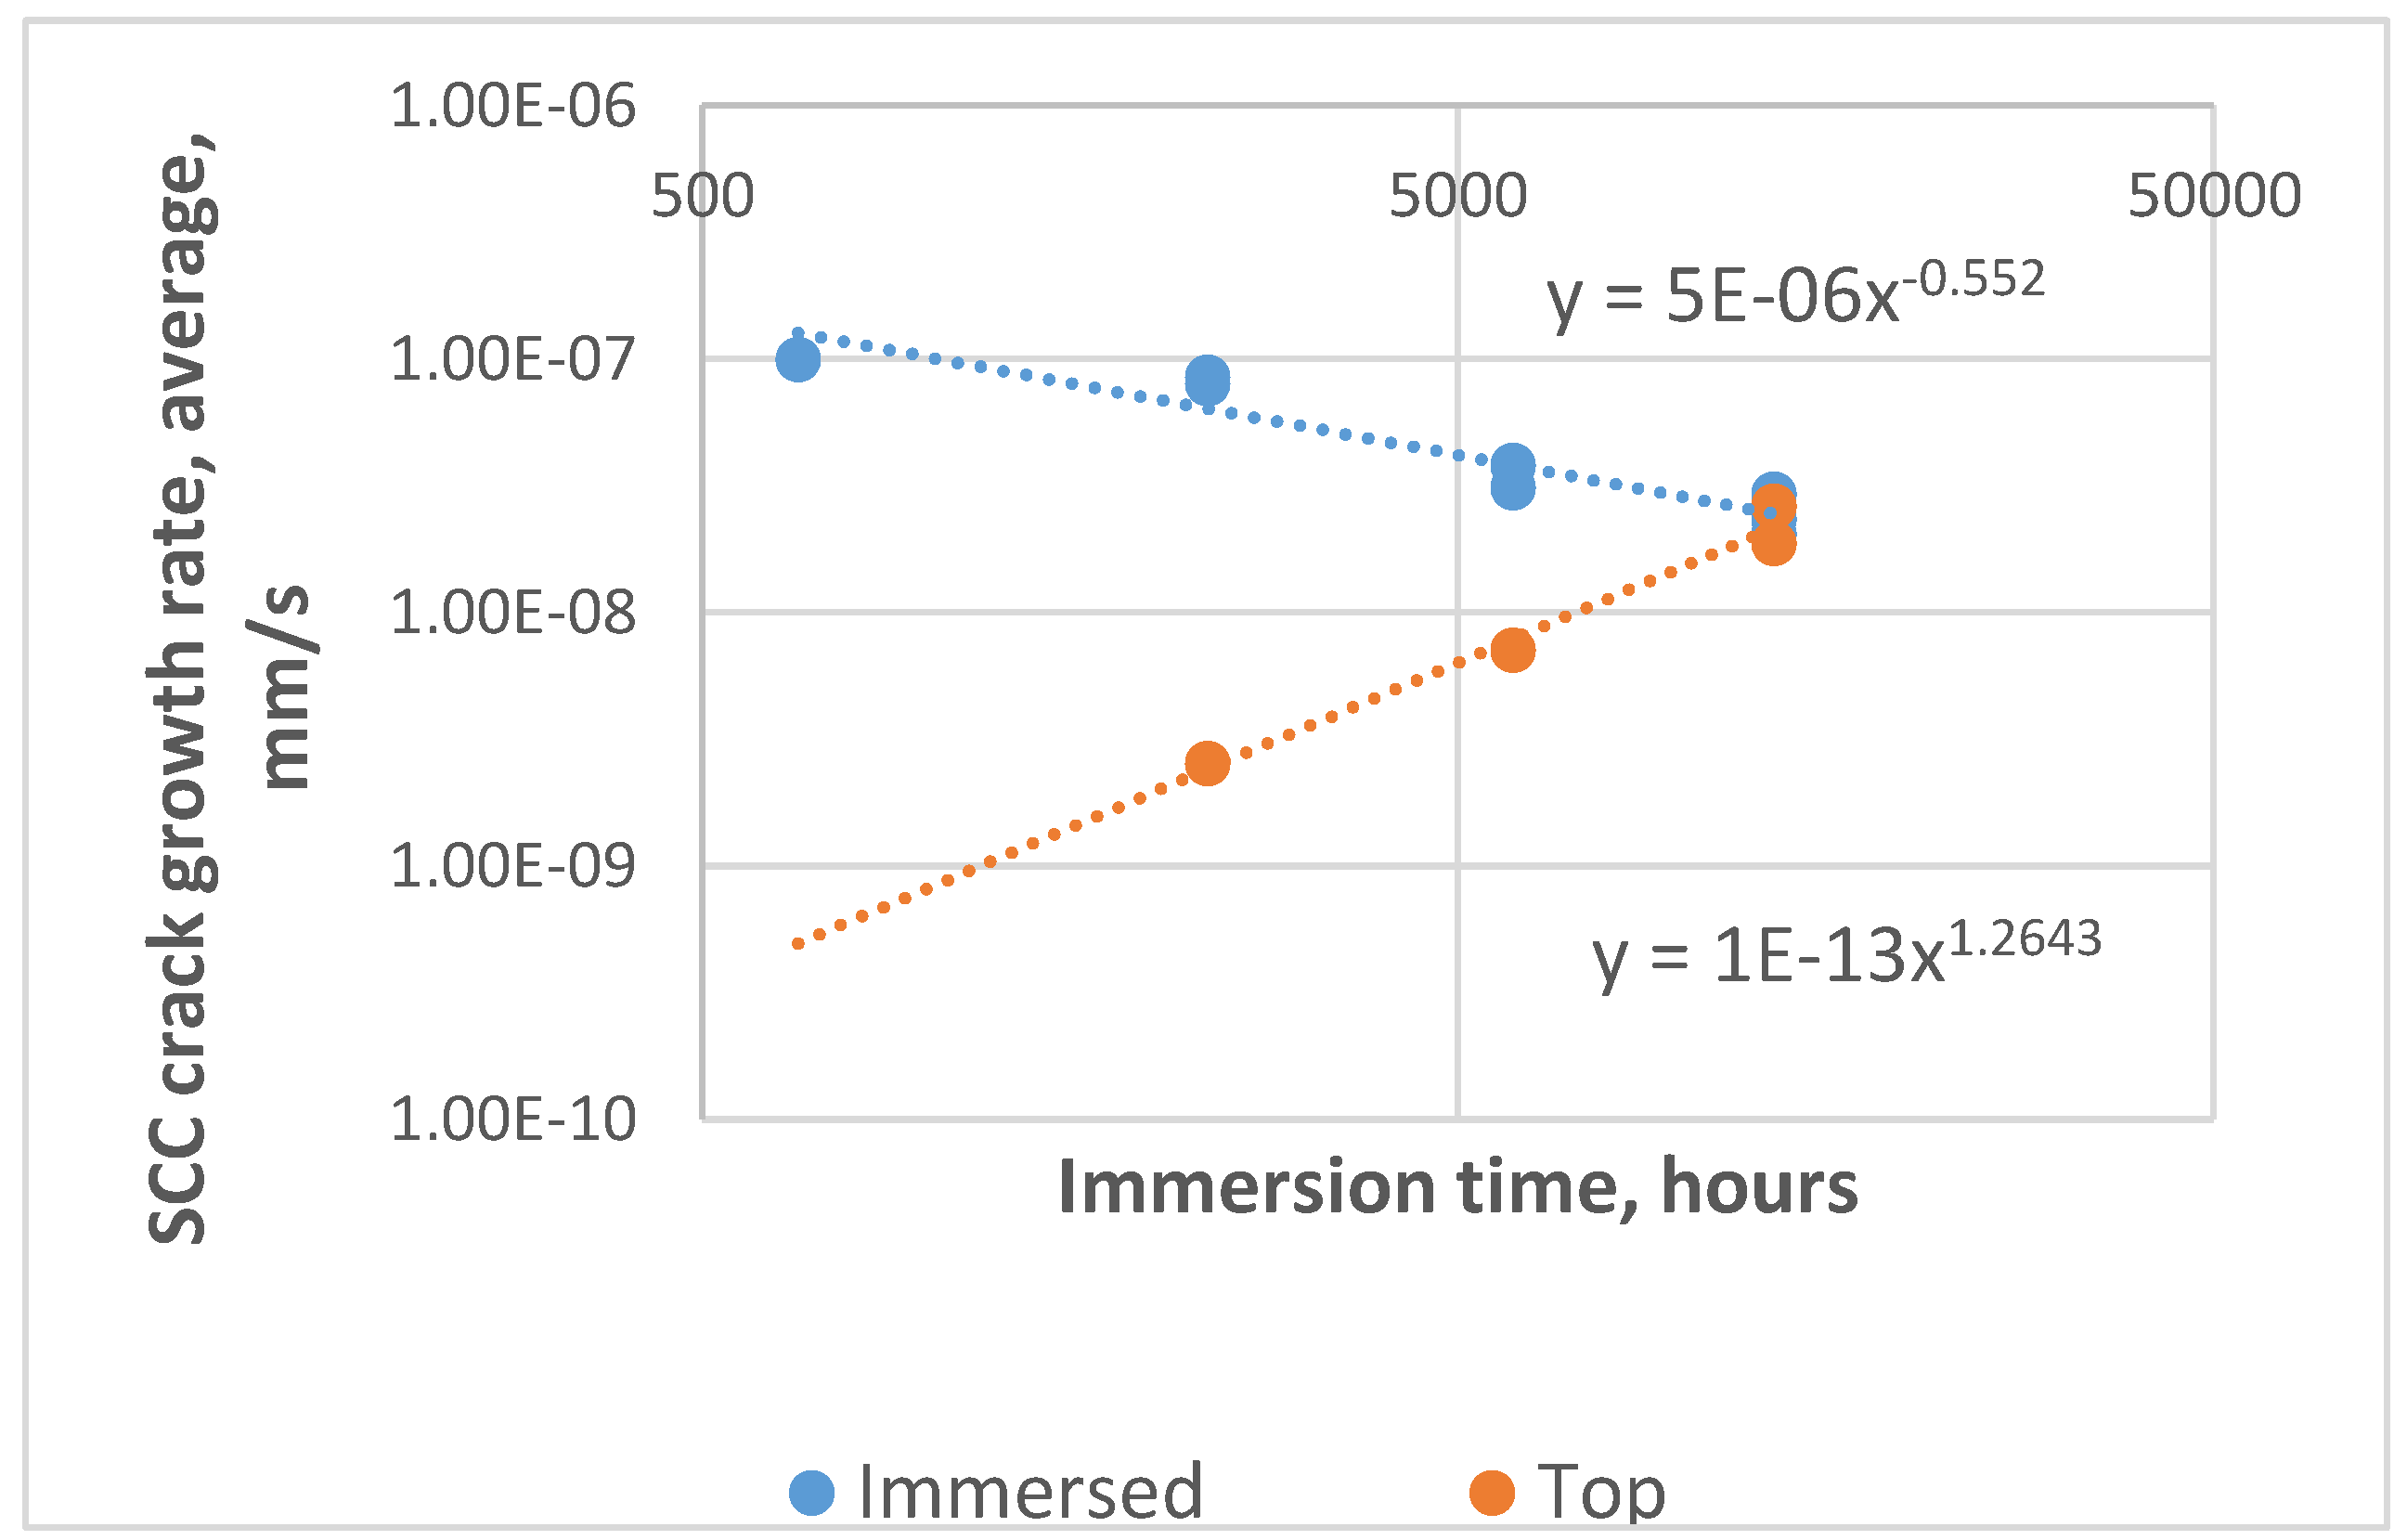
The average growth rates for the “immersed” (floor and surface) and “vapour zone” (top) samples are shown in Figure 4. The plot demonstrates the distinctly different growth behavior for the two classes of samples, with the governing power law equations for the two classes given in Figure 4. This difference was especially noticeable in the fourth exposure period (5941–13,080 h), when the incremental growth rate for the period was 3.3 times higher for the vapour (top) zone compared to that of the samples in the immersed zone (3.50 × 10⁻⁸ vs. 1.06 × 10⁻⁸ mm/s).
The values of stress intensity were established at the end of the exposure periods, and it was observed that the stress intensity (K1-values) did not appear to be in the process of stabilizing and reaching the threshold value, with increasing time. After 13,080 h, for example, the ratios of the stress intensity factors after full exposure and that at the start of the tests, K1_1380/K1_0, were found to be in the range of 0.91 to 0.97, for all samples.
6. Discussion and Conclusions
The average growth rates of this study, over the full test period and for both immersed and non-immersed conditions, are considerably higher than that established by Sato and Murato using U-bend specimens (Table 5). The higher rate in the current study is believed to be due to the precracking, as opposed to cracks initiating from the pits formed in the Sato and Murato study, and the time required for the establishment of the correct conditions for crack formation there. The current growth rate (~2 × 10⁻⁸ mm/s) is similar to that found by Parkins [4] (Figure 10) in a similar medium at very low applied strain rates (1 × 10⁻⁹/s) using SSRT samples, where many cracks initially formed and later coalesced.
The decline in growth rate with increasing time for the immersed samples, is in keeping with with that expected in Stage 2 of the Parkins model, where initiation of multiple small cracks reduce the effective strain rate and growth velocity at the individual crack tips. In the case of frequent drying events and low immersion of the “vapour zone” samples, however, an increase in growth rate was experienced with increasing exposure time. In this case, increasing crack numbers with time can also be expected. The increasing growth rate for this zone must therefore be due to another factor, and is likely to be related to the destruction of the inhibiting films during the regular and long dry periods.
Acknowledgments
This University of Pretoria has funded the production, presentation and publication of the paper, for which they are thanked. P. van der Vyver is thanked for his contributions during the experimental phase.
Conflicts of Interest
The author declares no conflict of interest. The founding sponsors had no role in the design of the study; in the collection, analysis, or interpretation of data; in the writing of the manuscript, and in the decision to publish the results.
References
- Kopyschinski, J.; Schildhauer, T.J.; Biollaz, S.M.A. Production of synthetic natural gas (SNG) from coal and dry biomass—A technology review from 1950 to 2009. Fuel 2010, 89, 1763–1783. [Google Scholar] [CrossRef]
- Parkins, R.N.; Usher, R. The stress-corrosion cracking of mild steel in coal gas liquors. J. Chem. Technol. Biotechnol. 1959, 9, 445–456. [Google Scholar]
- Parkins, R.N.; Belhimer, E.; Blanchard W.K., Jr. Stress Corrosion Cracking Characteristics of a Range of Pipeline Steels in Carbonate-Bicarbonate Solution. Corrosion 1993, 49, 951–966. [Google Scholar] [CrossRef]
- Parkins, R.N. Factors Influencing Stress Corrosion Crack Growth Kinetics. Corrosion 1987, 43, 130–139. [Google Scholar] [CrossRef]
- Parkins, R.N. Stress Corrosion Cracking. In Uhlig’s Corrosion Handbook, 3rd ed.; Uhlig, H.H., Ed.; John Wiley & Sons: Hoboken, NJ, USA, 2011; p. 174. [Google Scholar]
- Parkins, R.N.; Zhou, S. The Stress Corrosion Cracking of a C-Mn steel in CO2-HCO3−CO32− Solutions. 1: Stress Corrosion Data. Corros. Sci. 1997, 39, 159–173. [Google Scholar] [CrossRef]
- Sato, E.; Murata, T. Stress Corrosion Cracking of Steels in Coal Gas Liquid. Corrosion 1988, 44, 770–775. [Google Scholar] [CrossRef]
- Parkins, R.N. Mecanistic Aspects of Intergranular Stress Corrosion Cracking of Ferritic Steels. Corrosion 1996, 52, 363–374. [Google Scholar] [CrossRef]
- Parkins, R.N. Strain Rate Effects in Stress Corrosion Cracking. Corrosion 1990, 46, 178–189. [Google Scholar] [CrossRef]
Figure 1.
(a) A schematic of the self-stressed WOL samples utilized in this study. The sample thickness, B, was 16.8 mm and the width, W was 38.0 mm. The dimension, a0, was 17.7 mm; (b) A calibration curve used for the preloading of the samples for immersion. The initial stress intensity was mostly in the order of 71 MPam0.5 (38.7 kN). Samples were taken with crack orientations both parallel (TL according to ASTM A 399) and transverse (LT) to the rolling direction.

Figure 2.
Fracture surface after laboratory fracture of WOL specimens, immersed at the floor level for 670 h. Fatigue crack front is indicated with yellow hyphenated line, and the in-plane SCC crack front by the irregular hyphenated line. The bright fracture surface is the fresh (cryogenic) fracture (a) Notch longitudinal (TL orientation) showing in-plane SCC cracking; (b) Notch transverse (LT orientation) showing SCC cracking both in the plane of the fatigue crack and normal to it. Metallography demonstrated that cracking was intergranular in all cases.

Figure 3.
SCC crack depths, average, as a function of immersion time for the three tank locations.
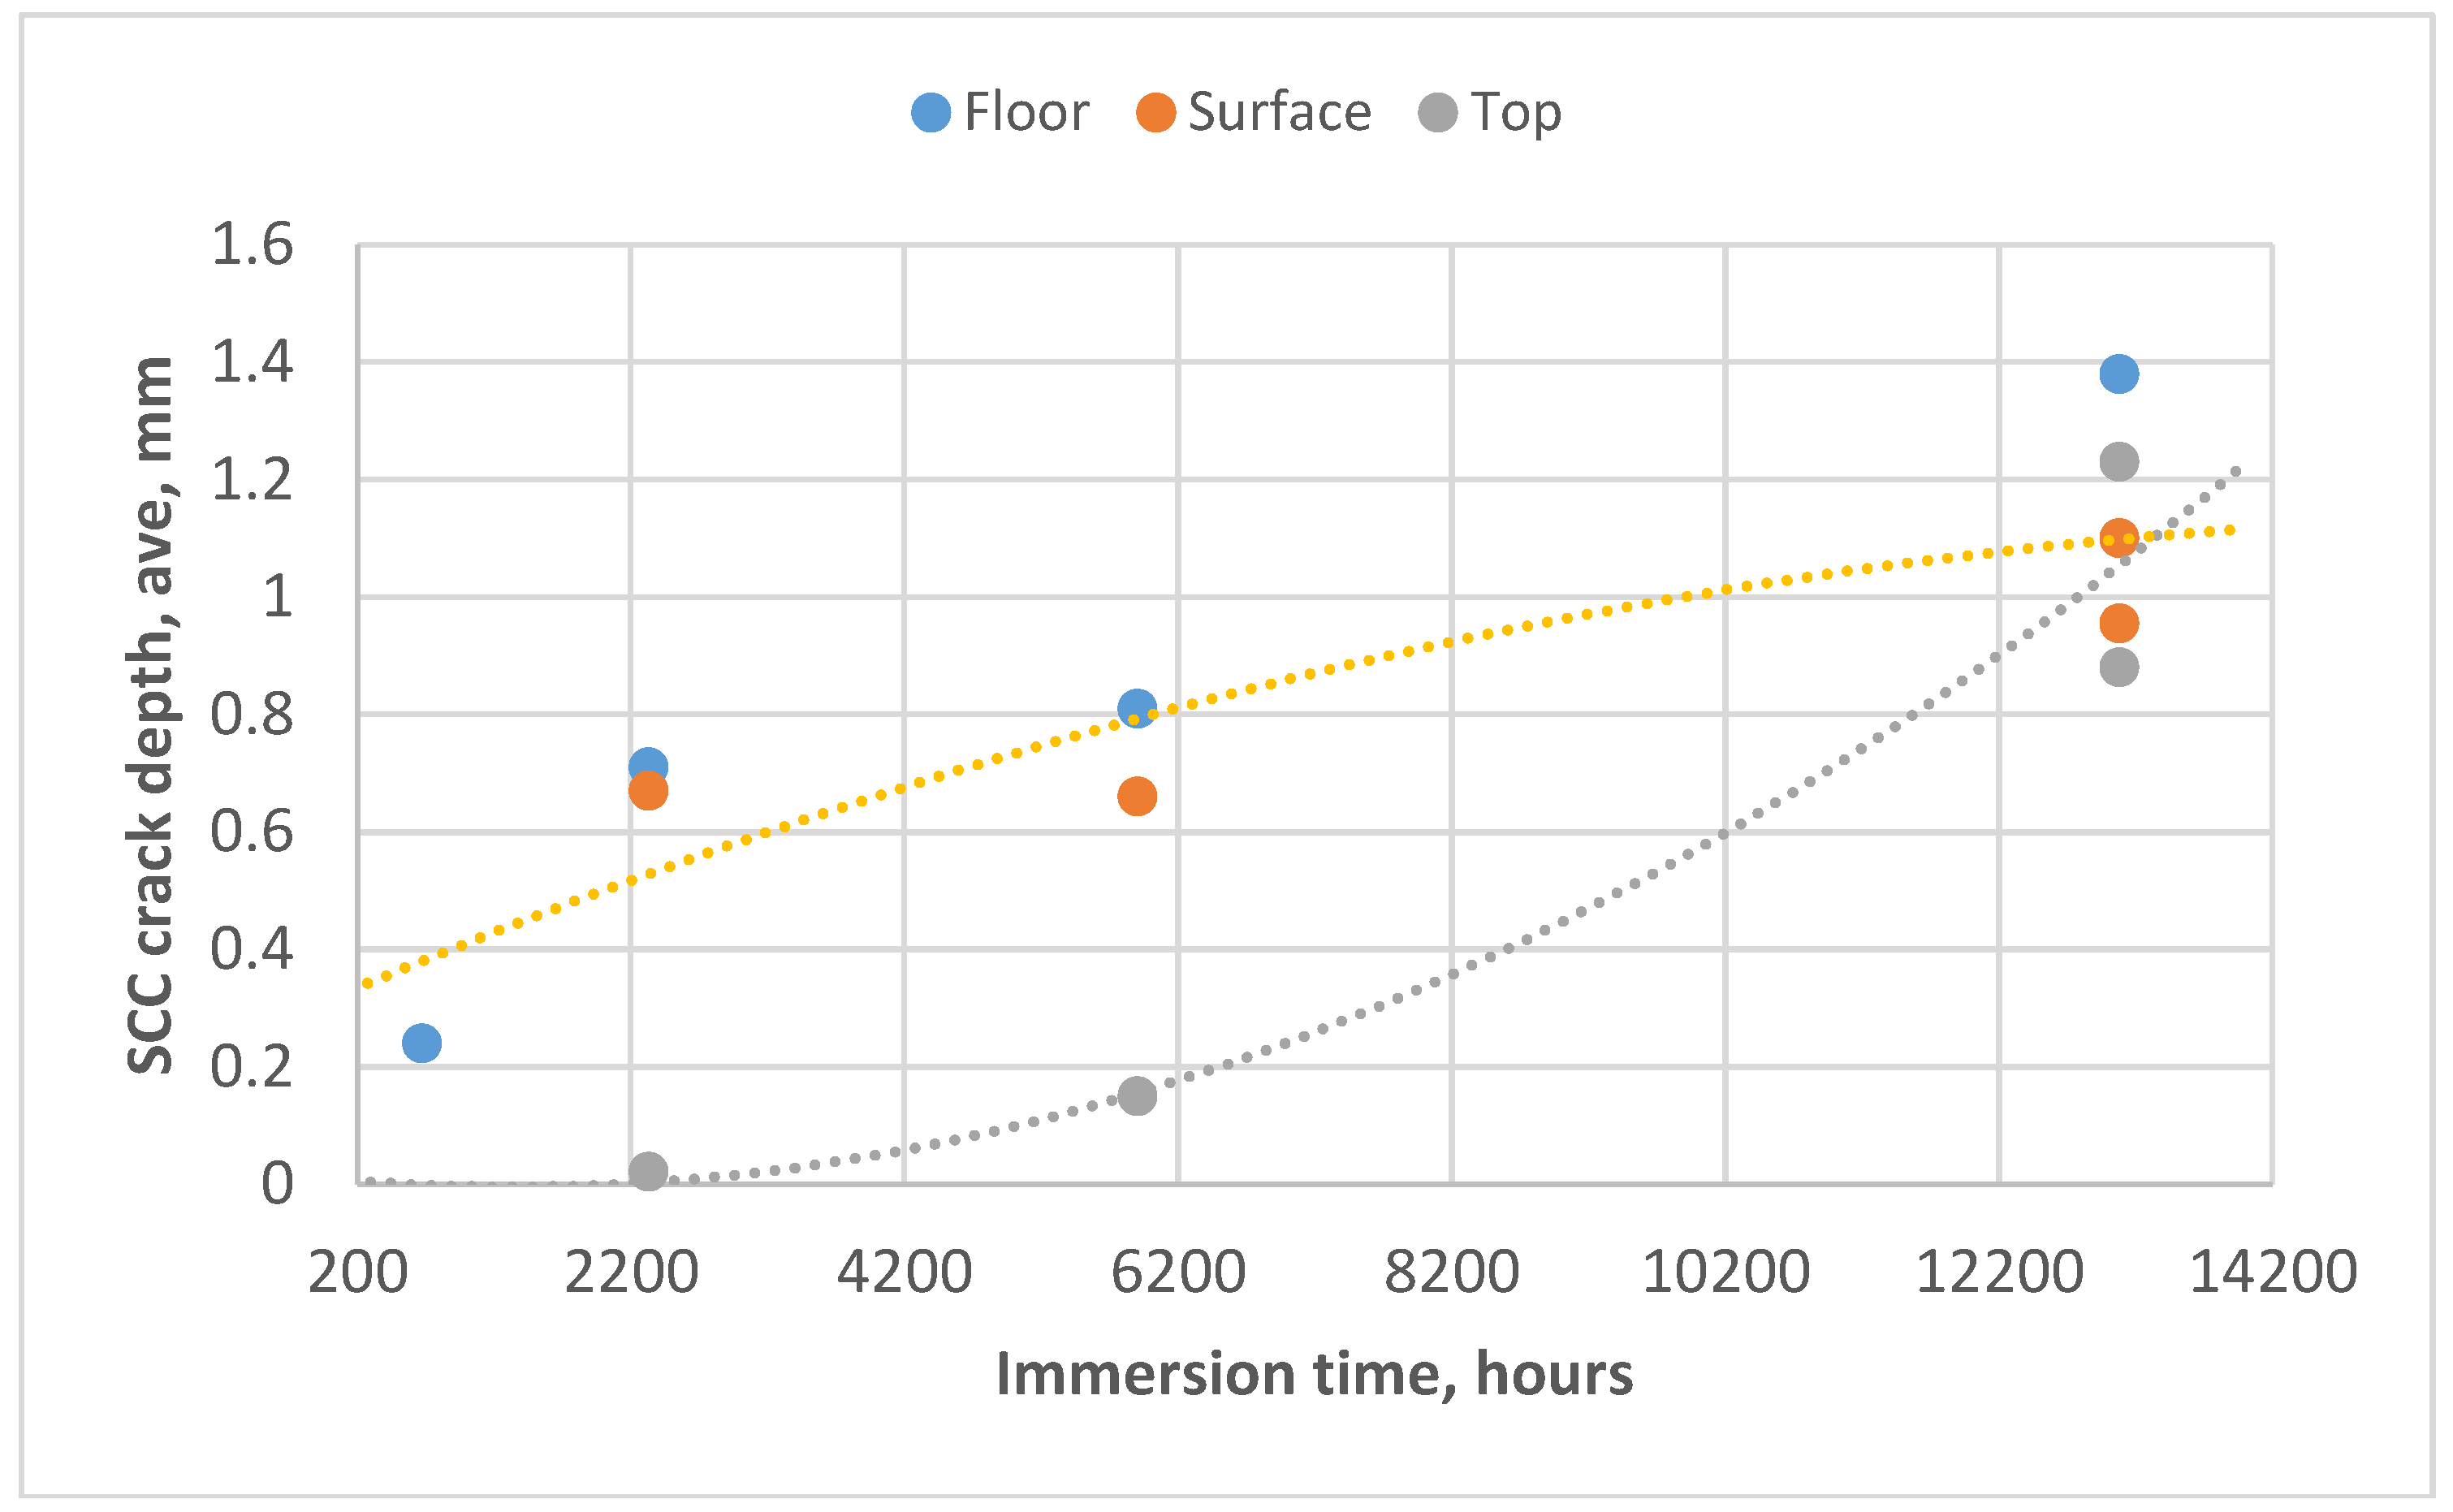
Figure 4.
Average crack growth rates for the immersed samples (floor and “surface level” samples grouped together) and top (“vapour zone”) samples, showing decreasing growth rates for the immersed samples and acceleration of the vapour zone samples.
Figure 4.
Average crack growth rates for the immersed samples (floor and “surface level” samples grouped together) and top (“vapour zone”) samples, showing decreasing growth rates for the immersed samples and acceleration of the vapour zone samples.

Table 1.
Typical chemistry of tank contents (main species, periodic analyses over the 18 months of the study) compared to that used in the Sato and Murata SCC [7] study. All values in g/l except for PH. Traces of H2S, SCN and CN- were found in both cases. Gas levels of 2.4% CO2, 0.065% H2S and 70 ppm HCN were found for the tank contents. Corresponding average levels for the Sato and Murata studies were 1.5%, 5.35 g/m3, and 1.35 g/m3, respectively.
| NH4+ | H2S | Cl− | SO42− | CO32− | pH | |
|---|---|---|---|---|---|---|
| Tank 1 | 1.52 | 0.35 | 0.98 | 5.4 | 1.82 | 8.93 |
| Ref. [7] | 3.05 | 1.45 | 2.2 | 0.075 | 2.85 | 9.5 |
1 Average over the time of the investigation, six periodic analyses.
Table 2.
Chemical composition of the plate used for the WOL sample manufacture. All elements given in mass %, unless indicated otherwise. Mechanical properties were Rp; 345 MPa, Rm; 554 MPa, A; 20%. Steel specification BS4360 1990 Gr 43 C.
Table 2.
Chemical composition of the plate used for the WOL sample manufacture. All elements given in mass %, unless indicated otherwise. Mechanical properties were Rp; 345 MPa, Rm; 554 MPa, A; 20%. Steel specification BS4360 1990 Gr 43 C.
| C | Mn | P | Si | Al | N |
|---|---|---|---|---|---|
| 0.21 | 1.10 | 0.015 | 0.007 | 0.028 | 90 |
Table 3.
Exposure history of Position 1 (top zone) and Position 2 (central zone) in terms of percentage immersion and number of drying incidents. Position 3 (floor zone) was always fully immersed.
Table 3.
Exposure history of Position 1 (top zone) and Position 2 (central zone) in terms of percentage immersion and number of drying incidents. Position 3 (floor zone) was always fully immersed.
| Immersion Period, Hours | Top Zone, % Immersion | Surface Zone, % Immersion | Top Zone, # Drying Incidents | Surface Zone, # Drying Incidents |
|---|---|---|---|---|
| 0–670 | 0 | 94 | 1 | 1 |
| 671–2328 | 0 | 98 | 1 | 1 |
| 2329–5940 | 34 | 66 | 4 | 4 |
| 5941–13,080 | 30 | 76 | 10 | 9 |
| 0–13,080 | 22.9 | 77 | 16 | 15 |
Table 4.
SCC crack depths after 670 h exposure.
| Sample | Max. Crack Depth, mm | Average Crack Depth, mm | Ratio, amax/aave |
|---|---|---|---|
| Floor,TL | 0.82 | 0.24 | 3.42 |
| Floor, LT | 0.83 | 0.24 1 | 3.46 |
| Vapour, LT | 0.17 2 | - | - |
1 Sample also showed SCC cracking normal to the precracked fatigue plane. 2 Individual small local cracks observed only, no general cracking.
Table 5.
Comparison of long-term average SCC growth rates found in this and earlier studies, in similar media and with similar steels. Figure 10 in Parkins [4] at a strain rate of ×10−9/s refers.
Table 5.
Comparison of long-term average SCC growth rates found in this and earlier studies, in similar media and with similar steels. Figure 10 in Parkins [4] at a strain rate of ×10−9/s refers.
| Study | Sample Type | Rate, mm/s |
|---|---|---|
| Current | WOL | 2.43 1 × 10⁻⁸ |
| Sato [7] | U-bend | 2.22 × 10⁻⁹ |
| Parkins [4] | SSRT | 1.5 × 10⁻⁸ |
1 For immersed samples after 13,080 h. The corresponding value for vapour zone samples was 2.24 × 10⁻⁸.
Publisher’s Note: MDPI stays neutral with regard to jurisdictional claims in published maps and institutional affiliations. |
© 2018 by the author. Licensee MDPI, Basel, Switzerland. This article is an open access article distributed under the terms and conditions of the Creative Commons Attribution (CC BY) license (https://creativecommons.org/licenses/by/4.0/).
Share and Cite
MDPI and ACS Style
Mostert, R. Long-Term In-Situ Study of Mild Steel Stress Corrosion Cracking Kinetics in a Carbonate-Rich Solution. Proceedings 2018, 2, 377. https://doi.org/10.3390/ICEM18-05197
AMA Style
Mostert R. Long-Term In-Situ Study of Mild Steel Stress Corrosion Cracking Kinetics in a Carbonate-Rich Solution. Proceedings. 2018; 2(8):377. https://doi.org/10.3390/ICEM18-05197
Chicago/Turabian StyleMostert, Roelf. 2018. "Long-Term In-Situ Study of Mild Steel Stress Corrosion Cracking Kinetics in a Carbonate-Rich Solution" Proceedings 2, no. 8: 377. https://doi.org/10.3390/ICEM18-05197