Vertical Segmentation of Airborne Light Detection and Ranging (LiDAR) for Select Australian Vegetation Communities †


Remote Sensing Research Centre, School of Earth and Environmental Science, The University of Queensland, St Lucia 4072, Australia
*
Author to whom correspondence should be addressed.
†
Presented at the 2nd International Electronic Conference on Remote Sensing, 22 March–5 April 2018; Available online: https://sciforum.net/conference/ecrs-2.
Proceedings 2018, 2(7), 338; https://doi.org/10.3390/ecrs-2-05151
Published: 22 March 2018
(This article belongs to the Proceedings of The 2nd International Electronic Conference on Remote Sensing)
Abstract
:A quantitative understanding of vegetation structure is vital to inform long-term protection and management of Australia’s vegetation communities. Although airborne light detection and ranging (LiDAR) systems are increasingly utilised to provide three-dimensional measures of vegetation structure at high spatial resolutions (1–10 m2), only limited studies characterise vertical vegetation structure using these datasets. This study assesses the capacity of high spatial resolution LiDAR data to accurately characterise the structural forms of Australian vegetation communities. Four study sites, each covering approximately 25 km2, were selected to provide examples across a range of vegetation structural forms, from shrubland to tall closed forest. A novel vertical segmentation methodology was developed to process airborne LiDAR data from each study site at 1 or 2 m vertical and horizontal spatial resolutions. Ratios were applied to standardise point density values, prior to an exploratory analysis utilising multi-dimensional clustering algorithms to classify distinct vertical structure patterns. Comparisons were subsequently performed between the exploratory analysis results and established structural classifications for Australian vegetation communities. The use of the vertical segmentation technique was found to improve the identification of sub-canopy features in multi-story vegetation communities, particularly shrubs and herbaceous ground covers 0.5–4 m tall. The exploratory analysis results saw increased noise in structurally complex and dense vegetation communities due to reduced sub-canopy returns. Further development and application of vertical segmentation methods in multi-story vegetation communities should be evaluated because of their potential for targeted management and monitoring of vegetation communities and wildlife populations.
1. Introduction
Australia has one of the most significant diversities of vegetation communities in the world, ranging from sparse open herbfields to tall closed forests [1]. Remote sensing technology provides a quantitative understanding of these environments at multiple spatial scales [2], helping to inform protection and management practices [3]. Structural vegetation classifications are an established method used to accurately map vegetation over regional to continental areas (104–108 km2) [4,5]. However, there is currently a limited capacity to measure and map vertical vegetation structure at these scales because of costs, complexity, and lack of methods for acquiring and processing data [6]. Airborne light distance and ranging (LiDAR) systems are an increasingly used source of remotely sensed data [7], with the capacity to provide three-dimensional quantitative measures of vegetation structure at high spatial resolutions (1–10 m2) [8]. Despite the increasing availability of high spatial resolution LiDAR data across Australia, only limited works characterise vertical vegetation structure using these datasets.
The need to improve the understanding of vertical vegetation structural forms for the classification of Australian vegetation communities has been discussed within the literature for over 50 years, with work by Specht (1970) highlighting the limitations of the existing classifications to characterise vertical vegetation structure appropriately [1]. Because of a limited capacity to currently synthesise the large and complex volumes of data required to measure and map vertical structure [6], current structural vegetation classifications have not been able to fully characterise vertical vegetation structure at continental scales (108 km2) [5]. Limited studies have utilised high spatial resolution LiDAR data to characterise vertical vegetation structural forms [8,9,10]. The majority have researched structurally simple vegetation communities at coarse vertical and horizontal spatial resolutions [11].
The objective of this study was to assess the capacity of high spatial resolution LiDAR data to accurately characterise the structural forms of Australian vegetation communities. This was achieved through the analysis of airborne LiDAR data collected across four structurally distinct study sites. The results of this research indicate the potential for vertical segmentation techniques to determine the vegetation structure and improve the identification of sub-canopy vegetation features.
2. Data and Methodology
2.1. Study Sites
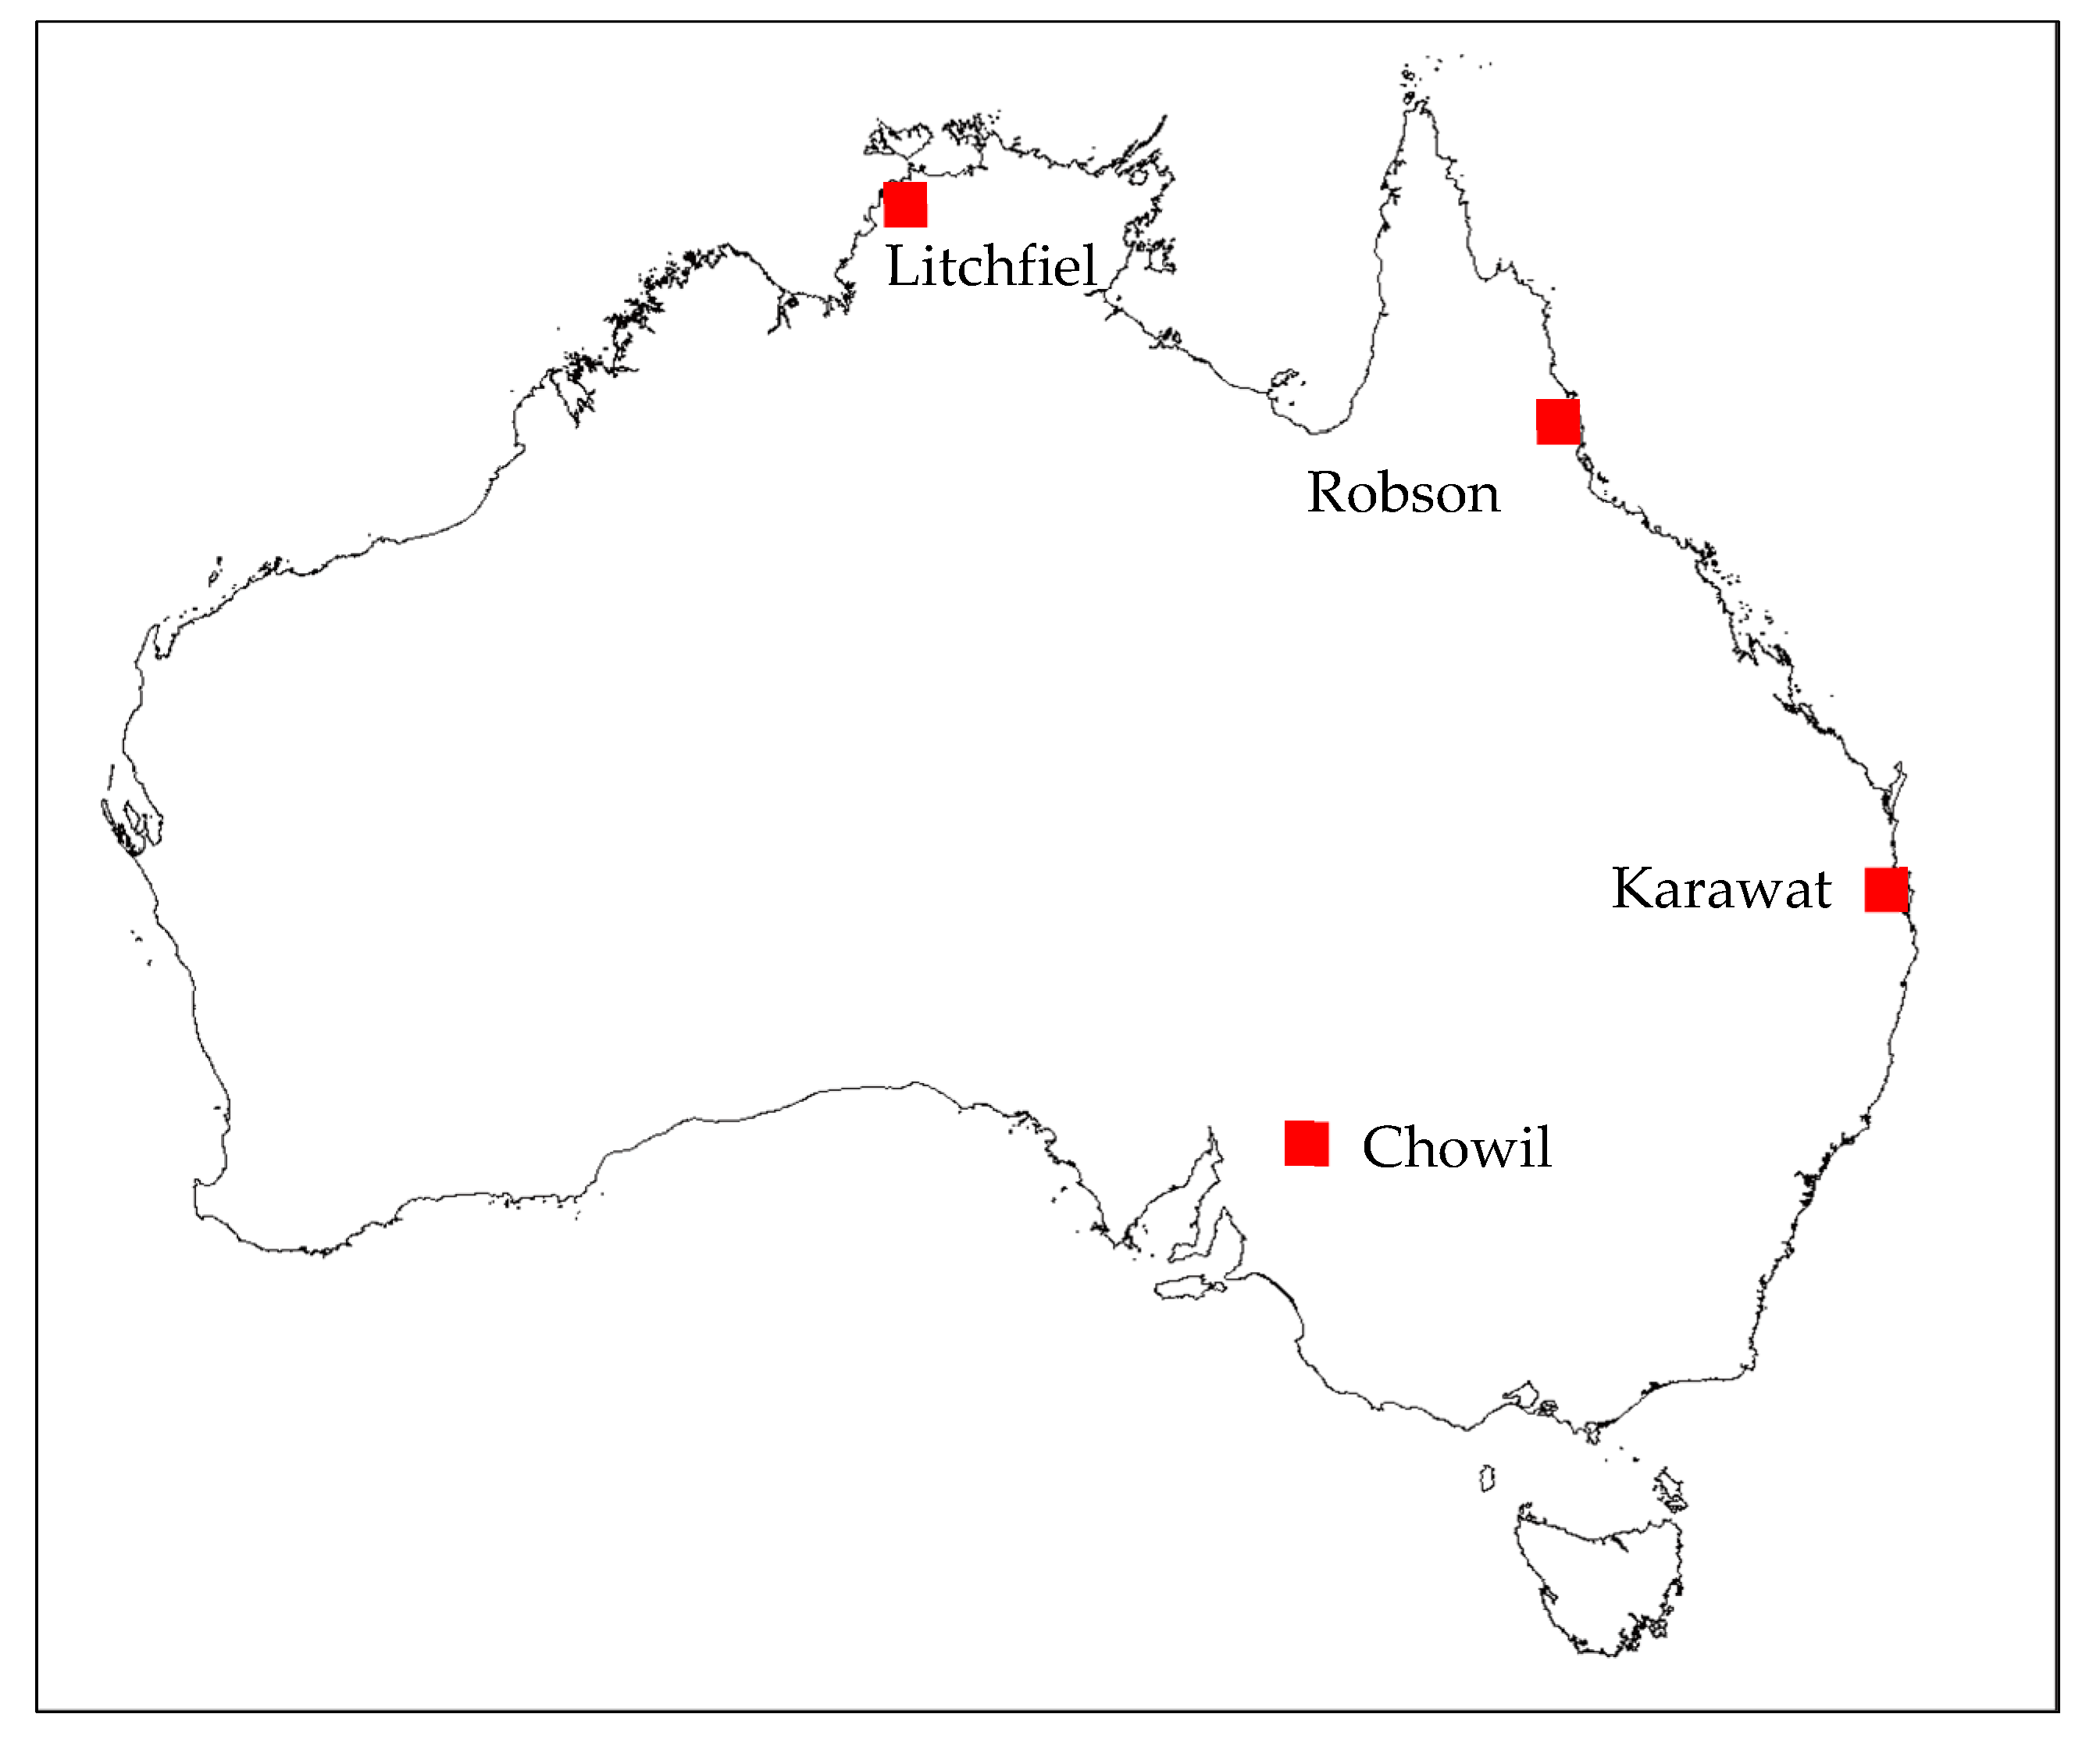
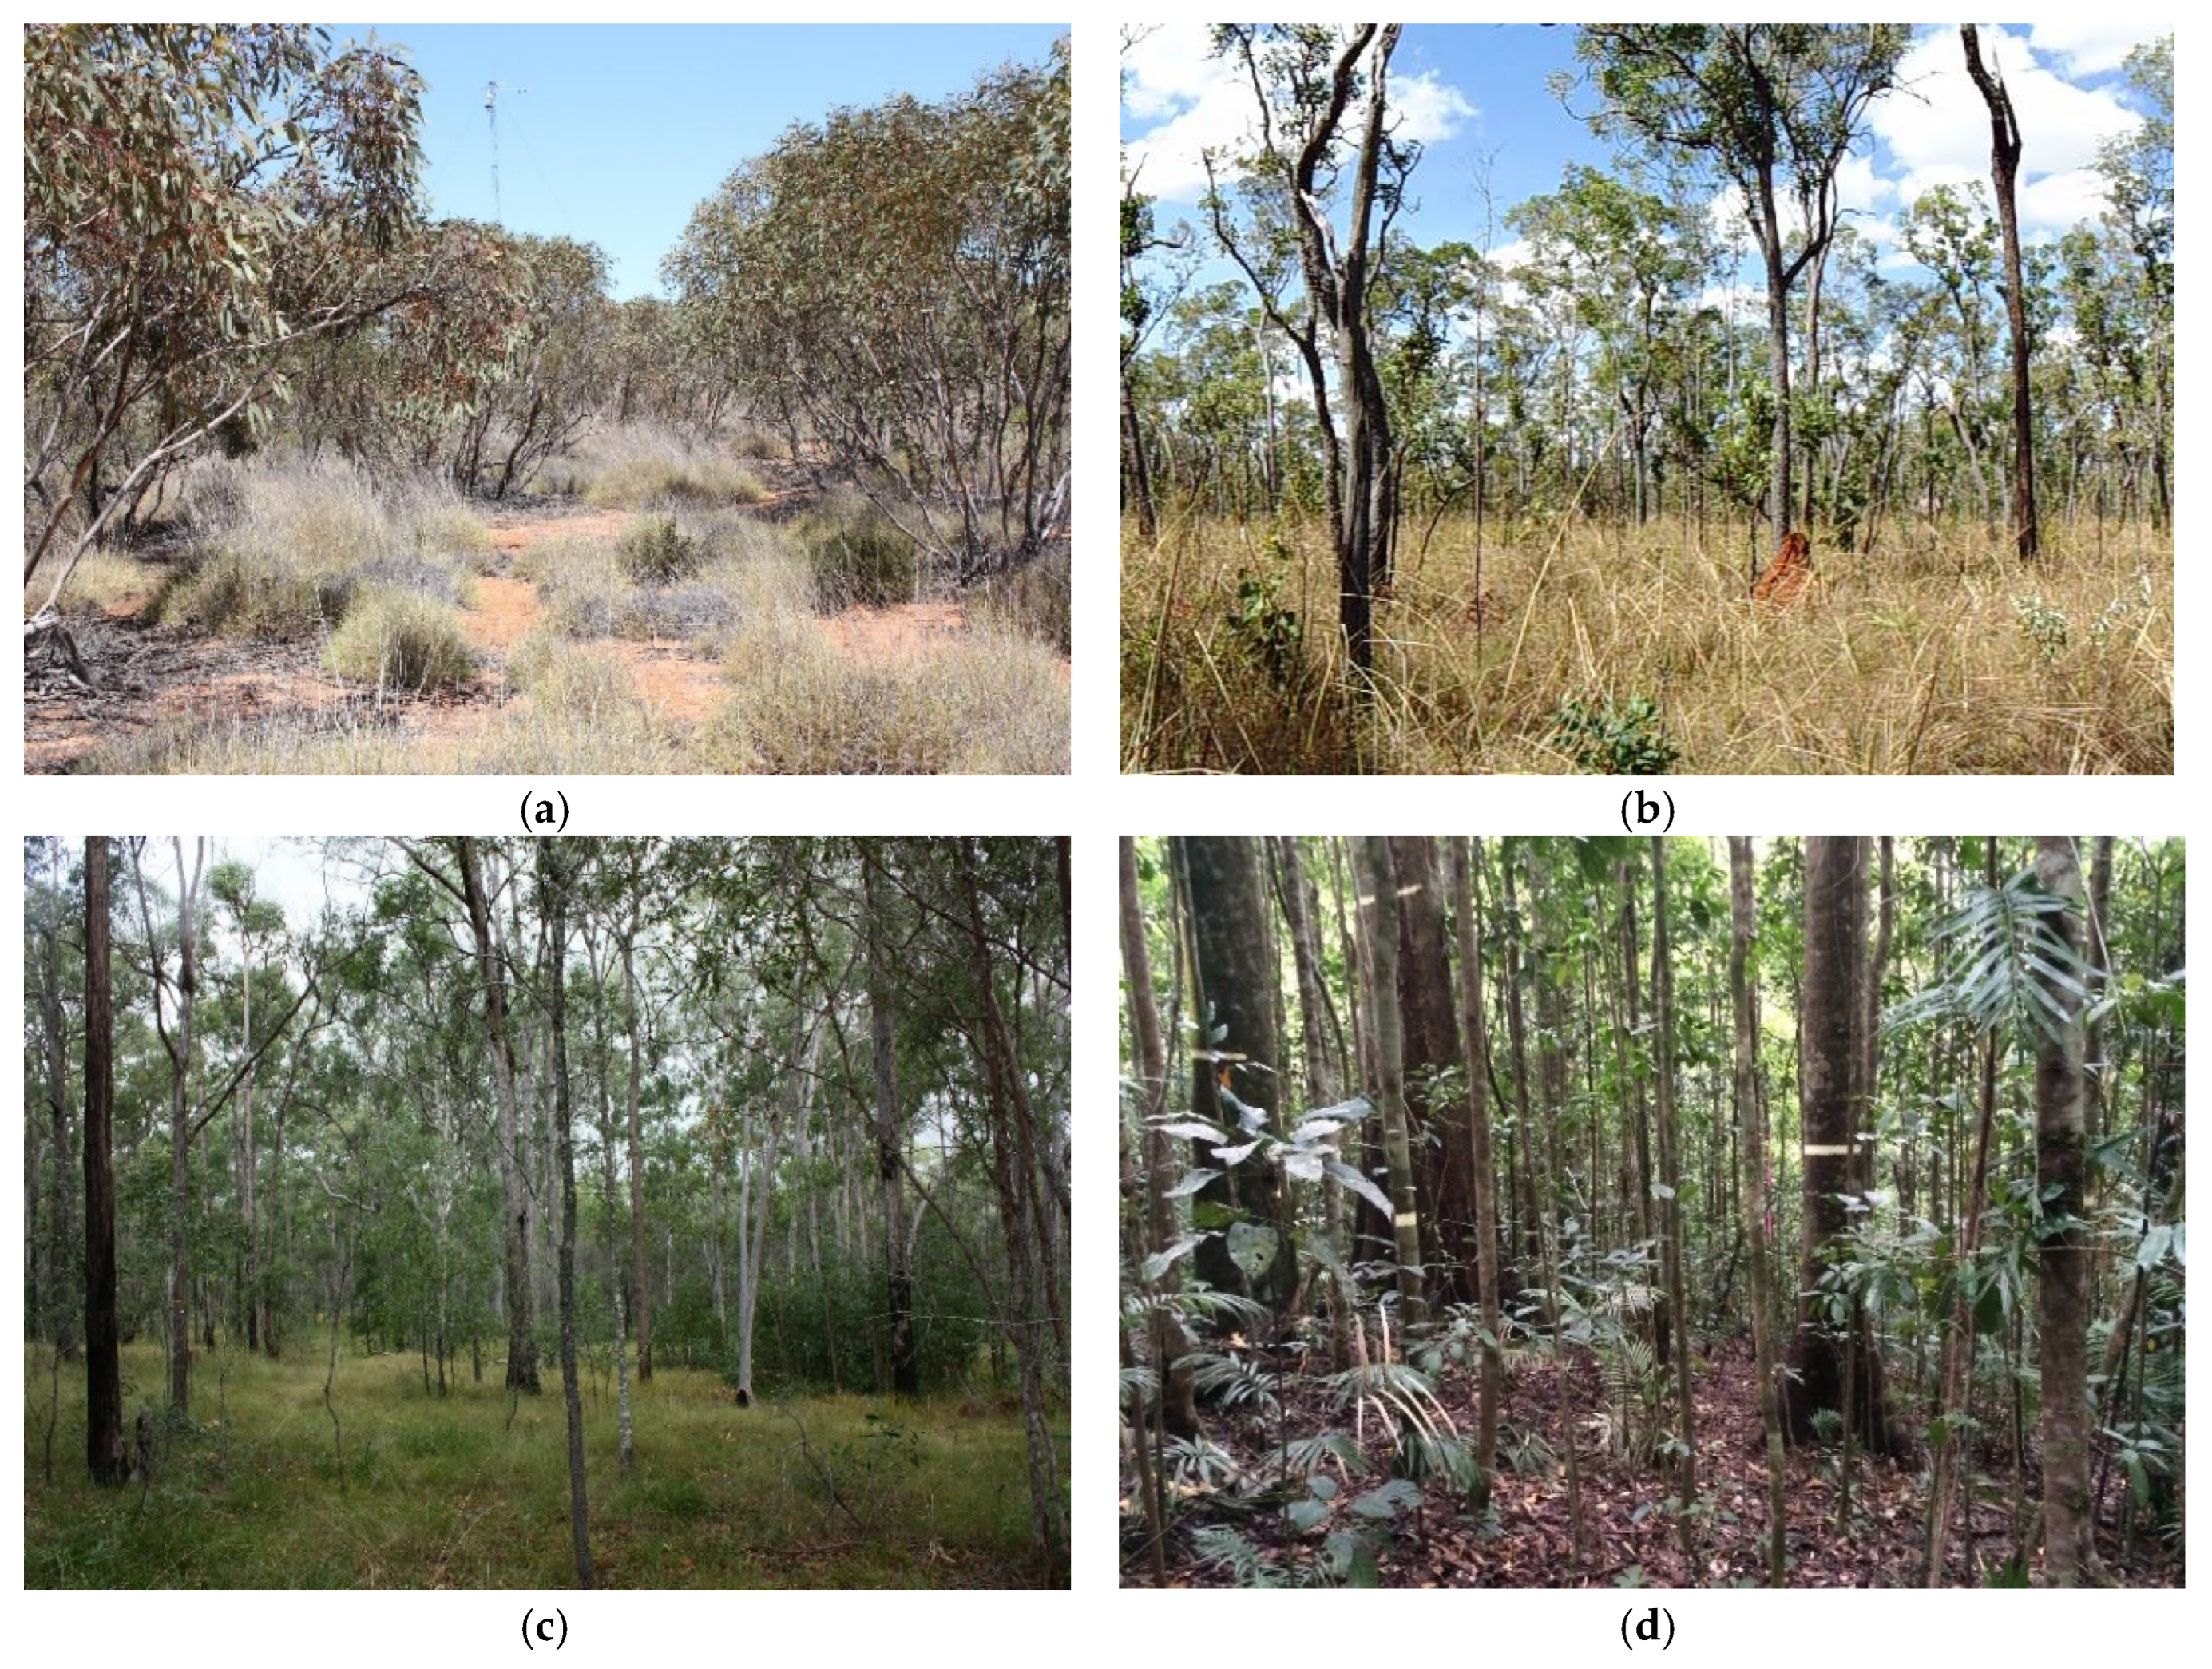
Four study sites, from the Terrestrial Ecosystem Research Network (TERN) Australian SuperSite Network (https://supersites.tern.org.au/), were chosen to provide examples representative of the diverse range of vegetation structural forms present across Australia: Chowilla, Litchfield, Karawatha, and Robson Creek. Chowilla (near Renmark, South Australia (Figure 1)) is dominated by semi-arid mallee scrub (Figure 2). Litchfield (near Darwin, Northern Territory (Figure 1)) is dominated by wet/dry tropical savanna (Figure 2). Karawatha (Brisbane, Queensland (Figure 1)) is dominated by dry open Eucalyptus forest (Figure 2), with patches of wet heath. Lastly, Robson Creek (Cairns, Queensland (Figure 1)) is dominated by simple notophyll vine forest (Figure 2).
2.2. Data
This study utilised open-access airborne laser scanner (ALS) flight-line data acquired from the TERN AusCover data facility [12]. The datasets for each site were collected between 2012 and 2013, using a RIEGL Q560 full-waveform (FWF) scanner flown at a nominal height of 300 m above ground level (AGL) [13]. The data was primarily captured using north–south oriented flight lines with a spacing of approximately 125 m [13]. The datasets used during this study were pre-processed by the data provider, Airborne Research Australia, with initial projection and classification of discrete returns performed using in-house software and the LAStools software package [13].
2.3. Methodology
A novel vertical segmentation methodology was developed from work by Caynes et al. (2016) to characterise vertical vegetation structure using ALS data collected from each study site. Segmentation was performed at fine vertical and horizontal spatial resolutions (1–2 m), with resolution dependent on the available density of discrete returns within the ALS dataset.
Ratio techniques were applied to standardise vertical segment point density values for subsequent analysis. An improvement to the characterisation of sub-canopy vegetation structure was achieved through the calculation of an adaptive ratio as:
where . denotes the final ratio value for each vertical layer, the returns between the minimum () and maximum () heights for each vertical layer, and all returns below the maximum height () of each vertical layer [8].
Exploratory analysis to characterise distinct vertical structure patterns was conducted on the vertically segmented ALS dataset using the ISODATA multi-dimensional clustering algorithm. An a posteriori classification was developed for each study site using the results of the exploratory analysis.
The established structural classification methodologies were applied to the ALS data products for each study site, enabling comparisons between the established and novel classification approaches. An analysis to assess the differences between the existing structural vegetation classifications and vertical point density-derived classifications was conducted, using several techniques including comparisons between vertical distribution profiles and analyses of class size.
3. Results and Discussion
3.1. Vertical Segmentation
Vertical segmentation of LiDAR data presents an effective solution to characterise vertical vegetation structure. The use of fine spatial resolutions (1–2 m) provided detailed results enabling an improved understanding of patterns in the selected Australian vegetation communities studied in this research. However, these fine resolutions posed significant processing and analysis challenges, requiring the consideration of data quality and spatial resolutions.
The ALS datasets collected for Chowilla, Litchfield, and Karawatha were of appropriate quality for the high spatial resolution (1 m) analysis and vegetation structure mapping conducted during this research (Table 1). By comparison, the high vegetation densities present across the Robson Creek study site resulted in reduced data quality and relative spatial accuracy (Table 1). While these anomalies within the ALS datasets present analysis challenges, potentially reducing the overall accuracy of the generated products, they are common occurrences encountered during ALS data collection, particularly in challenging terrain and vegetation communities.
While this project investigated the highest possible spatial resolutions at which vertical segmentation could be conducted, appropriate resolutions for repeatable analyses would likely be broader. Spatial resolutions between 10 and 30 m would better align with regional and continental scale mapping [6,10]. As the application of vertical segmentation methodologies remains limited within the Australian context, further work is required to determine suitable resolutions at which segmentation and classification should occur for the range of vegetation communities across the continent.
3.2. Point Density Ratios
The application of point density ratio techniques to calculate relative vegetation densities is an established technique within LiDAR vegetation structure analysis. Primarily, these relative density layers are sub-components of a broader vegetation analysis, with summary statistics typically generated to enable the integration with additional factors [8,9]. However, this study used these relative density layers as the primary input for exploratory classifications, enabling the characterisation of the overall vertical structure.
The implementation of height-dependent ratio calculations provides a means to overcome occlusion as vegetation density increases. However, this technique can place increased importance on point densities within lower vegetation strata. Where dense canopy vegetation is present, there is an increased likelihood of random under-sampling in lower strata. Although there are limited examples of high spatial resolution vertical segmentation within Australia from which to draw point density recommendations, the results of international studies indicate point densities above 10 points/m2 are necessary [14]. While all sites within this study possess average point densities well above this threshold, the distribution of these points becomes increasingly biased towards the canopy, as vegetation density increases. This pattern is particularly evident at Robson Creek, with high canopy density and limited canopy gaps resulting in reduced point densities within sub-canopy vegetation strata.
While overall cell point densities are an important factor dictating the applicability of segmentation methods, further constraints on the usage of fine resolution vertical segmentation methods are required to account for point densities within individual segments. Such values should be scaled with respect to both vegetation density and canopy height, as both influence the rate of under-sampling in sub-canopy vegetation strata. Within this project, values between 1 and 2 points per cubic metre were found applicable for accurate classifications incorporating all vegetation strata.
3.3. Classification Comparisons
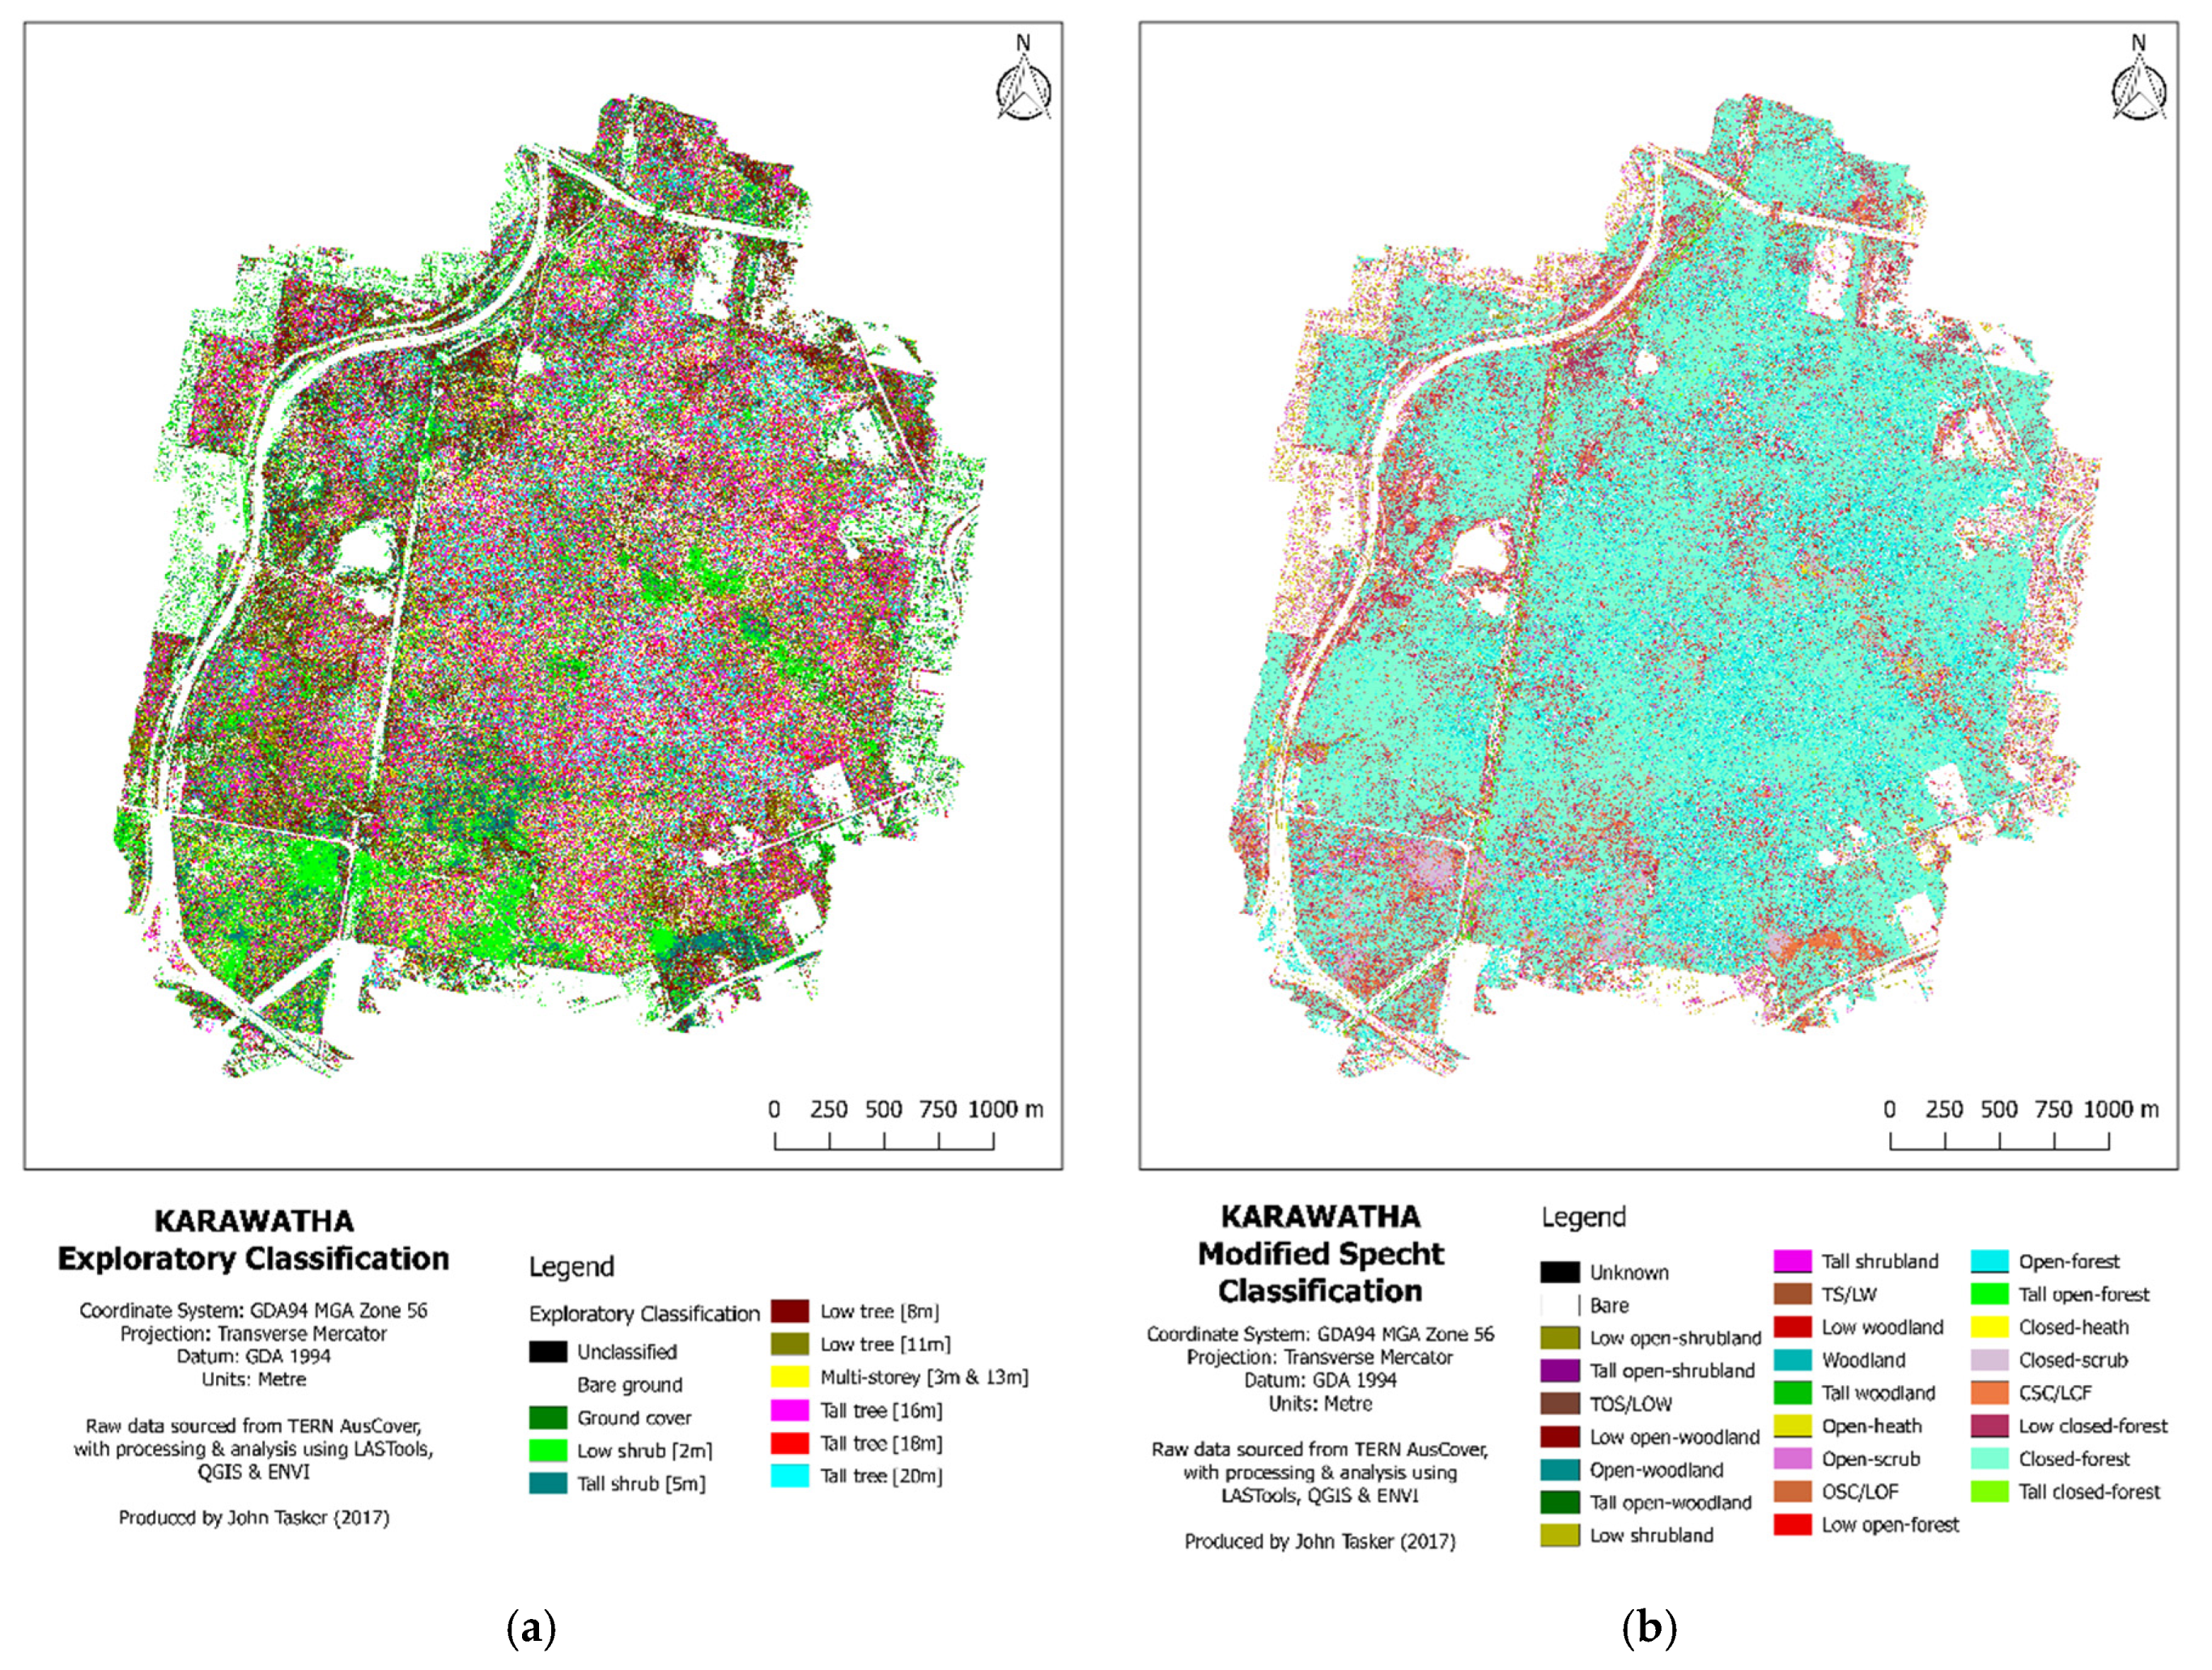
The exploratory LiDAR-derived classification provides insights into the potential application of these datasets for the classification of vertical vegetation structure (Figure 3). The equal significance of each segment within the classification ensures that the complete vertical vegetation profile is characterised. At fine spatial resolution, these classifications provide nuanced details about the structure and composition of vegetation communities present across each study site.
The results from applying the Specht classification to the LiDAR data provide a clear point of comparison for the exploratory LiDAR-derived structural classifications (Figure 1). With a focus on the canopy vegetation structural parameters, this classification is relatively simple to conduct and interpret. While this simplicity is useful for communication and visualisation purposes, the Specht classification is limited in its capacity to characterise the vertical distribution of sub-canopy vegetation. Comparisons with LiDAR-derived classification results provide clear examples of the critical information that can be extracted from the improved integration of LiDAR information within vegetation classifications.
4. Conclusions
The findings of this work demonstrate that high spatial resolution LiDAR data can be used to accurately characterise the fine spatial resolution (1–2 m) vertical structure of Australian vegetation communities. Future work within this field of inquiry is essential to ensure the integration of LiDAR-derived structural products within vegetation classifications and the formalisation of a repeatable and site-independent classification framework for vertical vegetation structure. Additional investigation is recommended to assess appropriate spatial resolutions and data quality requirements necessary to support multiple LiDAR-based mapping and monitoring applications. With an improved understanding of the structure and diversity of Australian vegetation comes the capacity to better protect and restore these environments.
Author Contributions
J.T. designed the study, performed the processing and analysis work, and prepared this manuscript; S.P. contributed to the design of the study.
Acknowledgments
This research was performed using data provided by the TERN AusCover data facility. Special thanks to Dan Wu and Kasper Johansen for technical support and expertise, David Padget and Sarah Ballinger for field assistance, and Gillian Marriott for proofreading.
Conflicts of Interest
The authors declare no conflict of interest.
References
- Specht, R.L. Vegetation. In Australian Environment, 4th ed.; Leeper, G.W., Ed.; Melbourne University Press: Melbourne, Australia, 1970; pp. 44–67. [Google Scholar]
- Gill, T.; Johansen, K.; Phinn, S.; Trevithick, R.; Scarth, P.; Armston, J. A method for mapping Australian woody vegetation cover by linking continental-scale field data and long-term Landsat time series. Int. J. Remote Sens. 2016, 38, 679–705. [Google Scholar] [CrossRef]
- Lucas, R.; Bunting, P.; Paterson, M.; Chisholm, L. Classification of Australian forest communities using aerial photography, CASI and HyMap data. Remote Sens. Environ. 2008, 112, 2088–2103. [Google Scholar] [CrossRef]
- Neldner, V.J.; Wilson, B.A.; Thompson, E.J.; Dillewaard, H.A. Methodology for Survey and Mapping of Regional Ecosystems and Vegetation Communities in Queensland; Queensland Herbarium: Brisbane, Australia, 2012; p. 124. [Google Scholar]
- Sun, D.; Hnatiuk, R.J.; Neldner, V.J. Review of vegetation classification and mapping systems undertaken by major forested land management agencies in Australia. Aust. J. Bot. 1998, 45, 929–948. [Google Scholar] [CrossRef]
- Keith, D.A.; Pellow, B.J. Review of Australia’s Major Vegetation Classification and Descriptions; Centre for Ecosystem Science, University of New South Wales: Sydney, Australia, 2015. [Google Scholar]
- Beraldin, J.-A.; Blais, F.; Lohr, U. Laser scanning technology. In Airborne and Terrestrial Laser Scanning; Vosselman, G., Maas, H.-G., Eds.; Whittles Publishing: Dunbeath, UK, 2010; pp. 1–43. [Google Scholar]
- Caynes, R.J.C.; Mitchell, M.G.E.; Wu, D.S.; Johansen, K.; Rhodes, J.R. Using high-resolution LIDAR data to quantify the three-dimensional structure of vegetation in urban green space. Urban Ecosyst. 2016, 19, 1749–1765. [Google Scholar] [CrossRef]
- Miura, N.; Jones, S.D. Characterizing forest ecological structure using pulse types and heights of airborne laser scanning. Remote Sens. Environ. 2010, 114, 1069–1076. [Google Scholar] [CrossRef]
- Wilkes, P.; Jones, S.D.; Suarez, L.; Haywood, A.; Mellor, A.; Woodgate, W.; Soto-Berelov, M.; Skidmore, A.K. Using discrete-return airborne laser scanning to quantify number of canopy strata across diverse forest types. Methods Ecol. Evol. 2016, 7, 700–712. [Google Scholar] [CrossRef]
- Koenig, K.; Höfle, B. Full-waveform airborne laser scanning in vegetation studies—A review of point cloud and waveform features for tree species classification. Forests 2016, 7, 198. [Google Scholar] [CrossRef]
- Paget, M. Airborne LiDAR- Reigle Q560, Point, Raster and Full Waveform, Australian Field Sites (Including AusCover Supersites). Available online: http://auscover.org.au/xwiki/bin/view/Product+pages/Airborne+Lidar (accessed on 12 August 2016).
- Hacker, J.M.; Lieff, W.; McGrath, A.J. Tern AusCover Data Report; Airborne Research Australia: Parafield, Australia, 2013. [Google Scholar]
- Leiterer, R.; Furrer, R.; Schaepman, M.E.; Morsdorf, F. Forest canopy-structure characterization: A data-driven approach. For. Ecol. Manag. 2015, 358, 48–61. [Google Scholar] [CrossRef]
Figure 1.
Study site locations.
Figure 2.
Study site field photography: (a) Chowilla; (b) Litchfield; (c) Karawatha; (d) Robson Creek.
Figure 2.
Study site field photography: (a) Chowilla; (b) Litchfield; (c) Karawatha; (d) Robson Creek.
Figure 3.
Classification comparison for Karawatha study site between (a) LiDAR-derived exploratory classification; (b) Specht classification. See presentation for higher resolution maps.
Figure 3.
Classification comparison for Karawatha study site between (a) LiDAR-derived exploratory classification; (b) Specht classification. See presentation for higher resolution maps.

Table 1.
Airborne laser scanner (ALS) data properties of the study sites.
| Study Site | Point Density (Last Only) | Spacing (Last Only) | Area Covered |
|---|---|---|---|
| Chowilla | 54.33 pts/m2 (33.95 pts/m2) | 0.143 m (0.16 m) | 26.02 km2 |
| Litchfield | 28.77 pts/m2 (20.80 pts/m2) | 0.19 m (0.22 m) | 26.02 km2 |
| Karawatha | 45.16 pts/m2 (22.87 pts/m2) | 0.15 m (0.21 m) | 12.77 km2 |
| Robson Creek | 50.68 pts/m2 (31.05 pts/m2) | 0.14 m (0.18 m) | 26.03 km2 |
Publisher’s Note: MDPI stays neutral with regard to jurisdictional claims in published maps and institutional affiliations. |
© 2018 by the authors. Licensee MDPI, Basel, Switzerland. This article is an open access article distributed under the terms and conditions of the Creative Commons Attribution (CC BY) license (https://creativecommons.org/licenses/by/4.0/).
Share and Cite
MDPI and ACS Style
Tasker, J.; Phinn, S. Vertical Segmentation of Airborne Light Detection and Ranging (LiDAR) for Select Australian Vegetation Communities. Proceedings 2018, 2, 338. https://doi.org/10.3390/ecrs-2-05151
AMA Style
Tasker J, Phinn S. Vertical Segmentation of Airborne Light Detection and Ranging (LiDAR) for Select Australian Vegetation Communities. Proceedings. 2018; 2(7):338. https://doi.org/10.3390/ecrs-2-05151
Chicago/Turabian StyleTasker, John, and Stuart Phinn. 2018. "Vertical Segmentation of Airborne Light Detection and Ranging (LiDAR) for Select Australian Vegetation Communities" Proceedings 2, no. 7: 338. https://doi.org/10.3390/ecrs-2-05151