1. Introduction
“Green space” is the area in urban covered by mainly vegetation and is regarded as an important element in Urban Sustainable Development [
1]. At the same time, Green Space is the signal to identify environment quality and residents’ life quality [
2,
3]. Currently, there are two main methods to assess and quantify the urban green space. The “conventional” method is used to assess the quality or urban green space by using perception and self-awareness of residents with questionnaire and field survey. Nevertheless, this method requires a large amount of time to conduct survey and the outcomes will be objective because the self-awareness towards green space is different among each person. The second method uses Earth observation system with satellites, which has become an indispensable tool for researching and managing land use status as well as the coverage of urban green space [
3]. Recently, with the rapid development of remote sensing technology along with the improvement of satellites image processing, many cities in the world have applied the former to collect information about real coverage to determine urban green space and optimize the structure of city green space [
4].
The research purpose of this article is to analyze space with the application of remote sensing technology to determine the urban green space distribution at Nha Trang (located in the central Vietnam), thus assessing and predict the Change of such distribution with time and space. From such, the proper management methods aligning with the city’s targeted urbanization will be proposed.
2. Methodology
2.1. Data:
The satellite images used for research consist of: the ALOS AVNIR2 captured in 17 July 2007 (space resolution: 10 m) and the LANDSAT 8 OLI&TIRS captured in 21 April 2017 (space resolution 30 m, full color-channeled resolution: 15 m). Both images were captured at daylight, with transparency and low cloud’s coverage (below 10%).
2.2. Method
2.2.1. Supervised Classification
Classification is verified on sample pixels which are selected by analysts. By choosing sample, the analyst has helped the computer to determine the pixels with the same features of reflection spectrum. In this research, the Verified classification method with MLC (Maximum Likelihood Classifier) has been used. The system employed in this case includes 4 main targets: water, unoccupied land, vegetation and impermeable surface
2.2.2. Change Analysis after Classification
The techniques and algorithms which detect changes at different stages of objects in satellite images have been established based on the development of remote sensing technology featuring characteristics of space, spectrum, temperature and time. Currently, many methods have been proposed to identify the development of coverage using data, which include: comparation of coverage’s classifications; multi-time images classification; subtraction image or division image; difference in real coverage index; main elements analysis [
5]. In this article, the authors used the Change analysis after classification method to determine changes of real coverage status at Nha Trang city, especially green coverage and impermeable surface
2.2.3. Development Prediction Method Using Markov Chain
Development prediction model using Markov chain relies on two map layers which are introduced to build transition matrix. Therefore, the model will check every real coverage and determine to transit pixel number of real coverages at time “t” (year 2017) to that at time
t + 1 (year 2017), thus calculating the transition pixel quantity and converting to the percentage change of every type of coverage [
6]. Pij is the matrix transiting probability of real coverage i to real coverage j. Suppose that this matrix is stable with time, it can be used to predict the distribution of real coverage layers in the future with the recent data. This means in the future time, from 2017 to 2027, the urbanization at Nha Trang will occur as similarly as it did from 2007 to 2017. In this research, the probability transition matrix has the 4x4 from (including water, unoccupied land, vegetation and impermeable surface). The input of Markov chain’s analysis consists of 2 variables: the area of 4 real coverage layers in 2017 and probability transition matrix among real coverage layers from 2007 to 2017. The total area of these 4 layers in 2017 were calculated directly after the satellite images process was conducted. Probability transition matrix among real coverage layers were identified on ArcGIS software after the process of collapsing two real coverage classification’s maps in 2007 and 2017 was practiced.
2.2.4. Urban Green Space Index Assessment Method (per Capita)
Based on many researches which built urban environment quality index in Vietnam, the index “green area/capita” is an important index to evaluate environment quality and urban space [
7]. This index is built to assess the quality of urban green coverage. The urban green space index after calculation is compared with TCXDVN 9257:2012 to evaluate the status of urban green space distribution.
3. Results and Discussion
3.1. Land Cover Distribution in 2007 and 2017
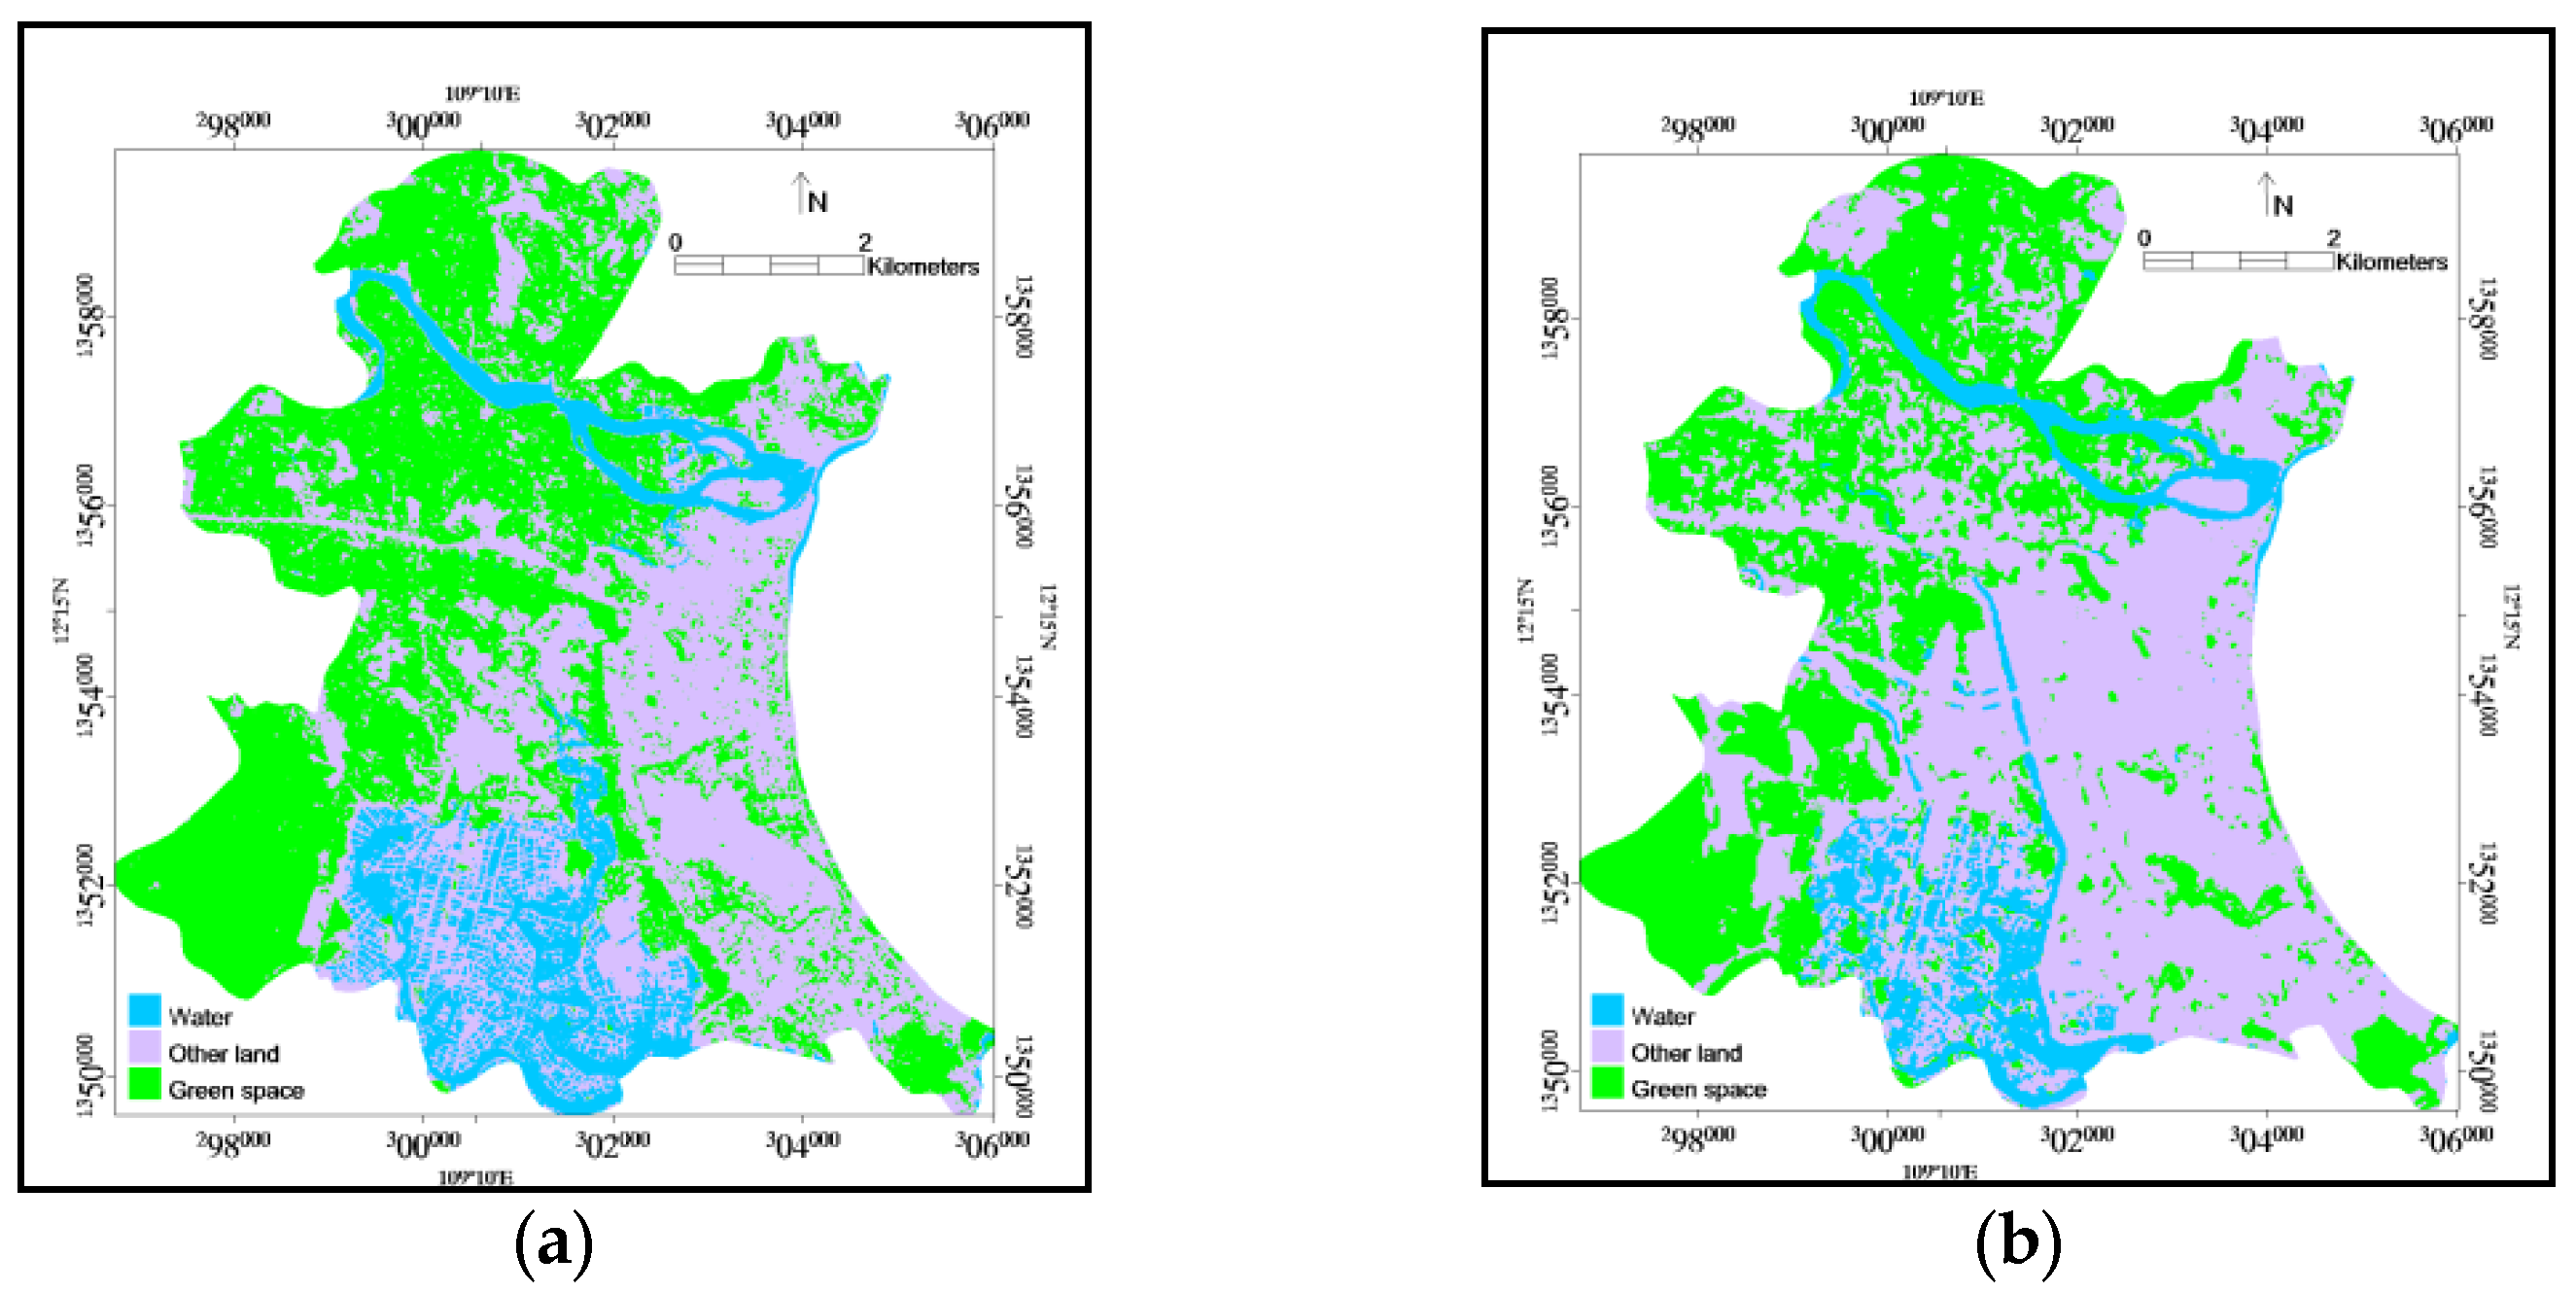
To evaluate the accuracy of classification results, the authors used a verified sample set, randomly picked similarly with choosing from the classified sample set. The result of classification on ALOS AVNIR2 2007 is shown with the total accuracy up to 90.43% and the Kappa coefficient at 0.89. Likewise, in 2007, the result of classification on Landsat 8 OLI is also shown with the total accuracy up to 91.21% and Kappa coefficient at 0.89.
The results showed, in 2007, that the vegetation layer majorly accounted for 73.87% of total coverage, followed by unoccupied land layer (12.23%), impermeable surface layer (9.34%) and water layer (4.06%). Until 2017, the distribution of layers in percentage has changed. Particularly, the vegetation layer still largely accounted for 72.81%, followed by impermeable surface area (15.15%), unoccupied land layer (8.18%) and water layer (3.86%). As a result, after 10-year time, the distribution of coverage layers has changed apparently. The majority of Nha Trang city’s area is covered with vegetation (more than 70%), especially in the northern and southern area of the city. Therefore, the area of vegetation coverage (throughout the metropolitan area) slightly reduced 1.44% from 2007 to 2017. However, when we examined inner-city area and other surrounding areas during urbanization, the urban green space area is decreasing rapidly. From 2007 to 2017, the area of urban green space reduced around 21.69% (
Table 1 and
Figure 1)
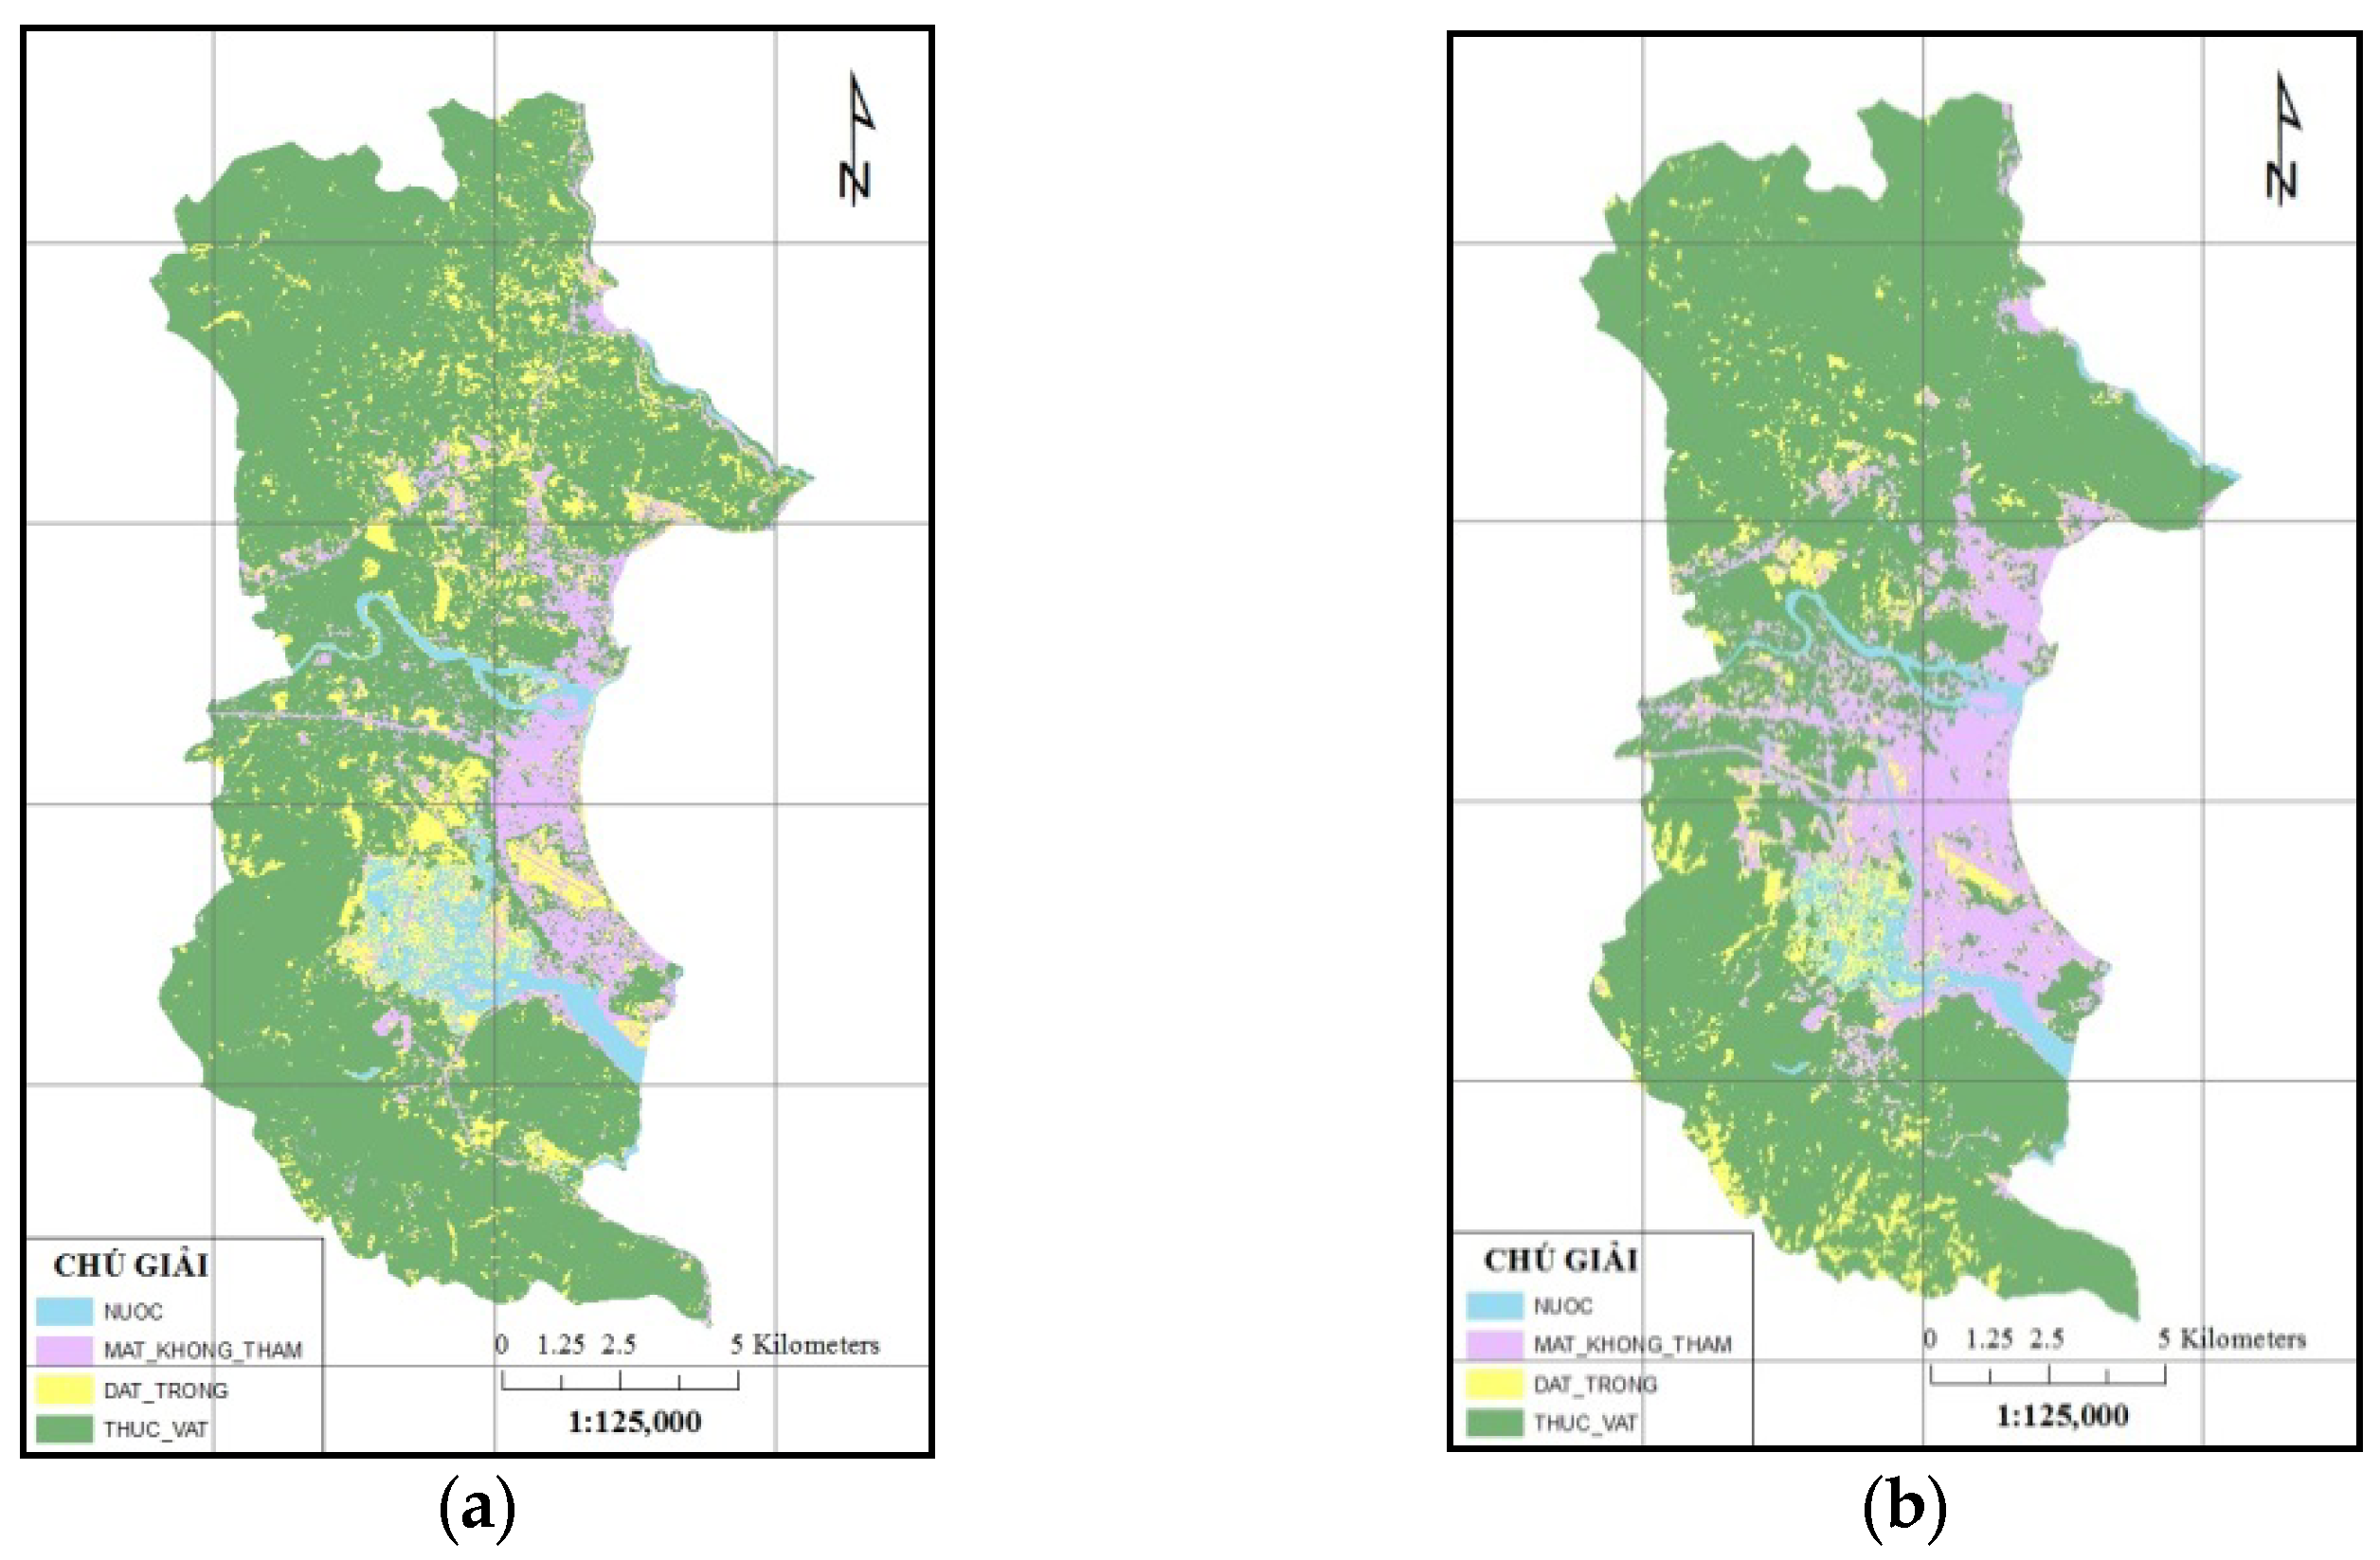
Based on the real coverage layers distribution’s maps in 2007, Nha Trang city prioritized urban development at coastal area (ranging from Tran Phu Street to Le Hong Phong Street). This area had low proportion of urban green space, while most green space distributed closely in northern, southern mountainous area and a small western area of the city (
Figure 2). Meanwhile, until 2017, although urban green space is mainly distributed in northern mountainous area and southern area, the western part has started the urbanization and the urban green space here is gradually replaced by impermeable surface (
Figure 2).
3.2. Change of Urban Green Space and Prediction
3.2.1. Change of Urban Green Space from 2007 to 2017
The result showed that throughout 10 years (from 2007 to 2017), only the impermeable surface’s area has increased 1255.61 ha on the total research area. Meanwhile, the other coverages such as water, unoccupied land and vegetation’s areas have decreased respectively around 173.34 ha, 853.72 ha and 229.15 ha. Therein, most of vegetation coverage has reduced because this coverage transformed into impermeable surface (transited 1149.89 ha) and unoccupied land (transited 997.83 ha)—which is covered for the coming new urban project. Besides, the research results also showed that the increment in impermeable surface area is largely due to the addition from vegetation coverage (1149.89 ha) and part of unoccupied land (547.66 ha). From the analysis above, we realized that urban development (urbanization) has severely decreased the vegetation coverage area and dramatically increased impermeable surface area.
At inner-city area and urbanization area, the vegetation coverage Change’s trend is similar with the situation above. From 2007 to 2017 (
Table 2), only the impermeable surface’s area has increased 1004.96 ha on the total research area. Meanwhile, the other coverages such as water, unoccupied land and vegetation’s areas have decreased respectively around 133.86 ha, 352.79 ha and 519.31 ha. From the mentioned results, throughout the metropolitan area, the unoccupied land area decreased the most. However, when examining on inner-city area and urbanization area, the vegetation coverage area reduced the most. Especially, when comparing with the whole area of the city, the urban green space at inner-city areas and urbanization areas have decreased more severely, with respective value of 229.15 ha and 519.31 ha. This is explained by the increase of green space area in suburban areas such as Vinh Luong, Vinh Hai and Vinh Phuong, thus causing the urban green space in inner-city areas and urbanization areas to decrease more than that in metropolitan area
3.2.2. Land Use Change Prediction in 2007
From the data of vegetation coverage Change during 2007–2017 and status of real coverage in 2017, the authors conducted the prediction of real coverage distribution in 2027. The input variable of this process includes area of real coverage at current time (2017) and matrix transiting probability from this coverage to the other coverage (transit probability among coverages from 2007 to 2017). The output variables of this calculation process is the area of prospective real coverage (2027).
The results showed that, in the prediction of year 2027, the urban green space area of Nha Trang City will continue decreasing 437.47 ha (2.78%) from 2017 to 2027. Similarly, the water coverage and unoccupied land will continue decreasing respectively 131.35 ha and 108.54 ha. However, the impermeable surface in Nha Trang city have propensity to increase 677.33 ha from 2017 to 2027. Therefore, if urbanization continues, much as similarly as from 2007 to 2017, in the future (2027), the urban green space will continue decreasing while impermeable surface area increase. As a result, to preserve and conserve the urban green space in metropolitan area, the related offices must re-adjust construction plans for the city in the future.
3.3. Urban Green Space Index and the Consequences of Reducing Urban Green Space
The urban green space index per capita has been used to evaluate environment quality and urban space all over the world [
8,
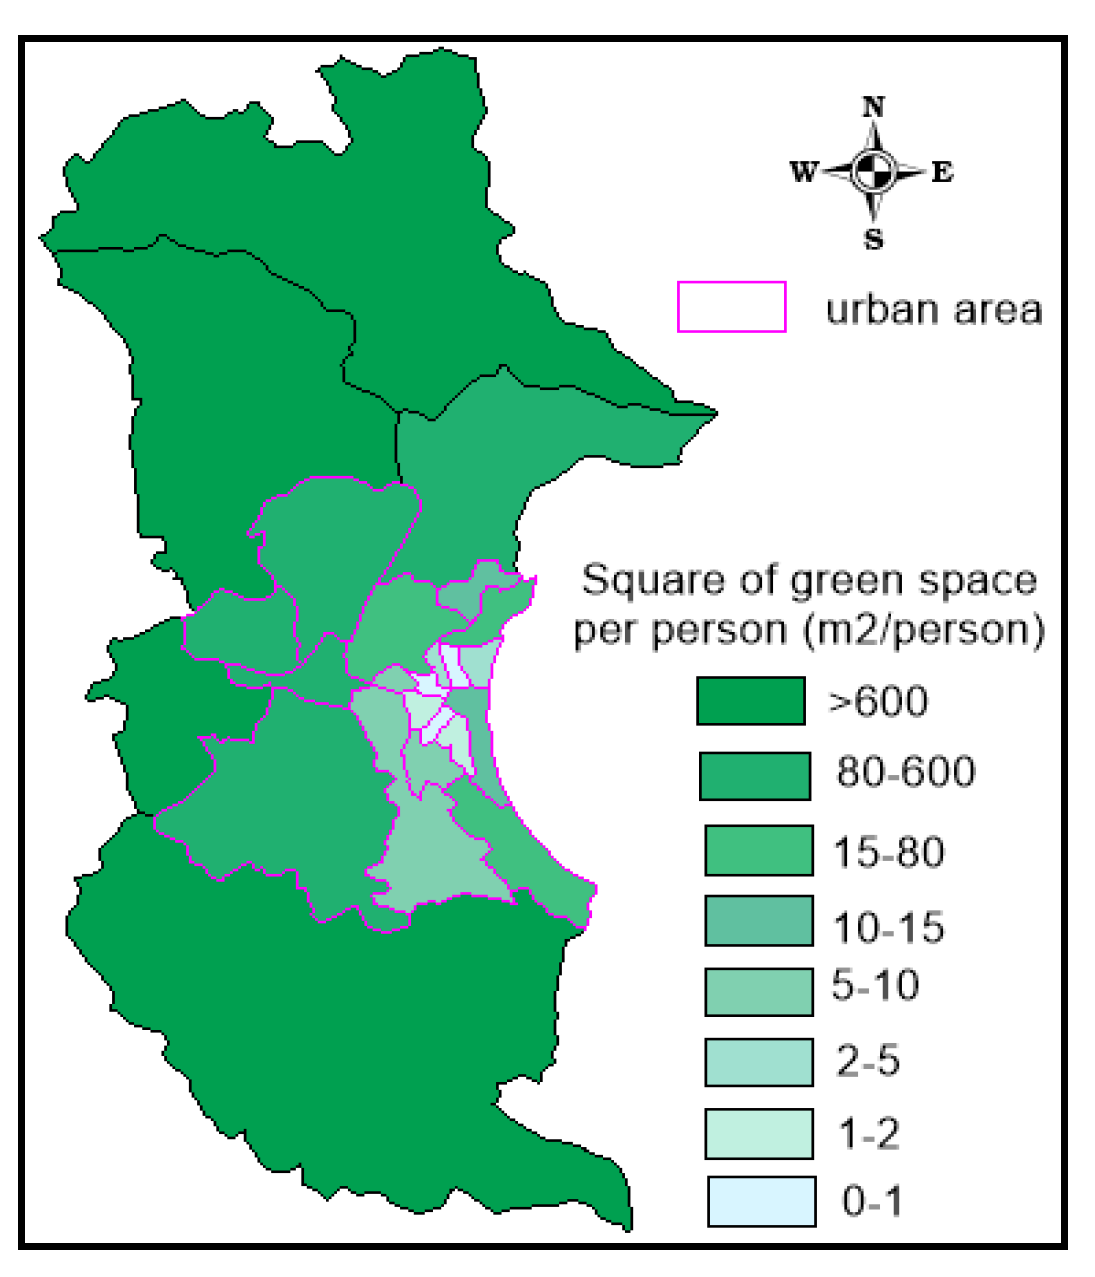
9]. Based on the population statistics of research area, in the urbanization area with many residences being built, the new urban areas show positive result with the urban green space index per capita over 100 m
2/capita. However, in the inner-city area, most of the urban green space index per capita are low, under 10 m
2/capita (apart from Ward Loc Tho). Especially, in Ward Van Thanh, Phuong Sai, Phuoc Tien, the green space index per capita is under 1 m
2/capita (
Figure 3). The results above showed that these inner-city areas are severely short of urban green space, based on TCXDVN 9257:2012. Thus, the green space index per capita in the inner-city areas of Nha Trang city is much lower than that of mentioned cities. These areas are even in severe shortage of green space compared with the equivalent areas of Ho Chi Minh City and Hanoi.
Rapidly increasing land in urban area and heavily reducing vegetation in city have caused many negative impacts on living environment quality of residents and tourists in Nha Trang city. According to the research overview of author Dang Trung Tu, the expansion and increment in impermeable surface area and reduction in urban green space may lead to many consequences such as increasing air temperature in the city due to the thermal radiation of concrete; raise the probability of flood; weakening the quality and amount of groundwater resource due to natural permeable surface (Dang Trung Tu et al., 2015). Besides, this can lead to the increase of disasters and environmental risks, especially flood and erosion in Nha Trang city. This is a warning to which must be paid attention to guarantee the urban green space for sustainably developing urban.
4. Conclusions
Currently, there are many methods to construct urban green space distribution’s maps. However, applying remote sensing technology to research distribution and Change of urban green space is a positive method which lead to effective result, time reduction, manpower savings, thus meeting the demands on recent society. This vegetation classification process leads to a positive result on both satellite images with accuracy over 90% and Kappa coefficient around 0.9. Most area of Nha Trang is covered by vegetation with density over 70%; however, in other inner-city areas, the urban green space is very low (under 10%). With the current urbanization speed, in 2027, the urban green space area will reduce around 2.78%. The urban green space index per capita in inner-city areas is very low, mostly under 10 m2/capita, or under 1 m2/capita in some areas, much lower than the standards in TCXDVN 9257:2012. Since then, we recognize that inner-city areas are in severe shortage of urban green space, and in need of increasing urban green space such areas in Nha Trang.

 ,
, 


