Novel Food-Safe Spin-Lattice Relaxation Time Calibration Samples for Use in Magnetic Resonance Sensor Development †


School of Science and Technology, Nottingham Trent University, Nottingham NG11 8NS, UK
*
Author to whom correspondence should be addressed.
†
Presented at the 4th International Electronic Conference on Sensors and Applications, 15–30 November 2017; Available online: http://sciforum.net/conference/ecsa-4.
Proceedings 2018, 2(3), 122; https://doi.org/10.3390/ecsa-4-04916
Published: 14 November 2017
(This article belongs to the Proceedings of The 4th International Electronic Conference on Sensors and Applications)
Abstract
:Magnetic Resonance (MR) sensors are an area of increasing interest for the measurement and monitoring of material properties. There are two relaxation times associated with samples that can be measured with MR sensors: The spin-lattice and spin-spin relaxations. When developing new sensors, it is desirable to have a series of standards by which instruments can be assessed. The standard calibration materials available typically comprise different concentrations of Nickel Sulphate which is carcinogenic and toxic. In this work we report the use of solutions containing full fat milk powder as a safe and inexpensive material that shortens the longitudinal relaxation time of water over a wide range of values. We demonstrate that concentrations in distilled water from 5% w/v to 64% w/v give T1 values from 1.7 s down to 469 ms respectively in a 1.5T clinical MRI, while within an MR sensor these times were from 1.6 s down to 431 ms. In addition, both systems have the same exponential coefficient (−0.022× concentration) that demonstrates the effectiveness of the NMR sensor in comparison to the clinical MRI.
1. Introduction
Sensors based on the measurement of Magnetic Resonance (MR) relaxation times have been increasing in popularity, due in part to developments in permanent magnet technology. Such sensors typically measure the spin-lattice (longitudinal) relaxation time T1, or the effective spin-spin (transverse) relaxation time T2eff [1,2,3]. The molecular size, the physical and chemical environment of the nucleus, such as the viscosity of the solution affect the MR relaxation times, thus allowing determination of material properties. It is therefore important when developing such sensors, that there are a range of safe and repeatable reference samples to aid in calibration and testing. For the spin-spin relaxation times different viscosities of polydimethylsiloxane (PDMS) oil provide a suitable range of safe test materials [4,5]. However, for the spin-lattice relaxation times, available options are not as safe to use and typically consist of different concentrations of Nickel Sulphate, which is carcinogenic and toxic or Copper Sulfate solutions [6,7].
It has been previously shown that the water self-diffusion in dairy products depends on the amount of the protein, lactose and fat in the sample which also affect the relaxation times [8,9]. In this work we report the use of solutions comprising of full fat milk powder as a safe and inexpensive material that can affect the longitudinal relaxation time over a wide range of values and give a set of samples which are easily replicated in any setting. We demonstrate that concentrations in distilled water from 5% w/v to 64% w/v produce a wide range of T1 values. We validate the range of T1 values on a 1.5T clinical MRI system and MR Sensor.
2. Material and Methods
2.1. Sample Preparation
Full fat milk powder (NIDO, Nestle, Vevey, Switzerland) and distilled water are all that is required to prepare the test samples. The milk powder was dissolved in distilled water at seven different concentrations (5%, 11%, 18%, 23%, 38%, 50% and 64% all w/v) within sample tubes and mixed thoroughly before the clinical MRI images were collected. The measurements made with the magnetic resonance sensor were collected using freshly prepared samples. Three of each sample were extracted and used to fill separate 5 mm glass, standard NMR tubes to collect average measurements for each concentration.
2.2. MRI Measurement
The first experiment demonstrates the suitability of the samples as a general T1 calibration sample, using a high field 1.5T clinical MRI system (Magnetom Avanto, Siemens, Munich, Germany) to verify that full fat milk powder does indeed affect the spin-lattice relaxation time (T1). This took the form of the Acronym of Nottingham Trent University using selected wells of three 24 well plates. These were imaged using an inversion recovery pulse sequence with varying inversion times (100, 500, 750, 1000, 1250, 1500, 1750, 2000, 2250, 2500, 3000, 3500, 4000 and 4500) ms with a 5000 ms repetition time and coronal orientation. The spine coil was used in order to transmit and collect radiofrequency signals for these samples as they are inherently flat. The T1 values was extracted using in house Matlab software (Math Works®, Natick, MA, USA) to produce a T1 map, encoding the value of T1 in the colour scale.
2.3. Magnetic Resonance Sensor Measurement
The Magnetic Resonance sensor used was a customized closed loop, iron yoke magnet shown in Figure 1, generating a magnetic field of 308 mT, equivalent to a proton resonant frequency of 19.38 MHz. For the transmitting and receiving radio frequency signal, an RF coil, as part of a commercial NMR Probe (Part 514 606, Leybold Didactic GmbH, Huerth, Germany) is positioned over the two permanent magnets. This ensures a homogenous field in the sample region. The sample was placed inside the coil for signal detection. This coil was connected to Kea2 spectrometer (Magritek, Wellington, New Zealand) through a standard series parallel tuning and matching circuit. The data was collected using Prospa (Version 3.22, Magritek, Wellington, New Zealand). The experimental measurements were taken using a T1 inversion recovery sequence, using seventeen inter-experimental repetition times ranging from 25 ms to 6000 ms in non-uniform increments. The maximum delay time was set to 10,000 ms which it is seven times the T1 value estimated by the clinical MRI. Eight Echoes with the shortest achievable echo time were summed to improve the signal to noise ratio.
The data collected using the Kea2 were processed using an online program (MRI toolbox website, © 2011-13 Alan McMillan) [10]. The T1 values were extracted from the mono-exponential fit of the signal intensity against repetition times.
3. Results and Discussion
The viscosity of a sample is well known to affect the T1 relaxation parameter. In this work we observe that as the viscosity increased, the spin lattice relaxation time values declined which is as expected. There is a relationship between the viscosity and the molecular size of the sample [10]. The sample is a full fat milk powder which involve protein, lactose and fat, where fat has a comparable molecular size as the protein. As these component increased in volume (by virtue of the concentration increase), the nucleus rotation will be slower and this causes a faster decay of the relaxation time [9,11].
Figure 2 demonstrates the changes in the image contrast due to the changes in the inversion time (Ti) applied and the different milk concentration on each part of the letters (NTU) using the spine coil. Samples measured using clinical MRI shows decreasing T1 values as the concentration is increased as shown in Figure 3 with the following average T1 values (1.7 ± 6.7, 1.46 ± 19.6, 1.25 ± 37.89, 1.18 ± 27.8, 0.838 ± 33.59, 0.886 ± 8.29 and 0.469 ± 13) seconds for the weight/volume concentrations of (5, 11, 18, 23, 38, 50, 64) percent respectively.
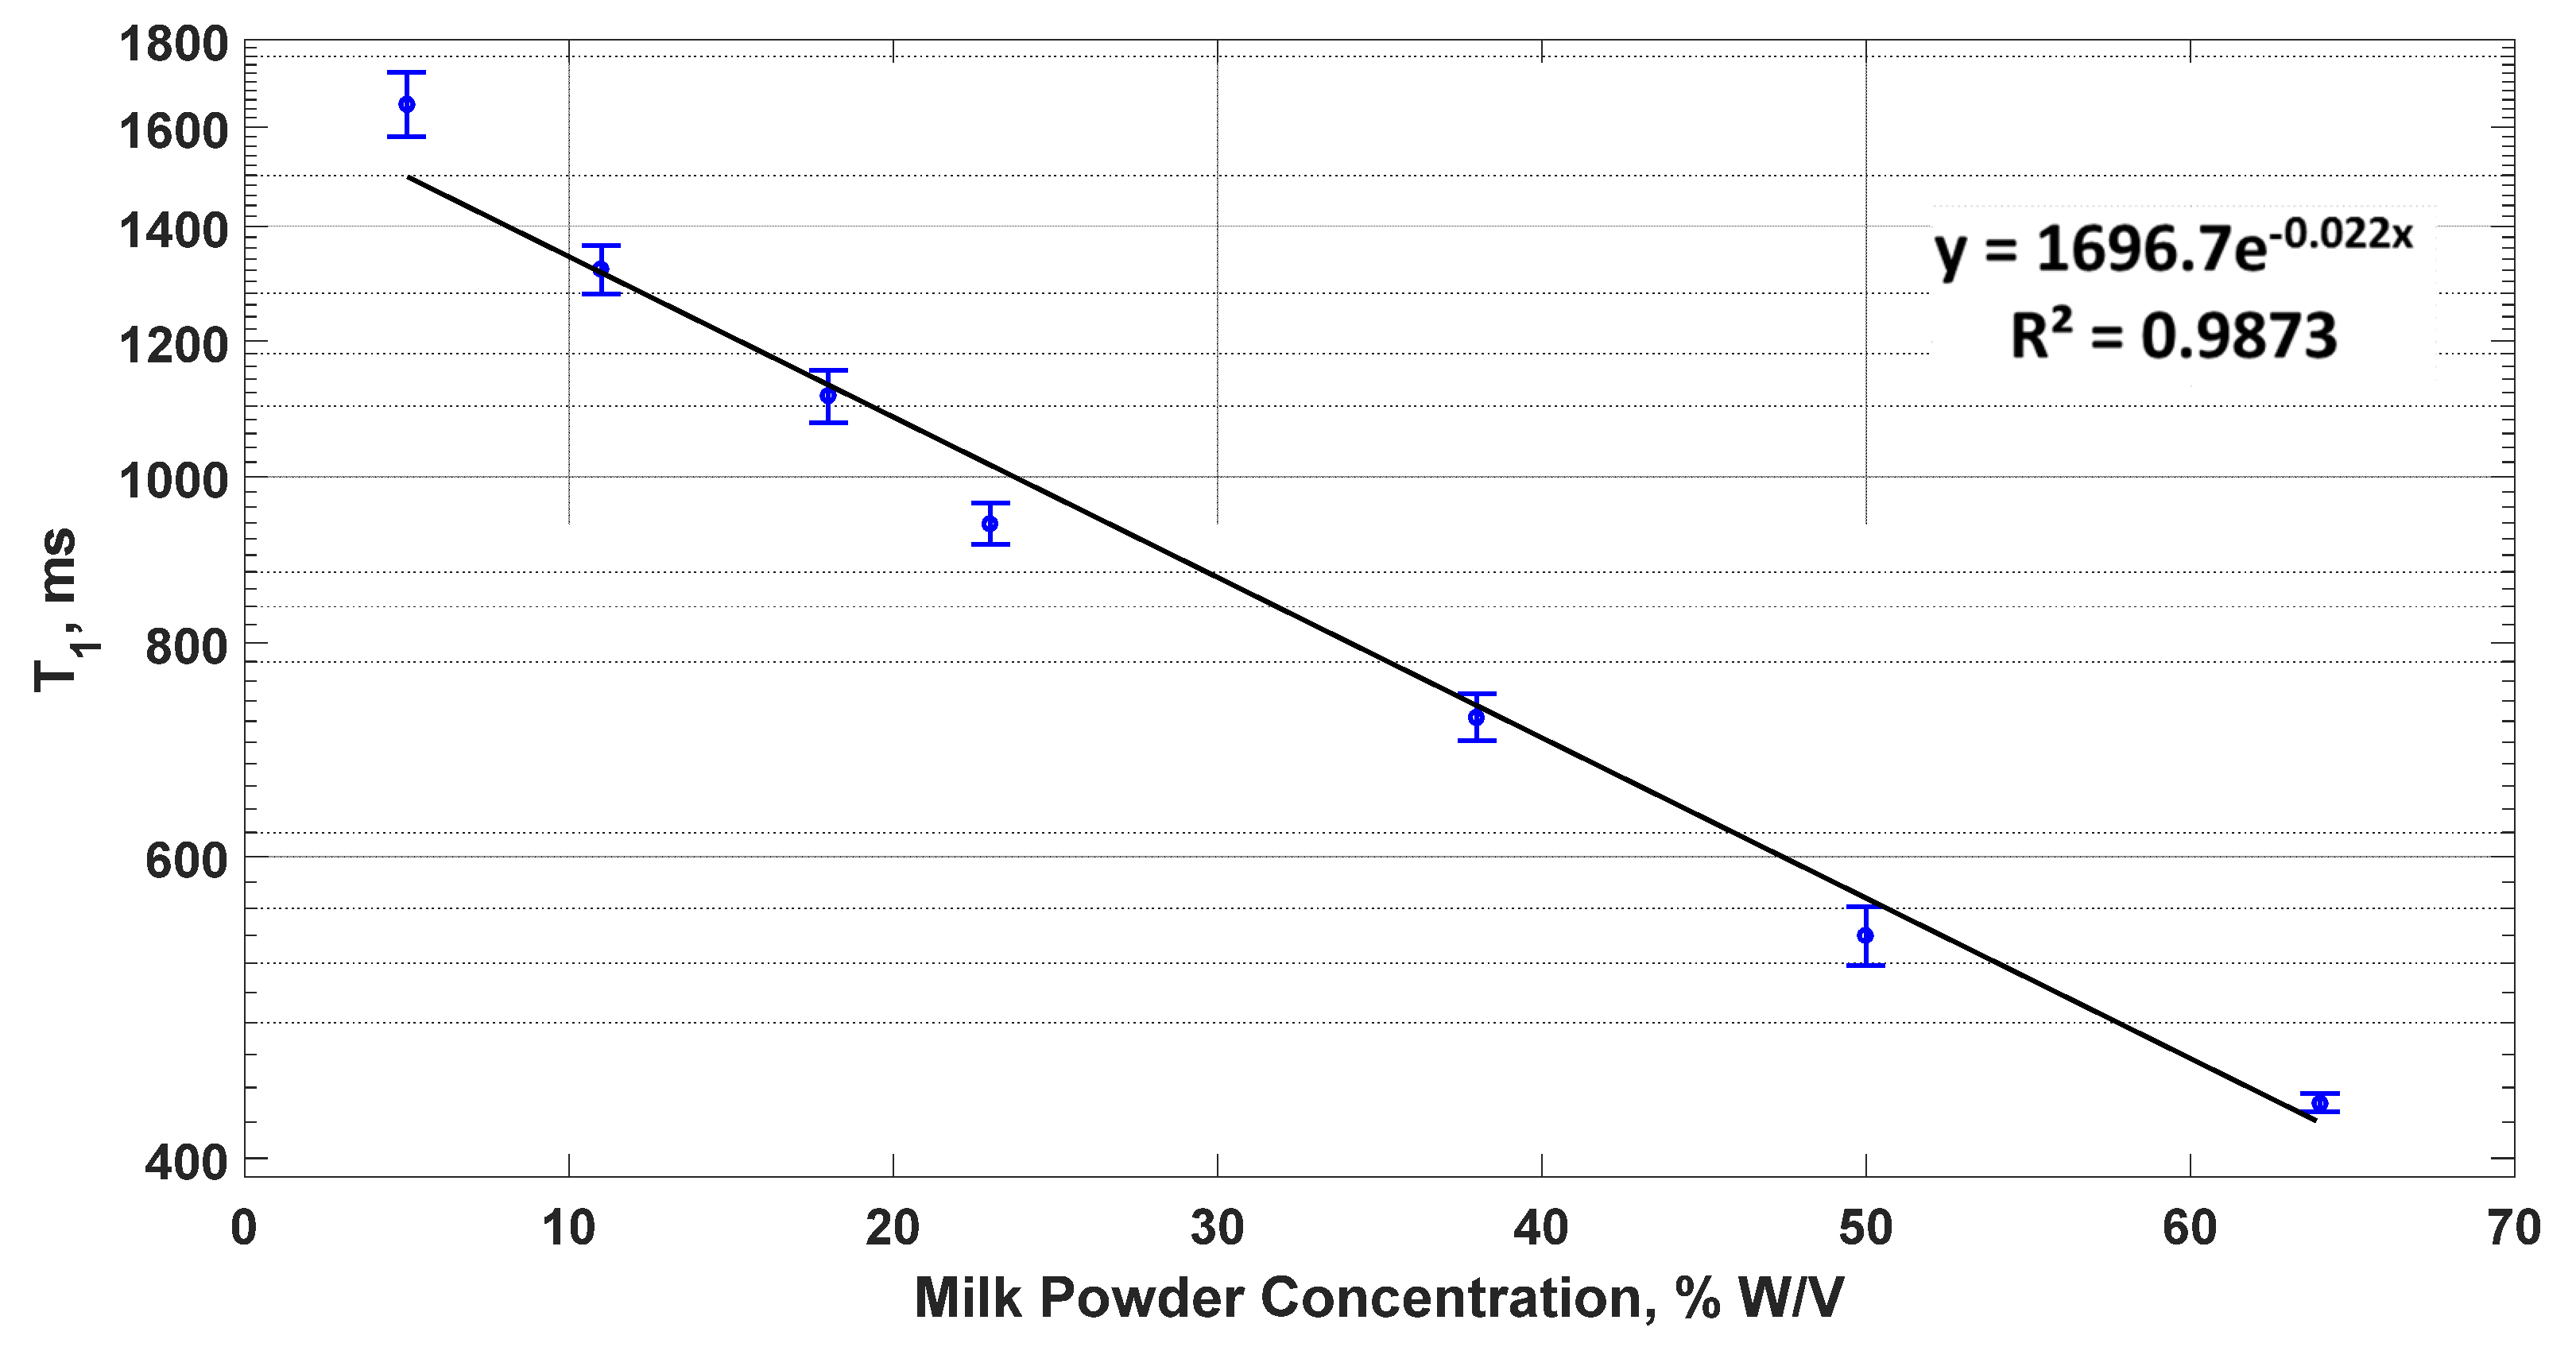
These concentrations were freshly prepared and measured using the customized NMR sensor. All the measurements were performed inside a bench top Faraday cage to reduce the external noise. The values of T1 were averaged from the individual measurements of three samples for each concentration. Figure 4 illustrates the relationship between the T1 values against the milk concentration. The T1 values that were generated were (1.65 ± 70.7, 1.32 ± 43.62, 1.11 ± 39, 0.939 ± 26.26, 0.724 ± 22.6, 0.539 ± 21.5 and 0.431 ± 5.34) second for the Weight/Volume concentrations of (5, 11, 18, 23, 38, 50, 64) percent respectively. The errors bars were taken from the standard deviation of these values, to show the repeatability from sample to sample.
It is interesting to note that despite the high difference in the intensity of magnetic field between the clinical MRI (1.5 Tesla) and the MR sensor (308 mT), the T1 relaxation of the full fat milk powder samples was similar. This is well demonstrated by observing the exponential fitting coefficient which in both systems is −0.022× concentration. This demonstrates the effectiveness of full fat milk powder samples as calibration standards for the sensor development.
4. Conclusions
The different concentrations of full fat milk powder show an excellent relationship with the spin-lattice relaxation time. Both the clinical MRI scanner and the MR sensor have the same exponential fitting coefficient that demonstrates well that full fat milk powder in distilled water is a safe, inexpensive material that can be used as a tool for MR sensor development. We recommend that freshly prepared sample should be used between 0–4 h to avoid the fluctuation in the T1 values due to the separation that can occur to avoid needing to add a stabilizer that could affect the relaxation times. The ease of preparation, low cost and availability of the material are ideal for such a system.
Acknowledgments
NKA acknowledges the Ministry of Higher Education and Scientific Research (MOHESR) in the United Arab Emirates for funding, and the Dubai Health Authority (DHA) for study leave.
Author Contributions
Robert H. Morris and Michael I. Newton conceived, designed the experiments, reviewed and edited the manuscript; Elizabeth R. Dye produced the software used for T1 experiments with the Kea2, Najlaa K. Almazrouei performed the experiments, analyzed the data and wrote the manuscript.
Conflicts of Interest
The authors declare no conflict of interest.
References
- Blümich, B.; Perlo, J.; Casanova, F. Mobile single-sided NMR. Prog. Nucl. Magn. Reson. Spectrosc. 2008, 52, 197–269. [Google Scholar] [CrossRef]
- Manz, B.; Coy, A.; Dykstra, R.; Eccles, C.D.; Hunter, M.W.; Parkinson, B.J.; Callaghan, P.T. A mobile one-sided NMR sensor with a homogeneous magnetic field: The NMR-MOLE. J. Magn. Reson. 2006, 183, 25–31. [Google Scholar] [CrossRef]
- Blümich, B.; Casanova, F.; Appelt, S. NMR at low magnetic fields. Chem. Phys. Lett. 2009, 477, 231–240. [Google Scholar] [CrossRef]
- Cosgrove, T.; Roberts, C.; Garasanin, T.; Schmidt, R.G.; Gordon, G.V. NMR Spin—Spin relaxation studies of silicate-filled low molecular weight poly (dimethylsiloxane)s. Langmuir 2002, 18, 10080–10085. [Google Scholar] [CrossRef]
- Simon, G.; Birnstiel, A.; Schimmel, K. Network characterisation of end-linked poly (dimethylsiloxane) by 1 H-NMR-spin-spin relaxation. Polym. Bull. 1989, 21, 235–241. [Google Scholar] [CrossRef]
- Christoffersson, J.O.; Olsson, L.; Sjöberg, S. Nickel-doped agarose gel phantoms in MR imaging. Acta Radiol. 1991, 32, 426–431. [Google Scholar] [CrossRef]
- Mitchell, M.D.; Kundel, H.L.; Axel, L.; Joseph, P.M. Agarose as a tissue equivalent phantom material for NMR imaging. Magn. Reson. Imaging 1986, 4, 263–266. [Google Scholar] [CrossRef]
- Métais, A.; Cambert, M.; Riaublanc, A.; Mariette, F. Effects of casein and fat content on water self-diffusion coefficients in casein systems: A pulsed field gradient nuclear magnetic resonance study. J. Agric. Food Chem. 2004, 52, 3988–3995. [Google Scholar] [CrossRef] [PubMed]
- Todt, H.; Guthausen, G.; Burk, W.; Schmalbein, D.; Kamlowski, A. Water/moisture and fat analysis by time-domain NMR. Food Chem. 2006, 96, 436–440. [Google Scholar] [CrossRef]
- MRI Toolbox Website. Available online: http://www.mritoolbox.com/ParameterFitting.htm1 (accessed on 19 October 2017).
- Colsenet, R.; Mariette, F.; Cambert, M. NMR relaxation and water self-diffusion studies in whey protein solutions and gels. J. Agric. Food Chem. 2005, 53, 6784–6790. [Google Scholar] [CrossRef] [PubMed]
Figure 1.
Photograph of closed Loop Magnet setup used for sensor measurements showing the permanent magnets, iron yoke and Leybold NMR Probe.
Figure 1.
Photograph of closed Loop Magnet setup used for sensor measurements showing the permanent magnets, iron yoke and Leybold NMR Probe.
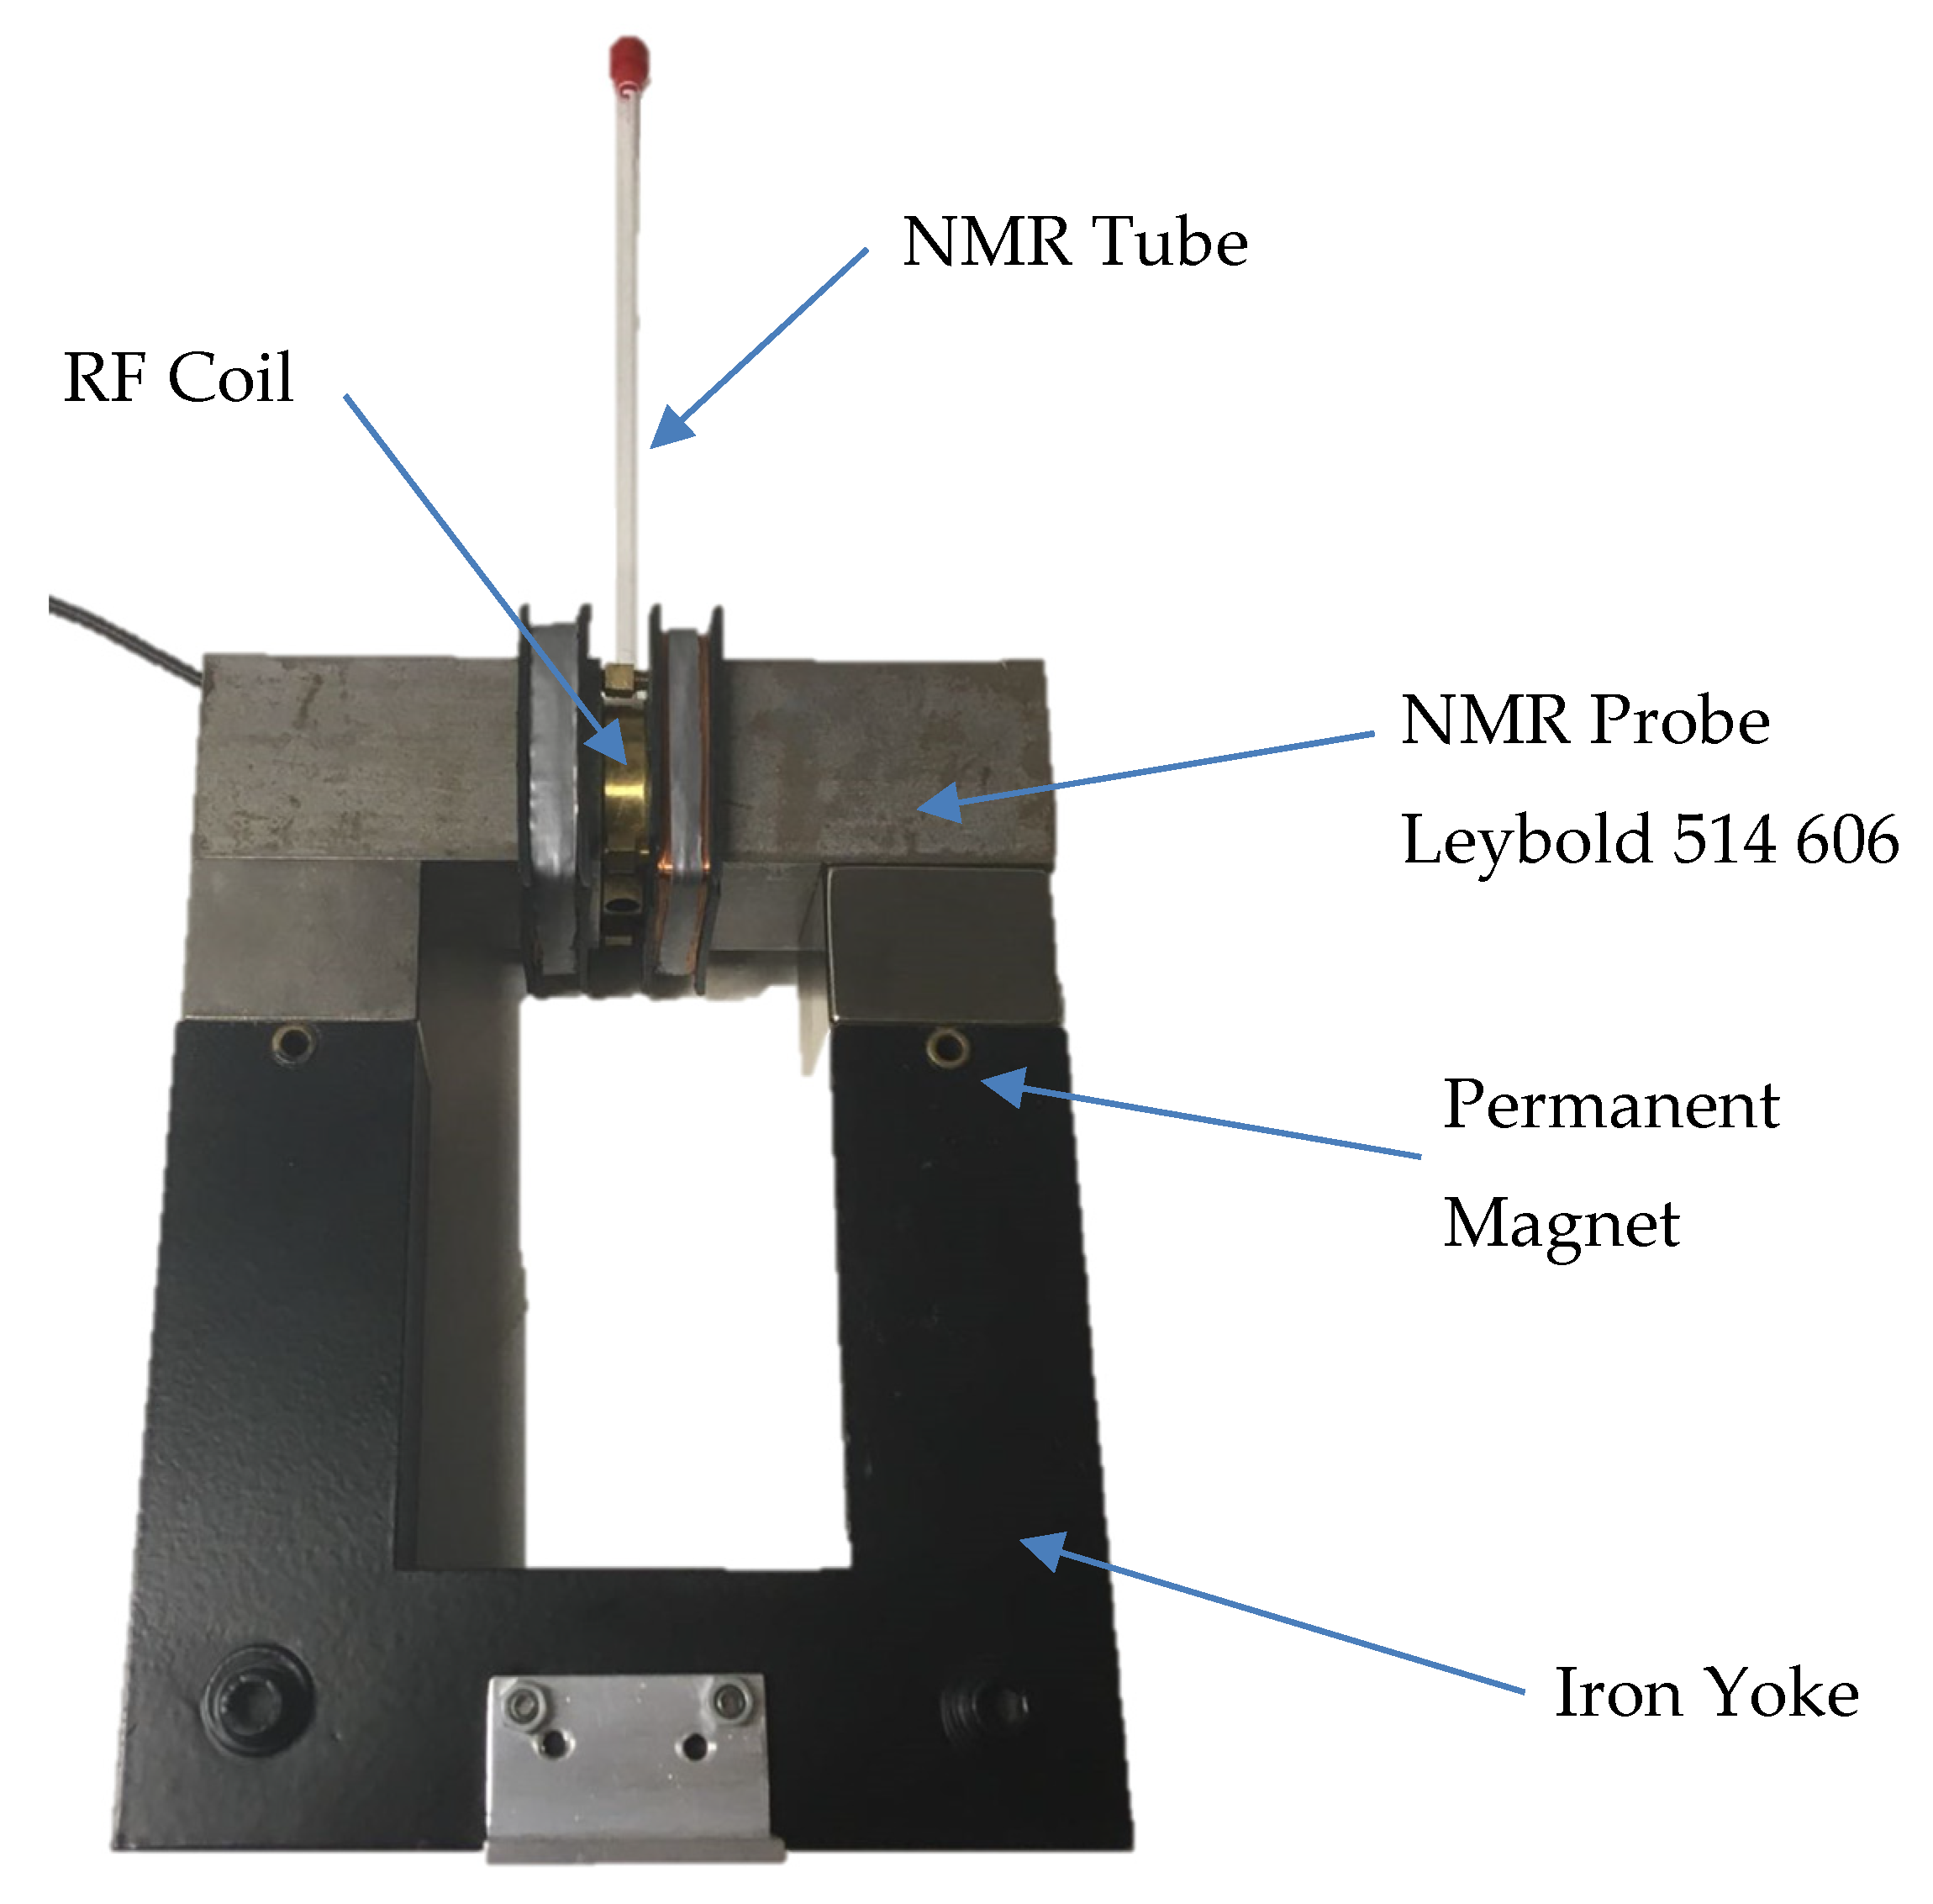
Figure 2.
Inversion recovery T1 map of different milk concentrations increasing from left to right, four of each sample. The color bar scale is T1 in ms.
Figure 2.
Inversion recovery T1 map of different milk concentrations increasing from left to right, four of each sample. The color bar scale is T1 in ms.
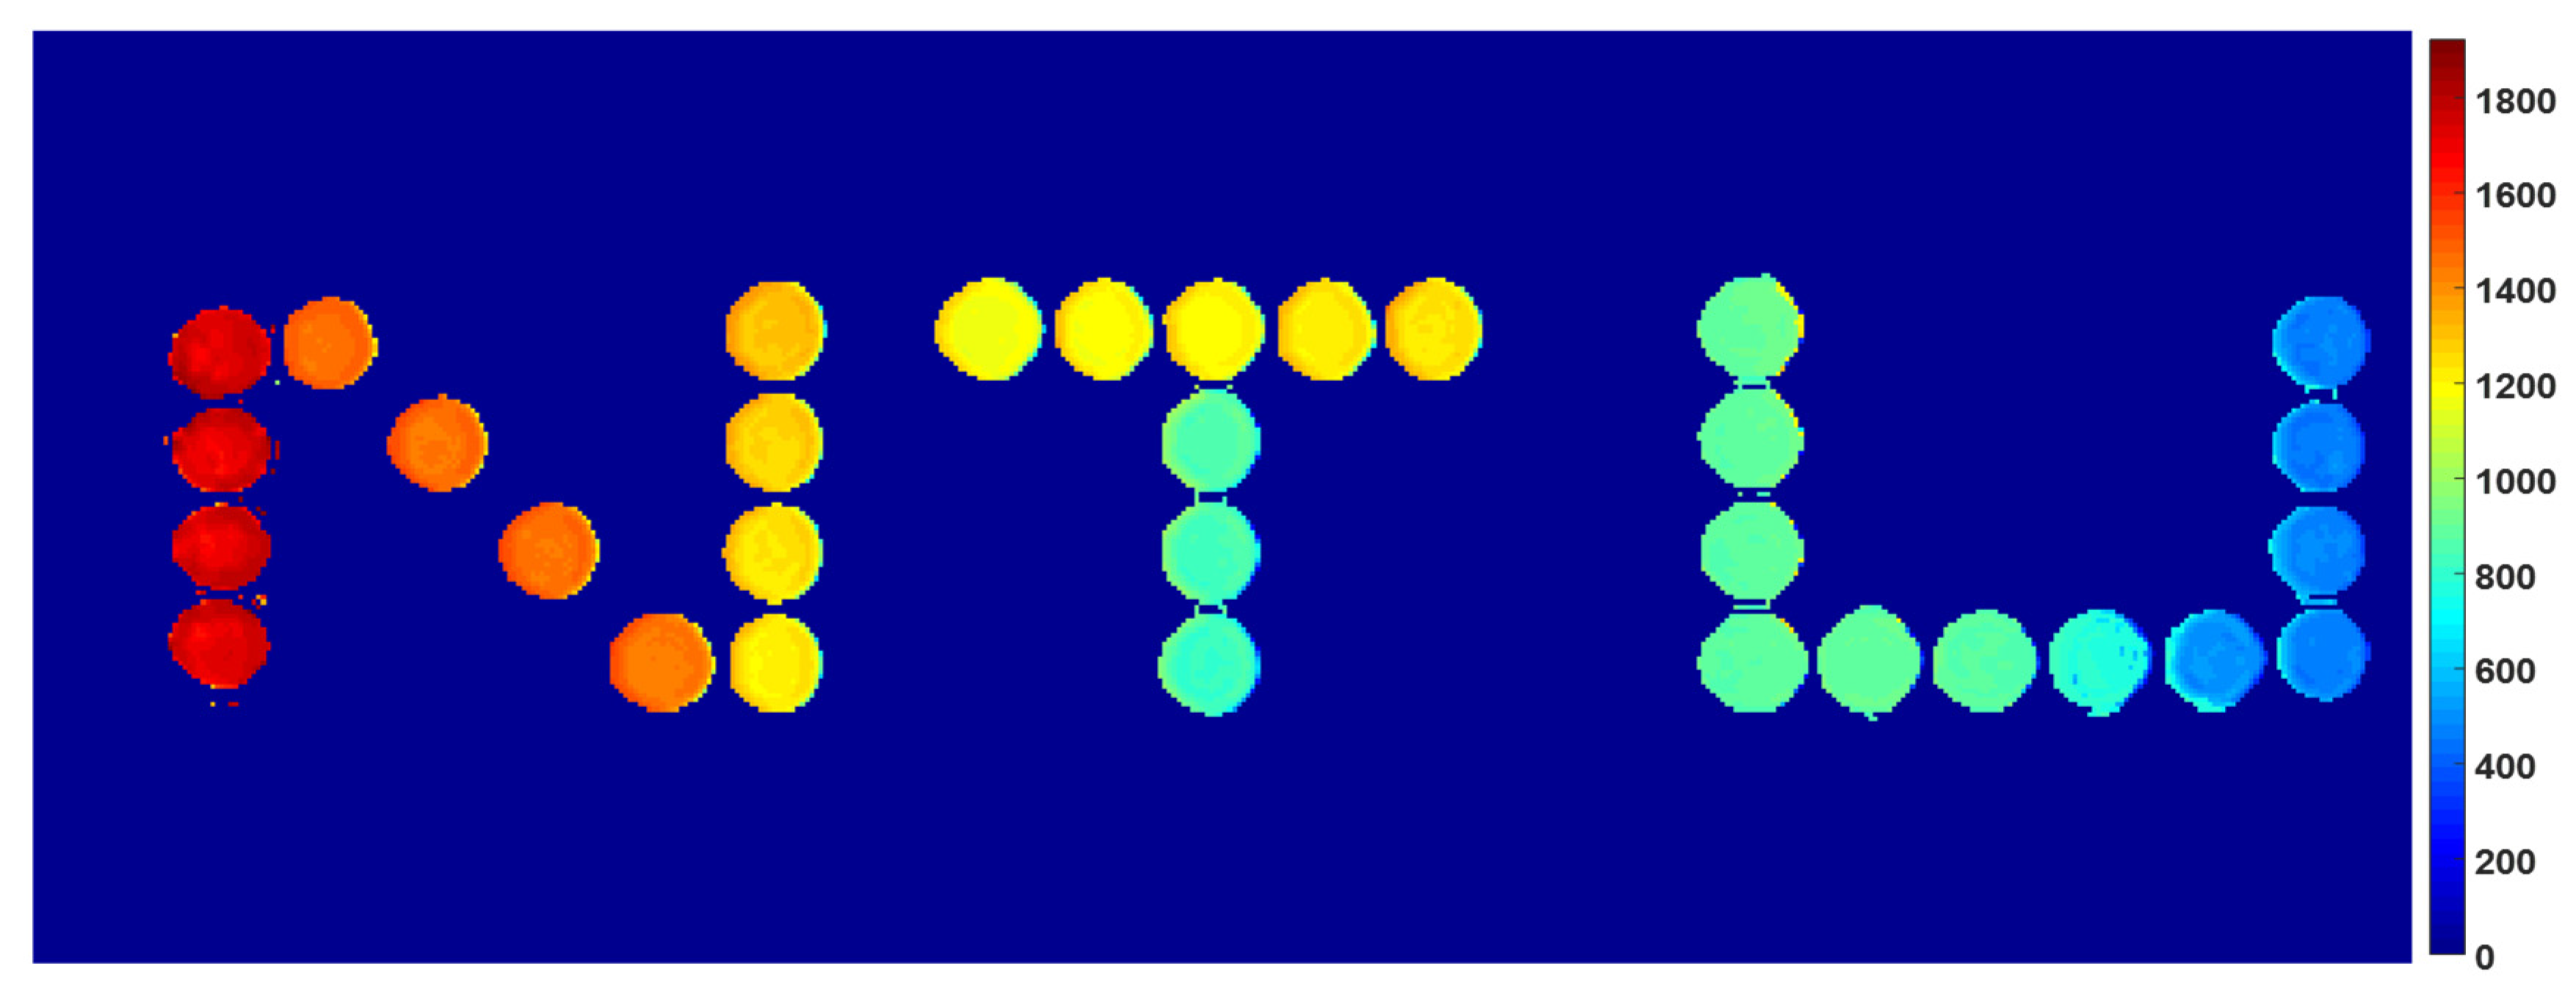
Figure 3.
Spin lattice relaxation time T1 values against full fat milk powder concentration measured using clinical MRI using the spine matrix coil.
Figure 3.
Spin lattice relaxation time T1 values against full fat milk powder concentration measured using clinical MRI using the spine matrix coil.
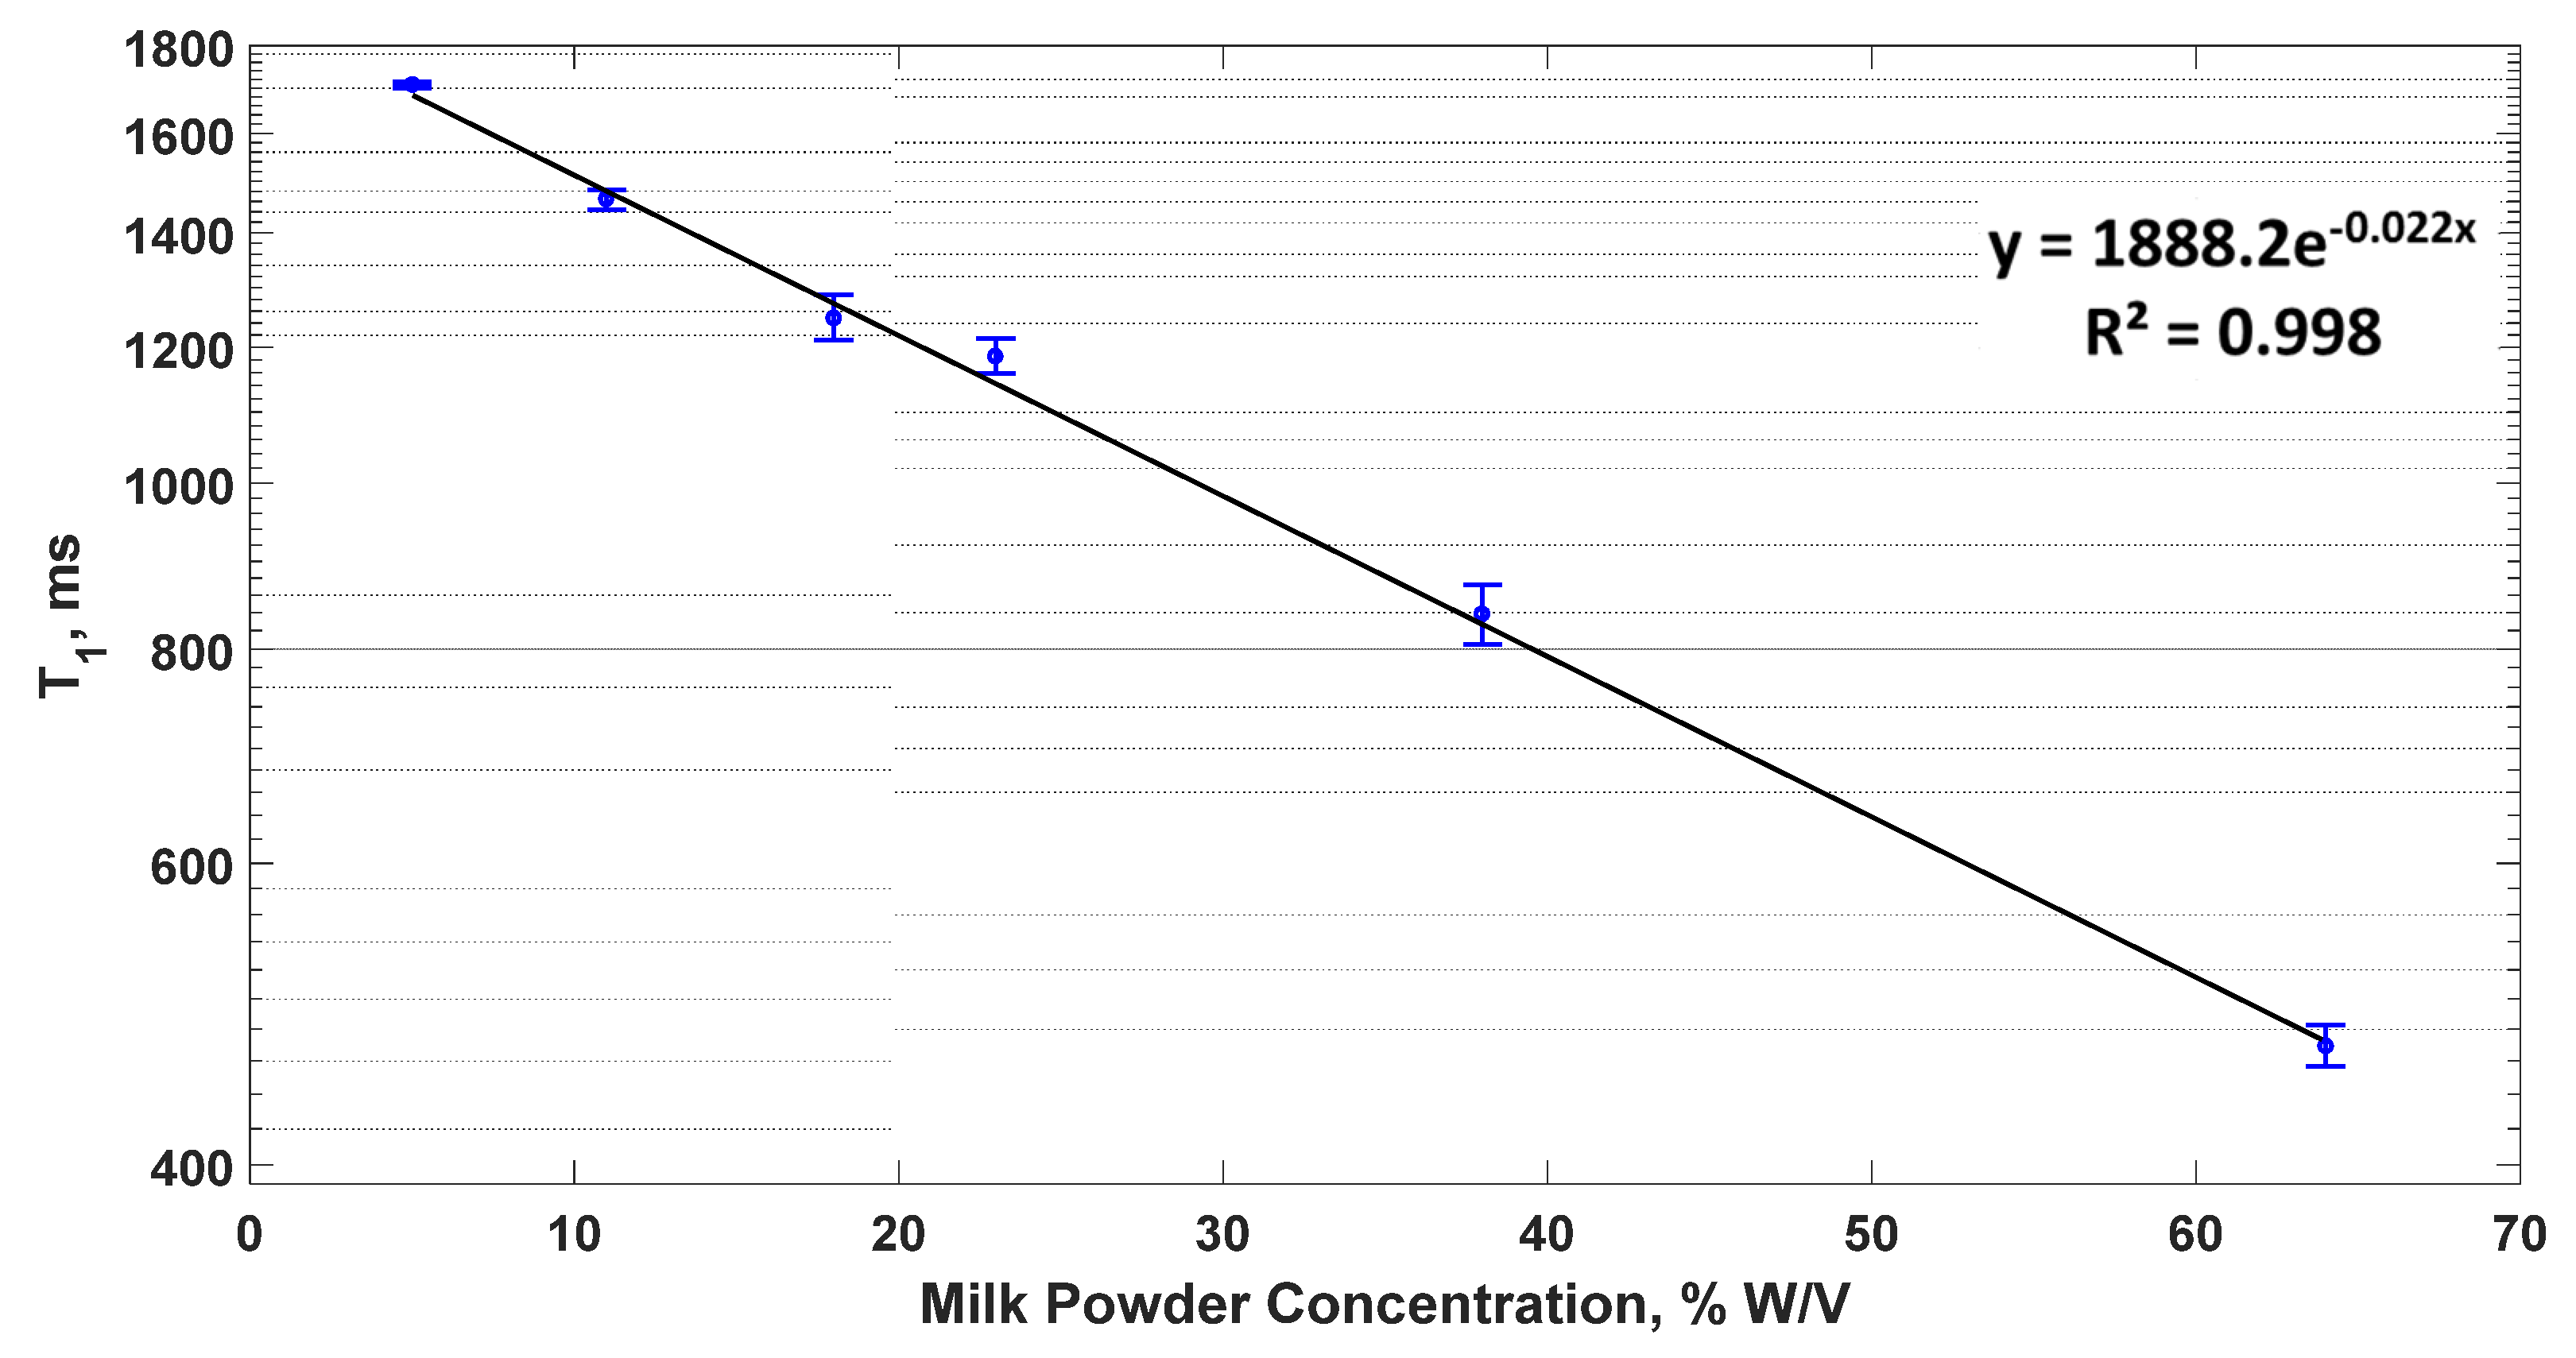
Figure 4.
Spin lattice relaxation time T1 values against full fat milk powder concentration measured using a customized MR sensor. The error bars show the standard deviation of the measurements.
Figure 4.
Spin lattice relaxation time T1 values against full fat milk powder concentration measured using a customized MR sensor. The error bars show the standard deviation of the measurements.
Publisher’s Note: MDPI stays neutral with regard to jurisdictional claims in published maps and institutional affiliations. |
© 2018 by the authors. Licensee MDPI, Basel, Switzerland. This article is an open access article distributed under the terms and conditions of the Creative Commons Attribution (CC BY) license (https://creativecommons.org/licenses/by/4.0/).
Share and Cite
MDPI and ACS Style
Almazrouei, N.K.; Newton, M.I.; Dye, E.R.; Morris, R.H. Novel Food-Safe Spin-Lattice Relaxation Time Calibration Samples for Use in Magnetic Resonance Sensor Development. Proceedings 2018, 2, 122. https://doi.org/10.3390/ecsa-4-04916
AMA Style
Almazrouei NK, Newton MI, Dye ER, Morris RH. Novel Food-Safe Spin-Lattice Relaxation Time Calibration Samples for Use in Magnetic Resonance Sensor Development. Proceedings. 2018; 2(3):122. https://doi.org/10.3390/ecsa-4-04916
Chicago/Turabian StyleAlmazrouei, Najlaa K., Michael I. Newton, Elizabeth R. Dye, and Robert H. Morris. 2018. "Novel Food-Safe Spin-Lattice Relaxation Time Calibration Samples for Use in Magnetic Resonance Sensor Development" Proceedings 2, no. 3: 122. https://doi.org/10.3390/ecsa-4-04916