Comparing Swarm Intelligence Algorithms for Dimension Reduction in Machine Learning


1
Department of Information Systems, ELTE Eötvös Loránd University, 1117 Budapest, Hungary
2
Department of Informatics, J. Selye University, 945 01 Komárno, Slovakia
*
Author to whom correspondence should be addressed.
Big Data Cogn. Comput. 2021, 5(3), 36; https://doi.org/10.3390/bdcc5030036
Submission received: 3 July 2021
/
Revised: 10 August 2021
/
Accepted: 11 August 2021
/
Published: 13 August 2021
Abstract
:Nowadays, the high-dimensionality of data causes a variety of problems in machine learning. It is necessary to reduce the feature number by selecting only the most relevant of them. Different approaches called Feature Selection are used for this task. In this paper, we propose a Feature Selection method that uses Swarm Intelligence techniques. Swarm Intelligence algorithms perform optimization by searching for optimal points in the search space. We show the usability of these techniques for solving Feature Selection and compare the performance of five major swarm algorithms: Particle Swarm Optimization, Artificial Bee Colony, Invasive Weed Optimization, Bat Algorithm, and Grey Wolf Optimizer. The accuracy of a decision tree classifier was used to evaluate the algorithms. It turned out that the dimension of the data can be reduced about two times without a loss in accuracy. Moreover, the accuracy increased when abandoning redundant features. Based on our experiments GWO turned out to be the best. It has the highest ranking on different datasets, and its average iteration number to find the best solution is 30.8. ABC obtained the lowest ranking on high-dimensional datasets.
1. Introduction
We are living in an age of Big Data. As the amount of data we collect is enormously growing all the time, it becomes more important to extract the relevant information. When using traditional model-based machine learning methods, high-dimensional data increase the search space and computational time. Moreover, it can make noise, which affects the construction of the model, resulting in effectiveness loss. To solve problems arising from the high dimensionality of data, researchers mainly use two approaches: feature extraction and feature selection [1]. Feature extraction creates a low-dimensional feature space by combining some features. Feature selection removes redundant attributes and creates a small subset of features that are relevant for the model.
We can perform a full forward feature selection by choosing the best feature from the subset in each step, but it has possible solutions where n is the total number of features. So when n is large, the time complexity is too high. We are looking for faster solutions.
Feature Selection (FS) can be considered an optimization problem where we have a search space of all features, and we want to find the optimal ones. There are three basic steps in a typical FS method:
- 1.
- a generation procedure to generate the next candidate subset;
- 2.
- an evaluation function to evaluate the subset under examination;
- 3.
- a validation procedure to either choose the subset or abandon it.
In this paper, we propose a Swarm Intelligence solution for Feature Selection. Among a large variety of known SI algorithms, we chose five that are considered to be effective: Particle Swarm Optimization (PSO), Bat Algorithm (BA), Artificial Bee Colony (ABC), Invasive Weed Optimization (IWO), Grey Wolf Optimizer (GWO) and compared them. Firstly, we provide SI definition and describe the chosen SI techniques in Section 3. Applying the usual SI structure for solving FS is presented in Section 4. In Section 5, we talk a little about the framework, show the experiments and compare the performance of implemented SI algorithms. Finally, Section 6 summarizes the effectiveness of the proposed approaches and mentions some future works.
2. Related Works
There are plenty of reviews on techniques for reducing the number of features. Li et al. [2] provides a comprehensive overview of similarity-based, information-theoretical-based, sparse-learning-based, and statistical-based methods. Saeys et al. [3] focuses on the application of FS techniques in bioinformatics. Beyond traditional methods, Jović et al. [4] reviews recent hybrid approaches for FS. A great overview of FS in supervised and unsupervised learning is provided by Cai in [5].
When talking about dimension reduction, multidimensional scaling [6] is always mentioned. It is a set of techniques, that aim to find a configuration of points in a space, where each point represents one of the objects or individuals, and the distances between pairs of points in the configuration match as well as possible the original dissimilarities between the pairs of objects or individuals. Another popular technique is principal component analysis [7]. It is based on replacing the original variables by a smaller number of derived variables, the principal components, which are linear combinations of the original variables. Park et al. [8] compares several linear discriminant analysis algorithms. These algorithms reduce the dimensionality by finding an optimal linear transformation that maximizes the class separability.
Relatively new methods called Swarm Intelligence (SI) are gaining popularity in FS as they can solve NP-hard computational problems. Authors of Swarm Intelligence Algorithms for Feature Selection: A Review [1], A survey on swarm intelligence approaches to feature selection in data mining [9] and Review of swarm intelligence-based feature selection methods [10] provide reviews on applying SI for FS. However, we did not find articles comparing different algorithms on the same datasets.
3. Materials and Methods
3.1. Swarm Intelligence
SI algorithms are a set of nature-inspired artificial intelligence techniques. The term Swarm Intelligence was first introduced in 1993 by Beni and Wang [11]. Nowadays, SI is commonly accepted as a branch of Computational Intelligence. It concerns the collective, emerging behavior of multiple, interacting agents that follow some simple rules [12]. Each agent may be considered unintelligent, while the whole system of the multiple agents may show some self-organization behavior and thus can behave like some sort of collective intelligence. According to [13], the main properties for the SI-based algorithms can be summarized as follows:
- Agents share information among each other.
- Self organization and autonomy of each agent.
- Adaptability and a fast response to environment change.
- It can be easily parallelized for practical and real-time problems.
In SI algorithms, a population of individual agents move in the search space and cooperate with each other. Each agent represents a possible solution, and this solution is evaluated by the fitness function. Agents become better and better over iterations, then eventually find good enough solutions [14].
The general phases of each SI algorithm are shown in Figure 1. At first, agents should be initialized. Most of the time, they are located on random points in the search space, but as far as the space of features is different from the usual Descartes coordinate system, we will discuss initializing in detail in Section 4. After that, each agent is evaluated by the fitness function. In our case, accuracy of the machine learning model is the main aspect of the fitness function. In optimizing algorithms, most of the time, the stop condition is a defined number of iterations, or it can be a value that we think is good enough. Therefore, while it did not reach either of these conditions, one iteration of the main phase is performed. It includes moving agents, updating their properties, and refreshing the best solution(s). In the end, the global best solution is returned.
Similar to other search algorithms, it is important to establish a proper balance between exploration and exploitation in swarm optimization approaches. In some algorithms, it is achieved by controlling parameters (PSO), while others use more randomness in the search (ABC, BA).
In the past 30 years, a large number of SI algorithms have emerged. The source of inspirations are varying from human society (TLBO, BSO), animals (BA, GWO, MA, LOA), insects and birds (ABC, PSO, ACO, FA, CS, GSO), bacteria (BFO), weeds (IWO), and also some human-made phenomenon (FWA).
3.2. Particle Swarm Optimization
PSO was one of the first SI algorithms, introduced by Kennedy and Eberhart in 1995 [15]. Each individual in the particle swarm is composed of three D-dimensional vectors, where D is the dimensionality of the search space. These are the current position , the previous best position , and the velocity . Moreover, each particle knows the global best solution so far: g. The velocity of each particle is iteratively adjusted so that the particle oscillates around and g locations. Eventually, the swarm as a whole, like a flock of birds collectively foraging for food, is likely to move close to an optimum of the fitness function [16]. This process is presented in Algorithm 1.
3.3. Artificial Bee Colony
ABC is based on the foraging behavior of honey bees. It was proposed by Karaboga in [17]. Honey bees collect nectar from vast areas around their hive and communicate with each other via a dance that informs other bees in the hive as to the direction, distance, and quality rating of food sources [18]. There are three types of bees: employees, onlookers, and scouts. Scout bees employ a random flying pattern to discover new food sources and replace the abandoned one with the new food source [12]. Employee bees fly to known food sources and collect nectar, then return to the hive and produce a dance. According to this dance, onlooker bees choose the best food sources found by employee bees and exploit them. Algorithm 2 shows this procedure with a detailed description of the moving strategy.
| Algorithm 1: PSO |
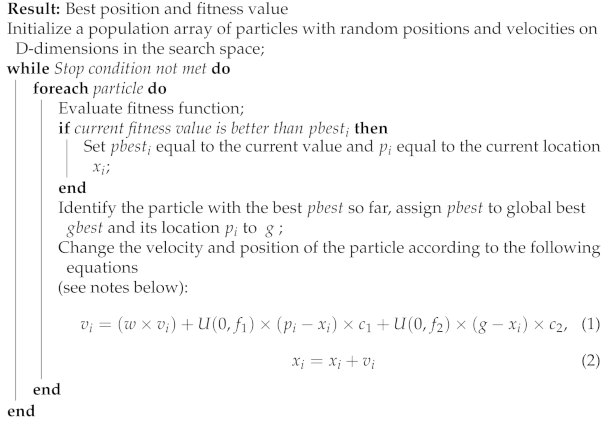 /* Notes: ; -U(0, fi) represents a vector of random numbers uniformly distributed in [0, fi], which is randomly generated at each iteration and for each particle ; -× is component-wise multiplication ; -w, c1 and c2 are parameters to control exploration and exploitation. Usually, w decreases linearly with the number of iterations (mostly when optimizing hyperparameters like in [19]), but in this research, we used a fixed value - 0.5˙ */ |
| Algorithm 2: ABC |
 |
3.4. Invasive Weed Optimization
The only evolutionary algorithm described in this paper is IWO [20], inspired by the colonization of invasive weeds in nature. A finite number of weeds are being spread out over the field. Those weeds that have better adoption to the environment and take more unused resources grow faster and produce more seeds. The newly produced weeds are randomly spread over the parent weed and grow into flowering weeds. When the maximum number of weeds is reached on the field due to the limited resources, only those weeds with better fitness can survive and produce new weeds [21]. Others are eliminated. This competitive contest between the weeds causes them to become well adapted and improved over time. The process is addressed in detail in Algorithm 3.
| Algorithm 3: IWO |
 |
3.5. Bat Algorithm
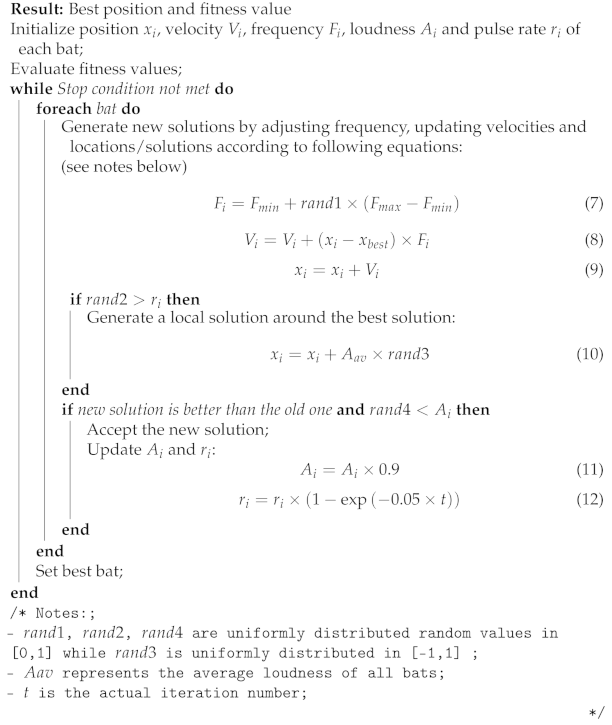
BA simulates the echolocational behavior of micro-bats. All bats create a loud and short pulse of sound and sense the distance of an object by using the returning echo. In some way, they are able to decide the difference between an obstacle and a prey, allowing them to hunt in darkness. Bats fly randomly with velocity at position with varying frequency f and loudness A to search for prey. They can automatically adjust the frequency of their emitted pulses and the rate of pulse emission r depending on the proximity of their target [22]. Each bat listens to the voices of other bats and flies in the direction of the prey. The process of using simulated bats for optimization problems is presented in Algorithm 4.
3.6. Gray Wolf Optimizer
The GWO proposed in [23] has been inspired by the social intelligence of gray wolves that prefer living in a group of 5–12 individuals. In order to simulate the leadership hierarchy of the wolf pack, four levels are considered in this algorithm: alpha (), beta (), delta (), and omega () [23]. According to [24], hunting is conducted in the following way. Firstly, the gray wolves search and track the prey; secondly, the alpha leads the others to encircle the prey in all directions; thirdly, commands the and wolves to attack the prey. If the prey escapes, the other wolves , which are supplied from the rear, will continue to attack the prey until it is caught. In the iterative optimization process, the possible position of prey is assessed by three wolves: alpha, beta, and delta. It is shown in Algorithm 5.
| Algorithm 4: BA |
 |
| Algorithm 5: GWO |
 |
3.7. Summarizing Algorithms
In Table 1, you can find a short summary about the main properties of the presented algorithms.
4. Feature Selection
In Section 1, we talked a bit about the importance of applying feature selection to the data. Algorithms of FS can be classified into two classes: filters or wrapper approaches. The former class includes methods independent from classifiers that work directly on data, trying to find some correlations between variables. For example, fuzzy integral-based aggregation processes can deal with this task [25]. On the other hand, wrapper feature selection methods involve classifiers and find interaction between variables [26]. As the literature shows, wrapper-based methods are better than filter-based techniques for classification algorithms [27,28]. In this section, we will describe how FS can be conducted with SI methods and how can we improve decision tree classification by reducing data dimensionality.
4.1. Decision Tree Classifier
When choosing a classification algorithm for wrapper FS approaches aspects that should be counted are computational time, generality, and classification performance. A study realized by Xue in [29] examines four corresponding algorithms: support vector machine (SVM), decision tree (DT), K-nearest neighbors (KNN), and Naïve Bayes (NB). It recommends choosing DT or NB if users have a high demand on the computational time and also need to avoid poor classification performance. That is one reason why we chose DT for testing our FS algorithms. Moreover, it is easy to implement and does not acquire a lot of parameter tuning.
The decision tree classifier by Quinlan [30] is made of decision nodes and leaf nodes. Each decision node corresponds to a test X over a single attribute of the input data and has a number of branches, each of which handles an outcome of the test X [31]. Each leaf node represents a class that is the result of a decision for a case. The maximum depth of the tree is limited by a parameter. Once a decision tree is built, the testing data, which are in the same format as the training data, can be classified.
4.2. Search Space Representation
Each SI algorithm was presented in a way where agents are moving in 2-dimensional continuous space. Therefore, the main challenge here is to convert this space so that a point represents which features are selected. A good representation should satisfy the condition that if two continuous values are close to each other, their transformed values are close to each other as well. In most of the related works, it was carried out by creating a binary variant of the chosen algorithm [28,32,33]. A straightforward way for that is to keep using the continuous space and convert the continuous position to a binary position. A sigmoid function is widely used for this task since it can convert any continuous value to a continuous value in the range [0,1], which is then converted to a binary value by comparing it with a random number or a threshold. However, it is complicated to decide which sigmoid function to use. Moreover, in this kind of problem, it is not necessary because we can scale [0,1] space to any other continuous values. In our experiments, we used D-dimensional search space with [-100,100] edges, where D is the total number of features, and the continuous value is compared to 0. Each dimension represents a feature, and for its coordinate x: if , the corresponding feature is selected; otherwise, the feature is discarded. We consider this is a big enough space for agents to move in.
Initialization: the position of each agent is a random D-dimensional vector with minimum -100 and maximum 100. The only exception is ABC, where food sources are initialized first, and then agents are assigned to food sources.
Movement: agents move in the same way as in the original SI algorithms presented in Section 3. However, it is possible that after moving, the position of an agent will be outside of [−100,100] boundaries. In this case, we relocate the agent to the border of the search space.
4.3. Fitness Function
The fitness function is a function to evaluate the performance of the optimization method. This feature selection aims to choose a subset of features for improving prediction accuracy and decreasing the size of the structure without significantly decreasing prediction accuracy of the classifier built using only the selected features. That is why we used the following fitness function:
where is the accuracy of the decision tree model with selected features, and represents the number of selected features. Using the number of selected features in the fitness function also prevents early convergence of the algorithm because even if accuracy is 1, it does not stop and tries to achieve the same accuracy with fewer features.
5. Results
In our experiments, we implemented the mentioned algorithms and chose different datasets to compare their performances. The maximum number of iterations was set to 100 because most of the time, even after 50 iterations, the best solution did not change. Furthermore, using more iterations would result in a long computational time. The population size was also set to 100. A large number of agents like this adds more randomness to the algorithm and increases the exploration factor. While comparing different approaches, these parameters should be equivalent.
5.1. Datasets
5.2. Data Preprocessing
Real-world data generally contain noises and missing values, and the data may be imbalanced or in a format that cannot be directly used for machine learning models. Before training the model, we did data preprocessing, which is a required task for cleaning the data and making it suitable for the classifier.
At first, we throw away rows that contain missing values. After that, for numerical columns, we applied standard scaling, which means removing the mean and scaling to unit variance. The standard score of a sample x is calculated as:
, where u is the mean of the training samples, and s is the standard deviation of the training samples. For categorical columns, we applied dummy encoding, which means creating a column for each categorical value that shows if a particular category is present in that instance (only categories with a 1/50 frequency rate are kept, others are marked as infrequent). Note that this transformation creates new features, so feature selection is applied for an extended number of columns.
Finally, data were split into train and test sets. The test size was 20% of all data. Since some of the datasets were imbalanced, we took care of proper splitting so that the classes were proportionally distributed between train and test sets.
5.3. Results
We collected most of the experimental results in two tables. Table 3 shows the maximum accuracy scores reached during optimizations, and Table 4 shows the number of features selected for achieving these scores. Each row contains results for one dataset, and column Original consists of values present before optimization.
It can be seen in Table 3 that almost all accuracy scores reached with some optimization algorithm are better than the scores without optimization. The only exceptions are the second and fourteenth datasets. This can be considered an excellent performance because the optimization is almost lossless in terms of accuracy scores. The number of features was always reduced significantly, stagnating around half of the original number. A great improvement can be seen in dataset 8, where every optimization algorithm could achieve 1.0 accuracy by reducing the number of attributes, but each example has promising results.
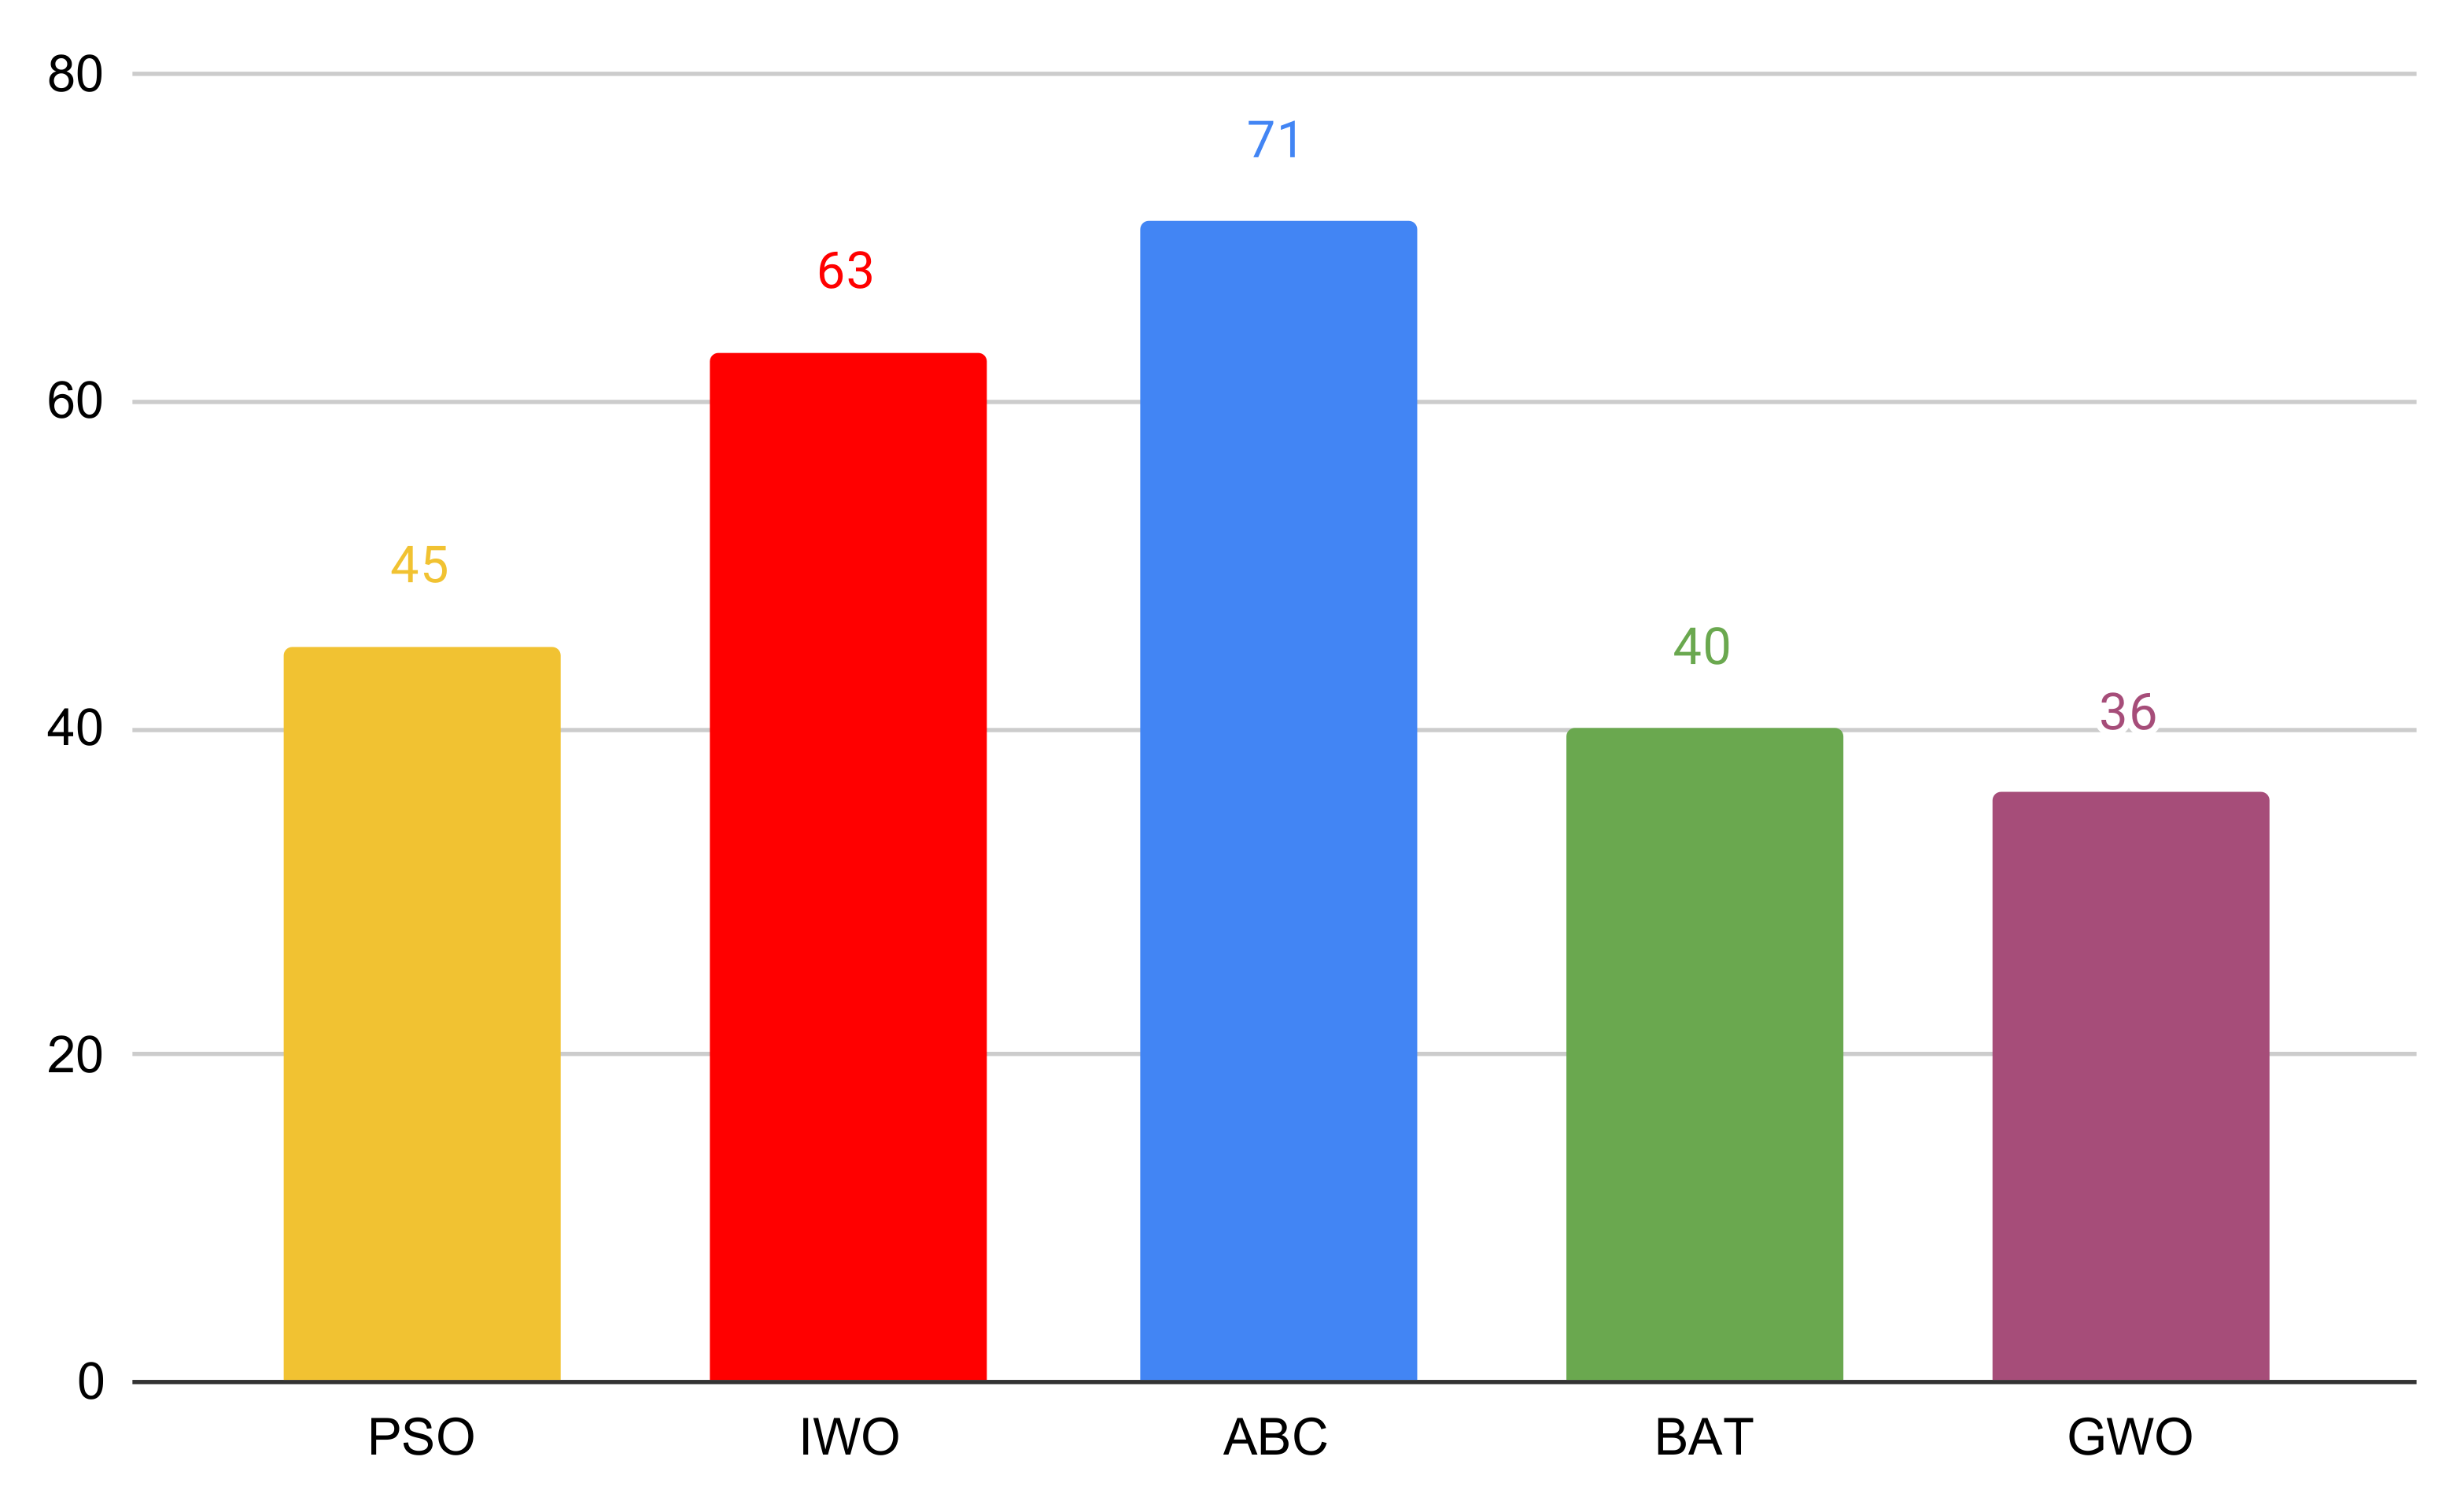
The average iteration number needed to reach values presented in Table 3 and Table 4 can be seen in Figure 2. The population size is 100 agents, so in one iteration, 100 models are trained. However, the sizes of these models are much smaller than the original model sizes because of the reduced number of attributes. Therefore, the computational time of one training process is smaller as well. However, with around 5000 model training, this optimization approach is very time-consuming, so it is rational to use it when the dataset has more than 50 attributes.
5.4. Comparing Algorithms
We used the results from Table 3 and Table 4 to rank the algorithms according to the fitness function mentioned in Section 4.3. Making any decisions based on the average accuracy or fitness values did not seem rational because all datasets are very different with varying accuracy ranges. Our ranking strategy was the following: on each dataset, we ranked the algorithms from 1 to 5 where 1 was for the algorithm that had maximum fitness value, 2 for the second-best, and so on; after that, we added all rankings grouped by algorithm. The results are presented in Figure 3. It can be seen that GWO outperformed other algorithms, so it can be considered best during this experiment.
As you can see, ABC and IWO turned out to be worse than the other three algorithms. The reason behind this for ABC is that it does not work well with high dimensions. When searching for better solutions, one bee changes only one dimension of its position, which means changing only one feature. However, when the number of features is not large (for example datasets 4 and 14), ABC tends to outperform the other algorithms. Therefore, if you chose ABC for feature selection, you should use some other representation of the search space that is not so high-dimensional or modify the algorithm by changing more dimensions in one step. The problem with IWO is that despite using a higher parameter for step size decreasing (), after a few iterations, it is too small to potentially change the solution. It can be seen in Figure 2 that IWO needed the fewest average iteration number, which is caused by the problem mentioned above. To solve it, you can use a higher parameter, for example, 0.9.
Our variant of PSO has higher exploration than exploitation, which gives it an opportunity to learn the space better. However, according to the results, most of the time, it can not find the best solution. The exploration and exploitation factors should be balanced individually depending on the dataset.
BA and GWO showed the best performance in both factors: increasing the accuracy score and decreasing the future number. The effectiveness of GWO is in its logic to move in the direction of three points instead of one or two like in other algorithms. It causes active movement in different dimensions. In BA algorithm, the better solution is not always accepted by an agent in order to achieve higher exploration. That is why it can take longer to find good solutions. For this reason, if you should choose one algorithm, we would recommend GWO.
Researches in this field mostly highlighted PSO, ABC, and Ant Colony Optimization as the most effective SI algorithms for FS. However, from the results, it can be seen that GWO and BA definitely deserve more attention and further studies.
5.5. Limitations
The findings of this study have to be seen in light of some limitations. Because of the train-test split mentioned in Section 5.2, the obtained accuracy results can vary when the split differs from the original one. The reason why we did not use cross-validation is because of its time complexity. SI algorithms are very time-consuming, and nearly 100 models are trained every iteration. Executing them with more train-test splits would significantly increase the research time and the required resources. Moreover, in this research, we are not focused on the exact accuracy scores. We are interested in how they change when reducing the number of features.
6. Conclusions and Future Works
In this paper, we showed the usability of SI methods for FS, implemented five SI algorithms, and compared their performance using decision tree classifier. It turned out that these methods can be effective for reducing the number of features as well as increasing the accuracy of machine learning model. The best performance according to ranking on different datasets was produced by GWO, but BA and PSO were very effective too.
Because of the random initialization on the beginning, agents are situated in the way that the number of selected features oscillates near the of the total number. To make the optimization faster, other initialization approaches can be used.
The paper provides all the information needed to realize FS with any of the five algorithms. However, individual parameter tuning is recommended before or during the optimization to achieve better results.
Future Works
The following steps can be carried out to improve the optimization:
- Try the optimization with other machine learning algorithms, for example, support vector machine or neural networks;
- Improve IWO or ABC using tips from previous section;
- Try different population sizes;
- Do parameter tuning;
- Implement and compare other SI methods;
- Try combining algorithms.
Author Contributions
Conceptualization, G.K. and A.K.; methodology, G.K. and A.K.; software, G.K.; validation, G.K. and A.K.; investigation, G.K. and A.K.; writing—original draft preparation, G.K. and A.K.; writing—review and editing, G.K. and A.K.; supervision, A.K.; project administration, A.K. All authors have read and agreed to the published version of the manuscript.
Funding
The project has been supported by the European Union, co-financed by the European Social Fund (EFOP-3.6.3-VEKOP-16-2017-00002). This research was also supported by grants of "Application Domain Specific Highly Reliable IT Solutions" project that has been implemented with the support provided from the National Research, Development and Innovation Fund of Hungary, financed under the Thematic Excellence Programme TKP2020-NKA-06 (National Challenges Subprogramme) funding scheme.
Institutional Review Board Statement
Not applicable.
Informed Consent Statement
Not applicable.
Data Availability Statement
All datasets were downloaded from open source UCI Machine Learning Repository.
Conflicts of Interest
The authors declare no conflict of interest.
Abbreviations
The following abbreviations are used in this manuscript:
| SI | Swarm intelligence |
| FS | Feature selection |
| PSO | Particle Swarm Optimization |
| ABC | Artificial Bee Colony |
| IWO | Invasive Weed Optimization |
| BA | Bat Algorithm |
| GWO | Grey Wolf Optimizer |
References
- Brezočnik, L.; Fister, I.; Podgorelec, V. Swarm Intelligence Algorithms for Feature Selection: A Review. Appl. Sci. 2018, 8, 1521. [Google Scholar] [CrossRef] [Green Version]
- Li, J.; Cheng, K.; Wang, S.; Morstatter, F.; Trevino, R.P.; Tang, J.; Liu, H. Feature Selection: A Data Perspective. ACM Comput. Surv. 2017, 50. [Google Scholar] [CrossRef] [Green Version]
- Saeys, Y.; Inza, I.; Larrañaga, P. A review of feature selection techniques in bioinformatics. Bioinformatics 2007, 23, 2507–2517. [Google Scholar] [CrossRef] [PubMed] [Green Version]
- Jović, A.; Brkić, K.; Bogunović, N. A review of feature selection methods with applications. In Proceedings of the 2015 38th International Convention on Information and Communication Technology, Electronics and Microelectronics (MIPRO), Opatija, Croatia, 25–29 May 2015; pp. 1200–1205. [Google Scholar] [CrossRef]
- Cai, J.; Luo, J.; Wang, S.; Yang, S. Feature selection in machine learning: A new perspective. Neurocomputing 2018, 300, 70–79. [Google Scholar] [CrossRef]
- Cox, M.A.A.; Cox, T.F. Multidimensional Scaling. In Handbook of Data Visualization; Springer: Berlin/Heidelberg, Germay, 2008; pp. 315–347. [Google Scholar] [CrossRef]
- Jolliffe, I. Principal Component Analysis. In Encyclopedia of Statistics in Behavioral Science; American Cancer Society: Atlanta, GA, USA, 2005. [Google Scholar] [CrossRef]
- Park, C.H.; Park, H. A comparison of generalized linear discriminant analysis algorithms. Pattern Recognit. 2008, 41, 1083–1097. [Google Scholar] [CrossRef] [Green Version]
- Nguyen, B.H.; Xue, B.; Zhang, M. A survey on swarm intelligence approaches to feature selection in data mining. Swarm Evol. Comput. 2020, 54, 100663. [Google Scholar] [CrossRef]
- Rostami, M.; Berahmand, K.; Nasiri, E.; Forouzandeh, S. Review of swarm intelligence-based feature selection methods. Eng. Appl. Artif. Intell. 2021, 100, 104210. [Google Scholar] [CrossRef]
- Beni, G.; Wang, J. Swarm Intelligence in Cellular Robotic Systems. In Robots and Biological Systems: Towards a New Bionics? Springer: Berlin/Heidelberg, Germany, 1993; pp. 703–712. [Google Scholar] [CrossRef]
- Fister, I., Jr.; Yang, X.; Fister, I.; Brest, J.; Fister, D. A Brief Review of Nature-Inspired Algorithms for Optimization. arXiv 2013, arXiv:1307.4186. [Google Scholar]
- Hassanien, A.; Emary, E. Swarm Intelligence: Principles, Advances, and Applications; CRC Press: Boca Raton, FL, USA, 2018. [Google Scholar]
- Panigrahi, B.; Shi, Y.; Lim, M. Handbook of Swarm Intelligence: Concepts, Principles and Applications; Adaptation, Learning, and Optimization; Springer: Berlin/Heidelberg, Germany, 2011. [Google Scholar]
- Kennedy, J.; Eberhart, R. Particle swarm optimization. In Proceedings of the ICNN’95—International Conference on Neural Networks, Perth, WA, Australia, 27 November–1 December 1995; pp. 1942–1948. [Google Scholar] [CrossRef]
- Poli, R.; Kennedy, J.; Blackwell, T. Particle swarm optimization. Swarm Intell. 2007, 1. [Google Scholar] [CrossRef]
- Karaboga, D.; Basturk, B. A powerful and efficient algorithm for numerical function optimization: Artificial bee colony (ABC) algorithm. J. Glob. Optim. 2007, 39, 459–471. [Google Scholar] [CrossRef]
- Brownlee, J. Clever Algorithms: Nature-inspired Programming Recipes; Lulu.com: Morrisville, NC, USA, 2011. [Google Scholar]
- Ossai, C.I. A Data-Driven Machine Learning Approach for Corrosion Risk Assessment—A Comparative Study. Big Data Cogn. Comput. 2019, 3, 28. [Google Scholar] [CrossRef] [Green Version]
- Mehrabian, A.; Lucas, C. A novel numerical optimization algorithm inspired from weed colonization. Ecol. Inform. 2006, 1, 355–366. [Google Scholar] [CrossRef]
- Karimkashi, S.; Kishk, A.A. Invasive Weed Optimization and its Features in Electromagnetics. IEEE Trans. Antennas Propag. 2010, 58, 1269–1278. [Google Scholar] [CrossRef]
- Yang, X.S. A New Metaheuristic Bat-Inspired Algorithm. In Nature Inspired Cooperative Strategies for Optimization (NICSO 2010); Springer: Berlin/Heidelberg, Germany, 2010; pp. 65–74. [Google Scholar] [CrossRef] [Green Version]
- Mirjalili, S.; Mirjalili, S.M.; Lewis, A. Grey Wolf Optimizer. Adv. Eng. Softw. 2014, 69, 46–61. [Google Scholar] [CrossRef] [Green Version]
- Teng, Z.J.; Lv, J.L.; Guo, L.W. An improved hybrid grey wolf optimization algorithm. Soft Comput. 2019, 23, 6617–6631. [Google Scholar] [CrossRef]
- Trabelsi Ben Ameur, S.; Sellami, D.; Wendling, L.; Cloppet, F. Breast Cancer Diagnosis System Based on Semantic Analysis and Choquet Integral Feature Selection for High Risk Subjects. Big Data Cogn. Comput. 2019, 3, 41. [Google Scholar] [CrossRef] [Green Version]
- Al-Tashi, Q.; Abdul Kadir, S.J.; Rais, H.M.; Mirjalili, S.; Alhussian, H. Binary Optimization Using Hybrid Grey Wolf Optimization for Feature Selection. IEEE Access 2019, 7, 39496–39508. [Google Scholar] [CrossRef]
- Liu, H.; Motoda, H.; Setiono, R.; Zhao, Z. Feature Selection: An Ever Evolving Frontier in Data Mining. In Proceedings of the Fourth International Workshop on Feature Selection in Data Mining, Hyderabad, India, 21 June 2010; Volume 10, pp. 4–13. [Google Scholar]
- Liu, H.; Zhao, Z. Manipulating Data and Dimension Reduction Methods: Feature Selection. In Computational Complexity: Theory, Techniques, and Applications; Springer: New York, NY, USA, 2012; pp. 1790–1800. [Google Scholar] [CrossRef]
- Xue, B.; Zhang, M.; Browne, W.N. A Comprehensive Comparison on Evolutionary Feature Selection Approaches to Classification. Int. J. Comput. Intell. Appl. 2015, 14, 1550008. [Google Scholar] [CrossRef]
- Quinlan, J. C4.5: Programs for Machine Learning; Elsevier: Amsterdam, The Netherlands, 2014. [Google Scholar]
- Stein, G.; Chen, B.; Wu, A.S.; Hua, K.A. Decision Tree Classifier for Network Intrusion Detection with GA-Based Feature Selection. In Proceedings of the 43rd Annual Southeast Regional Conference, New York, NY, USA, 14–18 March 2005; pp. 136–141. [Google Scholar] [CrossRef]
- Emary, E.; Zawbaa, H.M.; Hassanien, A.E. Binary grey wolf optimization approaches for feature selection. Neurocomputing 2016, 172, 371–381. [Google Scholar] [CrossRef]
- Kennedy, J.; Eberhart, R. A discrete binary version of the particle swarm algorithm. In Proceedings of the 1997 IEEE International Conference on Systems, Man, and Cybernetics. Computational Cybernetics and Simulation, Orlando, FL, USA, 12–15 October 1997; pp. 4104–4108. [Google Scholar] [CrossRef]
- Dua, D.; Graff, C. UCI Machine Learning Repository. 2017. Available online: http://archive.ics.uci.edu/ml (accessed on 3 July 2021).
Figure 1.
The Swarm Intelligence basic algorithm.
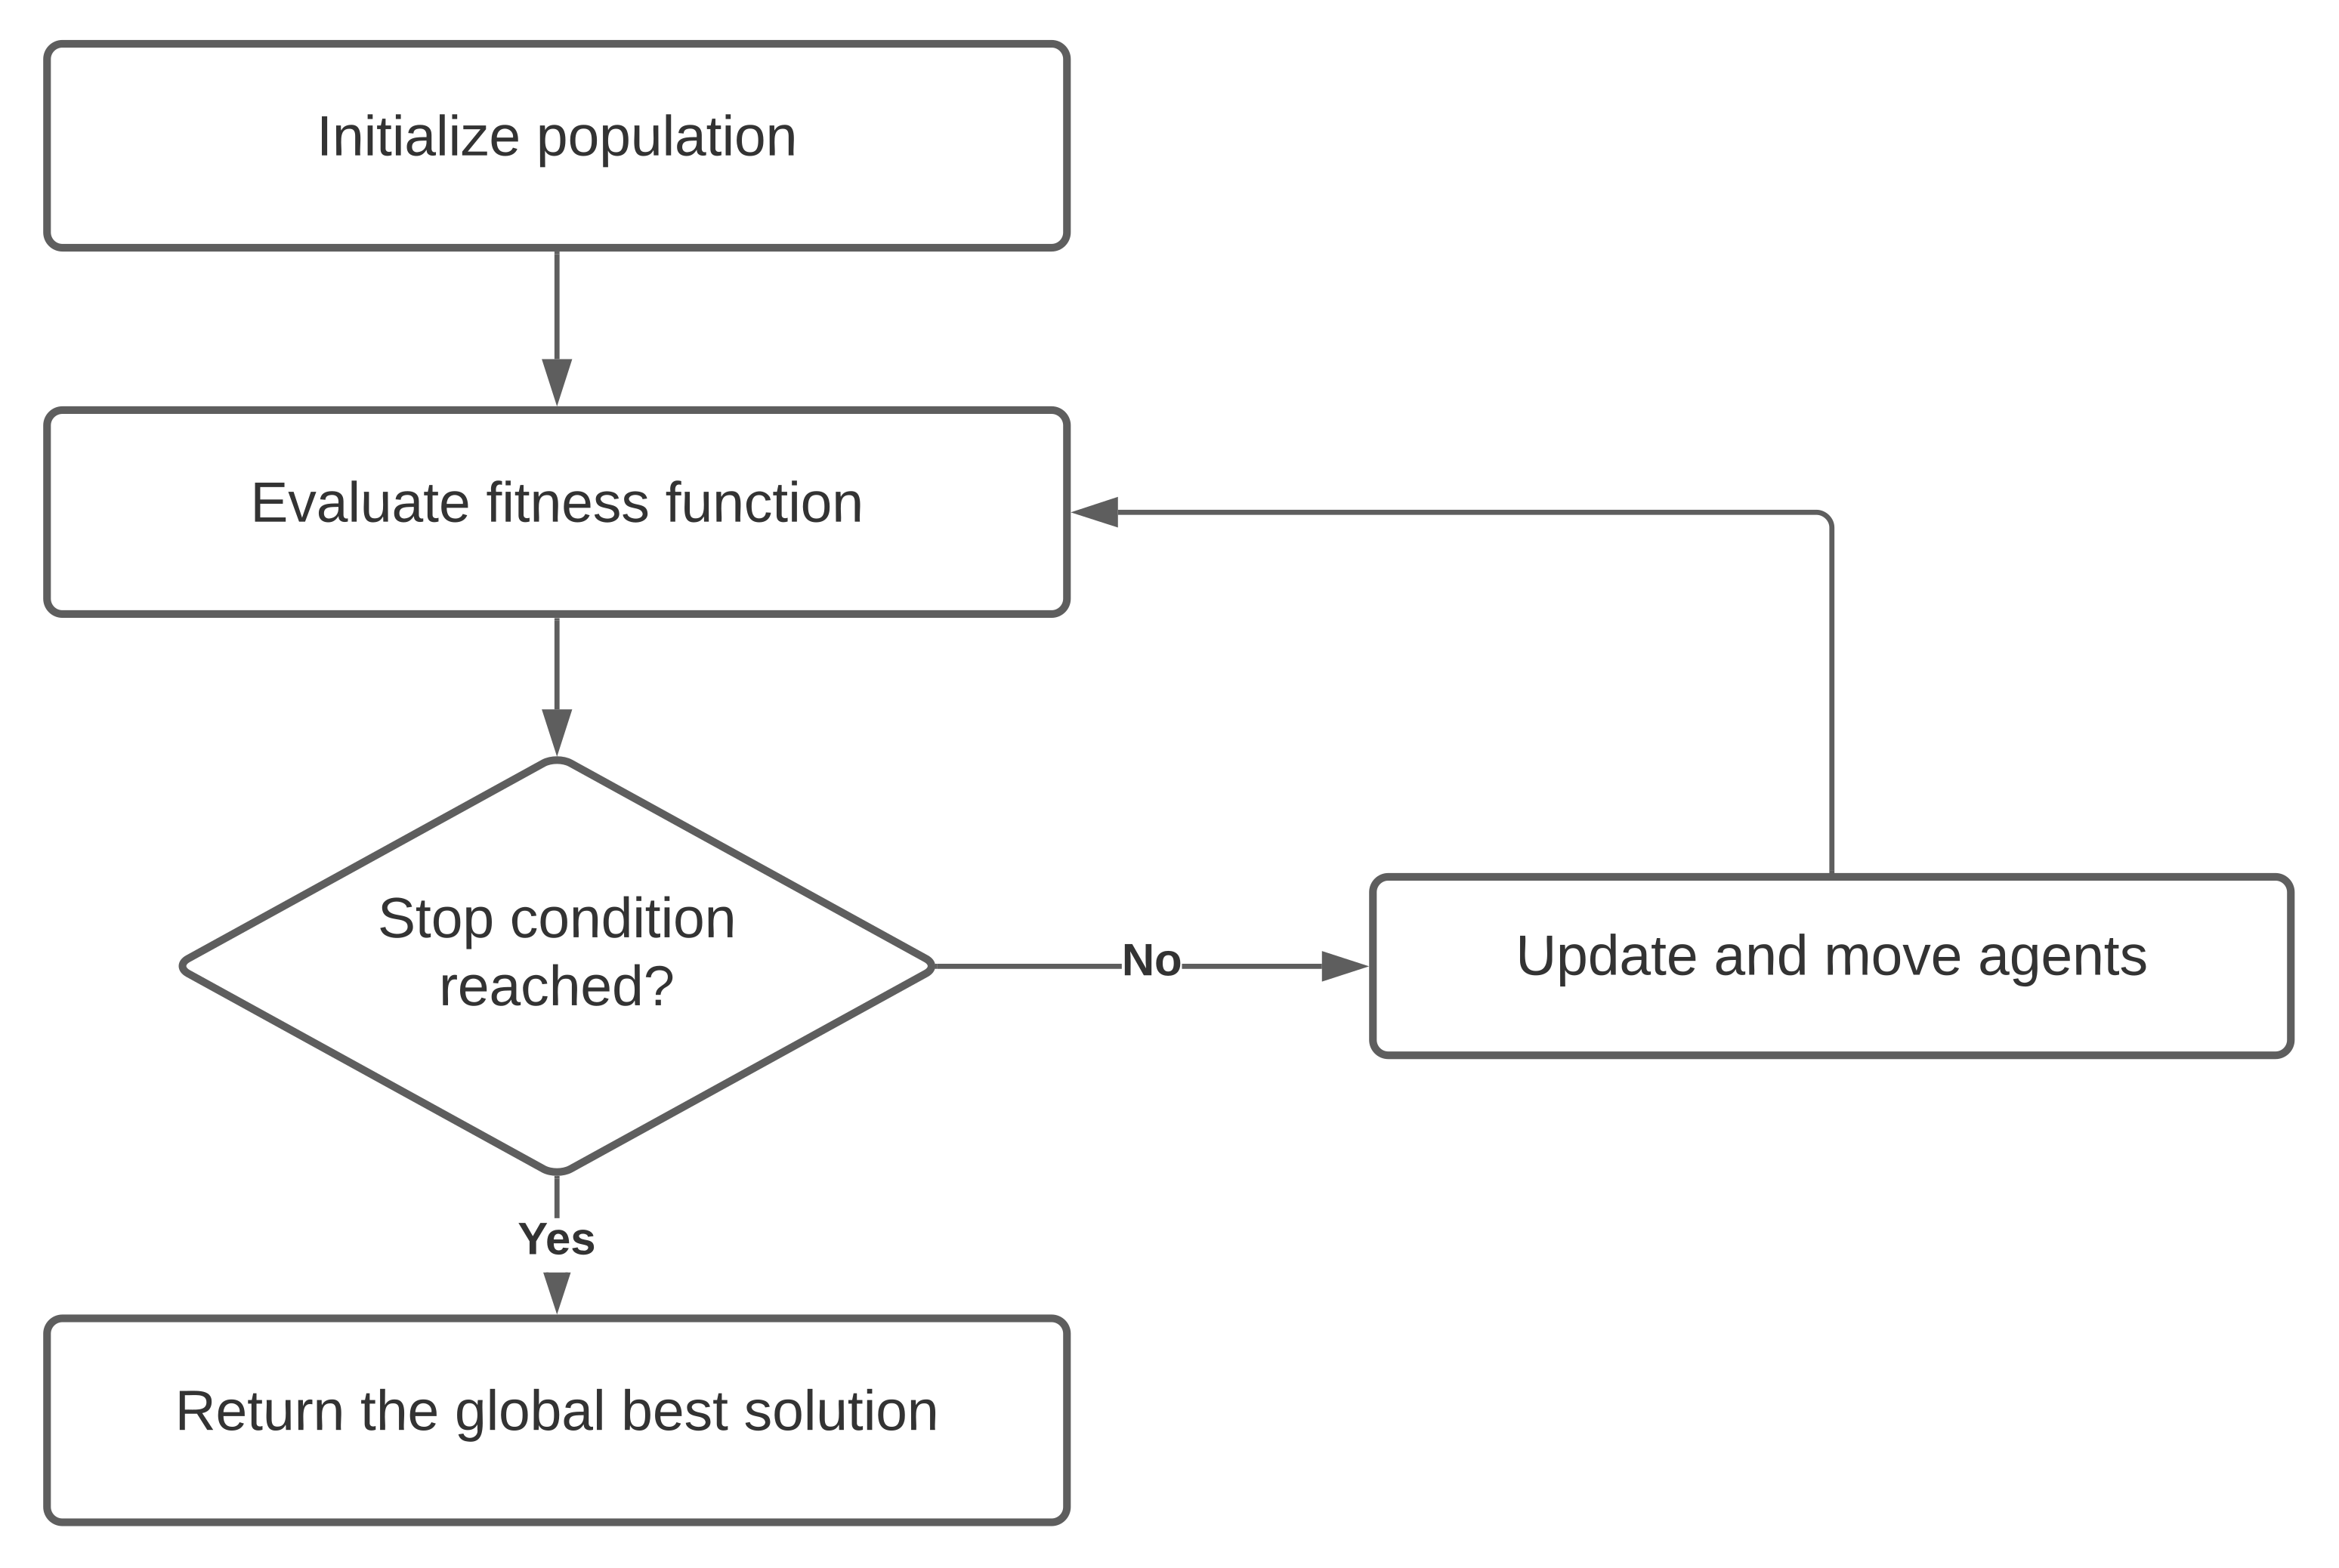
Figure 2.
The average iteration number to reach the best solution.

Figure 3.
A ranking of algorithms based on results.

Table 1.
Short summary of the algorithms.
| ID | Inspiration | Exploration | Exploitation | Aim Points | Num of Parameters |
|---|---|---|---|---|---|
| PSO | birds | high | low | 2 | 3 |
| ABC | honey bees | low | medium | 2 | 1 |
| IWO | weeds | low | high | 1 | 4 |
| BA | bats | medium | high | 1 | 4 |
| GWO | wolves | high | medium | 3 | 0 |
Table 2.
The characteristics of the used datasets.
| ID | Name | Attribute Types | Instances | Attributes |
|---|---|---|---|---|
| 1 | Arrhythmia | Categorical, Real | 452 | 279 |
| 2 | Chess (KR vs. KP) | Categorical | 3196 | 36 |
| 3 | Crowdsourced Mapping | Real | 10,546 | 29 |
| 4 | Hepatitis C Virus (HCV) | |||
| for Egyptian patients | Integer, Real | 1385 | 29 | |
| 5 | MEU-Mobile KSD | Integer, Real | 2856 | 71 |
| 6 | Phishing Websites | Integer | 2456 | 30 |
| 7 | QSAR androgen receptor | Integer | 1687 | 1024 |
| 8 | DBWorld e-mails | Integer | 64 | 4702 |
| 9 | Musk (Version 2) | Integer | 6598 | 168 |
| 10 | A study of Asian Religious | |||
| and Biblical Texts | Integer | 590 | 8265 | |
| 11 | Ozone Level Detection | Real | 2536 | 73 |
| 12 | Diabetic Retinopathy | Integer, Real | 1151 | 20 |
| 13 | Geographical Original of Music | Real | 1059 | 68 |
| 14 | Wall-Following Robot Navigation | Real | 5456 | 24 |
| 15 | Insurance Company Benchmark | Categorical, Integer | 9000 | 85 |
| 16 | Internet Advertisements | Integer, Real | 3279 | 1558 |
| 17 | Amazon Commerce reviews | Real | 1500 | 10,000 |
Table 3.
Accuracy scores before and after optimization.
| Dataset ID | Original | PSO | IWO | ABC | BA | GWO |
|---|---|---|---|---|---|---|
| 1 | 0.357 | 0.643 | 0.714 | 0.643 | 0.643 | 0.643 |
| 2 | 0.997 | 0.992 | 0.997 | 0.994 | 0.997 | 0.997 |
| 3 | 0.874 | 0.895 | 0.886 | 0.890 | 0.892 | 0.896 |
| 4 | 0.274 | 0.343 | 0.368 | 0.365 | 0.357 | 0.357 |
| 5 | 0.642 | 0.710 | 0.682 | 0.682 | 0.685 | 0.699 |
| 6 | 0.961 | 0.964 | 0.961 | 0.961 | 0.962 | 0.969 |
| 7 | 0.875 | 0.931 | 0.920 | 0.917 | 0.937 | 0.931 |
| 8 | 0.727 | 1.0 | 1.0 | 1.0 | 1.0 | 1.0 |
| 9 | 0.965 | 0.989 | 0.994 | 0.986 | 0.993 | 0.992 |
| 10 | 0.712 | 0.890 | 0.847 | 0.831 | 0.864 | 0.890 |
| 11 | 0.915 | 0.949 | 0.947 | 0.945 | 0.949 | 0.954 |
| 12 | 0.621 | 0.709 | 0.691 | 0.730 | 0.739 | 0.739 |
| 13 | 0.207 | 0.349 | 0.325 | 0.312 | 0.382 | 0.373 |
| 14 | 0.996 | 0.996 | 0.994 | 0.997 | 0.995 | 0.995 |
| 15 | 0.880 | 0.936 | 0.923 | 0.920 | 0.926 | 0.931 |
| 16 | 0.968 | 0.983 | 0.977 | 0.980 | 0.980 | 0.979 |
| 17 | 0.337 | 0.497 | 0.460 | 0.413 | 0.483 | 0.473 |
Table 4.
The number of features before and after optimization.
| Dataset ID | Original | PSO | IWO | ABC | BA | GWO |
|---|---|---|---|---|---|---|
| 1 | 279 | 118 | 126 | 140 | 102 | 77 |
| 2 | 73 | 36 | 42 | 43 | 41 | 28 |
| 3 | 28 | 15 | 17 | 18 | 12 | 19 |
| 4 | 28 | 13 | 12 | 14 | 11 | 13 |
| 5 | 71 | 36 | 39 | 36 | 38 | 39 |
| 6 | 30 | 22 | 22 | 20 | 20 | 21 |
| 7 | 1024 | 493 | 512 | 515 | 503 | 511 |
| 8 | 4702 | 2131 | 2271 | 2311 | 1971 | 2034 |
| 9 | 168 | 84 | 83 | 104 | 89 | 93 |
| 10 | 8266 | 4085 | 4118 | 4235 | 4101 | 4063 |
| 11 | 73 | 39 | 32 | 40 | 31 | 38 |
| 12 | 19 | 9 | 11 | 12 | 8 | 7 |
| 13 | 68 | 38 | 32 | 36 | 38 | 28 |
| 14 | 24 | 11 | 12 | 16 | 9 | 7 |
| 15 | 85 | 28 | 43 | 31 | 34 | 33 |
| 16 | 1558 | 732 | 784 | 776 | 681 | 751 |
| 17 | 10,000 | 4960 | 5012 | 4969 | 4958 | 4908 |
Publisher’s Note: MDPI stays neutral with regard to jurisdictional claims in published maps and institutional affiliations. |
© 2021 by the authors. Licensee MDPI, Basel, Switzerland. This article is an open access article distributed under the terms and conditions of the Creative Commons Attribution (CC BY) license (https://creativecommons.org/licenses/by/4.0/).
Share and Cite
MDPI and ACS Style
Kicska, G.; Kiss, A. Comparing Swarm Intelligence Algorithms for Dimension Reduction in Machine Learning. Big Data Cogn. Comput. 2021, 5, 36. https://doi.org/10.3390/bdcc5030036
AMA Style
Kicska G, Kiss A. Comparing Swarm Intelligence Algorithms for Dimension Reduction in Machine Learning. Big Data and Cognitive Computing. 2021; 5(3):36. https://doi.org/10.3390/bdcc5030036
Chicago/Turabian StyleKicska, Gabriella, and Attila Kiss. 2021. "Comparing Swarm Intelligence Algorithms for Dimension Reduction in Machine Learning" Big Data and Cognitive Computing 5, no. 3: 36. https://doi.org/10.3390/bdcc5030036