Article

A Preliminary Study of Summer Thermo-Hygrometric Comfort under Different Environmental Conditions in a Mediterranean City

by
Serena Falasca
1,
Annalisa Di Bernardino
1,*,
Virgilio Ciancio
2,
Gabriele Curci
3,4 and
Ferdinando Salata
2
1
Department of Physics, Sapienza University of Rome, 00185 Rome, Italy
2
Department of Astronautical, Electrical and Energy Engineering—Area Fisica Tecnica, Sapienza University of Rome, 00185 Rome, Italy
3
Department of Physical and Chemical Sciences, University of L’Aquila, 67100 L’Aquila, Italy
4
Center of Excellence in Telesensing of Environment and Model Prediction of Severe Events (CETEMPS), University of L’Aquila, 67100 L’Aquila, Italy
*
Author to whom correspondence should be addressed.
Urban Sci. 2022, 6(3), 51; https://doi.org/10.3390/urbansci6030051
Submission received: 28 July 2022 / Revised: 11 August 2022 / Accepted: 18 August 2022 / Published: 21 August 2022

Abstract

:
The thermo-hygrometric sensation of pedestrians in outdoor environments can be quantified by means of bioclimatic indices. In this work, the Mediterranean Outdoor Thermal Comfort Index (MOCI) is applied in the city of Rome (Italy) for the purpose of investigating the effect of local environmental conditions (urban, suburban, rural) on pedestrian thermal comfort. Hourly values of MOCI are calculated for the May–September period in the years 2015–2021 using weather quantities acquired by the four monitoring stations of the Regional Agency for Environmental Protection included in the metropolitan area of Rome. MOCI data are analyzed based on the comfort and (cold/hot) discomfort conditions during both daytime and nighttime. At the urban station, 26% of daily records exceed the comfort threshold revealing the effect of urban overheating, whereas only 0.1% of hot discomfort occurrences are recorded overnight. Here, greater nighttime thermal comfort is experienced than in non-urban locations suggesting that the nocturnal thermo-hygrometric conditions are satisfactory for inhabitants in downtown Rome, despite the urban heat island. It also suggests that other factors, such as orography and atmospheric circulation, influence outdoor thermal comfort. The development of this work will therefore include at least these two elements.

1. Introduction

Given the progressive urbanization of the global surface [1], a growing percentage of people live in metropolises and are exposed to widely investigated issues such as poor air quality [2] and thermal discomfort [3]. “Thermal Comfort is that condition of mind that expresses satisfaction with the thermal environment” (ASHRAE Standard 55). This definition leaves open what is meant by the condition of mind or satisfaction, but it correctly emphasizes that the judgment of comfort is a cognitive process involving many inputs influenced by physical, physiological, psychological, and other processes [4,5,6]. Different approaches are used to assess the outdoor thermal comfort in cities characterized by different climates (e.g., Brazil [7], Hong Kong [8], The Netherlands [9], Spain [10], and other European cities [11], United States [12], and India [13]). As is well known, built areas alter the local surface energy balance, impacting micrometeorological variables (e.g., air temperature and humidity) and local atmospheric circulation, with consequences for pedestrian comfort conditions. In particular, some scholars focused on the relationship between geometric features and comfort (e.g., aspect ratios and sky view factors [14]). Shahfahad et al., 2022 [15] highlighted the correlation between the size of built-up areas and the worsening in thermal comfort in recent decades in Delhi (India). Van Hove et al., 2015 [16] ascribed the higher number of discomfort hours in Rotterdam to “much lower winds in urban areas”. A general enhancement of the outdoor thermal comfort due to urban green spaces was detected by [17]. At the same time, the effectiveness of different heat mitigation strategies is investigated in order to define good practices for the sustainable development of cities, especially in the context of climate change. The most popular mitigation techniques are high-albedo materials [18], vegetation/green coverage [19], urban geometry, water-based systems [20], and the combinations of these [21,22]. Recently, some reviews discussed the latest findings on this topic [23,24].
It is important to highlight that outdoor thermal comfort is usually studied with different approaches or “models”, such as bioclimatic indices [25]. Several bioclimatic indices have been proposed in the last decades to quantify outdoor thermal sensation. They are based on different rationales and can be grouped into rational, empirical, and direct indices [26]. Site-specific empirical indices have been designed/developed for specific geographical areas, such as the thermal comfort Index for cities of Arid Zones (IZA) [27], and the Mediterranean Outdoor Thermal Comfort Index (MOCI) [28], Turkish Outdoor Comfort Index (TOCI) [29]. A comprehensive examination of bioclimatic indices can be found in [30].
In this work, MOCI is applied to investigate the effect of local environmental conditions on the thermo-hygrometric comfort of pedestrians in Rome (Italy). Rome has been chosen as a case study since it is the most populous city in Italy, as well as its capital, and has peculiar morphological characteristics due to its ancient origin. The phenomenon of the urban heat island in Rome has been extensively studied from different points of view. Ciardini et al., 2019 [31] investigated the interconnections between the urban heat island and the spatial and temporal micrometeorological variability. Morini et al., 2018 [32] found that increased albedo can favor the mitigation of the urban heat island and proposed a new numerical parameterization able to better represent the Rome morphology. Di Bernardino et al., 2022 [33] analyzed through numerical simulations the interaction between atmospheric circulation and urban heat island in Rome, evaluating the impact of land use and thermal/physical properties of the surfaces. The outdoor thermal comfort in Rome has been also investigated in relation to heat waves and mitigation strategies [34], daily shading [35], tourism [36], everyday movements of people [37], and historical urban canyons [38]. However, the link between thermo-hygrometric comfort and the local environment is poorly explored.
In the present study, four in-situ meteorological stations, belonging to the micrometeorological monitoring network managed by the Regional Agency for Environmental Protection (ARPA Lazio) are considered. The location of the four weather stations allows the link between thermal comfort and local environmental conditions to be adequately explored. Furthermore, the temporal coverage of the data (from 2015 to 2021) can be considered sufficiently representative of the local weather conditions.
The paper is structured as follows: Section 2 presents the material and methods of the proposed work, with the presentation of the area of interest and the description of the dataset and of the MOCI index. The main results of the study are presented and discussed in Section 3, while the main findings are summarized in Section 4.

2. Materials and Methods
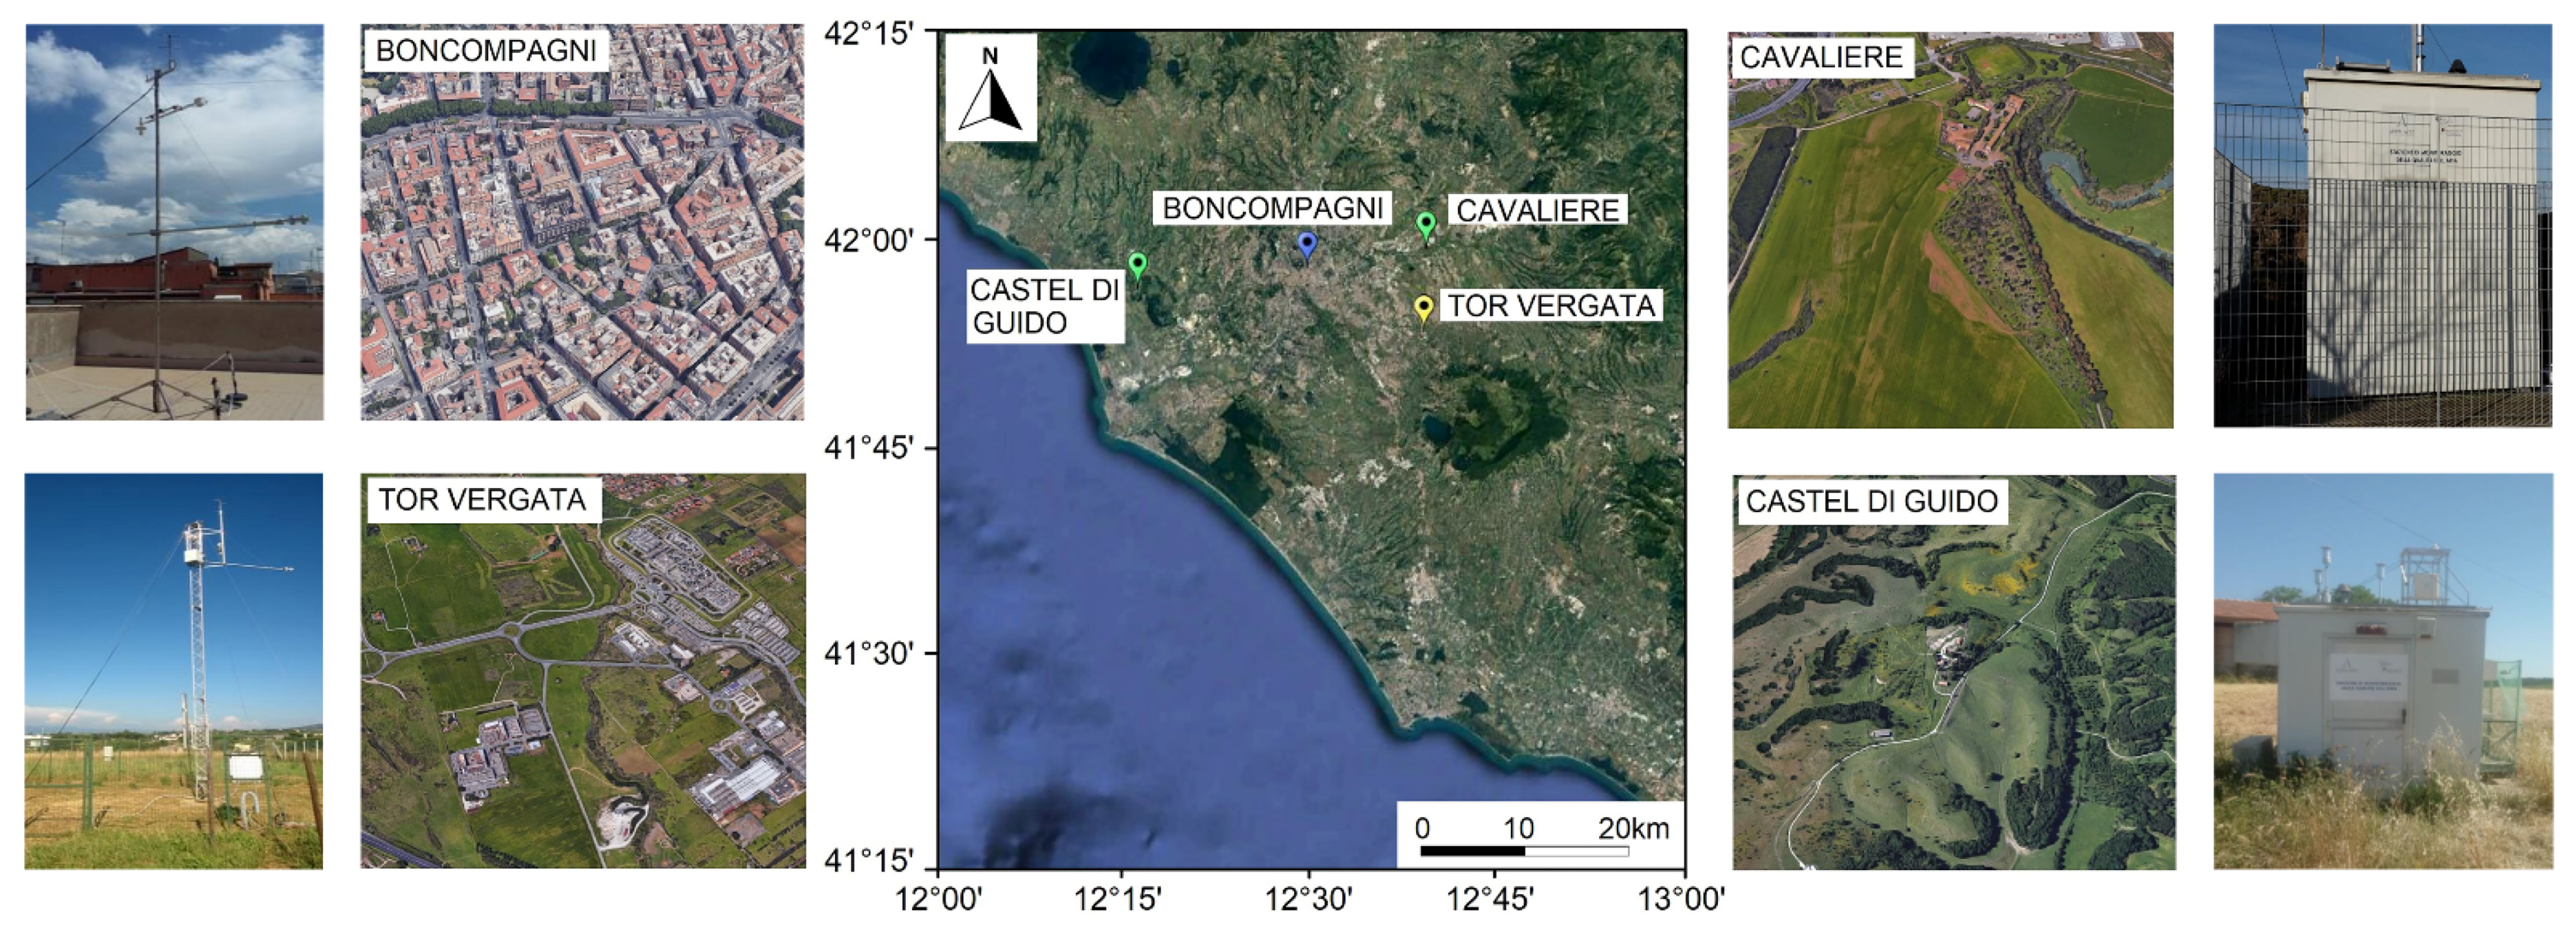
In this work, the outdoor thermal comfort in the metropolitan area of Rome is quantified through the MOCI index during the May–September months from 2015 to 2021. As described in Section 2.3, the computation of MOCI requires weather variables supplied by the monitoring stations of ARPA Lazio micrometeorological monitoring network. In the following subsections, the study area and the methodology are described in detail.

2.1. The Study Area

Rome is the Italian capital and the metropolitan area, hosting 2.8 million residents in about 1300 km2, is the first European municipality by territorial extension, and one of the densest populated European urban areas (www.comune.roma.it, last accessed on 27 July 2022).
Although the city of Rome has developed over many centuries, during the last decades its urban arrangement has changed considerably, passing from being a compact city, with a structure typical of historic towns, to a widespread metropolis, still developed around a city center but more branched and dispersed in the surrounding areas, and without a logical and systematic criterion. This implies that, even in downtown Rome, densely built-up areas with a compact building fabric alternate with scattered building fabric areas and large urban parks.
The city stretches along the Tiber valley and is surrounded by the Apennine Mountains to the north-west and by the Alban Hills to the south. To the east, the coast of the Tyrrhenian Sea is about 27 km far from the urban center.
Thanks to the morphology of the region and the proximity of the sea, Rome is subject to two peculiar anemological regimes: (i) the drainage flow in the Tiber valley [39], with wind from the northeast, characteristic of the innermost areas, and (ii) the sea/land breeze regime, typical of the region closest to the Tyrrhenian coast and of the western portion of the city. This latter regime develops because of the thermal differences between inland and sea surface, giving rise to winds from the southwest during daytime and from the northeast during nighttime [40]. According to the climate classification proposed by Köppen–Geiger [41], the region belongs to the Csa group, i.e., hot summer Mediterranean characterized by hot, dry summers and mild, wet winters.

2.2. Micrometeorological Measurements

In what follows, the micrometeorological stations used in the present study are briefly presented.
As shown in Figure 1, the weather stations are located both in downtown Rome and in its surroundings, allowing for the comparison of meteorological parameters in areas with different degrees of urbanization and different land use categorization. Geographical coordinates, altitude, and land use of the stations are listed in Table 1.
The Boncompagni (hereinafter, Bon) station is located in the center of Rome, in a densely built-up area. Tor Vergata (TV) is about 10 km southwest of Rome, in the sub-urban area with dispersed buildings and industries. The Castel di Guido (CdG) and Cavaliere (Cav) stations are both in rural environments, surrounded by cultivated fields without significant buildings or obstacles, and are located respectively to the west and east of the metropolitan area of Rome. The different distance from the Tyrrhenian coast (about 8 km for CdG and 40 km for Cav) makes it possible to evaluate the effect of local and mesoscale atmospheric circulation systems (such as the sea/land breeze regime) under the same environmental conditions. At TV, CdG, and Cav, the meteorological instruments are mounted on masts placed on the ground, away from obstacles that can affect the measurements, whereas at Bon the mast is positioned on the roof of a 5-storey building, so as not to be affected by the proximity of neighboring buildings. All the stations are equipped with a USA1 Scientific ultrasonic anemometer (METEK Meteorologische Messtechnik GmbH, Elmshorn, Germany), a HMP 45AC thermohygrometer (Vaisala, Vantaa, Finland) and a CNR1 radiometer (Kipp & Zonen, Delft, The Netherlands) and provide wind speed (m/s) and direction (degrees), surface air temperature (°C), and global solar radiation (W/m2) as hourly-averaged values. All sensors are WMO (World Meteorological Organization) compliant, so as to provide measures that can be used for urban meteorology studies and for the assessment of comfort at the pedestrian level [42] and data are provided by ARPA Lazio as quality checked, although no exact information about data uncertainty is currently available.

2.3. The Mediterranean Outdoor Thermal Comfort (MOCI) Index

The Mediterranean Outdoor Thermal Comfort Index (MOCI) estimates the average thermal sensation in outdoor spaces of people living in the Mediterranean area. It is based on the ASHRAE 7-point scale ranging from −3 (very cold) to +3 (very hot), with 0 corresponding to neutral thermal sensation.
A transversal field survey conducted in Rome from February 2014 to January 2015 and involving more than 1000 people included questionnaires and micrometeorological measurements. The results were then used to build a multiple regression model, also taking into account the results of a best-subsets analysis, and thus define an index of well-being in outdoor spaces. This index was developed in order to have a tool that was able to both evaluate and predict the thermal perception of the normotype of the Mediterranean area [24]. The original expression of MOCI included the following independent variables: air temperature, average radiant temperature (quantifying how people experience radiation), wind speed, relative humidity, and thermal clothing insulation. A modified version of MOCI (Equation (1)) omitting the average radiant temperature has been introduced and applied in [18] to calculate the MOCI through the weather variables simulated by the Weather Research and Forecasting model.
MOCI = −4.257 + 0.325 × ICL + 0.146 × TA + 0.005 × RH + 0.001 × IS − 0.235 × Ws,
where ICL is the thermal clothing insulation, TA is the ambient temperature, RH is the relative humidity, IS is the solar radiation, and Ws is the wind speed intensity.
Thermal clothing insulation is defined as:
ICL = 1.608 − 0.038 × TA,
Since the ARPA monitoring stations do not acquire the radiant temperature, in this work the modified MOCI (Equation (1)) is employed.
The Mediterranean Outdoor Comfort Index (MOCI) was compared with 4 other weather indicators: Actual Sensation Vote Europe (ASVEUROPE), Effective Temperature (ET), Physiological Equivalent Temperature (PET) and Predicted Mean Vote (PMV). The comparison took place through four criteria (the Spearman’s rho measure of correlation, the symmetrical measure of association gamma, the total percentage of correct predictions, and the distribution of the correct predictions for each class of thermal perception) and showed that the MOCI is the most suitable index to examine the external thermal comfort in the Mediterranean area [43]. In particular, thermal comfort conditions correspond to the range −0.5÷0.5. Higher MOCI values imply hot sensation, whereas lower MOCI values imply cold sensation.

3. Results

According to the Köppen–Geiger climate classification [41], in the case of Mediterranean climate, in Rome the conditions of the greatest thermal discomfort are experienced during the warm months. For this reason, the analysis is focused on the observations collected from May 01 to September 30 of the years 2015–2021. Furthermore, to deepen the analysis and to evaluate the level of thermal comfort according to the time of day, the hourly dataset has been divided into a daytime (from 06:00 to 19:00 LT) and a nighttime (from 20:00 to 05:00 LT) sub-dataset.

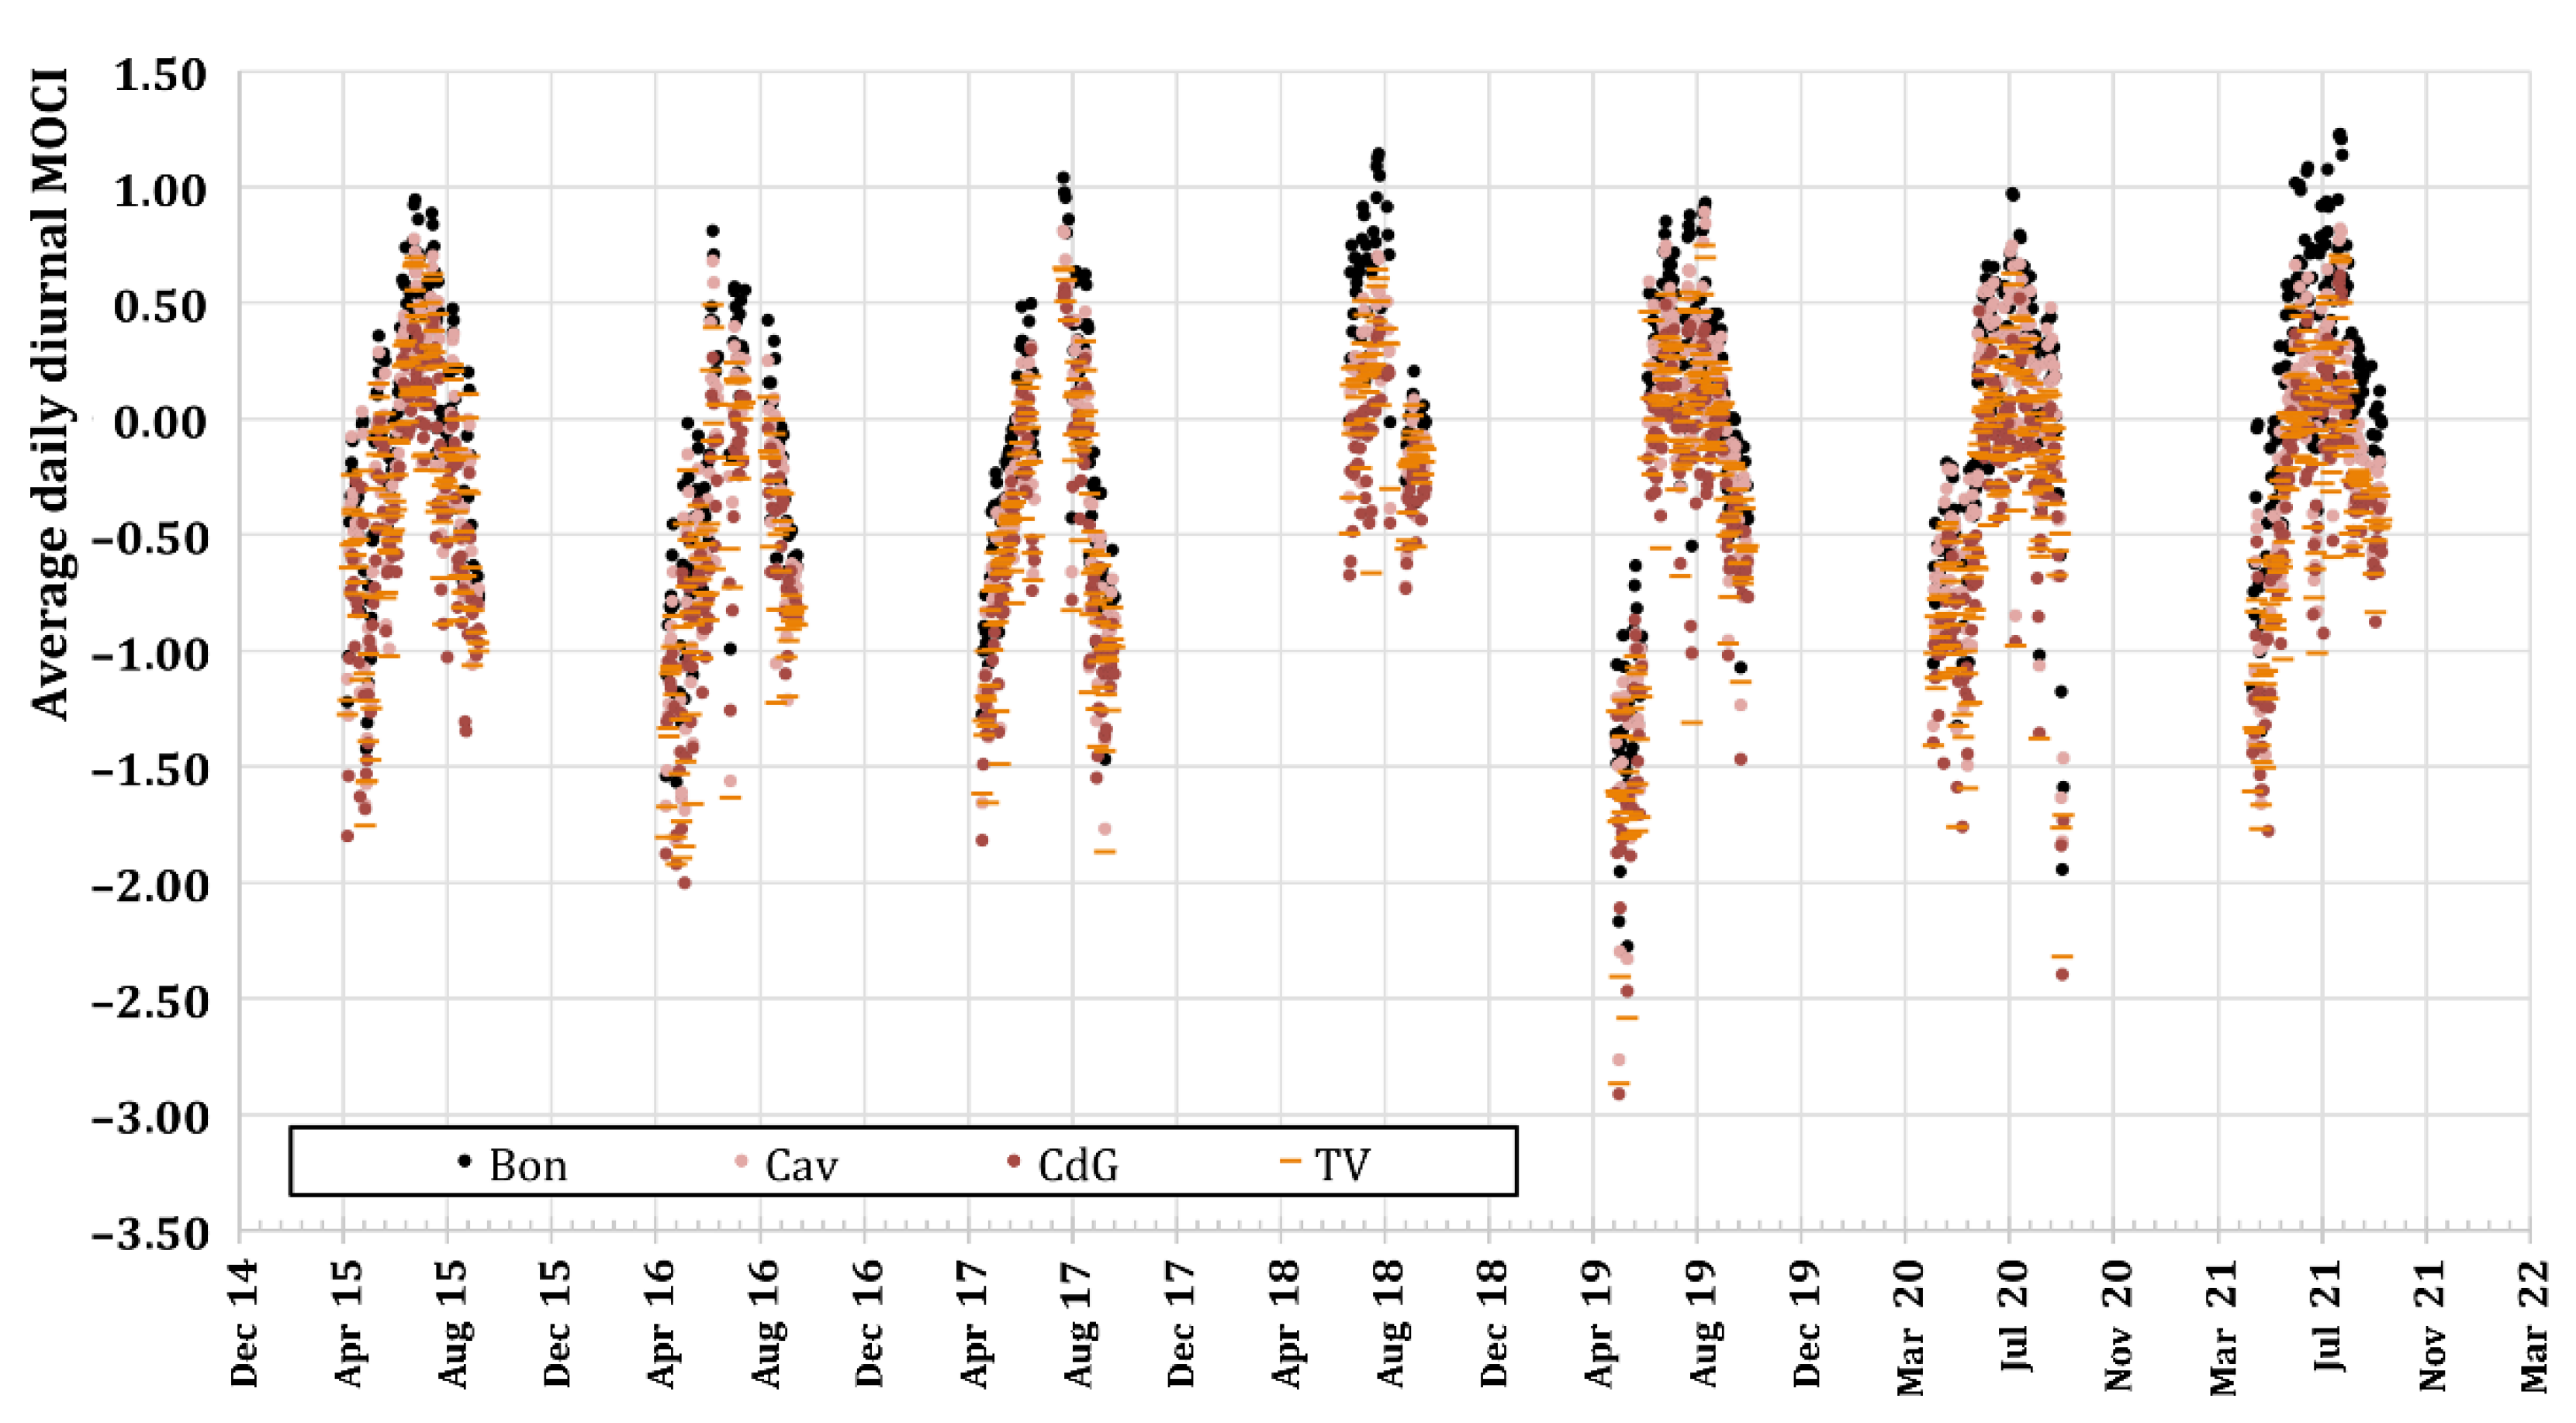
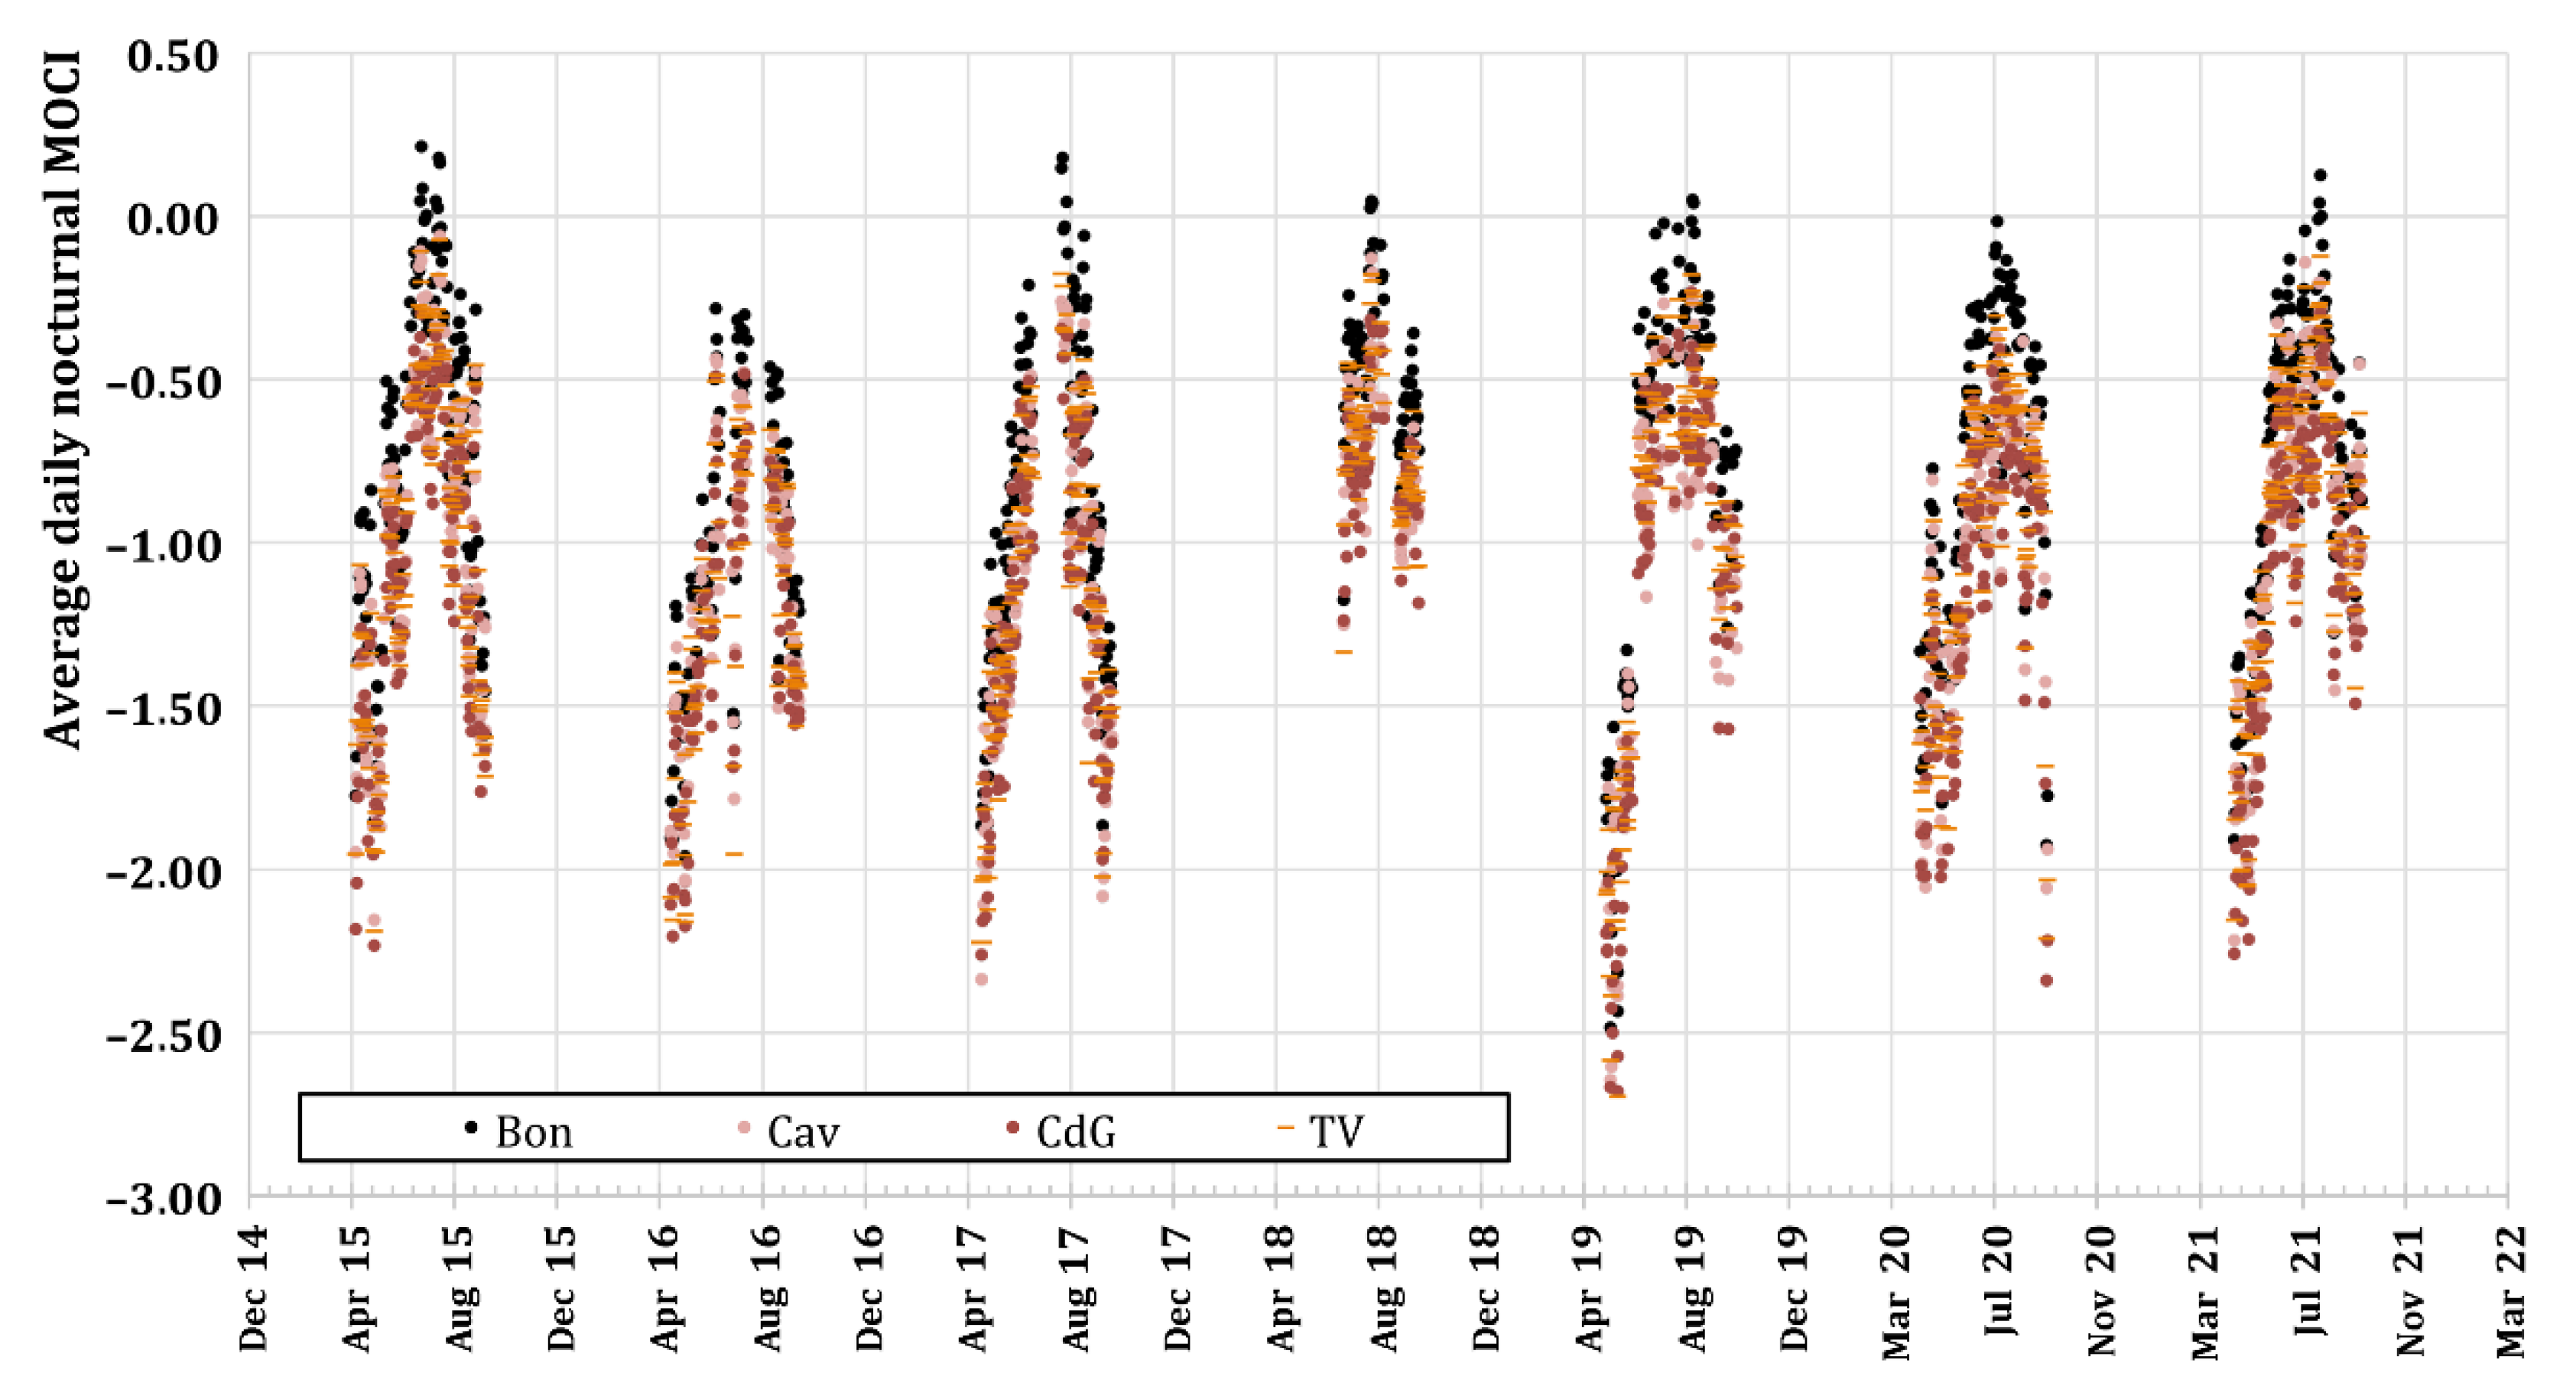
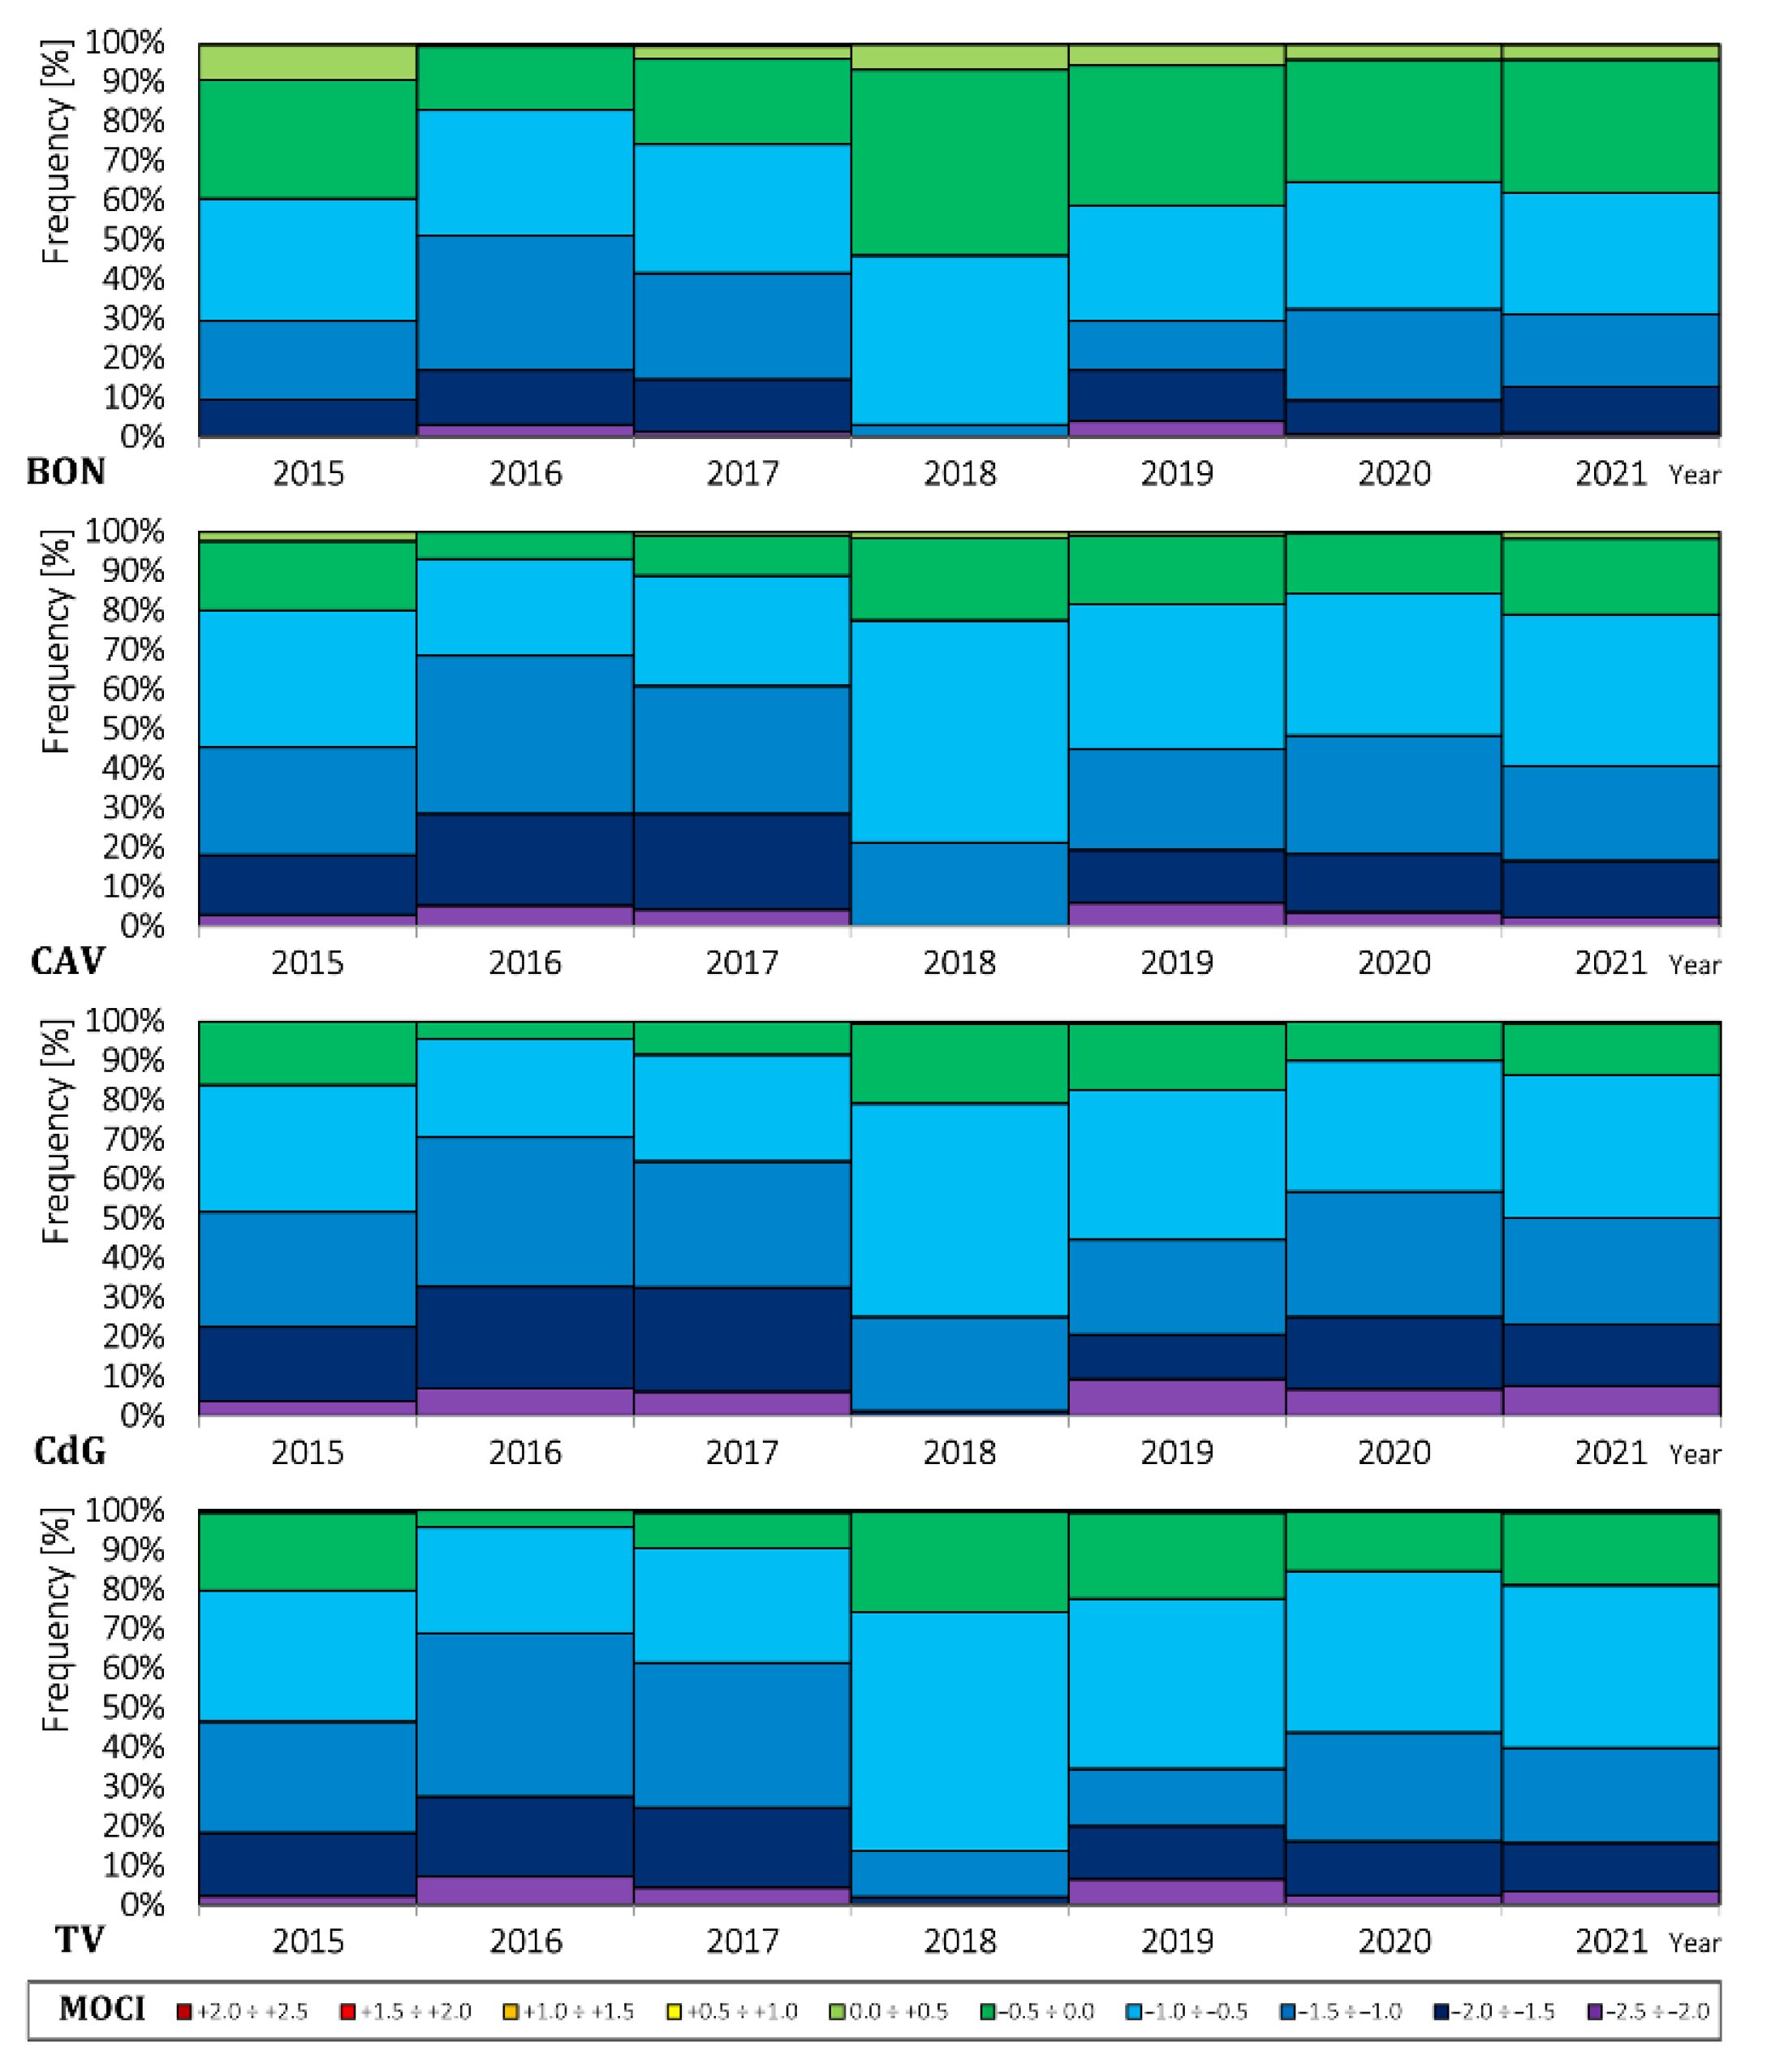
3.1. Daily-Averaged MOCI Index

Figure 2 shows the time series of the diurnal daily-averaged MOCI values for the four selected weather stations. Similarly, Figure 3 shows the time series of the daily-averaged MOCI values at night.
Both during daytime and nighttime, all the stations present an evident seasonal cycle. The MOCI index assumes lower values in May and September and reaches peaks between June and August, i.e., when in Rome the highest air temperatures and humidity rates are typically measured [44]. Furthermore, although all the years show a comparable variation, 2018 was an unfavorable year from a thermo-hygrometric point of view and very high day and night MOCI values were recorded in all the months analyzed. On the contrary, the months of May and June 2019 were particularly cold and resulted in MOCI values often below −0.5 in all the stations.
During the day, the threshold value of 0.5 is more frequently exceeded at Bon, followed by TV and Cav. CdG is the station that records the least number of exceedances, which only sporadically in 2017, 2020, and 2021, and reaches average daily values of about 0.6. Otherwise, at night, the MOCI values are always below 0.25 and, although the highest values are measured at the Bon urban station, the discomfort threshold is never exceeded.
The analysis of the time series shows a clear correlation between the MOCI values and the degree of urbanization of the analyzed sites. In fact, the worst conditions of thermal comfort are recorded at the Bon station, i.e., in the station located in downtown Rome, in a highly urbanized environment. On the contrary, moving away from the urban center, well-being conditions improve, and the best thermal conditions are reached in rural areas where, even on hot summer days, the MOCI levels do not exceed the 0.5 threshold.

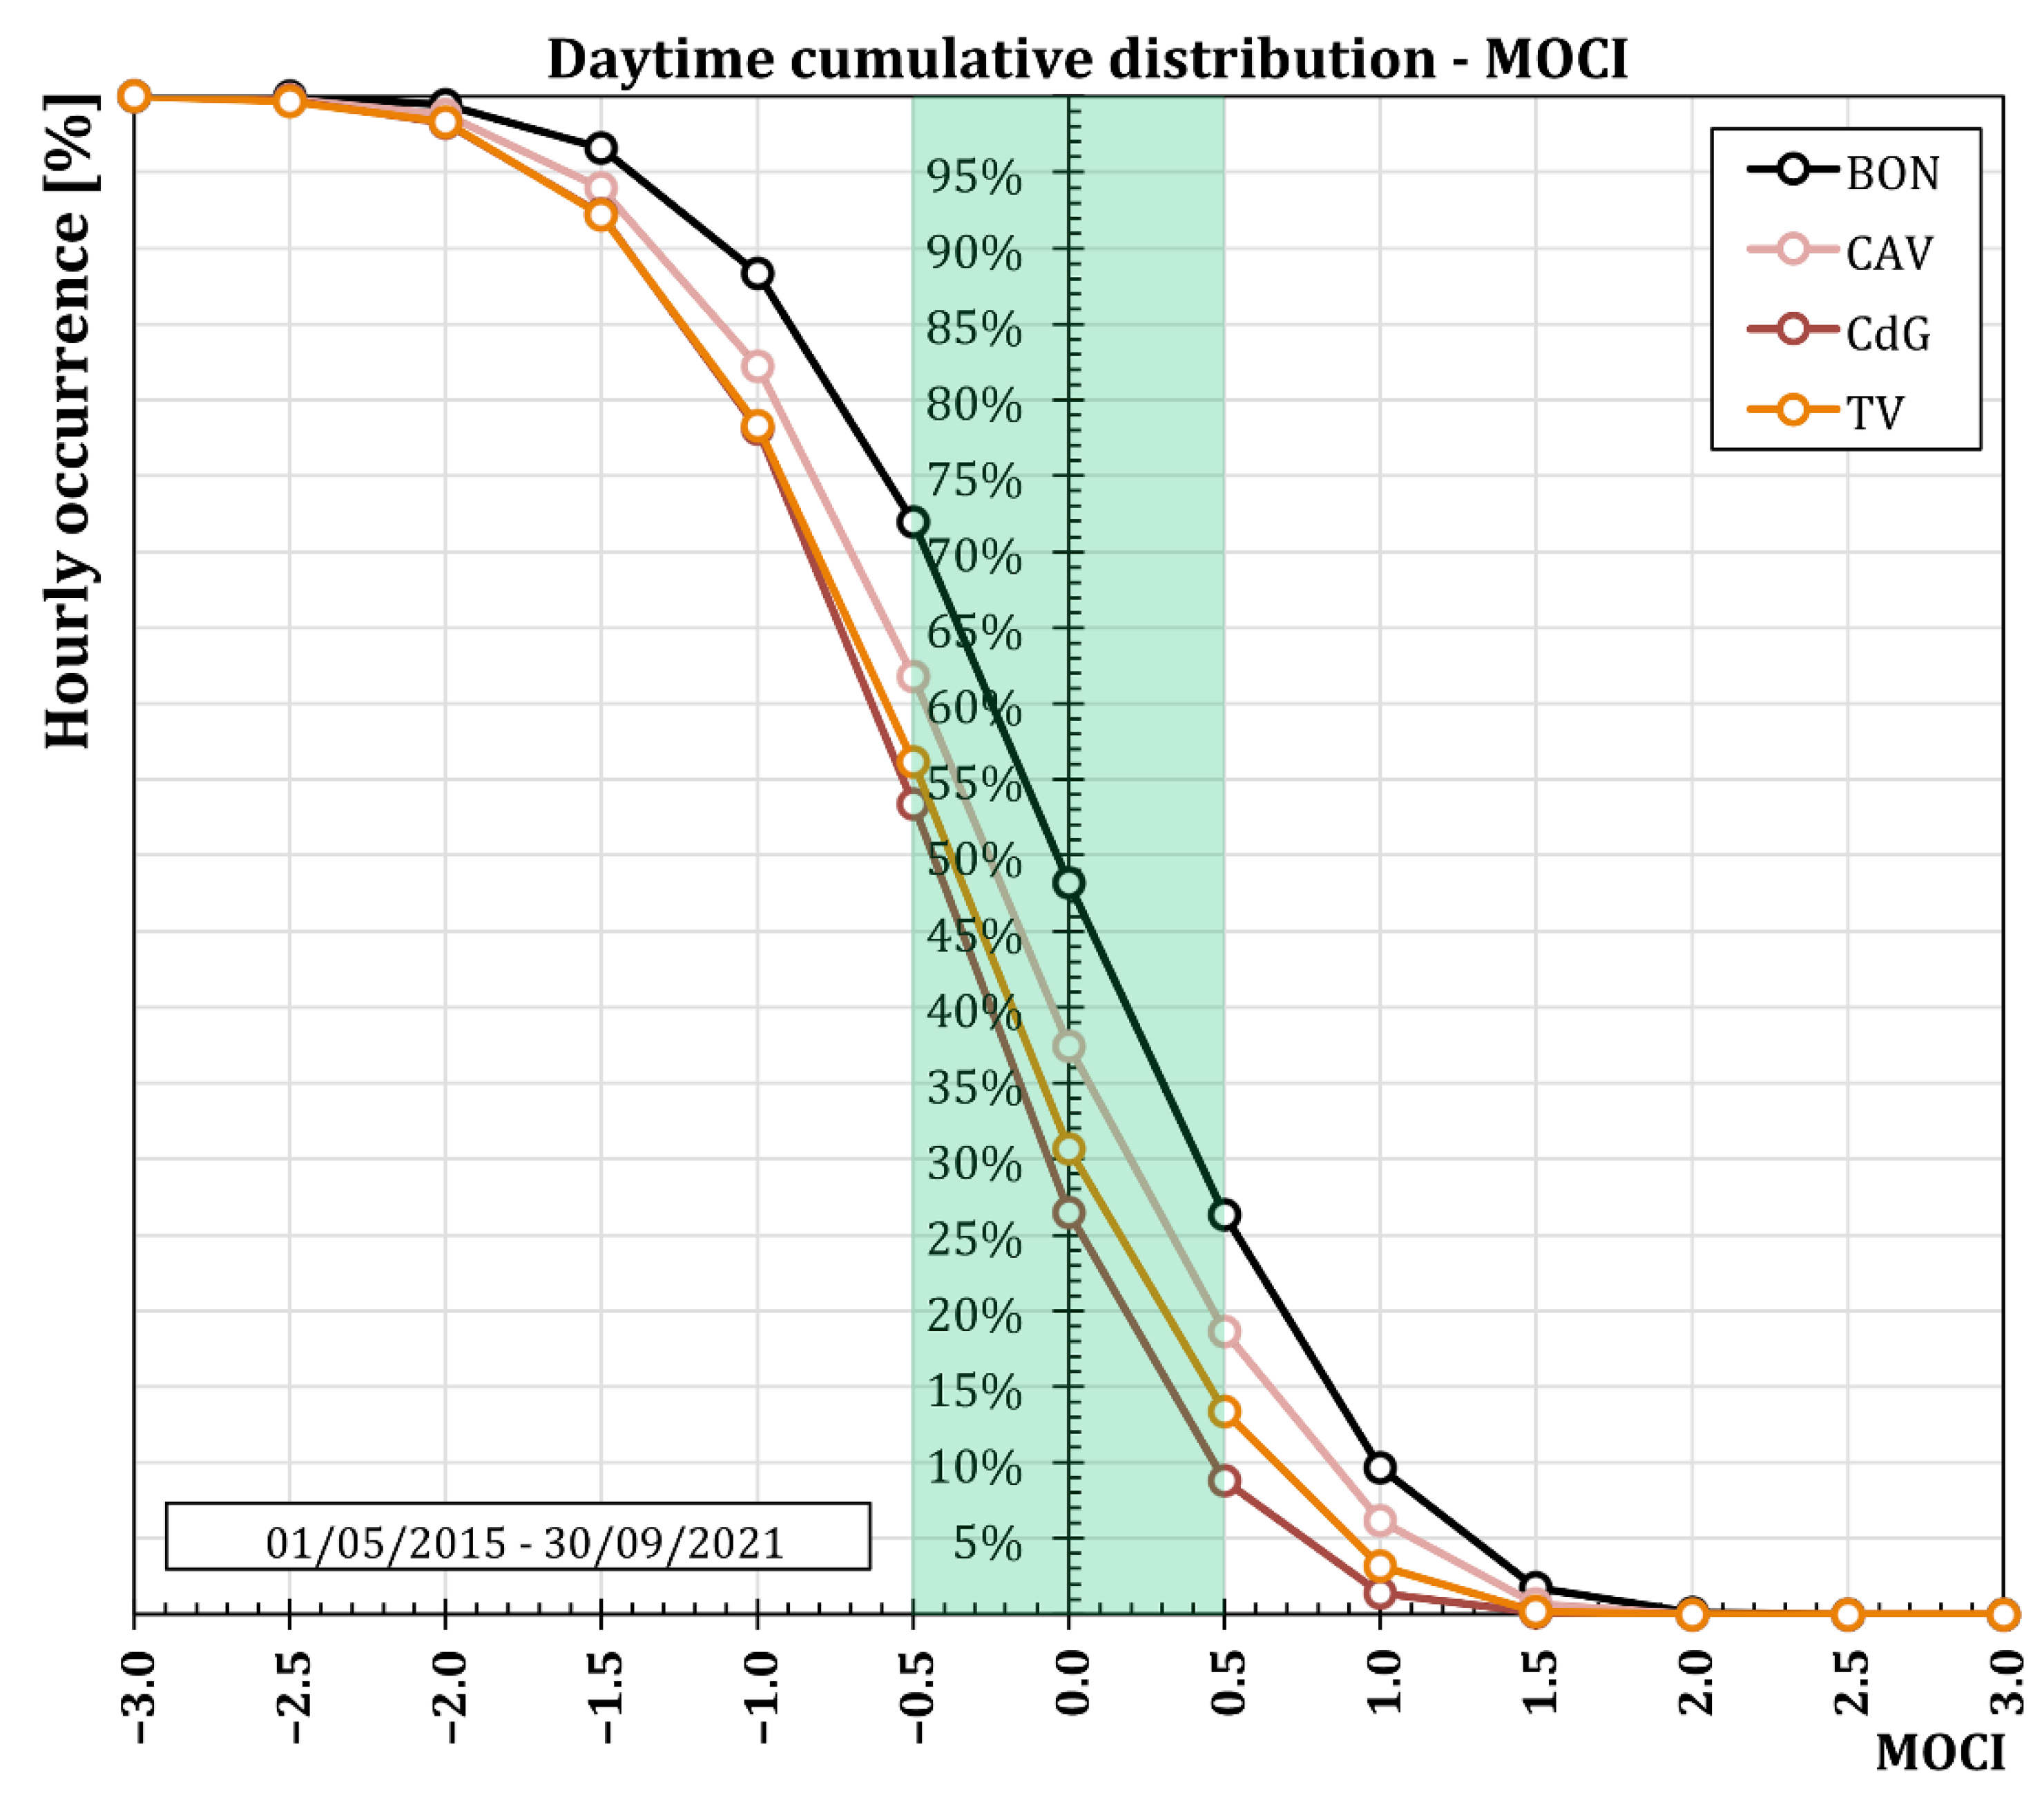
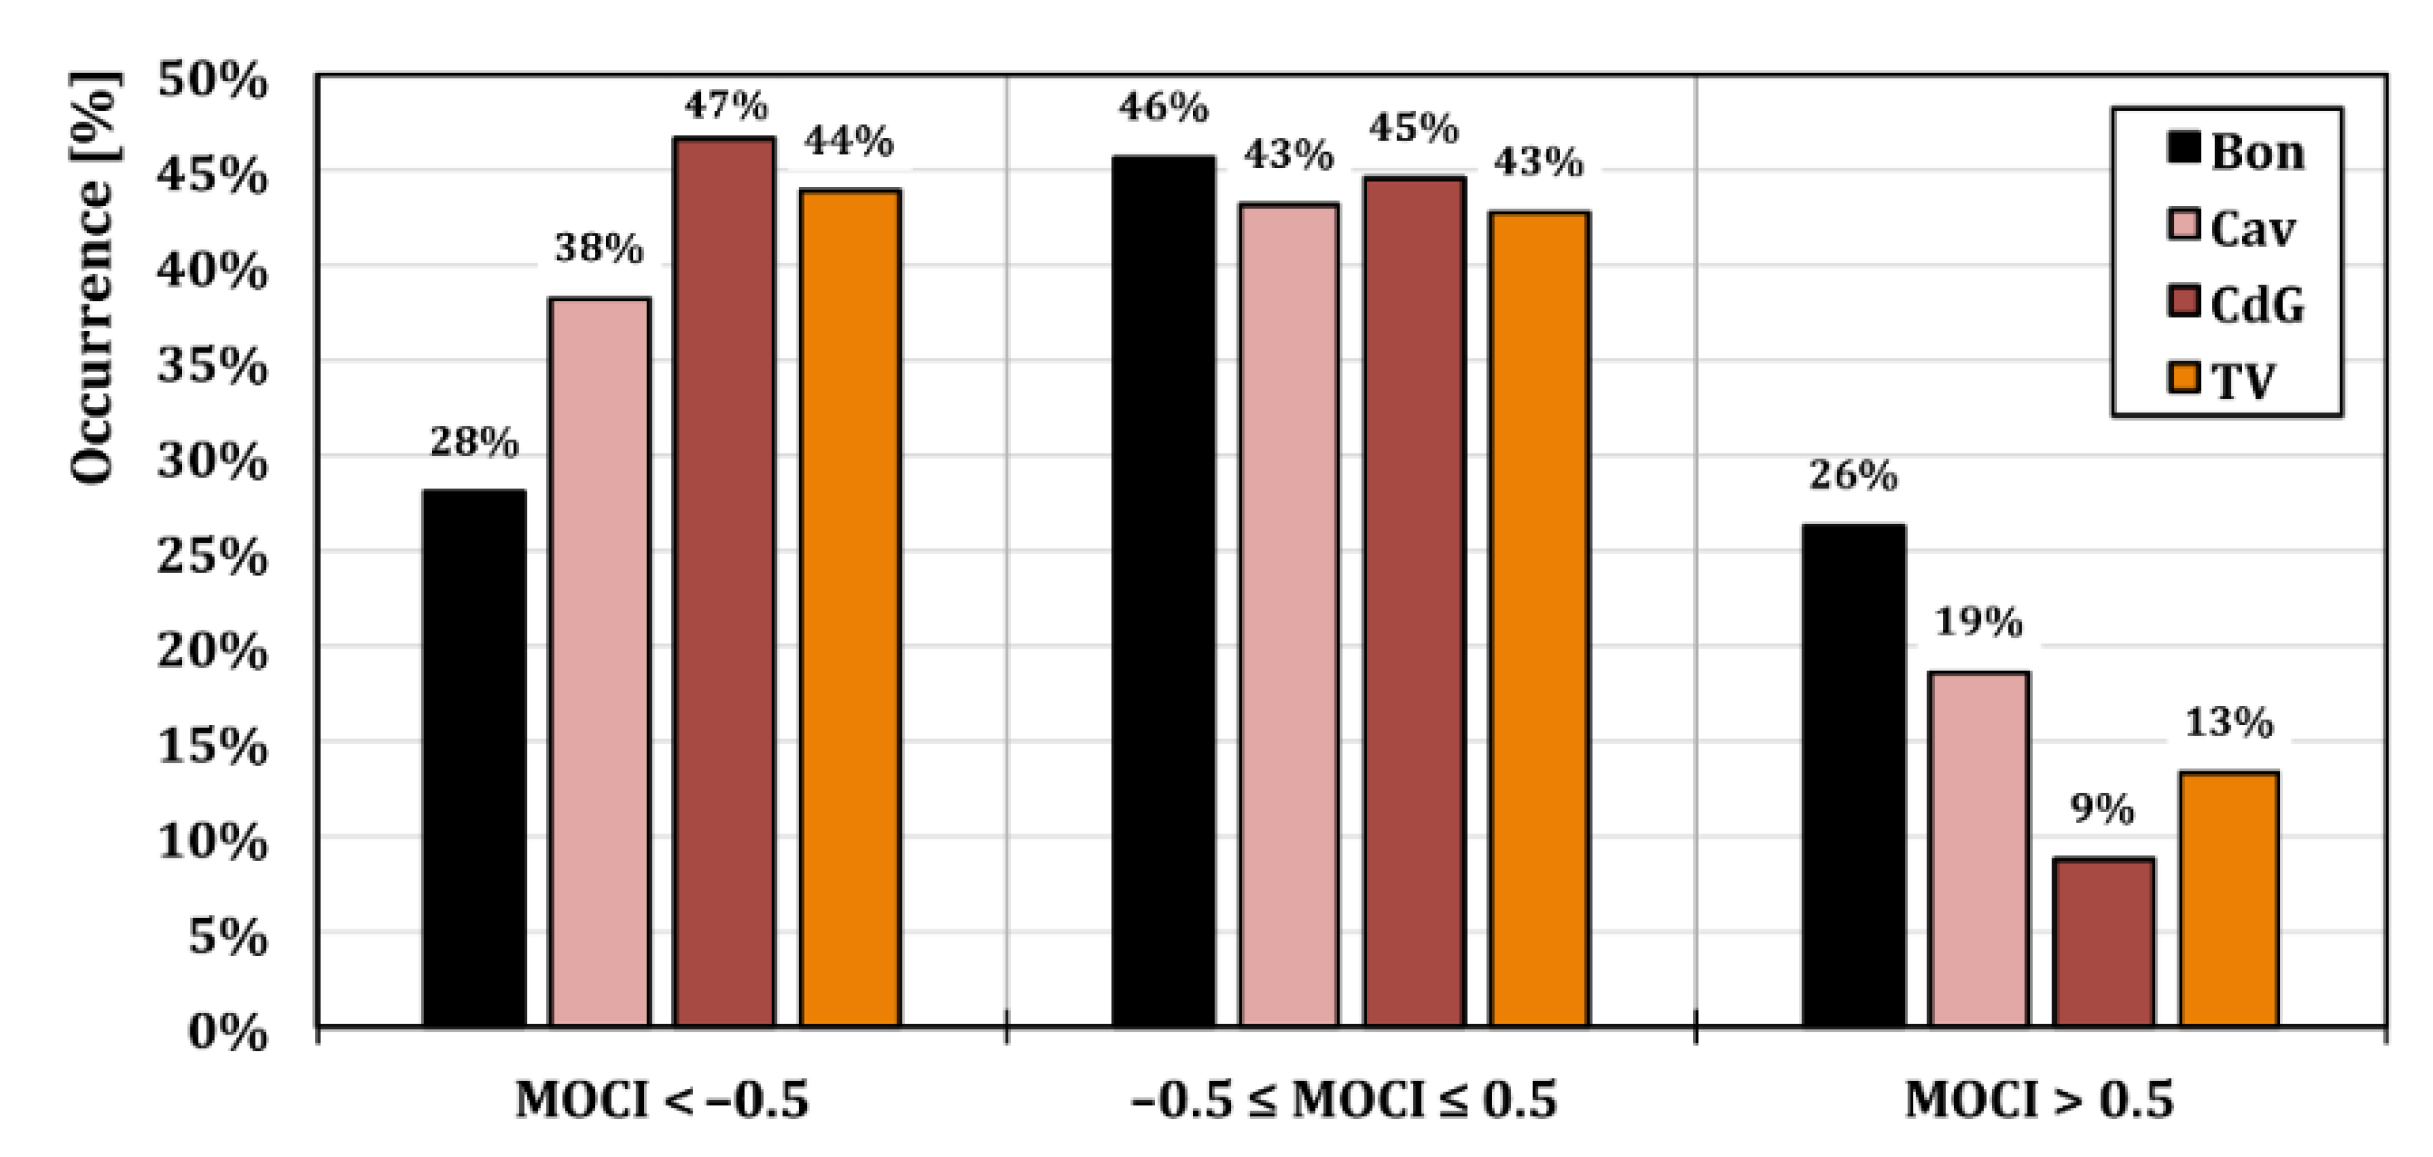
3.2. Hourly-Averaged MOCI Index

Figure 4 and Figure 5 show the MOCI frequencies using the daytime and nighttime hourly values for each station, yearly-aggregated over the period 2015–2021.
The results suggest that, during the day, Bon is the only station for which MOCI > 1.5 is reached and 2018 and 2021 were the hottest years. In general, during both day and night, the urban station has the highest discomfort due to overheating. The average conditions of well-being improve when leaving the city center and are comparable at Cav and TV. Specifically, during the daytime, at Cav MOCI is always greater than −2.0 and, compared to other extra-urban stations, a higher percentage of cases with MOCI > 0.5 can be identified. The daytime time series shows that 2018 was the year of greatest overheating in both urban and rural environments. In particular, in 2018 at Bon only a very small percentage of MOCI data (about 7%) is under −0.5 with a negligible percentage of data under −1 (less than 1%), whereas records in the discomfort range (MOCI > 0.5) represent a percentage of almost 44%. Moreover, only in 2018 and 2021 the percentage of MOCI > 1.5 reaches a few percentage points, that is 6.3% and 4.2% in 2018 and 2021, respectively. At the other stations no such high values of MOCI are recorded in these two years. On the contrary, 2016 and 2019 are characterized by greater daytime cooling. Indeed, only in 2016 and 2019 in non-urban stations MOCI reaches values lower than −2 in more than 2% of data. In 2019, Bon also recorded 45 occurrences in such a range, equal to about 2.2%.
Overnight, MOCI is below 0.5 at all the stations selected except for nine occurrences recorded at Bon. It is, therefore, important to underline that, despite the phenomenon of the urban heat island, the conditions of thermo-hygrometric comfort at night are acceptable for the citizens. Furthermore, the greater extension of the “green” bands at Bon compared to the other stations indicates that local overheating (cause of daytime thermal discomfort) can be instead associated with nighttime thermal comfort. In other words, in most years well-being records are over 30% at Bon, whereas in other stations they rarely reach 20%. The year of 2018 is confirmed to be the hottest year among those analyzed. At the Bon station this implies that the MOCI data are divided almost equally between the well-being range (−0.5 < MOCI < 0.5) and the cold range (MOCI < −0.5). In non-urban stations, on the other hand, the percentage of data in the well-being range does not differ much from that of other years (about 25%); however, data in the −0.5/−1 range are preponderant to the detriment of even lower values.
To facilitate the comparison between the stations and, therefore, to deepen the link between thermal stress and urbanization, the MOCI frequencies discussed above have been summarized in Figure 6 and Figure 7, where the cumulative distributions of the MOCI hourly values are presented, and calculated for the day and night intervals, respectively.
The Bon urban station depicts the greatest day and night thermal discomfort due to overheating, followed by Cav (rural) and TV (semi-urban). The best conditions always occurred at CdG (rural). It is interesting to note that, although Cav and TV correspond to a different degree of urbanization, the cumulative distributions show that the two stations have a very similar behavior for MOCI < −0.5, whereas a greater thermal comfort is experienced at TV compared to Cav. This is attributable to the concomitance of various factors related to the regional orography and the atmospheric circulation. In fact, the TV station, although being on the edge of the city, is located near the Alban Hills and is affected by local circulation, especially during the day when cool wind blows from the hills, lowering the values of MOCI.
During the day, at Bon, the MOCI values exceeded by 1 in 10% of the hourly data analyzed and by 0.5 in 26% of total cases. The level of well-being (MOCI between −0.5 and 0.5) is found in 46% whereas, in the remaining 28%, MOCI is lower than −0.5. The other stations show a similar growth rate in the range −0.5÷0.5 but the percentage of cases with MOCI > 0.5 is 19% for Cav, 13% for TV, and 9% for CdG. During the night, Cav and TV have similar behavior for the whole range of MOCI values, despite the different land use. As observed for the daytime, this could be due to TV’s geographic location, with cool winds from the hills reducing the values of MOCI. Here, the percentage of MOCI data higher than −0.5 is equal to 16.5%, whereas it is equal to 13% for CdG and 35% for Bon, respectively.
Figure 8 and Figure 9 show the occurrences for each hourly data station of MOCI divided into the three main ranges, corresponding to hot sensation (MOCI > 0.5), neutral sensation (−0.5–0.5), and cold sensation (MOCI < −0.5) for daytime and nighttime, respectively. The histograms show that the conditions of daytime heat stress are much worse than those at night, especially in the urban area. Bon shows the worst thermal comfort conditions, with 26% of data exceeding the well-being threshold. The percentage of data characterized by cool conditions is 28%, so the breakdown data divides almost equally between “cold” and “hot” stress. This shows that the conditions in downtown Rome are not prohibitive in terms of thermal stress despite the presence of the urban heat island. The urban heat island effect, which, as is well-known, involves an increase in temperature in urbanized areas with respect to the rural surroundings, is more evident during nighttime. Rural stations (Cav and CdG) present a very different amount of exceedances of the well-being threshold, with a value more than double for Cav (19%) compared to CdG (9%). In particular, Cav has a number of surpluses even greater than those at TV (13%), and 47% of data are below the “cool” threshold (47% CdG and 38% Cav), confirming that the geographical position with respect to the urban area of Rome significantly affects the conditions of thermo-hygrometric well-being. In fact, CdG is located west of Rome near the Tyrrhenian coast, whereas Cav is inland, east of Rome. Finally, the TV station, the only station located in a suburban environment, has a number of data of MOCI < −0.5 and MOCI > 0.5 between those of Cav and CdG.
At night, the effect of urban overheating is very evident in terms of histograms. However, this phenomenon does not affect the well-being in downtown Rome. In fact, the number of exceedances of the well-being threshold is negligible and the occurrences of MOCI in the well-being range are double those in Cav and TV and almost three times those in CdG. The vast majority of MOCI data in non-urban stations (83−87%) is in the cool discomfort range.

4. Conclusions

The city of Rome, capital of Italy, is located near the Tyrrenian coast in the center of the Mediterranean area. This makes it a very interesting case study for studying the thermo-hygrometric comfort of pedestrians.
This study investigates the influence of land-use on thermo-hygrometric conditions thanks to the application of MOCI in four locations, corresponding to weather stations supplying the quantities used for the calculation of the MOCI. These stations belong to the ARPA Lazio measurement network and are characterized by surroundings with different degrees of urbanization (rural, semi-rural, urban). This allows the investigation of the influence of local microclimatic conditions on the thermo-hygrometric comfort of the pedestrians under the same large-scale forcing. Most of the articles on thermo-hygrometric well-being are based on field campaigns that necessarily have a limited temporal duration. On the contrary, in this work, a 7-year-long time series (from 2015 to 2021) of weather variables acquired by monitoring stations have been examined. Although a climatological analysis is beyond our aim, the availability of a multi-year dataset allows the identification of hot and cold features of some years compared to the others.
Hourly MOCI data have been analyzed in order to determine for each station the occurrences in the three ranges of MOCI levels corresponding to sensations of cold, well-being, and heat during daytime and nighttime. The results show that the urban area of Rome (Bon station) experiences daytime overheating in 26% of daily records, whereas only 0.1% of hot discomfort occurrences are recorded overnight, suggesting satisfactory nocturnal thermo-hygrometric conditions for inhabitants in downtown Rome, despite the urban heat island. In non-urban stations, the diurnal exceedances of the MOCI well-being threshold are between 9% (CdG) and 19% (Cav), whereas, during the night, discomfort due to overheating is never reached. The outcomes suggest that the degree of urbanization plays a key role in determining the level of thermal stress. At the same time, the local environmental conditions are not sufficient to carry out a comprehensive characterization, as the orography and the atmospheric circulation can significantly affect the thermo-hygrometric well-being. In fact, although it is clear that thermal discomfort is much greater in heavily built-up districts than in green, rural areas, in zones with a low degree of urbanization and scattered building fabric, concomitant factors must be taken into account. Based on these observations, this work can be considered as a first approach that will be deepened in further studies focusing on the investigation of the atmospheric circulation (e.g., presence of the sea/land breeze regime), the time evolution of the building density, and the orography, suggesting food for thought to policy-makers and urban planners in its usefulness for choosing the best climate change mitigation/adaptation strategies suited to the peculiarities of the area under investigation.

Author Contributions

Conceptualization, S.F., A.D.B. and F.S.; methodology, S.F., A.D.B. and F.S.; data curation, S.F. and G.C.; writing—original draft preparation, A.D.B. and S.F.; writing—review and editing, S.F., A.D.B., V.C., G.C. and F.S.; visualization, V.C.; supervision, S.F. and F.S. All authors have read and agreed to the published version of the manuscript.

Funding

Serena Falasca was funded by MUR (Ministero dell’Università e della Ricerca) under PON “Ricerca e Innovazione” 2014–2020 (D.M. 1062/2021).

Institutional Review Board Statement

Not applicable.

Informed Consent Statement

Not applicable.

Data Availability Statement

Weather data analyzed in this study are available free of charge on the ARPA web page (https://www.arpalazio.it/rete-micro-meteorologica, last accessed on 27 July 2022).

Acknowledgments

The authors gratefully acknowledge ARPA Lazio for providing weather measurements.

Conflicts of Interest

The authors declare no conflict of interest. The funder had no role in the design of the study; in the collection, analyses, or interpretation of data; in the writing of the manuscript, or in the decision to publish the results.

References

  1. United Nations Department of Economic and Social Affairs. Population Division World Urbanization Prospects: The 2018 Revision; United Nations: New York, NY, USA, 2019; ISBN 9789211483192. [Google Scholar]
  2. Lin, B.; Zhu, J. Changes in Urban Air Quality during Urbanization in China. J. Clean. Prod. 2018, 188, 312–321. [Google Scholar] [CrossRef]
  3. Luo, M.; Lau, N. Increasing Human-Perceived Heat Stress Risks Exacerbated by Urbanization in China: A Comparative Study Based on Multiple Metrics. Earth’s Future 2021, 9, e2020EF001848. [Google Scholar] [CrossRef]
  4. American Society of Heating, Refrigerating and Air-Conditioning Engineers. 2009 ASHRAE Handbook: Fundamentals; American Society of Heating, Refrigeration and Air-Conditioning Engineers: Atlanta, GA, USA, 2009. [Google Scholar]
  5. Manavvi, S.; Rajasekar, E. Semantics of Outdoor Thermal Comfort in Religious Squares of Composite Climate: New Delhi, India. Int. J. Biometeorol. 2020, 64, 253–264. [Google Scholar] [CrossRef]
  6. Fang, Z.; Lin, Z.; Mak, C.M.; Niu, J.; Tse, K.-T. Investigation into Sensitivities of Factors in Outdoor Thermal Comfort Indices. Build. Environ. 2018, 128, 129–142. [Google Scholar] [CrossRef]
  7. Silva, T.J.V.; Hirashima, S.Q.S. Predicting Urban Thermal Comfort from Calibrated UTCI Assessment Scale—A Case Study in Belo Horizonte City, Southeastern Brazil. Urban Clim. 2021, 36, 100652. [Google Scholar] [CrossRef]
  8. Ng, E.; Cheng, V. Urban Human Thermal Comfort in Hot and Humid Hong Kong. Energy Build. 2012, 55, 51–65. [Google Scholar] [CrossRef]
  9. Taleghani, M.; Kleerekoper, L.; Tenpierik, M.; van den Dobbelsteen, A. Outdoor Thermal Comfort within Five Different Urban Forms in the Netherlands. Build. Environ. 2015, 83, 65–78. [Google Scholar] [CrossRef]
  10. Mercader-Moyano, P. Sustainable Development and Renovation in Architecture, Urbanism and Engineering; Springer: New York, NY, USA, 2017; ISBN 9783319514413. [Google Scholar]
  11. Nikolopoulou, M.; Lykoudis, S. Thermal Comfort in Outdoor Urban Spaces: Analysis across Different European Countries. Build. Environ. 2006, 41, 1455–1470. [Google Scholar] [CrossRef] [Green Version]
  12. Mirzabeigi, S.; Razkenari, M. Design Optimization of Urban Typologies: A Framework for Evaluating Building Energy Performance and Outdoor Thermal Comfort. Sustain. Cities Soc. 2022, 76, 103515. [Google Scholar] [CrossRef]
  13. Das, M.; Das, A. Exploring the Pattern of Outdoor Thermal Comfort (OTC) in a Tropical Planning Region of Eastern India during Summer. Urban Clim. 2020, 34, 100708. [Google Scholar] [CrossRef]
  14. Jamei, E.; Rajagopalan, P. Urban Development and Pedestrian Thermal Comfort in Melbourne. Sol. Energy 2017, 144, 681–698. [Google Scholar] [CrossRef]
  15. Shahfahad; Naikoo, M.W.; Towfiqul Islam, A.R.M.; Mallick, J.; Rahman, A. Land Use/Land Cover Change and Its Impact on Surface Urban Heat Island and Urban Thermal Comfort in a Metropolitan City. Urban Clim. 2022, 41, 101052. [Google Scholar] [CrossRef]
  16. Van Hove, L.W.A.; Jacobs, C.M.J.; Heusinkveld, B.G.; Elbers, J.A.; van Driel, B.L.; Holtslag, A.A.M. Temporal and Spatial Variability of Urban Heat Island and Thermal Comfort within the Rotterdam Agglomeration. Build. Environ. 2015, 83, 91–103. [Google Scholar] [CrossRef] [Green Version]
  17. Sun, S.; Xu, X.; Lao, Z.; Liu, W.; Li, Z.; Higueras García, E.; He, L.; Zhu, J. Evaluating the Impact of Urban Green Space and Landscape Design Parameters on Thermal Comfort in Hot Summer by Numerical Simulation. Build. Environ. 2017, 123, 277–288. [Google Scholar] [CrossRef]
  18. Falasca, S.; Ciancio, V.; Salata, F.; Golasi, I.; Rosso, F.; Curci, G. High Albedo Materials to Counteract Heat Waves in Cities: An Assessment of Meteorology, Buildings Energy Needs and Pedestrian Thermal Comfort. Build. Environ. 2019, 163, 106242. [Google Scholar] [CrossRef]
  19. Jia, S.; Wang, Y. Effect of Heat Mitigation Strategies on Thermal Environment, Thermal Comfort, and Walkability: A Case Study in Hong Kong. Build. Environ. 2021, 201, 107988. [Google Scholar] [CrossRef]
  20. Ulpiani, G.; Di Giuseppe, E.; Di Perna, C.; D’Orazio, M.; Zinzi, M. Thermal Comfort Improvement in Urban Spaces with Water Spray Systems: Field Measurements and Survey. Build. Environ. 2019, 156, 46–61. [Google Scholar] [CrossRef]
  21. Yang, F.; Lau, S.S.Y.; Qian, F. Thermal Comfort Effects of Urban Design Strategies in High-Rise Urban Environments in a Sub-Tropical Climate. Archit. Sci. Rev. 2011, 54, 285–304. [Google Scholar] [CrossRef]
  22. Jamei, E.; Rajagopalan, P.; Seyedmahmoudian, M.; Jamei, Y. Review on the Impact of Urban Geometry and Pedestrian Level Greening on Outdoor Thermal Comfort. Renew. Sustain. Energy Rev. 2016, 54, 1002–1017. [Google Scholar] [CrossRef]
  23. Lai, D.; Liu, W.; Gan, T.; Liu, K.; Chen, Q. A Review of Mitigating Strategies to Improve the Thermal Environment and Thermal Comfort in Urban Outdoor Spaces. Sci. Total Environ. 2019, 661, 337–353. [Google Scholar] [CrossRef]
  24. Nasrollahi, N.; Ghosouri, A.; Khodakarami, J.; Taleghani, M. Heat-Mitigation Strategies to Improve Pedestrian Thermal Comfort in Urban Environments: A Review. Sustainability 2020, 12, 10000. [Google Scholar] [CrossRef]
  25. Taleghani, M. Outdoor Thermal Comfort by Different Heat Mitigation Strategies—A Review. Renew. Sustain. Energy Rev. 2018, 81, 2011–2018. [Google Scholar] [CrossRef]
  26. Johansson, E.; Thorsson, S.; Emmanuel, R.; Krüger, E. Instruments and Methods in Outdoor Thermal Comfort Studies—The Need for Standardization. Urban Clim. 2014, 10, 346–366. [Google Scholar] [CrossRef] [Green Version]
  27. Ruiz, M.A.; Correa, E.N. Adaptive Model for Outdoor Thermal Comfort Assessment in an Oasis City of Arid Climate. Build. Environ. 2015, 85, 40–51. [Google Scholar] [CrossRef]
  28. Salata, F.; Golasi, I.; de Lieto Vollaro, R.; de Lieto Vollaro, A. Outdoor Thermal Comfort in the Mediterranean Area. A Transversal Study in Rome, Italy. Build. Environ. 2016, 96, 46–61. [Google Scholar] [CrossRef]
  29. Canan, F.; Golasi, I.; Falasca, S.; Salata, F. Outdoor Thermal Perception and Comfort Conditions in the Köppen-Geiger Climate Category BSk. One-Year Field Survey and Measurement Campaign in Konya, Turkey. Sci. Total Environ. 2020, 738, 140295. [Google Scholar] [CrossRef]
  30. Kumar, P.; Sharma, A. Study on Importance, Procedure, and Scope of Outdoor Thermal Comfort—A Review. Sustain. Cities Soc. 2020, 61, 102297. [Google Scholar] [CrossRef]
  31. Ciardini, V.; Caporaso, L.; Sozzi, R.; Petenko, I.; Bolignano, A.; Morelli, M.; Melas, D.; Argentini, S. Interconnections of the Urban Heat Island with the Spatial and Temporal Micrometeorological Variability in Rome. Urban Clim. 2019, 29, 100493. [Google Scholar] [CrossRef]
  32. Morini, E.; Touchaei, A.G.; Rossi, F.; Cotana, F.; Akbari, H. Evaluation of Albedo Enhancement to Mitigate Impacts of Urban Heat Island in Rome (Italy) Using WRF Meteorological Model. Urban Clim. 2018, 24, 551–566. [Google Scholar] [CrossRef]
  33. Di Bernardino, A.; Mazzarella, V.; Pecci, M.; Casasanta, G.; Cacciani, M.; Ferretti, R. Interaction of the sea breeze with the urban area of Rome (Italy): WRF mesoscale and WRF-LES simulations compared to ground-based observations. Bound Layer Meteor 2022. [Google Scholar] [CrossRef]
  34. Salata, F.; Golasi, I.; Petitti, D.; de Lieto Vollaro, E.; Coppi, M.; de Lieto Vollaro, A. Relating Microclimate, Human Thermal Comfort and Health during Heat Waves: An Analysis of Heat Island Mitigation Strategies through a Case Study in an Urban Outdoor Environment. Sustain. Cities Soc. 2017, 30, 79–96. [Google Scholar] [CrossRef]
  35. Martinelli, L.; Lin, T.-P.; Matzarakis, A. Assessment of the Influence of Daily Shadings Pattern on Human Thermal Comfort and Attendance in Rome during Summer Period. Build. Environ. 2015, 92, 30–38. [Google Scholar] [CrossRef]
  36. Salata, F.; Golasi, I.; Proietti, R.; de Lieto Vollaro, A. Implications of Climate and Outdoor Thermal Comfort on Tourism: The Case of Italy. Int. J. Biometeorol. 2017, 61, 2229–2244. [Google Scholar] [CrossRef] [PubMed]
  37. Vasilikou, C.; Nikolopoulou, M. Outdoor Thermal Comfort for Pedestrians in Movement: Thermal Walks in Complex Urban Morphology. Int. J. Biometeorol. 2020, 64, 277–291. [Google Scholar] [CrossRef] [Green Version]
  38. Rosso, F.; Golasi, I.; Castaldo, V.L.; Piselli, C.; Pisello, A.L.; Salata, F.; Ferrero, M.; Cotana, F.; de Lieto Vollaro, A. On the Impact of Innovative Materials on Outdoor Thermal Comfort of Pedestrians in Historical Urban Canyons. Renew. Energy 2018, 118, 825–839. [Google Scholar] [CrossRef]
  39. Petenko, I.; Mastrantonio, G.; Viola, A.; Argentini, S.; Coniglio, L.; Monti, P.; Leuzzi, G. Local Circulation Diurnal Patterns and Their Relationship with Large-Scale Flows in a Coastal Area of the Tyrrhenian Sea. Bound. Layer Meteorol. 2011, 139, 353–366. [Google Scholar] [CrossRef]
  40. Di Bernardino, A.; Iannarelli, A.M.; Casadio, S.; Mevi, G.; Campanelli, M.; Casasanta, G.; Cede, A.; Tiefengraber, M.; Siani, A.M.; Spinei, E.; et al. On the Effect of Sea Breeze Regime on Aerosols and Gases Properties in the Urban Area of Rome, Italy. Urban Clim. 2021, 37, 100842. [Google Scholar] [CrossRef]
  41. Peel, M.C.; Finlayson, B.L.; McMahon, T.A. Updated World Map of the Köppen-Geiger Climate Classification. Hydrol. Earth Syst. Sci. 2007, 11, 1633–1644. [Google Scholar] [CrossRef] [Green Version]
  42. World Meteorological Organization. Guide to Instruments and Methods of Observation, Volume I—Measurement of Meteorological Variables (WMO-No. 8); WMO: New York, NY, USA, 2018. [Google Scholar]
  43. Golasi, I.; Salata, F.; De Lieto Vollaro, E.; Coppi, M.; De Lieto Vollaro, A. Thermal Perception in the Mediterranean Area: Comparing the Mediterranean Outdoor Comfort Index (MOCI) to Other Outdoor Thermal Comfort Indices. Energies 2016, 9, 550. [Google Scholar] [CrossRef] [Green Version]
  44. Di Bernardino, A.; Iannarelli, A.M.; Diémoz, H.; Casadio, S.; Cacciani, M.; Siani, A.M. Analysis of Two-Decade Meteorological and Air Quality Trends in Rome (Italy). Theor. Appl. Climatol. 2022, 149, 291–307. [Google Scholar] [CrossRef]
Figure 1. Map of the region of interest for this study with indication of the surface micrometeorological stations. The enlargements show the urban texture of the areas surrounding the stations.
Urbansci 06 00051 g001
Figure 2. Time series of daily-averaged diurnal (from 06:00 to 19:00 LT) MOCI index for the four ARPA stations.
Urbansci 06 00051 g002
Figure 3. Time series of daily-averaged nocturnal (from 20:00 to 05:00 LT) MOCI index for the four ARPA stations.
Urbansci 06 00051 g003
Figure 4. MOCI frequencies for the four ARPA stations. The frequencies are calculated using diurnal (from 06:00 to 19:00 LT) hourly data and are presented in yearly units.
Urbansci 06 00051 g004
Figure 5. MOCI frequencies for the four ARPA stations. The frequencies are calculated using nocturnal (from 20:00 to 05:00 LT) hourly data and are presented in yearly units.
Urbansci 06 00051 g005
Figure 6. Cumulative distribution of average diurnal (from 06:00 to 19:00 LT) MOCI index for the four ARPA stations.
Urbansci 06 00051 g006
Figure 7. Cumulative distribution of average nocturnal (from 20:00 to 05:00 LT) MOCI index for the four ARPA stations.
Urbansci 06 00051 g007
Figure 8. Occurrence of the main MOCI ranges for the four ARPA stations. Occurrences are calculated using diurnal (from 06:00 to 19:00 LT) hourly data.
Urbansci 06 00051 g008
Figure 9. Occurrence of the main MOCI ranges for the four ARPA stations. Occurrences are calculated using nocturnal (from 20:00 to 05:00 LT) hourly data.
Urbansci 06 00051 g009
Table 1. Characteristics of the micrometeorological stations belonging to ARPA Lazio network used in the present study.
StationStation IDLatitude (°)Longitude (°)Altitude (m a.s.l.)Land Use
BoncompagniBon41.9112.5072Urban
Tor VergataTV41.8412.64104Semi-rural
CavaliereCav41.9312.6657Rural
Castel di GuidoCdG41.8912.2761Rural
Publisher’s Note: MDPI stays neutral with regard to jurisdictional claims in published maps and institutional affiliations.

