1. Introduction
Bridges and infrastructure networks play an essential role in economic growth and development. However, in Europe and North America, most existing bridges were built prior to the 1970s and according to codes and regulations that are now outdated, making structural assessment of these structures necessary and in some cases urgent. Deterioration of materials and higher traffic loads are often perceived as the primary causes of failure for bridges; however, according to different studies [
1,
2,
3], collapse due to hydraulic reasons (e.g., scour, debris accumulation, and lift) is the actual main cause. Hence, the development of structural assessment procedures related to hydraulic action is of primary importance to perform a complete safety evaluation of river bridges.
In practice, hydraulic and structural evaluations of existing bridges are performed independently, and the outcomes of each assessment often remain separate. This limit is generally overcome only for scouring. Considerable research has been devoted to understanding scour [
4] and its effects on structures [
5,
6]. There is even a standard procedure for estimating scour at bridge foundations [
7] or performing structural verification combining usual loads and different extreme events [
8]. On the other hand, the effects of hydrodynamic loads on structures have been studied much less.
During a high-stage hydraulic event, a bridge can be partially or entirely submerged, and the river flow exerts extreme horizontal pressure on the bridge deck [
9]. Most studies regarding deck–river interaction deal with coastal bridges, estimating loads from tsunami waves or hurricanes [
10,
11]. However, in Italy, the main issue related to deck–river interaction is the intensification of hydrodynamic loads created by debris accumulation. The debris, namely, floating or submerged materials (e.g., logs and/or vegetation) transported by river flow can occlude the bridge spans, increasing the loads up to an order of magnitude greater than hydrodynamic conditions alone [
12,
13]. Both the Eurocode (EN 1991-1-6) [
14] and the US Federal Highway Administration [
9] provide relationships to estimate the horizontal force exerted by the river flow on the deck; nevertheless, there still a need to evaluate the effects of these actions from the structural safety standpoint.
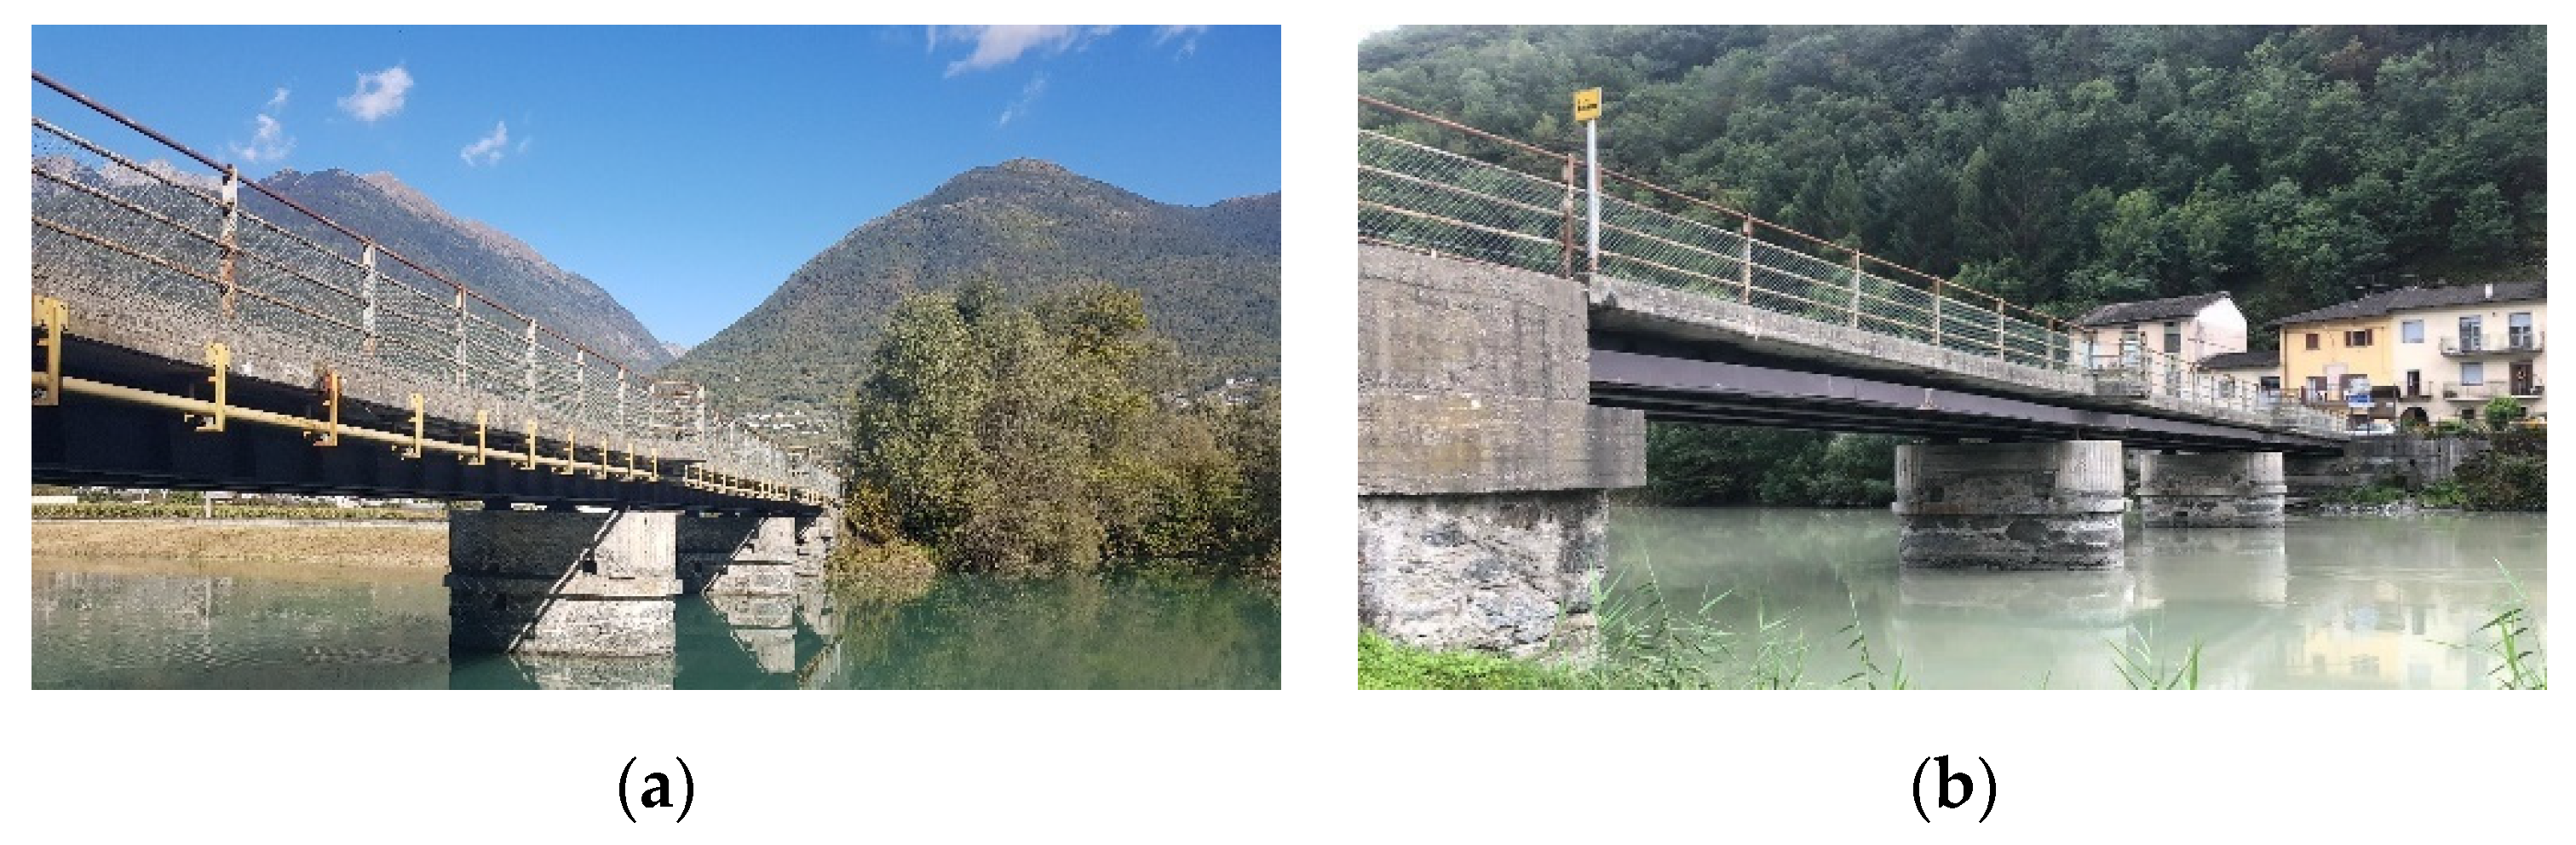
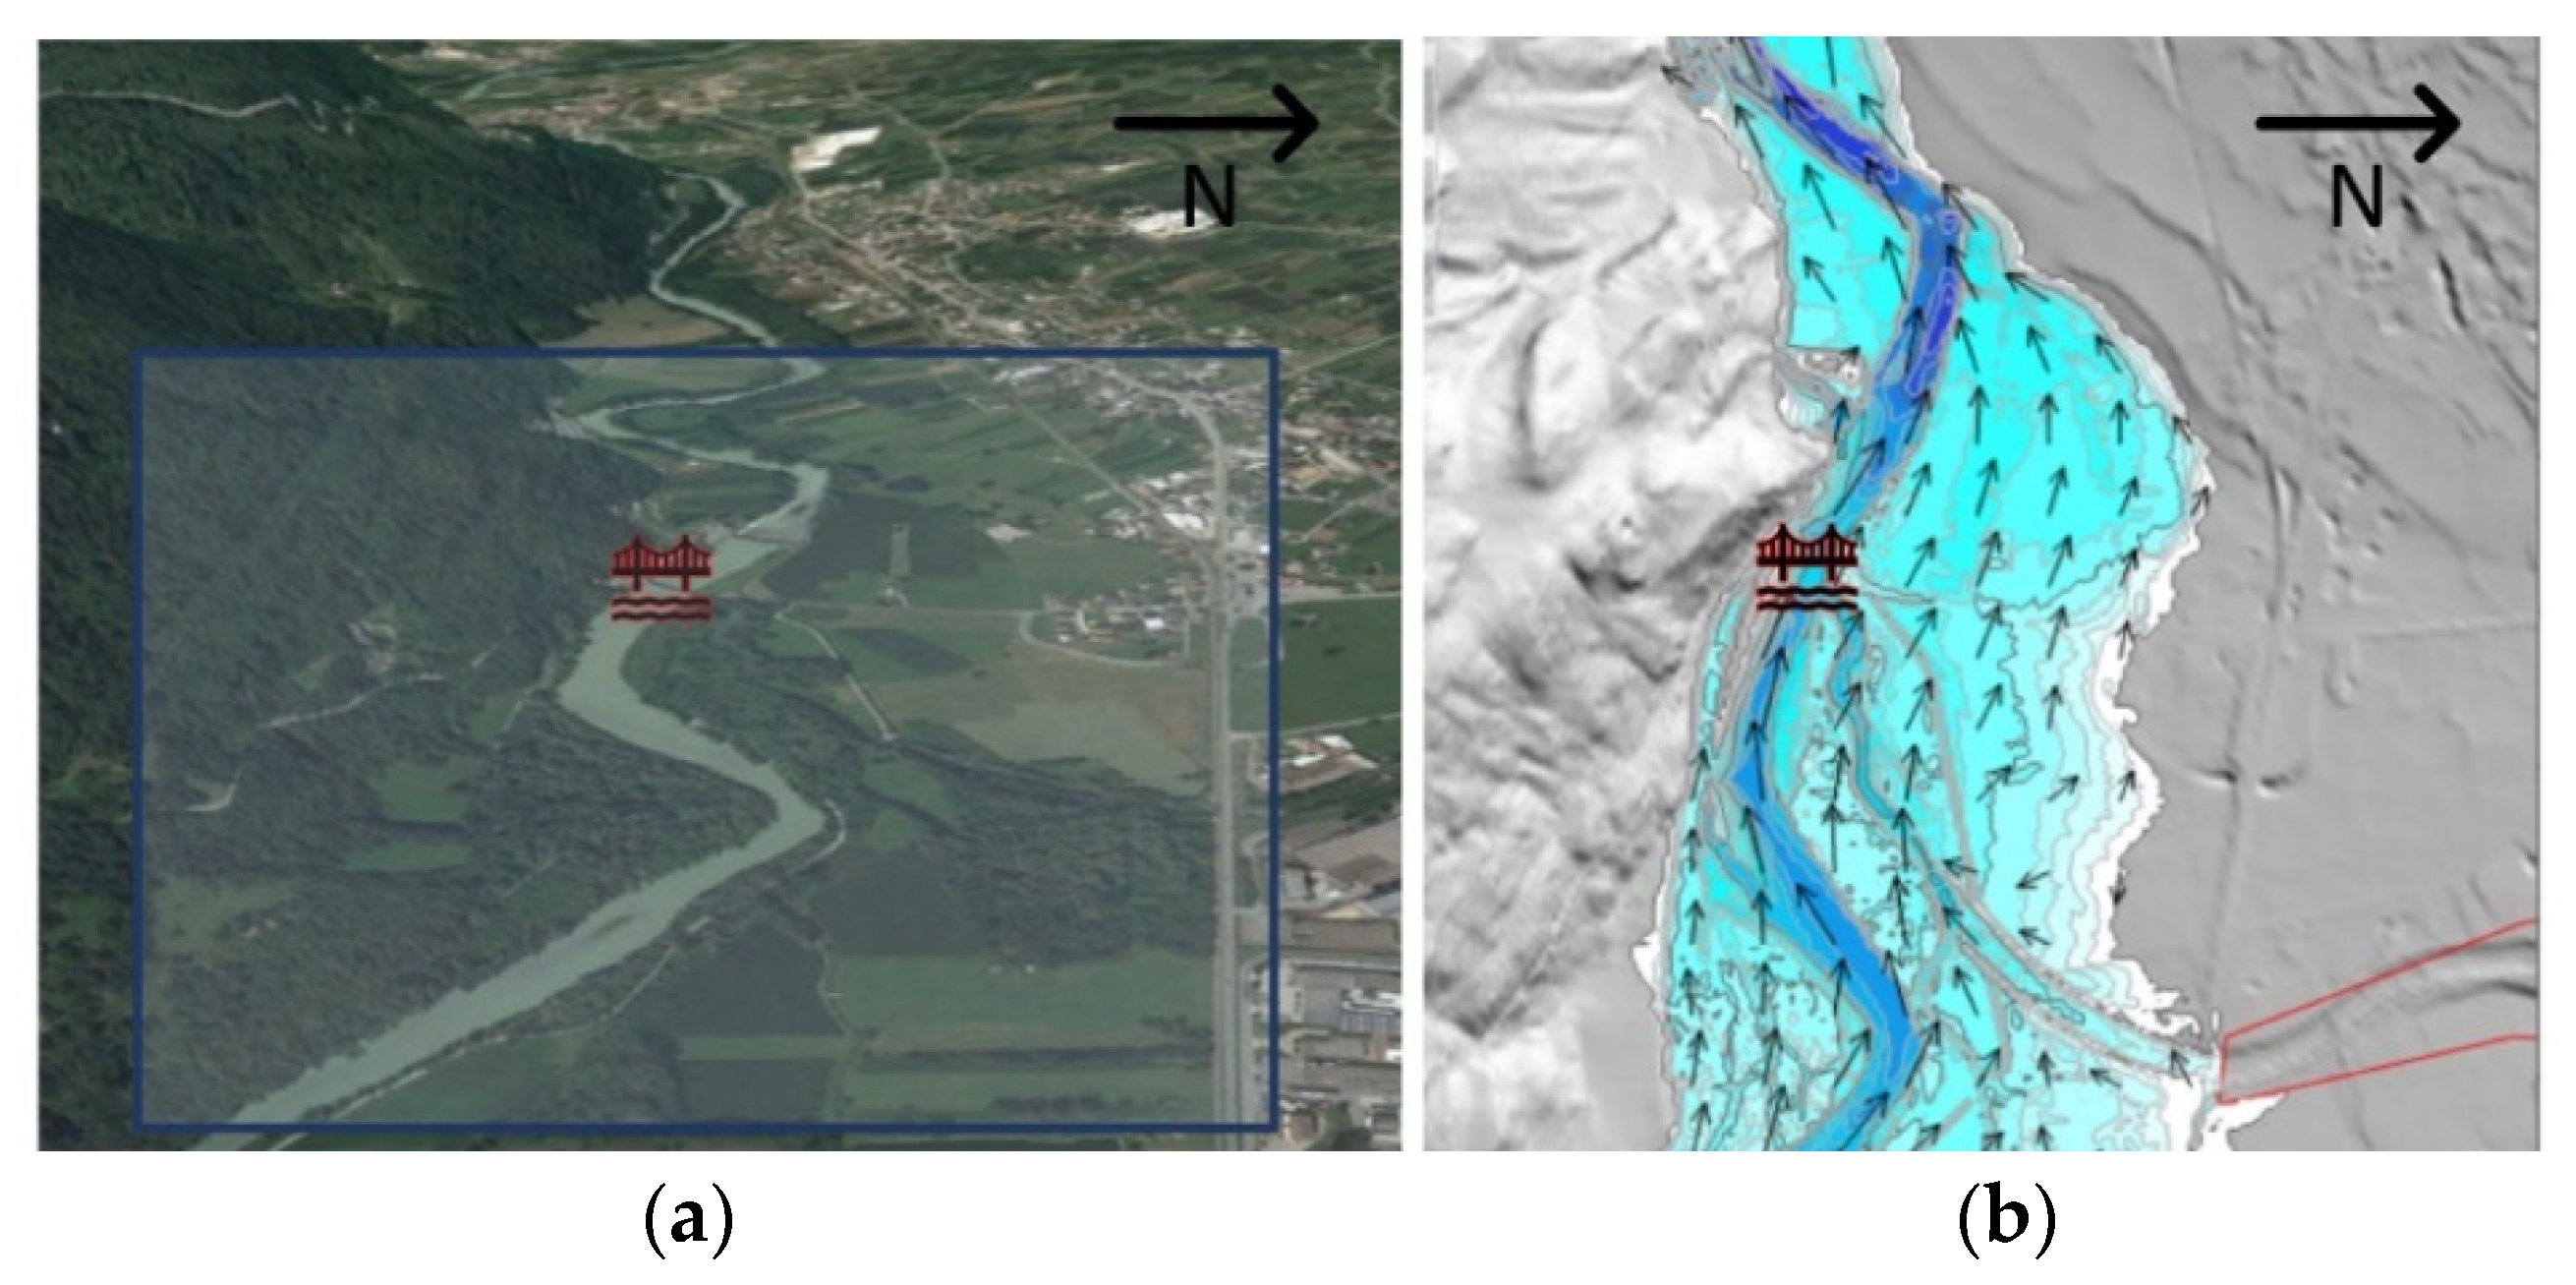
The objective of the present research is to propose a multidisciplinary approach that integrates hydraulic and structural investigations of bridges with traditional mechanical bearings. The proposed approach involves the following steps: (i) on-site inspections and document research; (ii) hydraulic investigations; (iii) simplified evaluation of structural safety to hydraulic action; (iv) dynamic testing and FE modelling; (v) repeated dynamic testing to assess the state of preservation of the structure. The approach is applied on a 50-year-old river bridge on the Adda River in north Italy: the Baghetto Bridge [
15] (
Figure 1).
The Baghetto Bridge, built in 1966 on 19th-century masonry piers, is composed of three steel–concrete composite girders, two (reinforced) masonry piers, pile foundations, and traditional mechanical bearings. Firstly, document research provided the original blueprints and construction details of the bearing system. On-site inspections confirmed the geometric information of the original blueprints. Secondly, hydraulic analysis estimated the actions that the river flow exerts on the structure during a hydraulic event. From the estimated hydrodynamic loads, simplified structural verifications were performed considering slab lift and anchor bolt drag. In this context, a coefficient—called hydraulic safety factor (HSF)—was defined, describing the safety margin during different hydraulic scenarios. It is worth mentioning that the HSF is herein proposed to summarize the structural verifications in a single coefficient.
Subsequently, dynamic tests in operational conditions were performed to evaluate 82 the modal parameters of the structure and a FE model was developed and validated using 83 the identified modal parameters. At last, dynamic tests were repeated every four months 84 to investigate the environmental effects on modal parameters. As expected [
16,
17], 85 remarkable variations on natural frequencies were identified while the mode shapes show 86 an almost stable behavior. Depending on the season in which experimental tests were 87 performed, frequency variations up to 14% were recorded.
The paper is mainly divided into two parts: hydraulic-structural analysis and dynamic investigations.
Section 1—the introduction—illustrates the context of the research and summarizes the proposed approach.
Section 2 is dedicated to the description of the investigated structure, the inspections, and the document research.
Section 3 is dedicated to the hydraulic investigations, namely defining the hydraulic scenarios and estimating hydraulic loads. Structural verifications and the HSF are outlined in
Section 4.
Section 5 presents the dynamic inspections and FE modelling and updating, while
Section 6 presents the results of repeated dynamic tests. In conclusion, the present paper shows a multidisciplinary approach that can be applied for structural verification and control of river bridges with traditional mechanical bearings.
2. The Baghetto Bridge: Description and Document Research
The Baghetto Bridge (
Figure 1) is a three-span, steel–concrete composite bridge built in 1966 over the Adda River. It carries the route SP23 between the municipalities of Chiuro and Castello dell’Acqua, about 10 km from the city of Sondrio, in the north part of Lombardy, Italy. The structure—along with other bridges [
18,
19]—has been investigated as part of joint research between the Lombardy Region and Politecnico di Milano aimed at defining guidelines for monitoring key infrastructure.
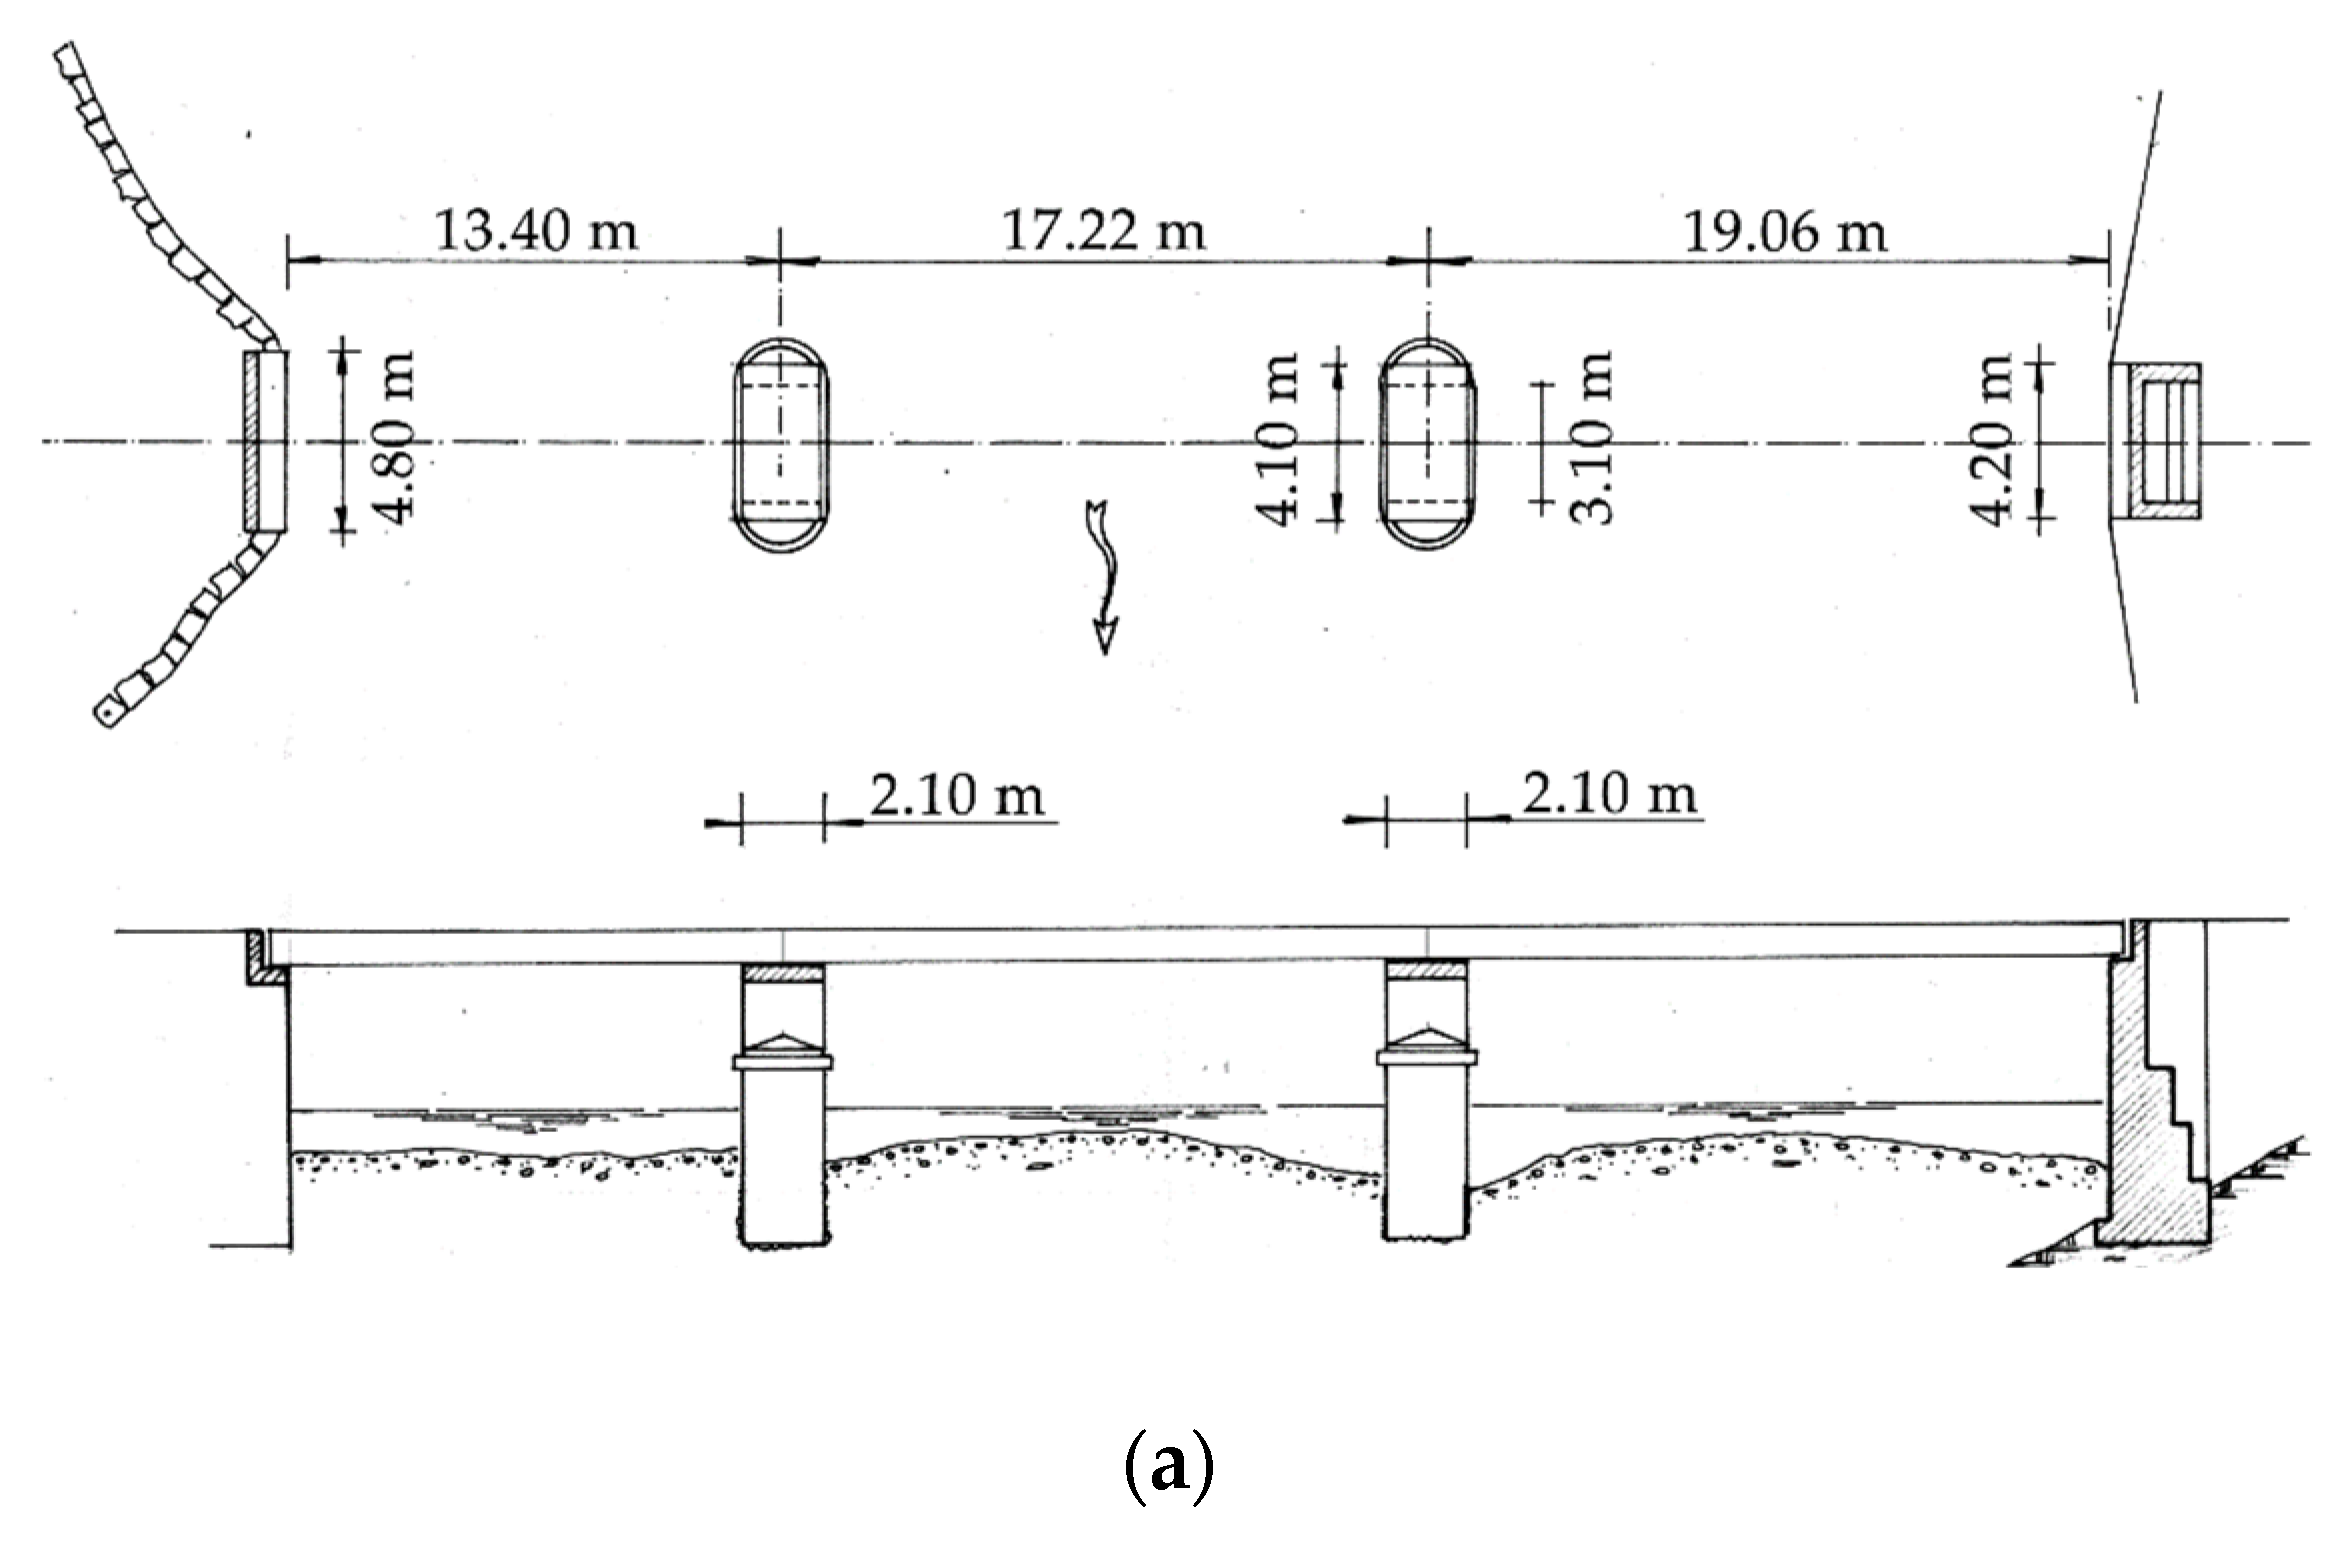
The structure is approximately 50 m long and is composed of three simply supported girders. The steel–concrete composite girders have different lengths, 19.06 m, 17.22 m, and 13.40 m, and have a free span (i.e., the distances between the supports) equal to 18.76 m, 16.62 m, and 13.10 m, respectively. The carriageway is 4.5 m wide, providing an alternating one-lane. The piers and one abutment are in roughly cut stone masonry with concrete strengthening in the upper part, while the other abutment is reinforced concrete. Regarding the geometry, piers and abutments have a height—starting from the foundation level—of about 7 m. The piers have an approximately rectangular section (2.30 m × 5.50 m) with rounded edges. The longitudinal and plan views of the bridge are shown in
Figure 2a.
The metallic part of the cross-section consists of three identical steel I-girders spaced at 1.5 m and connected by intermediate cross-bracings (double-channel sections) and diagonals (angular sections). The upper part of the cross-section consists of a reinforced concrete slab with a height of 0.18 m. The detailed dimensions of the cross-section are shown in
Figure 2b. According to [
20], the connection between the concrete slab and the steel beam are obtained by welded stud connectors (
Figure 2b). Regarding the layout of the metallic bearing supports, they restrain transverse and longitudinal displacement on one side of each span while allowing longitudinal translation on the opposite side (flat-sided roller-bearing typology); their detailed description will be given in
Section 4.
As specified by the Italian code on existing structures [
21] and guidelines on evaluation of bridges [
22], the history and original blueprints of the investigated bridge are of the utmost importance to perform an accurate structural analysis. Consequently, the first stage of the analysis was document research in the archives of the Province of Sondrio. Document research revealed the presence of the original design documents in the archives of the local authority responsible for route maintenance. As stated in the design report [
20], the investigated bridge was built in 1966 to replace an older timber structure. The older bridge was designed in 1877 by Francesco Polatti and built by the “Stabilimento Nazionale di Costruzioni in ferro Pietro Bizzarini” [
20]. The project of the new bridge involved substituting the deck with the aforementioned steel–concrete composite structure, constructing a new abutment in reinforced concrete, and strengthening the existing piers and abutment, mainly involving the use of inclined and vertical micro-piles for the foundations. In summary, the bridge underwent different phases of maintenance and reconstruction work:
1877—Construction of the original timber bridge;
1966—Erection of the present I-girder bridge and strengthening of stone masonry piers and abutments;
2016—Maintenance of the steel girders with sandblasting and powder coating.
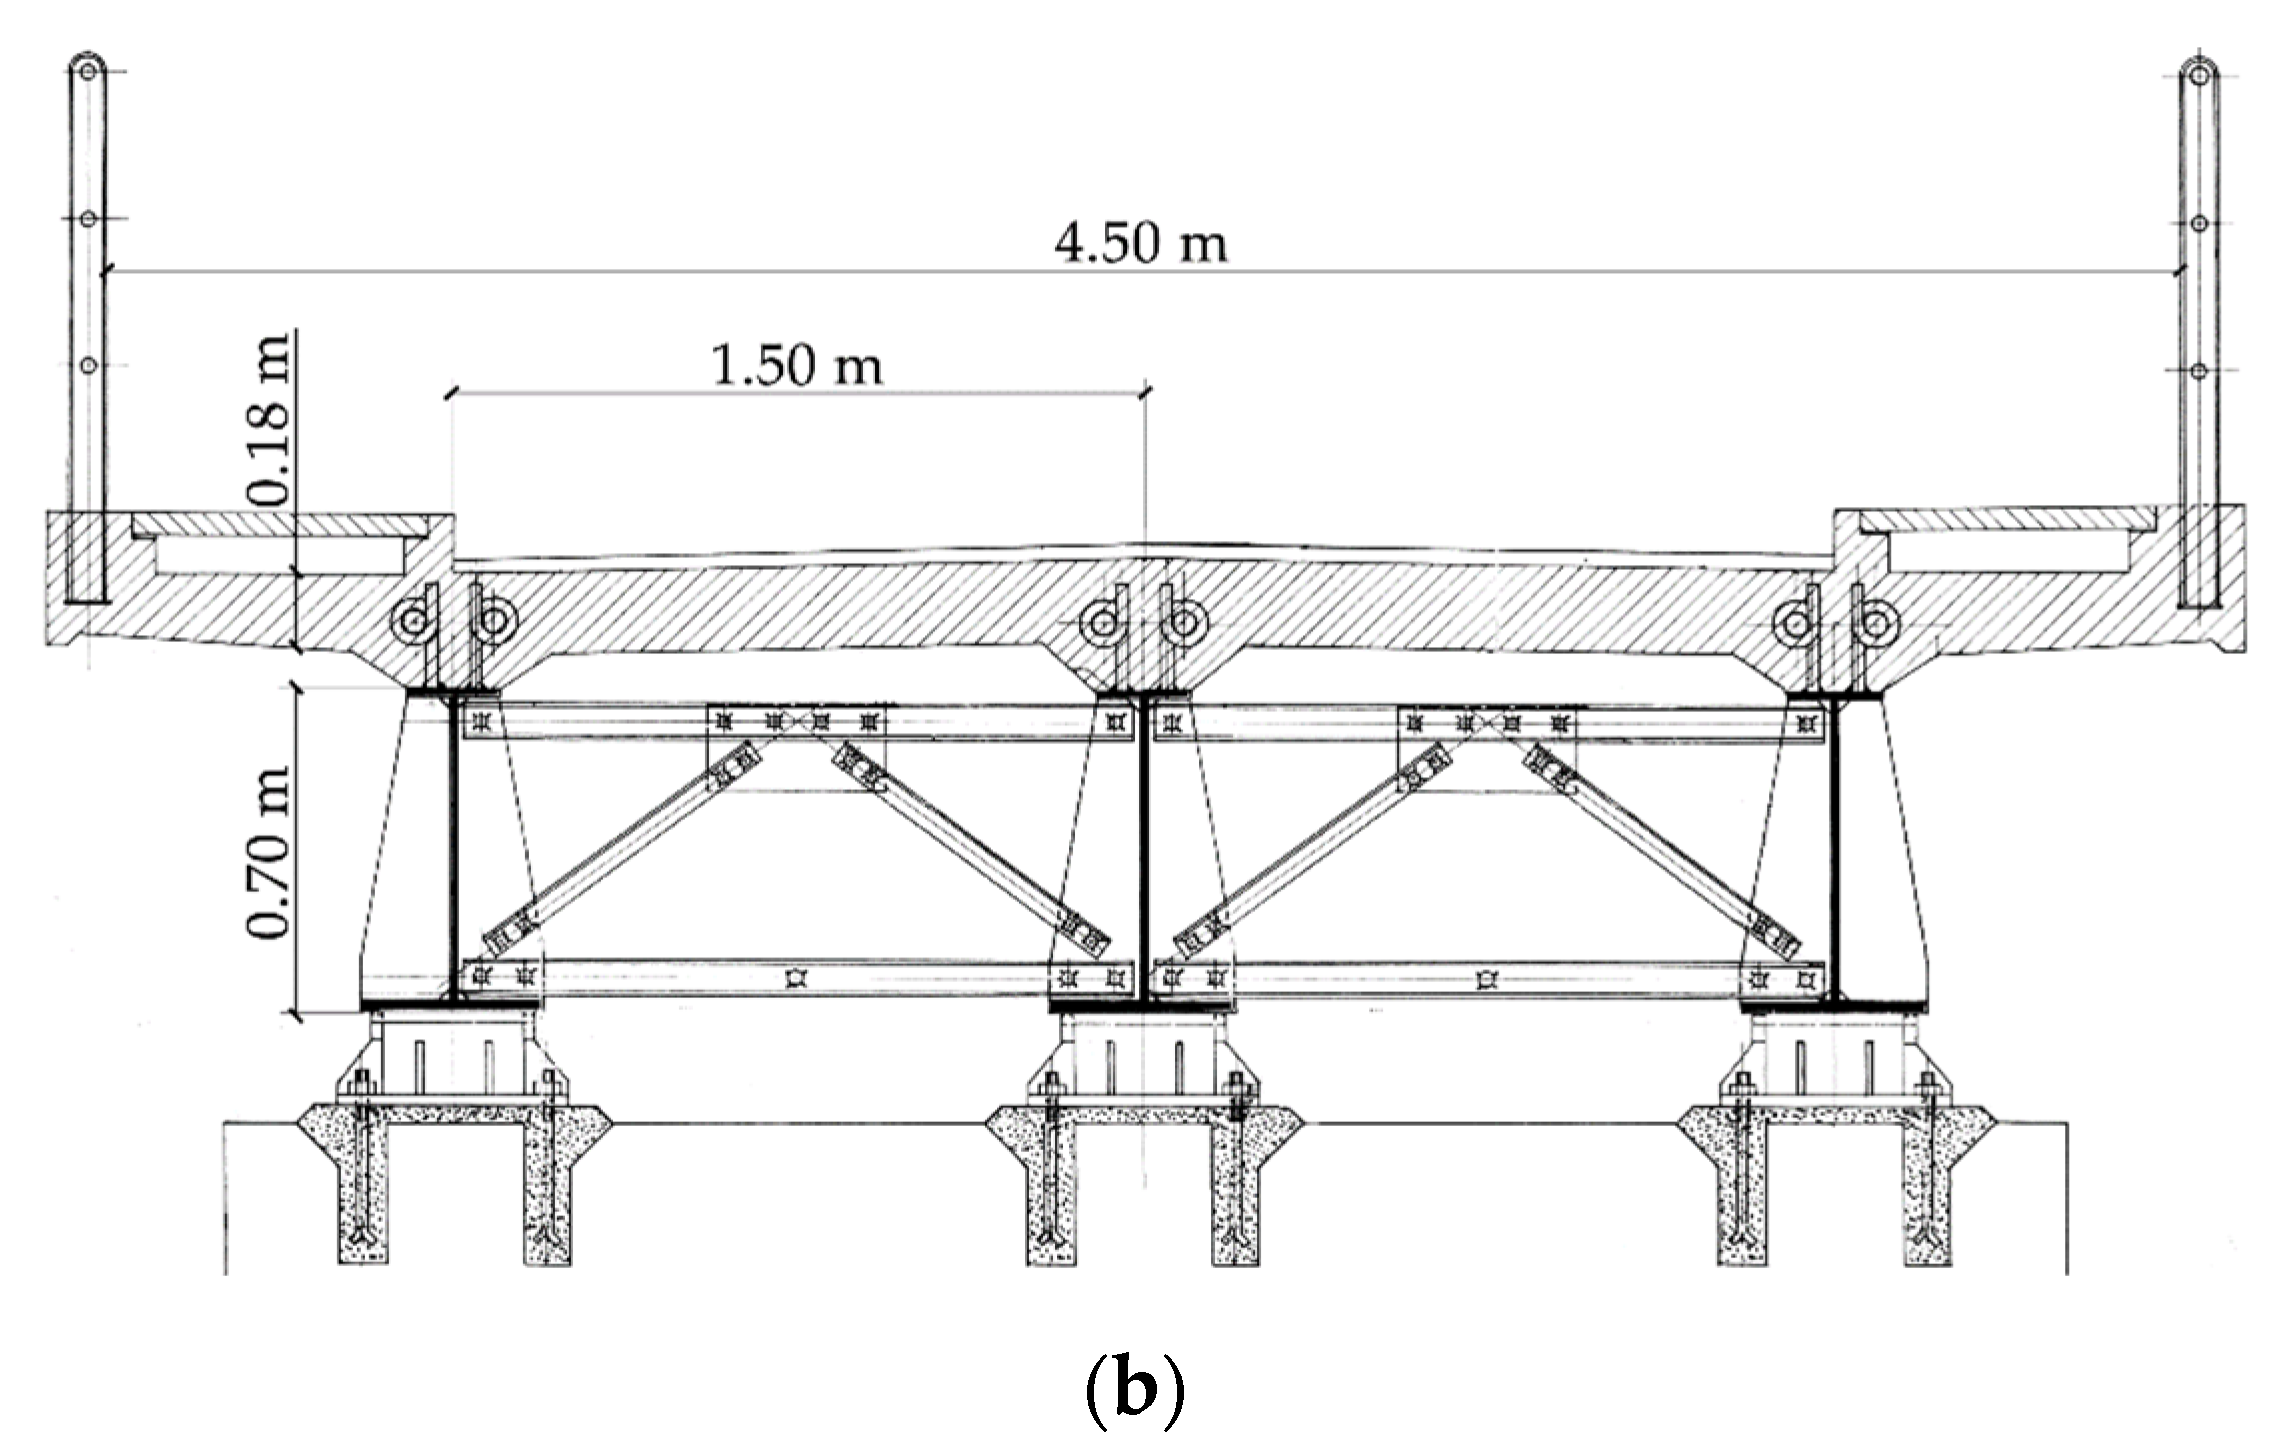
Presently, the structure exhibits a fairly good state of preservation, with only a few signs of rust expansion (
Figure 3) causing deformation of some diagonal members of the girder.
3. Hydraulic Investigations
Specific guidelines on risk classification and management, safety assessment, and monitoring of existing bridges have been published in Italy by the Minister of Infrastructure as a mandatory code in 2020 [
22]. The guidelines approach the problem of existing bridges through a multilevel procedure that accounts for various types of risk derived from structural vulnerabilities and the surrounding environment [
23]. Hydraulic risk is included in the guidelines. If a bridge is deemed to require a high level of attention, a detailed assessment must be performed in accordance with current Italian technical code [
21]. The Baghetto Bridge, as will be discussed in
Section 3.1, requires a high level of attention from a hydraulic perspective. For hydraulic risk, the standard requires hydraulic actions to be considered as variable loads.
Therefore, the aim of the hydraulic investigations was to estimate the actions exerted by the Adda River flow on the Baghetto Bridge during (selected) high-stage events. In addition, hydraulic processes can develop at different spatial scales, so different hydraulic scenarios were evaluated considering both the river basin scale and the structural scale.
In general, for hydraulic actions on bridges three main categories can be considered: (i) hydraulic force on the structure, i.e., the loads on the piers and deck; (ii) erosion of the riverbed at the base of the piers; and (iii) erosion of the abutment and asportation of the access road embankment due to lateral migration of the river. Moreover, floating debris (logs, shrubs, etc.) may increase the effects of hydraulic actions on the structure, especially regarding actions (i) and (ii).
3.1. Definition of the Hydraulic Scenario
Hydraulic modelling based on existing topographic surveys of the river and basin was performed to evaluate hydraulic actions (i) and (ii) on the bridge. Modelling was performed for two hydraulic scenarios, i.e., hydraulic events with 20- and 200-year return periods. Note that hydraulic actions on the bridge occur constantly, as structural elements of the bridge are permanently submerged. However, the most intense actions occur during high-stage events.
Figure 4 shows the flow field in the area around the bridge during a 200-year event (the event referenced in the Italian code). The Adda River runs with a subcritical current and very variable speed depending on the topographic conditions (up to 3.7 m/s). On the left, the flow is bounded by the steep valley side, while it can freely expand on the right side, which is not protected by levees or embankments, to occupy part of the agricultural and natural floodplain with water depths up to 2.0 m and low speeds (<1.0 m/s). Therefore, the right access road to the bridge that crosses the floodplain perpendicularly is submerged. This embankment is covered in stone masonry, so it appears to be minimally vulnerable to direct erosion by the flow, at least in a first-level evaluation. A further threat for the right embankment (and abutment) may come from lateral shift of the riverbed (action (iii)): however, by observing historical aerial and satellite images going back to 1954, no evident signs of bank erosion—which would induce lateral migration of the river—were noted; lateral erosion may be, therefore, considered to be low probability.
The presence of a weir 150 m downstream of the bridge, built for a hydroelectric power plant, influences the morphology and the hydraulic regime of the river upstream.
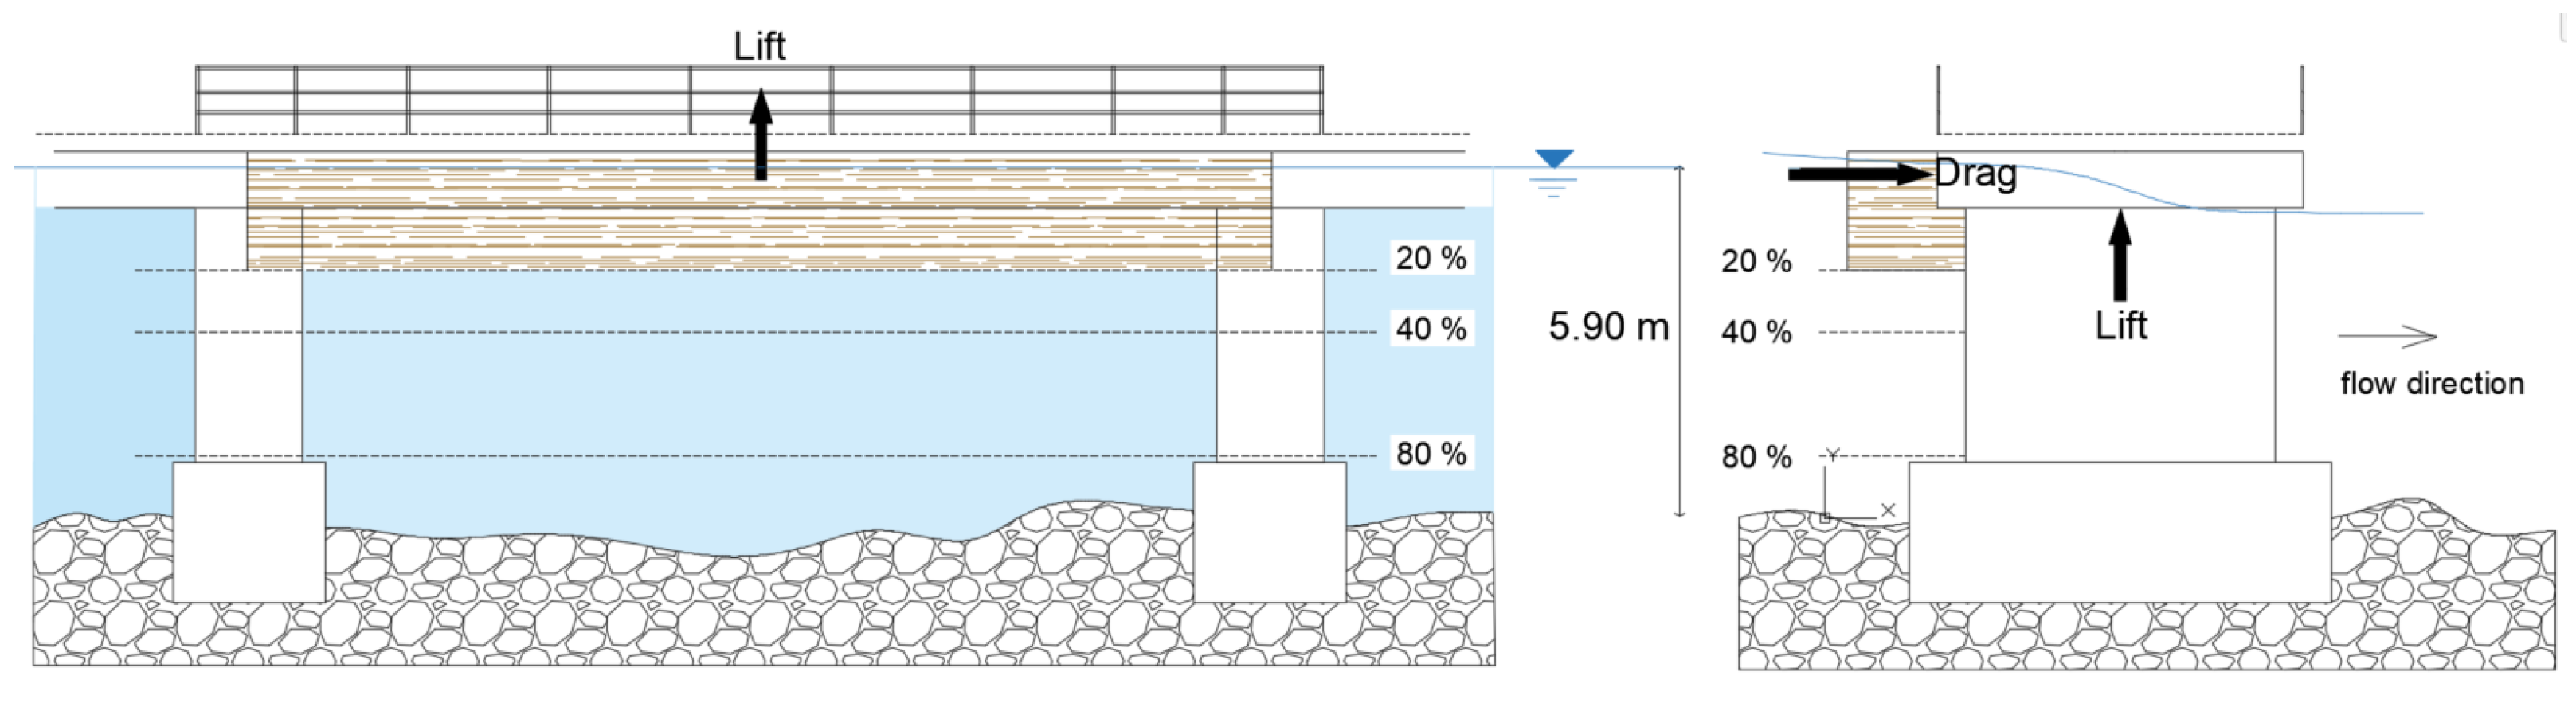
The main result from the simulation is that the bridge is hit by the current at the level of the deck with a water depth equal to 5.90 m (with respect to the lowest point of the riverbed at the bridge) and a depth-averaged flow velocity equal to 2.63 m/s. Therefore, the bridge does not meet the standard set out in Italian code, which states that the distance between the water surface and the deck must not be less than 1 m.
Historical satellite images and visual inspection of the bridge did not show evidence of frequent debris accumulation. However, interviews with nearby residents reported accumulation of debris in front of the piers during important hydraulic events. The mechanism of impact and the geometry of the accumulation of debris can result in different load configurations on the structure. With no data or observations available, to obtain a rough estimate of the order of magnitude of the load it is possible only to hypothesize a series of likely configurations of debris accumulation. In this context, we considered scenarios with various partial occlusions of one of the spans of the bridge, with the debris mats leaning on the deck and the piers (
Figure 5). In this case, the load on each structural element is uniformly distributed, and the affected area is equal to the projection of the debris on the element. Other configurations consist of debris mats leaning on the deck only and total occlusion of the span. These last two configurations generate a smaller load on the structure, since debris mats leaning on the deck cannot reach large depths, and total occlusion of the span would correspond to a hydrostatic load on the structure (flow velocity close to zero). Debris mats are expected to impact the deck even when the water level does not reach deck level, i.e., for an event with T = 20 years return period. For each configuration, a probability of occurrence, mainly expert-based, was assigned. A partial occlusion of 20, 40 and 80% was hypothesized with an occurrence of 1/2, 1/5, and 1/10 for the 20-year event. For the 200-year event, a scenario with 40% occlusion and 1/2 probability of occurrence was hypothesized. Five different scenarios, each associated with a specific time-return period, were obtained through the combination of hydraulic scenarios and debris scenarios.
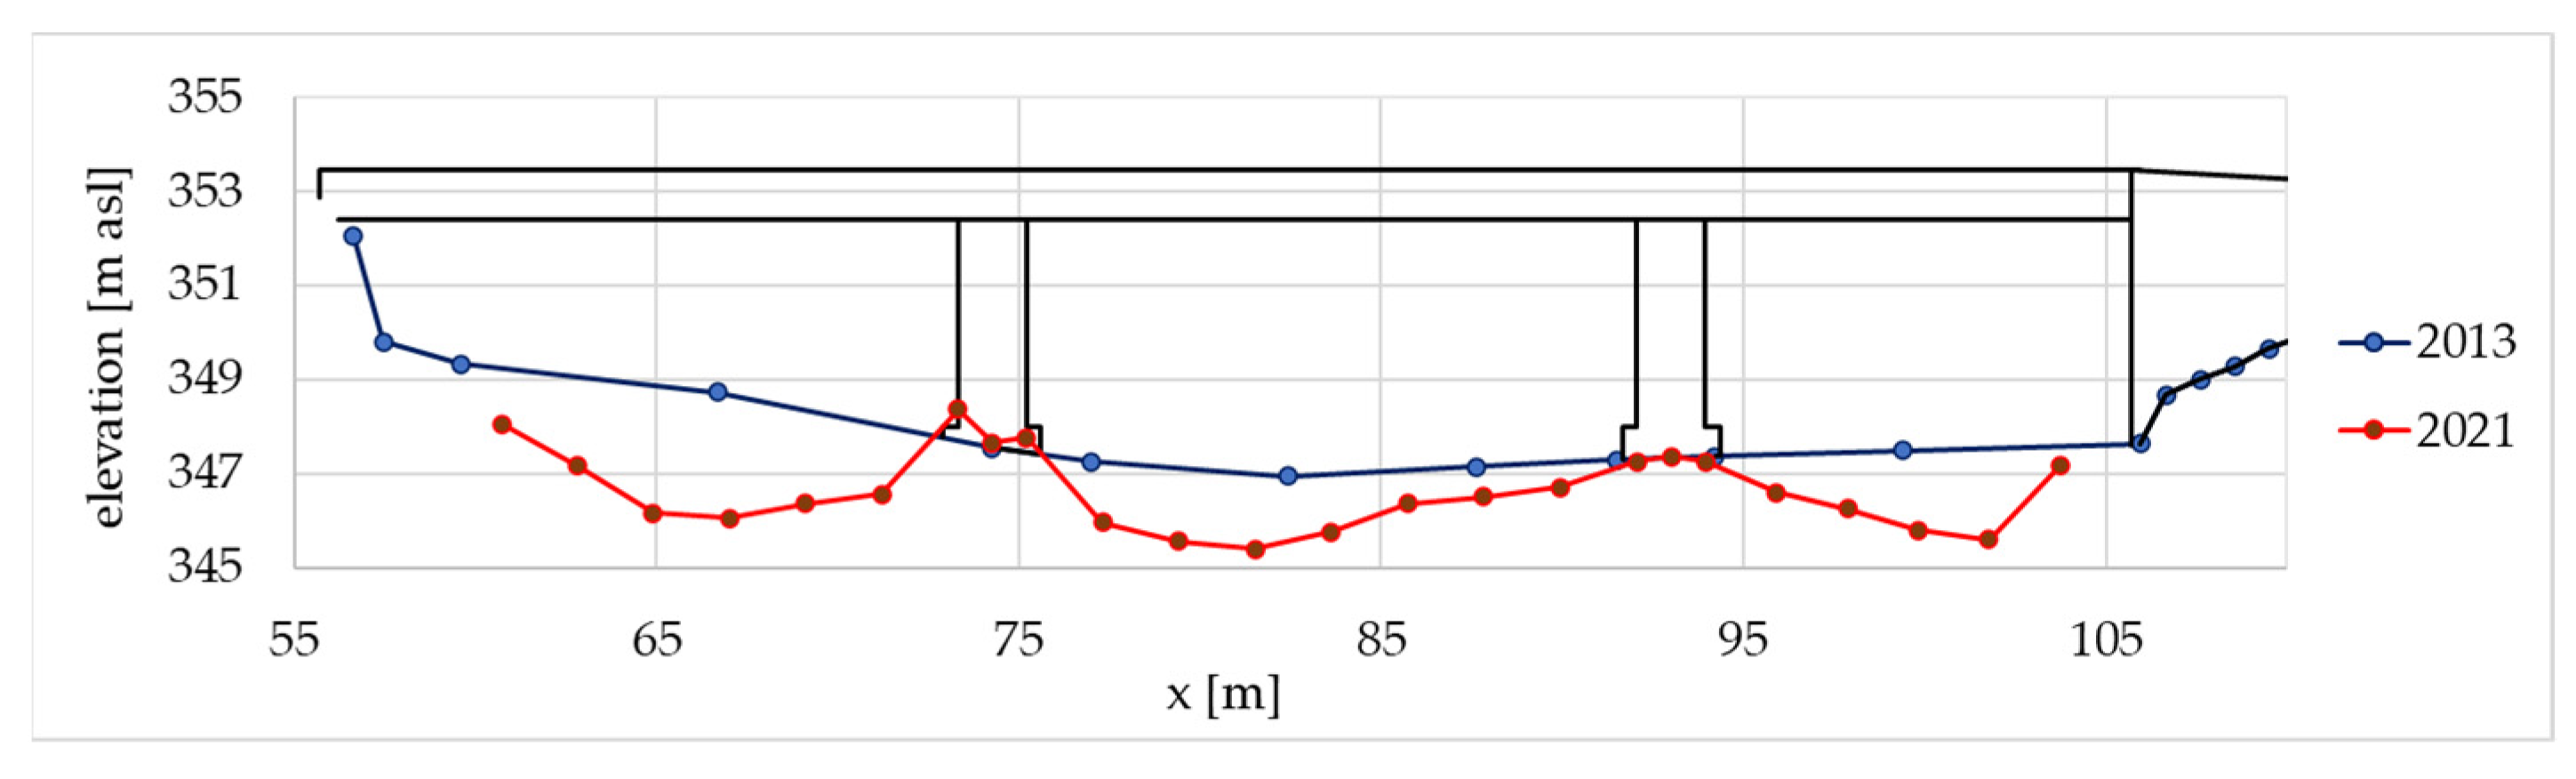
The riverbed elevation at the bridge section was measured in 2021 to detect altimetric variations with respect to the 2013 configuration. From
Figure 6, a general degradation of about 1.5 m can be noted, apart from the area around the pier foundations. These measurements led to the hypothesis of the presence of a rip-rap to protect the foundations against scour.
Scour is a cyclic process that can develop at different spatial and temporal scales. Whereas the processes are characterized by very distinct spatial scales, their effects remain separate and can simply be added. In this case, further general degradation of the riverbed at the largest scales (both spatial and temporal) can be excluded due to the presence of the weir, which stabilizes the topographic longitudinal profile of the riverbed. At smaller scales, local and contraction erosion around the piers may occur during an extreme event. Local erosion is due to the presence of the piers, which create vortices at their bases. On the other hand, contraction scour is caused by the increase of velocity generated by the constriction of the cross-sectional area of the riverbed at the bridge. However, under the hypothesis of a rip-rap protection around the foundations, in the structural model presented in
Section 5 it has been decided to consider a fixed riverbed and, therefore, a fixed foundation system. Future development of this work may investigate the effects of riverbed variation around the foundations in case the rip-rap protection should prove inadequate.
3.2. Hydraulic Actions on the Bridge
In this section, hydraulic actions on the structure are estimated based on the scenarios defined in the previous section.
Concerning the loads on the structure, the hydraulic force can be calculated singularly for each structural element (the piers and the deck). However, the structural safety evaluation (
Section 4) is performed only for the deck since it is the most vulnerable element to lateral and lifting loads. Therefore, the loads for each scenario were calculated for the deck only. To provide the order of magnitude of the load for the piers, it was evaluated based only on the load for the scenario with T = 200 years and no debris.
The two piers have equivalent hydraulic conditions. Both hydrostatic and hydrodynamic forces act on the bridge, depending on the water elevation, due to the difference of water depths between upstream and downstream of the structure. Assuming a drag coefficient equal to 1.33 [
24] on each pier, the total hydraulic force along the river current direction is equal to 105 kN (51 kN and 54 kN for the hydrostatic and hydrodynamic components, respectively). Note that the static component makes up about half of the total. Considering the static component is approximately proportional to the difference in water level between upstream and downstream, there is considerable uncertainty in the calculation of this value. In fact, the water level difference is approximately equal to the energy loss at the bridge, in turn governed by the concentrated loss coefficients. These coefficients represent an element of significant arbitrariness in the hydraulic calculation. For example, variation from standard values for a bridge (m1 = 0.3; m2 = 0.5) to the typical values of the most-abrupt transitions (m1 = 0.5; m2 = 0.8), produces an increase of 29% to the total force calculated for the 200-year event.
For calculation of the lift component, only the buoyancy force has to be considered. The up-thrust corresponds to a reduction of 10 kN/m3 of the specific weight of the submerged part of the structure.
Concerning calculation of hydraulic force on the deck, in the literature, few studies have been conducted estimating water and debris forces on bridge superstructures during river high-stage events (see [
12,
13]). In this case, a simplified approach was adopted by considering a rectangular shape for the deck and the debris mats. By considering the load scheme of
Figure 5, the debris mat load is applied both on the deck and the piers. The redistribution of the load between the deck and the piers was estimated by considering a plate loaded uniformly and leaning on the three structural elements. With such a configuration, over 80% of the total area of the debris ended up affecting the deck in all the hydraulic scenarios, while the remaining portion affected the piers.
Table 1 shows the hydraulic force acting on a single span for the five scenarios described previously. The forces refer to the single 17.35 m span (although they are transferable to the other spans by taking into consideration their different lengths). Water current velocity increased 20% with respect to the depth-averaged velocity according to the typical vertical velocity profile. To account for porosity of the debris mats, the drag coefficient was set to 1.5, 11% less than as estimated by Parola et al. [
25], who indicated Cd = 1.9 as the upper limit drag coefficient for a rectangular prismatic obstacle.
Water depth was equal to 4.98 m and 5.900 m for the events with 20- and 200-year return periods, respectively.
Concerning the vertical component of force, the static component depends on the submerged volume of the deck. In the 200-year event, when air is entrapped between the beams, the buoyancy force acting on the deck can reach 1000 kN (20 kN/m). For the hydrodynamic component of force, few experiments exist for the evaluation of the lift dynamic coefficient of a submerged deck. Relying on Malavasi and Guadagnini [
26], a negative lift force (downward direction) of the same order of magnitude as the buoyancy force was calculated. Due to the high level of uncertainty related to evaluating the hydrodynamic component, only the static component has been considered. Finally, debris does not affect the vertical force. Therefore, only the vertical force must be considered for the 200-year event.
To better elucidate the lateral hydraulic loads, it is possible to compare them to the lateral wind load acting on the deck (although this was not considered in the design loads of the bridge). For a truck that occupies the same span and has 3 m height (to be added to the thickness of the deck, equal to 1 m) and at wind speed equal to 25 m/s, the resulting force is approximately 56 kN.
4. Structural Safety Evaluation
The structural safety evaluation is carried out considering slab lift and anchor bolt drag with the estimated hydraulic actions in terms of drag and lift components according to the different return period of the hydraulic event. The structural-simplified methodology is aimed at defining a safety factor—called hydraulic safety factor (HSF)—chosen as the minimum safety factor computed for slab lift (HSFs) and anchor bolt drag (HSFa); thus HSF = min {HSFs, HSFa}.
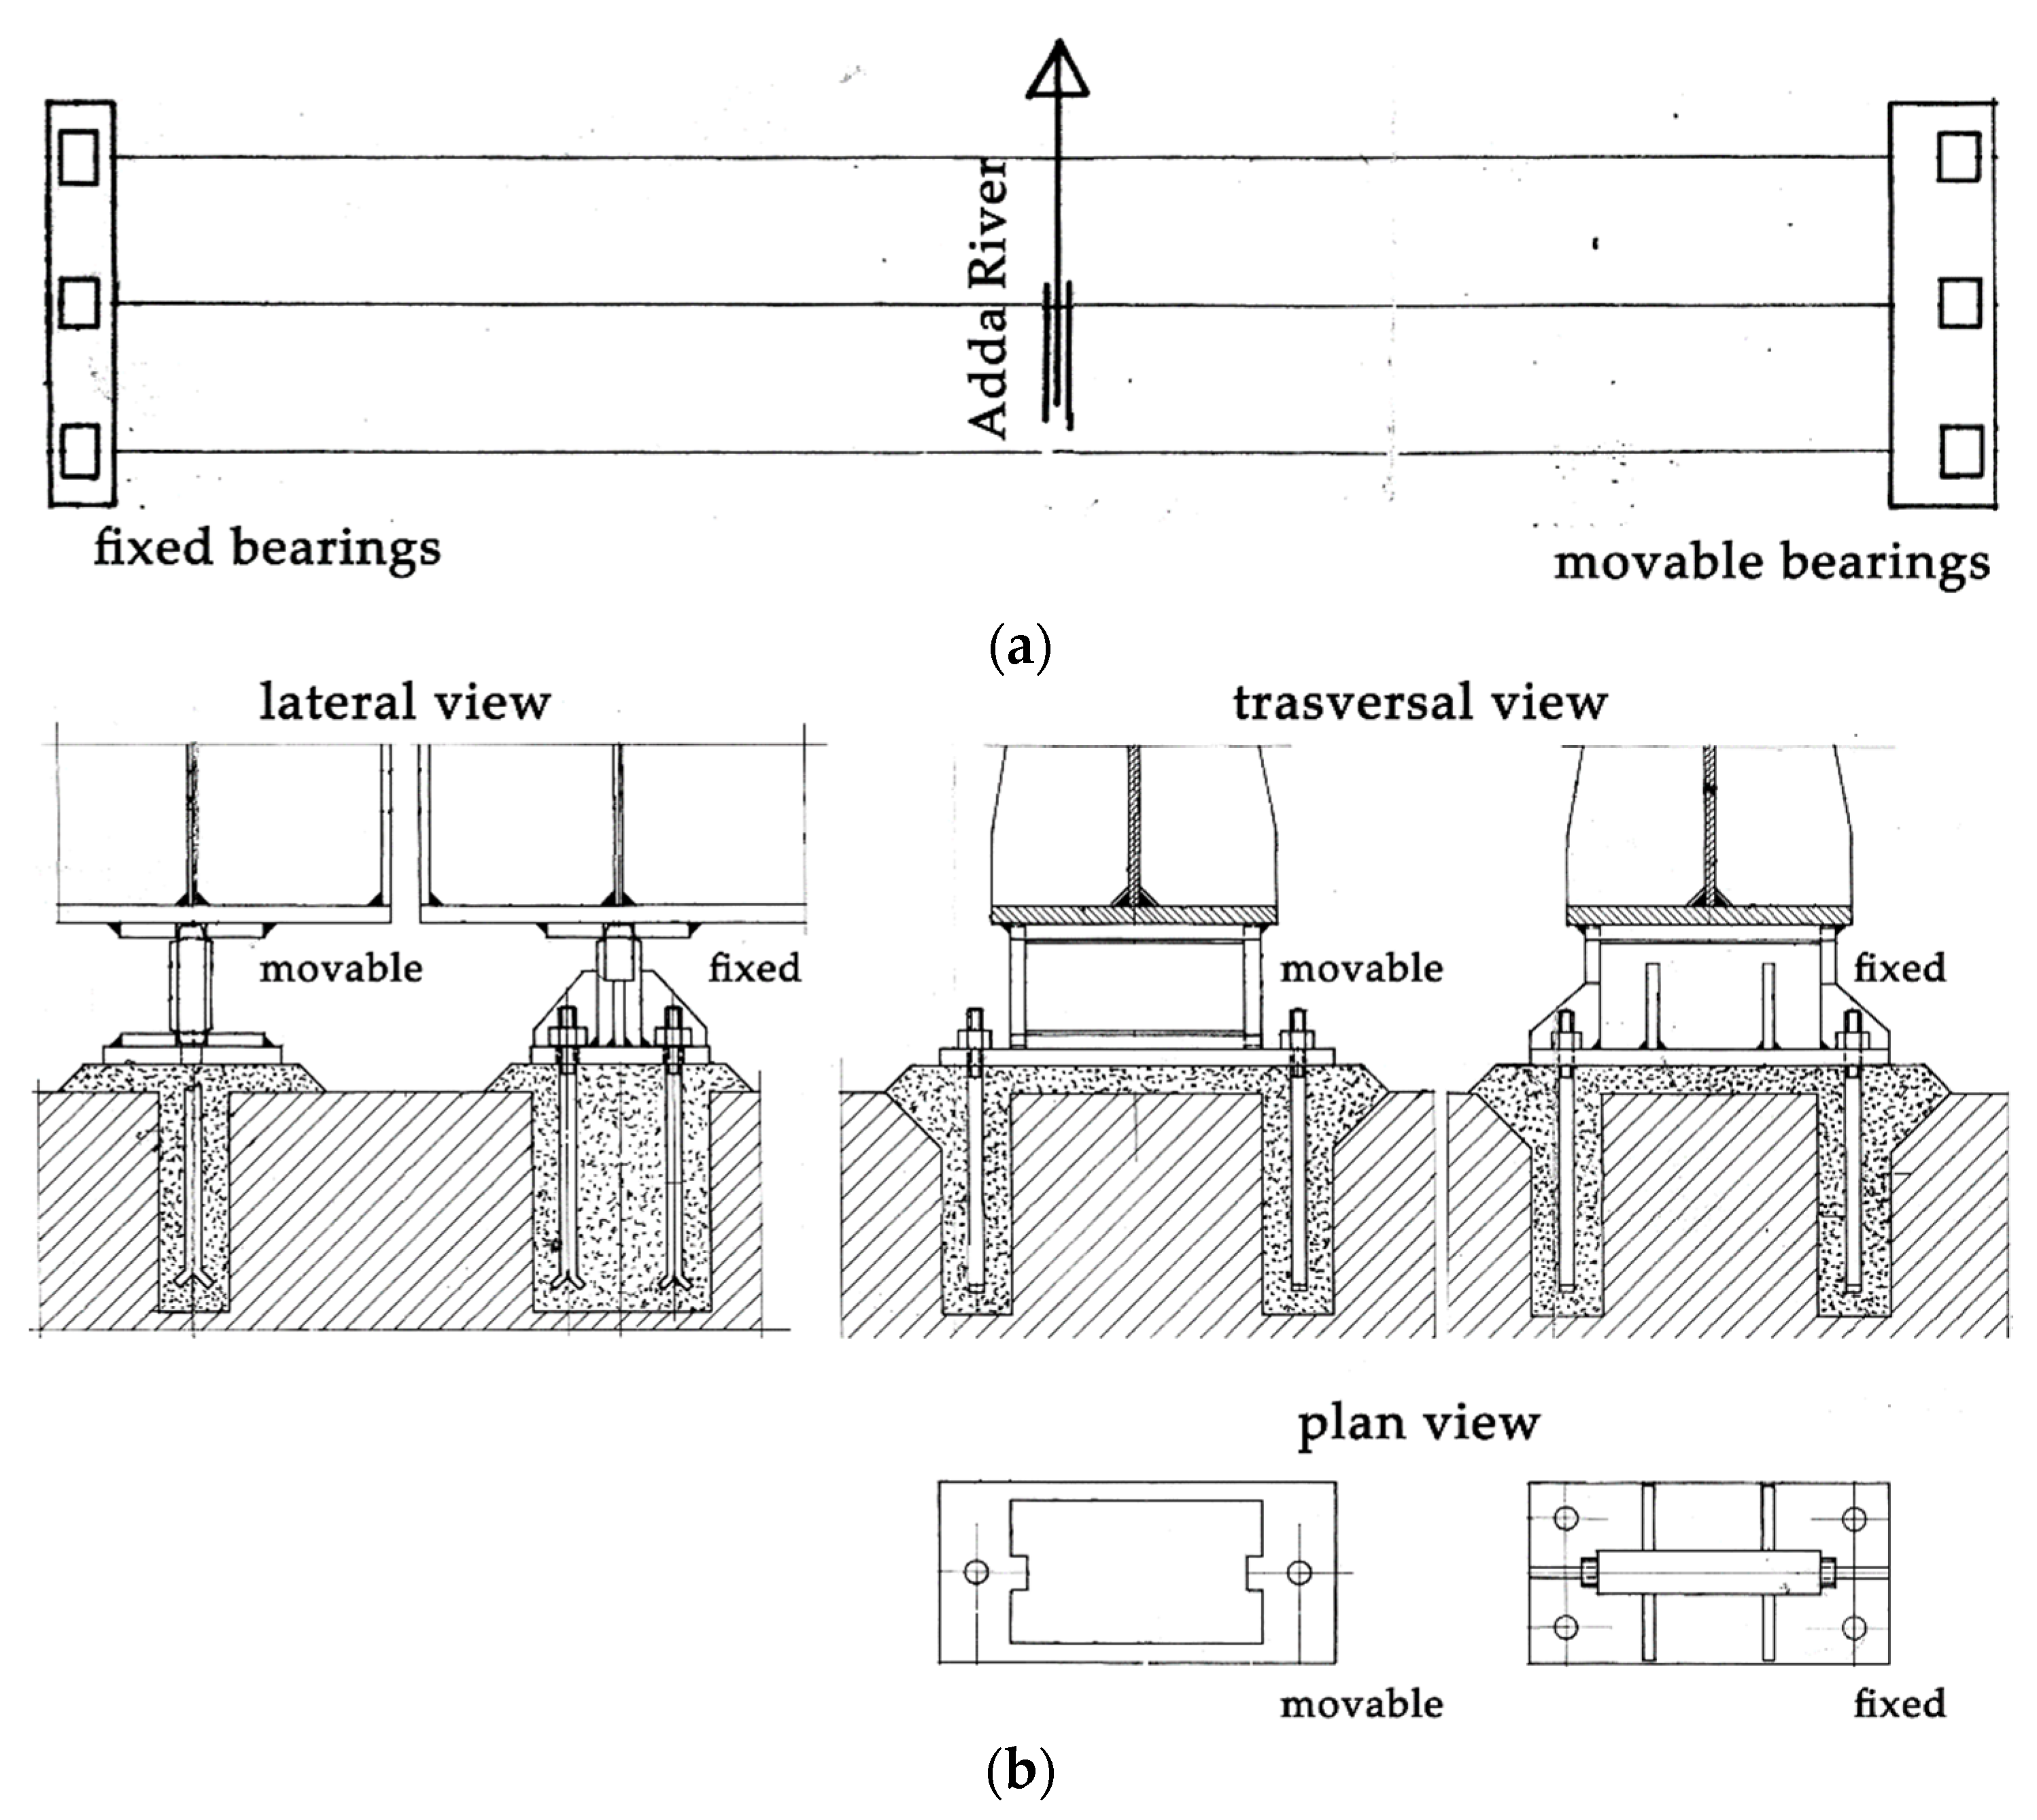
Regarding the characteristics of the bridge’s metallic support devices, each girder span is supported on a knuckle pin bearing at one side, restraining transverse and longitudinal displacement, and a single sliding roller bearing at the other side, releasing the longitudinal translation from the opposite side. Each span has a total of three fixed supports and three roller supports. The supports are identified as flat-sided bearings according to EN 1337-4:2004 classification [
27]. Each support device is composed by assembling two horizontal plates: the first one is connected to the lower intrados of the metal beam and the second one is fixed to the pier; both horizontal elements are connected by a vertical plate, as shown in
Figure 7.
The lower plates are anchored to the pier by anchor bolts ϕ27 (A
b = 470 mm
2). As shown in
Figure 7a, there are two anchor bolts for each roller-bearing support and four for each fixed support. The transfer of shear force between each horizontal plate and vertical plate occurs through a contact area of about 40 × 20 mm
2 (
Figure 7b). Regarding material properties, the original calculation report [
28] refers to Aq42 UNI 815 steel for the steel plates and Aq50 for the bolted girder connections. Referring to Verderame et al. [
29], the yield strength is assumed equal to f
y = 235 MPa (steel plates) and 265 MPa (bolts), while the ultimate stress is f
u = 412 MPa (steel plates) and 490 MPa (bolts). Because of lack of detailed indications, the anchor bolt elements were assumed to be of the same material as the bolts used in the steel element connections. Future investigation should assess experimentally the validity of the assumed values of strength, hardness, and toughness for the bridge support steel elements.
4.1. Slab Lift
Considering the 200-year hydraulic scenario, hydrostatic actions may cause upward lift effect (WLift) with greater magnitude than the bridge self-weight (Ws). Slab lift could be prevented as long as the hydraulic lift force is lower than the self-weight of the three girders of the slab (WLift < Ws). Each bridge span has a structural load of 27.2 kN/m. In particular:
Thus, each girder carries a distributed load equal to 9.1 kN/m, for a total weight of Ws = 512 kN for all the three main girders. According to the original design computations, the distributed load of each girder is equal to 920 kg/m (9.02 kN/m), with a maximum midspan bending moment of 40,472 kgm (397 kNm) and a shear force equal to 8630 kg (85 kN).
As a result, the hydraulic safety factor associated with slab lift (HSF
s) can be defined as:
with the parameter meanings explained above. Regarding hydraulic actions, from a precautionary point of view, it is hypothesized that during an extreme event the lower intrados of the concrete slab will be totally full of air instead of water. The resulting Archimedes lift is equivalent to a distributed upward load of 20 kN/m (
WLift = 375.2 kN). The hydraulic safety factor with respect to slab lift would be HSF
s = 1.4 (return period of the event in case of debris occlusion equal to 200 years). The results show a safety margin amply sufficient to avoid deck kinematics. For these reasons, floating of the deck can be reasonably excluded.
4.2. Anchor Bolt Drag
The shear forces due to hydraulic actions can be transmitted by shear resistance at the anchor bolts or by friction between the concrete pier and the steel plate. The support anchors are verified as bolted connections subject to the combined action of tension and shear with the following formula, according to EN 1993-1-8 [
30]:
with
Fv,Rd (shear resistance) and
Ft,Rd (tension resistance) of a single bolt computed as:
where
As is the tensile stress area of the bolt,
is assumed equal to 0.6,
fub is the ultimate tensile strength of the bolt (equal to 490 MPa),
γM2 is the partial safety factor for the resistance of the bolts in the bearing. The tension
Ft,Rd resistance is computed as:
It is thus possible to define the following hydraulic safety factor (HSF
a) for the anchors bolts:
In this context, the hydraulic actions in horizontal (drag) as well as in vertical (lift) directions are assumed to be distributed equally among all anchor bolts. The acting forces, resistances, and safety factors for different return periods of hydraulic action for each anchor bolt are listed in
Table 2 below.
Table 2, the hydraulic safety factor (HSF
a) coefficient is associated with a different return period for the hypothesized hydraulic scenarios in
Table 1. Obtained values of HSF
a show an amply sufficient safety margin with regard to anchor bolt resistance when subjected to various hydraulic actions.
By considering the worst case, the presence of damaged anchor bolts or concrete cracking along the anchor length would create imperfect adherence between the anchor bolts and the concrete pier. In this case, the slab shear resistance relies mainly on the friction between the steel plate and the concrete pier, which can be computed as:
where
NEd is the vertical force transmitted by each girder to the anchor bolts,
is the coefficient of friction between the base plate and concrete pier (which is assumed equal to 0.2 according to EN 1993-1-8 [
30]). The vertical reaction on each support device due to structural permanent load is equal to 85 kN (see
Section 4.1), leading to a resisting
Fv,Rd equal to 17 kN. The obtained value, if compared with V
Ed in
Table 2, highlights some criticalities in case T event = 200 and 500 years (hydraulic scenarios no. 3 and 5, respectively).
In this context, it might be advisable to check the anchor bolts and base plate solidarization of the metal plates with the pier. The anchors should be able to transmit compression on the concrete part and avoid the bearing of the anchors. With this aim, the anchor length should be greater than:
where
fbd is the ultimate contact strength defined as
fbd = 2.25⋅
fctk,0.05/γ
c, with
fctk0.05 being the characteristic tensile resistance of concrete (with a 5% fractile), and γ
c = 1.5 (concrete safety coefficient) in accordance with NTC 2018-4.1.2.1.1.4 [
21]. The anchor length, which was assumed by the design drawing to be equal to 400 mm, is appropriate to avoid any bearing mechanism. However, it might be advisable to check the state of conservation and to intervene to make a slight improvement in the solidarization of the metal plates with the pier, considering transverse actions.
All the computations carried out were based on the assumption of undamaged supports—in fact, the visive inspections did not show any evident signs of damage. However, more detailed investigations are recommended for the roller and roller plates, for example:
5. Dynamic Test and FE Modelling
5.1. The Dynamic Test and Modal Identification
In order to evaluate the dynamic characteristics of the bridge in operational conditions, a first ambient vibration test (AVT) was performed on 20 July 2020. During the test, the vertical and transverse structural dynamic response was measured: three cross-sections for each span were instrumented for a total of eighteen measuring positions, as schematically depicted in
Figure 8. As shown in this figure, the sensors were placed on the external curb of the bridge, in order to protect them from cars traffic.
Instrumentation consisted of 24-bit resolution DAQs and high-sensitivity (10 V/g) piezo-electric accelerometers and servo accelerometers. The sensing devices featured a measurement range of 0.5 g pk and a frequency range () from 0.05 to 4000 Hz. The structural responses to ambient and operational excitation were recorded at a sampling frequency of 200 Hz, and datasets of 3600 s were collected.
Modal identification was carried out by two well-known approaches: frequency domain decomposition (FDD) [
33]—available in Artemis software—and covariance-driven stochastic subspace identification (SSI Cov) [
34]—developed in previous research [
35].
Since analysis of the horizontal signals did not highlight any significant component in the lateral direction, only the vertical dynamic characteristics are herein discussed.
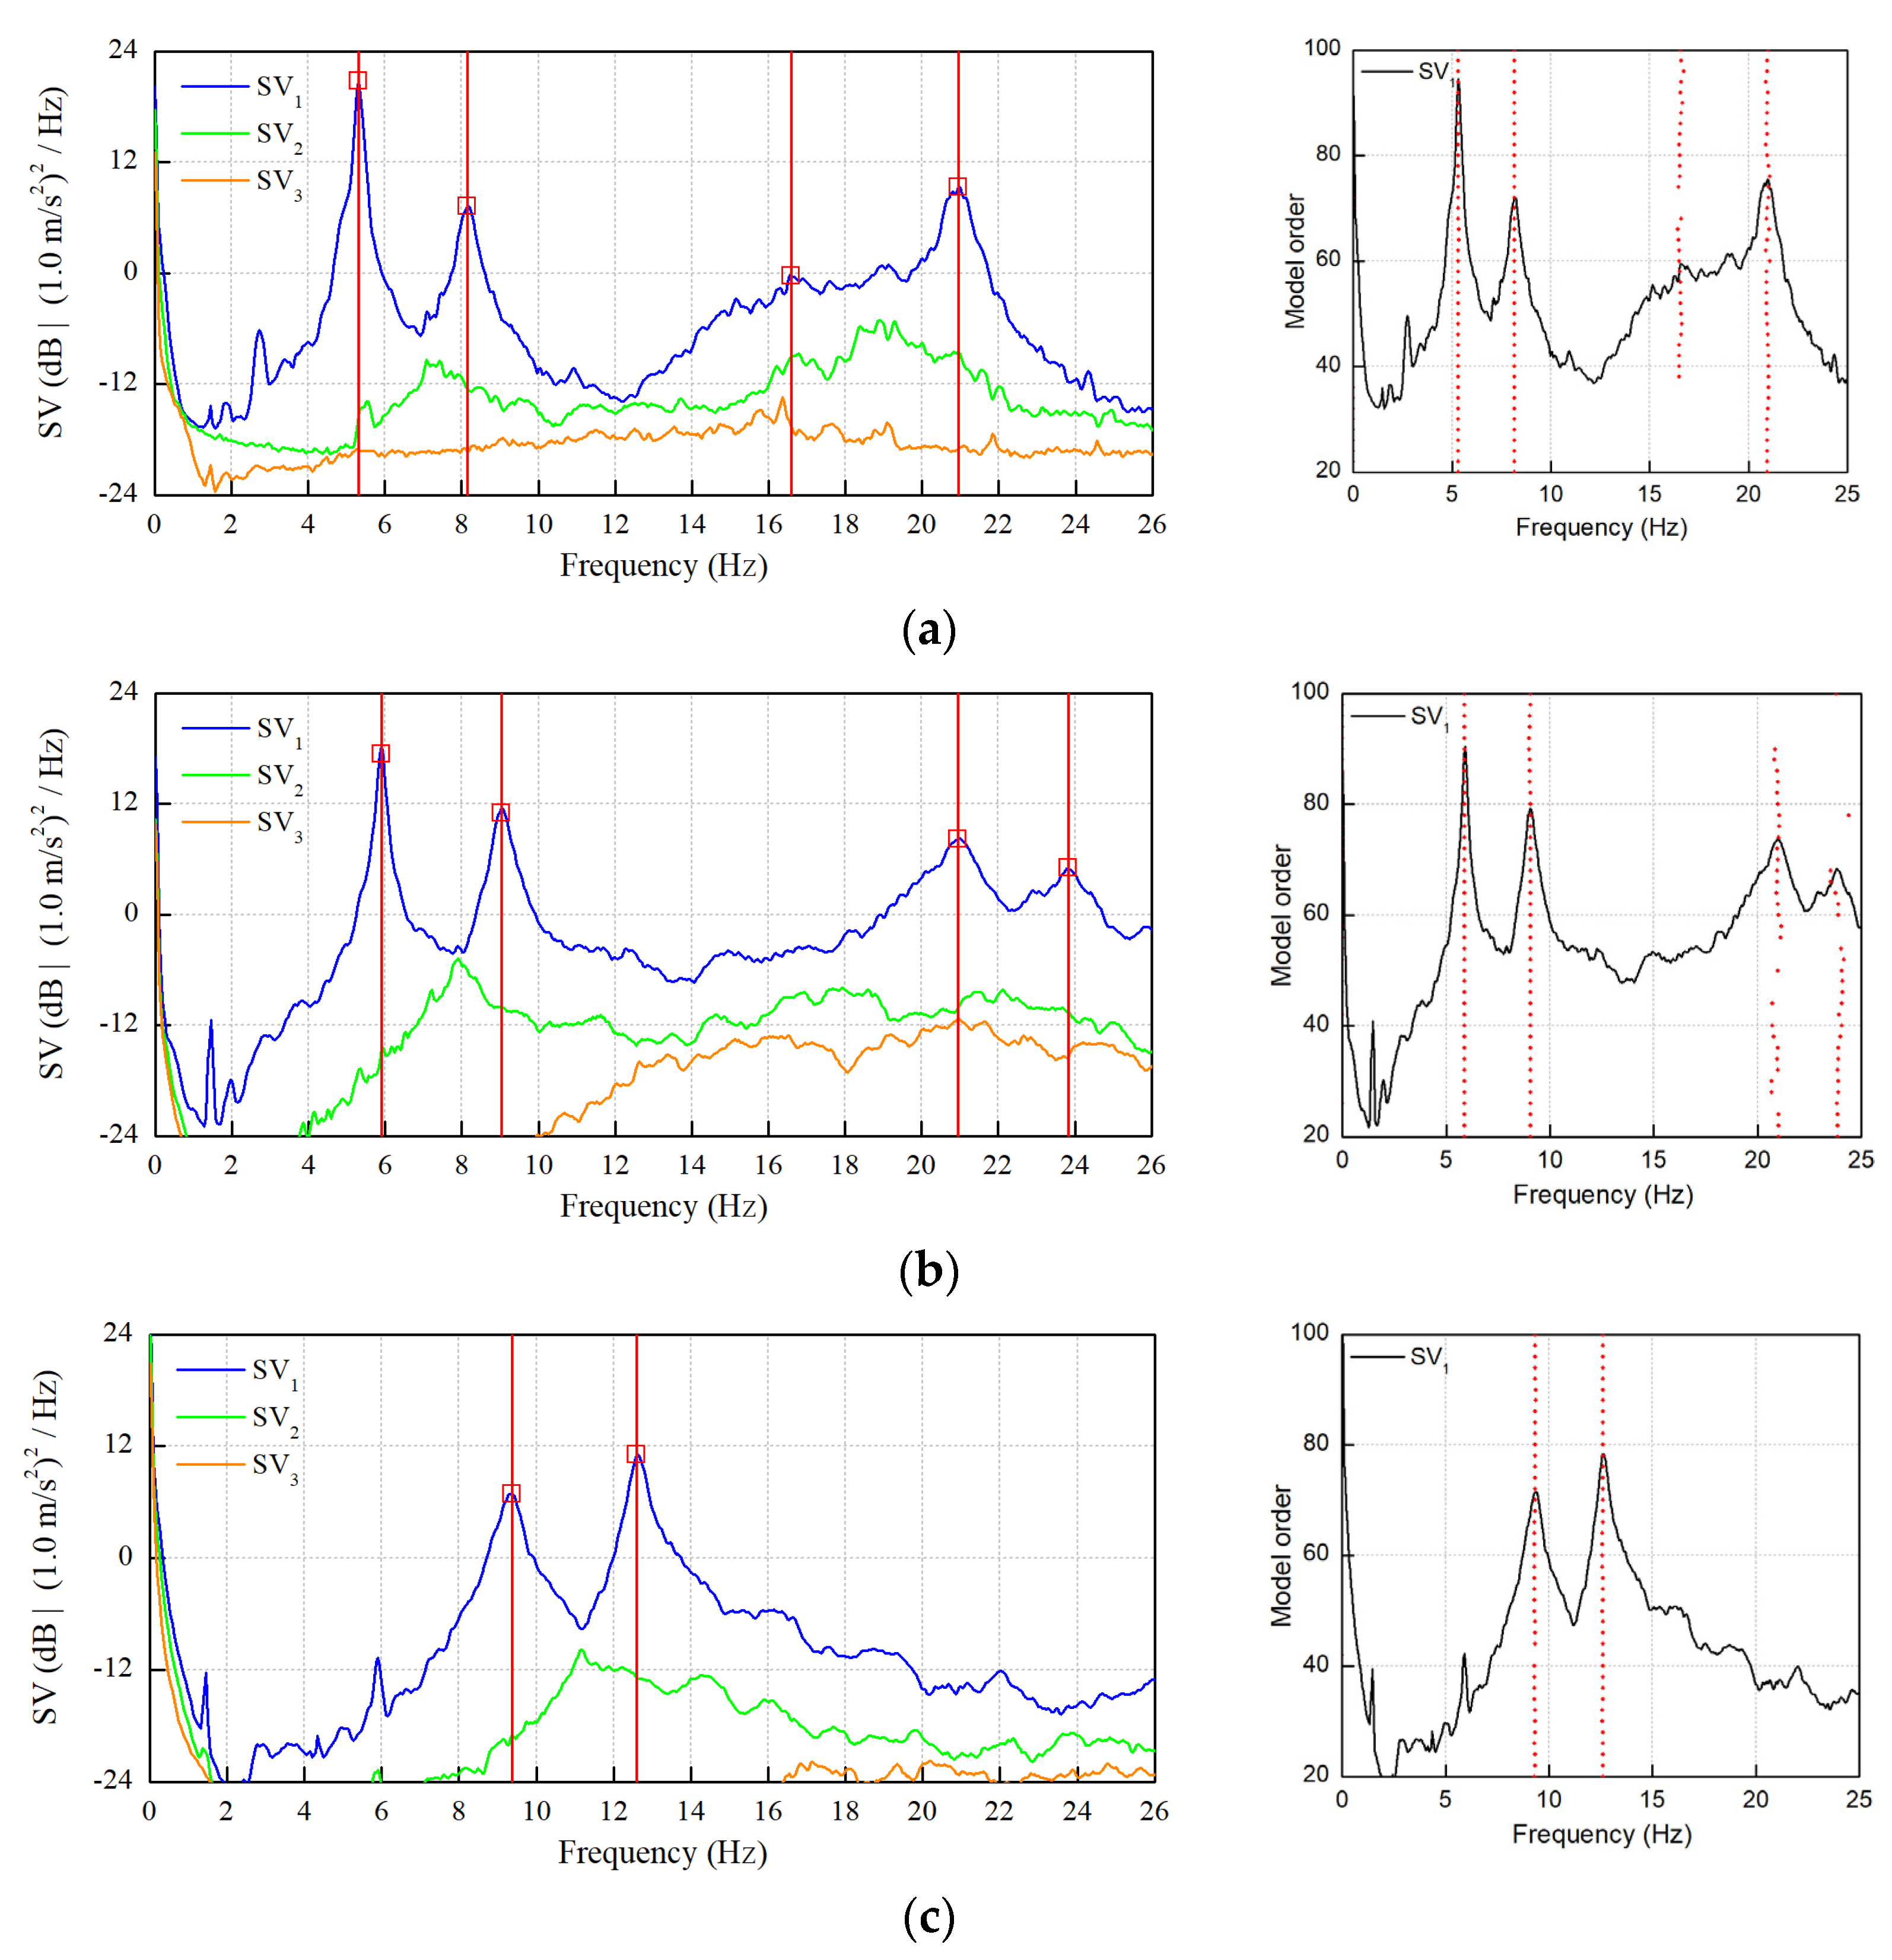
Figure 9 shows on the left side the results of data processing in terms of the largest singular value (SV) lines for each span in the range of 0–26 Hz, while on the right side the outcomes of the SSI algorithm are illustrated. Four vibration modes were identified by the local maxima of the first SV line for the longest spans, S1 and S2 (
Figure 9a,b), whereas two vibration modes were identified for the shortest span, S3 (
Figure 9c).
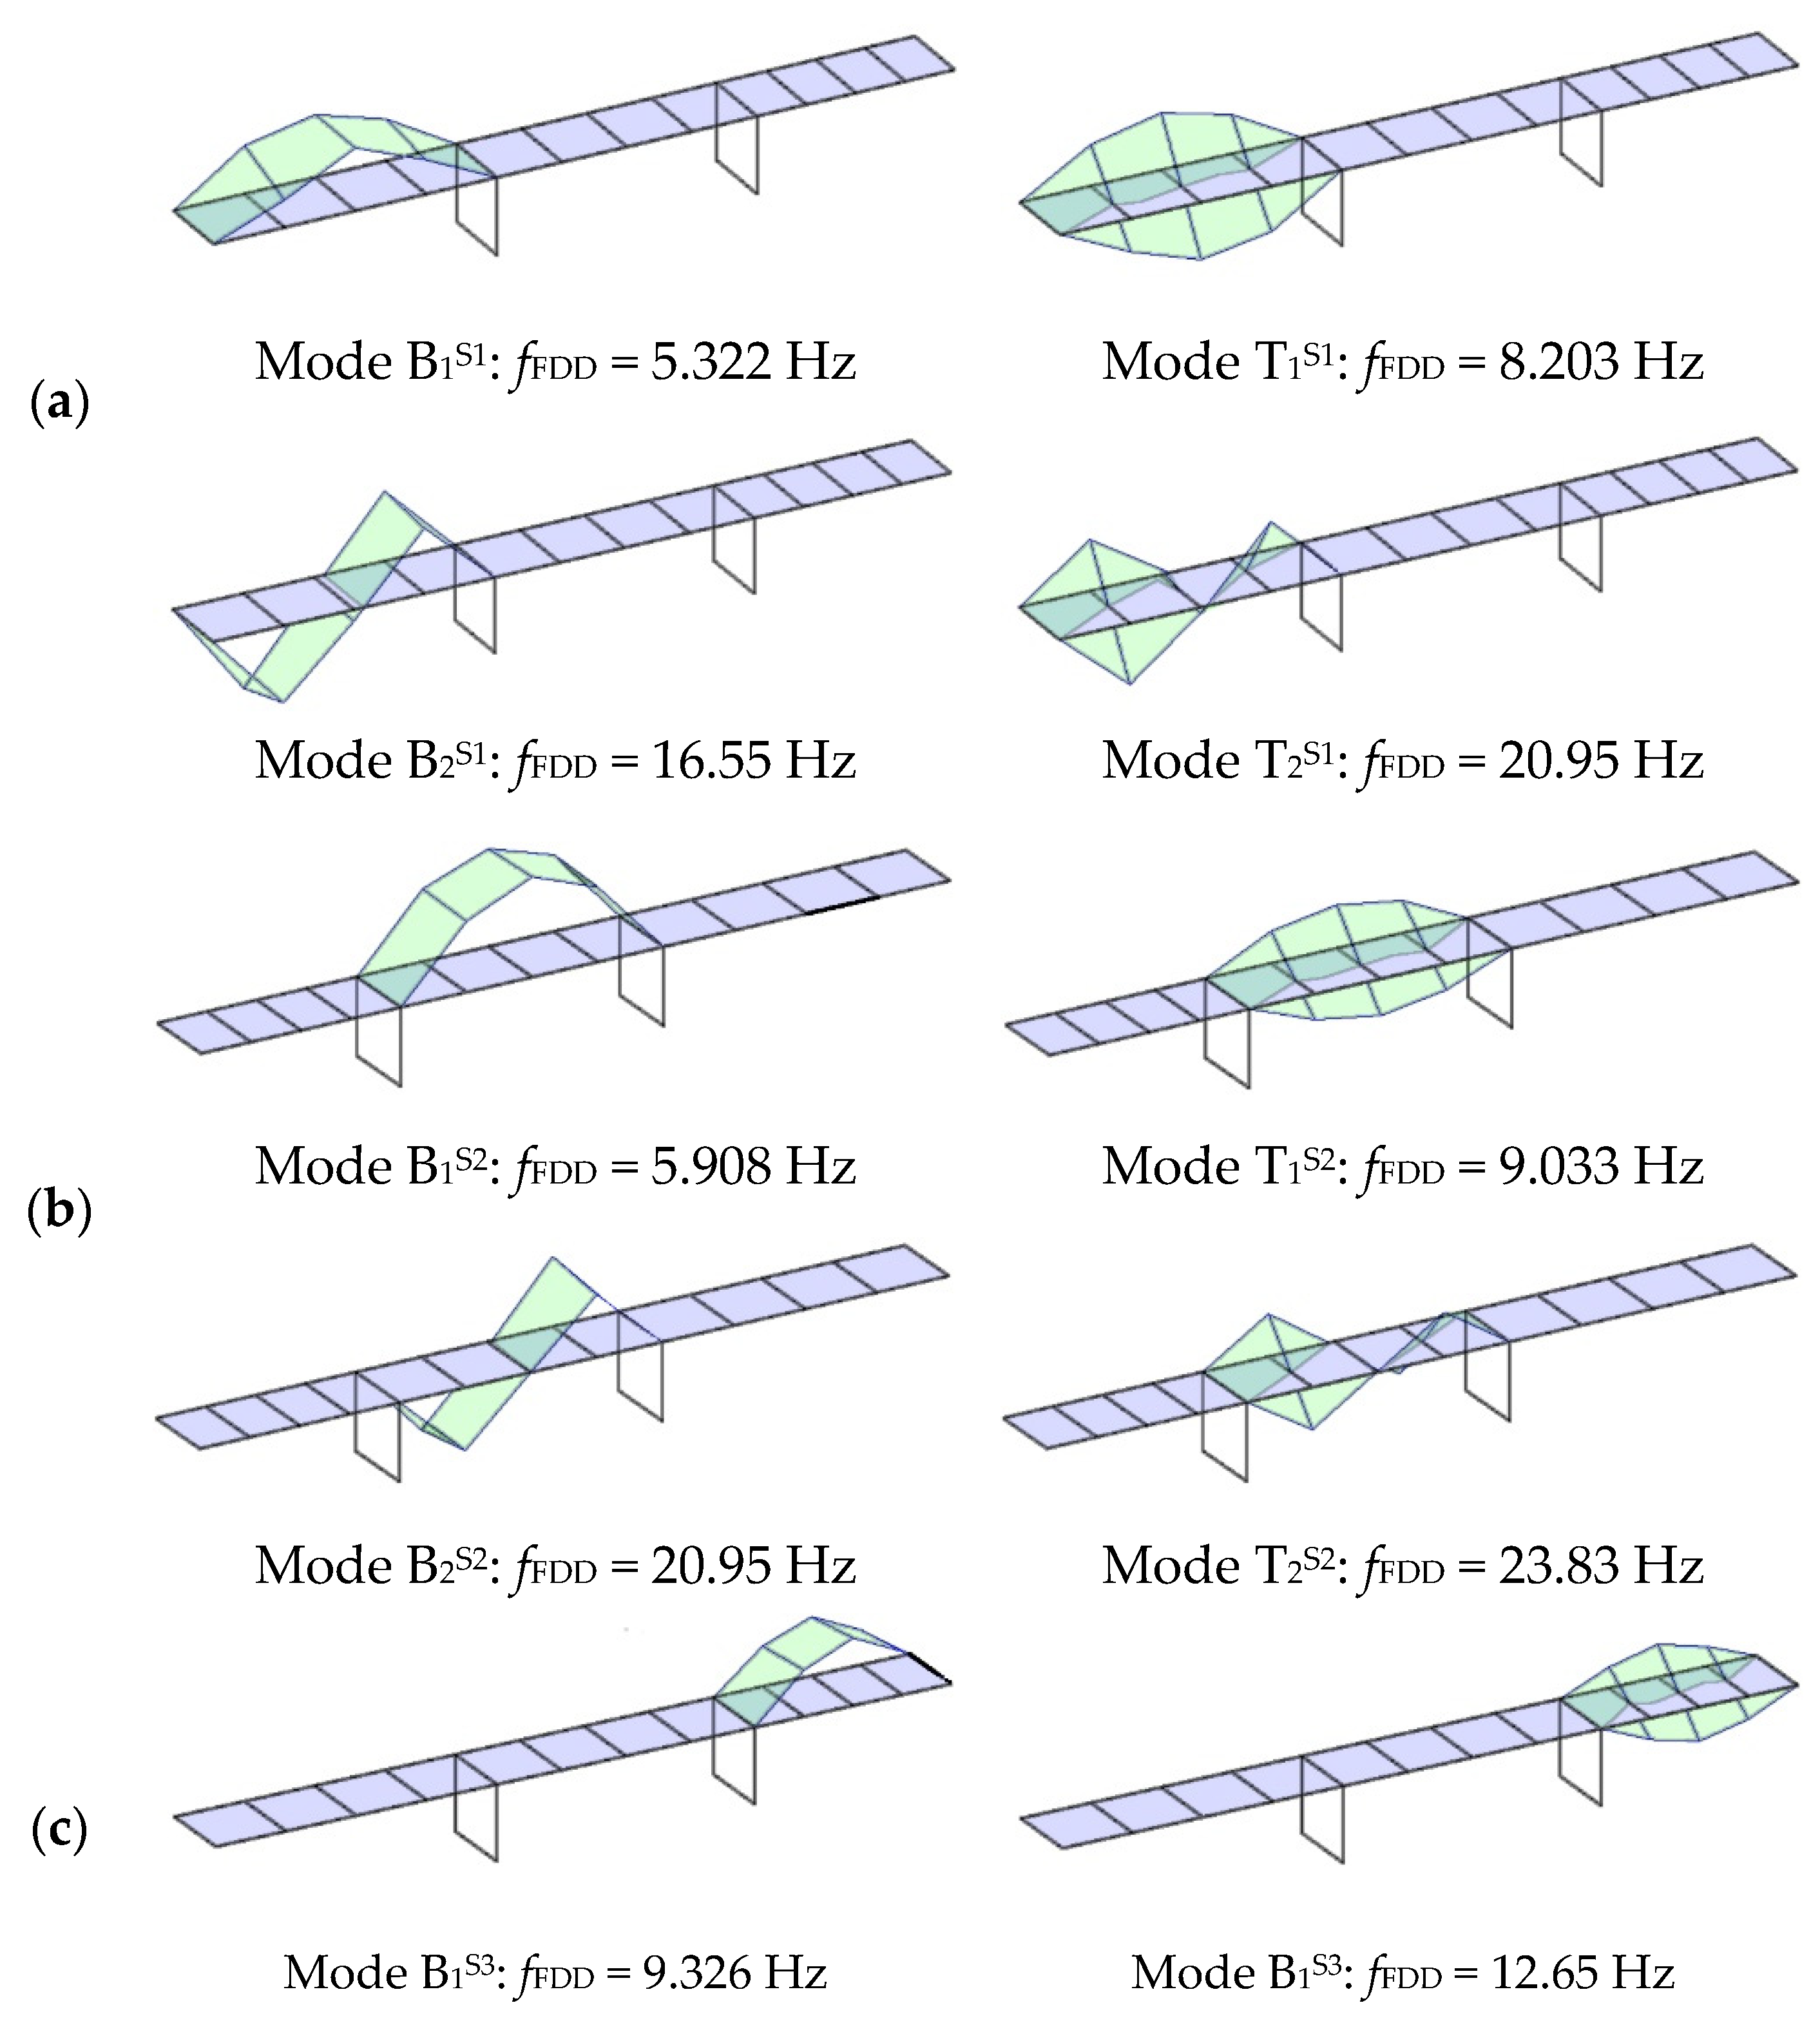
The corresponding mode shapes are reported in
Figure 10: the mode shapes follow the expected sequence of bending (B) and torsion (T) modes of first and second order.
5.2. FE Modelling and Updating
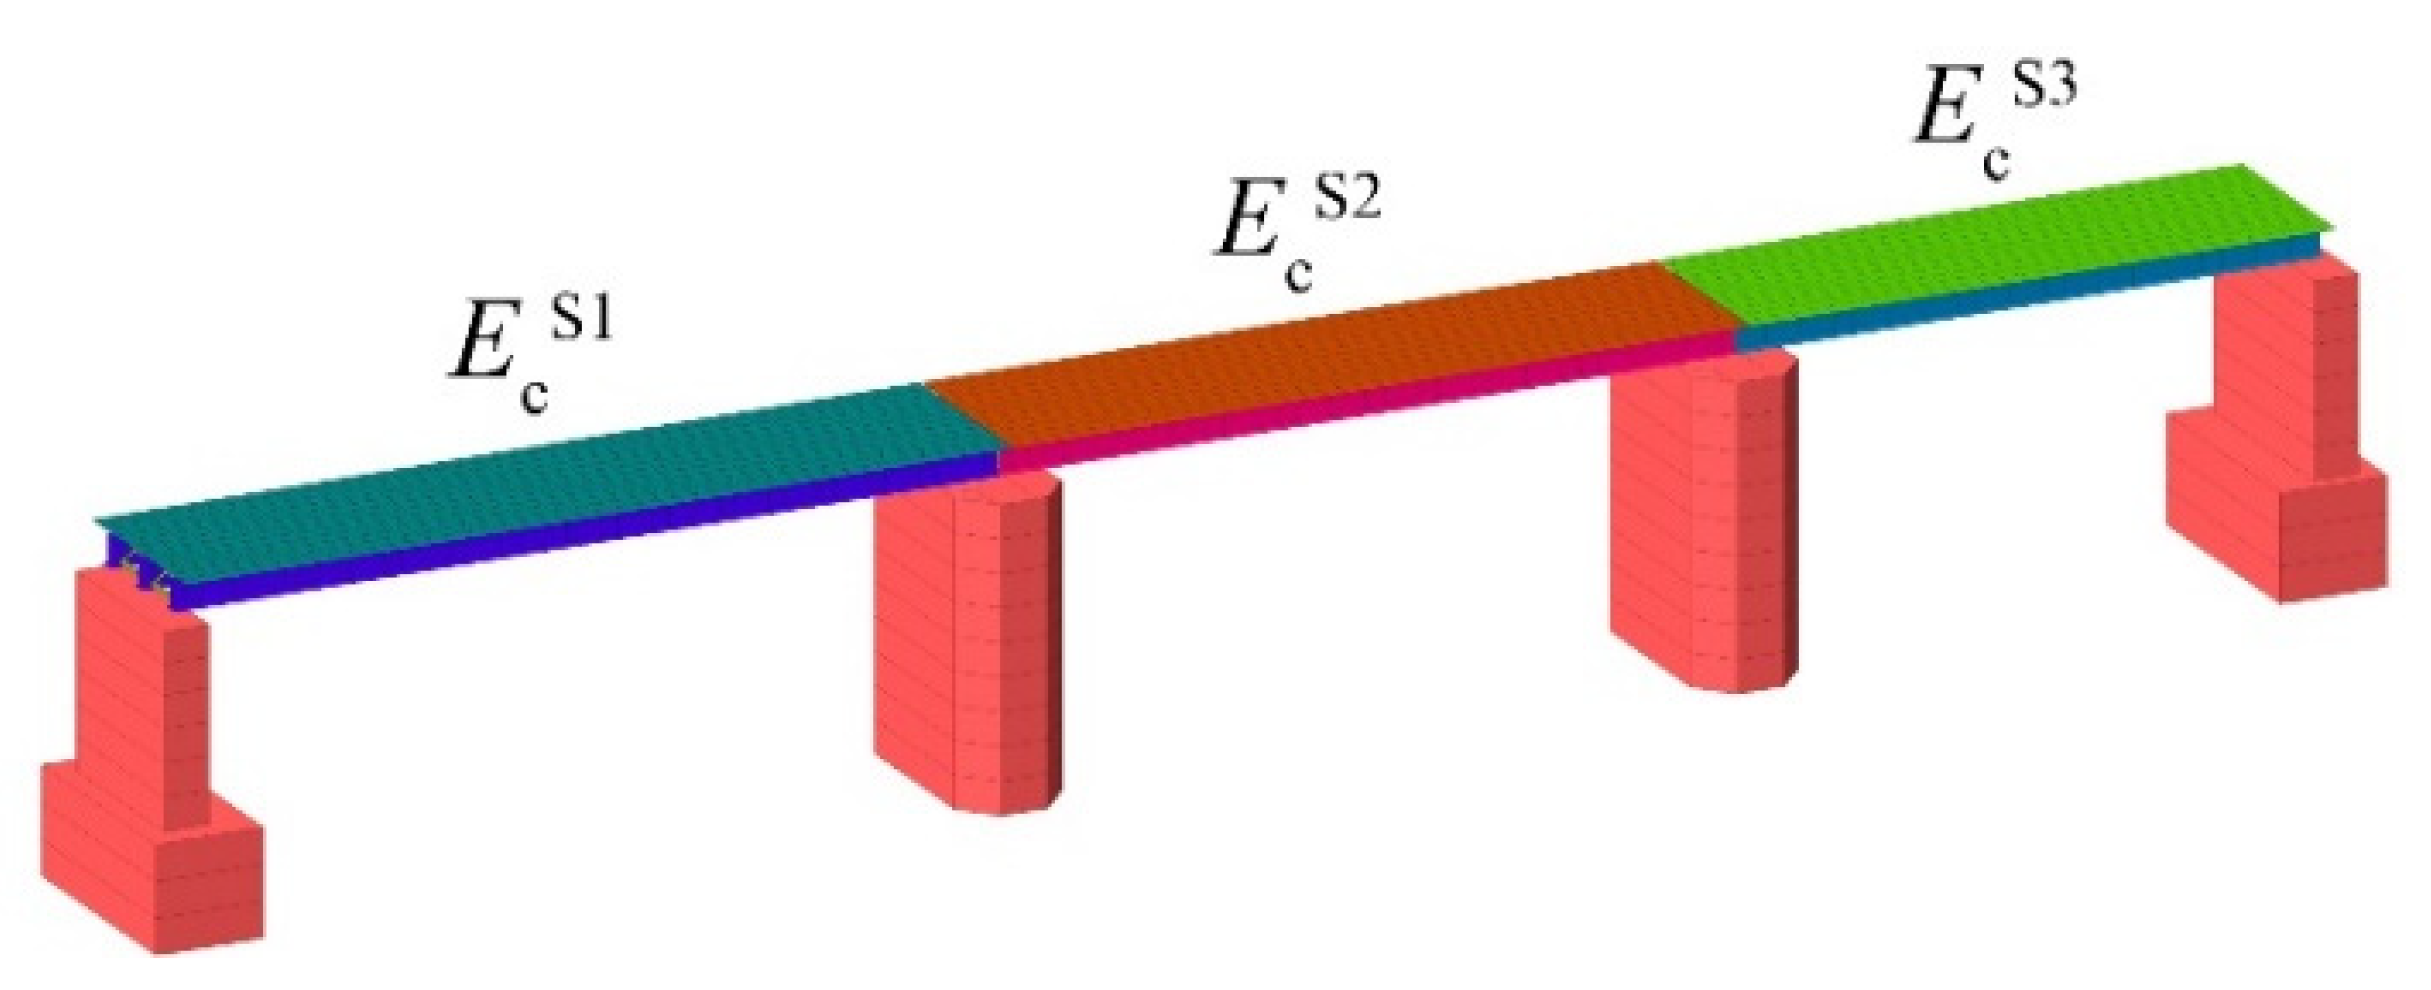
The 3D numerical model of the bridge was carried out with MIDAS software and is shown in
Figure 11 and it is carried out with MIDAS software. The three main girders, the bracings elements, and the struts were simulated as beam elements with cross-sections taken from the original drawings. Ideal hinges are assumed as connections between bracings and main girders. The concrete slab is modeled through four-noded rectangular shell elements and is connected to the steel beams with rigid links allowing vertical rotation. It is worth noting that the modelling strategy is consistent with other known examples (see [
36,
37]).
Moreover, the following assumptions are made in the bridge numerical model: (a) the soil–structure interaction is neglected, (b) all the materials are isotropic with constant mass density (γs = 7850 kg/m3; γc = 2400 kg/m3) and Poisson’s ratio (νs = 0.3; νc = 0.2), (c) the concrete slab is assumed to have a thickness equal to 0.18 m as indicated in the original blueprints, and (d) concerning the non-structural loads (i.e., asphalt and curbs), a mass per unit area of 200 kg/m2 is applied to the concrete slab.
In order to obtain a regular distribution of mass, a consistent description of geometrical features, and to avoid frequency sensitivity to mesh size, a relatively large number of elements were used. In total, the numerical model consisted of 816 elements, 6441 nodes, and an average mesh size of 0.7 m, as shown in
Figure 11.
With the aim to choose the structural parameters to be updated, the following considerations were made in order to avoid the ill-conditioning of the inverse problem and to improve the robustness of updating parameter estimations: (i) consider a smaller number of updating variables than experimental parameters; (ii) update only the structural parameters affected by uncertainties; and (iii) avoid low-sensitivity structural parameters by checking the sensitivity of natural frequencies to the selected parameters.
An initial base model was carried out to test the similarity between experimental and numerical responses. The steel and concrete elastic moduli were firstly assumed equal to 205 GPa and 32 GPa, respectively.
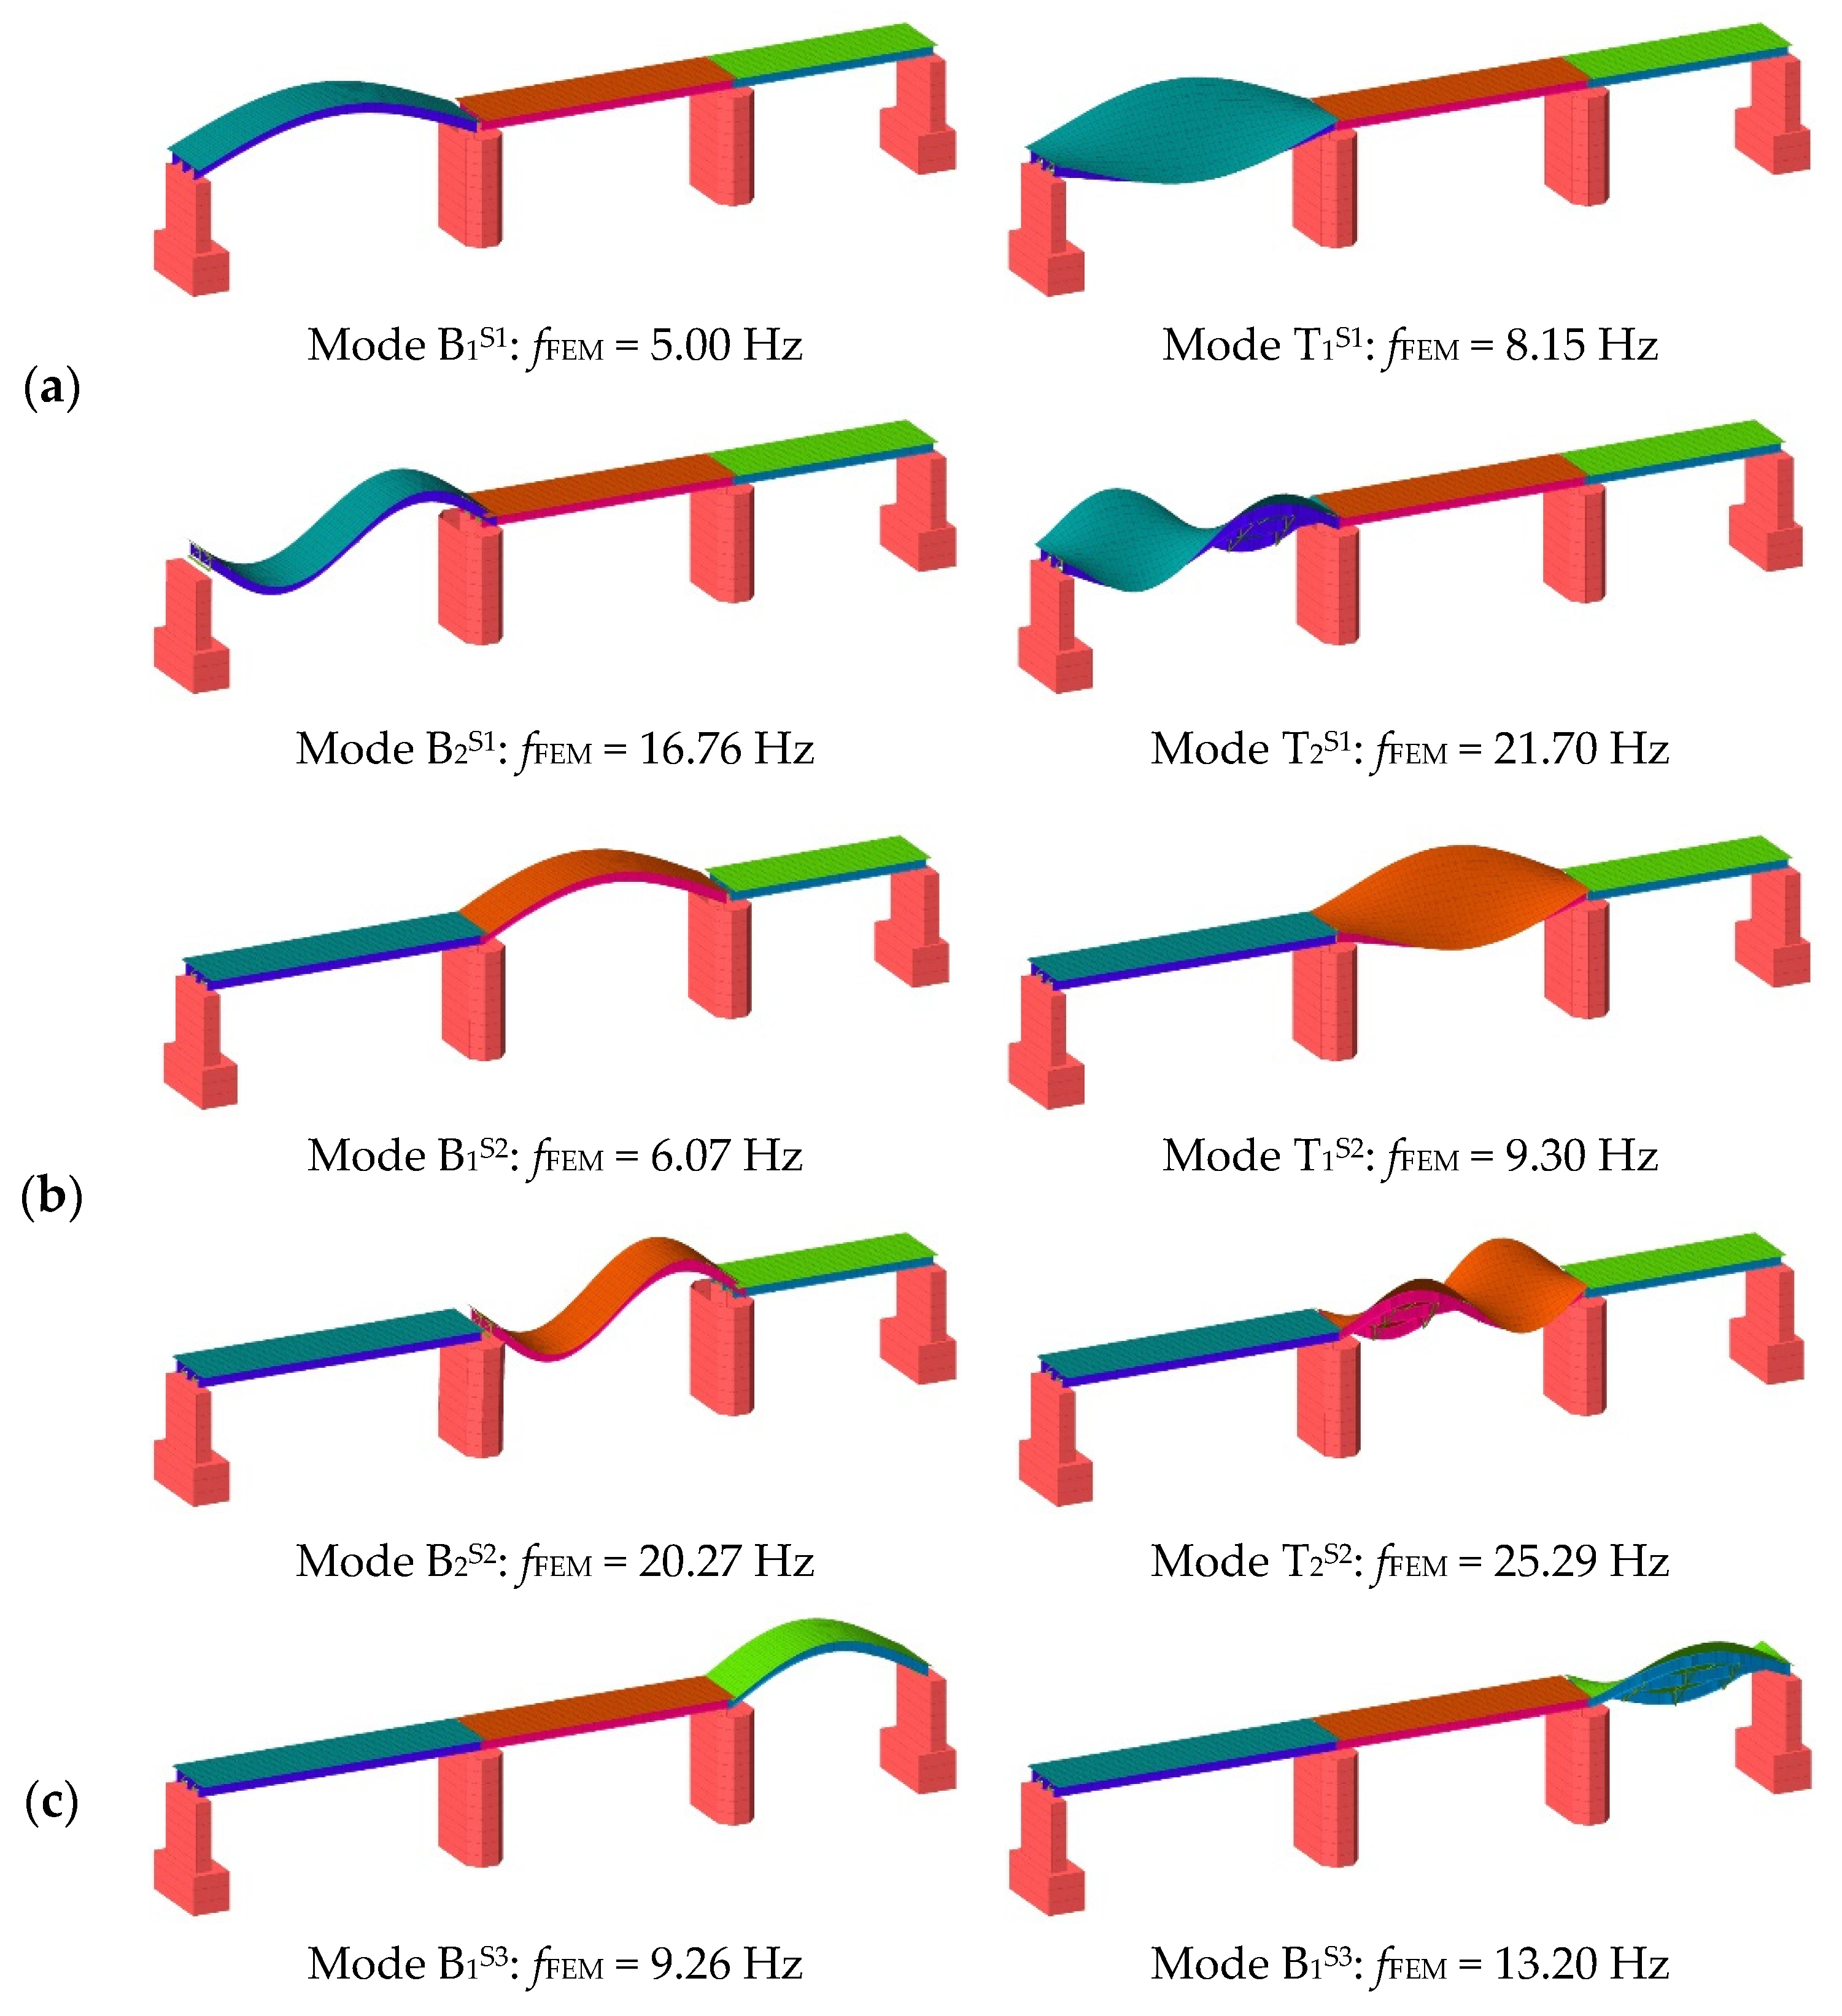
Table 3 lists the results in term of natural frequencies (measured during July 2020) and numerical modes: the sequence of vibration modes corresponds to those observed, while the frequency discrepancy (DF =
fFEM/
fFDD − 1) between experimental (
fFDD) and numerical values (
fFEM) exhibits an acceptable match, with the major difference being 7% for the first bending mode of the first span.
A manual tuning procedure was carried out to reduce the differences between numerical and experimental frequencies. In this context, the elastic modulus of the concrete deck (Ec) was considered as a structural parameter to be adjusted, as it was the component for which there is the most uncertainty. The elastic modulus of the three spans were considered separately, for a total of three parameters adjusted.
The manual tuning procedure consisted in variation of the selected parameters within a constrained range until a minimum in the average discrepancy function (
DFave) was reached. For the first span (S1) the best solution was obtained with E
c equal to 35 GPa, while for the other two spans (S2 and S3), the minimum was obtained with E
c equal to 31 GPa. As shown in
Table 3 and
Figure 12, correlation with experimental natural frequencies increased, providing preliminary validation of the numerical model with discrete accuracy.
6. Repeated Dynamic Testing
After the investigation performed in July 2020, the results of which were discussed above, three other field tests were conducted in November 2020, March 2021, and July 2021. These three experimental campaigns were performed by means of 2 g triaxial MEMS accelerometers with a bandwidth ranging from 0 to 1 kHz, exploiting a wireless sensor network. This system, featuring a communication range that extended up to 400 m, remarkably eased measuring. In fact, once radio frequency (RF) communication between the base station (through its antenna) and the sensor nodes is properly established, acquisition can be started from the user’s laptop by means of dedicated software; during the entire acquisition, the base station oversees node-to-node synchronization. Given the order of magnitude of the measured frequencies, the dynamic response of each of the three spans of the bridge was continuously acquired with a sampling frequency of 128 Hz, which is indeed sufficiently higher than the double of the second torsional frequency of span S2. Therefore, it was enough for proper signal acquisition in the frequency range of interest for modal identification.
The investigation was then repeated at different times of the year in order to evaluate the effect of temperature on modal parameters. The results, in terms of identified natural frequencies, are shown in
Table 4: span S2 exemplifies the overall behavior of the structure. It should be noted that the number of tests per year has been selected to include the higher temperature variations and identify the modal parameters in different environmental conditions.
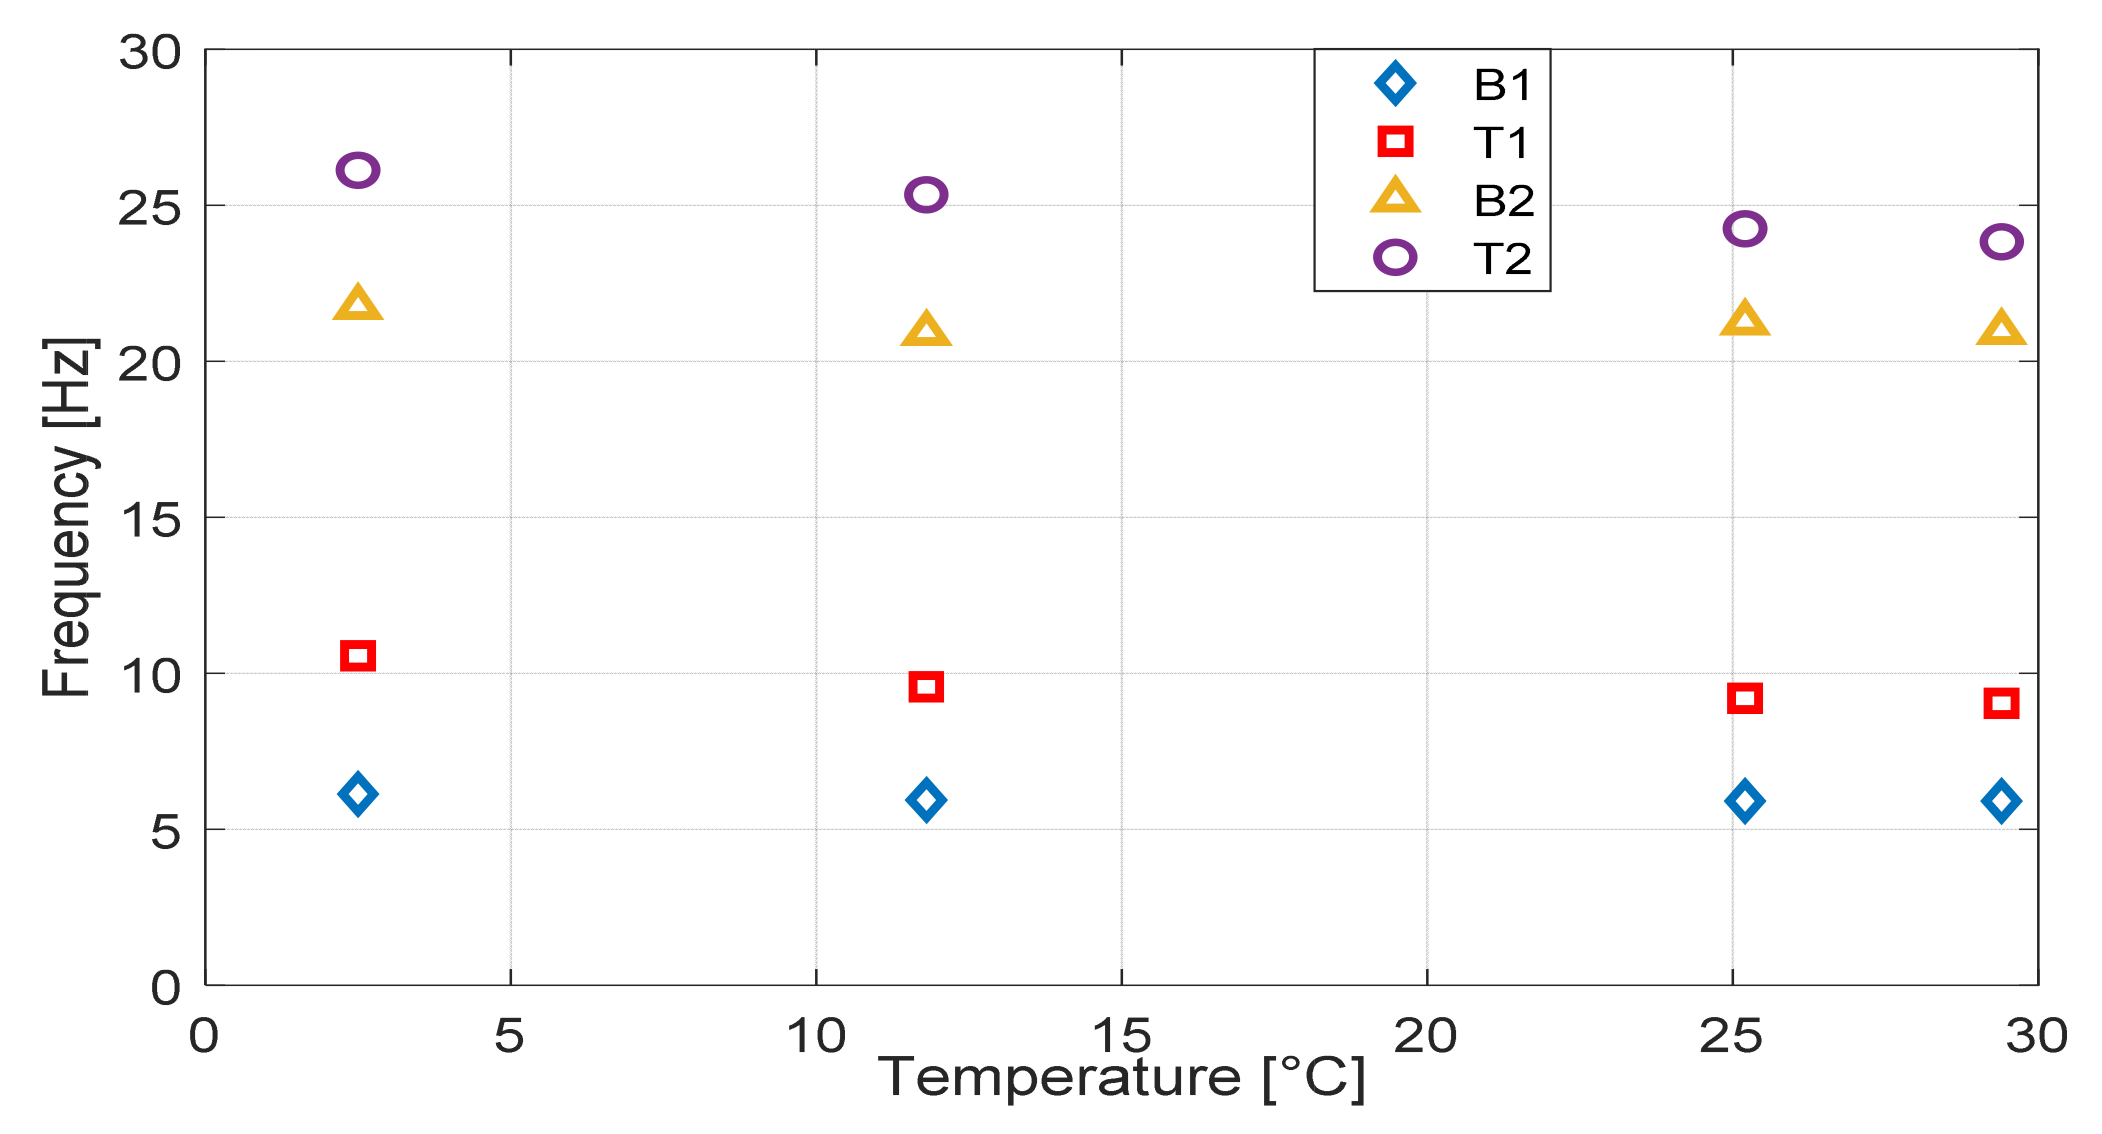
The evaluation of temperature effects on natural frequencies is crucial when dealing with repeated dynamic testing or continuous dynamic monitoring (see [
16,
17]). As shown in
Figure 13, which refers to span S2, changes can be observed for the first two torsional and bending mode frequencies (collected in
Table 4). In fact, as temperature increases, the natural frequencies of the central bridge span tend to decrease: changes in frequency up to 15% were observed due to the effects of temperature. The freeze–thaw process [
38], which is particularly severe for wet concrete bridges when the temperature approaches the freezing point, explains why the highest frequency values were observed at the coldest temperature: close to 0 °C. Water droplets seep into concrete slab pores, and when the temperature gets close to the freezing point, they tend to expand, causing global stiffening of the structure, thus increasing the structure’s natural frequencies. On the other hand, as the temperature increases, the natural frequencies decrease due to softening as a result of temperature changes to the bridge [
39]. The experimental tests presented represent the first step in defining frequency–temperature correlation; in subsequent years, the relationship between modal parameters and environmental parameters will be detailed through exploitation of new data.
7. Conclusions
Scour, hydrodynamic loads, and debris accumulation have been largely studied in the hydraulic engineering community (see [
1,
2,
3,
4,
7,
8,
9,
10,
11,
12,
13,
14]); however, in practice, there is still the need for simplified procedures to perform structural evaluation of existing river bridges. In this study, a multidisciplinary approach integrating structural and hydraulic investigations is proposed to assess the structural safety of bridges with traditional mechanical bearings. Accordingly, the proposed approach is based on the following steps: (i) on-site inspections and document research; (ii) hydraulic investigations; (iii) simplified evaluation of structural safety with respect to hydraulic actions using the proposed HSF; (iv) dynamic testing and FE modelling; and (v) repeated dynamic testing to assess the state of preservation of the structure.
In summary, the overall results of the methodology show (1) a relatively fast procedure that can be applied by practitioners to perform structural verifications of river bridges with traditional mechanical bearing, and (2) an investigation method to evaluate temperature–frequency correlation as a reference for future inspections. Regarding the specific results on the 50-year-old Baghetto Bridge, the following conclusions can be drawn:
Simplified structural verifications were carried out considering slab lift and anchor bolt drag under different hydraulic scenarios: the results are summarized in
Table 5 in terms of the proposed HSF. In the case of undamaged anchor bolts, no critical conditions were found; however, in the worst case scenario in which some of the anchor bolts are damaged or there is concrete cracking at the interface between the anchor bolts and the pier, some criticalities may occur as a result of shear forces related to 200- and 500-year events (hydraulic scenarios no. 3 and no. 5, respectively).
During the AVT, performed with the bridge fully open to traffic, 10 vertical vibration modes (four modes for spans 1–2 and 2 for span 3) were identified in the frequency range of 0–26 Hz.
The natural frequencies identified allowed for manual tuning of the elastic modulus of the concrete deck—the structural parameter with the highest uncertainty—obtaining a preliminary calibration of the model (DFave = 3.07%, DFmax = 6.13%).
The AVT were repeated in different seasons, showing remarkable dependence of bridge natural frequencies on temperature. In fact, frequency changes of up to 14.8% for the first torsional mode of the central span were observed with a temperature difference of 27 °C. In particular, the highest frequency values were observed when the temperature was close to the freezing point due to the freeze–thaw effect, while with increasing temperature a decreasing trend of frequencies was observed for the whole ensemble of modes.
To expand the capability of the proposed approach, further investigations on different bearing supports should be performed. In addition, the frequency–temperature correlation of Baghetto Bridge should be improved by exploiting the availability of new data in the coming months.


 ,
, 


