1. Introduction
Nowadays, our social lives and wellbeing, the industrial production of goods and services, and the economy in general, strongly depend on the operating level of several infrastructures and on their mutual interactions. These lifeline infrastructures are usually referred to as “critical infrastructures” (CI hereafter) to highlight their relevance in ensuring the proper function of all kinds of work, control and management activities, and in releasing primary and other services. Among CI, special attention must be given to transport infrastructures such as roads and railways and, therefore, to their major aesthetic features such as bridges and viaducts.
The patrimony of bridges is very large all over the world, and Italy is not an exception. Reinforced concrete, pre-stressed concrete and steel bridges older than 50 years are still in use, as well as masonry arch bridges. They were designed with reference to technical codes that are quite different from the present ones, and therefore consider different travel loads, including, among others, high speed trains, and heavy articulated trucks. Furthermore, most of these bridges were designed without considering seismic event (or only considering seismic actions of a much lower intensity than those assumed to be relevant by the present codes). Thus, preserving these structures and simultaneously guaranteeing their efficiency, durability and reliability is a current challenge. A proper maintenance program is needed to avoid worsening the current condition and to avoid incurring irreversible damage [
1].
The first step towards this is the organization of a suitable data base which should contain all the data and information available for each bridge structure that is related to its original structural design, as-built design, and any structural and non-structural interventions, etc. This information should be complemented and improved by means of experimental tests on materials and structural components, in order to perform a structural evaluation of the health status of the bridge/viaduct [
2].
In Italy, an electronic archive of public structures (AINOP) was established in 2019 [
3]. It is based on the data interoperability that is achieved between different institutions that hold and manage the data of public structures and keep track of their maintenance interventions. An identification code allows the retrieval of the associated information of each structure. AINOP constitutes a “revolution” in the management of public structures which can increase their safety and savings with the continuous monitoring and suitable scheduling of maintenance interventions.
The reduction in maintenance costs is, indeed, a major goal for operators; however, this should not produce, a reduction in the safety level which, in turn, should be further enhanced. Seismic compliance interventions are frequently needed to update the structural actions related to new knowledge on seismic hazards. In this respect, the two present maintenance criteria should be overlooked:
The classic maintenance strategy “on request” which implies a retrofitting intervention only if damage has already occurred;
The cyclic preventive maintenance which is based on a Life Cycle Assessment of the structure and its components in order to define the optimum maintenance period.
A suitable preventive maintenance intervention should be based on the experimental evaluation of the effective structural health status [
4,
5,
6]. This can be achieved by means of continuous monitoring, allowing a rolling check of the health status of the bridge and its components or, alternatively, by periodic tests on its structure and materials. Obviously, any intervention should be made based on the effective level of damage. The importance of the structural health monitoring (SHM) for the Maintenance and Management of bridges, as well as for their Life-Cycle Design has often been emphasized. Furthermore, SHM can be viewed as a higher-level inspection in the evaluation of structures [
7].
Previous works have been referring to an experimental vibration analysis for the evaluation of the resonance frequencies and modal shapes in a reliability assessment or damage detection [
8,
9,
10,
11,
12], or for the evaluation of the effects of particular loads, such as high-speed train passages [
13].
Seismic monitoring systems have been used for the structural modification assessment or analysis of structural behaviour under seismic events [
14,
15,
16]. For this purpose, the optimization of sensor deployment is a fundamental issue. Obviously, in order to minimize the number of sensors, a suitable choice of the parameter to be measured is needed [
17,
18]. Recently, low-cost monitoring strategies were developed [
19].
The present work aims at defining a methodological strategy (and describing the technological systems that were built to realize this strategy), allowing a continuous analysis of the state-of-risk of bridges for both road and railway transport networks. Other than assessing the current status of an infrastructure, this strategy foresees its continuous monitoring (through pervasive—albeit not invasive—sensors) and the continuous mapping of its damage probability with respect to the multitude of hazards it is subject to. The strategy is organized in three steps. These are not mandatorily consequential but are related to different levels of knowledge of the structure, in order to reach an appropriate reliability level and prediction accuracy, as detailed in
Section 2 and
Section 3.
The impact of natural events can be either sudden and direct, or it can increase in time, thus, slowly, but irreversibly reducing the safety of an infrastructure. The continuous monitoring can be performed either by field sensors or by remote sensing; the latter, such as the analysis of satellite images is relevant for detecting slow movements of both the infrastructure itself and the surrounding ground.
This paper focuses on the seismic risk. Currently, the first level assessment is carried out through the analysis of fragility curves. This approach is based on cold data and is derived from the statistics of previously studied cases, but not on the actual health status of the specific infrastructure.
This paper proposes an approach that, in compliance with the Italian LG2020, is based on census and inspection; that is, on the survey and analysis of the actual conservation status of the bridge. It considers the intrinsic characteristics of the structural type and dimensions of the bridge and, therefore, of its intrinsic vulnerability, but also of any defects present. It is therefore an evaluation of the bridge’s actual current health status and not just a presumed estimate based on a statistical basis.
Such a study (extended to all the bridges of a region or even to the whole national territory) would allow—without excessive effort in terms of both time and money—a suitable knowledge of the actual health status of the infrastructures and not a simple estimation based on cold parameters. Such knowledge would be closer to reality and more suitable for the purpose of defining a reliable priority scale at the first step.
The use of a webGIS Decision Support System (DDS) CIPCast is proposed for real-time monitoring; continuous alerting; and the simulation of synthetic scenarios that can support a “what if” analysis; and, therefore, for the planning of preparedness and mitigation strategies such as the design of educated emergency plans [
20,
21]. A detailed description of CIPCast is given in
Section 6.
The proposed approach is used for a notable case study: the evaluation of the cable-stayed bridge, Indiano, in Florence.
2. The Approach on Three Levels for the Seismic Risk Analysis
The reliability of a seismic risk analysis depends on the level of knowledge available for the structure and the hazard severity at the site.
The seismic hazard is usually described by hazard maps, which are produced by means of a probabilistic approach and refer to a rigid soil [
22]; these are integrated with the seismic microzoning or even local seismic response studies to account for the amplification due to the soil characteristics.
Simplified assessments of structures are usually based on fragility curves [
23], which represent the probability of exceeding a predefined damage state (DS) as a function of an engineering demand parameter, expressed as peak ground acceleration (
PGA), spectral acceleration (
Sa) or spectral displacement (
Sd). The simplest way to define a fragility curve is through empirical methods (analytic methods require the use of too much information). This was achieved in the framework of the RISK-UE project [
24], in which empirical data were collected and analysed after different seismic events. Fifteen categories of bridges are defined based on the following parameters: material, column bent type, and span continuity and design (conventional or seismic). Four different damage states are considered: minor damage (D1), moderate damage (D2), extensive damage (D3), and complete damage (D4). For each category, the probability of exceedance of any damage state is defined based on the number of spans; the skew angle, i.e., the angle between the principal axis of minimum inertia of the pier and a line normal to roadway centreline; and the spectral amplitude
Sa at
T = 1 s for the considered earthquake. For the purpose of this paper, consider the Ultimate Limit State (ULS) which can be associated to D4, and suppose to fix its probability of exceedance. The ratio between the value of the
PGAC (or
SaC) inducing this limit state and the actual
PGAeff (or
Sa,eff at bridge resonance period) of the earthquake in question can be assumed as a key performance indicator (
KPI) for the considered limit state.
Other recent proposals came from the European Collaborative Research Project, “Systemic Seismic Vulnerability and Risk Analysis for Buildings, Lifeline Networks and Infrastructures Safety Gain” (SYNER-G) [
25]; and the Horizon 2020-supported programme, “Seismology and Earthquake Engineering Research Infrastructure Alliance for Europe” (SERA) [
26].
Currently, a risk analysis can be performed at three different levels, depending on the data available, and providing increasing reliability and prediction accuracy [
27]. The three levels of analysis that are proposed and discussed in this paper can be summarized as follows:
L1: Simplified estimation based on the definition of class of attention (CA), according to the Italian Guidelines for bridges and viaducts (LG2020) [
28]; this step should be performed for all bridges;
L2: Prediction of the seismic behaviour through numerical modelling; this level can be considered when a suitable mathematical model can be set up;
L3: Structural health monitoring (SHM), which is recommended when a permanent monitoring network is active on the bridge.
The three steps are not mandatorily consequential but are related to different levels of knowledge of the structure so that an appropriate reliability level and prediction accuracy can be reached. In the case of little available data (i.e., just for level L1, the complete path from L1 to L3 is recommended), this would allow the optimization of the resources, because the analyses of L2 and L3 can be defined based on the results of L1.
3. Level 1: Simplified Estimation Based on the Class of Attention
As an alternative to the fragility curves approach, a first level of assessment can be based on the definition of the seismic class of attention (CA) that is proposed in the Italian Guidelines for bridges and viaducts (LG2020) [
28]. Five risk classes are considered in LG2020, namely: high (H), medium-high (MH), medium (M), medium-low (ML), and low (L), which correspond to the different risk levels of the structures in their present state. The definition of the seismic CA considers the main parameters that influence the response of bridges and their road networks to the seismic actions. The class depends on the hazard, and the vulnerability and exposure, determined through the combination of primary and secondary parameters. In detail, the approach is based on the use of logical operators and, starting from the classification of primary and secondary parameters, arrives to the classification of the hazard, vulnerability and exposure factors and, finally, the determination of the seismic attention class. Unlike the fragility curves method, the seismic CA approach is not probabilistic and requires the assessment of the defects that are present in the infrastructure in its current state.
The evaluation of the hazard factor is based on the peak ground acceleration on rigid soil a
g with an exceedance probability of 10% in 50 years, and to the topography category T
i [
29,
30], according to
Table 1. A passage to the higher class is made for subsoil types C, D or E [
29,
30].
The classification for the vulnerability starts from the primary parameters (
Table 2). In case of the presence of further seismic vulnerability parameters (skewed or curved decks, single-column piles or those with very different height, the presence of supports that are subject to deterioration, etc.) the vulnerability class increases by one level. The primary vulnerability class also increases by one level if the bridge was design without seismic criteria.
The level of defects (i.e., the state of conservation) is estimated by processing the data collected from the visual inspections, in which particular attention must be paid to the elements and construction details that can significantly influence the global seismic behaviour of the bridge (piles, foundation structures, support devices, etc.). The level of defects, always from H to L, is assigned based on the gravity of the defects observed and the importance of the element involved, and also their intensity and extension.
Primary vulnerability class and level of defects are finally combined according to
Table 3.
Finally, the exposure primary level is evaluated based on the Average Daily Traffic (ADT, number of vehicles per day on the entire carriageway) and the average span length L according to
Table 4. The class increases if alternative roads are absent; it also increases based on the importance and the presence of the people in the bypassed area, and in case of the transport of dangerous goods. The class increases further if the bridge is strategic.
In [
28], the classes of hazard, vulnerability and exposure are finally combined to obtain the seismic CA of the bridge.
For the purposes of this study, the evaluation of the hazard and the exposure is performed by referring to the parameter a
g·
S·
F·γ
I, which represents the maximum amplitude of the elastic spectrum (
S = soil and topography amplification factor,
F = structural amplification), and includes the importance factor γ
I which assumes values from 1 (ordinary structures) up to 1.4 for strategic structures [
29]. This assumption is consistent with the procedures used in L2 and L3. Furthermore, an additional class is considered, namely very high class (VH), to individualize the infrastructures with a very high class of hazard and exposure (
Table 5).
Analogously,
Table 3 can be changed in
Table 6 in which a very high class of attention (VH) is considered for the vulnerability.
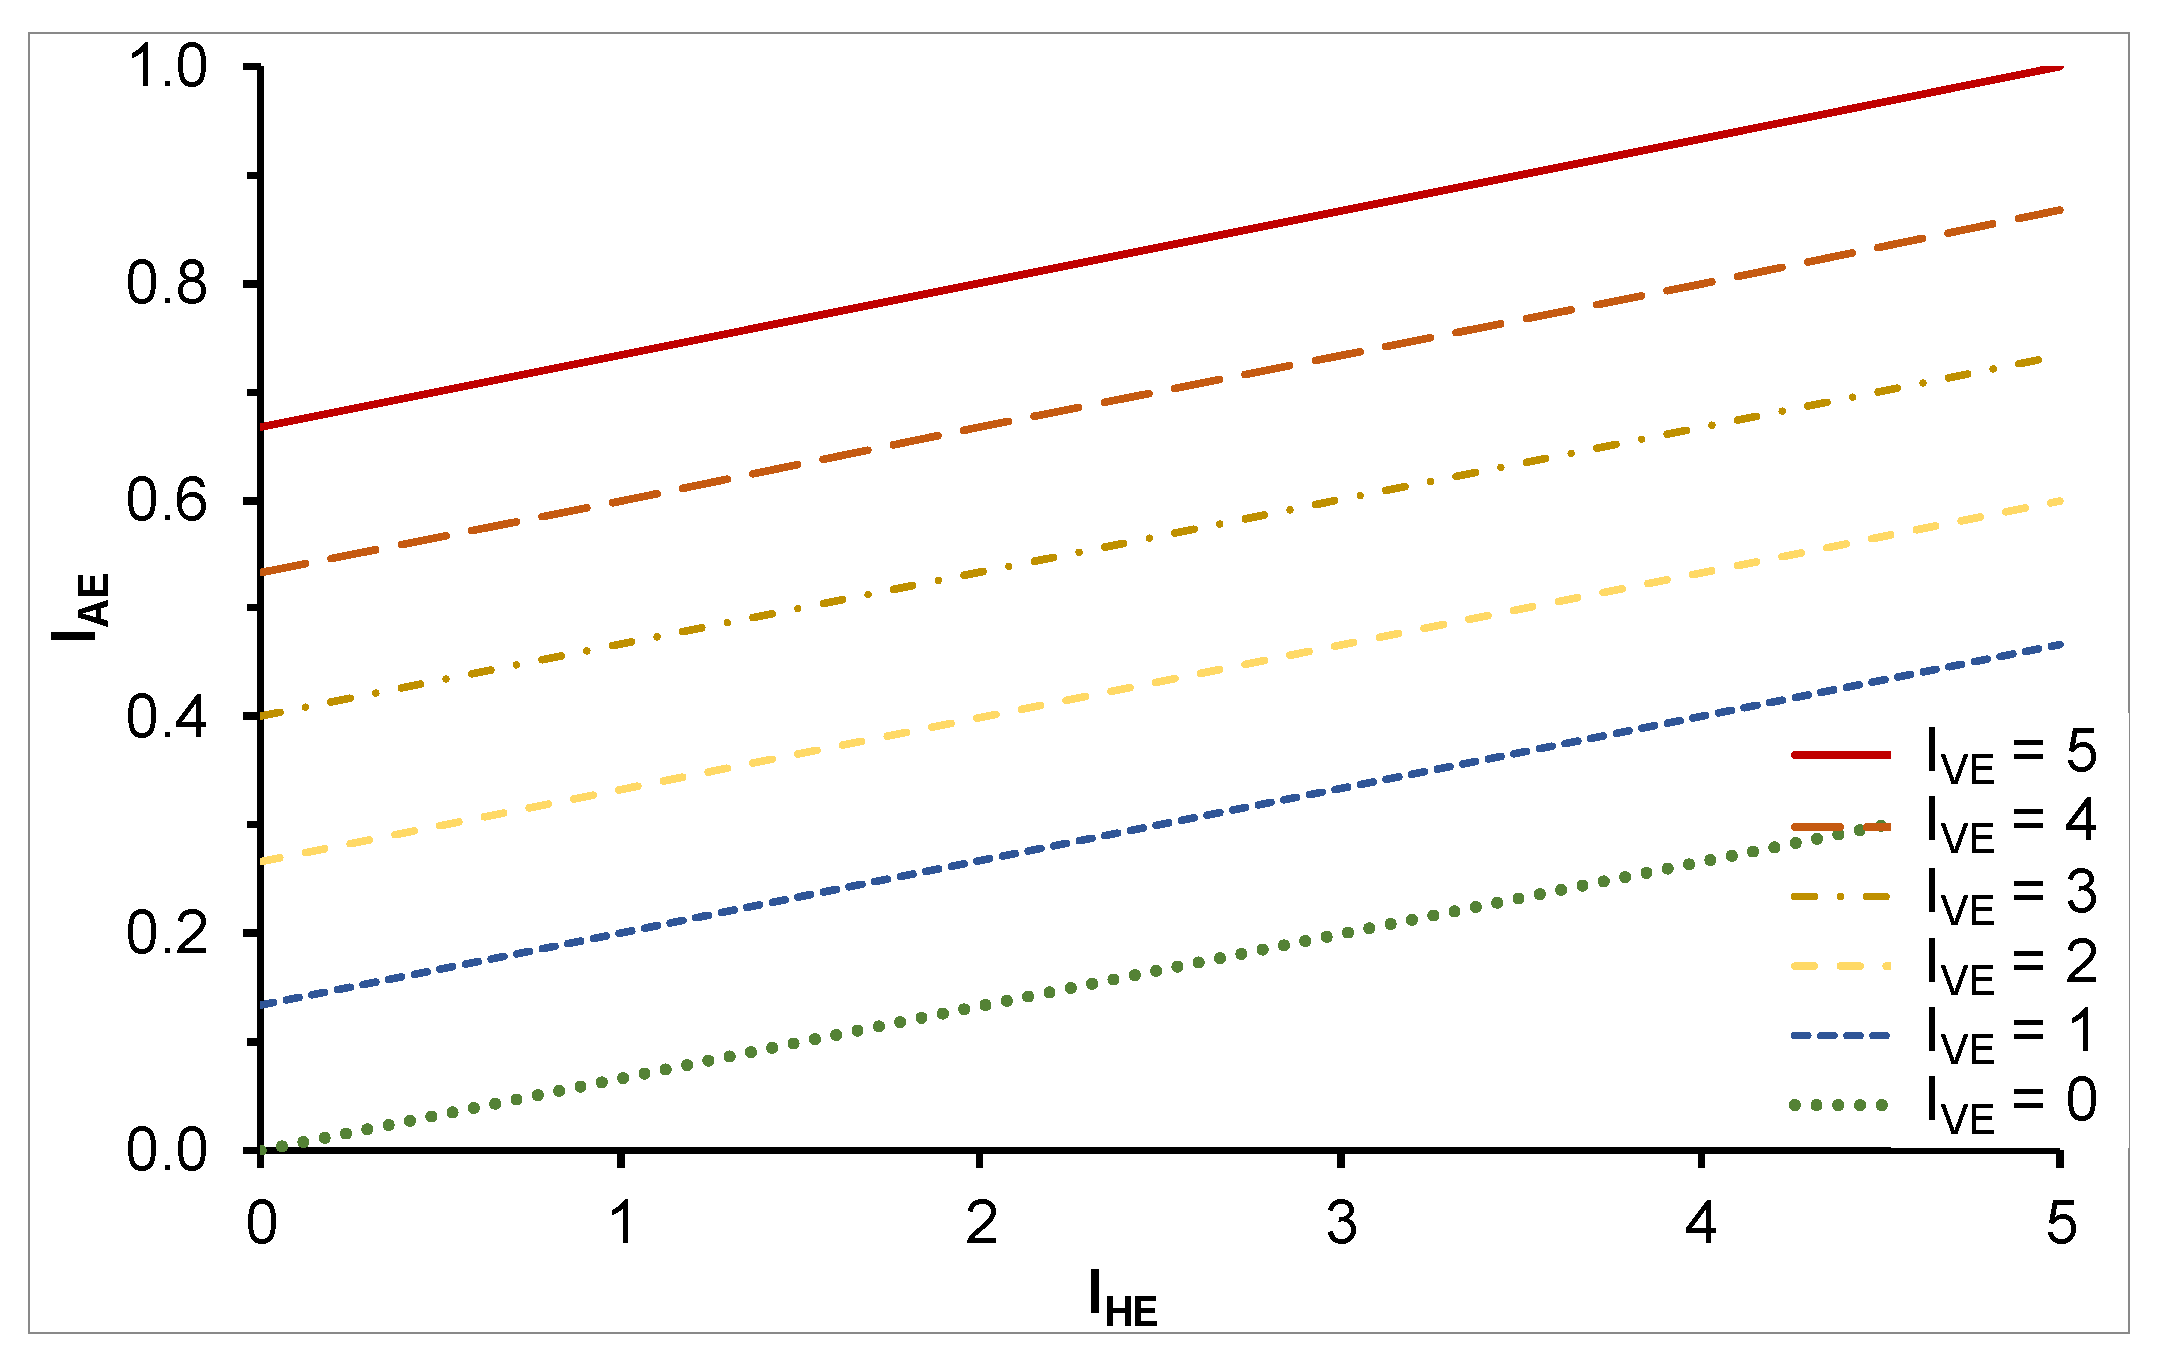
With this assumption, an index can be assigned to each seismic CA that is obtained for the hazard (
IHE, which also accounts for the exposure) and vulnerability (
IVE) classes, respectively. Suitable values for these indexes are proposed in
Table 7. A seismic Index of Attention
IAE can be deduced as a weighted sum that is normalized to the maximum value
:
The weights α allow to assign different relevance to the three indexes. For example, for structural and seismic performance it seems suitable to assign a greater importance to the vulnerability, which also depends on the defects that are observed on the structure. These can change during the lifetime of the structure and strongly influences its behaviour. The calibration of the weights is an important step of the methodology and should be tested on several cases, considering different situations.
If
, which is consistent with the classes assigned in [
26], the values of
IAE are those in
Figure 1, where
IAE is plotted versus
for the different values of
IVE.
The CA approach has been proposed for screening purposes: it is thus useful for prioritizing resource allocation and intervention in mitigation decision-making processes. It is based on the local seismic hazard and on the vulnerability and the exposure of the infrastructure to that hazard. With this purpose, a safety index can be defined according to the Italian technical code [
30]:
The same approach can be used for post-event purposes by considering the value of
IHE corresponding to the actual
PGA recorded at the site during the event in question (see
Table 5) and evaluating the corresponding
IAE,eff in
Figure 1. Then, the
KPIE1 that is relative to the seismic event can be defined as follows:
L1 is based on an approximated analysis, therefore only a general KPI can be defined that is related to the entire structure. Furthermore, KPI is always lower than or at least equal to unity, which is consistent with the objectives of a preliminary assessment.
The approach proposed here that is based on the fragility curve accounts for the same parameters with reference to the seismic hazard. In contrast, the most important difference for the vulnerability is that the fragility curve approach does not consider the defects, the span lengths and critic elements, such as the pier heights and the case of a curved bridge. The exposure is not directly considered by the fragility curve approach but is accounted for when considering a greater seismic hazard, i.e., the peak ground acceleration.
An interesting proposal to improve the fragility curve approach is described in [
31]. The fragility curves were deduced from those of the RISK UE, considering the presence of corroded steel bars and The influence of corrosion on the plastic behaviour of the pier base section was analysed in greater detail. The method enables modification of the average value obtained with the RISK UE as a function of the time elapsed since the construction, or the last interventions, and of a parameter that must be calibrated on the specific bridge. It does not consider the presence of other defects, nor the collapse due to brittle break.
4. Level 2: Prediction Modelling of the Seismic Behaviour
Level 2 assessment requires the set-up of a numerical model that is suitable for the structural design, and/or a detailed geometrical survey that is associated with a comprehensive experimental analysis on the structure and materials that are available. Using a mathematical model, the effects of an increasing seismic action that is applied to the foundations of the abutments and piers can be evaluated. These effects are the displacements at the top of the piers and the girders, the displacements of the sliding bearings, the internal forces in the structure, the forces on the fixed supports, etc. The results can be plotted in diagrams of these engineering capacity parameters as functions of the seismic acceleration at the base (or a spectral amplitude at a fixed period), defining suitable damage levels for each of them and for the structure. The seismic analysis can be performed with a spectrum response analysis, or a time-history or pushover analysis.
The ratio between the seismic capacity of the structure and the design demand for new structures, both expressed in terms of
PGA at its base, is a safety index [
30]:
When an earthquake occurs, the acceleration that is recorded at the base of the structure (the foundation of abutment or pier) or estimated by means of a shaking map can be compared with the above curve and give an estimation of the expected values of the above effects. The shaking maps can be estimated by the deliberate use of a software and by the official national maps when available, usually a few minutes after the event.
For each considered parameter and for the entire structure, a performance index can be defined for each limit state. With reference to the ULS of a parameter
X, it can be defined as the ratio between the capacity value that is obtained from the numerical model
XC and that of the earthquake
Xeff:
The advantage of referring to the single behaviour parameters is apparent. The weak points are clearly identified and the maintenance intervention can be suitably defined. The KPIE2 of the entire structure can be assumed as the minimum.
Both KPIE2 and IE2 can be updated after a new evaluation based on new experimental analyses or after an earthquake.
5. Level 3: Seismic and Structural Health Monitoring
The Level 3 approach requires the presence of a static and/or dynamic monitoring system on the structure; the monitoring system allows for a continuous and real-time measurement of the before mentioned parameters under travelling loads and other loads, such as wind and low energy earthquakes. The continuous analysis of the behaviour under these actions can point out the presence of damage or deterioration and, therefore, the loss of static and seismic capacity.
In this case, a safety index can be defined for Level 2, based on the updated capacity
PGACt at time
t, and the design demand for new structures:
If a seismic monitoring system is available on the bridge, the information about some response parameters is also available and can be compared with those obtained from the numerical analysis with the updated model.
In L3, for each considered parameter and for the entire structure, a performance index can also be defined for each limit state. Analogously to L2, with reference to the ULS and to the parameter
X, a
KPI can be defined as the ratio between the capacity value obtained from the updated numerical model
XC,up and that under the current earthquake
Xeff:
KPIE3 and IE3 can also be updated after a new evaluation based on new experimental analyses or after an earthquake.
6. Data Collection and Managing
Four different risks are considered in the LG2020: structural, seismic, landslide and hydraulic risks. These are combined and a global CA is deduced to obtain a global Index of Attention IA. This is a good way to organize a priority list but, in several cases, some situations of imminent risk may be hidden. Therefore, in our opinion the different risk should always be considered separately.
Furthermore, a similar procedure used for the seismic risk can easily be extended to the other risks, such as landslides and hydraulic risks.
CIPCast-DSS (Critical Infrastructure Protection risk analysis and foreCAST Decision Support Systems) is a WEBGIS-based software whose development was started in the framework of the EU FP7 project, “Critical Infrastructures Preparedness and Resilience Research Network” (CIPRNet) [
20] and continued during other Italian national funded projects such as RoMA (Resilience enhancement of Metropolitan Areas) and RAFAEL (System for Risk Analysis and Forecast for critical infrastructure in the Apennines dorsal regions). CIPCast allows the real-time, 24/7 operational monitoring and risk analysis of built and natural environments, with particular reference to CIs, including bridges and viaducts and their road networks and strategic structures in general. CIPCast DSS is the main tool that can boost the Italian node EISAC.IT of the European Infrastructure Simulation and Analysis Centre (EISAC), a European-wide network of national centres aiming to support the protection and resilience enhancement of CIs.
CIPCast DSS can be applied in the management of roads and highway networks in the decision-making process that occurs after an earthquake event [
21]. The idea is to provide operators of the highway networks with a tool to be used for the management of transport networks in the aftermath of emergencies induced by natural events, including earthquakes. This tool is connected and interfaced with other tools and is deployed by sensors on sites and structures.
A suitable selection of data to be recorded in CIPCast should be gathered. Real time and delayed analyses can be carried out as well as a comparison between data recorded at different times, especially after seismic events.
The analysis of a bridge can be used for an early warning. If the recorded data exceeds the fixed threshold, the traffic can be interrupted on a portion of road (by using traffic lights and the exit just before the bridge which is very simple for Italian highways) and an inspection can be conducted. If no significant damage is pointed out, the bridge can be opened to traffic; otherwise, a more detailed analysis should be carried out, based on experimental tests and numerical evaluations.
Obviously, the time and investigation that are needed depend on the reliability of the data and knowledge of the structure. Data from SHM, if available, are very useful for making a suitable decision based on the effective structural health status of the bridge.
7. A Case Study
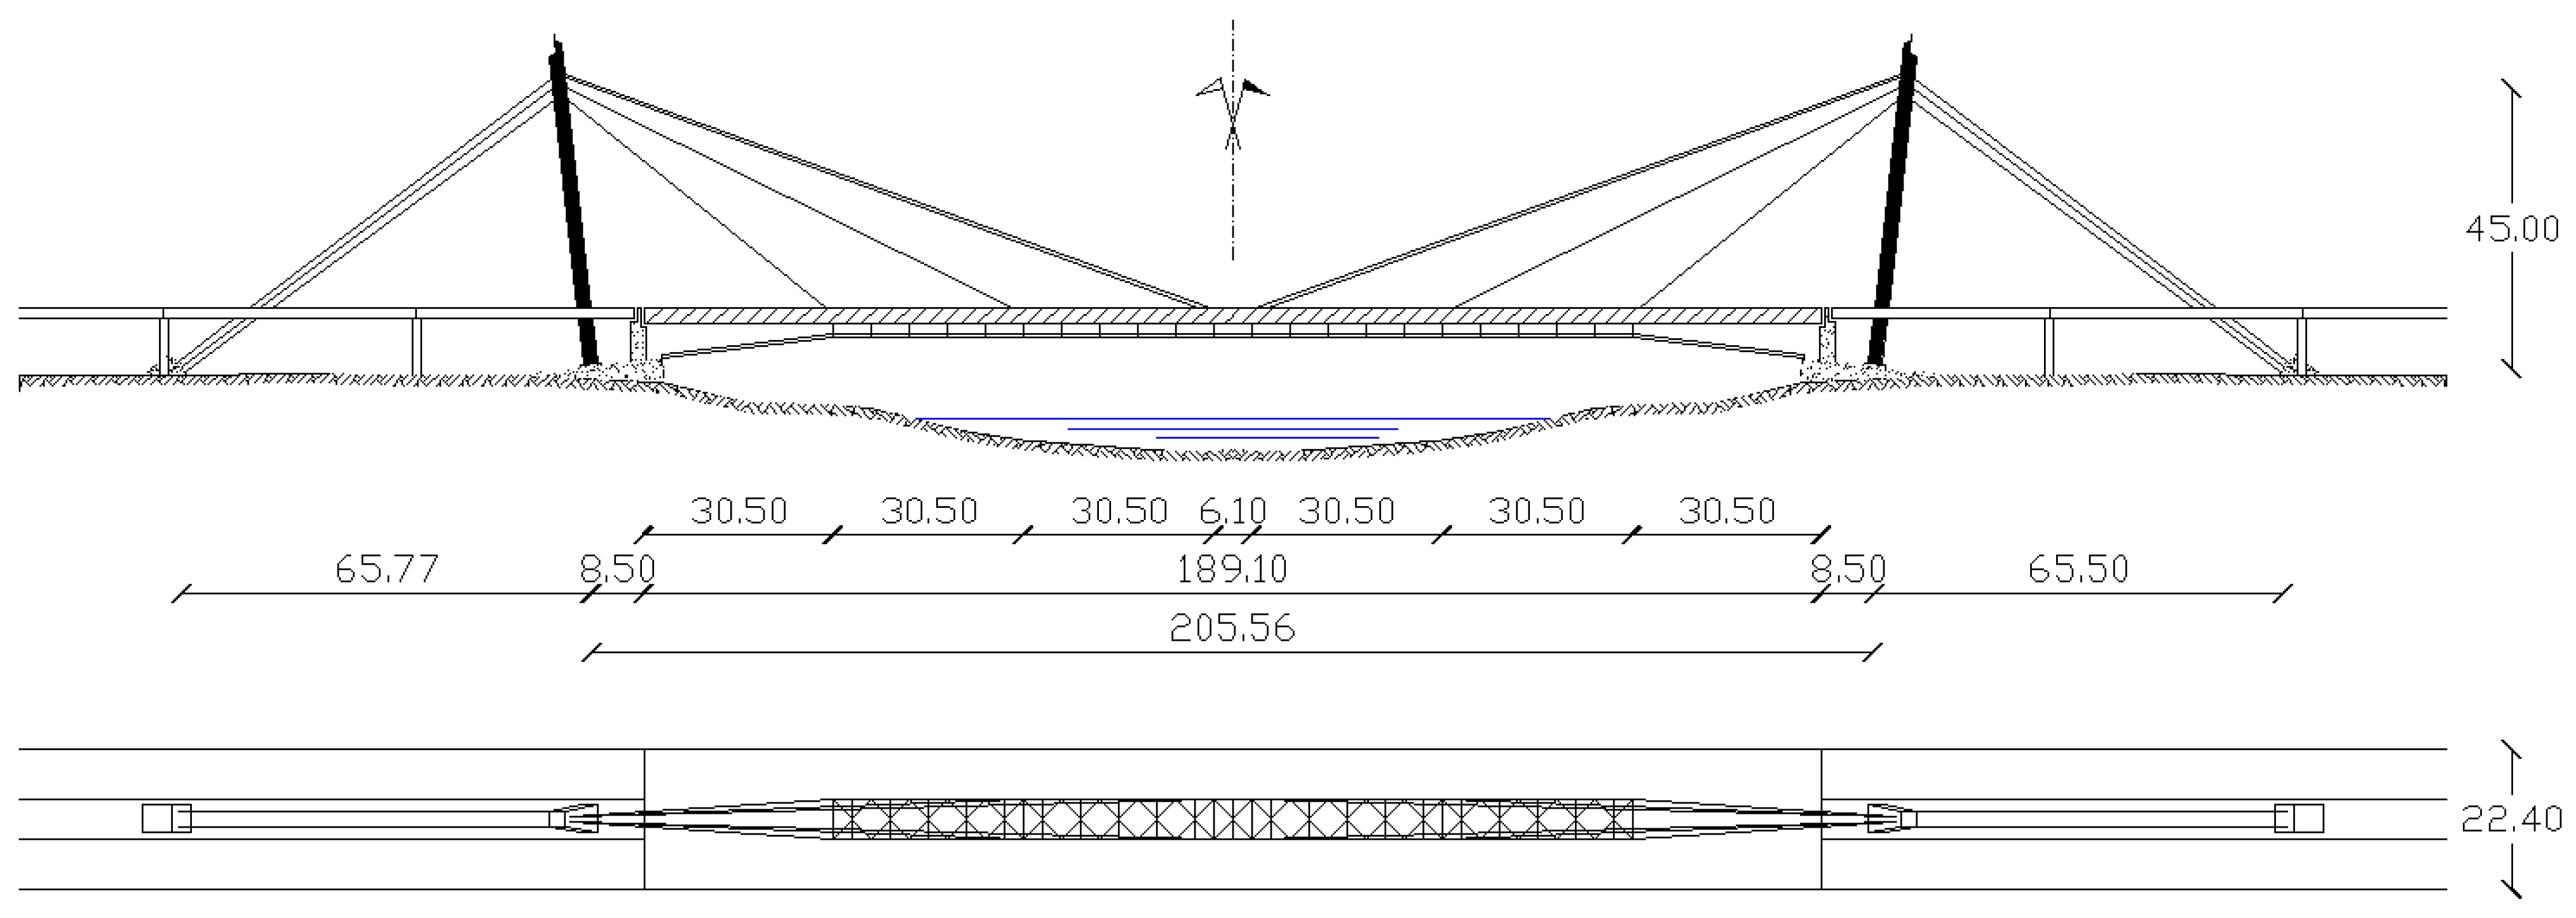
The Indiano Bridge, a cable-stayed bridge over the Arno River in Florence was opened to traffic in 1977. It has a main span of 189.1 m, suspended by two fans, and supported at its ends by two piers by means of sliding supports in the longitudinal direction. The piers are structurally independent of the other parts of the cable-stayed bridge. Each fan is composed of three couples of stays, radiating from the tops of the two steel towers, 55.0 m tall, whose distance at the basement is 206.1 m. The longitudinal section and the plan view with the general dimensions of the bridge are shown in
Figure 2.
The cables from each fan are regularly spread 30.5 m along the deck in the longitudinal direction. The distance between the longest cables of the two fans is 6.1 m. The two stays of each pair are 6.0 m and spaced in the transversal direction. Two earth anchored back stays, each composed of three cables, start from the top of each tower and are constrained to external gravity anchoring 65.5 m from the pylon bases. The two anchorings are linked to the tower foundations by means of a pre-stressed concrete truss. The bridge was designed according to the technical code of the construction time.
7.1. L1: Class of Attention
At the site of the bridge, ag = 0.131 g and F = 2.403 for P50 = 10%. The topography category and soil type are T1 and C (S = 1.5), respectively, while γI = 1.4. Therefore, it is ag·S·F·γI = 0.661 g and the hazard class of attention is MH (IHE = 3).
Assuming a single long span steel bridge, the primary vulnerability is classified as ML due to the non-seismic design. The level of defects being L, the CA for the seismic vulnerability is ML (IVE = 1).
From Equation (1) the seismic index of attention can be deduced as IAE = 0.33 and the safety index as .
Three different values of the seismic actions were considered, relative to an exceedance probability of 10%, 5% and 2% in 50 years, respectively. The corresponding values of I
HE are 3 (MH), 3 (MH) and 4 (H), respectively. The values of
IAE and
KPIE1 are reported in
Table 8.
7.2. L2: Numerical Modelling
A finite element model of the bridge was developed based on the original structural design (obtained via the Technical Office of the City Hall in Florence) and the results of an experimental dynamic analysis under ambience and traffic [
12]. The main features are as follows:
The towers, modelled with steel beam elements, are fully constrained at their basements;
The girder, modelled with steel beam elements, is simply supported and longitudinal displacements are allowed at its ends;
Rigid links have been offset both from the girder and the towers, in order to accommodate correctly the cable attachments;
Cables have been modelled as truss elements. The reduction in their axial stiffness, due to the sag, was accounted for assuming reduced Young’s modules [
32].
In
Table 9, the resonance frequencies obtained from the numerical model are compared with those from the experimental analysis, demonstrating a good agreement.
The effects due to the static and seismic loadings were analysed by means of the numerical model. Actions were evaluated according to the present Italian Technical Code, considering the three components. In
Table 10, the values of the main effects due to permanent, variable (traffic, breaking longitudinal force and wind) and seismic actions are reported. Three different values of the seismic actions were considered, relative to an exceedance probability of 10%, 5% and 2% in 50 years, respectively.
For the purpose of the present work, it is assumed that the bridge was designed so that the capacities are exactly equal to the static demand at the ULS. Thus, the ratios between the internal forces under seismic actions and those at the static ULS directly give the
KPI for each parameter (
Table 11).
The results indicated the good performance of the bridge in the case of an earthquake. KPIs are less than unity only for the bending moments around the vertical axis of the girder cross section. Obviously, the results are affected by the hypothesis regarding the design capacities. It is important to point out that the technical code at the time of construction was very different from the present one, both in terms of loads and analysis.
7.3. Monitoring System
The Indiano bridge was instrumented and tested once. In order to improve the information on the structural health status of the bridge and to plan a suitable maintenance program, a permanent network for static and dynamic monitoring should be installed.
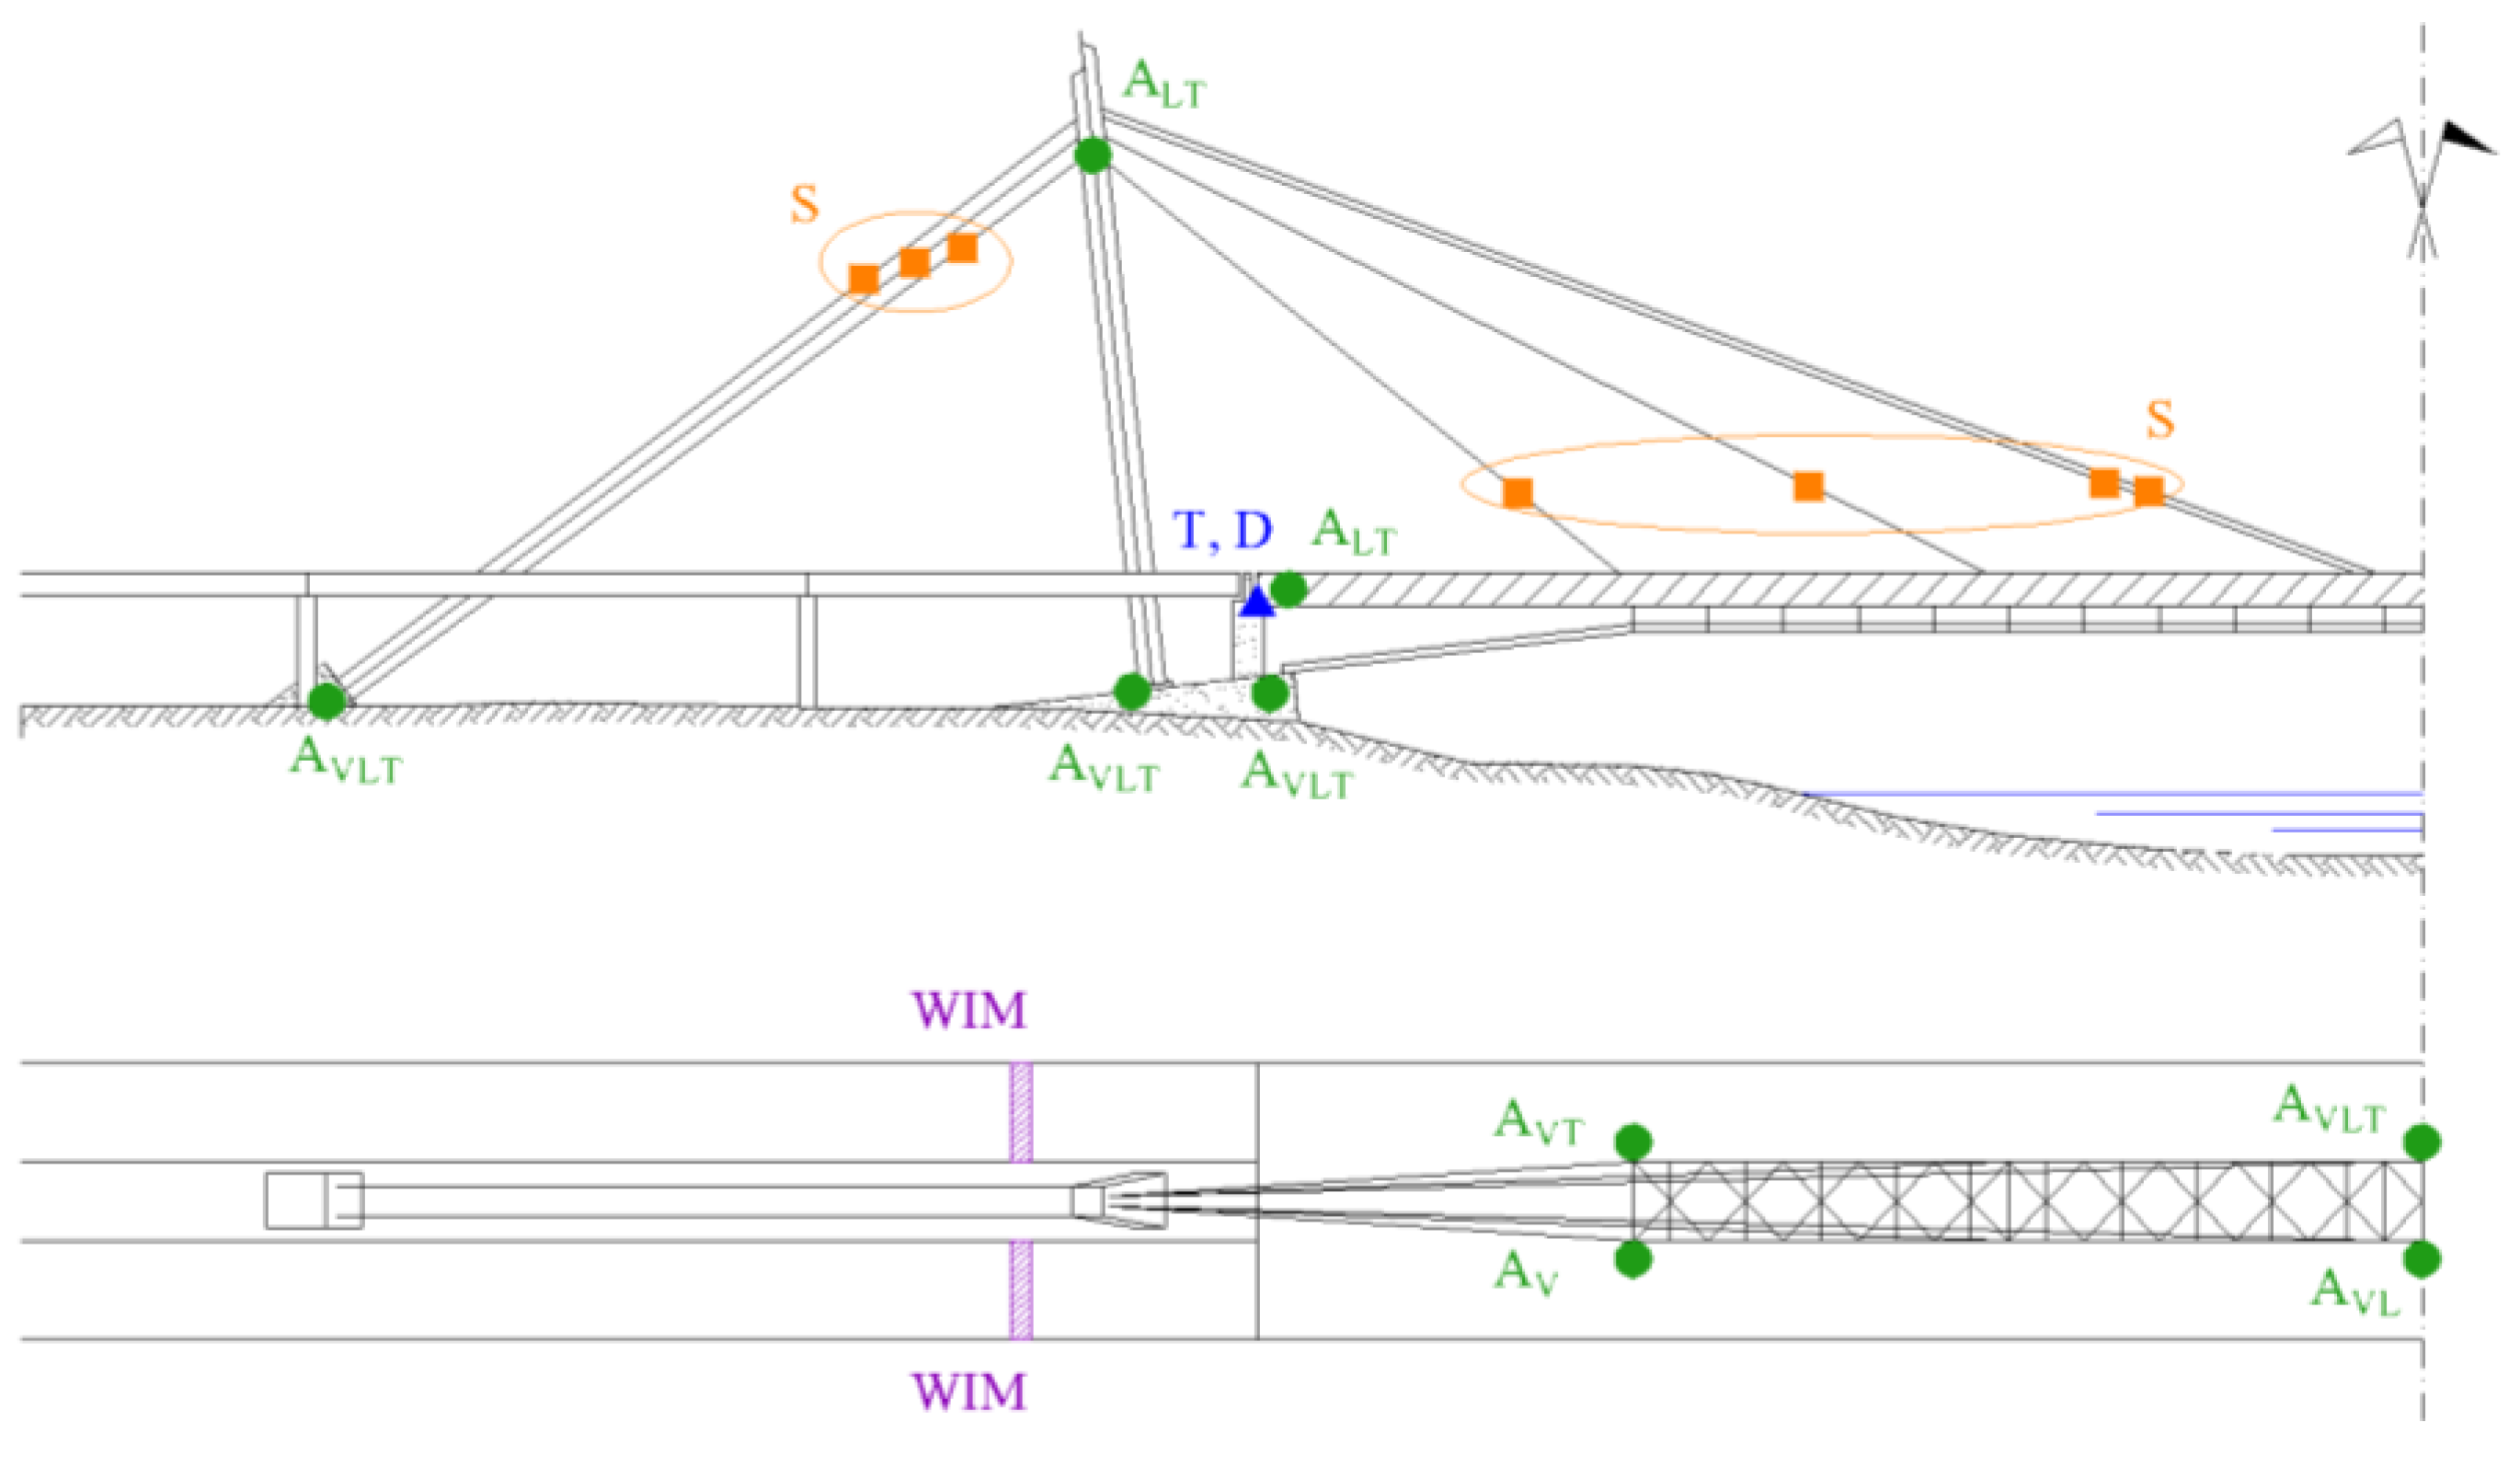
According to the most recent developments, a suitable list of sensors to be installed should comprise (
Figure 3):
Three-axial acceleration sensors at the base of the towers, piers and anchoring of cables, in order to calculate the seismic input in case of earthquake;
Bi-axial acceleration sensors at the top of the towers and piers, in longitudinal and transversal directions;
Acceleration sensors in the vertical direction at least at three sections along the girder (mid and quarters) at both sides of the sections, in order to analyse the torsion modes; acceleration sensors in longitudinal and transversal directions on the girder;
Acceleration sensors and strain gauges on the cables;
Rotation sensors at the section on the bearings;
Relative displacement sensors at the sliding bearings;
Weight-in-motion system at the approach viaduct to the bridge.
Figure 3.
Proposed monitoring system, where: A (green circle) stands for accelerometers and the subscripts V, L and T represent the vertical, longitudinal and transversal direction of the sensor, respectively; S (orange square) represents the accelerometers and the strain gauges placed on the cables; T and D (blue triangle) stand, respectively for tiltmeter and relative displacement sensors on the deck; WIM (purple) stands for weight-in-motion system.
8. Conclusions
A methodological strategy allowing a continuous analysis of the state-of-risk of bridges was discussed and applied to an operative example. The purpose of the paper is to combine, complement and uniformize simplified, yet reliable, approaches that are usually adopted for performing pre-disaster risk assessment and post-disaster impact scenario assessment for critical infrastructures at territorial scale, with advanced engineering simulations and SHM techniques that are usually devoted to the sophisticated analysis of single structures.
The proposed procedure is characterized by three levels of analysis (L1–L3) with increasing reliability and complexity, including the definition of the KPI indicators for each of the defined levels of analysis, i.e., KPIEi (i = 1 to 3). The KPIEi were conceived with a similar meaning and structure (all ranging from 0 to 1) and are therefore comparable, thus allowing us to take a scalable and incremental approach that can be implemented from the starting point of just a few available data. The three levels are as follows.
The first level of analysis (L1) defines a score based KPIE1 in compliance with the Italian LG2020 which introduced the definition of a seismic Class of Attention for the bridge, from Low to High. Despite the introduction of an Index of Attention, the relative KPI and another CA (very high), the approach seems to be too conservative, often leading to a low value of KPI. In L1, which is based on an approximated analysis, only a KPI related to the entire structure can be defined. It is always lower or equal to unity, which is consistent with the objectives of a preliminary assessment.
At the second level (L2), a KPIE2 is defined as a function of the capacity of the analysed structure and is assessed via a numerical engineering approach; it enables a prediction regarding the behaviour of the structure, in order to foresee its serviceability and level of damage under different seismic scenarios or immediately after a real earthquake. This approach is useful for deep knowledge of the structural health of a piece of infrastructure, and can be useful to better schedule prevention intervention works.
At the third level (L3) of analysis, the KPIE3 is assessed after the processing of SHM data and is based on the implementation of a static and/or dynamic monitoring system on the structure. It allows the measurement, continuously and in real time, of the bridge’s response under travelling loads, wind loads, and earthquake actions, allowing the detection of damages and dangerous situations which can lead to the concept of maintenance on request.
The approach that is proposed for the first level is based on census and inspection; that is, on the survey and analysis of the actual conservation status of the bridge. It also considers its defects, if present, and therefore represents an evaluation of its actual current health status. It would be desirable for this approach to be extended to all the bridges of a region or even to the entire national territory, in order to obtain suitable knowledge of the actual health status of the infrastructures and to define a reliable priority scale with limited effort in terms of time and cost.
For all three levels of the proposed procedure, both static data and dynamic data recorded in real time by SHM sensors are collected and collated in a unique Geo-Database in compliance with existing standards. Through the automatic calculation of the proposed KPIEi from the collected data, and their representation in a user-friendly WebGIS platform, it is possible to achieve continuous static and dynamic monitoring of critical infrastructures in non-earthquake periods for supporting the planning for preventive and effective maintenance interventions—both nation-wide and in post-disaster time—in order to support an effective and efficient system of emergency management and response. An example of such a possible implementation is briefly showcased in the paper with reference to the CIPCast Decision Support System (CIPCast-DSS), a WebGIS platform developed by ENEA to support the protection and resilience of critical infrastructures.
The first step should be carried out in a short amount of time for all the infrastructures, in order to obtain a priority scale and to plan detailed analyses. The implementation of the third approach represents the ideal solution that should be used on all the bridges and viaducts, allowing a reliable source to evaluate the health status of bridges in real time and providing a tool to optimize their management. The feasibility of such monitoring systems in the long run is related to the cost of the implementation, but also of a detailed data analysis in real time. The optimization of the monitoring system, i.e., the selection of the parameters to be measured and the sensor locations, is the main issue to face in the next future.
Author Contributions
Conceptualization, G.B., P.C., S.G., C.O., M.P. and V.R.; methodology, G.B., P.C., S.G., C.O., M.P. and V.R.; software, G.B., P.C., S.G., C.O., M.P. and V.R.; validation, G.B., P.C., S.G., C.O., M.P. and V.R.; formal analysis, G.B., P.C., S.G., C.O., M.P. and V.R.; investigation, G.B., P.C., S.G., C.O., M.P. and V.R.; resources, G.B., P.C., S.G., C.O., M.P. and V.R.; data curation, G.B., P.C., S.G., C.O., M.P. and V.R.; writing—original draft preparation, G.B., P.C., S.G., C.O., M.P. and V.R.; writing—review and editing, G.B., P.C., S.G., C.O., M.P. and V.R.; visualization, G.B., P.C., S.G., C.O., M.P. and V.R.; supervision, G.B., P.C., S.G., C.O., M.P. and V.R.; project administration, M.P. and V.R.; funding acquisition, M.P. and V.R. All authors have read and agreed to the published version of the manuscript.
Funding
The activities presented in the paper were conducted in the framework of the project RAFAEL “System for Risk Analysis and Forecast for critical infrastructure in the ApenninEs dorsaL Regions”, MIUR PON 2014-2020 (project ARS01_00305), and funded by the Italian ministry of scientific and technological research. Financial support from the RoMA project (“Resilience enhancement of Metropolitan Areas”, MIUR PON n. SCN00064) is also acknowledged.
Institutional Review Board Statement
Not applicable.
Informed Consent Statement
Not applicable.
Data Availability Statement
Not applicable.
Conflicts of Interest
The authors declare no conflict of interest.
References
- Clemente, P. Monitoring and evaluation of bridges. Lessons from the Polcevera Viaduct collapse in Italy. J. Civ. Struct. Health Monit. 2020, 10, 177–182. [Google Scholar] [CrossRef]
- Blaso, L.; Clemente, P.; Giovinazzi, S.; Giuliani, G.; Gozo, N.; Ormando, C.; Pollino, M.; Rosato, V. Towards Standardized and Interoperable Platforms for supporting the Seismic Vulnerability Assessment and Seismic Monitoring of Italian Bridges and Viaducts. In Lecture Notes in Civil Engineering, Proceedings of the 1st Conference of the European Association on Quality Control of Bridges and Structures (EUROSTRUCT 2021), Padua, Italy, 29 August–1 September 2021; Springer: Berlin/Heidelberg, Germany, 2022; Volume 200, pp. 471–480. [Google Scholar] [CrossRef]
- MIMS. Archivio Informatico Delle Opere Pubbliche (AINOP). Ministero Delle Infrastrutture e Della Mobilità Sostenibili. 2019. Available online: https://ainop.mit.gov.it/portale#/ (accessed on 15 December 2021).
- Clemente, P.; De Stefano, A. Novel methods in SHM and monitoring of bridges: Foreward. J. Civ. Struct. Health Monit. 2016, 6, 317–318. [Google Scholar] [CrossRef] [Green Version]
- Sun, Z.; Sun, H. Jiangyin Bridge: An Example of Integrating Structural Health Monitoring with Bridge Maintenance. Struct. Eng. Int. 2018, 28, 353–356. [Google Scholar] [CrossRef]
- Bas, S.; Apaydin, N.M.; Ilki, A.; Catbas, F.N. Structural health monitoring system of the long-span bridges in Turkey. Struct. Infrastruct. Eng. 2018, 14, 425–444. [Google Scholar] [CrossRef]
- Ormando, C.; Raeisi, F.; Clemente, P.; Mufti, A. The SHM as higher level inspection in the evaluation of structures. In Lecture Notes in Civil Engineering, Proceedings of the 1st Conference of the European Association on Quality Control of Bridges and Structures (EUROSTRUCT 2021), Padua, Italy, 29 August–1 September 2021; Pellegrino, C., Ed.; Springer: Berlin/Heidelberg, Germany, 2022; Volume 200, pp. 452–461. [Google Scholar] [CrossRef]
- Clemente, P.; Marulo, S.; Lecce, L.; Bifulco, A. Experimental modal analysis of the Garigliano cable-stayed bridge. Soil Dyn. Earthq. Eng. 1998, 17, 485–493. [Google Scholar] [CrossRef]
- Frangopol, D.M.; Strauss, A.; Kim, S. Bridge Reliability Assessment Based on Monitoring. J. Bridge Eng. 2008, 13, 258–270. [Google Scholar] [CrossRef]
- Li, H.N.; Ren, L.; Jia, Z.G. State-of-the-art in structural health monitoring of large and complex civil infrastructures. J. Civ. Struct. Health Monit. 2016, 6, 3–16. [Google Scholar] [CrossRef]
- Lorenzoni, F.; De Conto, N.; da Porto, F. Ambient and free-vibration tests to improve the quantification and estimation of modal parameters in existing bridges. J. Civ. Struct. Health Monit. 2019, 9, 617–637. [Google Scholar] [CrossRef]
- Clemente, P.; Bongiovanni, G.; Buffarini, G.; Saitta, F. Structural health status assessment of a cable-stayed bridge by means of experimental vibration analysis. J. Civ. Struct. Health Monit. 2019, 9, 655–669. [Google Scholar] [CrossRef]
- Somaschini, C.; Matsuoka, K.; Collina, A. Experimental analysis of a composite bridge under high-speed train passages. Procedia Eng. 2017, 199, 3071–3076. [Google Scholar] [CrossRef]
- Gentile, C.; Saisi, A. Continuous dynamic monitoring of a centenary iron bridge for structural modification assessment. Front. Struct. Civ. Eng. 2015, 9, 26–41. [Google Scholar] [CrossRef]
- Bongiovanni, G.; Cellilli, A.; Clemente, P.; Giovinazzi, S.; Ormando, C. Seismic response of a r.c. viaduct during different earthquakes. In Proceedings of the 10th International Conference on Structural Health Monitoring of Intelligent Infrastructure (SHMII-10), Porto, Portugal, 30 June–2 July 2021. [Google Scholar]
- Norouzzadeh Tochaei, E.; Fang, Z.; Taylor, T.; Babanajad, S.; Ansari, F. Structural monitoring and remaining fatigue life estimation of typical welded crack details in the Manhattan Bridge. Eng. Struct. 2021, 231, 111760. [Google Scholar] [CrossRef]
- Abdoli Oskoui, E.; Taylor, T.; Ansari, F. Method and sensor for monitoring weight of trucks in motion based on bridge girder end rotations. Struct. Infrastruct. Eng. 2020, 16, 481–494. [Google Scholar] [CrossRef]
- Obrien, E.J.; Brownjohn, J.M.W.; Hester, D.; Huseynov, F.; Casero, M. Identifying damage on a bridge using rotation-based Bridge Weigh-In-Motion. J. Civ. Struct. Health Monit. 2021, 11, 175–188. [Google Scholar] [CrossRef]
- Sitton, J.D.; Rajan, D.; Story, B.A. Bridge frequency estimation strategies using smartphones. J. Civ. Struct. Health Monit. 2020, 10, 513–526. [Google Scholar] [CrossRef]
- Di Pietro, A.; Lavalle, L.; La Porta, L.; Pollino, M.; Tofani, A.; Rosato, V. Design of DSS for Supporting Preparedness to and Managment of Anomalous Situation in Complex Scenario. In Managing the Complexity of Critical Infrastructures. Studies in Systems, Decision and Control; Setola, R., Rosato, V., Kyriakides, E., Rome, E., Eds.; Springer: Berlin/Heidelberg, Germany, 2016; Volume 90, pp. 195–232. [Google Scholar] [CrossRef] [Green Version]
- Giovinazzi, S.; Pollino, M.; Rosato, V.; Clemente, P.; Buffarini, G.; La Porta, L.; Di Pietro, A.; Ciarallo, F.; Lombardi, M. A decision support system for the emergency management of highways in the event of earthquakes. In Proceedings of the Atti del XVIII Congresso Nazionale “L’ingegneria Sismica in Italia”, Ascoli Piceno, Italy, 15–19 September 2019. [Google Scholar]
- Rinaldis, D.; Clemente, P. Seismic input characterization for some sites in Italy. In Earthquake Ground Motion: Input Definition for Aseismic Design; Syngellakis, S., Ed.; Wit Press: Southampton, UK, 2014; ISBN 978-1-84564-736-0/978-1-84564-737-7. [Google Scholar]
- Gehl, P.; D’Ayala, D. Derivation of Bridge Functionality Loss Curves for the Resilience Analysis of a Road Network exposed to Seismic Risk. In Proceedings of the First International Workshop on Resilience, Turin, Italy, 20–22 September 2016; Available online: https://hal-brgm.archives-ouvertes.fr/hal-01355883 (accessed on 15 September 2021).
- Mouroux, P.; Bertrand, E.; Bour, M.; Le Brun, B.; Depinois, S.; Masure, P.; The RISK-UE team. The European RISK-UE project: An advanced approach to earthquake risk scenarios. In Proceedings of the 13th World Conference on Earthquake Engineering (13WCEE), Vancouver, BC, Canada, 1–6 August 2004; Curran Associates, Inc.: New York, NY, USA, 2004; p. 3329, ISBN 9789892031828. [Google Scholar]
- Pitilakis, K.; Franchin, P.; Khazai, B.; Wenzel, H. SYNER-G: Systemic Seismic Vulnerability and Risk Assessment of Complex Urban, Utility, Lifeline Systems and Critical Facilities: Methodology and Applications. In Geotechnical, Geological and Earthquake Engineering Book Series (GGEE, Volume 31); Springer: Berlin/Heidelberg, Germany, 2014. [Google Scholar] [CrossRef]
- European Commission, Joint Research Centre. Seismology and Earthquake Engineering Research Infrastructure Alliance for Europe. Final Report, Publications Office. 2020. Available online: https://data.europa.eu/doi/10.2760/823726 (accessed on 15 December 2021).
- Ormando, C.; Ianniruberto, U.; Clemente, P.; Giovinazzi, S.; Pollino, M.; Rosato, V. Real-time assessment of performance indicators for bridges to support road network management in the aftermaths of earthquake events. In Proceedings of the 8th International Conference on Computational Methods in Structural Dynamics and Earthquake Engineering (COMPDYN 2021), Athens, Greece, 28–30 June 2021; NTUA: Athens, Greece, 2021; Volume 2, pp. 3536–3550. [Google Scholar] [CrossRef]
- MIT-CSLLPP. Linee Guida Per la Classificazione e Gestione del Rischio, la Valutazione Della Sicurezza ed il Monitoraggio Dei Ponti Esistenti (LG2020); Ministero delle Infrastrutture e dei Trasporti: Rome, Italy, 2020.
- CEN; E.urocode 8: Design of Structures for Earthquake Resistance. European Standard, CEN: Brussels, Belgium, 2004.
- NTC-2018; Norme Tecniche per le Costruzioni. DM Ministero Delle Infrastrutture e dei Trasporti 17.01.2018, Supplemento Ordinario alla Gazzetta Ufficiale n. 42 of 20 February 2018 - Serie Generale. Istituto Poligrafico e Zecca dello Stato: Rome, Italy, 2018.
- Zanini, M.A.; Pellegrino, C.; Morbin, R.; Modena, C. Seismic vulnerability of bridges in transport networks subjected to environmental deterioration. Bull. Earthq. Eng. 2013, 11, 561–579. [Google Scholar] [CrossRef]
- Podolny, W.; Scalzi, J. Construction and Design of Cable-Stayed Bridges; John Wiley and Sons: Hoboken, NJ, USA, 1976; ISBN 0471756253/978-0471756255. [Google Scholar]
| Publisher’s Note: MDPI stays neutral with regard to jurisdictional claims in published maps and institutional affiliations. |
© 2022 by the authors. Licensee MDPI, Basel, Switzerland. This article is an open access article distributed under the terms and conditions of the Creative Commons Attribution (CC BY) license (https://creativecommons.org/licenses/by/4.0/).


 ,
, 


