


Behavior of Half-Joints: Design and Simulation of Laboratory Tests
by
 , , and
Rebecca Asso
1,
Marco Domaneschi
1,*,
Giuseppe C. Marano
1,2,
Fabrizio Palmisano
1 and
Giuseppe Palombella
3 1
Department of Structural, Geotechnical and Building Engineering DISEG, Politecnico di Torino, 10129 Turin, Italy
2
College of Civil Engineering, Fuzhou University, Fuzhou 350108, China
3
Centro Prove Materiali s.r.l., 21017 Samarate, Italy
*
Author to whom correspondence should be addressed.
Infrastructures 2022, 7(12), 160; https://doi.org/10.3390/infrastructures7120160
Submission received: 29 September 2022
/
Revised: 16 November 2022
/
Accepted: 20 November 2022
/
Published: 24 November 2022
(This article belongs to the Special Issue Structural Health Monitoring of Civil Infrastructures)
Abstract
:European countries are characterized by an extensive infrastructural network, mainly built around the 1960s and 1970s. In that period prefabrication processes were starting to gain ground, and one of the most spread and studied typologies of bridges was constituted by reinforced or prestressed concrete decks. Those structures have gone through years of service, which caused the inevitable degradation of the materials and relevant deterioration of structural elements. Moreover, the design and construction processes of that period have soon become obsolete, and the knowledge relative to the influence of detailing increased significantly. One particular element that has been commonly used has been the half-joint, which is easy to prefabricate and has a strategic impact. However, in recent years this solution is showing critical aptitudes in resisting structural degradation and material decay. In addition, structural health monitoring (SHM) strategies are gaining attention since they are a very useful tool for gathering information on the current state of the structure and then for evaluating intervention plans to improve safety. Indeed, existing bridges, despite their working age, are still crucial to the development and sustainability of community life, and their decommissioning would be an act of critical impact on the communities (e.g., economy, logistics, sustainability). This contribution presents the design and the simulation of laboratory tests on half-joints of reinforced concrete beams that will be developed at the Politecnico di Torino in a subsequent step of the present research. They are designed to test and compare different monitoring techniques along with different steel reinforcement configurations. Specifically, the first part of the manuscript focuses on a review of the literature regarding the design, strengthening, and monitoring of half-joints. Subsequently, the laboratory setup to test half-joints is presented along with the numerical simulation to support the experimental design. Laboratory tests will involve the use of monitoring systems to detect the local response of the system and also to propose new solutions specifically for this type of connection using emerging technologies. Numerical collapse simulations show the effect of different reinforcement configurations and the collapse behavior.
1. Introduction
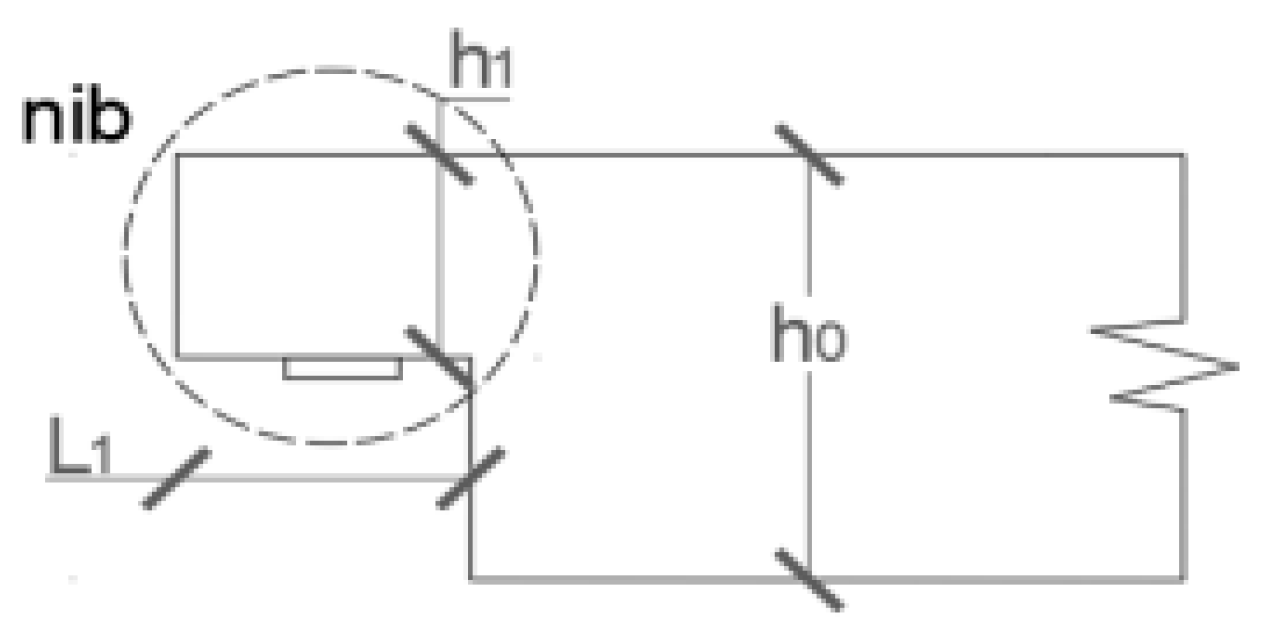
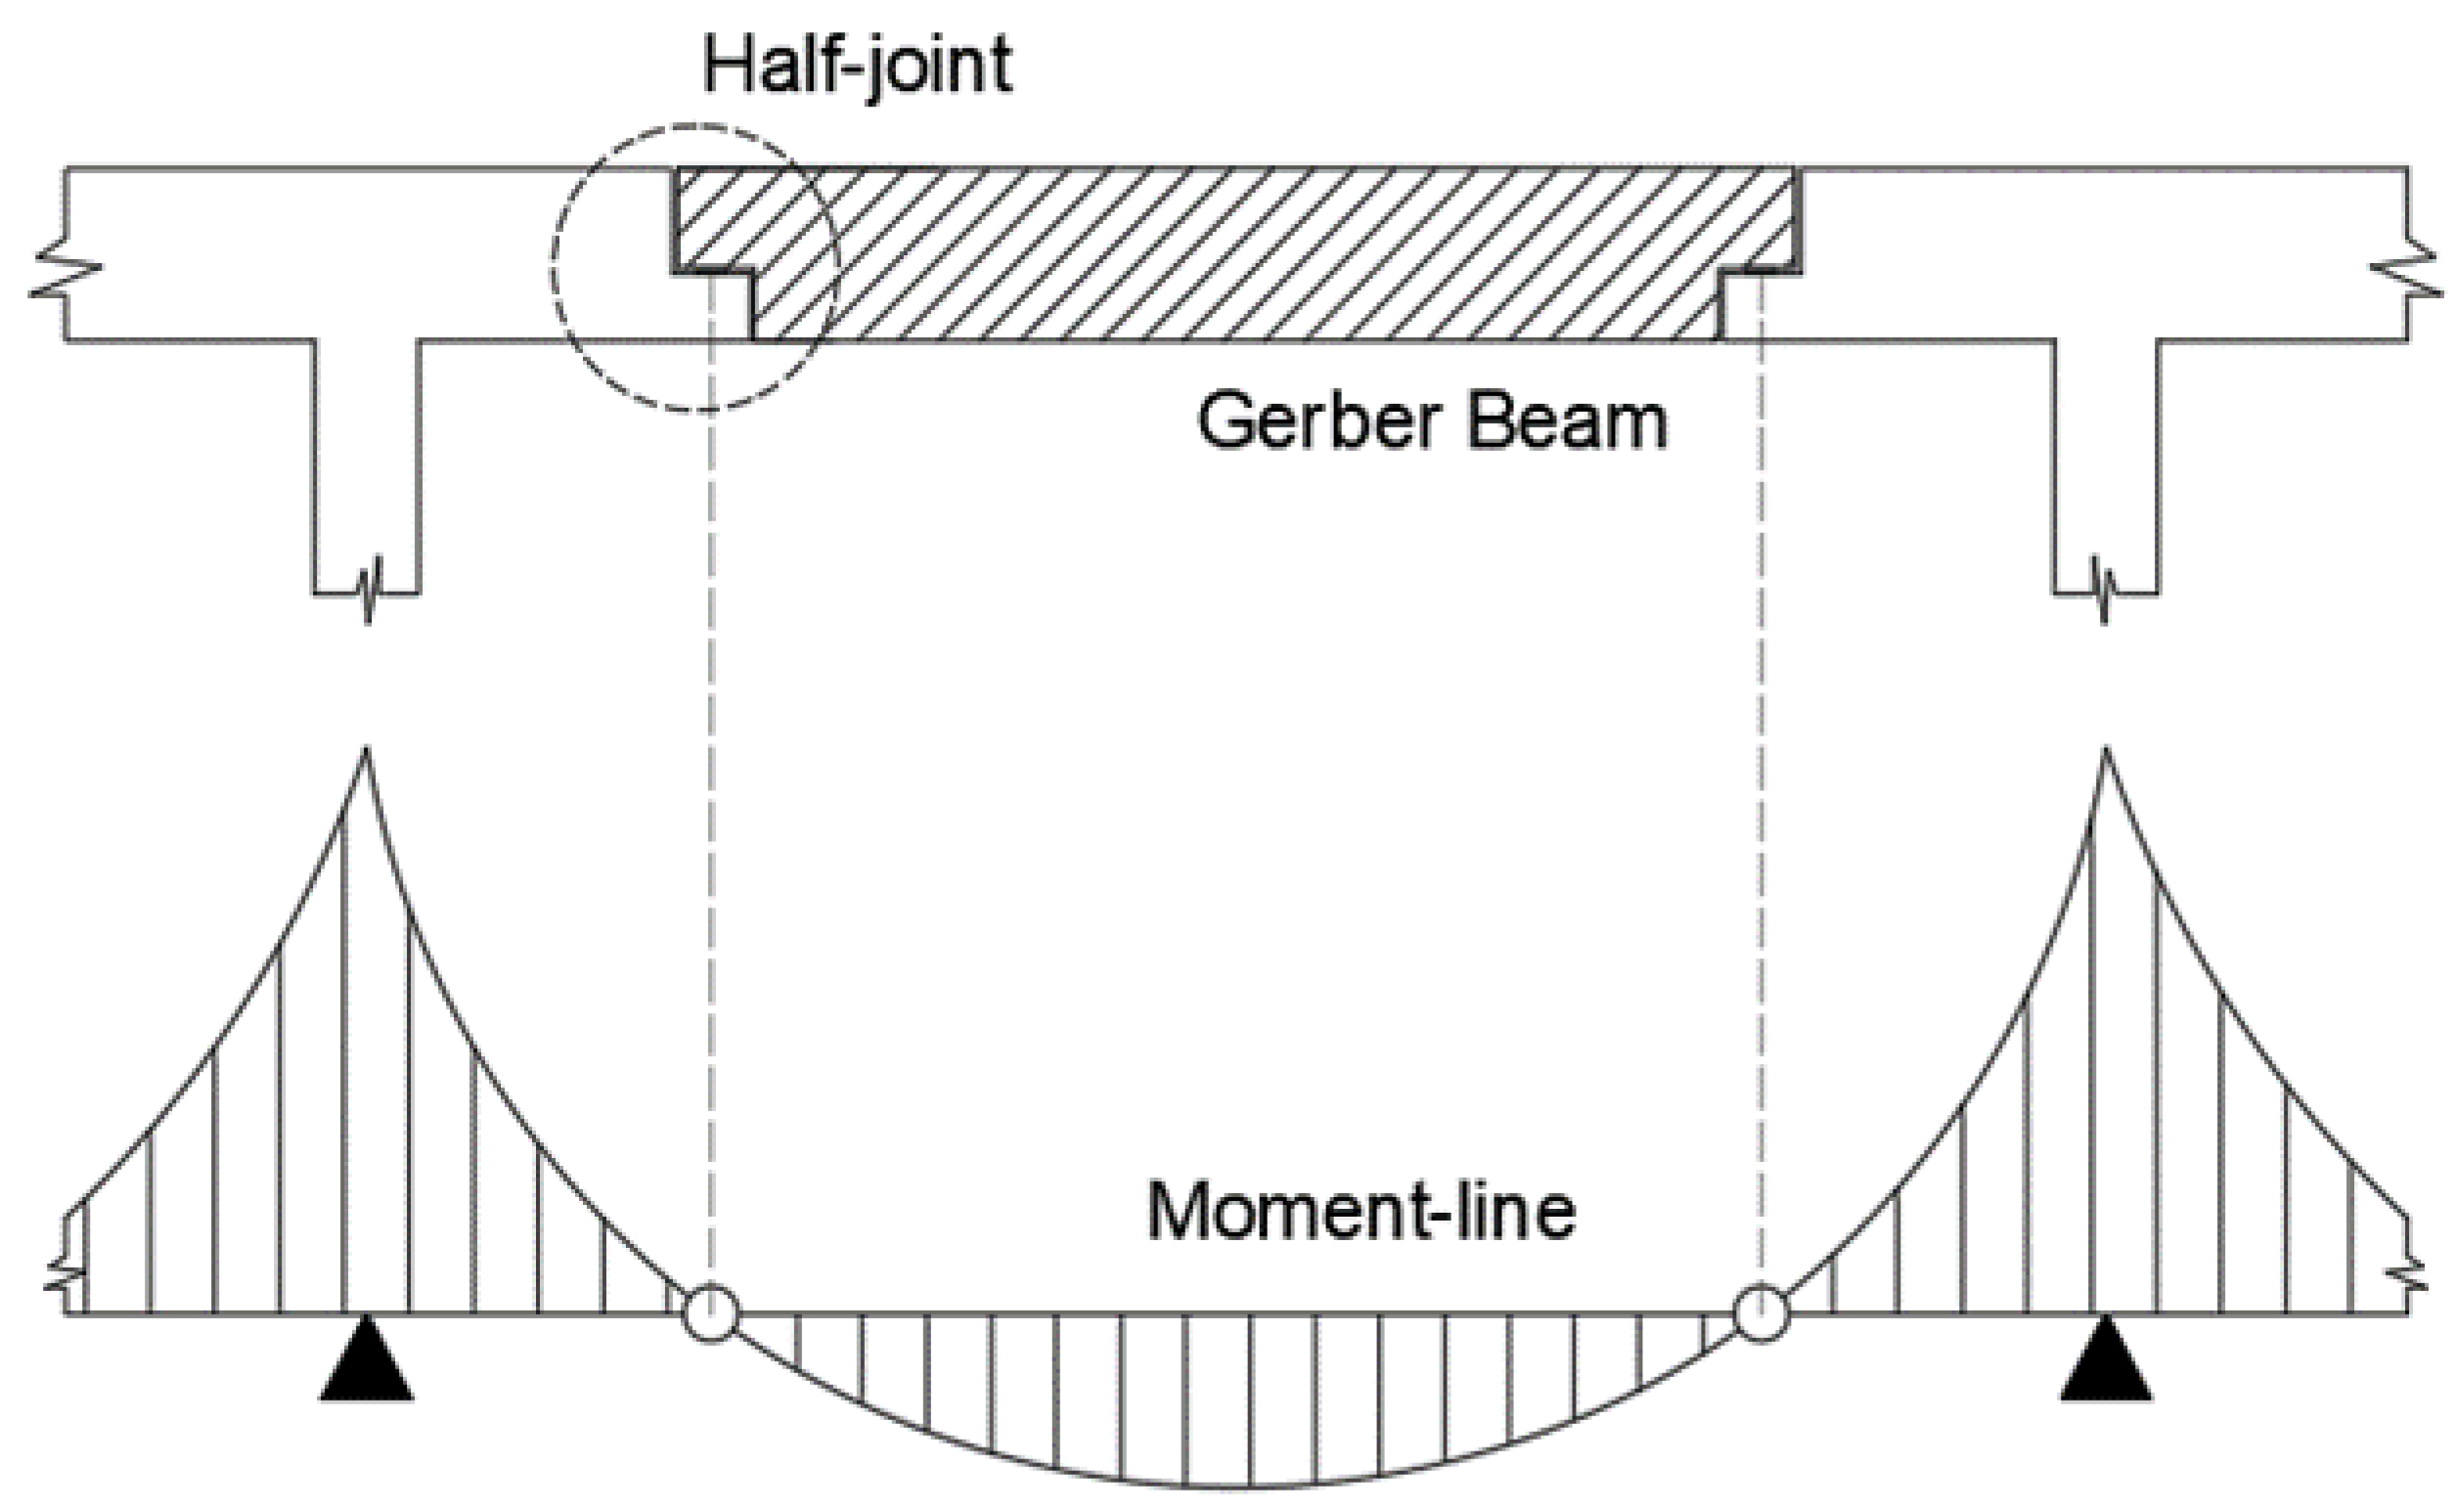
In the decades after World War II, we have witnessed a fast-growing that promoted the design and construction of most of the European infrastructural networks. In that period, half-joints were often used in reinforced concrete structures: they consist of reduced beam ends (Gerber joints) that are supported by complementary half-joints or pier caps, and which form suspended spans or Gerber beams (geometry Figure 1). The suspended spans were often exploited, because of their easy prefabrication and thanks to the optimization of stress distribution, as a consequence of the static scheme of the structure (as shown in Figure 2), which was not sensitive to differential settlement and thermal variations. However, the geometry of these joints causes a fast degradation of the material, so premature corrosion and concrete spalling, and the most damaged areas are not accessible for visual inspections. Water and de-icing salt, coming from the street surface, can easily infiltrate the nib and accumulate in the supporting half-joint: in England, it has been noticed a reinforcement reduction in the nib of 30–50% [1], caused by the corrosion mechanisms that spread fast in presence of some environments. These intrinsic characteristics of half-joints cause their unreliability and spread mistrust when the assessment according to actual codes and loads is needed. Moreover, the design codes specifically devoted to the dimensioning of half-joints were not available and globally recognized; therefore, the existing elements are characterized by different reinforcement layouts and design assumptions.
With the purpose of structural health monitoring of half-joints, the brittle behavior of these elements is a strict limitation for their analysis. In fact, the monitoring of crack widths is usually not valuable information (that can be only accessed in some scenarios when the element is cracked at serviceability limit states), and the deformations of the element are only available at the local scale (e.g., with the application of strain gauges) and the obtained data are only reliable at the unracked stage, for the technical limitation of the instruments.
The research presented in this paper introduces an emerging technique, digital image correlation, that in some cases can overcome the limits of other monitoring layouts. In particular, the present paper describes the calibration of the test campaign that will be carried out by the Politecnico di Torino leading to the identification of a monitoring strategy specifically addressed to half-joints. After a section dedicated to the state of the art, the test layout is described along with monitoring solutions specific for half-joints. Finally, the numerical nonlinear analyses that are performed to support the design of the laboratory destructive tests are reported.
2. State of the Art on Half-Joints
While the scientific community was firstly interested in investigating the possible design options to optimize the half-joint strength, in recent years the attention moved towards the identification of strengthening techniques and monitoring strategies.
Half-joints are a discontinuity region that are nowadays analyzed by the strut-and-tie method, which is exploiting the lower bound theorem of plasticity. However, in the past, they were usually designed according to the upper bound theorem of plasticity. Important test campaigns were conducted by Reynolds in 1969 [2], Mattock and Chan in 1979 [3], Liem in 1983 [4] who adopted a kinematic method to design the reinforcement amount and the positioning of steel reinforcement. Kinematic methods (in accordance with the upper bound theorem of plasticity, define a hypothetic mechanism that can be responsible for the collapse of the element (or of the structure) and calculate the acting loads that are necessary to achieve that condition. With reference to half-joints, a major crack is set, starting from the inner part of the nib and developing until it meets the neutral axis of the beam in pure bending, and all reinforcement crossing the crack is calculated to resist this mechanism. This method usually provides accurate solutions; however, it overestimates the real resistance of the element.
According to Drucker and Prager [5], the definition of the lower bound and upper bound of theorems is provided as follows (the number of the reported theorems is in accordance with [5]):
Theorem 3.
“As long as collapse does not occur, a safe statically admissible state of stress can be found at each stage of loading”.
Theorem 4.
“If a kinematically admissible collapse state can be found at any stage of loading, collapse must impend or have taken place previously”.
Despite the accuracy that is related to upper-bound methods, several reasons characterize their non-reliability and have caused the spread of the lower-bound theorem of plasticity in more recent times. First of all, the location and type of collapse are assumed to occur at the corner of the nib or at the full height cross-section, because of steel yielding, anchorage loss, concrete crushing, etc. One more assumption is the calculation of the position of the neutral axis, and the critical crack formation, that is directly affecting the calculation of the element strength. Lastly, but most important, half-joints have shown a lack of resistance to degradation mostly related to the seepage of water and aggressive solutions coming from the road surface that implies a fast decay of the materials.
In conclusion, when kinematic methods are adopted to design half-joints, their resistance is usually overestimated, the reliability of the calculation is strictly depending on the position of the reinforcement that can undergo some adjustment in the construction phase and the degradation mechanisms can dramatically reduce the capacity of the element.
The strut-and-tie method is nowadays representing the most widespread technique to deal with half-joints. It relies on two main aspects:
- External loads must be in equilibrium with the internal stress distribution.
- The internal stress schematization must not exceed any element of plastic stress.
The literature on half-joints is often dedicated to the definition of strut-and-tie models to be used in the specific case [6,7,8]. The main challenge is the evaluation of a general stress distribution that can be adapted to several reinforcement layouts, in terms of geometrical boundaries and exploitation of strength reservoirs. In fact, since most of the half-joints were not designed by the lower bound method but by the upper bound method, the reinforcement distribution is often hardly adaptable to the truss of the half-joints, and the risk is to avoid the complete exploitation of the reinforcement and concrete ultimate strength, leading to the identification of a critical load that is significantly lower than the real failure load.
Some authors have studied the response of half-joints at the serviceability limit states (SLS), highlighting the cracking and the influence of reinforcement, bearings, and possible strengthening solutions.
Starting in 1973, Werner and Dilger [9] analyzed five beams in prestressed concrete, focusing on the positioning of shear reinforcement and type of bearing. The test campaign was concluded with a precise indication of the shear reinforcement positioning and concrete cover.
Later in 2014, Moreno-Martinez and Meli [10] highlighted the importance of inclined bars in crack control and ductility.
Strengthening solutions have been provided by Taher [11], Sas et al. [12], Herzinger and Elbadry [13]. These authors studied the influence of strengthening materials such as carbon-fiber wraps and polymer strips also combined with studs. The use of different systems on the same element provided, as expected, the highest increase in strength in the elements.
3. Parameters That Affect the Crack Pattern
Half-joints are brittle elements; thus, they show very limited deformations before the collapse. The crack patterns that can be developed in half-joints at the SLS are usually not extended but can witness some critical aspects in the behavior of the element. According to Barton et al. [14], the first crack develops when the half-joint is reaching 20–30% of its ultimate strength. This has been confirmed by numerical [15] and laboratory [16] simulations. In the following paragraphs, the influence of reinforcement layout and deterioration on the cause and development of cracks is highlighted.
3.1. Reinforcement Layout
From a test campaign carried out by Desnerck et al. [16], the reinforcement layout can directly affect the crack pattern at the Ultimate Limit State.
In detail:
- When rebars are present in diagonal, horizontal, and vertical directions in the nib and in the nearby area, a critical crack develops in the inner part of the nib, together with diffused secondary cracks in the beam.
- If the reinforcement layout includes only inclined and vertical reinforcement, the critical crack cuts the nib sub-vertically.
- If the reinforcement layout is only formed by vertical and horizontal reinforcement the collapse is reached with very limited deformation. The inclined rebars seem to be very effective to control cracking, also according to the test campaign by [10].
In a text campaign carried out by Clark and Thorogood in 1987 [17], the serviceability behavior of half-joints is studied. These authors have noticed a reduction of the crack width up to six times when the inclined reinforcement is present.
3.2. Damage and Decay of the Materials
Deterioration is often present in half-joints, because of water and aggressive agents in critical areas.
The most common deterioration processes that can be found in inspections on half-joints are the following:
- Corrosion of the rebars close to the nib;
- Concrete spalling;
- Anchorage area reduction (bond degradation).
The deterioration of the anchorage area can bring the failure of the element because of bar slipping and the formation of major cracks, as in the case of the Concorde collapse in 2006 [18].
At the formation of the first cracks in concrete, oxygen and moisture from the atmosphere can seep into the material and reach the steel rebars. The corrosion of steel reinforcement has several consequences on the structure, from the reduction of resisting area and the loss of ductility to the increase in steel volume that can push the concrete, causing spalling and further cracking [19]. Nowadays, there are precise indications on the concrete cover, rebar spacing, and detailing to limit crack formation and spreading.
This introduction on half-joints highlights the main problems related to the analysis of existing elements and the influence of some parameters on the crack patterns. In the following sections, the layout of the laboratory specimens and the monitoring sensors that have been considered are first highlighted. Finally, the finite element models, used to reproduce in advance of the laboratory tests, are presented.
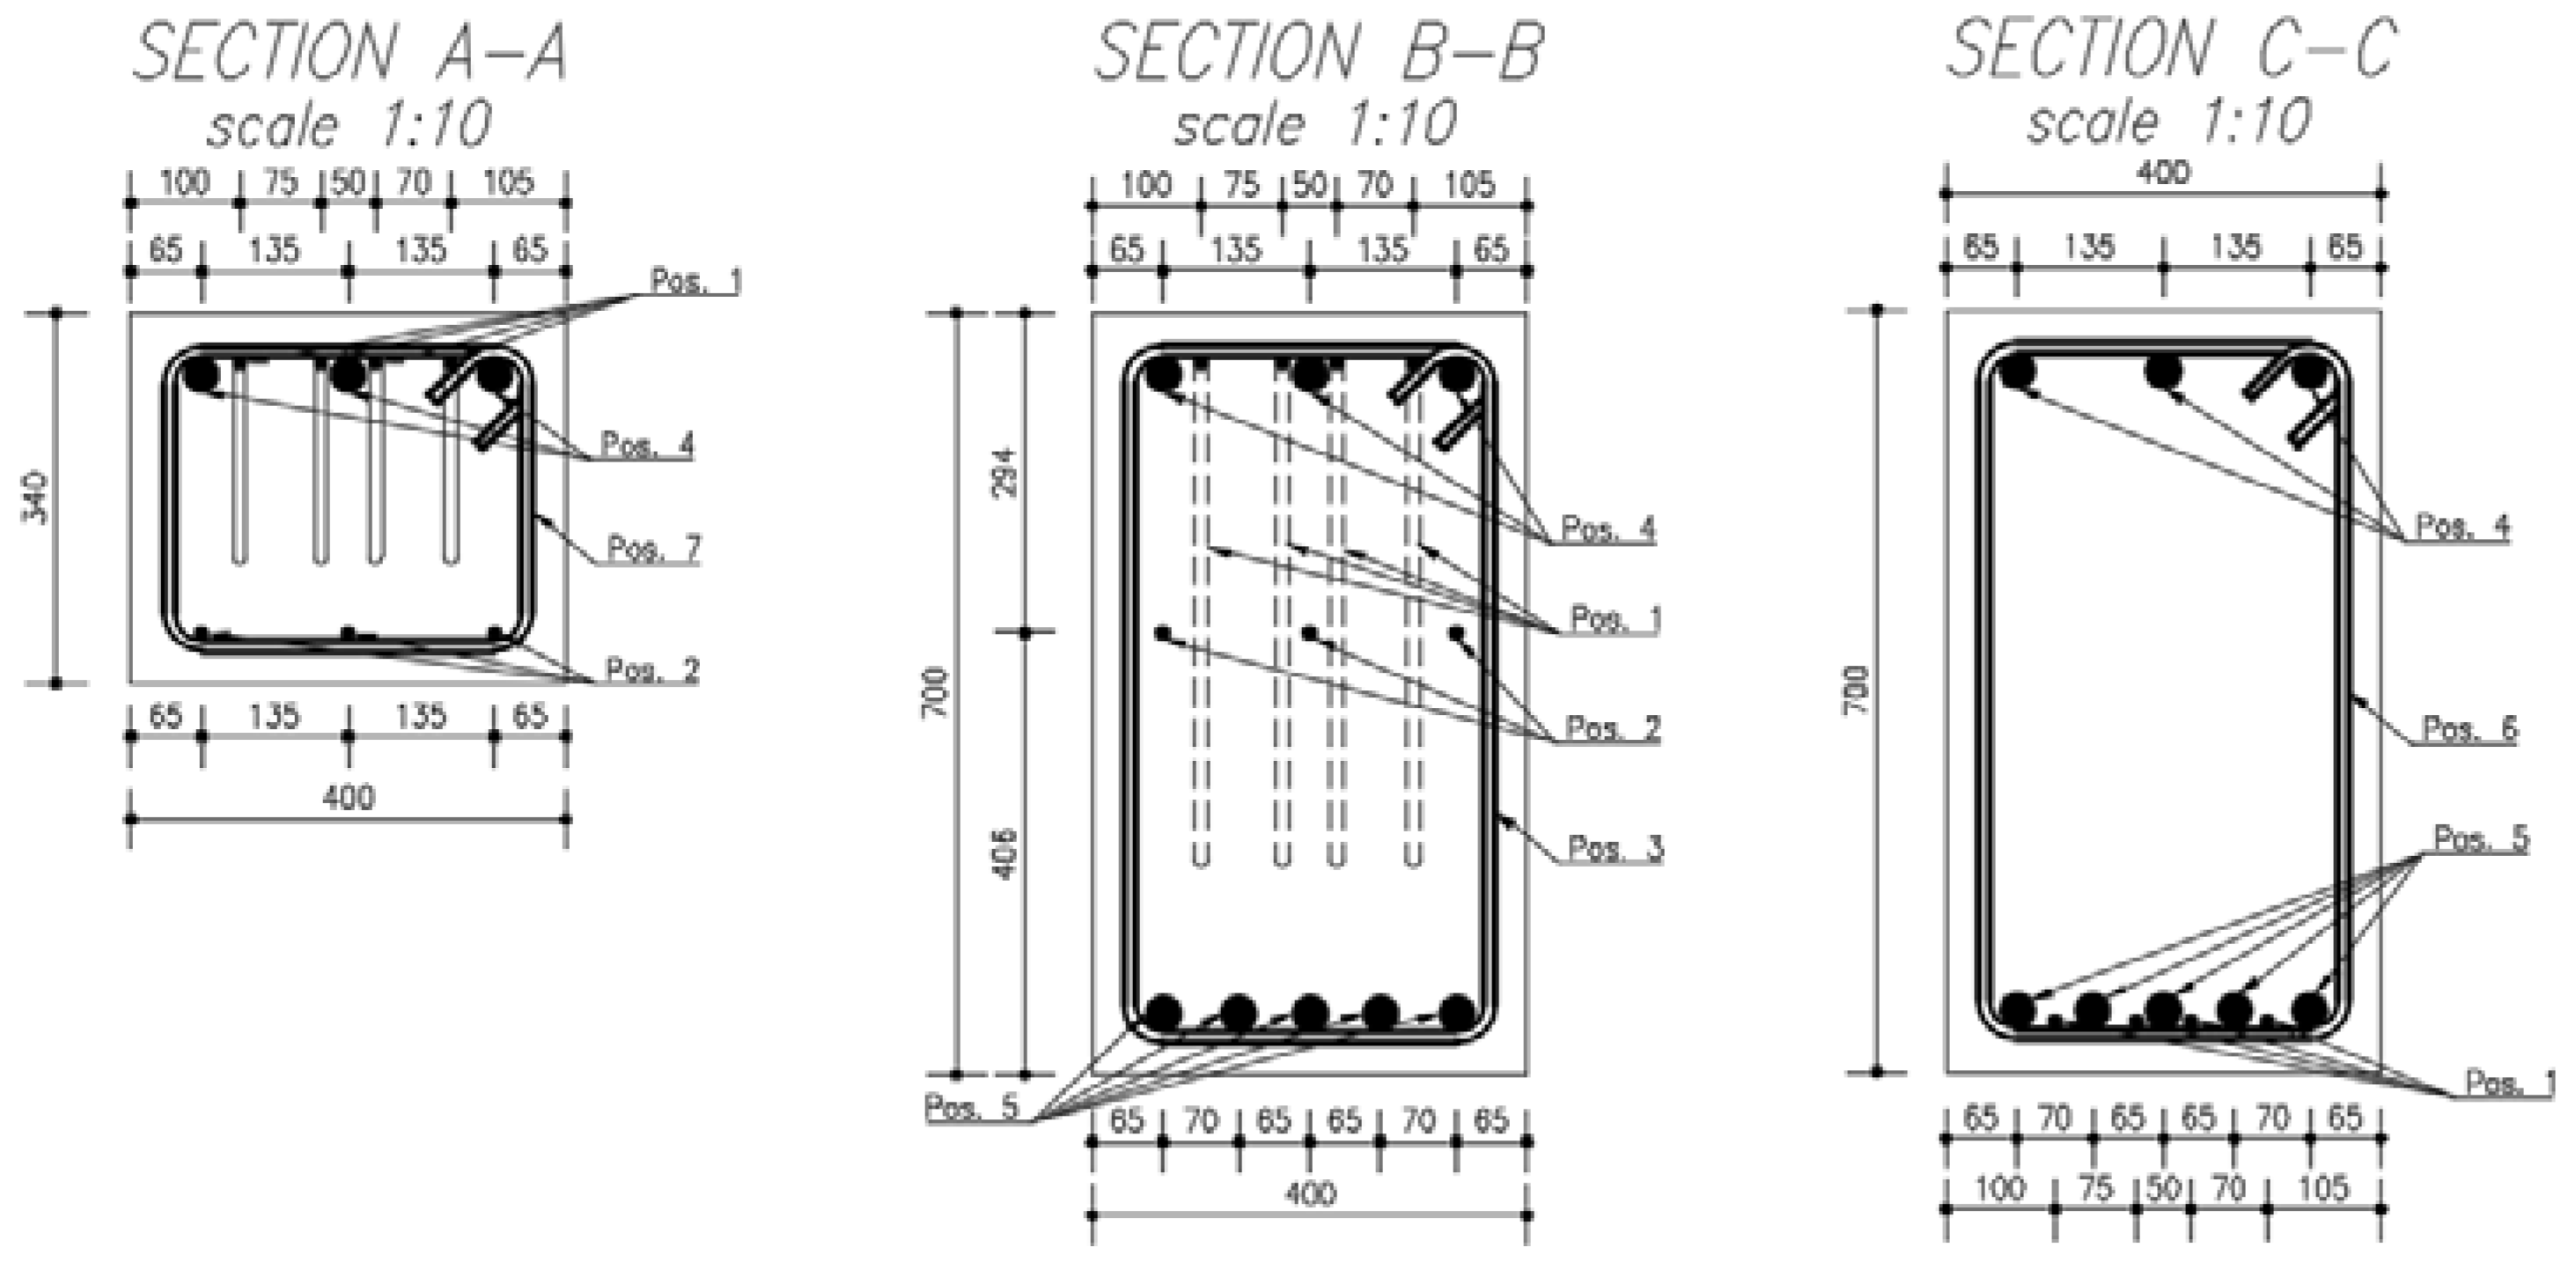
4. Test Layout: Specimen Configurations, Reinforcement, Loading Conditions, and Monitoring
The purpose of the experimental campaign is to test different half-joint configurations and to compare different monitoring techniques with respect to damage detection, localization, and quantification, by applying traditional and emerging technologies.
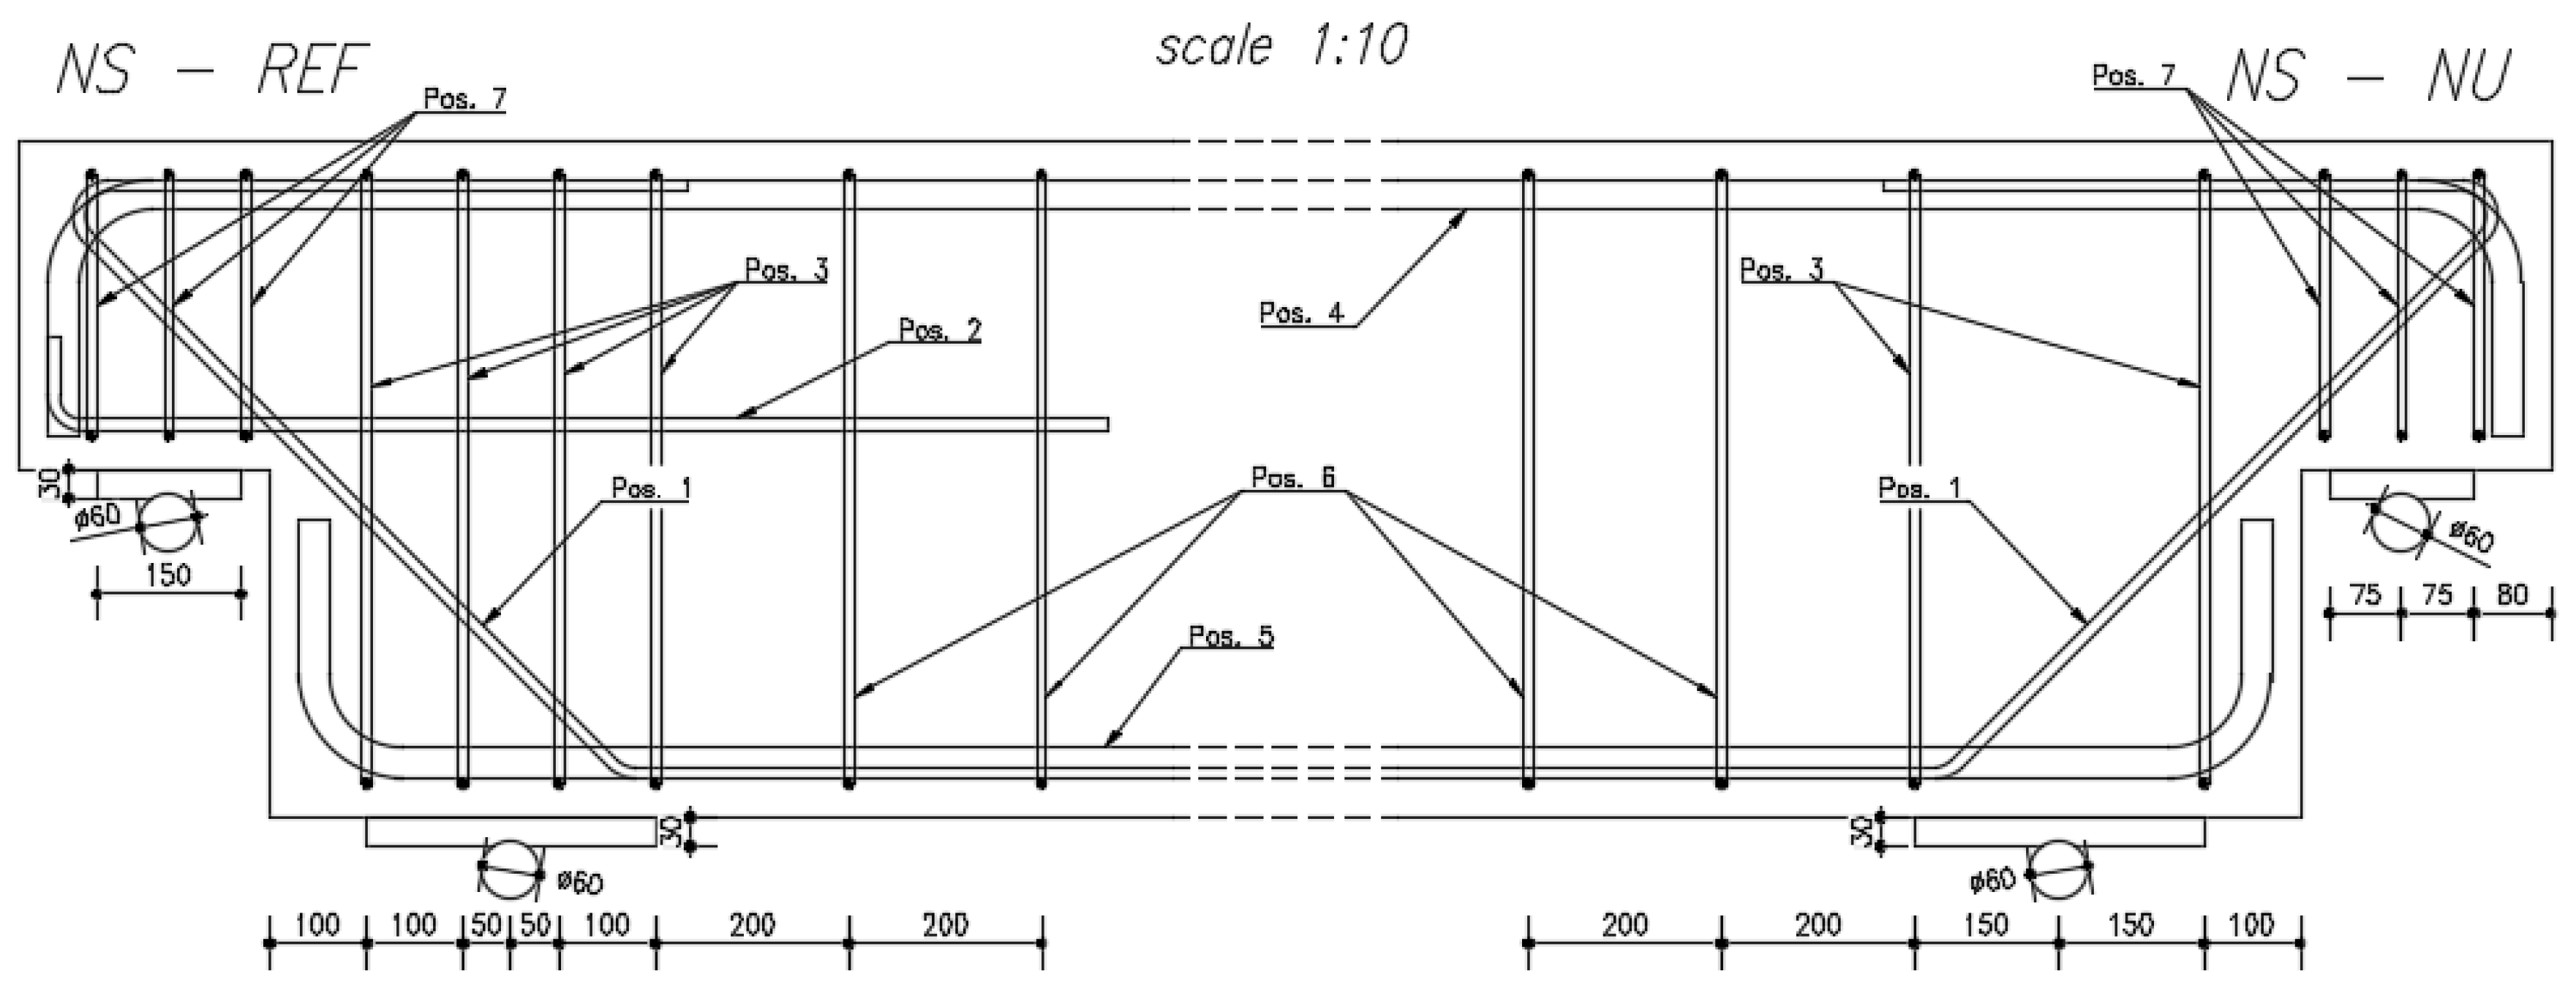
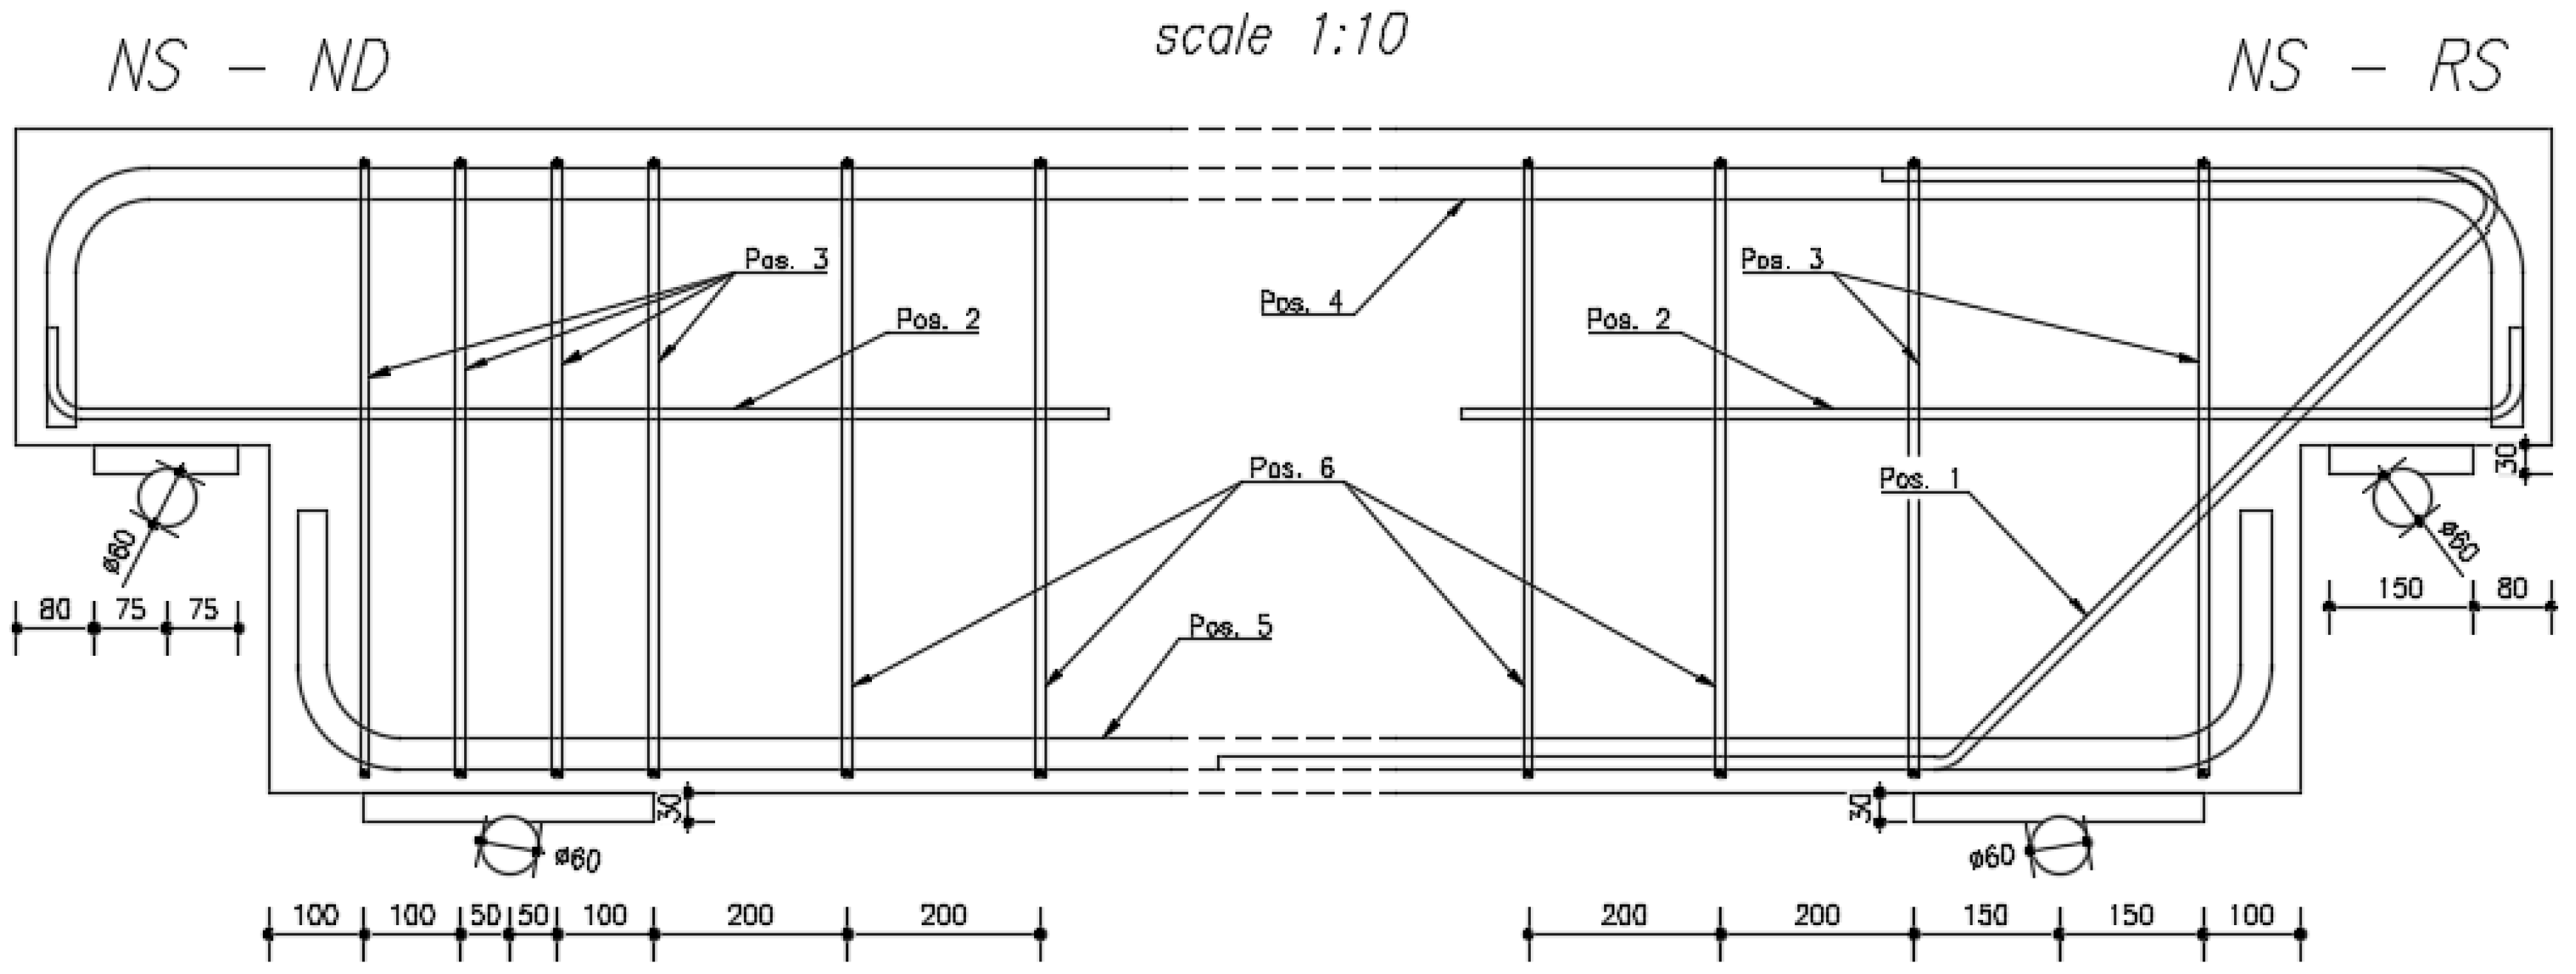
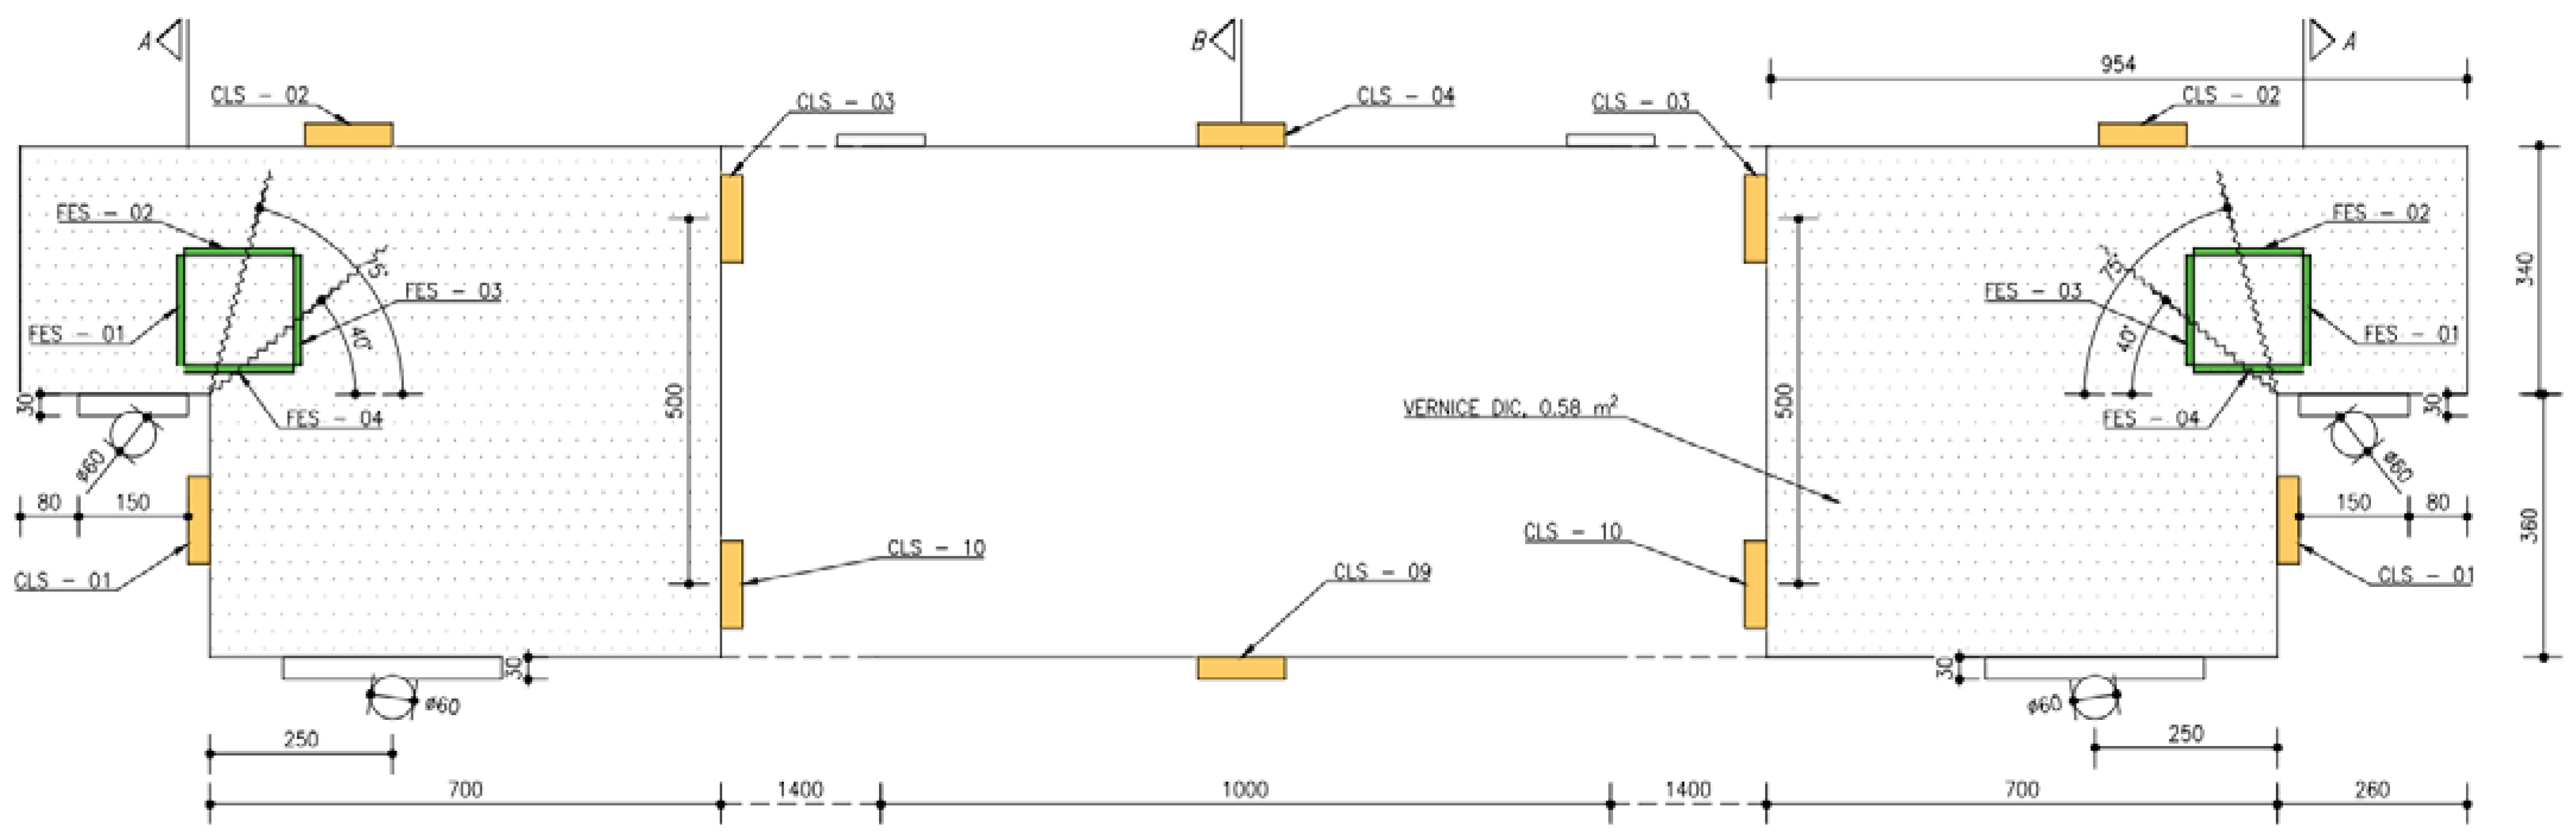
Figure 3 and Figure 4 report the four different configurations of the half-joint that are considered for the experimental campaign (NS-REF, NS-NU, NS-ND, NS-RS). These refer to different arrangements of inclined, horizontal, and vertical reinforcements at the critical areas where major cracks, responsible for the brittle behavior of the component, are expected to develop. The reinforcement layouts that have been chosen are those usually present in existing half-joints. However, the case of prestressed half-joints is not considered in this work.
The four half-joints are named as follows and they are inspired by the paper of Desnerck, Lees, and Morley [16] (Figure 3 and Figure 4):
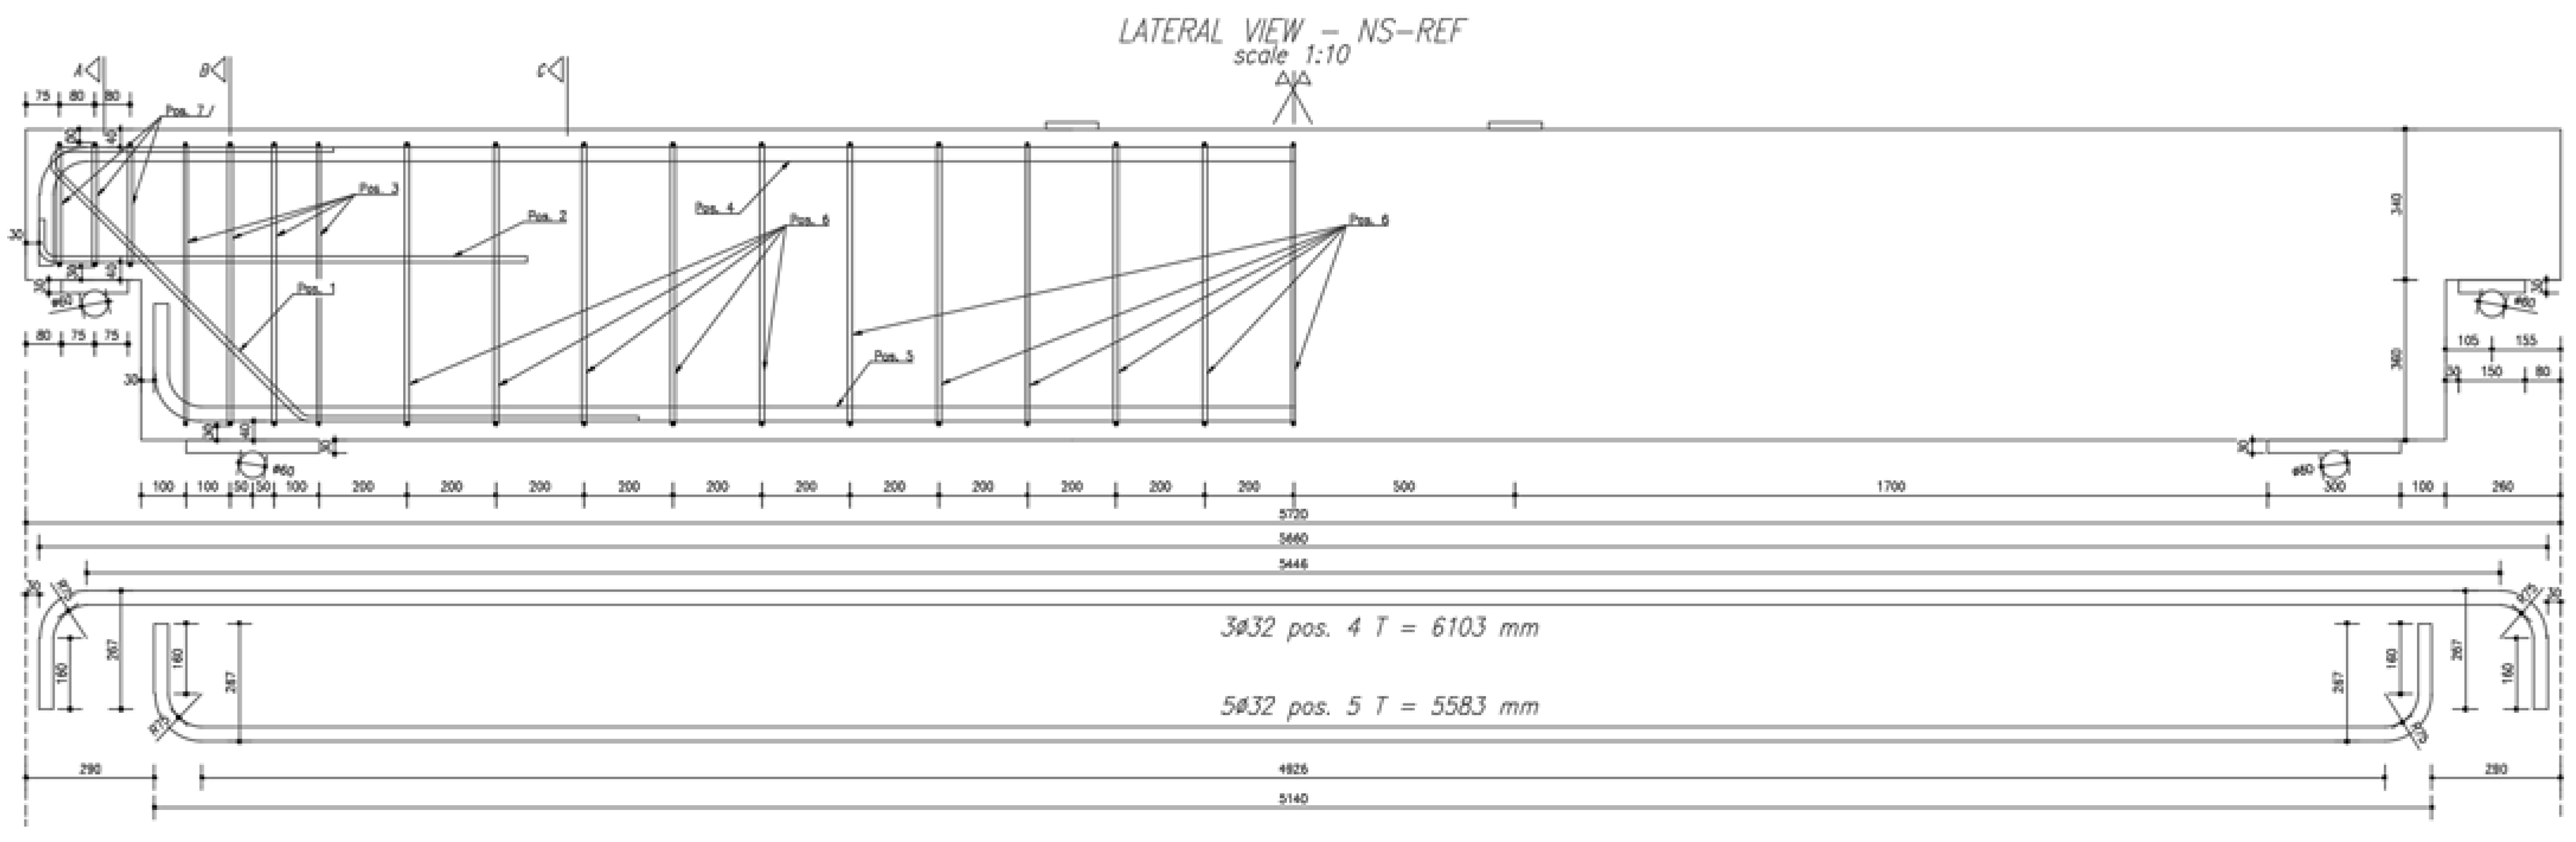
- NS-REF: is the reference beam, with a complete reinforcement layout. It is composed of inclined, horizontal, and vertical steel rebars.
- NS-NU: is based on NS-REF with the removal of the horizontal rebars.
- NS-ND: is based on NS-REF with the removal of the diagonal rebars.
- NS-RS: is based on NS-REF with the reduction of the stirrups nearby the nib.
Tests are planned to be carried out on two beam specimens with a half-joint at each end, leading to failure in a four-point bending load configuration. Overall, four types of half-joints (Figure 3 and Figure 4) will be brought to failure, each of them with different reinforcement configurations. For each beam specimen, the first loading phase aims to bring the weakest joint of the beam to failure. The second stage, on the other hand, by appropriately restoring the support that collapsed at the previous stage, will bring the strongest element to collapse.
The beam ends are composed as follows: NS-REF strong element with NS-NU weak element (Figure 3); NS-RS strong element with NS-ND weak element (Figure 4).
The specimens chosen for testing include the following major changes and improvements to a previous study from the literature (Desnerck et al. [16]):
- The test is changed from the three-point to the four-point bending configuration, to better highlight the shear failure. This has led to the span increase.
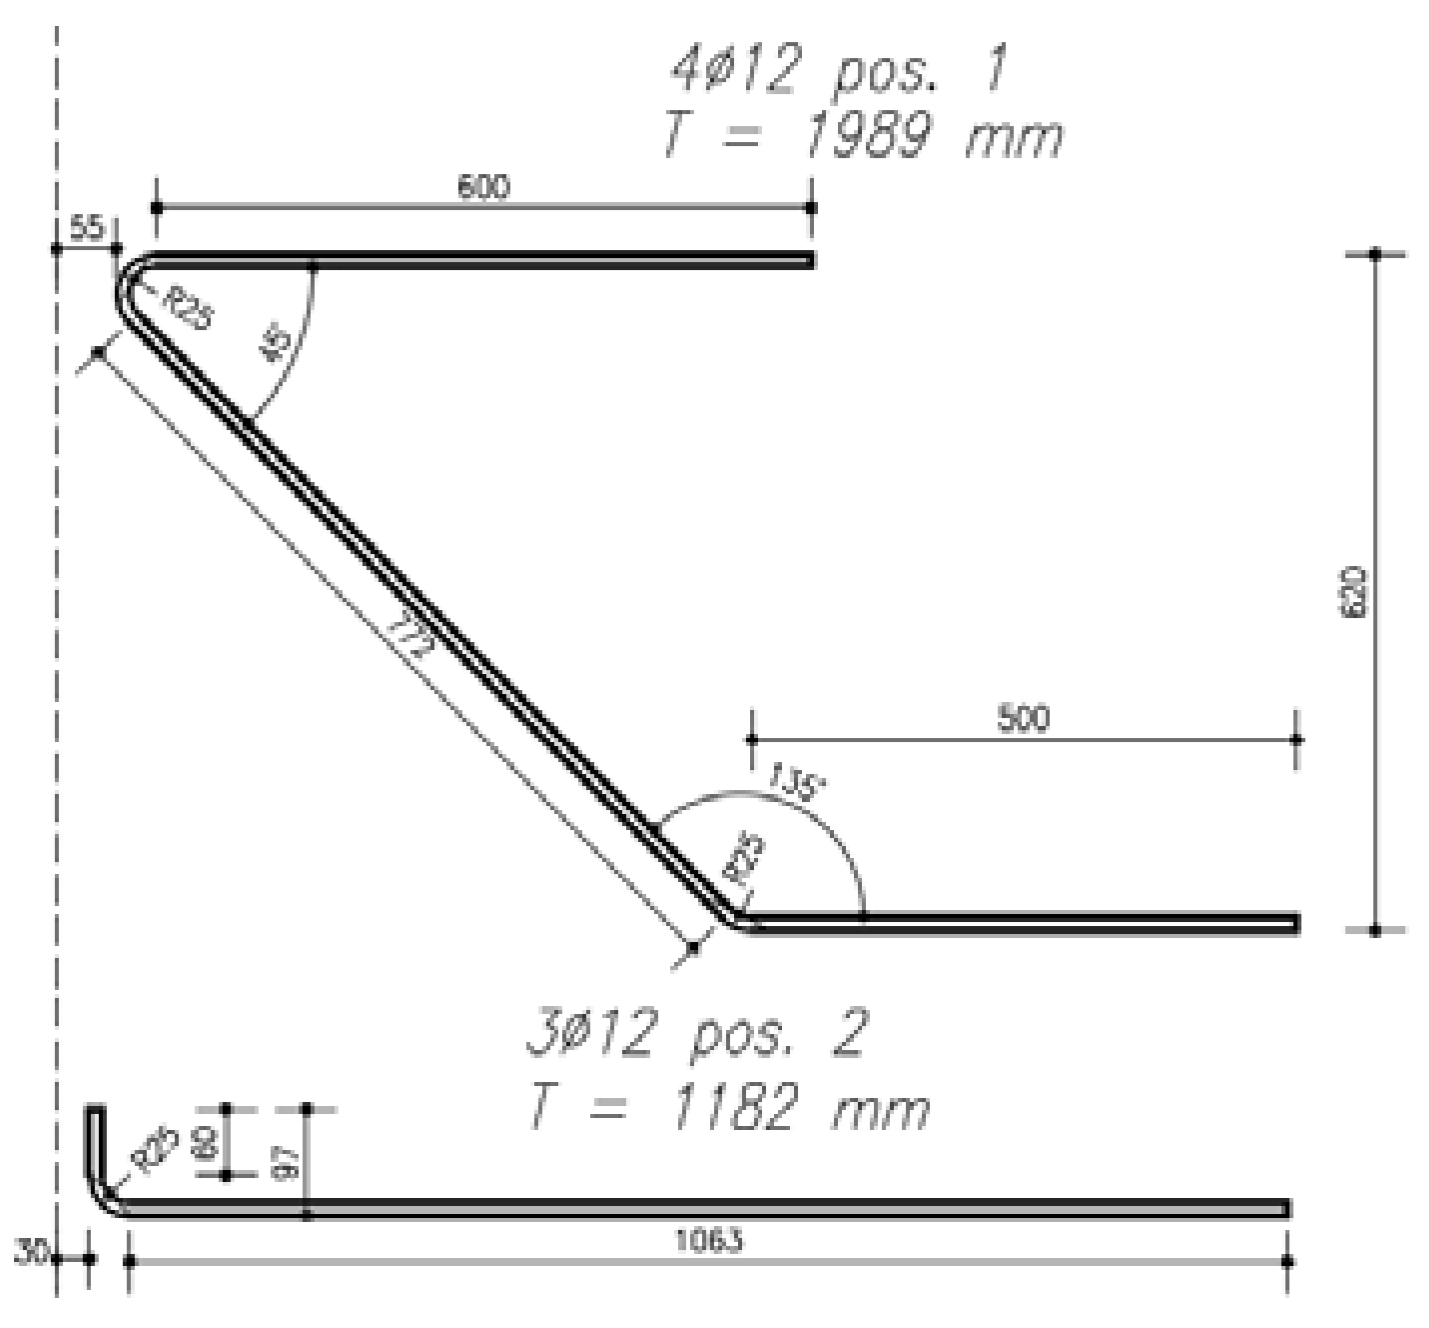
- To exclude bending failure, taking account of the span increase, the diameter of the bottom longitudinal bars has been increased to Ø32.
- Horizontal bars are designed with bends for proper anchorage.
- Horizontal bars in the nib are not U-shaped.
- The position of the top bent of the inclined bar has been changed to better activate the relevant resisting mechanism.
- Half-joints NS-REF and NS-ND are provided with vertical reinforcements also in the nib.
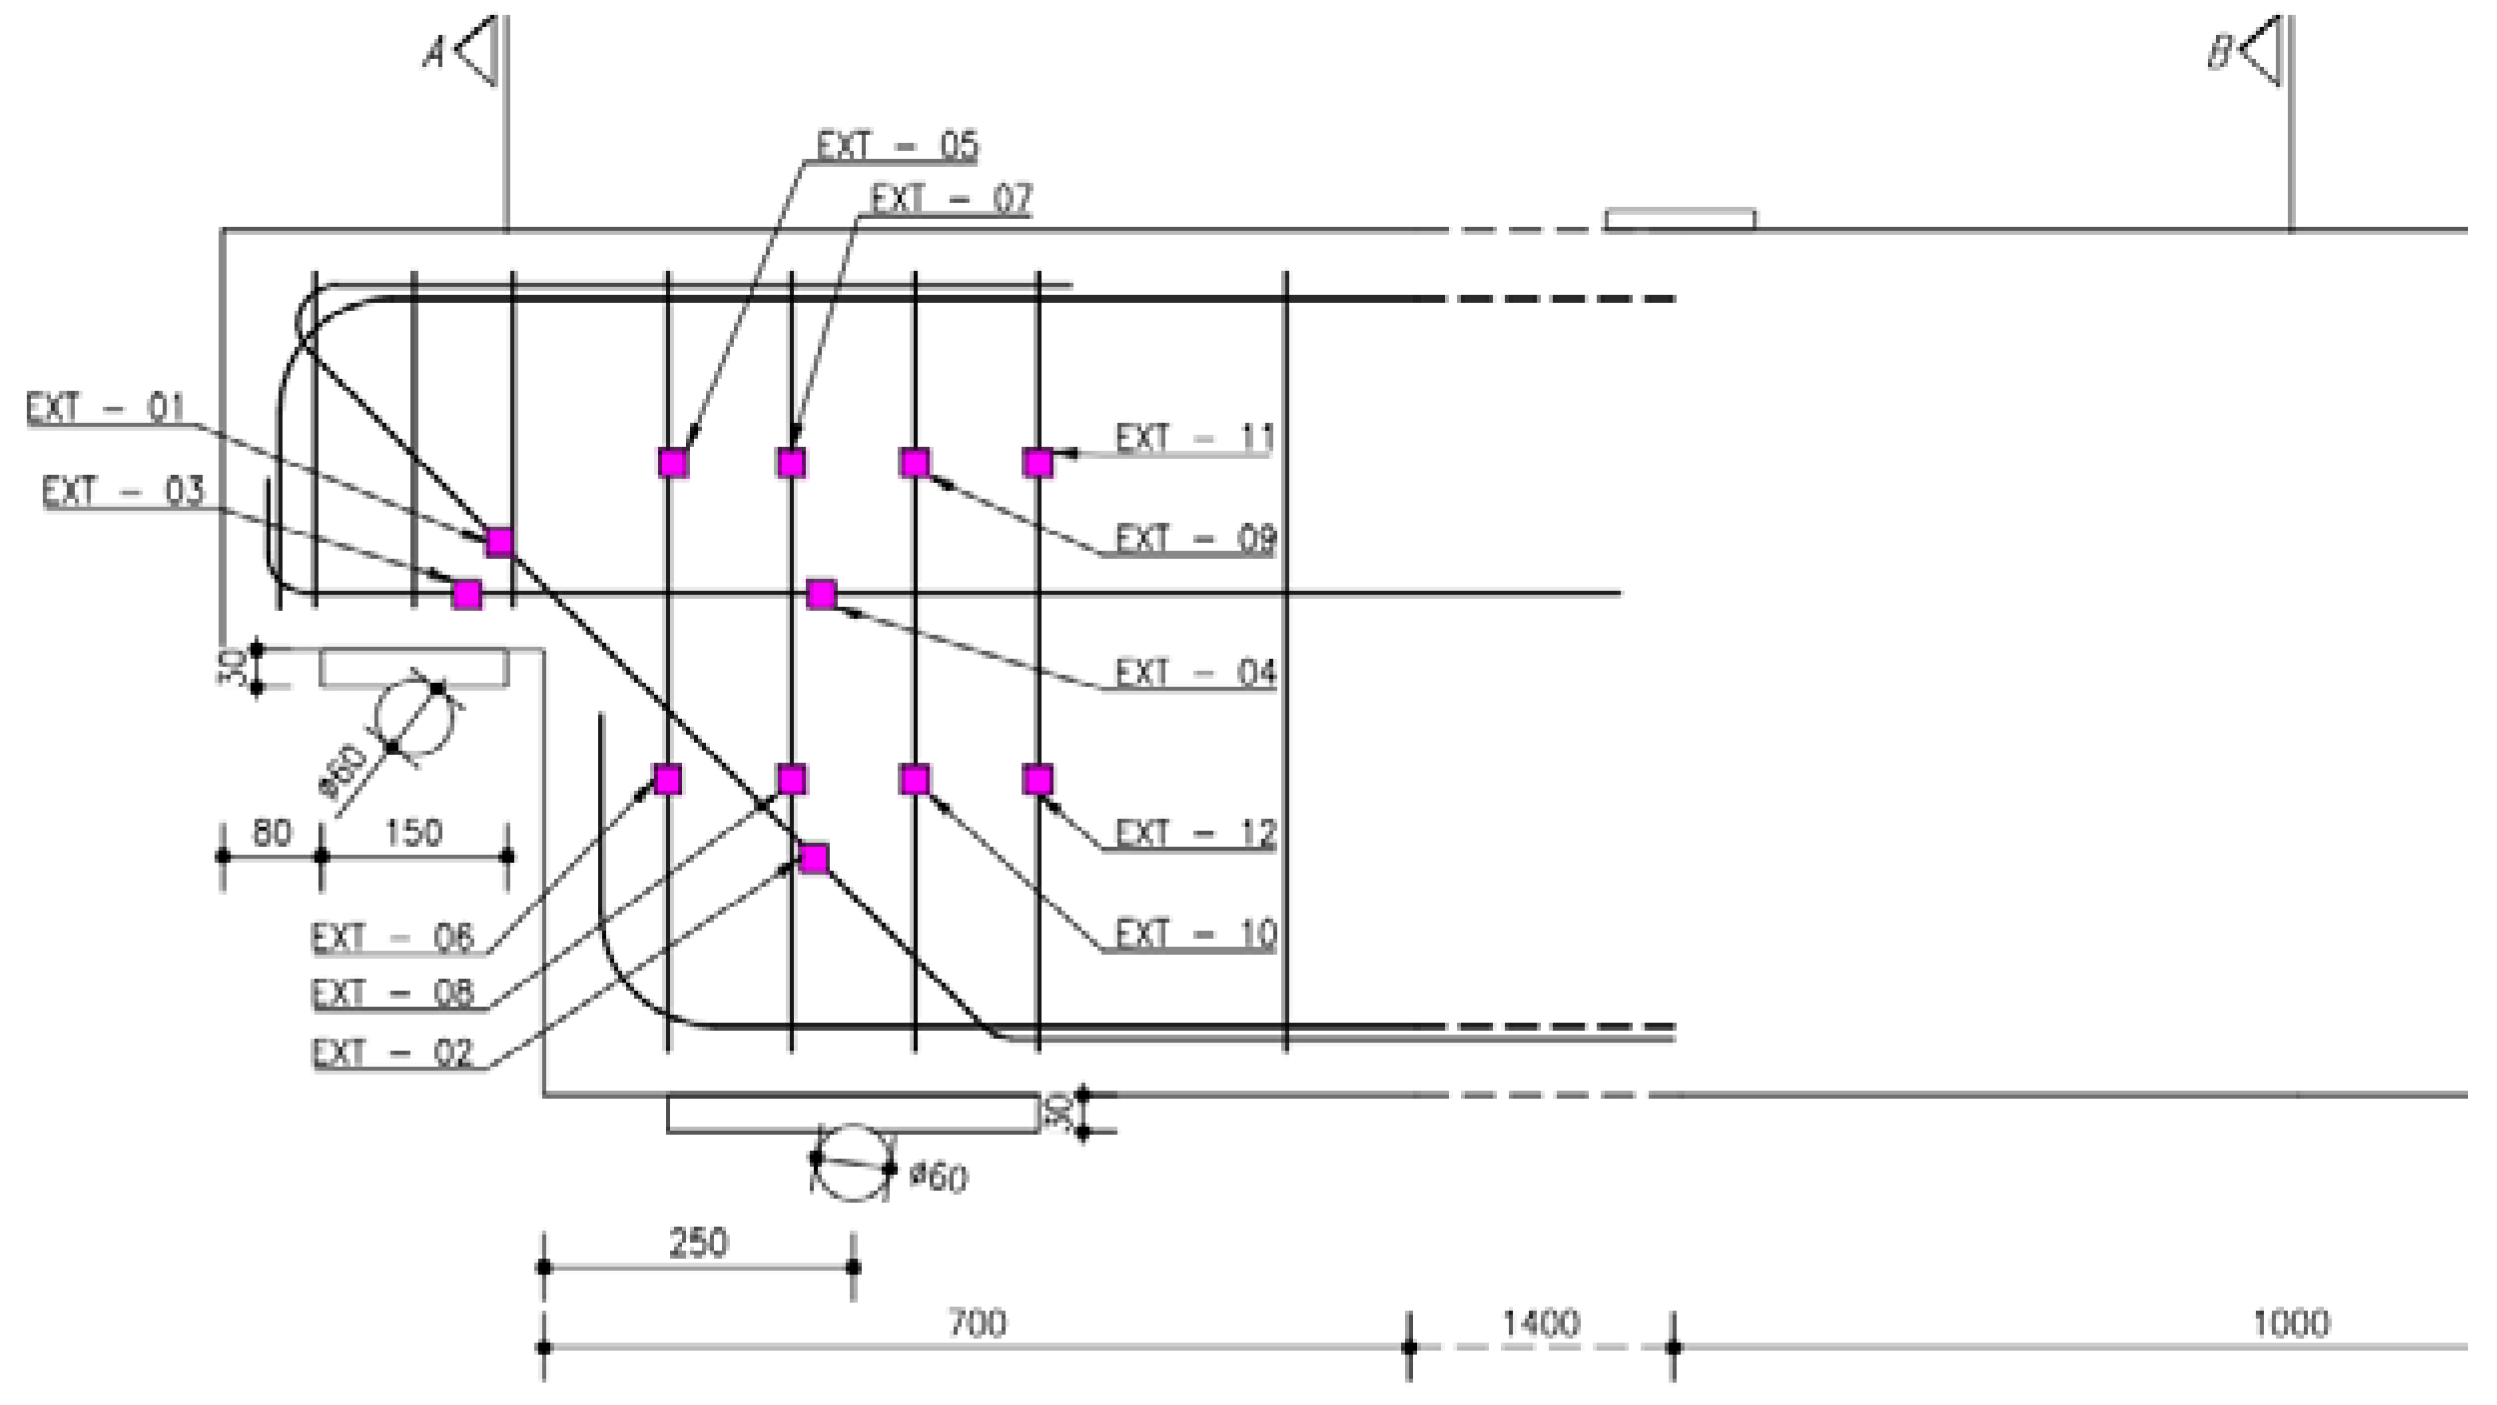
The load will be applied in a quasi-static configuration, and sensing devices will be applied to the specimens in several positions to track the behavior of the half-joint at several levels (Figure 9):
- There will be 4 + 2 strain gauges on the external concrete surface at the half-joint under evaluation (4) and at the mid-span (2) (in yellow);
- Crack meters in squared configuration will be placed at the re-entrant corner where the main cracks are expected (in green);
- Two strain gauges for each main reinforcement (diagonal, horizontal, and four stirrups) will be applied to the reinforcement rebars (in Figure 10).
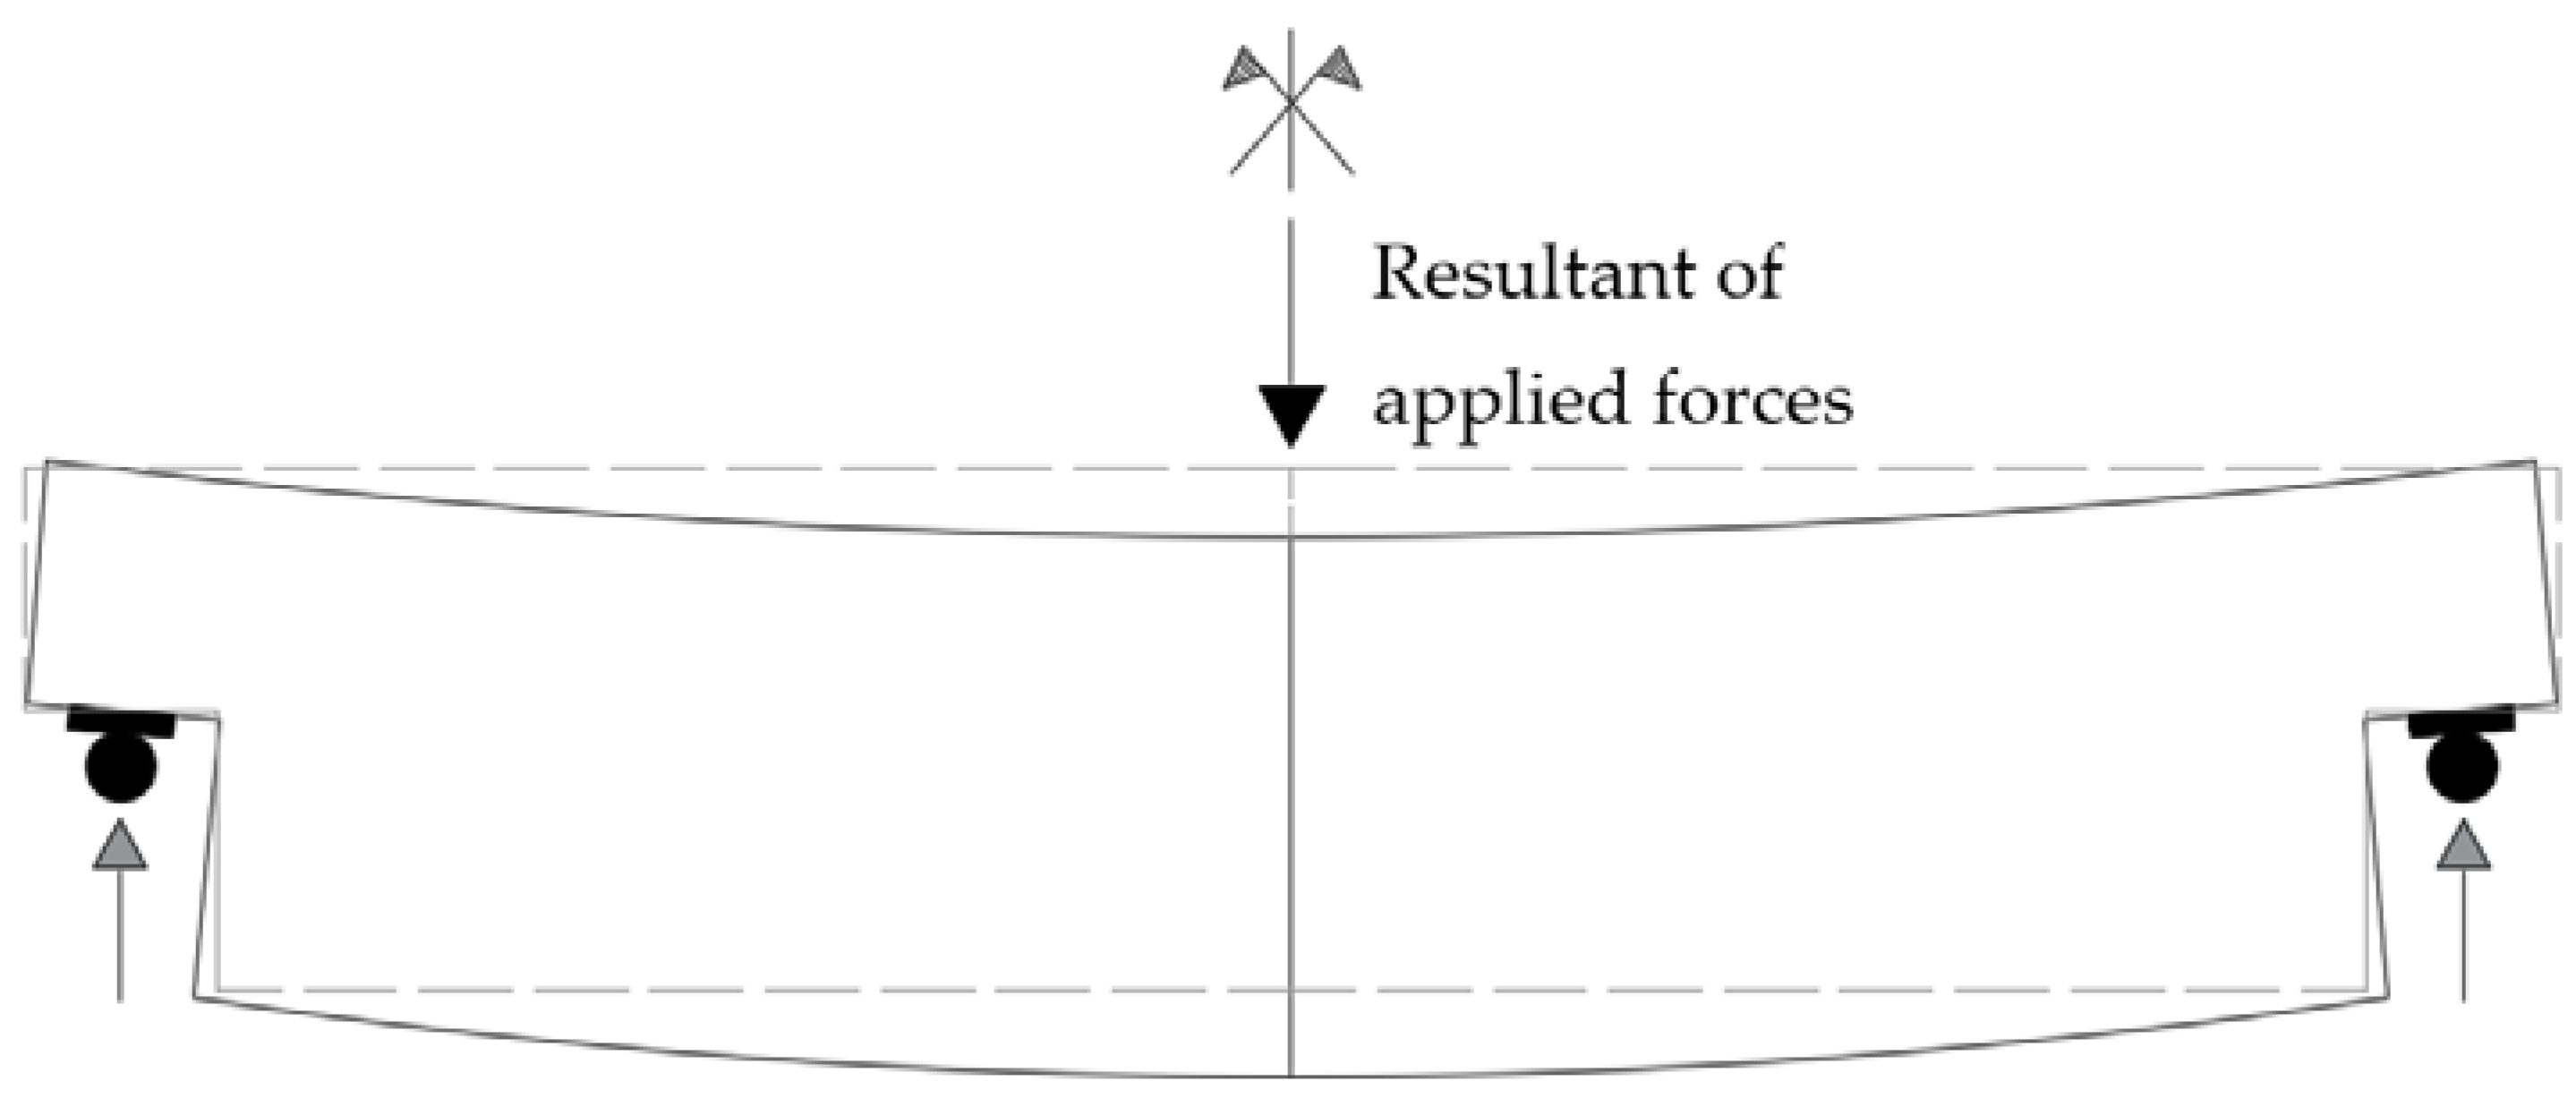
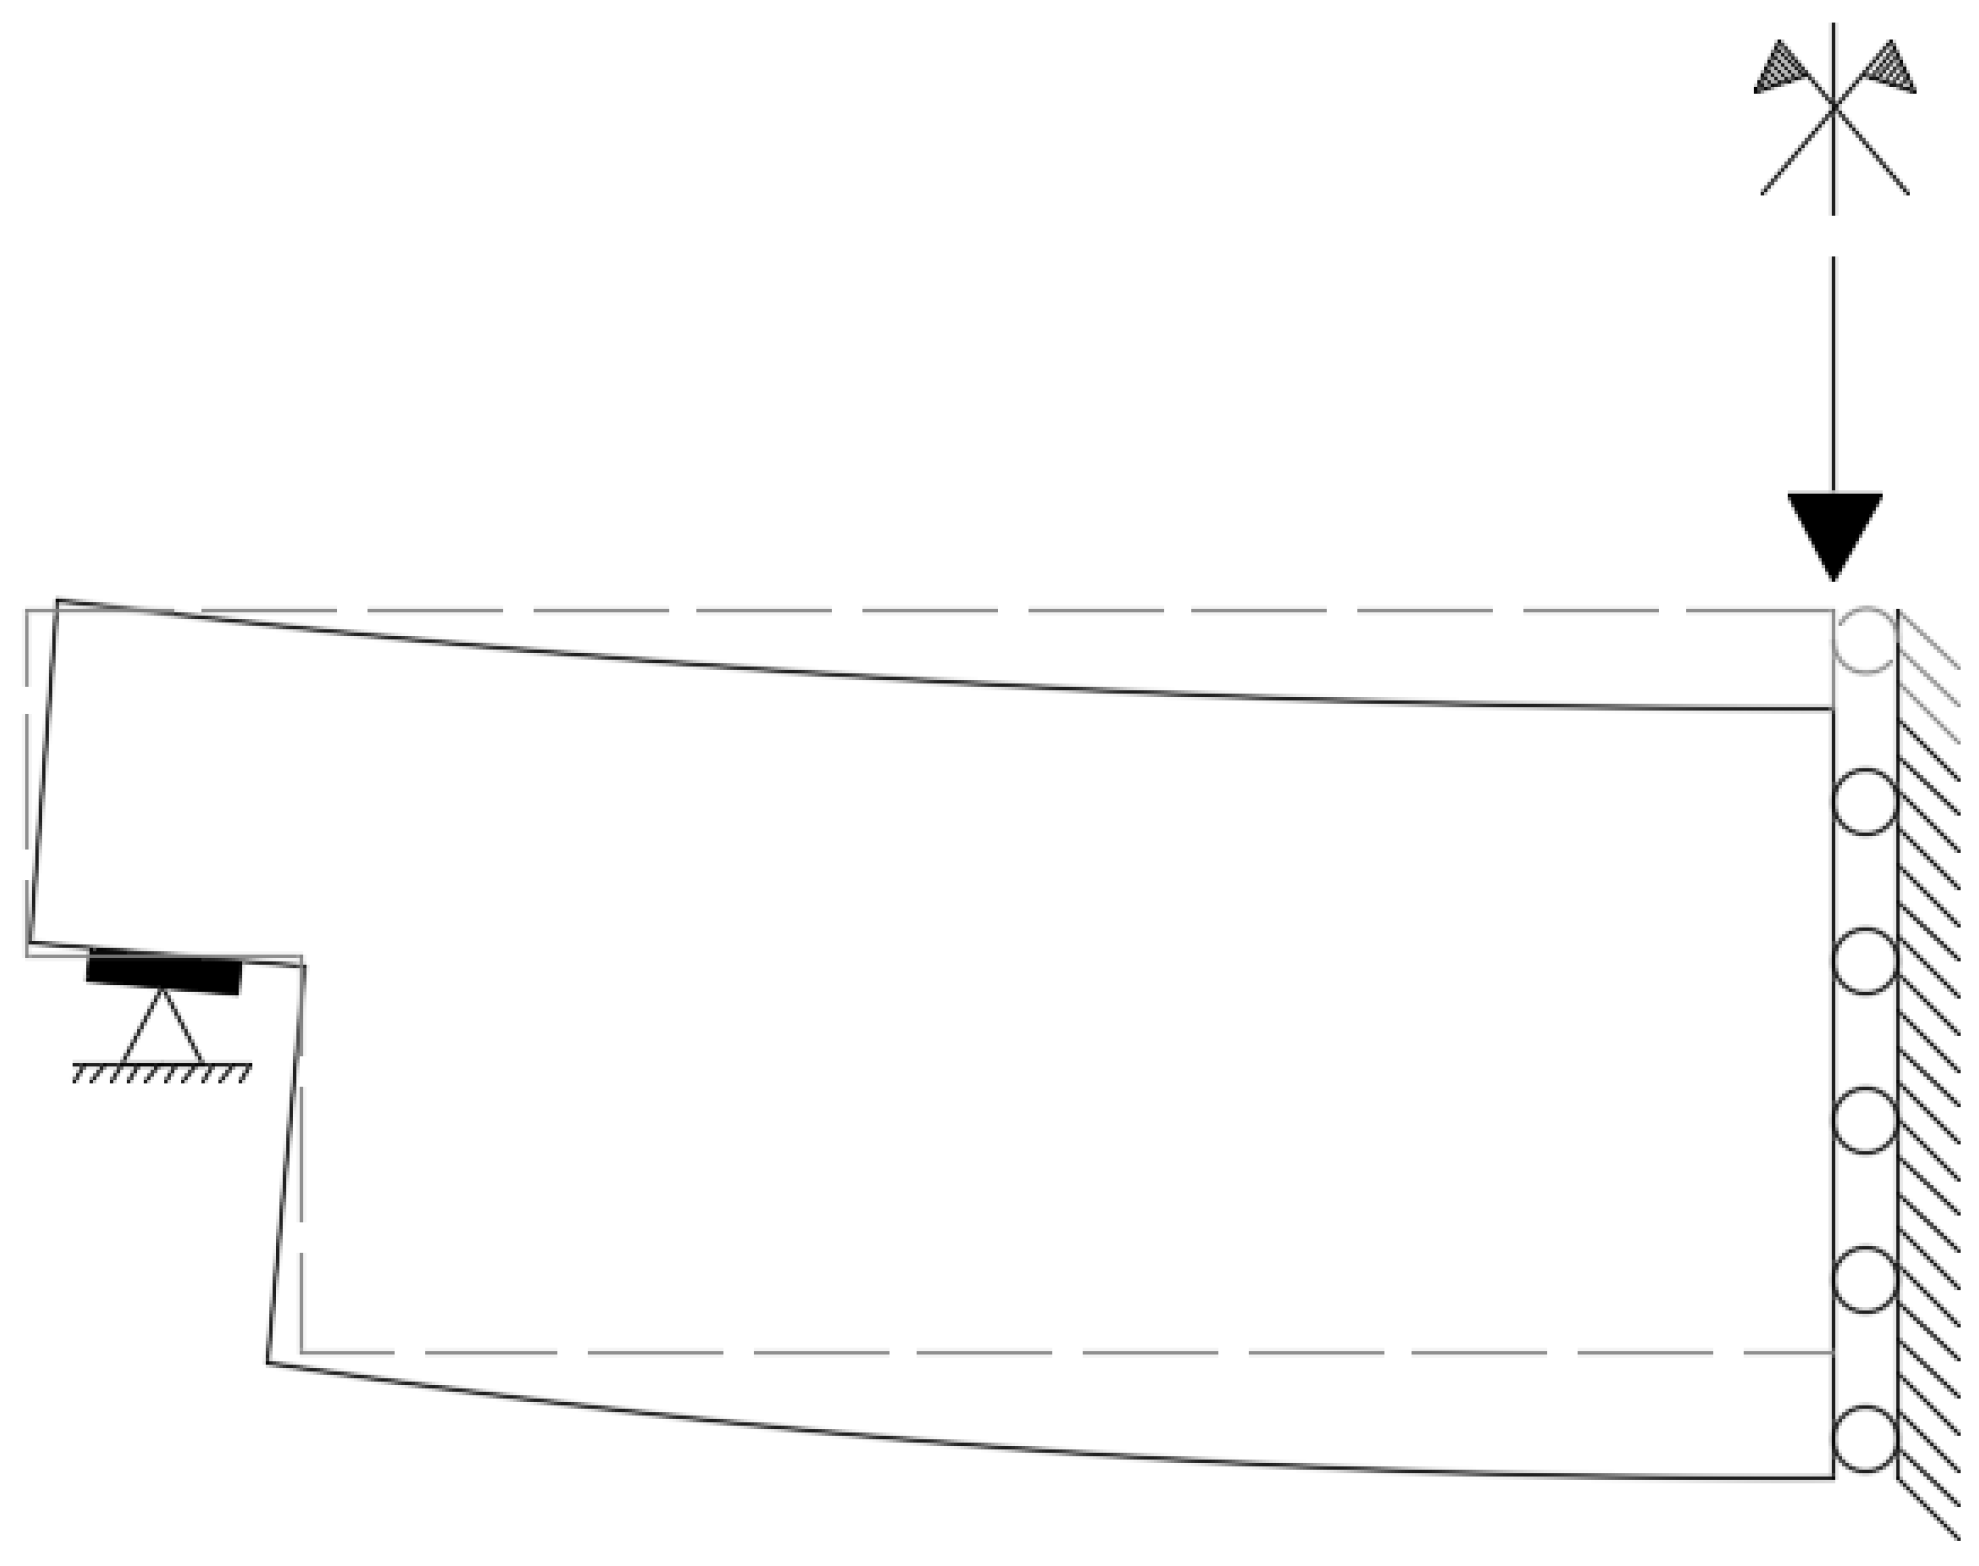
Moreover, the D-region of the half-joint will be painted (speckle pattern) with the purpose of DIC measuring (dotted area in Figure 9). Figure 11 depicts the simplified layout of the specimen (deformed and undeformed) with the boundary conditions.
The monitoring layout has been designed with the aim of detecting the most valuable technology for damage quantification. It is worth underlining how the speckle pattern region for DIC analyses will not be instrumented with crack meters, that are in fact applied to the opposite side of the beam.
Specifically, the SHM sensors are identified as follows:
- Strain gauges on the concrete surface will be necessary to match the information coming from the DIC at the deformed stages of the half-joint.
- Crack meters at the nib corner will be applied to quantify the crack width and to match the results coming from the DIC technique. The chosen position of the crack meters considers possible inclinations (varying from 40° to 75° [13]) of the main crack, which will develop at failure.
- The strain gauges to be applied to steel reinforcement will monitor bar stresses, highlighting their exploitation, and providing interesting data to be compared with the original reinforcement layout by Desnerck et al. [13].
- The speckle pattern region for the DIC registration will comprise the entire disturbed region of the element. The results coming from the application of digital image correlation will be strengthened by the information provided by the strain gauges on concrete and the crack meters at the nib. With the purpose of avoiding compromising the interaction between several monitoring techniques, the strain gauges will be applied in the perimetral dotted area for the DIC, and the crack meters are fixed at the opposite side of the beam.
5. Emerging Monitoring Techniques for Half-Joints
As above mentioned, one of the main objectives of the experimental campaign is also to test some innovative and emerging monitoring solutions specifically for the case of half-joints.
The technologies intended to be applied during testing to evaluate their effectiveness and appropriateness for real-world applications are mainly digital image correlation (DIC), acoustic emission (AE), and distributed fiber optic (FOS) methods.
The first is a non-contact optical measurement technique designed to derive surface displacement and geometry profiles at various stages or times from images taken with a camera (or multi-camera). It has been suggested for structural monitoring and inspection, and it has been successfully used in the past to assess various structures at various scales (e.g., [20,21,22]). A stochastic pattern (e.g., black dots on a white background) must be put to the surface of interest in order to perform a DIC measurement. As the surface deforms over time, the relative positions of each of the dots are determined. White pixels have a grayscale level of 0, while black pixels have a level of 100. Each image can be thought of as a matrix of natural integers. The basic purpose of DIC is to match the same physical point between many deformed images and a reference image using continuous patterns with different grayscales.
The AE monitoring of RC beams can be used to confirm various damage mechanisms and levels, including tensile cracking followed by shear cracking, reinforced steel yielding, and crushing. The two primary stages of fracture propagation are the development of uncorrelated tensile fractures between the core stresses and the emergence of diagonal shear cracks that connect the tensile cracks that have already developed. Trends that can be attributed to various damage stages can be found by statistical analysis of the AE signal properties. To gather the information for damage detection, high-frequency sensors can be mounted on the concrete surface in an appropriate arrangement. Therefore, using the piezoelectric effect, the perturbation of the sensors’ surface, when they are struck by a wave (due to crack propagation or another reason) is transformed into an electric voltage. Amplitude, duration, and ring-down counts, or the total number of times the signal exceeds the threshold level, can all be automatically extracted and stored [20].
To detect strain and temperature, various FOS-distributed sensors can be mounted to the specimen surface and inserted into the concrete matrix. Additionally, they can be used on steel reinforcements. The backscattered light of Brillouin experiences a frequency shift proportional to the longitudinal strain when the optical fiber is stressed. Despite being sensitive across their whole length, fiber optic sensors take measurements at distinct places that are separated by a fixed length known as the “sampling interval”. The “spatial resolution” parameter is the average across a specific length. More details can be found in the literature, e.g., [20,21,23].
Focusing on the use of the DIC, it lends itself to multiple installations, each deserving of specific evaluations. In particular, the DIC equipment can be installed on the element to be monitored near the half-joint. However, considering that such connections may be in very awkward positions to be reached or exposed, the possibility of equipping drones with the DIC system is another possibility of interest. Such solutions have several critical aspects that will have to be evaluated, such as, for example, the quality and measurement possibility related to different light exposures in the real world. Moreover, the DIC could be used for continuous monitoring, or periodic monitoring over short periods with transit of vehicles or following a standard protocol under controlled loading conditions (proof load testing of existing or new structures).
Considering periodic monitoring without traffic interruption (output-only), a possible damage detection scheme could be focused on the statistical distribution of crack opening (see Figure 12), evaluating the damage progression in terms of mean variation Δm(t) and/or standard deviation variation Δstd(t).
6. Finite Element Analysis
Five half-joints are modeled in ANSYS [24] environment, with the purpose of studying the crack generation and propagation of three-dimensional nonlinear models.
One model is representing the half-joint without steel reinforcement, while the remaining four models highlight the role of four steel layouts in the cracking pattern and the achievement of the collapse condition (Figure 3 and Figure 4). The distribution of steel rebars and the geometry of the half-joints are inspired by the paper of Desnerck, Lees, and Morley [16].
6.1. Modelling and Materials
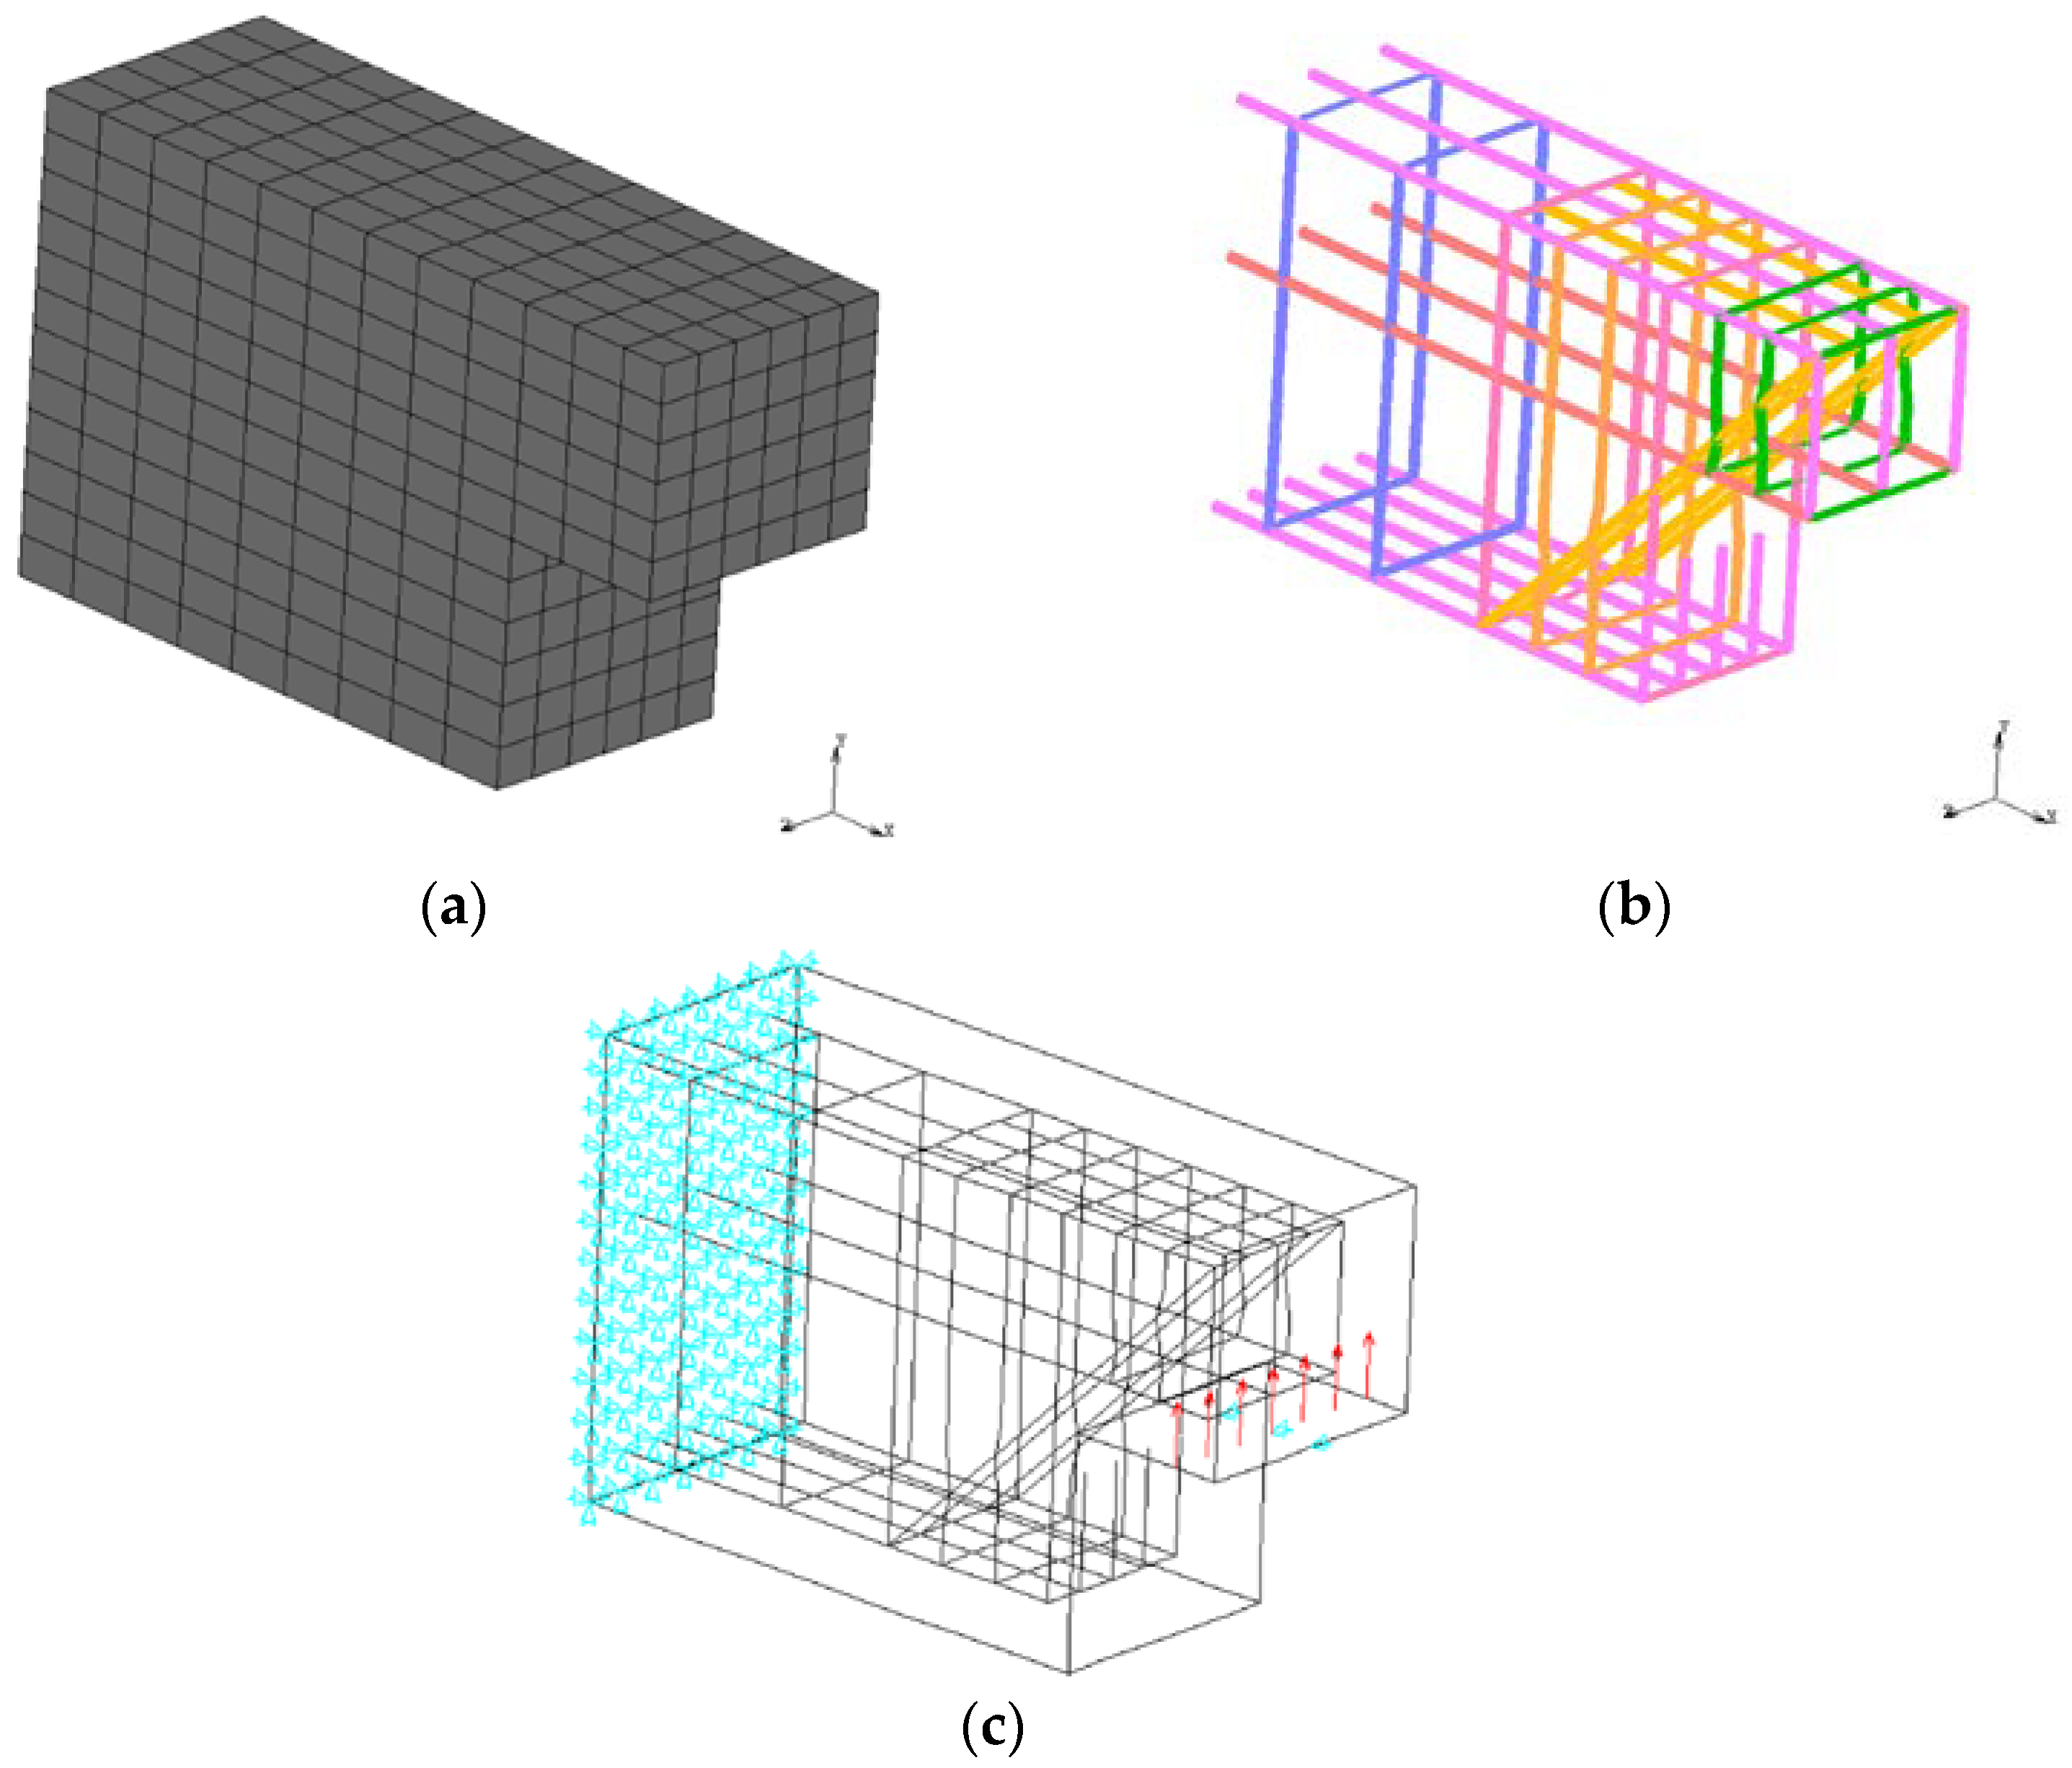
The finite element used to create the concrete matrix mesh is an eight-node isoparametric element, identified by the acronym SOLID65, which allows the modeling of material nonlinearity. Concrete is considered a material subject to brittle-type failure, with failure modes such as crushing and cracking failure.
The concrete failure criterion implemented in the code takes into account a multi-axial stress state [24,25]. To define the failure surface, it is necessary to provide the code with some strength parameters and a value for the hydrostatic tension state. In this case, the value for the maximum uniaxial tensile stress (2400 kPa) and the maximum uniaxial compressive stress (24,000 kPa) has been specified. The failure surface can therefore still be specified by providing only two parameters, while the other parameters assume preset values in this case. However, these settings are valid only if the stress state has a small hydrostatic tension component, as in the case of the present study [24,25].
Steel reinforcement has been modeled in a discrete fashion between consecutive nodes and positioned according to the design drawings. Two-node TRUSS180 [24] elements were used, without flexural stiffness and with action in tension and compression. The constitutive law is elastic perfectly plastic with a yielding stress of 235 MPa. The discrete fashion of reinforcement modeling is in contrast with the smeared one allowed by the SOLID65 element, implemented for example in [24]. This choice of discrete bar modeling arises from the complexity of the reinforcement distribution that characterizes the joint and involved several constraints in preparing the mesh to achieve the correct alignment of the nodes (Figure 13).
6.2. Boundary Conditions
Due to the symmetry of the specimen shown in Figure 14, only half the beam has been analyzed. However, in order to focus specifically on the half-joint area, to reduce the size of the model, and to simplify the computational burden in terms of the number of degrees of freedom, calculation time, and output size, the model was further reduced in its longitudinal dimension to a total length of 1.16 m (Figure 13).
7. Results
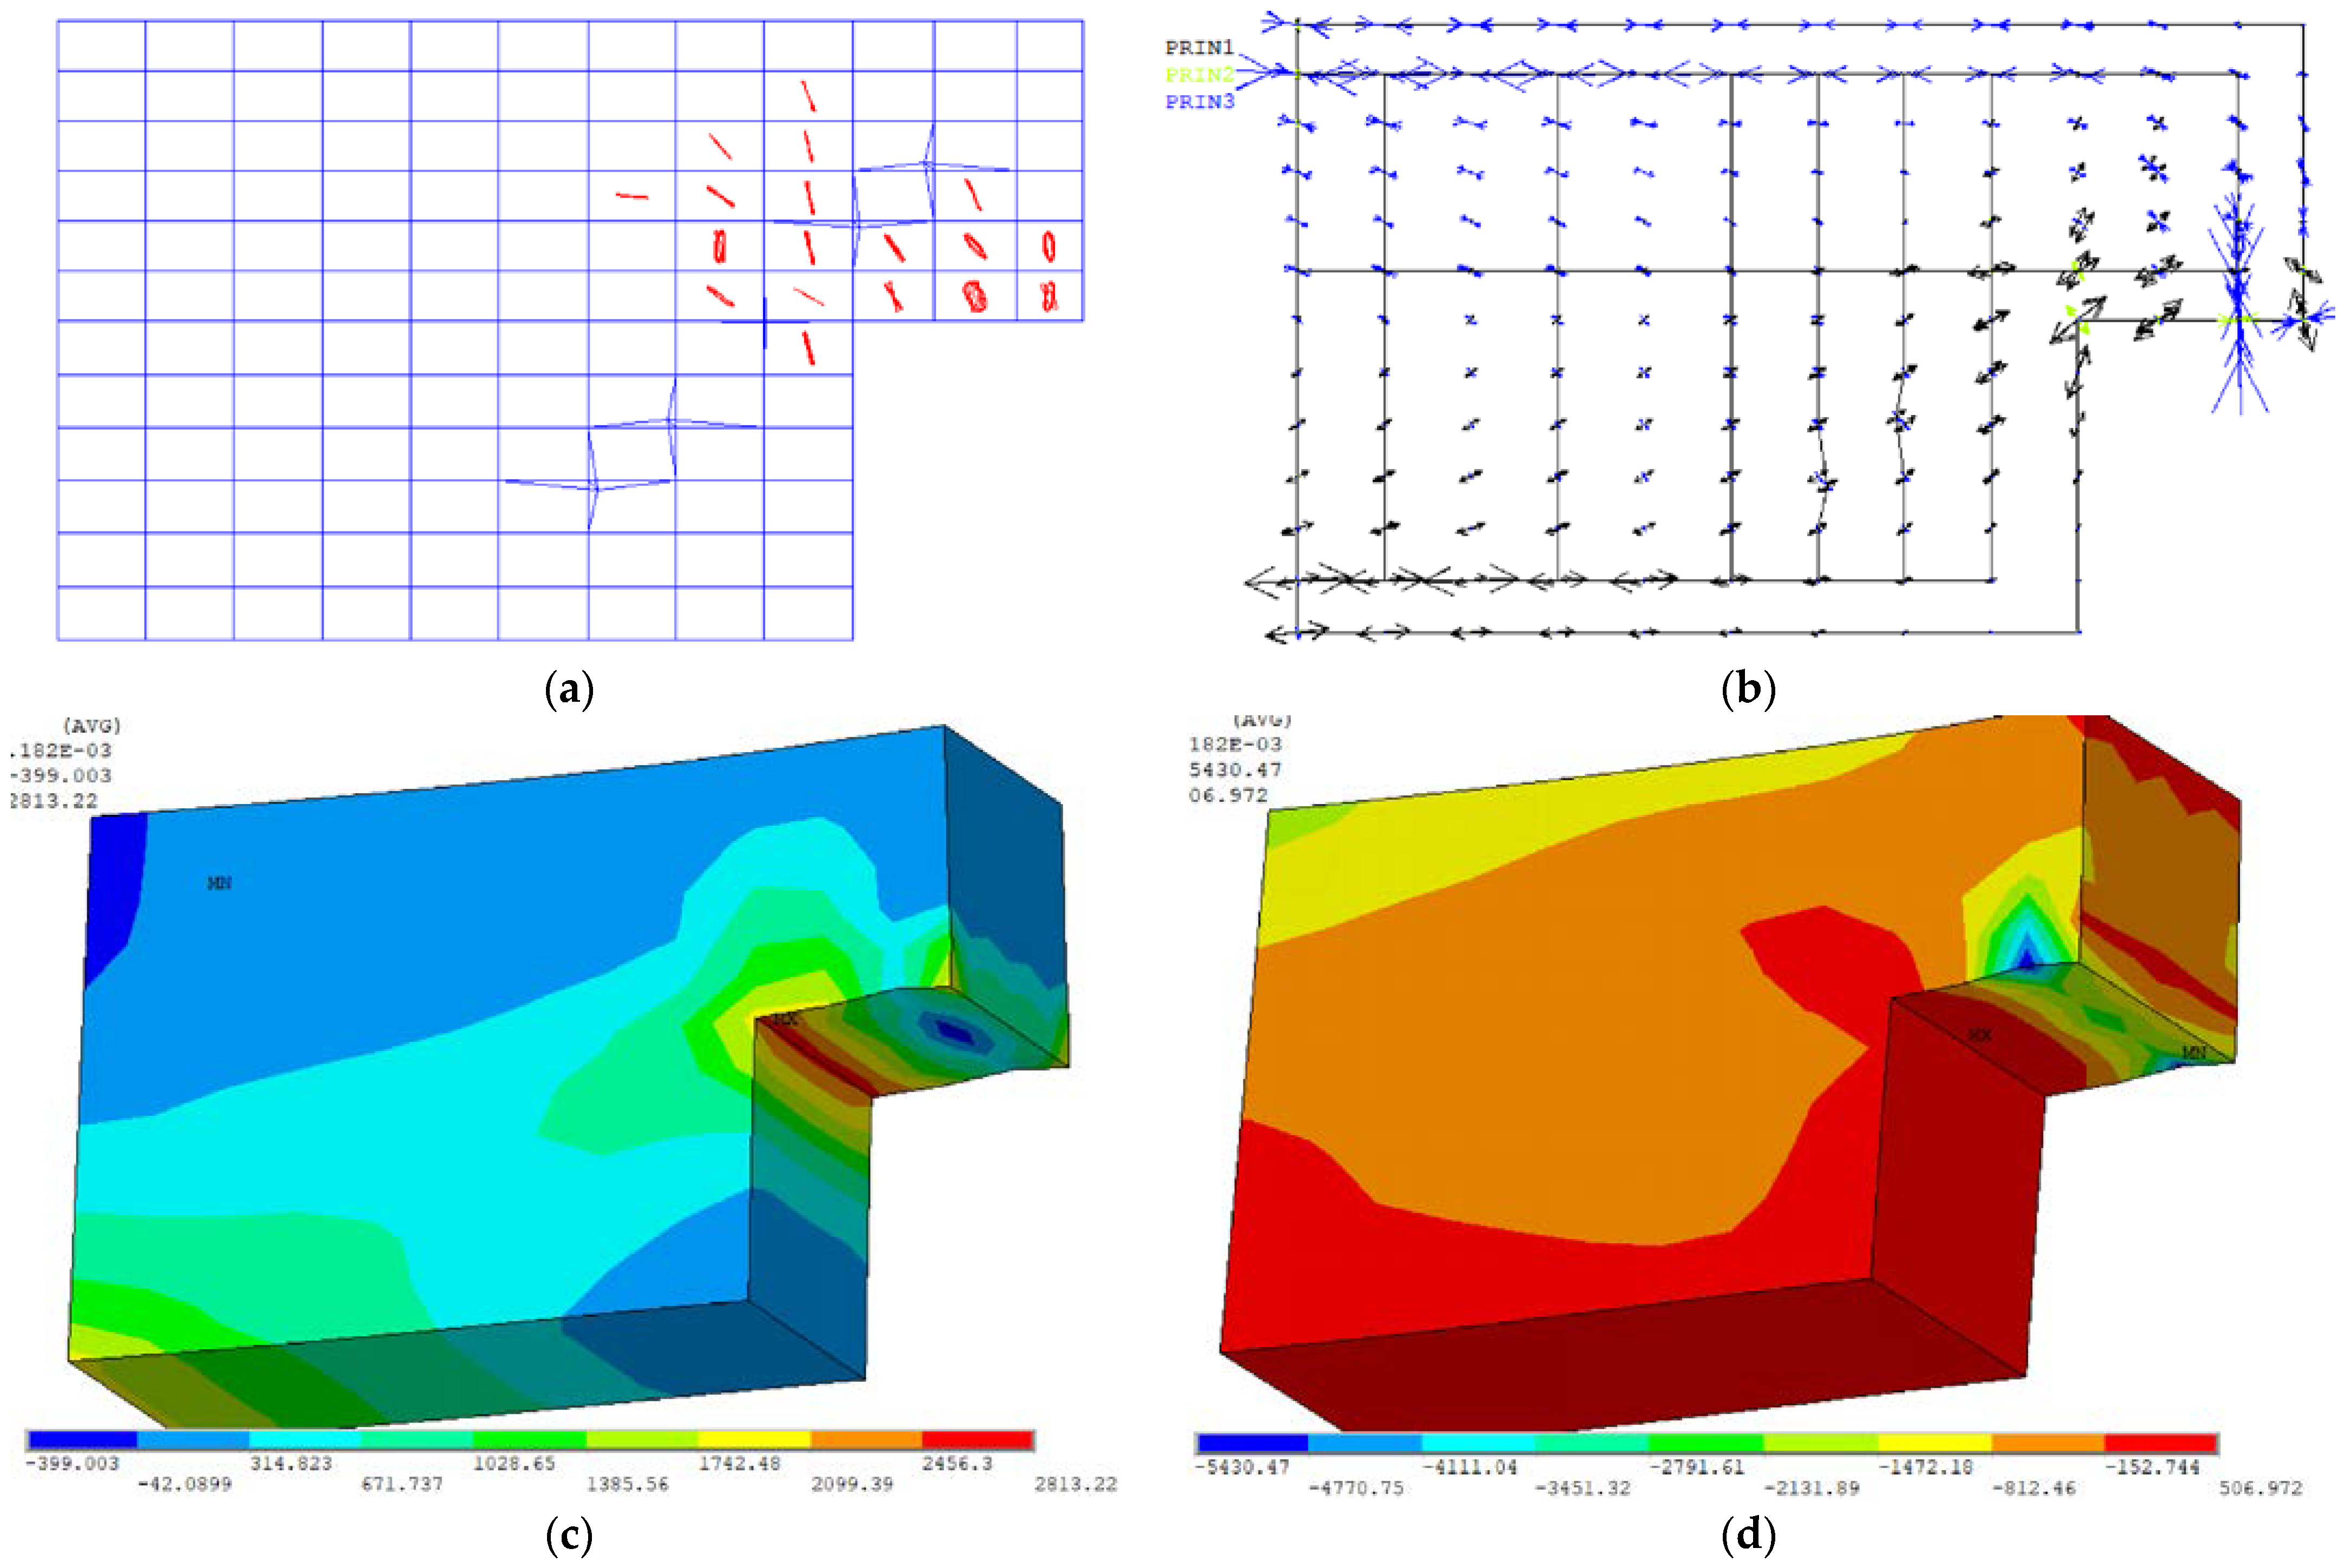
The nonlinear model with a longitudinal axis along the z direction is subjected to external forces linearly incremented during the static analysis time, directed as the y-axis, with a total final intensity of 800 kN (Figure 13c).
In Figure 15, Figure 16, Figure 17, Figure 18 and Figure 19 the results of the analyses are shown. First, the model without steel reinforcement is reported (Figure 15), and then the four reinforcement configurations (Figure 16, Figure 17, Figure 18 and Figure 19) as designed (NS-REF, NS-NU, NS-ND, NS-RS).
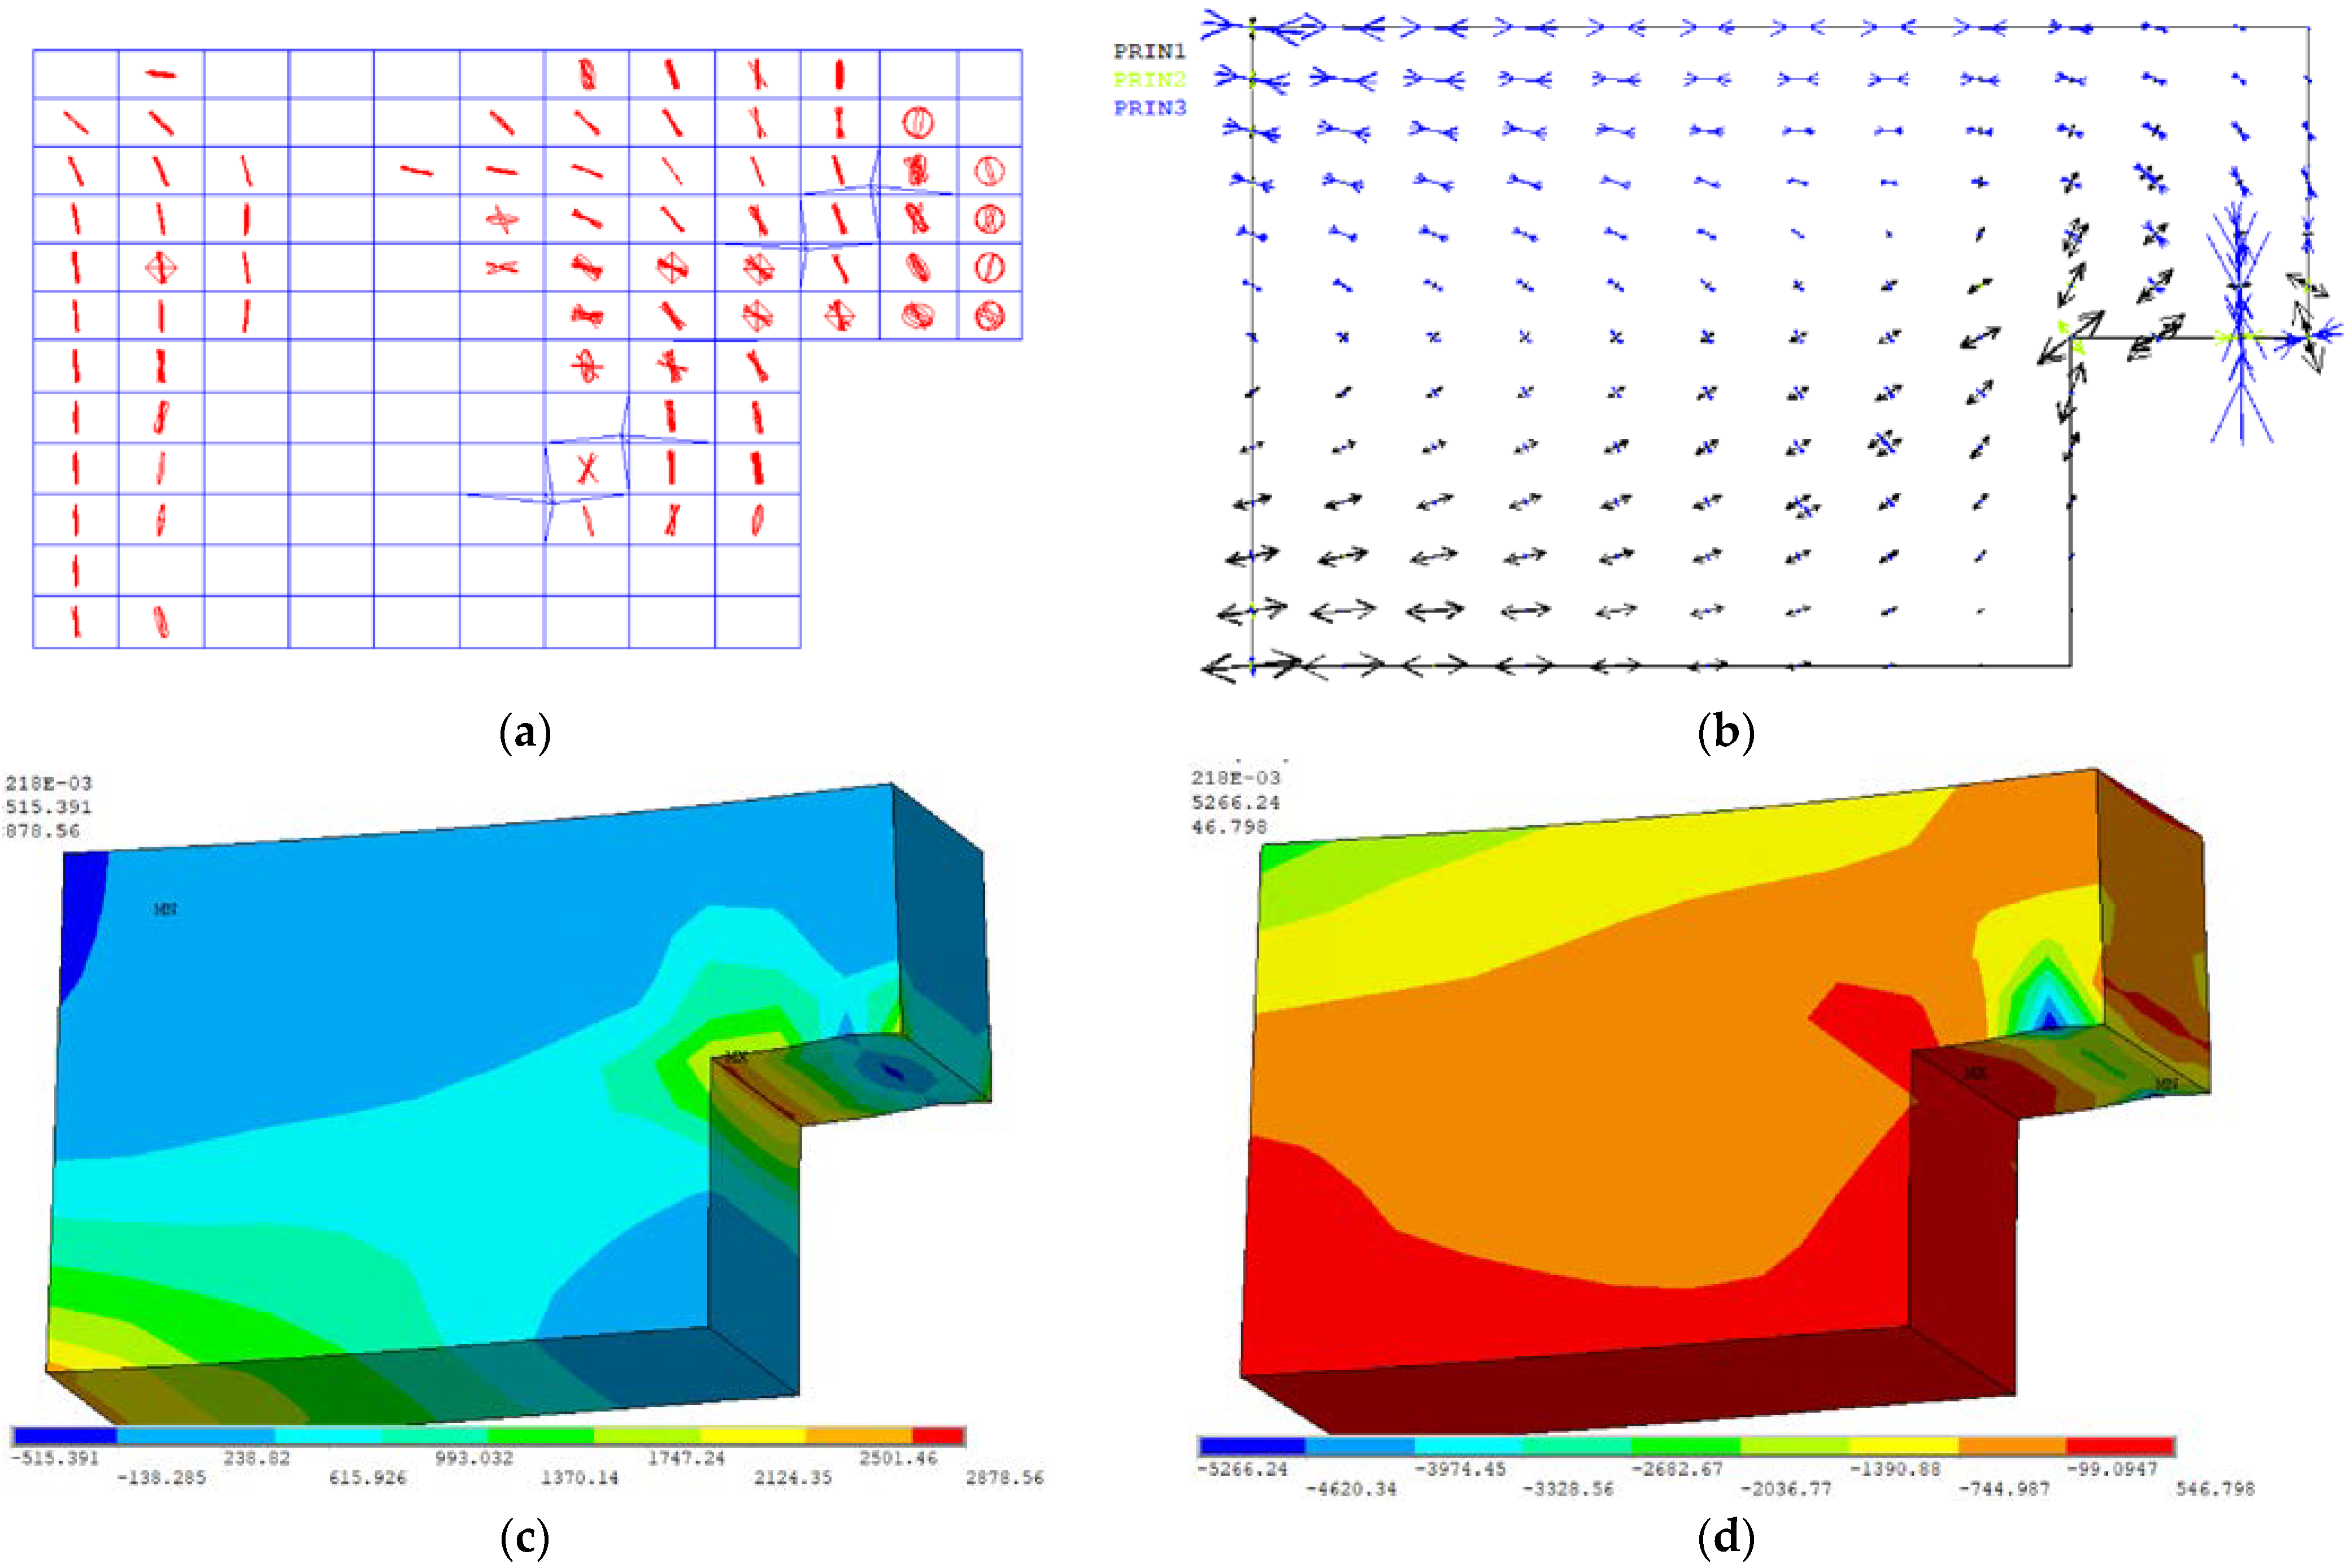
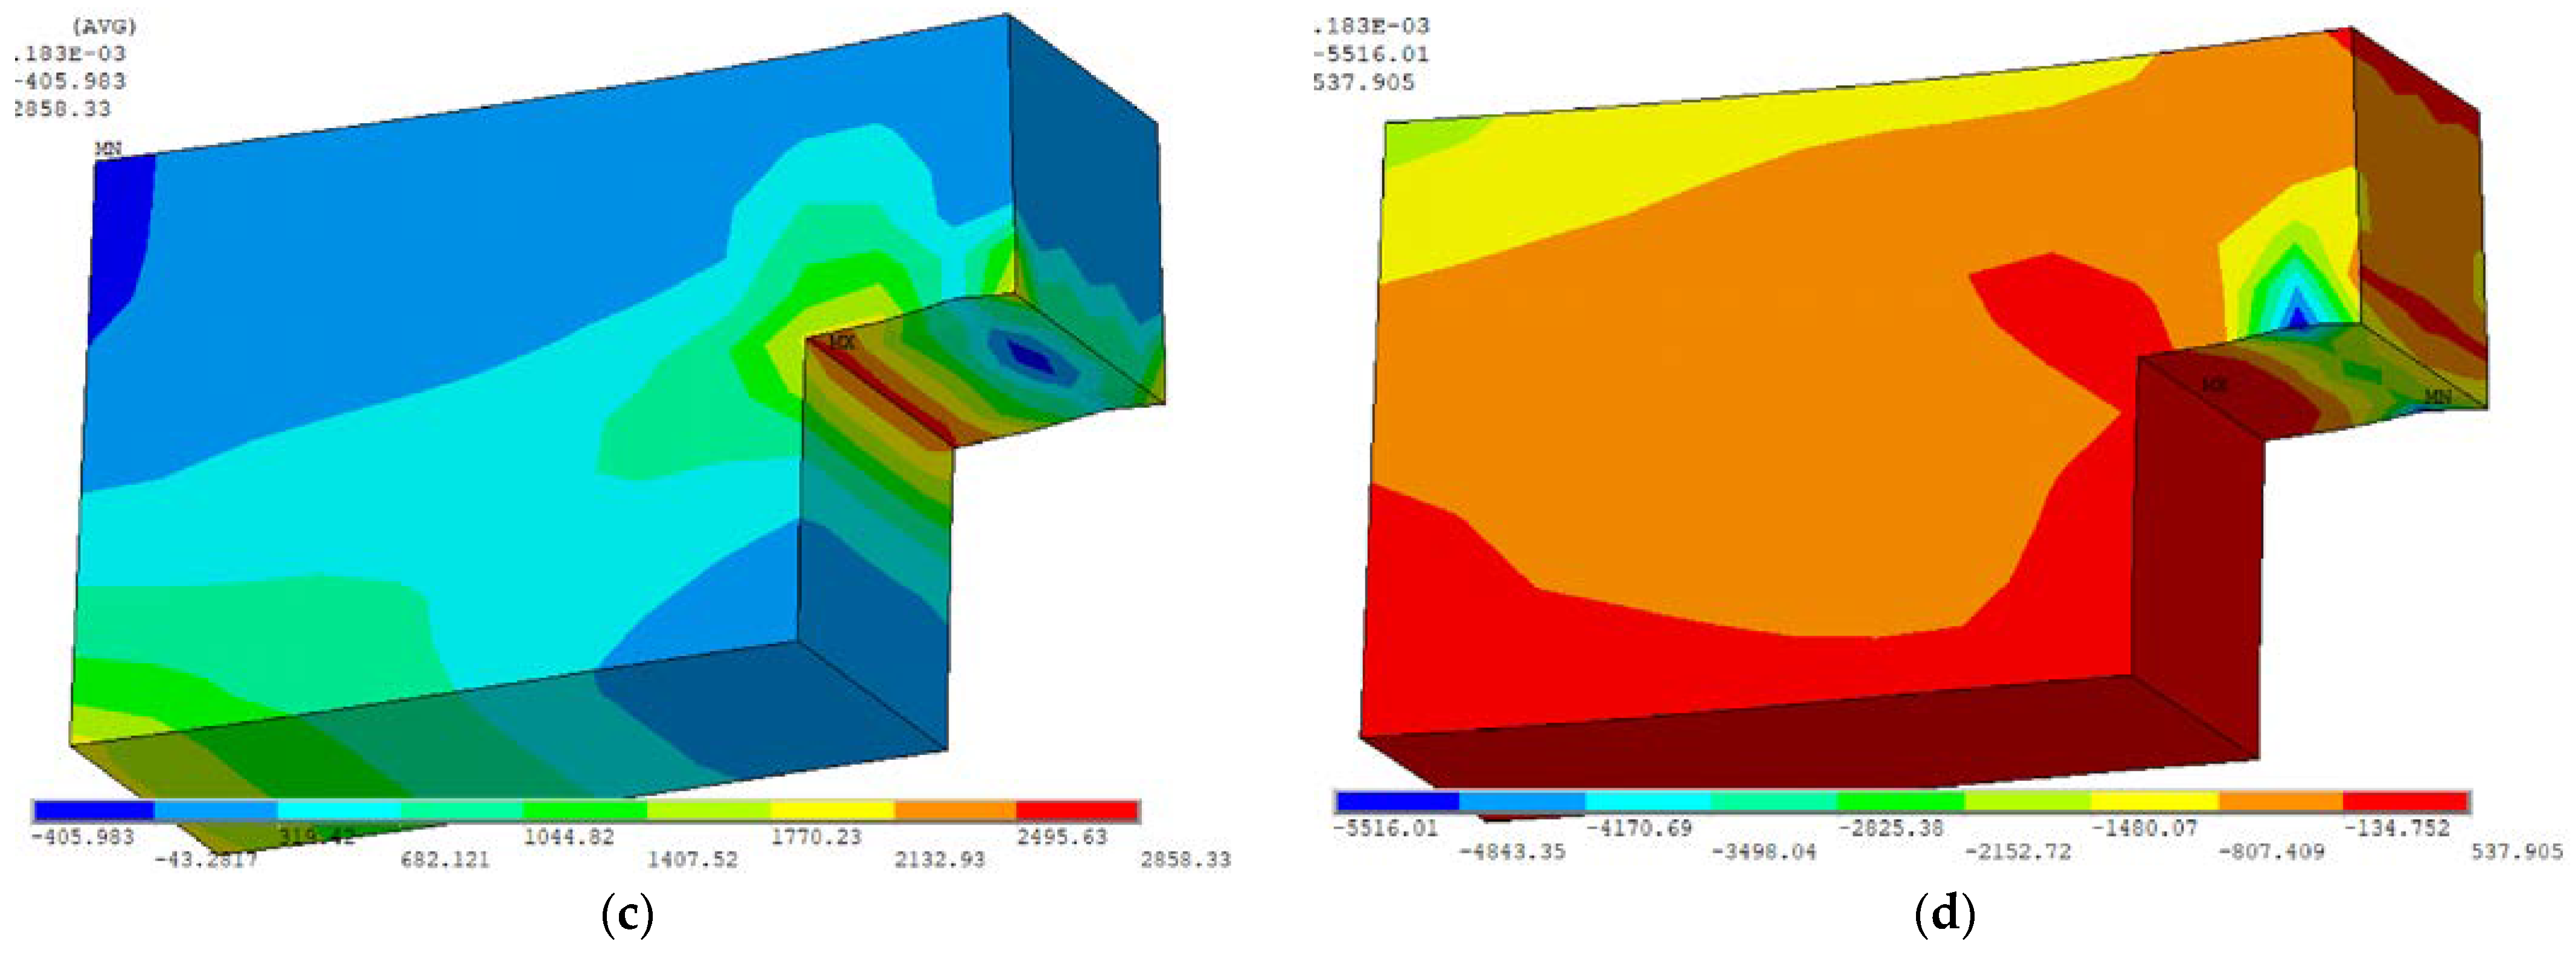
The beam configuration without steel reinforcement highlights the spreading of cracks in the whole model at the ultimate state (Figure 15a). The first principal stress at the re-entrant corner is clearly oriented for a crack opening at 45° due to shear effects (Figure 15b). The collapse occurs when the tensile limit (2400 kPa) is reached for the first principal stresses at the re-entrant corner (Figure 15c). The third principal stress remains far from its characteristic limit of 2000 kPa (Figure 15d).
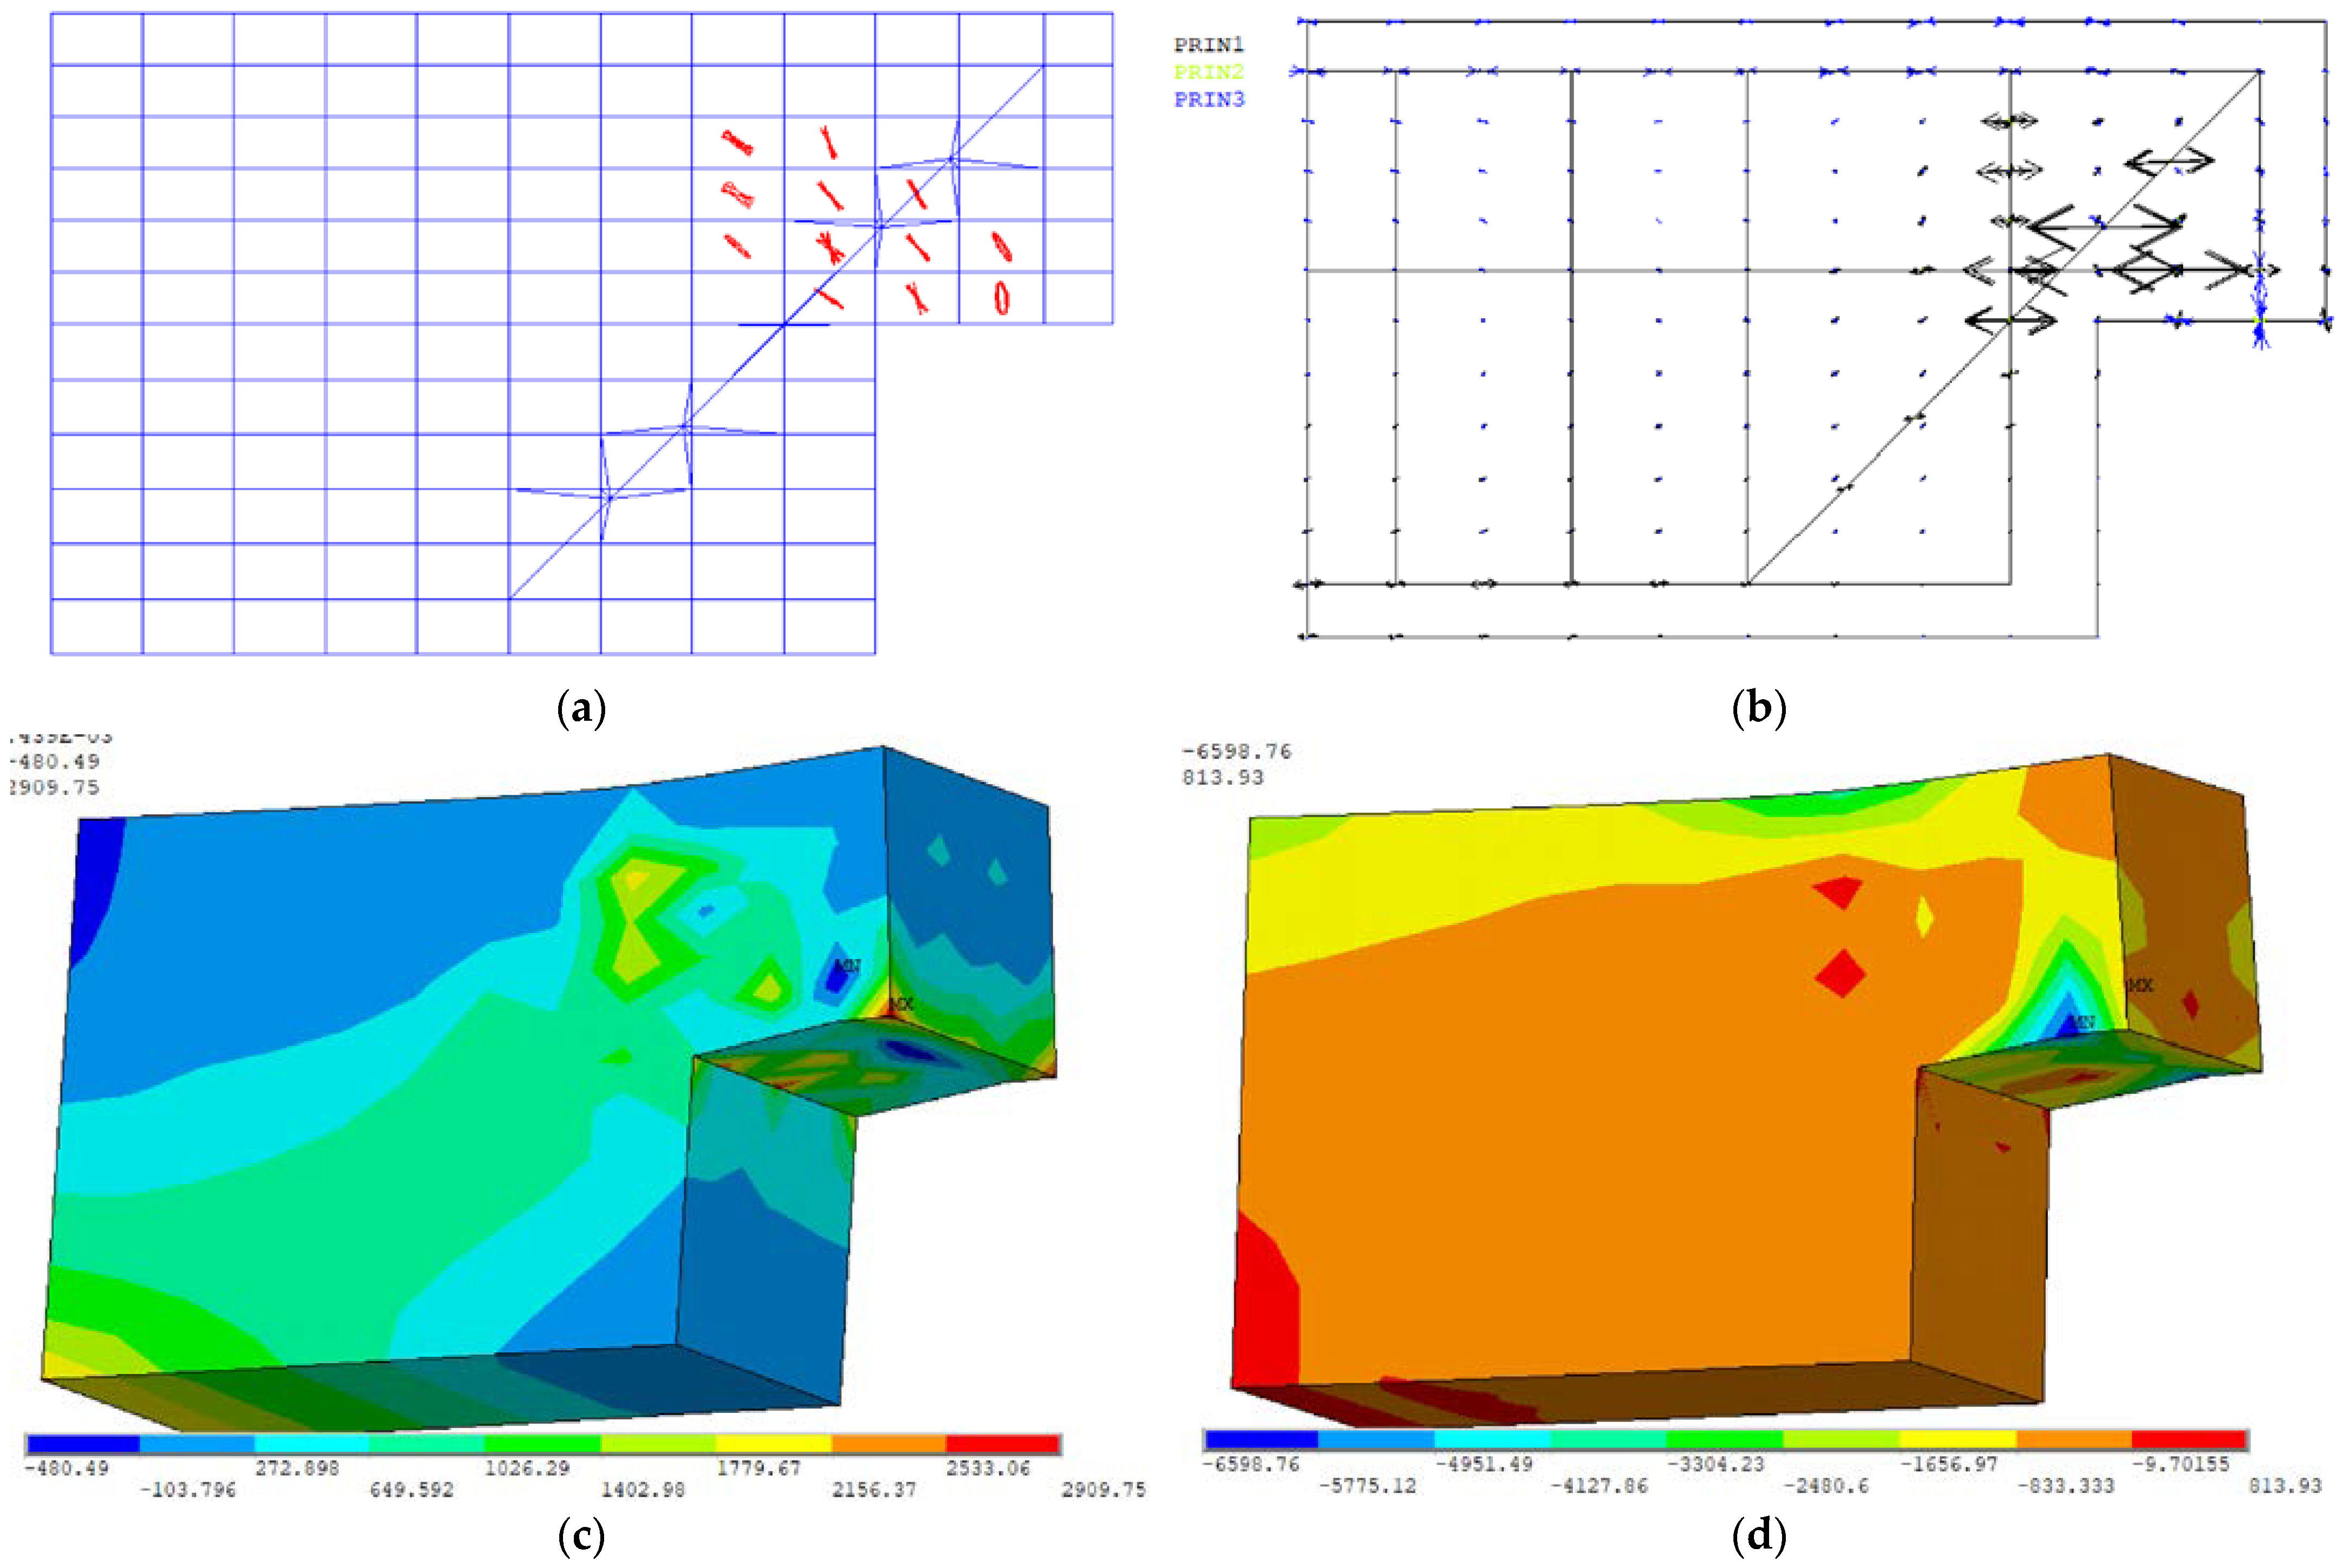
Focusing on the beam configurations with steel reinforcement (NS-REF, NS-NU, NS-ND, NS-RS), the following observations can be provided:
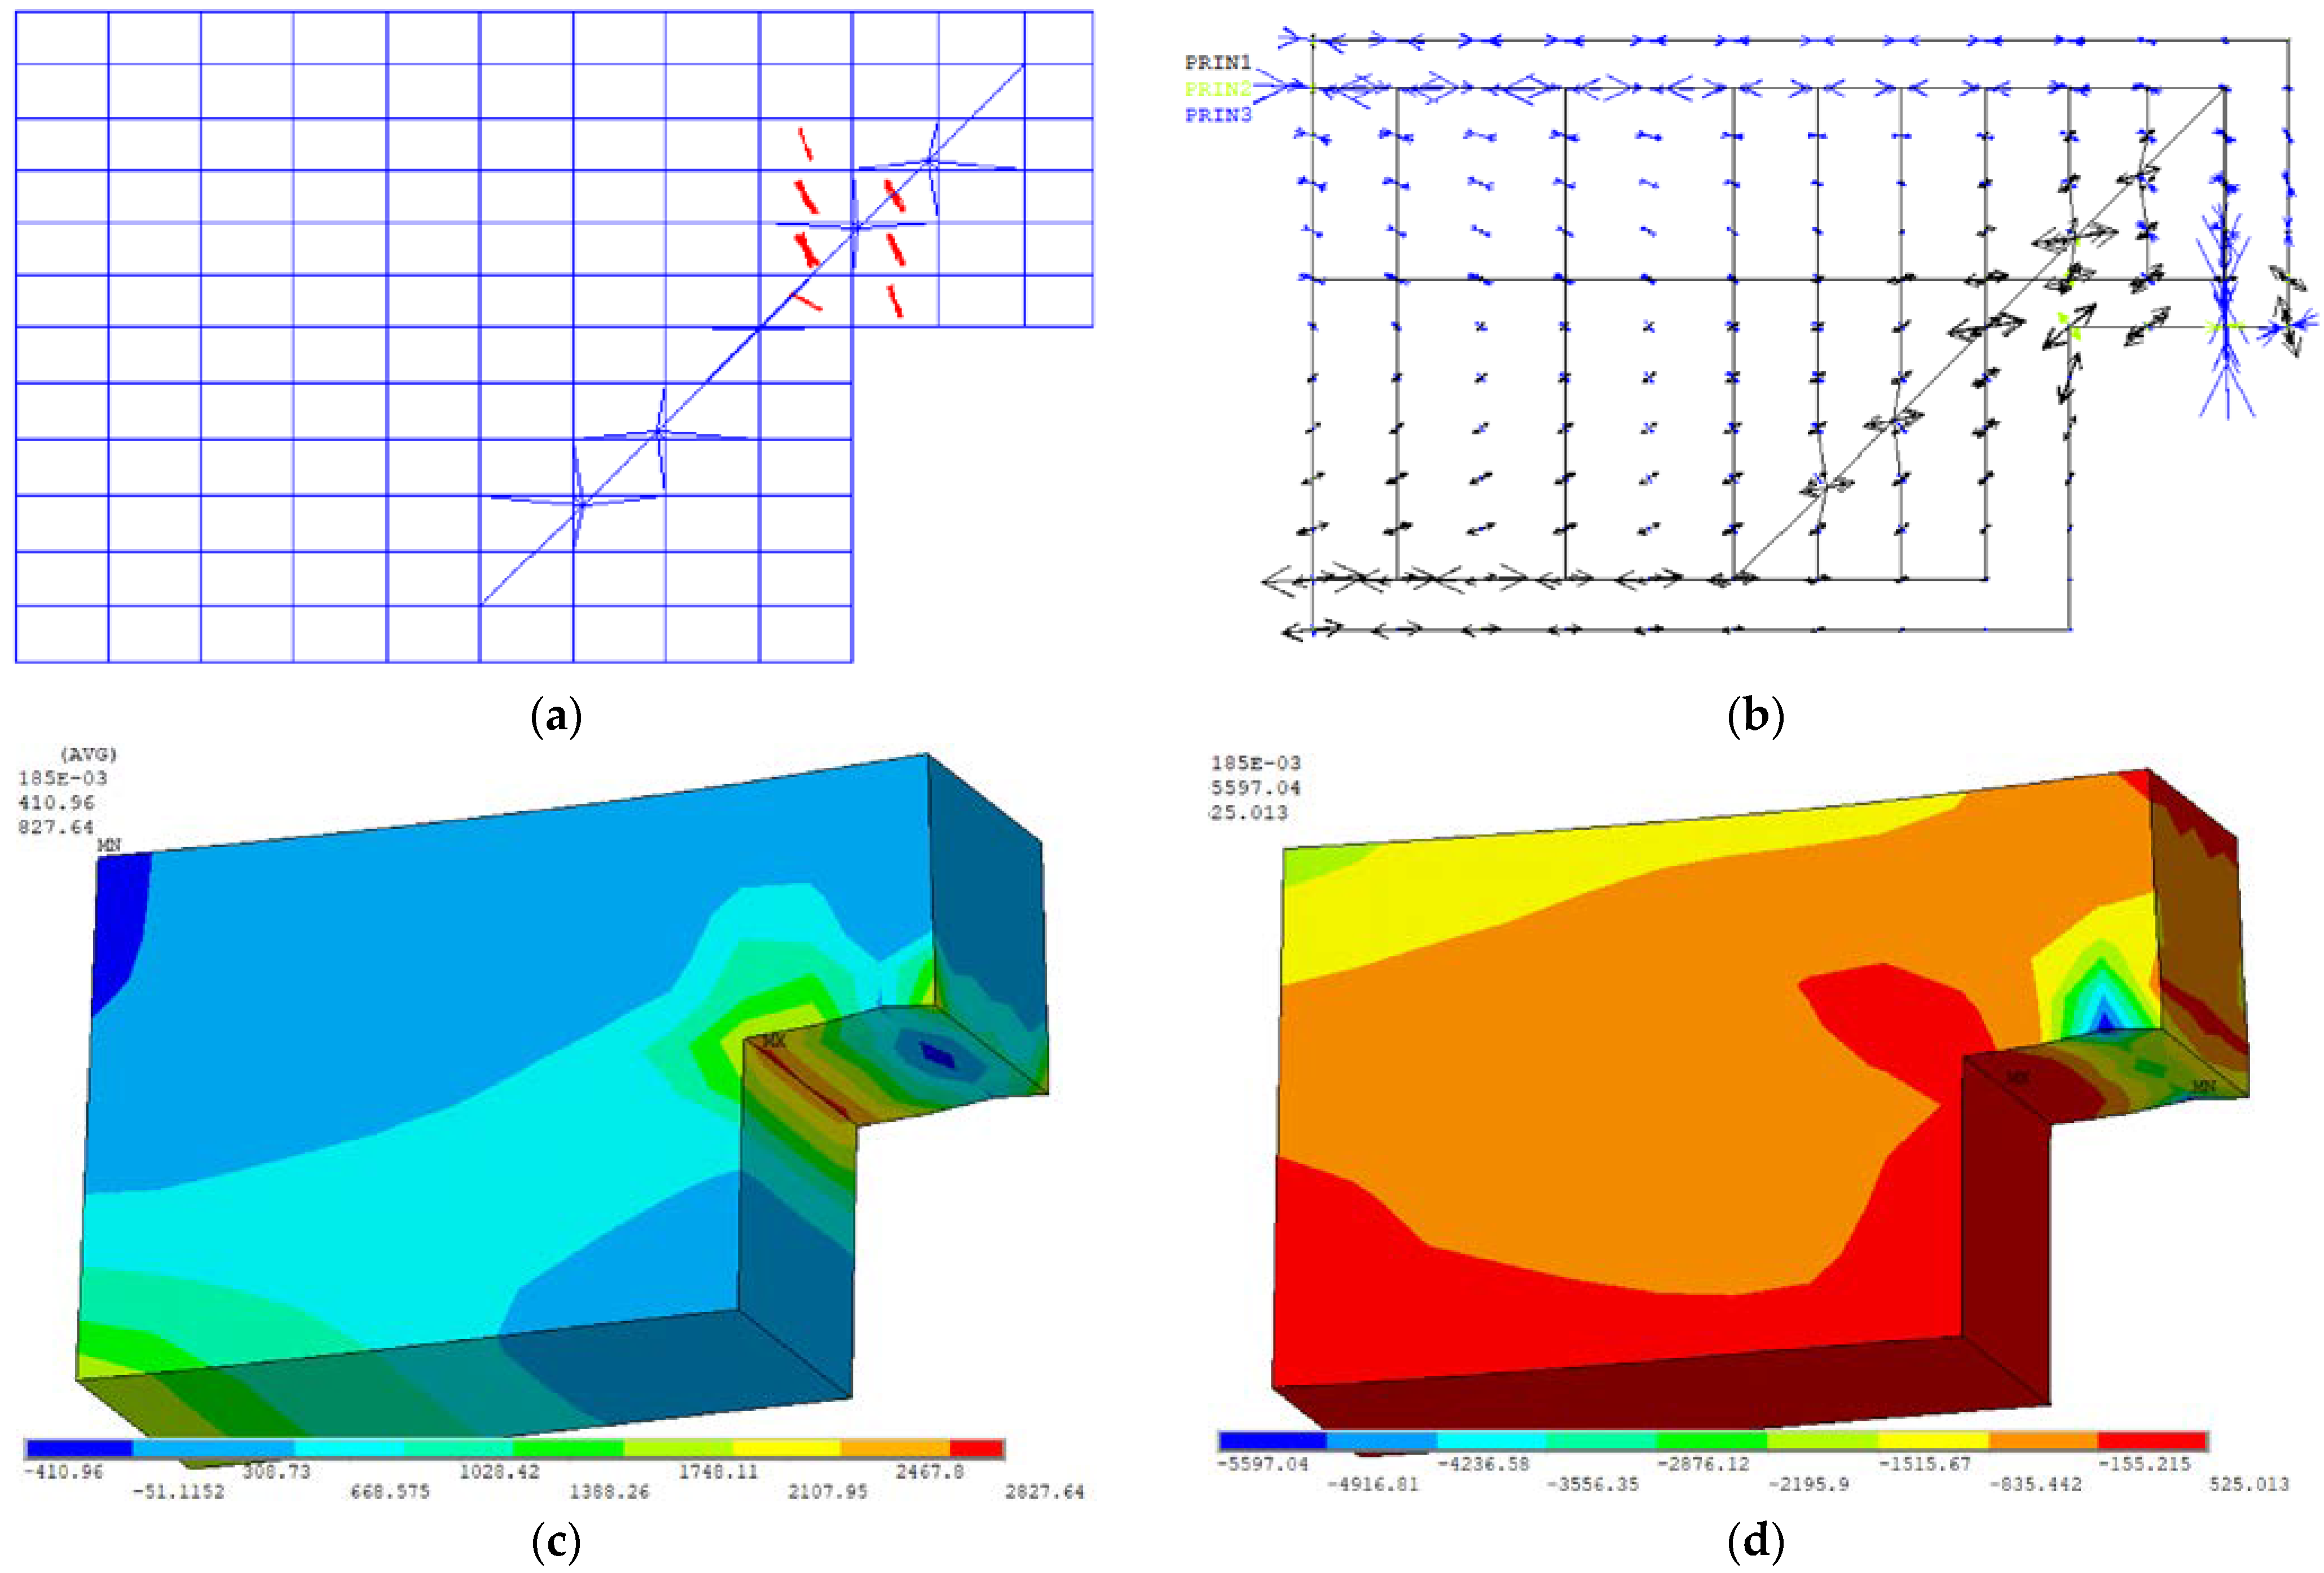
- The results in terms of cracks development at collapse, and their spread in the beam, highlight that the introduction of steel reinforcement is beneficial. If compared with the case without reinforcement, the part of the beam where cracks develop is limited in extension and affects the re-entrant corner only. Moreover, the beneficial effect of the reinforcing bars at positions 1 and 2 (NS-REF, NS-RS, Figure 15 and Figure 18, respectively), which explicitly strengthen the re-entrant corner and absorb the tensile stresses that develop as a result of the shear action, clearly appears.
- Complementing what has been expressed at the previous point, the trend of internal stresses at reinforcing bars 1 and 2 has been analyzed. These steel elements absorb the tensile stresses and limit the extent and intensity of the damage. Moreover, the vector plots (Figure 15b and Figure 18b) clearly show the stress flow along isostatic lines that tend to be oriented with the directions of the reinforcing bars.
- The NS-NU case (Figure 16) has collapse damages diffused to the area where the beam height is reduced from 0.7 m to 0.34 m. This is in reasonable agreement with the crack path of real beams reported by Desnerck et al. in 2016 [13] and 2017 [22]. In both studies, the most effective arrangement seems to be NS-REF (Figure 15), as also highlighted in this numerical study.
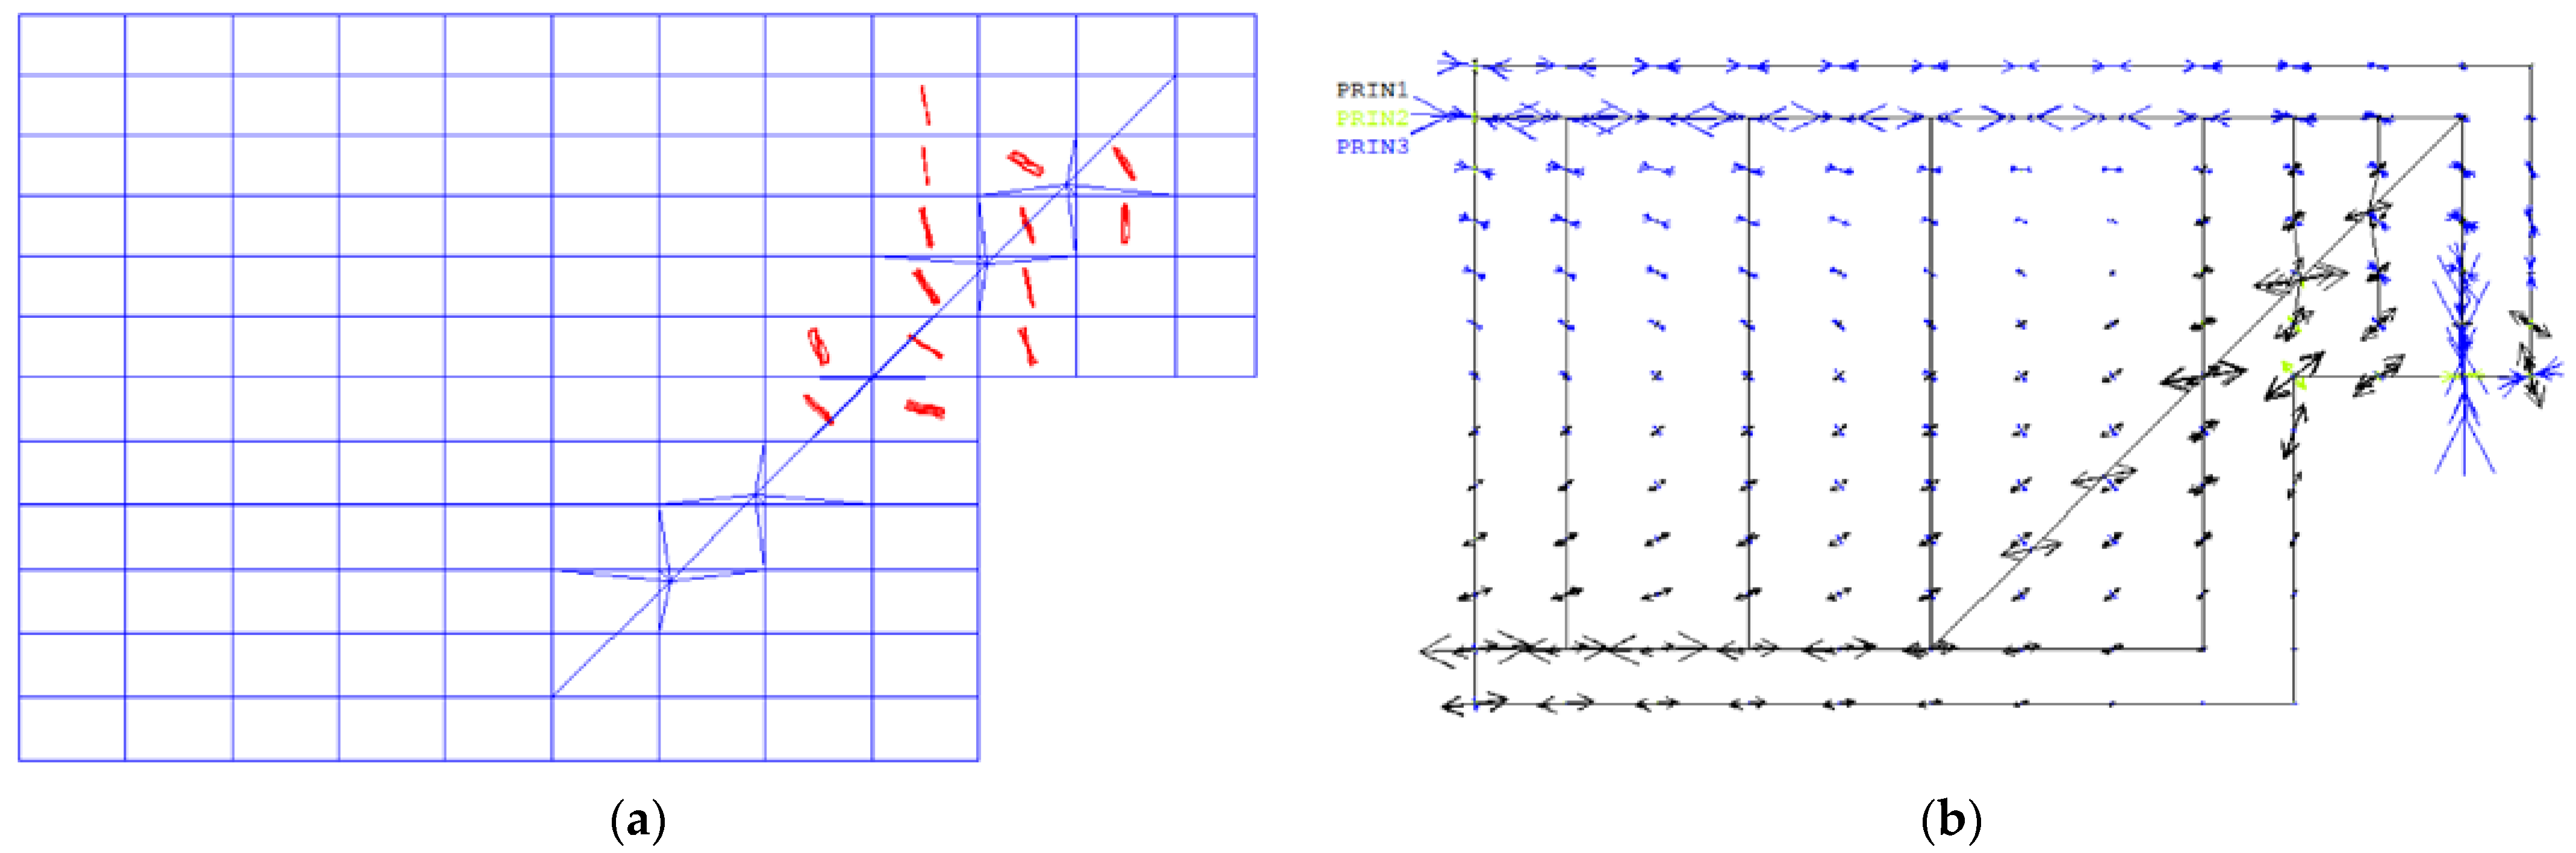
- Focusing on NS-RS configuration (Figure 18), the performed numerical analysis highlights a similar behavior with respect to the other cases. The evolution of the internal stresses is similar to up to 87% of the final load. Subsequently, NS-REF, NS-NU, and NS-ND cases show the beam collapse, while the NS-RS case is able to rearrange the stress path and absorb almost the whole of the final load (97%).
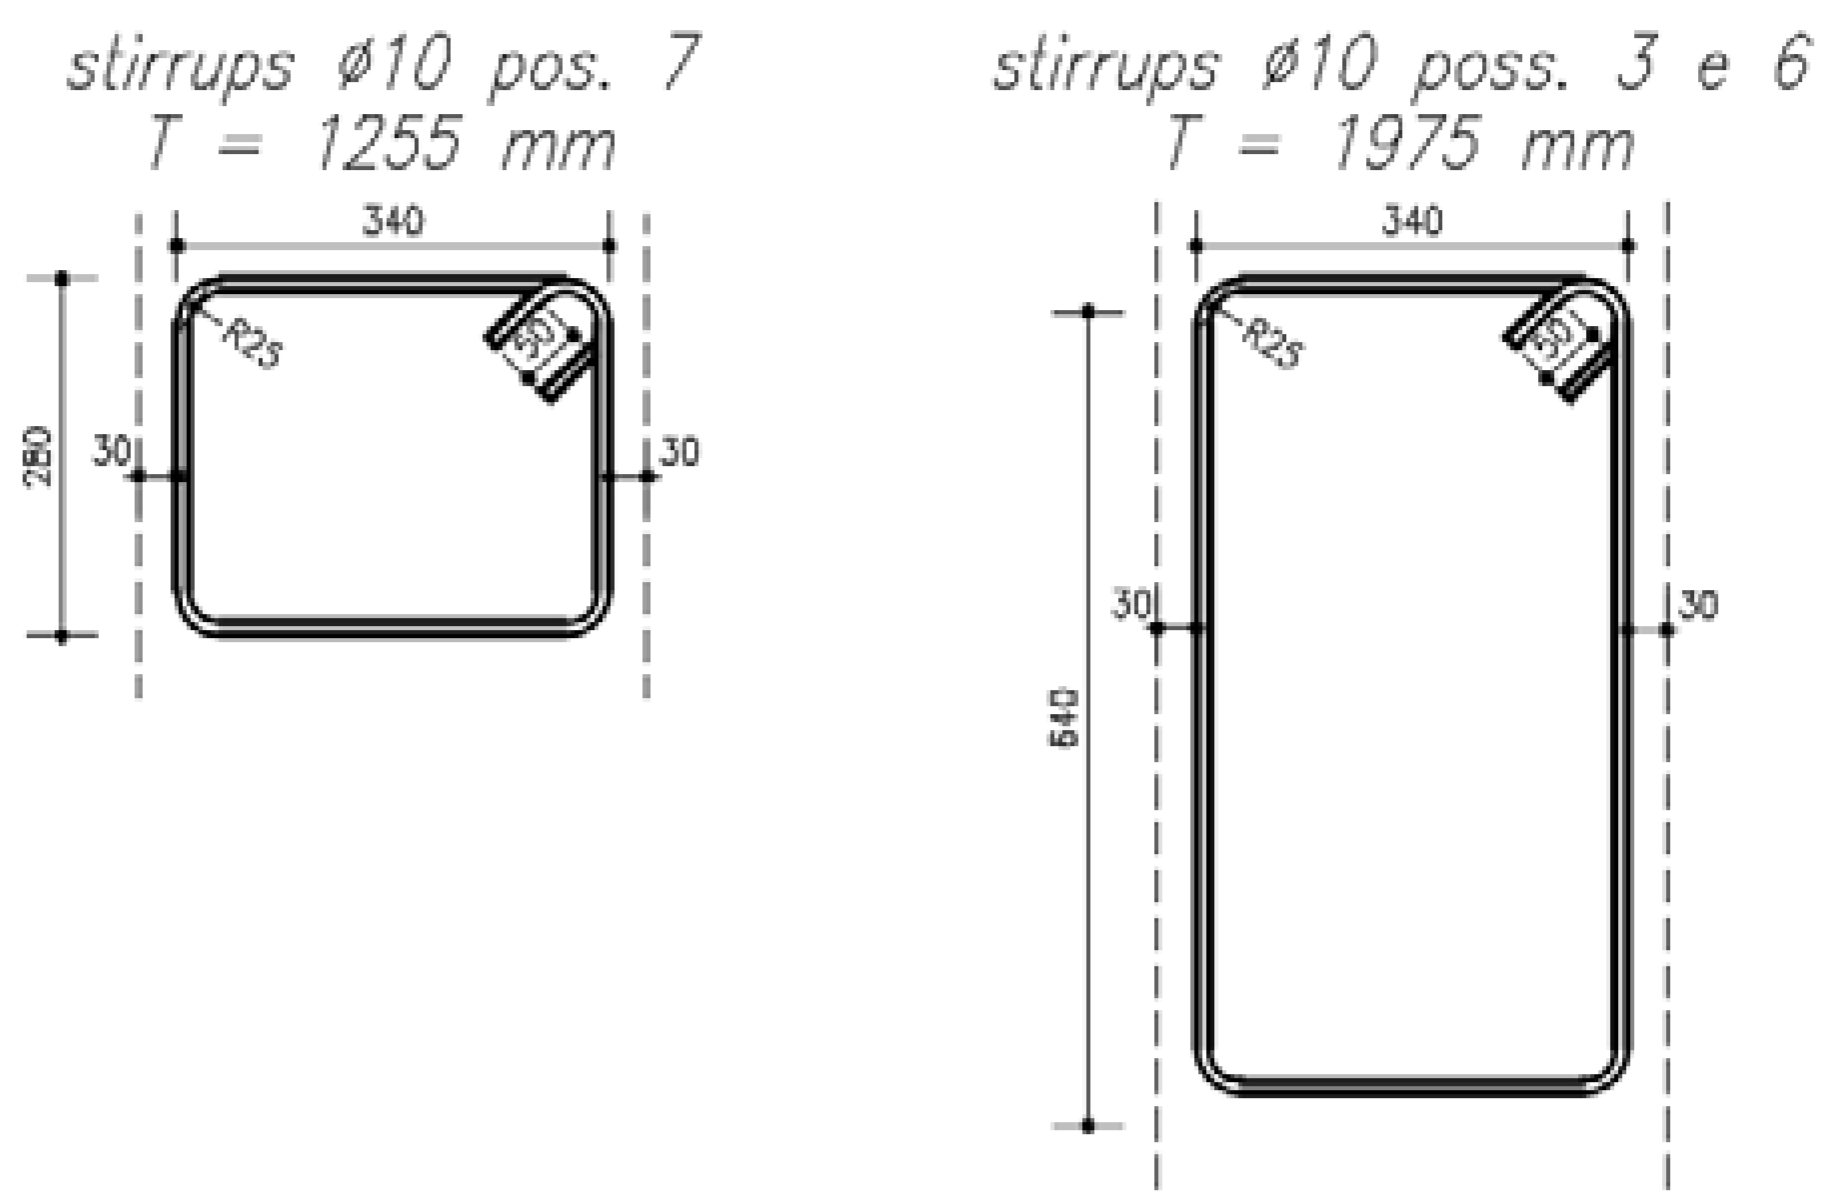
- The effect of stirrup thickening near the re-entrant corner positions 7 and 3, appears beneficial since it reduces the area affected by cracking damage, and allows for better confinement of the concrete in the area of the highest force concentration.
- All models analyzed have shown identical behavior with respect to crack development. There is no crack path evolution with progressive spreading. On the contrary, up to the last load-bearing value, the models do not show appreciable damage evolution. Damage appears suddenly at the last step of the analysis. This is in agreement with the characteristic fragility of the phenomenon related to shear stresses, and the inability of the structure for the highest value of demand to allow redistribution, resulting in the sudden achievement of collapse.
8. Concluding Remarks
This paper presents the design and simulation of laboratory tests that will be carried out on half-joints of reinforced concrete beams at the Politecnico di Torino to evaluate and compare different monitoring techniques along with different steel reinforcement arrangements.
Starting from a state-of-the-art review of the design, reinforcement, and monitoring of half-joints, the experimental design of different specimens is presented. The laboratory tests will include the use of traditional monitoring systems such as strain gauges and crack meters to detect the local response of both the concrete matrix and the reinforcements. In addition, the experimental campaign will be also focused to evaluate new emerging SHM technologies, specifically for half-joint connections. The purpose is to move from traditional local measurements to wider field monitoring, obtained with the association of DIC measures to the more traditional strain evaluation by strain gauges. Moreover, incipient crack development, which is difficult to be detected by traditional technologies will be also a critical point of investigation.
Numerical collapse simulations of half-joints by using nonlinear models for the concrete matrix (crack-crush constitutive law) and steel rebars (bilinear elastoplastic) have shown the influence of different reinforcement configurations on damage extension. Furthermore, the results have highlighted no crack path evolution with the progressive spreading of cracks at increasing loading. Conversely, at the collapse loading value, cracking damage appears and spreads suddenly. This behavior is in reasonable agreement with the typical fragility of half-joints.
However, it is worth noting that, compared to the existing literature, the adopted models fail to show the presence of cracking at the service limit state. This limitation of modeling, relevant to specimen discretization and to the complexity of the half-joint itself, will be addressed in a further step of the research through the planned laboratory experimental campaign at the Centro Prove Materiali in Samarate (VA, Italy).
Author Contributions
Conceptualization, R.A., M.D., F.P., G.C.M. and G.P.; methodology, R.A., M.D., G.C.M. and F.P.; software, M.D.; validation, R.A. and M.D.; formal analysis, R.A., M.D. and F.P.; investigation, R.A. and M.D.; resources, R.A. and M.D.; data curation, R.A. and M.D.; writing—original draft preparation, R.A. and M.D.; writing—review and editing, R.A., M.D. and F.P.; supervision, M.D. and G.C.M.; project administration, M.D., G.C.M. and G.P. All authors have read and agreed to the published version of the manuscript.
Funding
This research received no external funding.
Conflicts of Interest
The authors declare no conflict of interest.
References
- Desnerck, P.; Lees, J.M.; Valerio, P.; Loudon, N.; Morley, C.T. Inspection of RC half-joint bridges in England: Analysis of current practice. Proc. Inst. Civ. Eng. Bridg. Eng. 2018, 171, 290–302. [Google Scholar] [CrossRef]
- Reynolds, G.C. The Strength of Half-Joints in Reinforced Concrete Beams; Cement and Concrete Association: Cleveland, OH, USA, 1969. [Google Scholar]
- Mattock, A.H.; Chan, T.C. Design and Behavior of Dapped-End Beams. PCI J. 1979, 24, 28–45. [Google Scholar] [CrossRef]
- Liem, S.K. Maximum Shear Strength of Dapped-End or Corbel. Master’s Thesis, Concordia University, Montreal, QC, Canada, 1983. [Google Scholar]
- Drucker, D.C.; Prager, W.; Greenberg, H.J. Extended limit design theorems for continuous media. Q. Appl. Math. 1952, 9, 381–389. [Google Scholar] [CrossRef] [Green Version]
- Cook, W.D.; Mitchell, D. Studies of Disturbed Regions Near Discontinuities in Reinforced Concrete Members. Struct. J. 1988, 85, 206–216. [Google Scholar] [CrossRef]
- Mata-Falcón, J.; Pallarés, L.; Miguel, P.F. Proposal and experimental validation of simplified strut-and-tie models on dapped-end beams. Eng. Struct. 2019, 183, 594–609. [Google Scholar] [CrossRef]
- Schlaich, J.; Schafer, K.; Jennewein, M. Toward a Consistent Design of Structural Concrete. PCI J. 1987, 32, 74–150. [Google Scholar] [CrossRef]
- Werner, M.P. Shear design of prestressed concrete stepped beams. PCI J. 1973, 18, 37–49. [Google Scholar] [CrossRef]
- Moreno-Martínez, J.Y.; Meli, R. Experimental study on the structural behavior of concrete dapped-end beams. Eng. Struct. 2014, 75, 152–163. [Google Scholar] [CrossRef]
- Taher, S.E.-D.M.F. Strengthening of critically designed girders with dapped ends. ICE Proc. Struct. Build. 2015, 158, 141–152. [Google Scholar] [CrossRef]
- Sas, G.; Dăescu, C.; Popescu, C.; Nagy-György, T. Numerical optimization of strengthening disturbed regions of dapped-end beams using NSM and EBR CFRP. Compos. Part B Eng. 2014, 67, 381–390. [Google Scholar] [CrossRef]
- Herzinger, R.; Elbadry, M. Alternative Reinforcing Details in Dapped Ends of Precast Concrete Bridge Girders. Transp. Res. Rec. J. Transp. Res. Board 2007, 2028, 111–121. [Google Scholar] [CrossRef]
- Barton, D.; Anderson, R.; Bouadi, A.; Jirsa, J.; Breen, J. An Investigation of Strut-and-Tie Models for Dapped Beam Details. 1991. Available online: https://trid.trb.org/view/1174623 (accessed on 30 May 2022).
- Asso, R. Half-Joint Assessment of Concrete Bridges: Strut and Tie Model Development and FEM Validation; Politecnico di Torino: Torino, Italy, 2020. [Google Scholar]
- Desnerck, P.; Lees, J.M.; Morley, C.T. Impact of the reinforcement layout on the load capacity of reinforced concrete half-joints. Eng. Struct. 2016, 127, 227–239. [Google Scholar] [CrossRef] [Green Version]
- Clark, L.; Thorogood, P. Serviceability Behaviour of Reinforced Concrete Half Joints. 1988. Available online: https://trid.trb.org/view/295410 (accessed on 7 April 2021).
- Mitchell, D.; Marchand, J.; Croteau, P.; Cook, W.D. Concorde Overpass Collapse: Structural Aspects. J. Perform. Constr. Facil. 2011, 25, 545–553. [Google Scholar] [CrossRef]
- Rosso, M.M.; Asso, R.; Aloisio, A.; Di Benedetto, M.; Cucuzza, R.; Greco, R. Corrosion Effects on the Capacity and Ductility of Concrete Half-Joint Bridges; Elsevier: Amsterdam, The Netherlands, 2022; Volume 360, p. 129555. [Google Scholar] [CrossRef]
- Domaneschi, M.; Niccolini, G.; Lacidogna, G.; Cimellaro, G.P. Nondestructive Monitoring Techniques for Crack Detection and Localization in RC Elements. Appl. Sci. 2020, 10, 3248. [Google Scholar] [CrossRef]
- Improving Distributed Fiber-Optic Sensor Measures by Digital Image Correlation: Two-Stage Structural Health Monitoring. ACI Struct. J. 2021, 118, 91–102. [CrossRef]
- Domaneschi, M.; Casciati, S.; Catbas, N.; Cimellaro, G.P.; Inaudi, D.; Marano, G.C. Structural health monitoring of in-service tunnels. Int. J. Sustain. Mater. Struct. Syst. 2020, 4, 268. [Google Scholar] [CrossRef]
- Morgese, M.; Ying, Y.; Taylor, T.; Ansari, F. Method and Theory for Conversion of Distributed Fiber-Optic Strains to Crack Opening Displacements. J. Eng. Mech. 2022, 148, 04022072. [Google Scholar] [CrossRef]
- Ansys, Release 15; Ansys Inc.: Canonsburg, PA, USA; Available online: http://www.ansys.com (accessed on 23 November 2022).
- Domaneschi, M.; Mazzarella, G.; Mulas, M. Nonlinear structural dynamic simulation and analysis of the SMART-2008 shaking table specimen. In Proceedings of the EACS 2012—5th European Conference on Structural Control, Genoa, Italy, 18–20 June 2012. [Google Scholar]
Figure 1.
Geometry of a half-joint.

Figure 2.
Static scheme of a suspended span and half-joint.

Figure 3.
Reinforcement description and geometry—NS-REF and NS-NU.

Figure 4.
Reinforcement description and geometry—NS-ND and NS-RS.

Figure 5.
Lateral view and rebars in pos. 4 and pos. 5.

Figure 6.
Cross sections A–A, B–B, and C–C.

Figure 7.
Rebars in pos. 1 and pos. 2.

Figure 8.
Rebars in pos. 3, pos. 6, and pos. 7.

Figure 9.
Lateral view of the beam specimen with the monitoring devices.

Figure 10.
Detail of the strain gauges applied to the reinforcement.

Figure 11.
Simplified geometry of the specimen and boundary conditions.

Figure 12.
Damage development.

Figure 13.
(a) SOLID65 concrete matrix mesh; (b) TRUSS180 steel reinforcement; (c) boundary conditions.
Figure 13.
(a) SOLID65 concrete matrix mesh; (b) TRUSS180 steel reinforcement; (c) boundary conditions.

Figure 14.
Boundary condition of the FE model.

Figure 15.
Half-joint without steel reinforcement. (a) Cracking surfaces at collapse (78% final load); (b) vector plot of principal stresses just before collapse; (c) 1st principal stress just before collapse [kN/m2]; (d) 3rd principal stress just before collapse [kN/m2].
Figure 15.
Half-joint without steel reinforcement. (a) Cracking surfaces at collapse (78% final load); (b) vector plot of principal stresses just before collapse; (c) 1st principal stress just before collapse [kN/m2]; (d) 3rd principal stress just before collapse [kN/m2].

Figure 16.
Half-joint in NS-REF configuration. (a) Cracking surfaces at collapse (87% final load); (b) vector plot of principal stresses just before collapse; (c) 1st principal stress just before collapse [kN/m2]; (d) 3rd principal stress just before collapse [kN/m2].
Figure 16.
Half-joint in NS-REF configuration. (a) Cracking surfaces at collapse (87% final load); (b) vector plot of principal stresses just before collapse; (c) 1st principal stress just before collapse [kN/m2]; (d) 3rd principal stress just before collapse [kN/m2].

Figure 17.
Half-joint in NS-NU configuration. (a) Cracking surfaces at collapse (86% final load); (b) vector plot of principal stresses just before collapse; (c) 1st principal stress just before collapse [kN/m2]; (d) 3rd principal stress just before collapse [kN/m2].
Figure 17.
Half-joint in NS-NU configuration. (a) Cracking surfaces at collapse (86% final load); (b) vector plot of principal stresses just before collapse; (c) 1st principal stress just before collapse [kN/m2]; (d) 3rd principal stress just before collapse [kN/m2].


Figure 18.
Half-joint in NS-ND configuration. (a) Cracking surfaces at collapse (87% final load); (b) vector plot of principal stresses just before collapse; (c) 1st principal stress just before collapse [kN/m2]; (d) 3rd principal stress just before collapse [kN/m2].
Figure 18.
Half-joint in NS-ND configuration. (a) Cracking surfaces at collapse (87% final load); (b) vector plot of principal stresses just before collapse; (c) 1st principal stress just before collapse [kN/m2]; (d) 3rd principal stress just before collapse [kN/m2].

Figure 19.
Half-joint in NS-RS configuration. (a) Cracking surfaces at collapse (97% final load); (b) vector plot of principal stresses just before collapse; (c) 1st principal stress just before collapse [kN/m2]; (d) 3rd principal stress just before collapse [kN/m2].
Figure 19.
Half-joint in NS-RS configuration. (a) Cracking surfaces at collapse (97% final load); (b) vector plot of principal stresses just before collapse; (c) 1st principal stress just before collapse [kN/m2]; (d) 3rd principal stress just before collapse [kN/m2].

Publisher’s Note: MDPI stays neutral with regard to jurisdictional claims in published maps and institutional affiliations. |
© 2022 by the authors. Licensee MDPI, Basel, Switzerland. This article is an open access article distributed under the terms and conditions of the Creative Commons Attribution (CC BY) license (https://creativecommons.org/licenses/by/4.0/).
Share and Cite
MDPI and ACS Style
Asso, R.; Domaneschi, M.; Marano, G.C.; Palmisano, F.; Palombella, G. Behavior of Half-Joints: Design and Simulation of Laboratory Tests. Infrastructures 2022, 7, 160. https://doi.org/10.3390/infrastructures7120160
AMA Style
Asso R, Domaneschi M, Marano GC, Palmisano F, Palombella G. Behavior of Half-Joints: Design and Simulation of Laboratory Tests. Infrastructures. 2022; 7(12):160. https://doi.org/10.3390/infrastructures7120160
Chicago/Turabian StyleAsso, Rebecca, Marco Domaneschi, Giuseppe C. Marano, Fabrizio Palmisano, and Giuseppe Palombella. 2022. "Behavior of Half-Joints: Design and Simulation of Laboratory Tests" Infrastructures 7, no. 12: 160. https://doi.org/10.3390/infrastructures7120160