1. Introduction
The tight control of droplets and bubbles generated in microfluidic devices has become pivotal, due to the multifaceted applications that they have, both in research as well as in industrial operations. The ability to generate highly uniform structures (plugs, bubbles, or droplets) has rendered microfluidics as a promising field for a wide range of applications, from particle synthesis, to microreactors and microanalytical devices. As the need to generate uniform droplets in a controlled manner is the motivation, the aim of this work is to unveil the effect of the flow rate ratio on droplet generation. One of the most widely studied microfluidic geometries to generate droplets or bubbles is the T-junction geometry with a side arm that feeds one phase to a main channel, where the second immiscible phase flows. When the two immiscible fluids flow in this geometrical configuration, droplets of the phase that does not wet the channel walls are generated. The generation of such droplets consists of three stages; (i) the fluid to be dispersed flows through the side arm penetrating the continuous phase flow in the main channel, at the vicinity of the T-junction; (ii) the emerging thread grows downstream under the continuous phase effect; and (iii) a droplet is sheared off and carried by the continuous phase downstream of the main channel. To describe the mechanism of droplet formation in microfluidic T-junctions, two prevailing approaches can be distinguished. Thorsen et al. [
1], described the formation as a result of the competition between the shear forces acting to pinch a droplet off the emerging dispersed phase thread, and the interfacial tension acting on stabilising it. The second approach, as summarised by Garstecki et al. [
2], postulates that the effect of shear stress is not significant at lower capillary numbers. The “rate-of-flow controlled” break-up mechanism attributed the droplet pinch-off to lower capillary numbers on the balance of pressures in the continuous and dispersed phase. However, they identified a transition point at a critical value of capillary number, above which the shear stress effect has to be accounted for. Extensive work has been performed over the last decades in an attempt to describe and characterise the break-up mechanism in a microfluidic T-junction, both in Newtonian and non-Newtonian systems [
1,
2,
3,
4,
5,
6,
7,
8,
9]. Droplets are detached from the dispersed phase threads penetrating the continuous phase, either near the junction or several widths downstream, depending on the flow rates, the fluid properties, and the geometrical characteristics of the system [
4,
5]. Three distinct regimes have been identified for the droplet breakup process in a microfluidic T-junction by various research groups, namely squeezing, dripping, and jetting in Newtonian systems [
2,
4,
6]. Mapping of these flow regimes and patterns at different parametric conditions, as well as characterising the transition between the regimes mentioned above, is vital for the design and operation of microfluidic devices. The transition between these regimes has been characterised by using the capillary number [
4,
6]. Additionally, Nisisako et al. [
5], as well as Tice et al. [
10], have used capillary number to predict the patterns of droplet formation. The capillary number is defined as “the parameter measuring the distorting forces due to the flow relative to the interfacial tension opposing the distortion” [
11], given by the formula
where
μ is the dynamic viscosity of the continuous phase,
U is the velocity of the continuous phase, and
γ is the interfacial tension between the continuous and the dispersed phase.
The squeezing regime has been reported to be observed at low values of capillary number, and the preponderant explanation is that the break-up is due to the build-up of pressure upstream of the emerging droplet [
3,
12]. This build-up of pressure is attributed to the restriction of the area available for the continuous phase to flow. The emerging droplet occupies most of the cross-section of the continuous phase channel before being pinched off. When the droplet is detached from the liquid thread, a sharp decrease of pressure has been reported [
3].
The dripping regime has been reported to occur at higher capillary numbers [
6]. During dripping, droplets are sheared off before they fill the cross-section of the channel, where the shear force exerted on the droplet is acting against the interfacial force [
6]. The pressure build-up upstream of the emerging droplet cannot be neglected, and it is expected to facilitate break up [
6,
13]. Dripping is stated to occur over a short range of capillary numbers [
6] before the jetting regime becomes dominant. Generally, during the dripping regime, smaller droplets are generated compared to the squeezing regime [
6]. In the jetting regime, the two immiscible phases flow in parallel in the main channel, in what is described as “laminar flow side-by-side”, with the dispersed phase forming a jet [
6] before a droplet is detached several width lengths downstream [
13].
The transition between these regimes has been described by several researchers using mostly the capillary number (Ca), calculated using the parameters associated with the continuous phase [
3,
13,
14]. Experimental work performed by Garstecki et al. [
3], validated by numerical simulations performed by De Menech et al. [
6], indicated a notable change in the behaviour above a critical capillary number of 0.01. This change in behaviour was explained in terms of the effect of the shear stress on the break-up mechanism. They suggested that as the shear stress starts to contribute significantly to the break-up mechanism, smaller droplets are generated. The observed behaviour is similar ‘to the dripping regime in an unbounded, co-flowing liquid’ [
3]. Additionally, Christopher et al. [
13] studied the transition from squeezing to dripping in a microfluidic T-junction. They commented that for a specific range of conditions, the break-up is influenced by both the squeezing pressure due to the obstruction of the area available for the continuous phase to flow, as well as on the viscous shear stress acting on the emerging thread [
13]. Fu et al. [
15] have investigated the squeezing-to-dripping transition in a gas-liquid system, and they have reported that during the transitional regime, the break-up mechanism is driven by both the squeezing pressure and the shear stress. An extended study focused on the transitional regime, that included experimental observations and model validation [
16,
17] has identified that break-up is affected by the geometrical characteristics of the T-junction and the capillary number, as well as the flow rate and viscosity ratio between the two phases. Numerical simulations performed along those lines [
6] provided access to different dynamic parameters. The evolution of pressure was used to explain the transition between the regimes. To identify the regimes described above and to distinguish their transitions, visual observations are utilised [
3,
6,
7,
8,
13,
15]. Thus, the identification and the distinction between different regimes is qualitative, and it is subjected to each authors’ judgment, rendering the identification of transition between regimes as a convoluted process. The above explains the discrepancies that arise in terms of the sharp transition between regimes, or the gradual transition that is identified as an intermediate regime by several researchers, and in this manuscript [
6,
15].
Therefore, most work that is done in identifying and characterising the transition between these distinct regimes [
3,
6,
14], observed these transitions occurring at a critical capillary number (
Ca). Nevertheless, the critical capillary number at which the transition between regimes occurs, is evidently affected by the system properties. Christopher et al. [
13], supported the critical capillary concept presented by Garstecki et al. [
3]; however, they indicated that the fluid properties and geometry have an influence on the regime transition. In addition, they supported that this dependency extends to the dripping regime, and it is not only applicable at the squeezing regime, as reported by Garstecki et al. [
2]. The ratios between the widths of the dispersed phase channel and the continuous phase flow channel, as well as the ratio between the viscosities of the two phases, have been found to significantly affect regime transition. It is noteworthy that when a system with high viscosity contrast has been employed, the transition from squeezing to dripping has not been observed [
7].
The occurrence of multiple regimes at constant capillary numbers has been reported before by Zangoni et al. [
18]. They have demonstrated that at constant capillary numbers for a hydrophilic T-junction, changing the flow rate ratio between the two phases resulted in the observation of different regimes such as squeezing, coflow (parallel flow of the two phases in the channel), dripping, and jetting. Nevertheless, they have observed the transition from dripping to jetting and finally to coflow, or from squeezing to jetting, and then coflow. However, the transition between squeezing and dripping at constant capillary numbers has not been reported. Decreasing the flow rate ratio results in a transition from a regime that is observed at lower capillary numbers, to a regime that is reported to be observed at higher capillary numbers, such as from squeezing to coflow, or dripping to jetting. In the context of microfluidic T-junctions, Gupta et al. [
19] commented on the effect of flow rate ratio on the regime transition from droplet flows to parallel flows in the dripping regime. Their simulations demonstrated that at constant capillary numbers, different structures were observed when the flow rate ratio was varied. Extending their work on the squeezing regime, Gupta and Kumar [
20] commented that for constant capillary numbers the length of plugs increased linearly with an increase in the flow rate ratio; however the effect of the flow rate ratio on the mechanism of formation has not been discussed. Furthermore, Zangoni et al. [
18] indicated that different flow patterns in terms of segmented or co-flowing flows were observed at constant capillary numbers and varying flow rate ratios. Nevertheless, no transition has been observed between squeezing and dripping. The results presented in Liu and Zhang [
21], demonstrated a regime transition at constant capillary numbers with an increasing flow rate ratio. Recent work by Chiarello et al. [
8] on the droplet break-up mechanism in shear thinning solutions has clearly demonstrated that the regime transition is apparent for constant capillary numbers, when the flow rate is altered.
The unsuitability of the capillary number to describe the regime transition was first pointed out by Guillot and Colin [
22]. Their work was focused on parallel flows in microfluidic geometries, and they reported that at constant capillary numbers, the transition from droplet flow to parallel was influenced by the flow rate of the dispersed phase. This is further supported by Bai et al. [
7], as they highlighted that the use of a unified critical capillary number to distinguish between regimes is not applicable, stressing instead the effect of flow properties on this critical capillary number.
As mentioned above, various research groups have performed extensive work, in an attempt to predict the size of droplets that are generated in a microfluidic T-junction. The most prevalent approach is that the proposed predictive model is regime-specific [
1,
3,
14,
23,
24,
25], as demonstrated below.
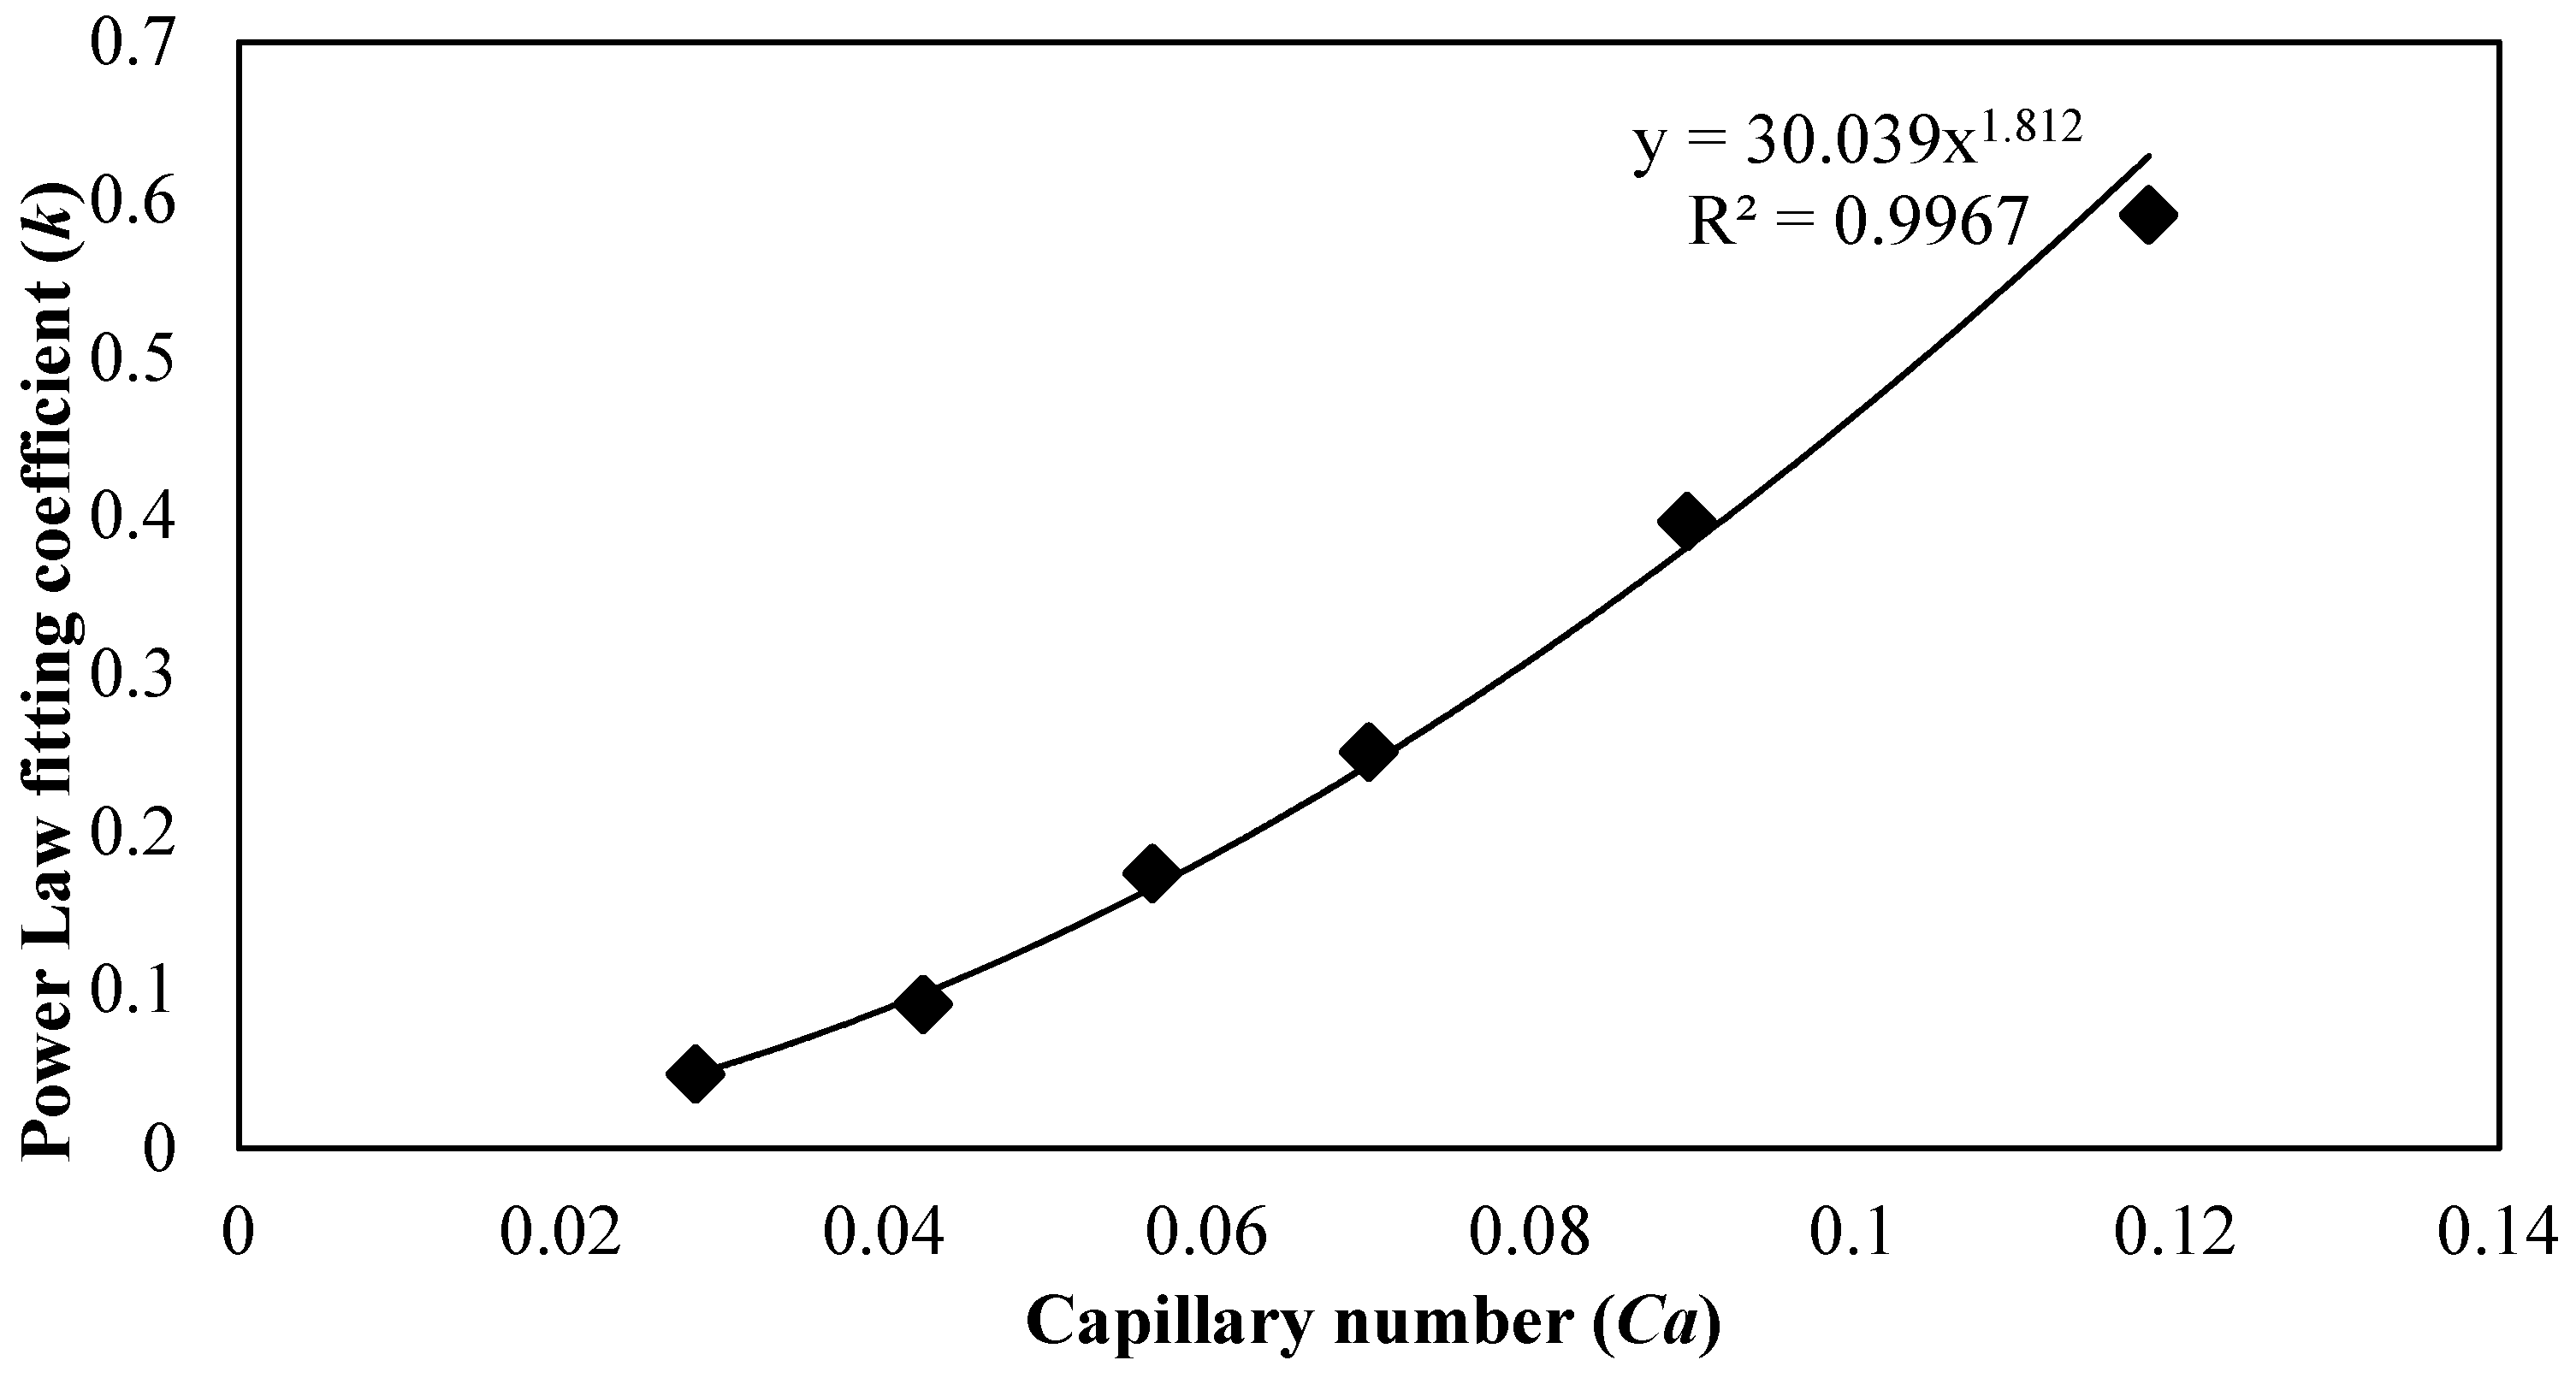
For the squeezing regime, scaling laws included the non-dimensional length of the resulting plug as a function of the flow rate ratio, having the form of:
where
L is the length of the plug,
w is the width of the main channel, and
f depends upon the geometrical characteristics and is usually around unity [
23], and
c is the ratio between the neck of the droplet forming, and the width of the continuous phase channel [
3,
23]. The capillary number has not been included in most scaling laws formed for the squeezing regime. In terms of the dripping regime, previous studies presented by several researchers are focused on the effect of the capillary number on the droplet size, excluding the flow rate ratio from most scaling laws applicable in dripping regime [
13,
26].
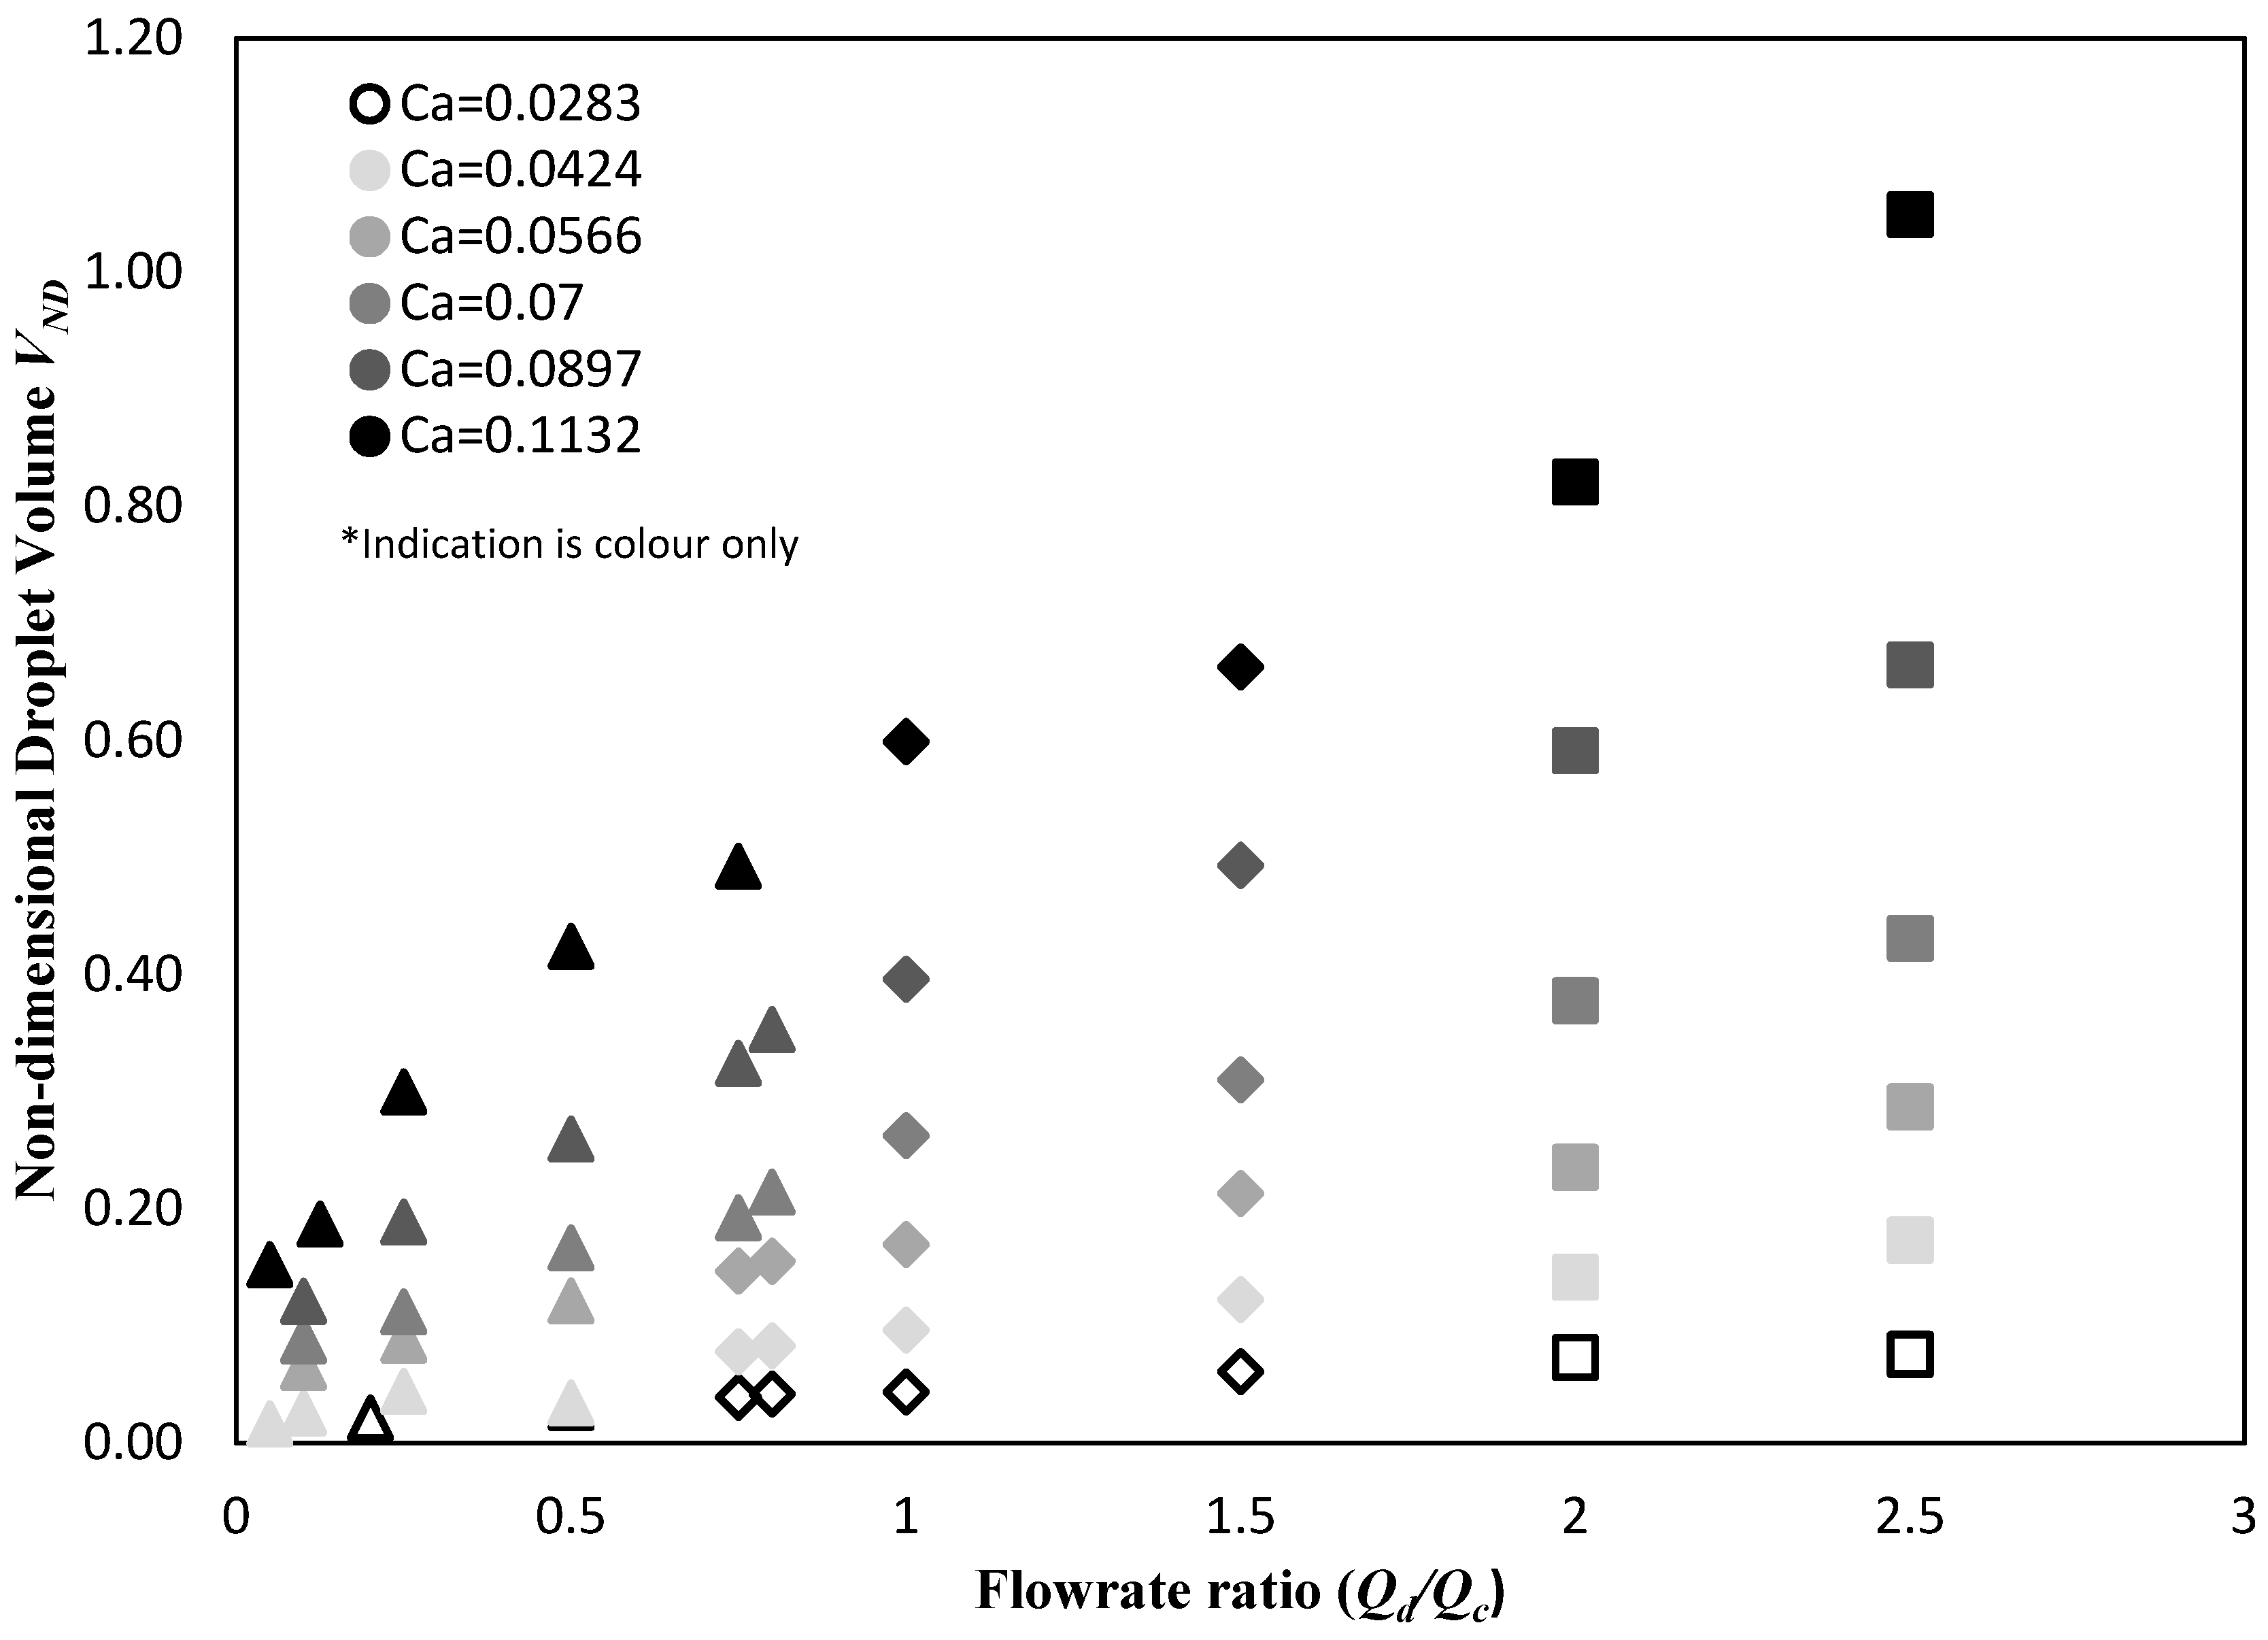
A power law dependency of the non-dimensional droplet volume on capillary number is identified by Christopher et al. [
13]. They suggested that the droplet volume (
V) varies with all tested capillary numbers, and they have identified a power law dependency on capillary number as follows:
where 1 −
δ = −0.316 ± 0.016. The non-dimensional volume is inversely proportional to capillary number as
δ > 1. Bai et al. [
7] have extended the power law dependency of the droplet size on capillary number in both squeezing and dripping regimes. However, they have reported a distinct change in the power law exponent when capillary number is increased above a critical value.
Graaf et al. [
27], in their investigation of the formation of a droplet from a single pore, have proposed that the droplet formation in microfluidic T-junctions consists of two stages; the droplet growth stage, and the droplet detachment (or necking) phase. Hence, they proposed and validated a model based on the assumption that the total volume of the formed droplet consists of the sum of an initial volume term which described the growth phase and the volume increase before the droplet is being detached (necking phase) [
27,
28]. Steegmans et al. [
29] compared several models through the utilisation of statistical analysis to evaluate the predicted volume. They have suggested that the droplet size can be controlled though the control of the geometrical characteristics of the devices (thus controlling the growth volume), or by controlling the flow rates employed (to control the detachment volume).
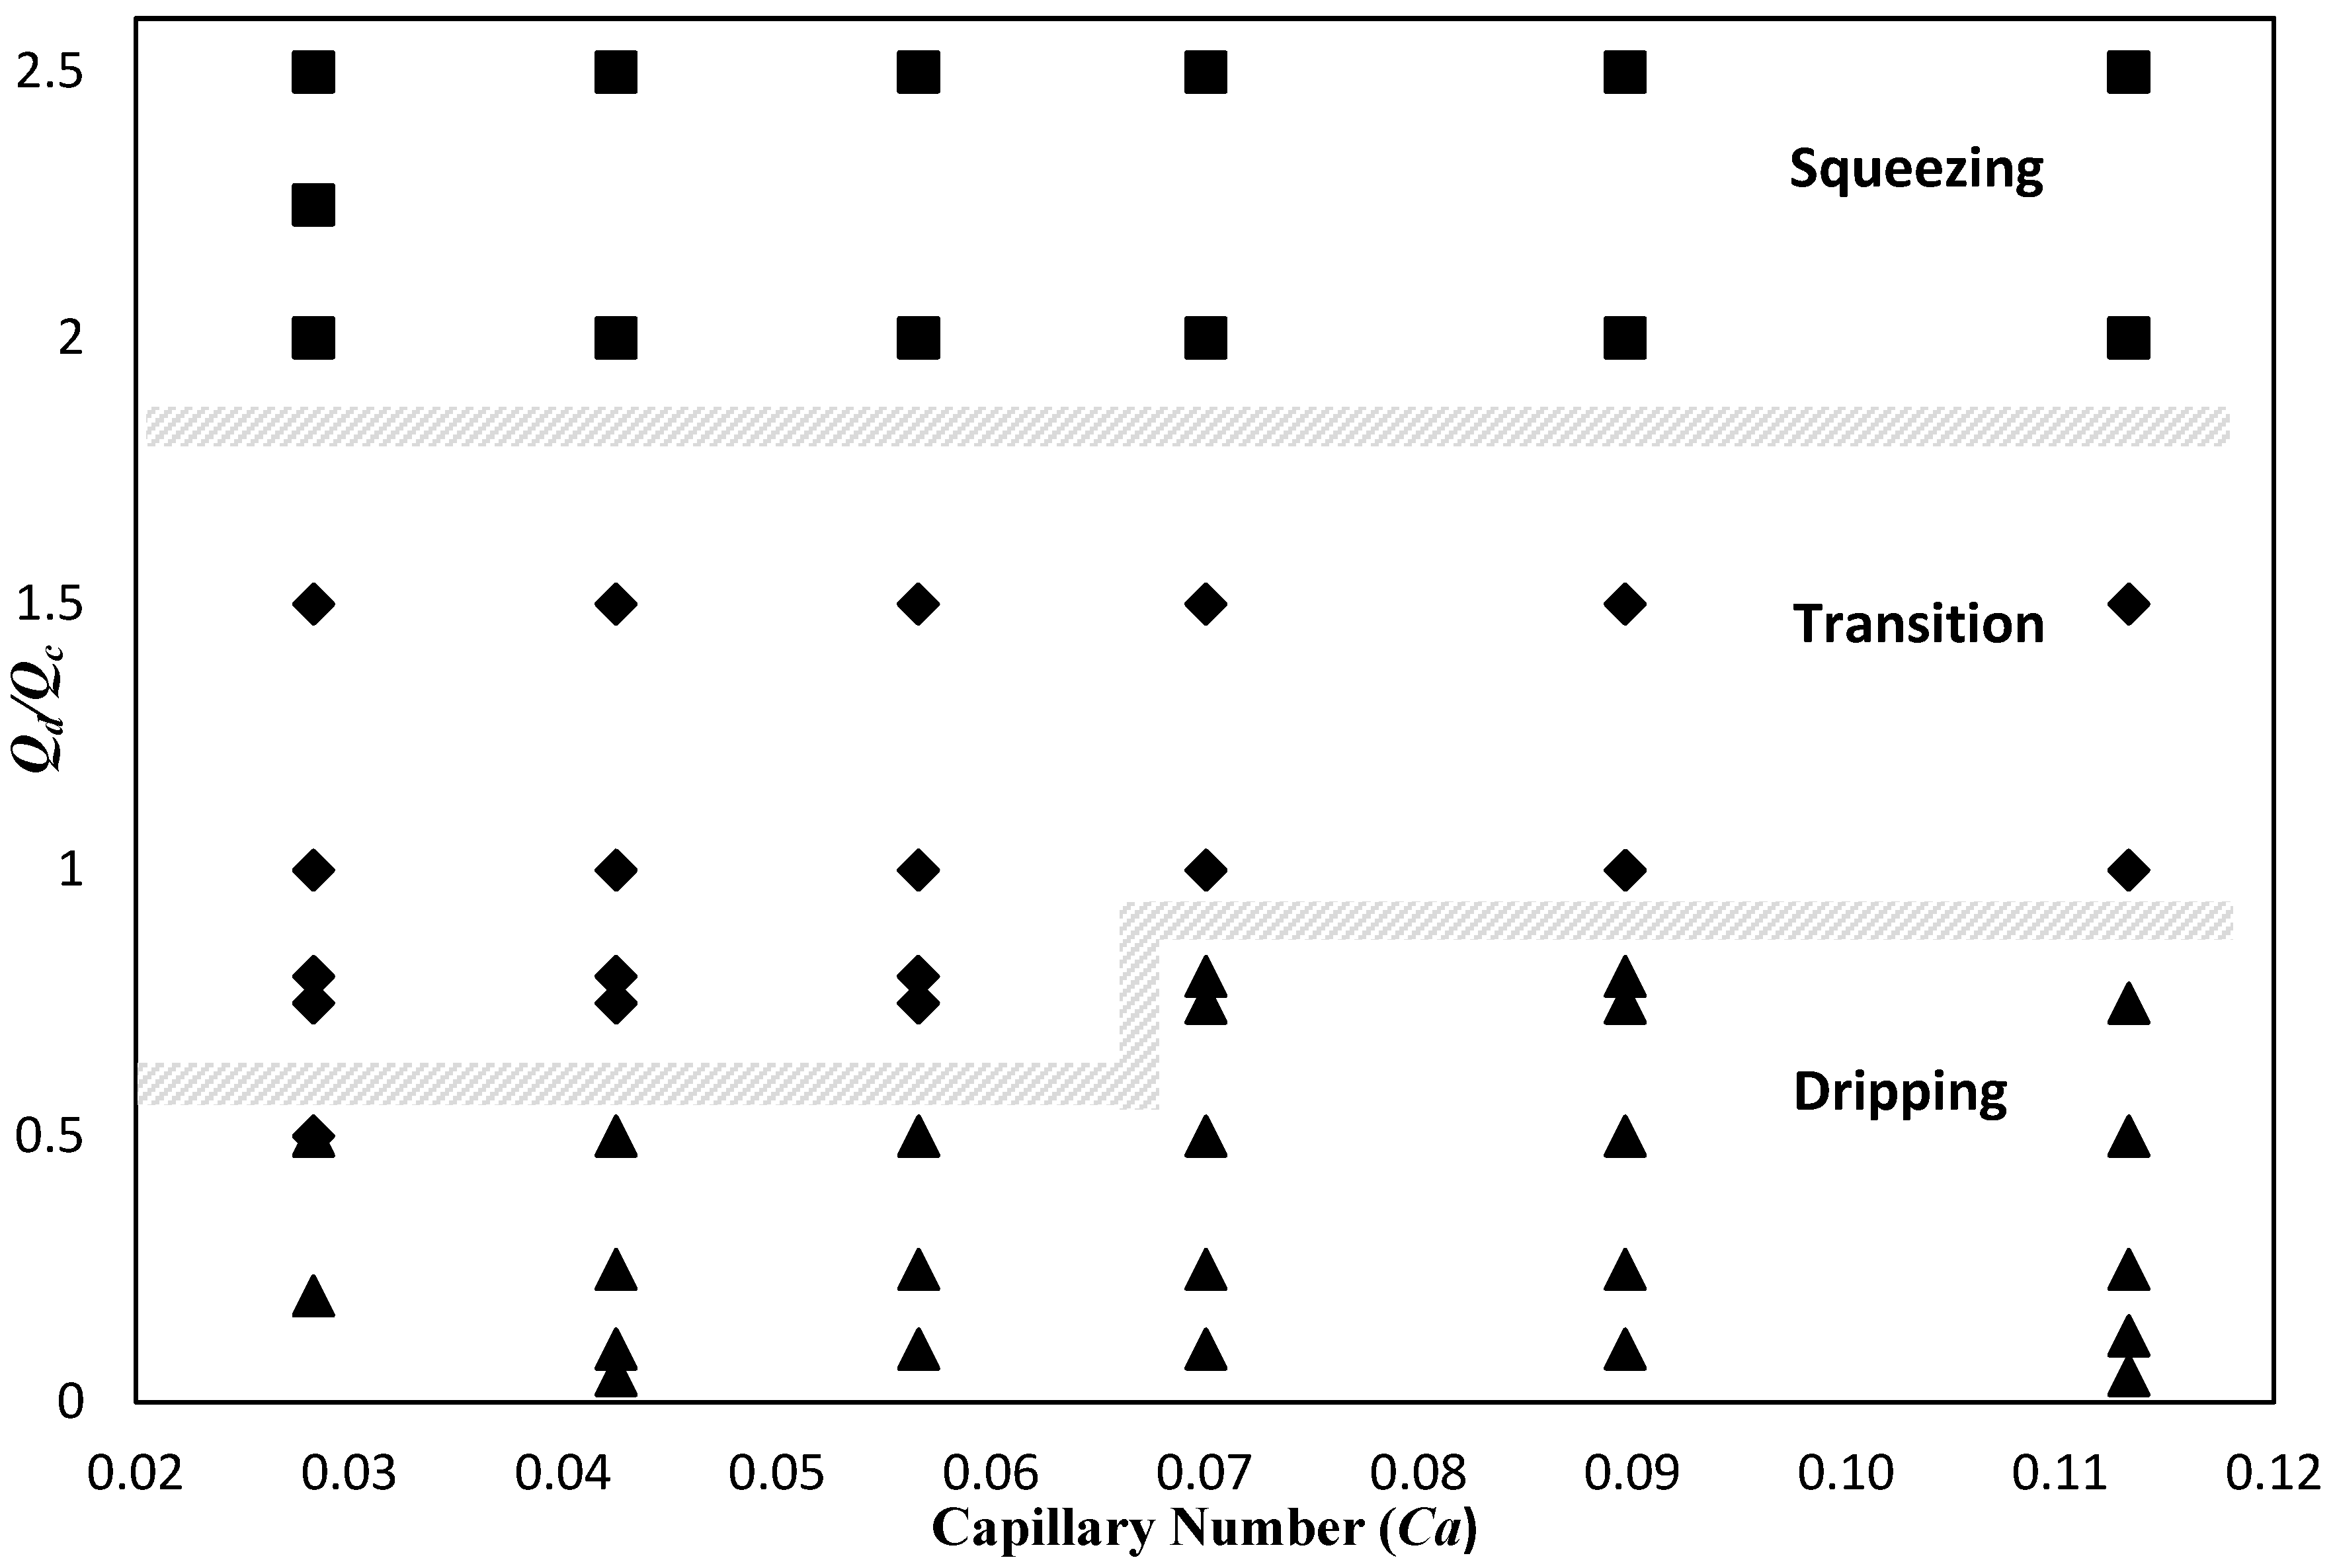
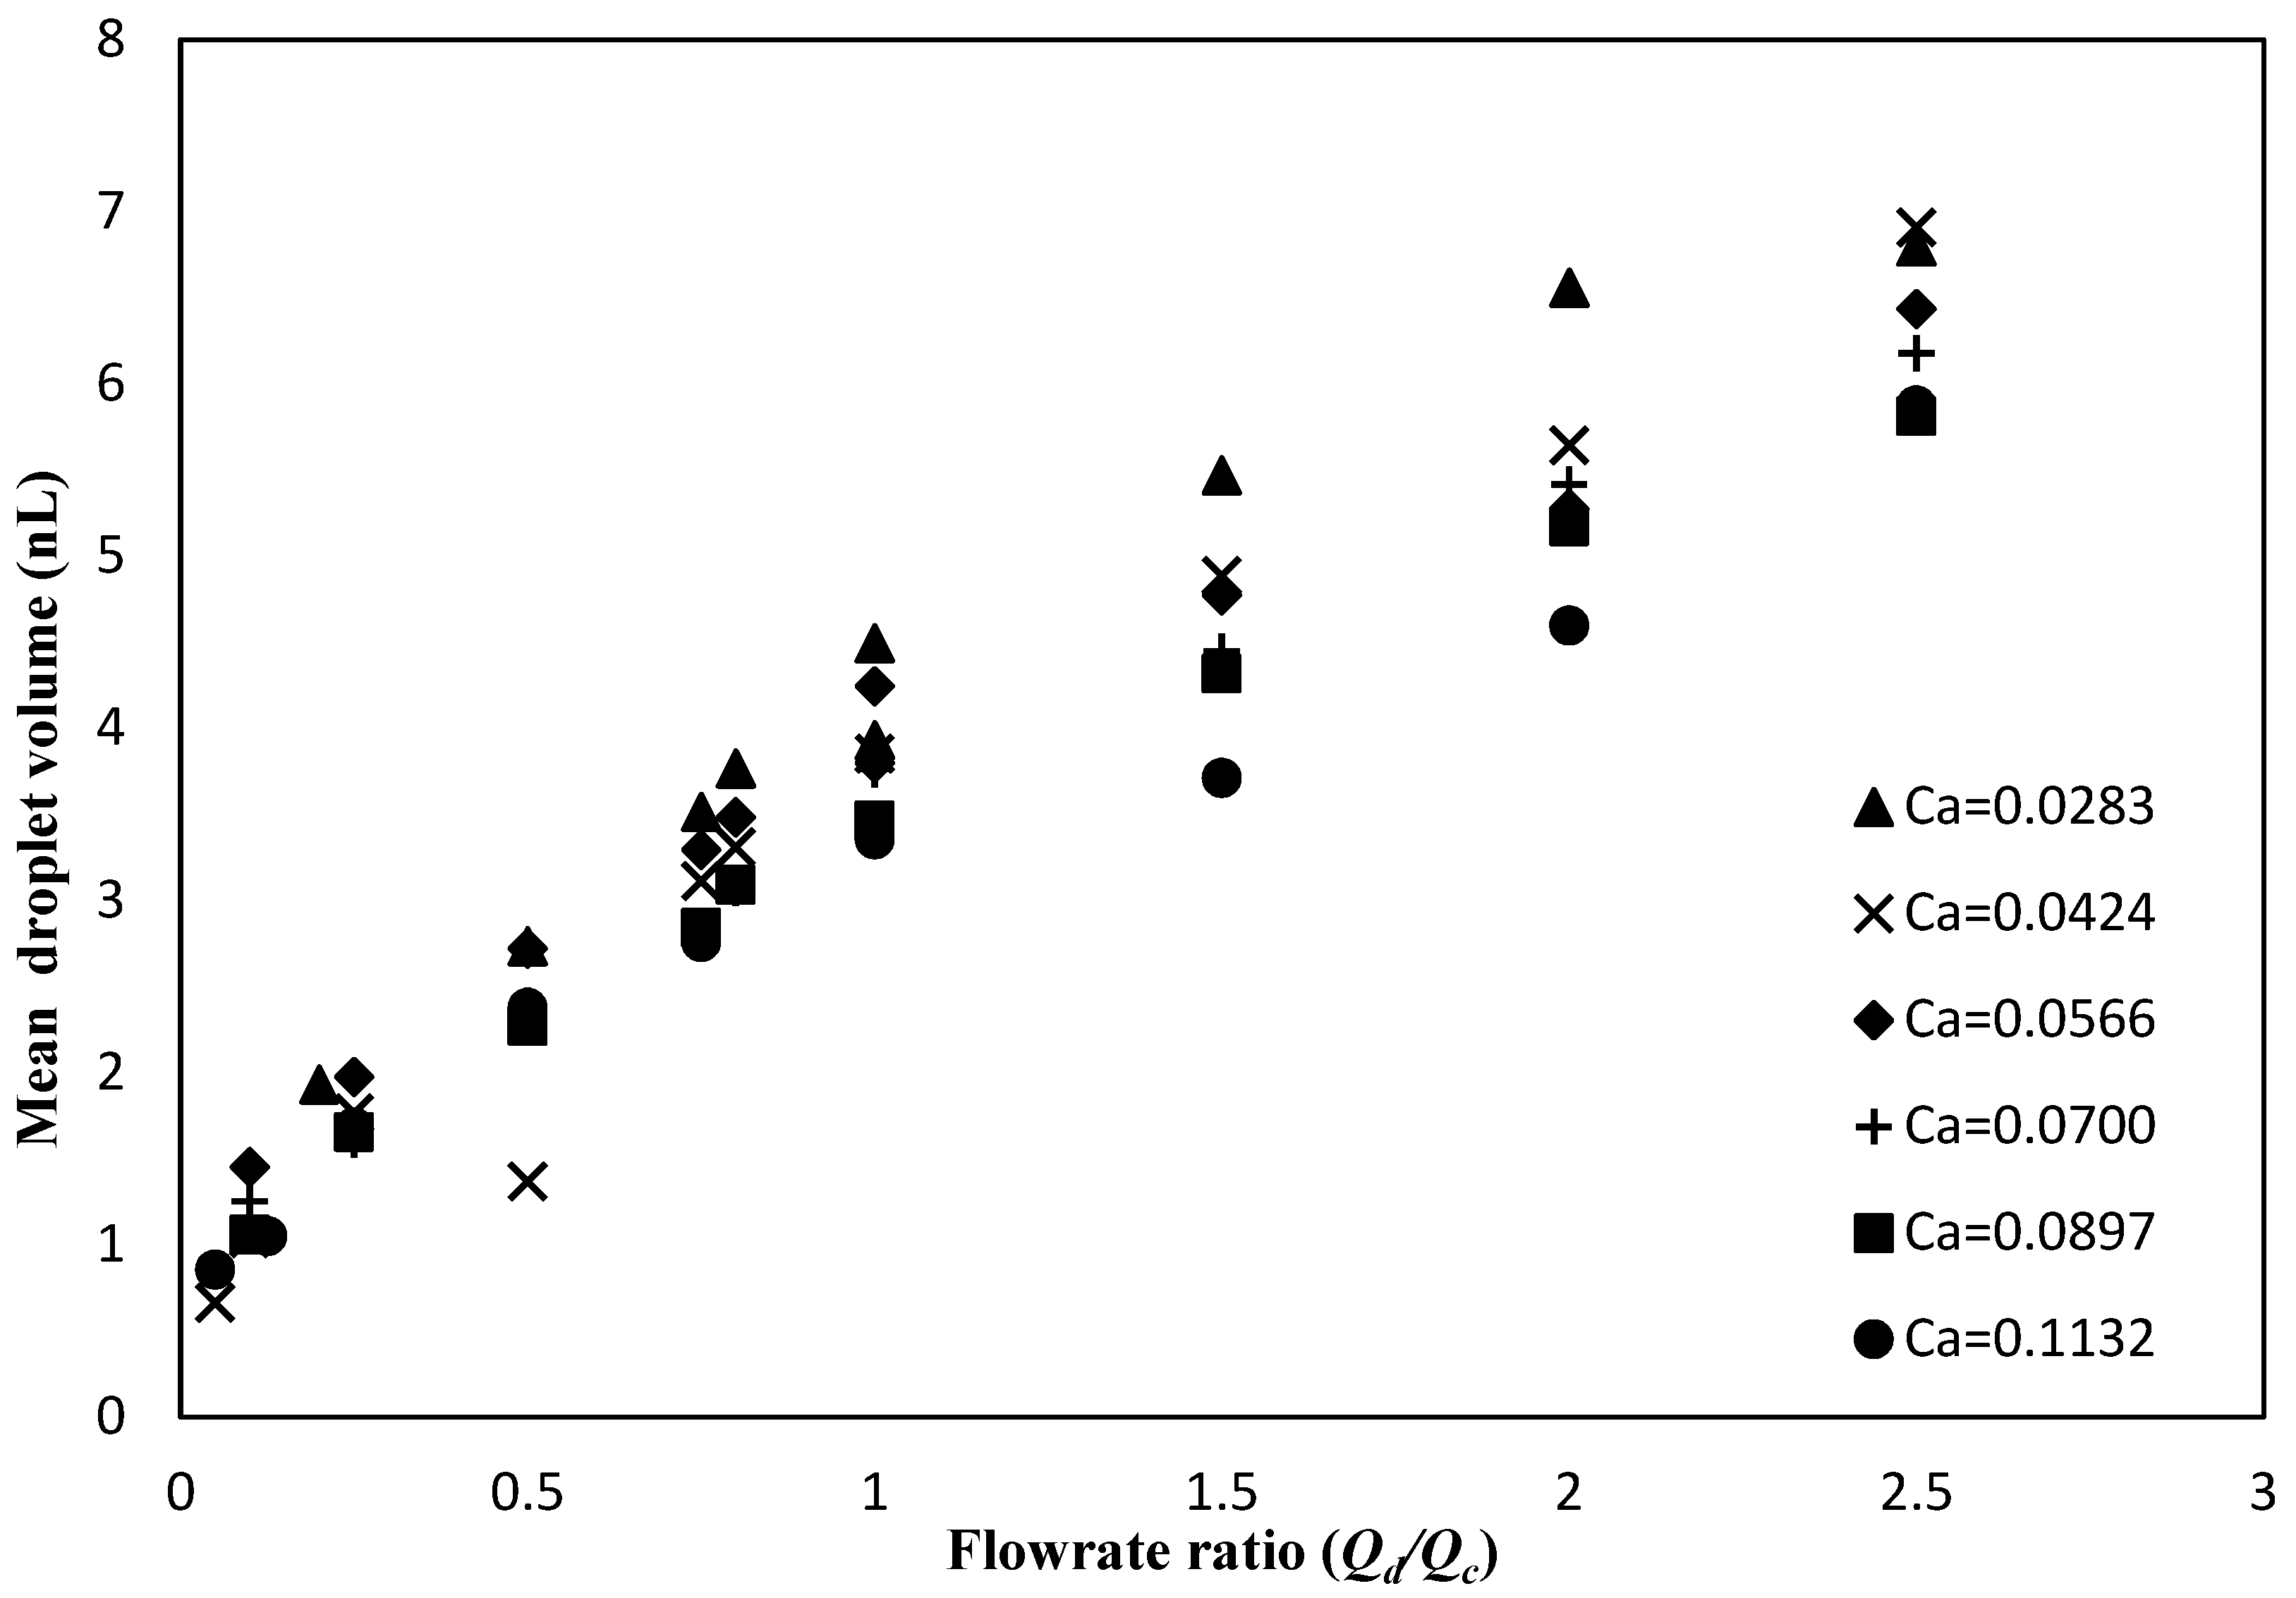
Even though the formation of droplets at T-junctions has been studied widely, it is evident that the mechanisms of droplet generation are not fully established. In addition, the effect of several parameters on the mechanism of droplet formation, and thus the droplet size, has not been fully examined. In this work, the transition between regimes at constant capillary numbers is presented, highlighting that regime transition is apparent when the flow rate ratio is varied. Finally, the effect of the flow rate ratio on the volume of droplets generated is discussed, along with a proposed model to predict the droplet volume.
2. Materials and Methods
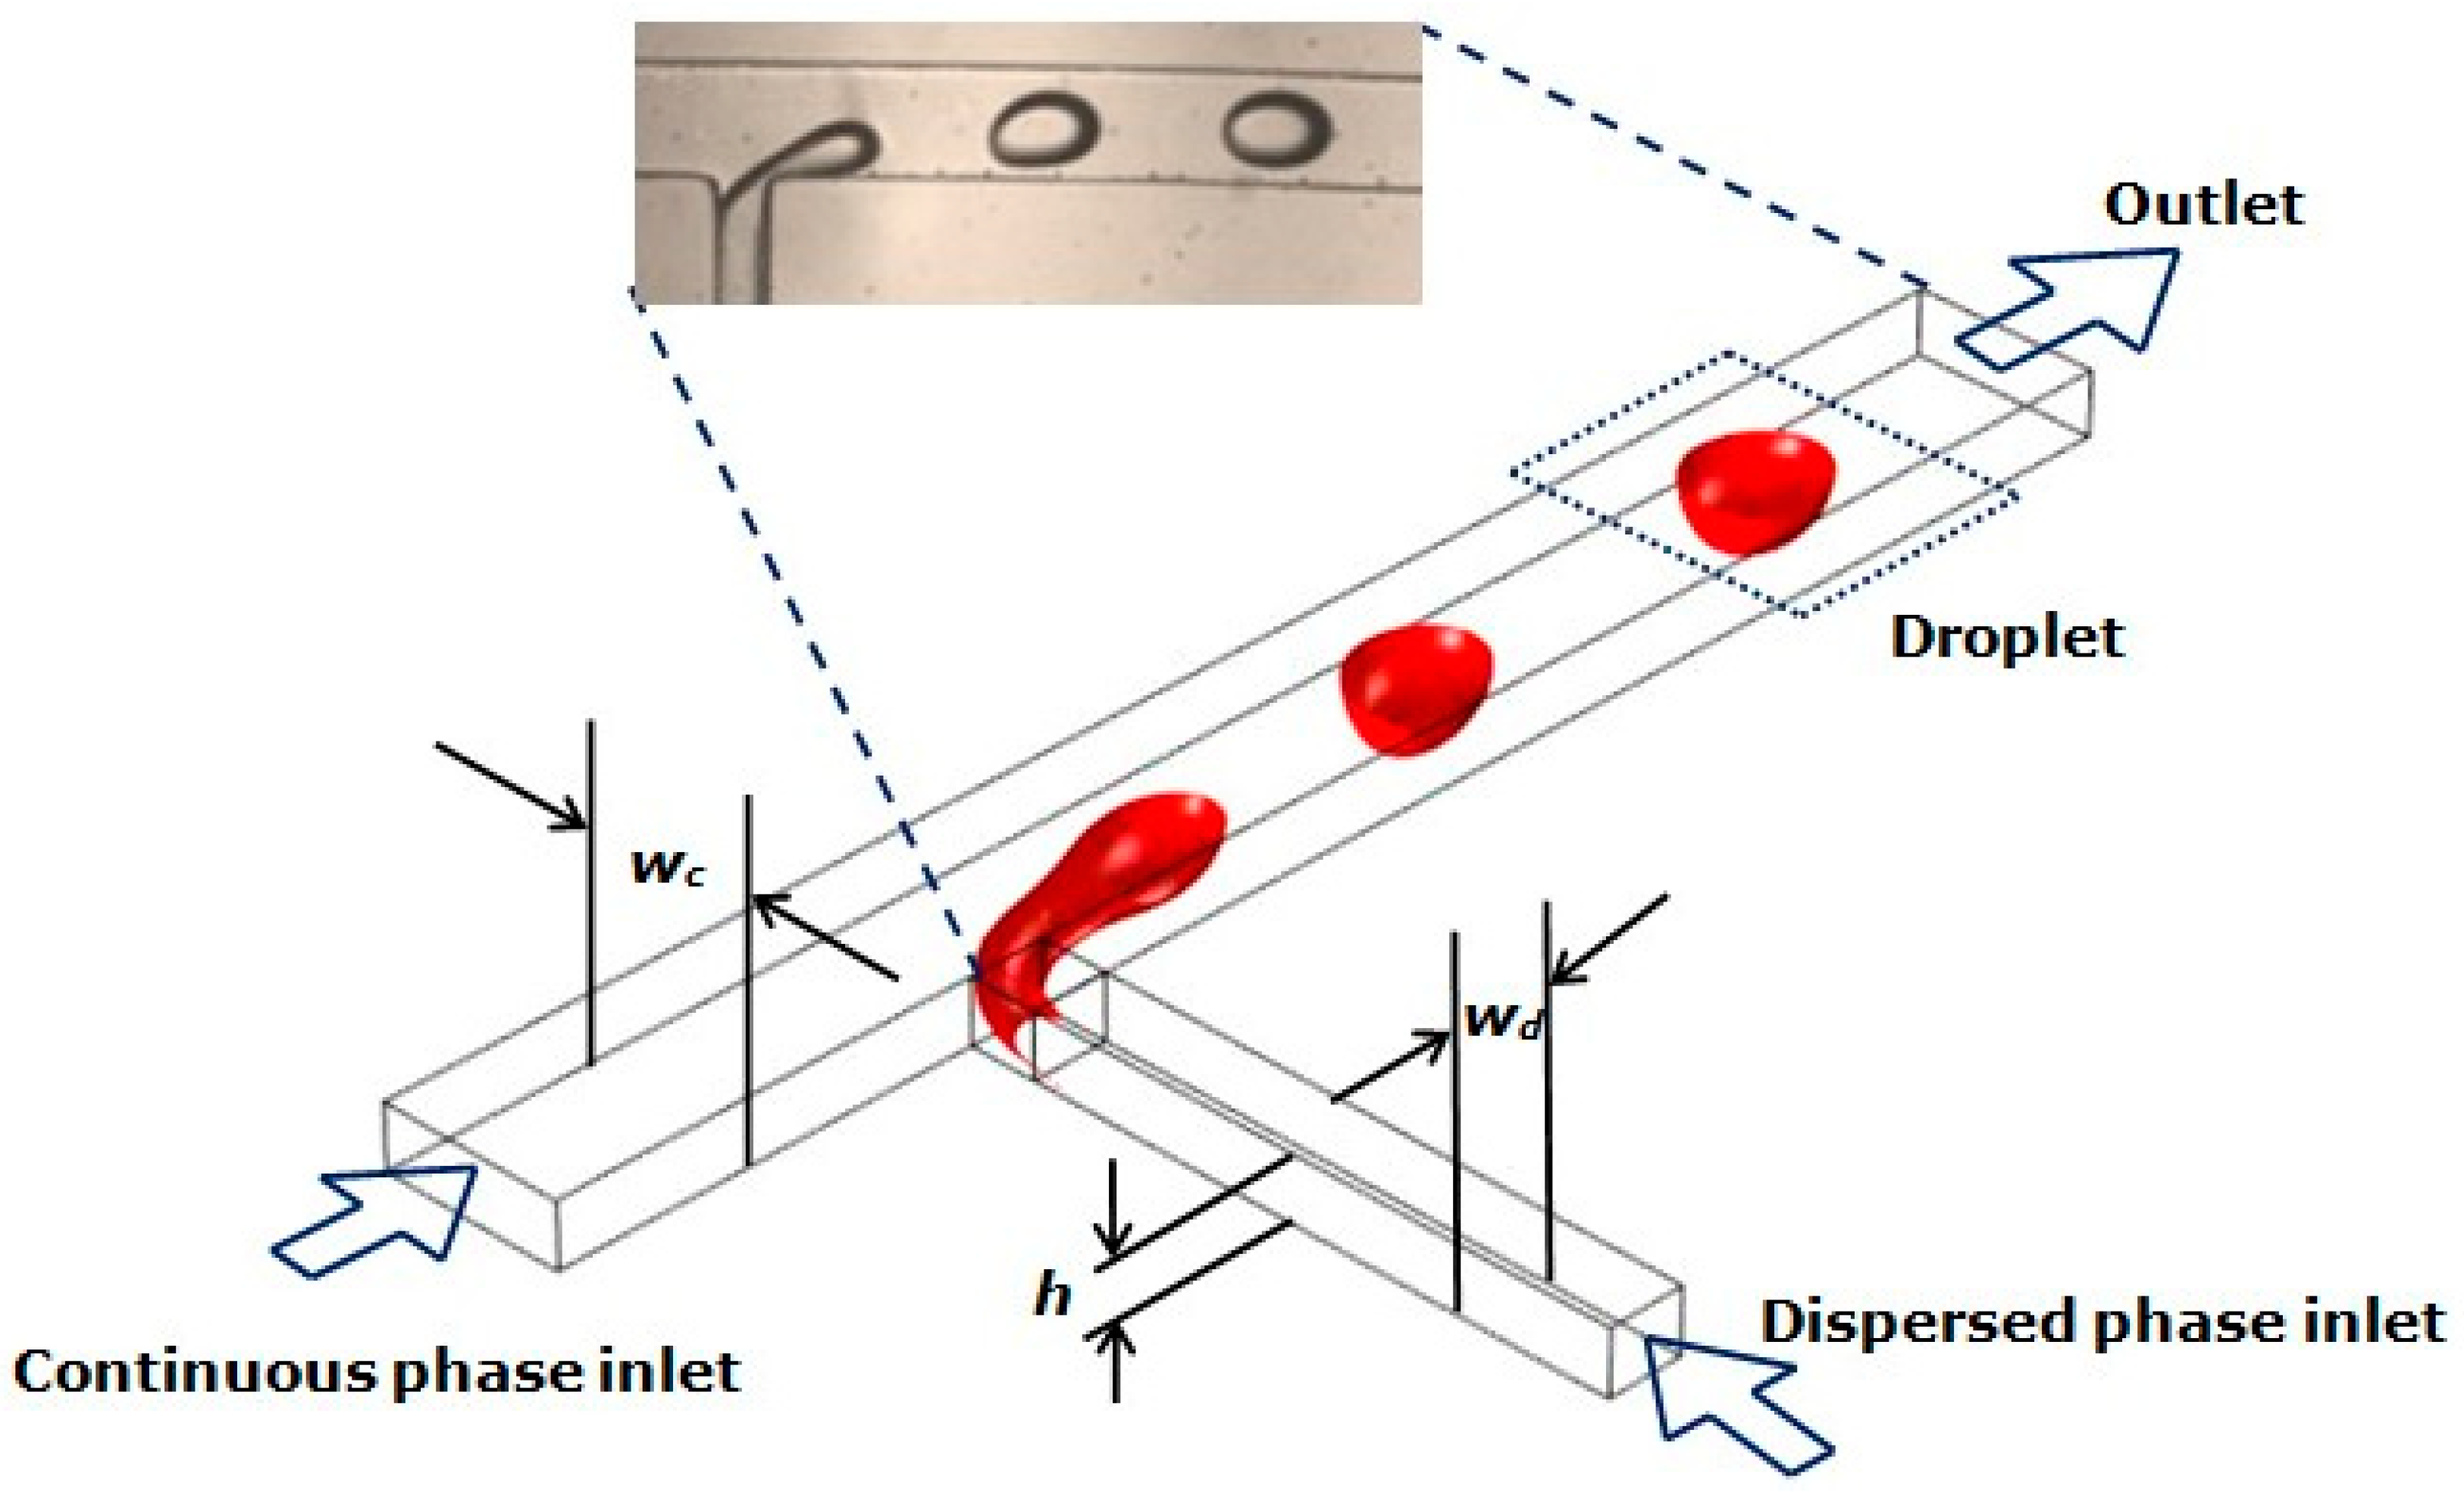
The microfluidic networks used in the present study were fabricated using soft lithography. The geometry was transferred onto a substrate coated with a negative photoresist (SU-8 2025, MicroChem, Westborough, MA, USA), and the cured substrate was used as a mould to generate microfluidic channels. Polydimethylsiloxane elastomer (PDMS, SYLGARD 184, Dow Corning, Midland, MI, USA) was used to stamp the moulds. The microchannels were fabricated by sealing the moulded pattern onto a glass slide, which was also coated with a thin layer of PDMS. A T-junction, as shown in
Figure 1, was used for the experiments presented here. PDMS channels are inherently hydrophobic, with the contact angle between the three phases (PDMS, olive oil, and de-ionised water) being 120.49 ± 9.19°. The contact angle was measured using a MATLAB (MathWorks, Natick, MA, USA) code developed in house, employing an image analysis code.
In such geometries, the dispersed phase (de-ionised water) flows through the side arm, which is orthogonal to the main flow channel, where the continuous phase (Olive oil, highly refined, low acidity, Sigma Aldrich, St. Louis, MO, USA) flows through. The channel height (h) of the microfluidic network used was 76 ± 5 μm, and the width of continuous (wc) and dispersed phase (wd) channels were 212 ± 10 μm and 104 ± 10 μm respectively.
The physical properties of the liquids used were measured at room temperature (20 ± 2 °C), and the values are given in
Table 1. Viscosity measurements were performed using an Ostwald viscometer (BS/U tube Viscometer) and density was measured using a densitometer (30PX Mettler Toledo, Colombus, OH, USA). Interfacial tension was determined using the pendant drop method, by dispensing a drop of de-ionised water into olive oil [
8]. It should be noted that Marangoni effects were neglected due the employment of pure solutions.
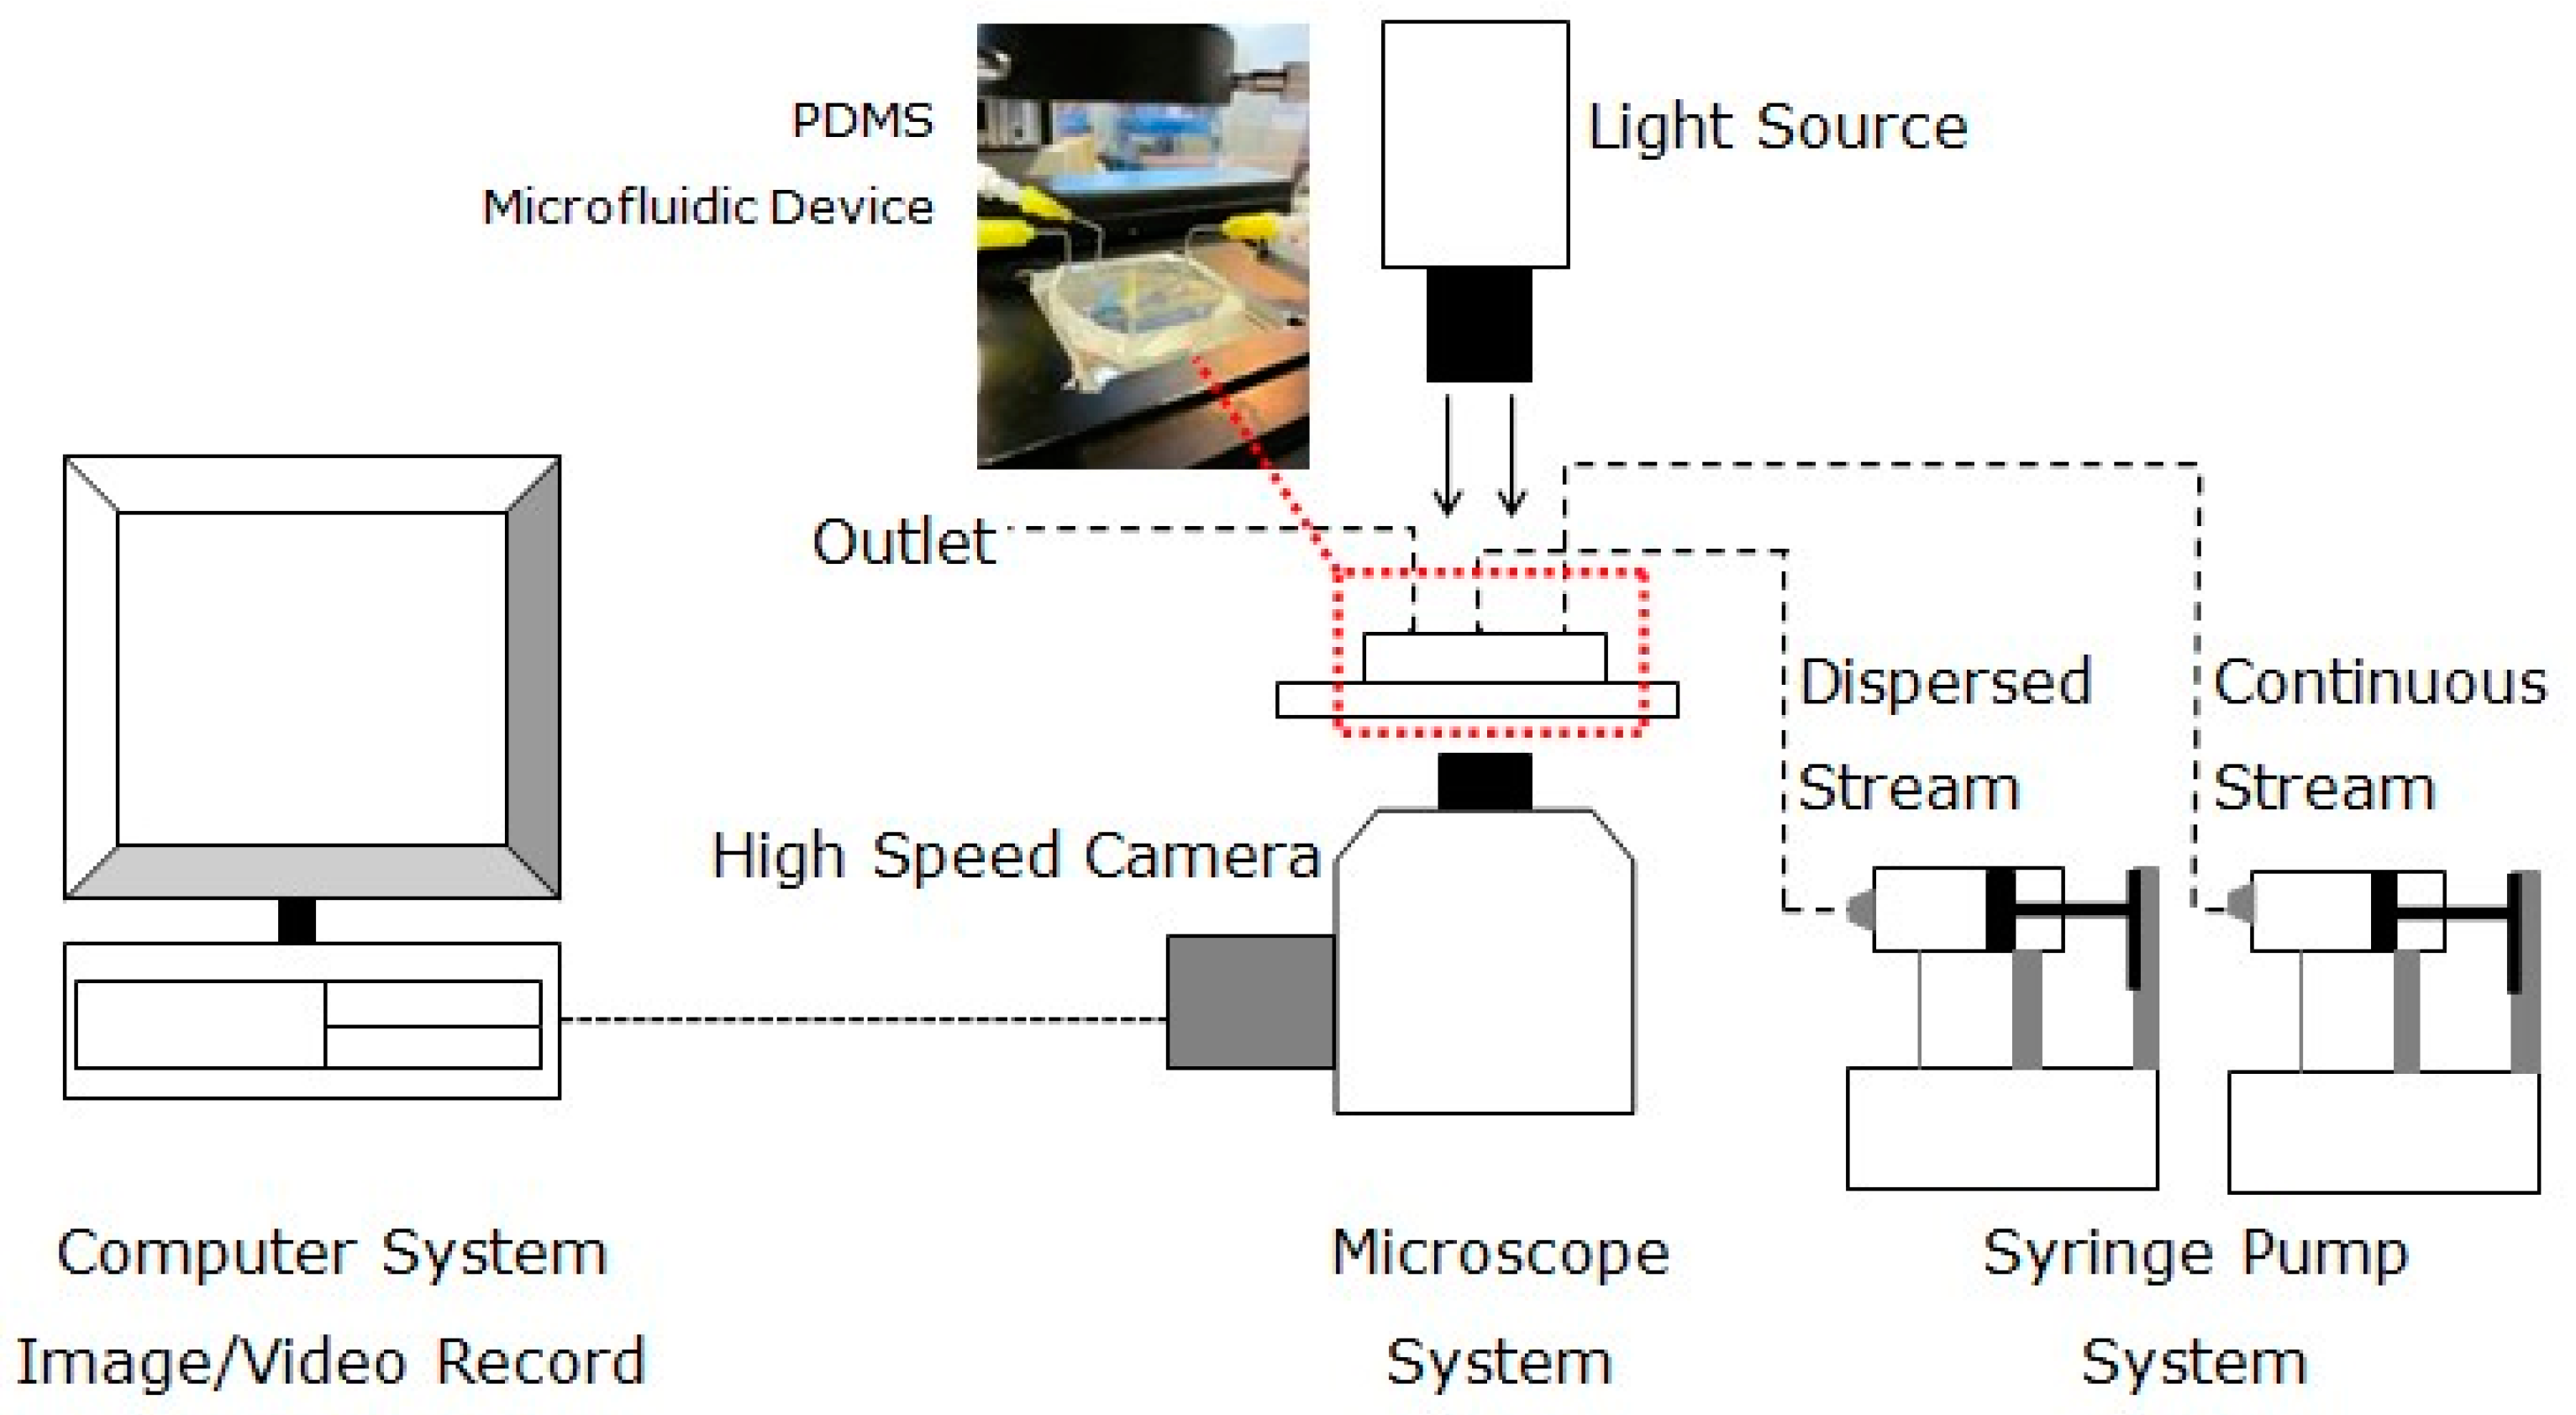
The experimental set up, as depicted in
Figure 2, consisted of two infusion pumps used to deliver the continuous and the dispersed phase (AL-1000, World Precision Instruments (Hitchin, UK) and NE-1000, ProSence B.V. (Oosterhout, The Netherlands). The droplets generated were captured using a high speed camera (HotShot CC, NAC Image Technology) mounted onto an inverted microscope (GXMXDS3 VS-3, GX Microscopes, GT Vision, Suffolk, UK) at a frame rate of 500 fps.
In order to identify the transition between regimes, the percentage of the channel filled by the droplet as soon as it is detached from the dispersed phase filament was employed as a threshold. A MATLAB image analysis code was developed, where images extracted from the high speed videos were analysed. A Gaussian filter was employed to smooth the resulting image, and the edges of the droplet and the microchannels were detected through the Sobel method. The detected boundaries were traced and extracted using the built-in boundary tracing function. The distance between the edge of the droplet and the microchannel walls was calculated, after converting the pixel values to micrometers. This enabled the calculation of the percentage of the channel occupied by the emerging droplet.
A modified capillary number based on the continuous phase properties, where
μc and
Uc represent the dynamic viscosity and the velocity of the continuous phase, while
σ denotes the interfacial tension between the two liquids [
30], was employed for the purpose of this study. The interfacial force term in this case was calculated using the interfacial tension between the continuous and dispersed phase.
Experiments were performed at several constant capillary numbers ranging from 0.0283 to 0.1132. At each capillary number (thus at each continuous phase flow rate), the droplet behaviour was examined at the range of dispersed phase flow rates employed. The flow rate ratios were kept similar for each capillary number. A summary of flow rates of both the continuous and dispersed phase, as well as the flow rate ratio between the two, is presented in
Table 2. Due to pump limitations, capillary numbers smaller than 0.0283 were excluded from the experimental study.
The volume of droplets generated was calculated by dividing the dispersed phase flow rate
Qd with the average frequency or rate of neck collapse, as obtained from the high speed videos. The rate of the neck collapse was defined as the rate at which the dispersed phase thread thinned, before breaking up into segments. The system was allowed to stabilise for 20 minutes for each flow rate examined in this work. It is worth mentioning that the coefficient of variation (the quotient of standard deviation over the mean) of the droplet volume was below 7%. Previous work by the authors demonstrated that the droplet diameter was not indicative of the size of the droplets, as the effect of confinement is significant and cannot be neglected [
31]. Experiments performed using two different microchannel networks indicated that increasing the cross-sectional area of the continuous phase channel resulted in an increase of the volume of the resulting droplets. The volume can be used as a universal indication of the size, as it is applicable for all systems and regimes [
31].


