Article

Distribution, Spread, and Habitat Predictability of a Small, Invasive, Piscivorous Fish in an Important Estuarine Fish Nursery

by
M. F. D. Greenwood
ICF, 630 K Street, Sacramento, CA 95814, USA
Submission received: 14 February 2017 / Revised: 6 May 2017 / Accepted: 8 May 2017 / Published: 13 May 2017

Abstract

:
Invasive species often cause negative ecological and economic effects. Florida has >20 established invasive fish species but only seven exist in saltwater. The present study examined Belonesox belizanus (Pike Killifish), a Central American euryhaline fish introduced to Tampa Bay (west-central Florida) in the early 1990s, which has quantifiably reduced populations of small-bodied native fishes and may compete with prized sportfish juveniles in estuarine nursery habitat. Long-term monitoring revealed that B. belizanus occurs in estuarine waterbodies along a 31-km stretch of the bay’s eastern fringe, with a second, smaller population in two western tributaries. Spread rate was estimated to be 5.5–13 km year−1, intermediate among invasive poeciliids. A novel implementation of boosted regression tree modeling to assess B. belizanus habitat predictability found greater probability of presence with decreasing water depth and pH, whereas presence tended to be greatest at polyhaline salinity. It is hypothesized that B. belizanus distribution in Tampa Bay is constrained by deep, seawall habitats acting as ecological barriers. Further B. belizanus spread therefore may be most likely to occur by human release (from aquaria or bait buckets) or bird carry-off. Newly restored tidal habitat within the current range probably will be invaded quite quickly by B. belizanus.

1. Introduction

Invasive species, habitat degradation or loss, and pollution are the most important threats to native fishes in the USA [1]. Invasive species are defined by the United States government as “with regard to a particular ecosystem, a non-native organism whose introduction causes or is likely to cause economic or environmental harm, or harm to human, animal, or plant health” [2]. The number of established nonnative fishes in the USA more than doubled between 1970 and 2013 [3]. Negative ecological effects from invasive fishes can include predation, competition, and interference [4]. Economic losses from invasive fishes have been estimated at several billion US dollars annually [5]. Successful establishment of invasive fishes in new habitats, whether through intentional or unintentional releases, may depend on a variety of factors including broad physiological tolerance, rapid dispersal, and similarity of habitat to the native range [6].
Prediction of invasive fish presence and habitat use is one of the most important applications of species distribution modeling [7]. Establishing species-habitat relationships that are general and broadly applicable rather than idiosyncratic to a narrow set of conditions is desirable for allowing successful prediction of presence in unsampled areas [8]. Prediction serves as an important means of validating the generality of observed species-habitat relationships and was recently argued by Houlahan et al. [9] to be essential for demonstrating ecological understanding.
Peninsular Florida is likely to contain more invasive freshwater fish than any other similarly sized area in the world [10], probably because the warm climate facilitates survival of tropical fish that are released from freshwater aquaria or that escape from fish farms [11]. Although freshwater invasive fishes are prevalent, there are relatively few established invasive saltwater or estuarine fishes in Florida: Schofield and Loftus [12] described 22 permanently established freshwater fishes, whereas Schofield et al. [13] noted only two permanently established marine fishes (the lionfishes Pterois volitans and Pterois miles). Six of the permanently established freshwater fishes are euryhaline and occur in saltwater habitat [13]. The Pike Killifish Belonesox belizanus Kner (Pisces: Poeciliidae) is among these species and was introduced to Miami-Dade County, south Florida, in 1957 when ~50 excess medical research specimens were released into an agricultural canal [14]. Although the main invasive distribution of B. belizanus is in south Florida (Figure 1), a secondary introduction occurred in the Tampa Bay watershed (west central Florida), possibly as a result of escape from a tropical aquaculture facility [15], and is the subject of the present study.
B. belizanus is native to Central American Atlantic drainages south of the Punta del Morro (Mexico) to northeastern Costa Rica [16,17] and although the largest species within the Poeciliidae, it is still relatively small (maximum size of 200-mm total length; [17]). All life stages of B. belizanus are carnivorous [17], with prominent teeth and a novel gape adaptation that allows the species to consume prey that are relatively large for its size [18]. The primary prey for all life stages (including neonates) is fish [14,19,20,21]. The ability to switch to invertebrate prey such as small shrimps is considered to allow B. belizanus to be a successful invader despite its specialized, invariant feeding mechanism [22]. In south Florida, B. belizanus was observed to deplete small resident fish populations after introduction [14,19] and the species was recently classified at the upper end of medium risk for potential negative effects [23]. Recognition of the ecological risk from B. belizanus is evidenced by the species being prohibited for possession in a number of American states, although not Florida.
There is strong quantitative evidence that the Tampa Bay population of B. belizanus has significantly reduced abundance of small-bodied resident fishes, in particular Sailfin Molly Poecilia latipinna, Eastern Mosquitofish Gambusia holbrooki, and Sheepshead Minnow Cyprinodon variegatus [24]. Although there is little evidence for direct effects on abundance or size distribution of estuary-dependent migratory species, which generally grow to larger sizes and recruit from larger source populations than resident fishes, the depletion of resident prey fishes by B. belizanus is of concern for its potential indirect effects on estuary-dependent species through competition [15]. In particular, Tampa Bay provides important nursery habitat for Common Snook Centropomus undecimalis, a prized sportfish supporting a substantial recreational fishery (>277,000 directed trips year−1 worth $15.8 M year−1; [25]), which experienced a considerable cold-kill-related decline in recent years [26] and occurs in estuarine areas in which B. belizanus is also found [27,28,29].
Knowledge of B. belizanus spread, distribution, and habitat associations in Tampa Bay is therefore of considerable importance both from the perspective of biodiversity (structuring of resident native fish assemblages) and potential effects on managed fisheries. Qualitative accounts of B. belizanus habitat in the native range describe occupation of a variety of shallow-water, low-flow habitats ranging from freshwater to hypersaline, including mangrove swamps, sinkholes, ponds, creeks, and river backwaters [17,30,31,32]. Quantitative evaluations of B. belizanus habitat have included multispecies analyses in the native range [33,34,35,36] and a detailed single-species evaluation of associations with physicochemical parameters from several datasets collected in south Florida [37]. The latter study found B. belizanus density was correlated with salinity and temperature at the southernmost, estuarine sites, whereas pH was most associated with changes in density at the northern, inland sites.
The present study used long-term monitoring and shorter duration sampling efforts [24] to ask three main questions. First, what is the distribution of B. belizanus in estuarine portions of the Tampa Bay watershed? Examination of the species’ distribution allowed hypotheses to be developed for the potential factors constraining B. belizanus within Tampa Bay and, by extension, south Florida. Second, what is the spread rate of B. belizanus? Given the observed negative effects of the species, knowledge of spread rate is vital to understanding the expansion of the potential risk posed by B. belizanus, particularly because global climate change may provide more favorable temperatures over a greater spatial area of Florida and other states in the future [38]. Third, what are the habitat associations of B. belizanus? Following the philosophy of Houlahan et al. [9] that prediction should be used to aid ecological understanding, the present study employed a novel method to assess predictability of habitat use in test waterbodies based on boosted regression tree models developed from independent, training waterbodies. This allowed examination of the extent to which observed B. belizanus–habitat relationships were general and broadly applicable rather than idiosyncratic and limited to specific waterbodies. The present study is the first quantitative, single-species examination of B. belizanus–habitat relationships based solely on data collected in situ at the time of sampling, and demonstrates a method that can also be used for other species and locations. The main conclusions of the present study are that the principal Tampa Bay population of B. belizanus is distributed in eastern estuarine waterbodies, with a smaller, spatially restricted western population that is likely to have been a separate introduction. Although the rate of B. belizanus spread is comparable to that of some other invasive fishes, the distribution may be constrained by soft ecological barriers, which emphasizes the need to manage human-mediated spread. Success of B. belizanus in Tampa Bay appears facilitated by its spread rate, broad environmental tolerance, and relatively distinct ecological niche.

2. Materials and Methods

All data used in the present study are provided as Supplementary Material.

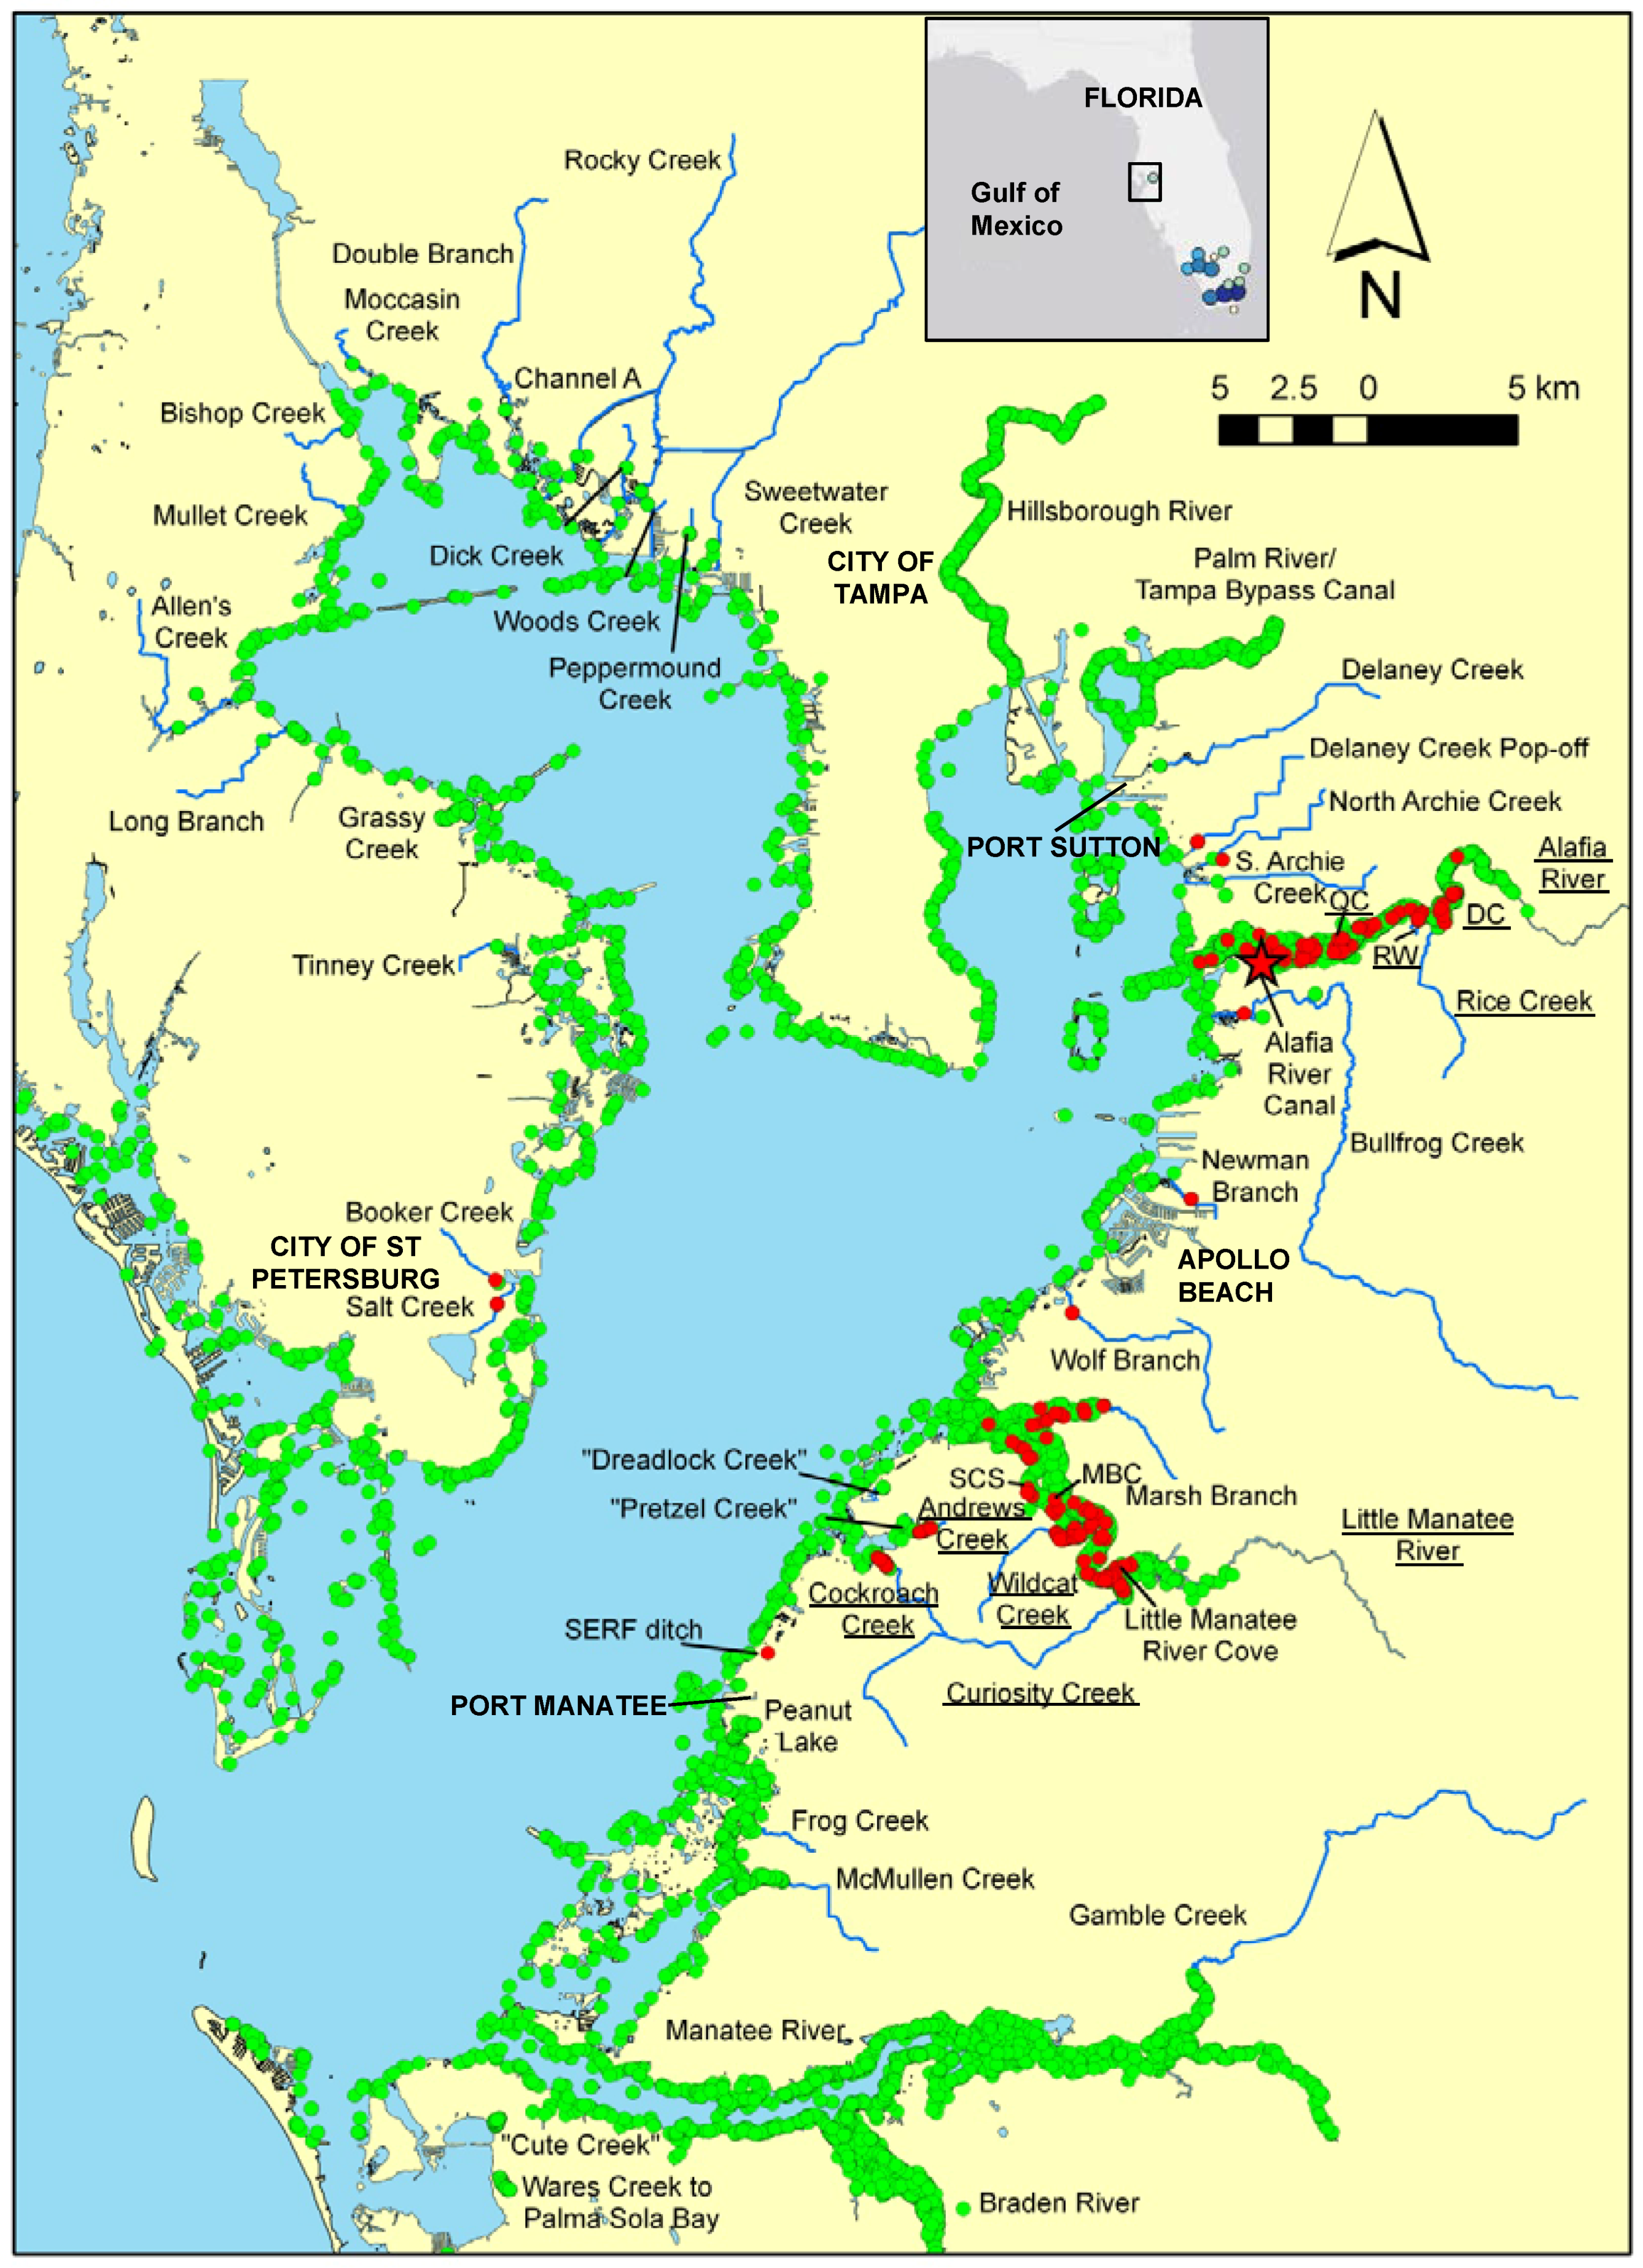
2.1. Study Area and Sampling Techniques

Tampa Bay is Florida’s largest open-water estuary (1031 km2; [39]), a subtropical system that, although greatly altered by urbanization, still has relatively large areas fringed by mangroves, salt marshes, and other natural vegetation [29,40,41]. Four main tributaries (the Hillsborough, Alafia, Little Manatee, and Manatee rivers) provide freshwater inflow, with approximately 100 smaller tributaries also draining to the bay (Figure 1; [42]). The smaller tributaries and creeks range from relatively natural mangrove- or saltmarsh-lined waterbodies to urbanized systems with considerable amounts of seawall and riprap. Physicochemical conditions vary widely and salinity ranges from nearly fresh to polyhaline, depending on tides, precipitation, and wind. Tampa Bay is described in detail by Lewis and Estevez [39].
Analyses presented herein used data collected in 1989–2008 during diurnal shoreline seine sampling within estuarine waterbodies of the Tampa Bay watershed by the Florida Fish and Wildlife Conservation Commission, Fish and Wildlife Research Institute’s Fisheries-Independent Monitoring program [24]. Data from trawling in deeper areas and seines deployed away from the shore were not considered because B. belizanus was never collected in these habitats. In all sampling, B. belizanus specimens were identified, counted, and measured (standard length, mm). Descriptive habitat data and physicochemical parameters were also recorded, as described further below. Secchi depth as a measure of water clarity was also measured, but is not included in analyses because sampling sites were sufficiently shallow that the Secchi disk was almost always visible on the substrate. Further details of the sampling procedures can be found elsewhere [24,43].

2.2. Data Analysis

2.2.1. Distribution and Spread Rate

Coordinates of sites at which B. belizanus was present or absent during seine sampling were overlaid on maps of the Tampa Bay watershed to assess the species’ distribution. Long-term sampling in the lower Little Manatee River watershed was used to examine the rate of spread following first occurrence. This watershed was selected to examine rate of spread because it offered the most comprehensive, consistent longitudinal sampling and monthly sampling had already commenced before first occurrence (in contrast to the Alafia River, for example, wherein sampling was only seasonal at the time of first occurrence). Monthly 21.3-m shoreline seine sampling in the Little Manatee River watershed occurs in the lowermost 13 km of the river main stem and accessible adjacent habitats (Figure 2). Sampling is stratified into upstream and downstream zones 7 km upstream of the river mouth (Figure 2), with 4 samples per month in each zone. The temporal sequence of observations suggested that B. belizanus invaded the Little Manatee River from downstream to upstream. Following Ben Rais Lasram et al. [44], the rate of spread (S) was calculated:
S t =   ( d t     d t 1 ) ( D t     D t 1 ) ,
where d is distance upstream of the mouth of the Little Manatee River (km), D is number of days from the first observation in the river, t is a given observation of B. belizanus, and t − 1 is the previous downstream observation of B. belizanus.

2.2.2. Habitat Predictability

Habitat predictability of B. belizanus was investigated using data collected monthly in 2006 or 2007 with 9.1-m seines in 11 estuarine waterbodies within the species’ range in the Tampa Bay watershed, consisting of small creeks, canals, and adjacent non-creek/canal habitats (river main-stems or bayous) (Figure 1, Table 1 and Table 2; [24]). The original purpose of sampling in these waterbodies was to assess the value of tidal creeks/canals as nekton habitat, with the adjacent non-creek/canal habitats generally also sampled to provide a contrast. Each waterbody was divided into longitudinal spatial strata (~200 m long) and daylight sampling was undertaken monthly at randomly chosen locations between each creek/canal’s mouth and the upstream extent that could be reached within time or access constraints. Sites were chosen from a set of predefined geographic coordinates with a random number generator. The number of samples per waterbody was proportional to the extent of the waterbody that was sampled, with two samples per spatial stratum per month; thus, the number of seine samples ranged from four per month in smaller waterbodies (250–300 m long) to 10 per month in larger waterbodies (1000 m long). Adjacent waterbodies (rivers or bayou) also received two samples per month per stratum, with one stratum located upstream and downstream of the creek/canal mouths. A total of 935 shoreline seine samples was collected. Additional detailed description of the studied waterbodies is provided in [21,45].
Relationships between B. belizanus probability of presence and a variety of habitat predictor variables were examined using Boosted Regression Trees (BRT; [46]). As described by Elith et al. [46], BRT is a machine learning method that combines regression trees (models that relate a response to their predictors by recursive binary splits) and boosting (an adaptive method for combining many simple models to give improved predictive performance), resulting in final models that are essentially additive regression models in which individual terms are simple trees, fitted in a forward, stagewise fashion. The advantages of BRT include no need for prior data transformation or elimination of outliers, ability to fit complex nonlinear relationships, and inclusion of interactions between predictors [46].
Habitat variables were assessed in the BRT modeling for their potential to influence the probability of presence of B. belizanus based on previously observed or hypothesized relationships. Julian day was included to represent seasonality [37]. Waterbody type was included to test for the potential importance of mesohabitat, given previous qualitative observations of habitat preference (Miller [30]: “swamps and the eddies of streams”; Turner and Snelson [20]: “…habitats with some degree of cover, such as mangrove swamps and narrow, shallow canals with dense aquatic vegetation…not found in large, open canals or borrow ponds”; Greenfield and Thomerson [31]: “…shallow water and areas of heavy vegetation”, “temporary ponds that form during…flooding”, “larger rivers and streams…usually found close to shore, in slower-moving backwater areas”; and Miller et al. [17]: “…ciénegas, lagoons, ponds, and slow-moving parts of creeks and rivers…”). Waterbodies were classified as creek (natural tributaries of larger rivers), canal (dredged inlets of larger rivers), bayou (large open embayment of a river), and river (mainstems of the two main rivers within the B. belizanus range, Alafia and Little Manatee). Dominant shoreline type at each sampling site was included because of qualitative observations of differences in B. belizanus presence between vegetation type [20], and was characterized as emergent marsh (primarily black rush, Juncus roemarianus), mangrove (red mangrove, Rhizophora mangle, or black mangrove, Avicennia germinans), small terrestrial vegetation (primarily leather fern, Acrostichum danaefolium), shrubs/trees, or artificially hardened (e.g., sea wall or rip rap). Associated with shoreline type were qualitative variables for whether or not the shoreline was inundated during sampling and whether or not the shoreline vegetation was overhanging the sampling site; these variables could influence the probability of presence along shoreline habitat, as shown for other fishes [47,48]. Substrate type was represented in the BRT models as mud, mud-sand, sand, or some oyster/rock. Water depth (at the seine’s bag, i.e., 1.5 m from shore; with sampling limited to sites 1.2 m deep or less) and site gradient (calculated as the difference in water depth between the seine’s bag and the seine’s wing at the shore, divided by the distance between bag and shore, and expressed as a percentage) were included to address these variables’ potential importance for predation risk [49]. Physicochemical variables previously shown to correlate with B. belizanus density in south Florida [37] were also included in the BRT models: salinity, temperature, dissolved oxygen, and pH. These physicochemical variables were measured at 0.2-m depth with a Hydrolab® multiprobe (OTT Hydromet, Kempten, Germany), reflecting B. belizanus’s tendency to inhabit surface waters [30].
In order to examine habitat predictability for B. belizanus presence, a novel approach based on creating two sets of BRT models was implemented. Hereinafter the models are referred to as the fixed subset and randomly selected subset models. For both types of models, training data are defined as the data used to formulate the model, whereas test data were not used for model formulation and instead were used to test the models’ predictive performance, i.e., the test data were independent of the training data. For the fixed subset model, test data were represented by the data collected in three waterbodies (Andrews Creek, Curiosity Creek, and Question Mark Creek; n = 240 samples, 25.7% of the 935 total samples), which were chosen on the basis of their habitat characteristics being within the range encompassed by the other eight waterbodies (Table 1 and Table 2). Training data thus consisted of the 695 samples (74.3%) from these eight other waterbodies. The fixed subset BRT model was implemented in the dismo package [50] of the R software environment [51] using a bag fraction (i.e., the proportion of data to be selected at each step of the model) of 0.5, a learning rate (i.e., the shrinkage parameter determining the contribution of each tree to the growing model) of 0.005, and tree complexity of 2 (i.e., allowing first-order interactions) in order to achieve Elith and coworkers’ [46] recommendation of >1000 trees for reliable model predictions. Exploration of a higher order of tree complexity (5) did not yield substantial improvement in the model’s predictive performance, so tree complexity of 2 was implemented for the final analysis. Given the stochasticity in BRT model formulation [46], 1000 iterations of the fixed subset model were undertaken in order to examine the variability in model predictive performance and the consistency in relationships between B. belizanus presence and habitat. Model fitting, tenfold crossvalidation, and prediction of the model to the test data were undertaken for each of the 1000 iterations of the fixed subset model.
The randomly selected subset BRT model consisted of randomly selecting (without replacement) 695 samples of the total 935 samples to use as training data, then repeating the steps described above for the fixed subset model: model fitting, crossvalidation, and prediction to the test data (i.e., the randomly remaining 240 samples). This whole procedure was repeated 1000 times, again to illustrate the variability in model predictive performance and consistency in B. belizanus presence–habitat relationships.
The predictive performance of the fixed and randomly selected subset BRT models in correctly modeling presence of B. belizanus was assessed using the area under the receiver operating characteristic curve (AUC). As noted by Huang and Frimpong [7], AUC values are commonly interpreted as follows: AUC > 0.9 is excellent; 0.8 < AUC < 0.9 is good; 0.7 < AUC < 0.8 is fair; 0.6 < AUC < 0.7 is poor; and 0.5 < AUC < 0.6 is failed (i.e., similar to random guessing). Huang and Frimpong suggested that this classification scheme is too demanding for prediction to test data, given that the scheme was developed for the purpose of assessing model fit rather than transferability (prediction); instead, they used a threshold of AUC < 0.6 to indicate limited transferability from training to test data for prediction [7]. This threshold was also considered appropriate for the present study. Similar to the approach used by Broennimann and Guisan [52], the variability in AUC over the 1000 iterations of the fixed subset and randomly selected BRT models allowed 95% intervals to be calculated, based on the 2.5th and 97.5th percentiles of AUC. The overlap of the 95% intervals was assessed to examine the evidence for differences in predictive performance between fixed subset and randomly selected BRT models for training, crossvalidation, and prediction to test data.
In addition to assessing predictive performance with AUC, the ability of the fixed subset BRT to predict presence in the three test waterbodies was assessed by summing the probability of presence over all samples for each waterbody to give an overall predicted % presence for each iteration of the model, with 95% intervals calculated based on the 2.5th and 97.5th percentiles of the 1000 iterations. The predicted estimates of % presence were compared to the actual % presence in each waterbody, for which 95% intervals were generated by bootstrapping—randomly sampling with replacement, for the same sample size as the original sample [53]—the presence/absence data 1000 times, then calculating the 2.5th and 97.5th percentiles of the % presence from each of the 1000 resamples.
The relative contribution [54] of the habitat predictor variables to B. belizanus presence was compared between the fixed and randomly selected subset BRT models using the 95% intervals from the 1000 model iterations. The consistency of B. belizanus presence–habitat relationships between the fixed and randomly selected subset models was assessed with partial dependence plots from R’s gbm package [55]. The partial dependence plots illustrated the marginal effect of each habitat predictor on B. belizanus probability of presence after accounting for the average effects of all other predictors in the models, and were based on the 95% intervals of the marginal effects from the 1000 model iterations.

3. Results

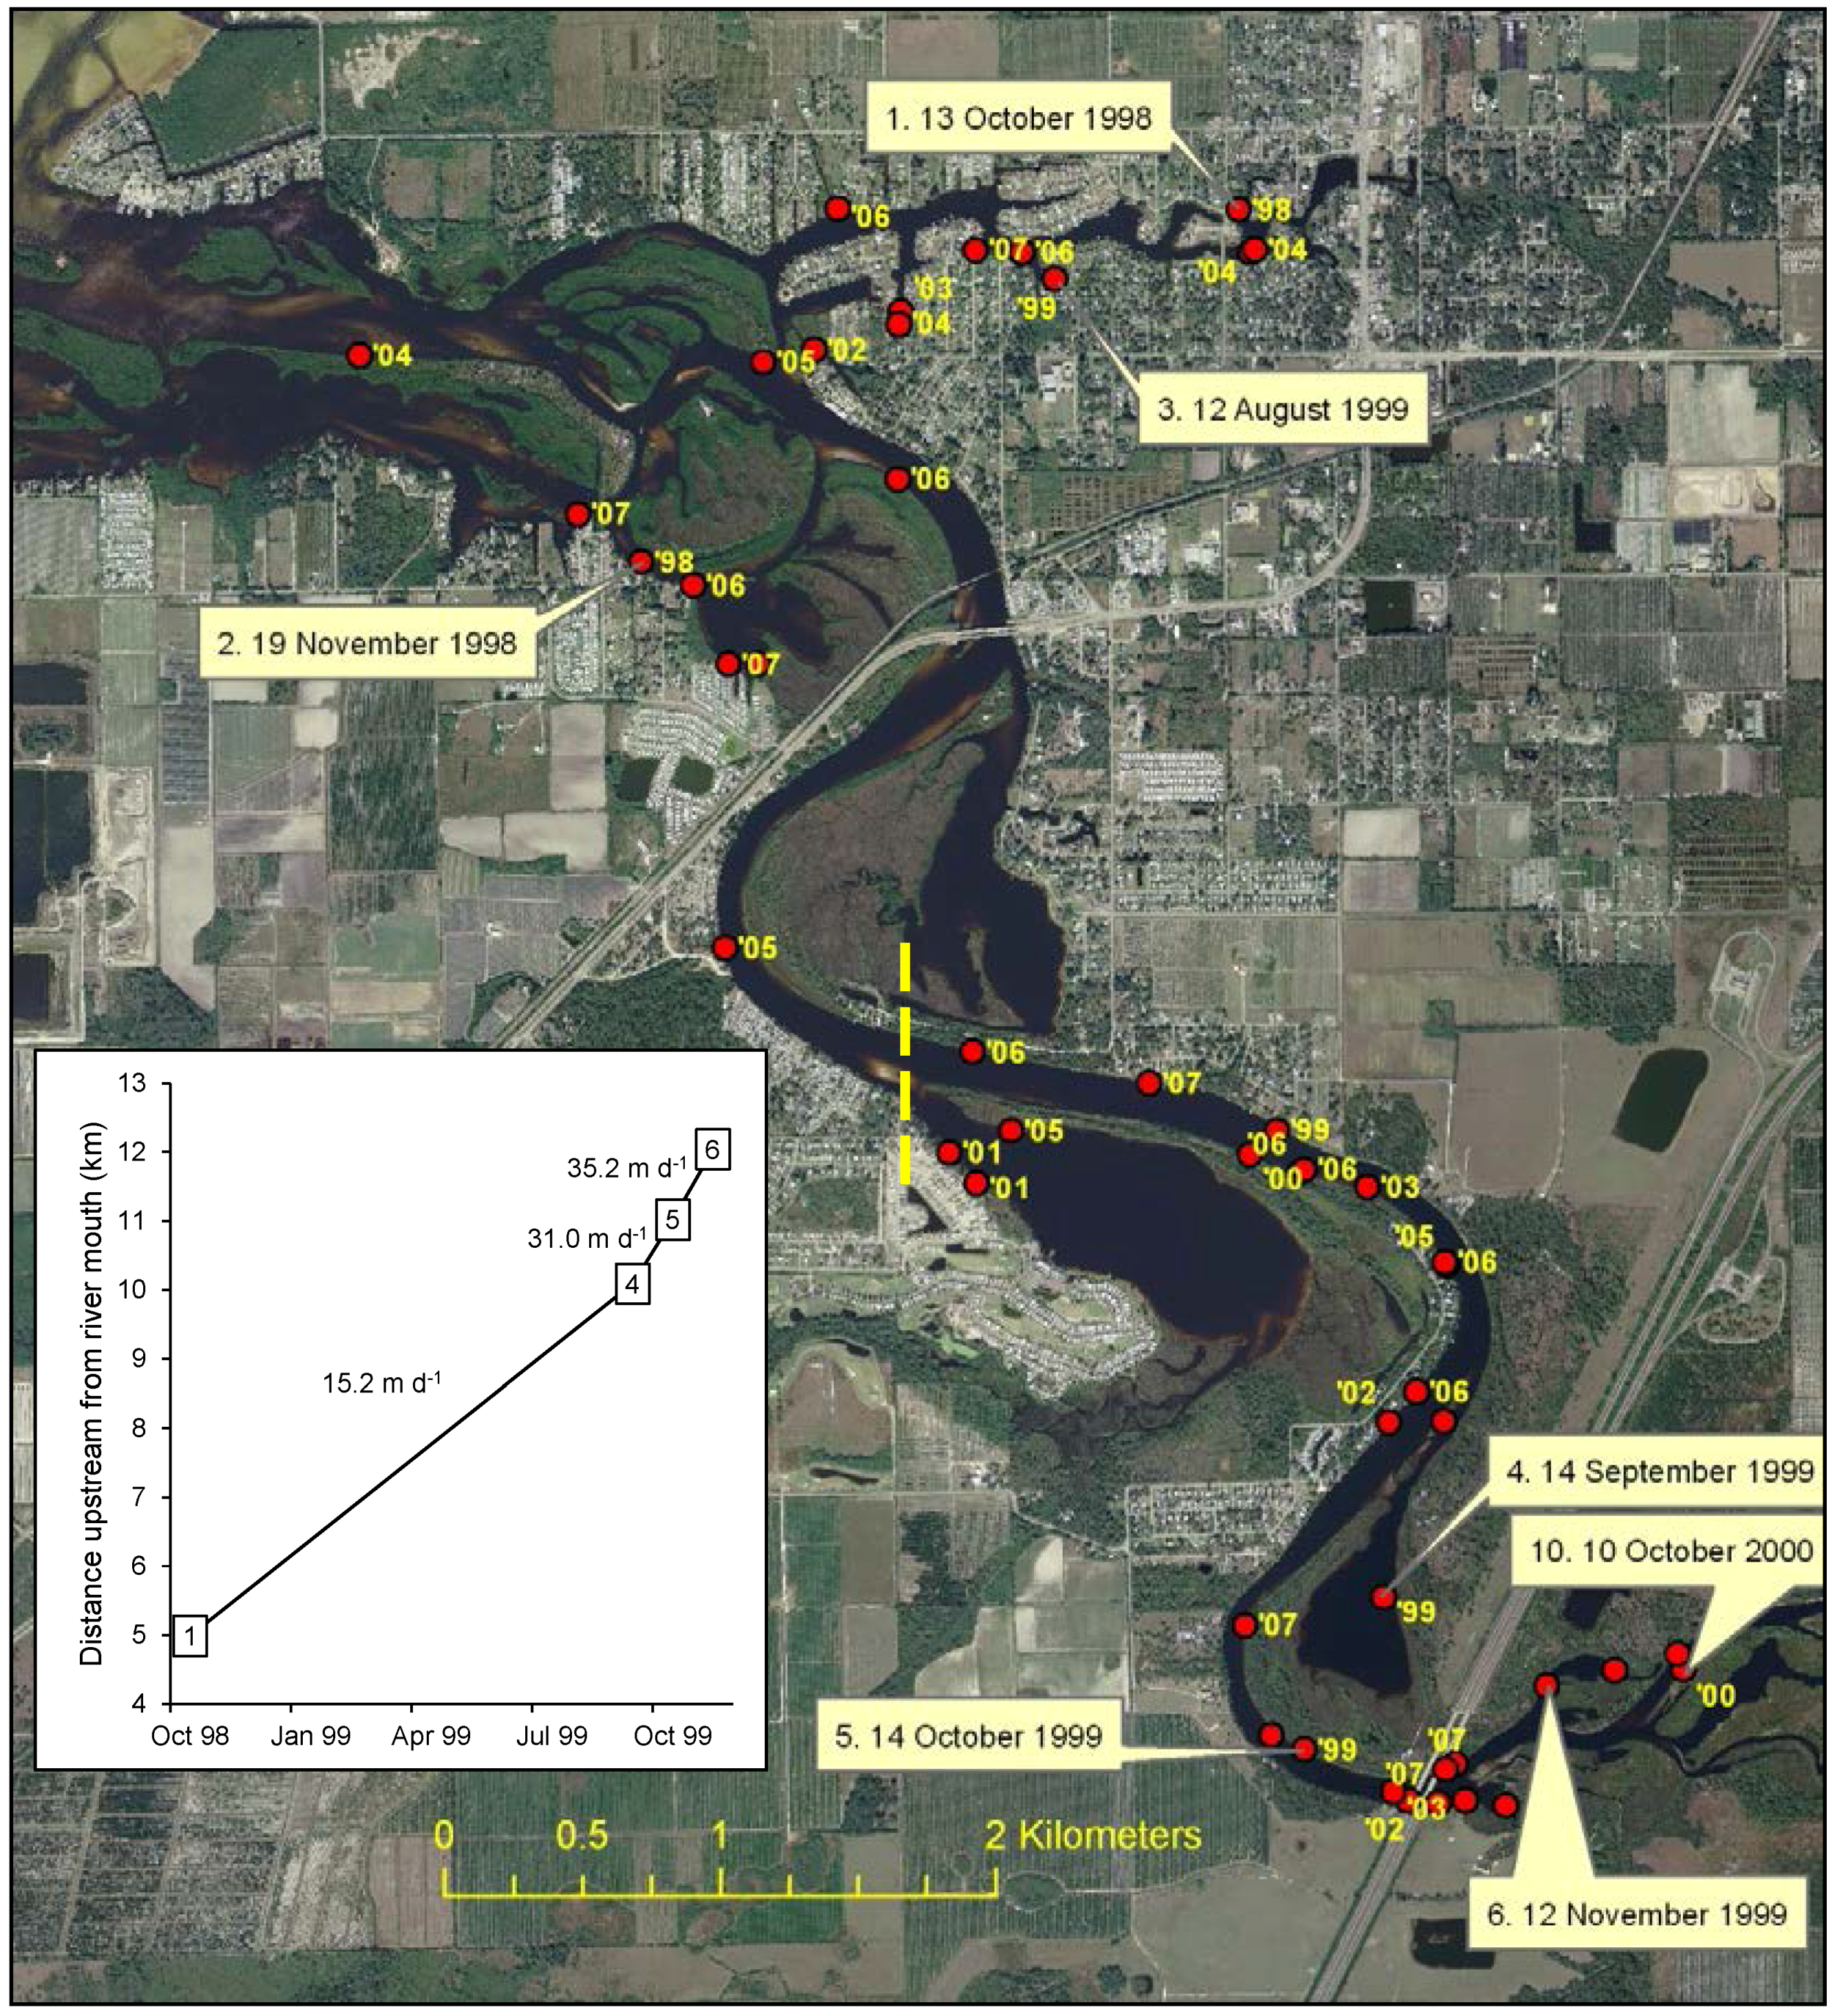
3.1. Distribution and Spread Rate

The first specimen of B. belizanus collected in the Tampa Bay watershed was made on 21 February 1994 from a canal off the Alafia River (at 3.2 km from the river mouth; Figure 1). During extensive sampling occurring in 2006/2007, B. belizanus was mostly collected in a number of waterbodies draining either directly to eastern Tampa Bay, to the Alafia River, or to the Little Manatee River (Figure 1). Data collected following this period (2008–2016), primarily as a continuation of long-term monitoring for status and trends in estuary-dependent sportfishes and nekton communities, found B. belizanus in similar areas within this range [56,57]. The straight-line distance from the northernmost to southernmost collection locations is approximately 31 km. B. belizanus was also collected in two small urban creeks in the city of St. Petersburg, on the western fringe of Tampa Bay (Figure 1).
The first collection of B. belizanus in the Little Manatee River watershed was made on 13 October 1998, approximately 5 km from the mouth of the river, with the farthest upstream collection within the sampling area at approximately river km 13 of the main stem in October 2000 (Figure 2). Four collections between October 1998 and November 1999 gave estimated spread rates of 15–35 m day−1 (5.5–13 km year−1; Figure 2).

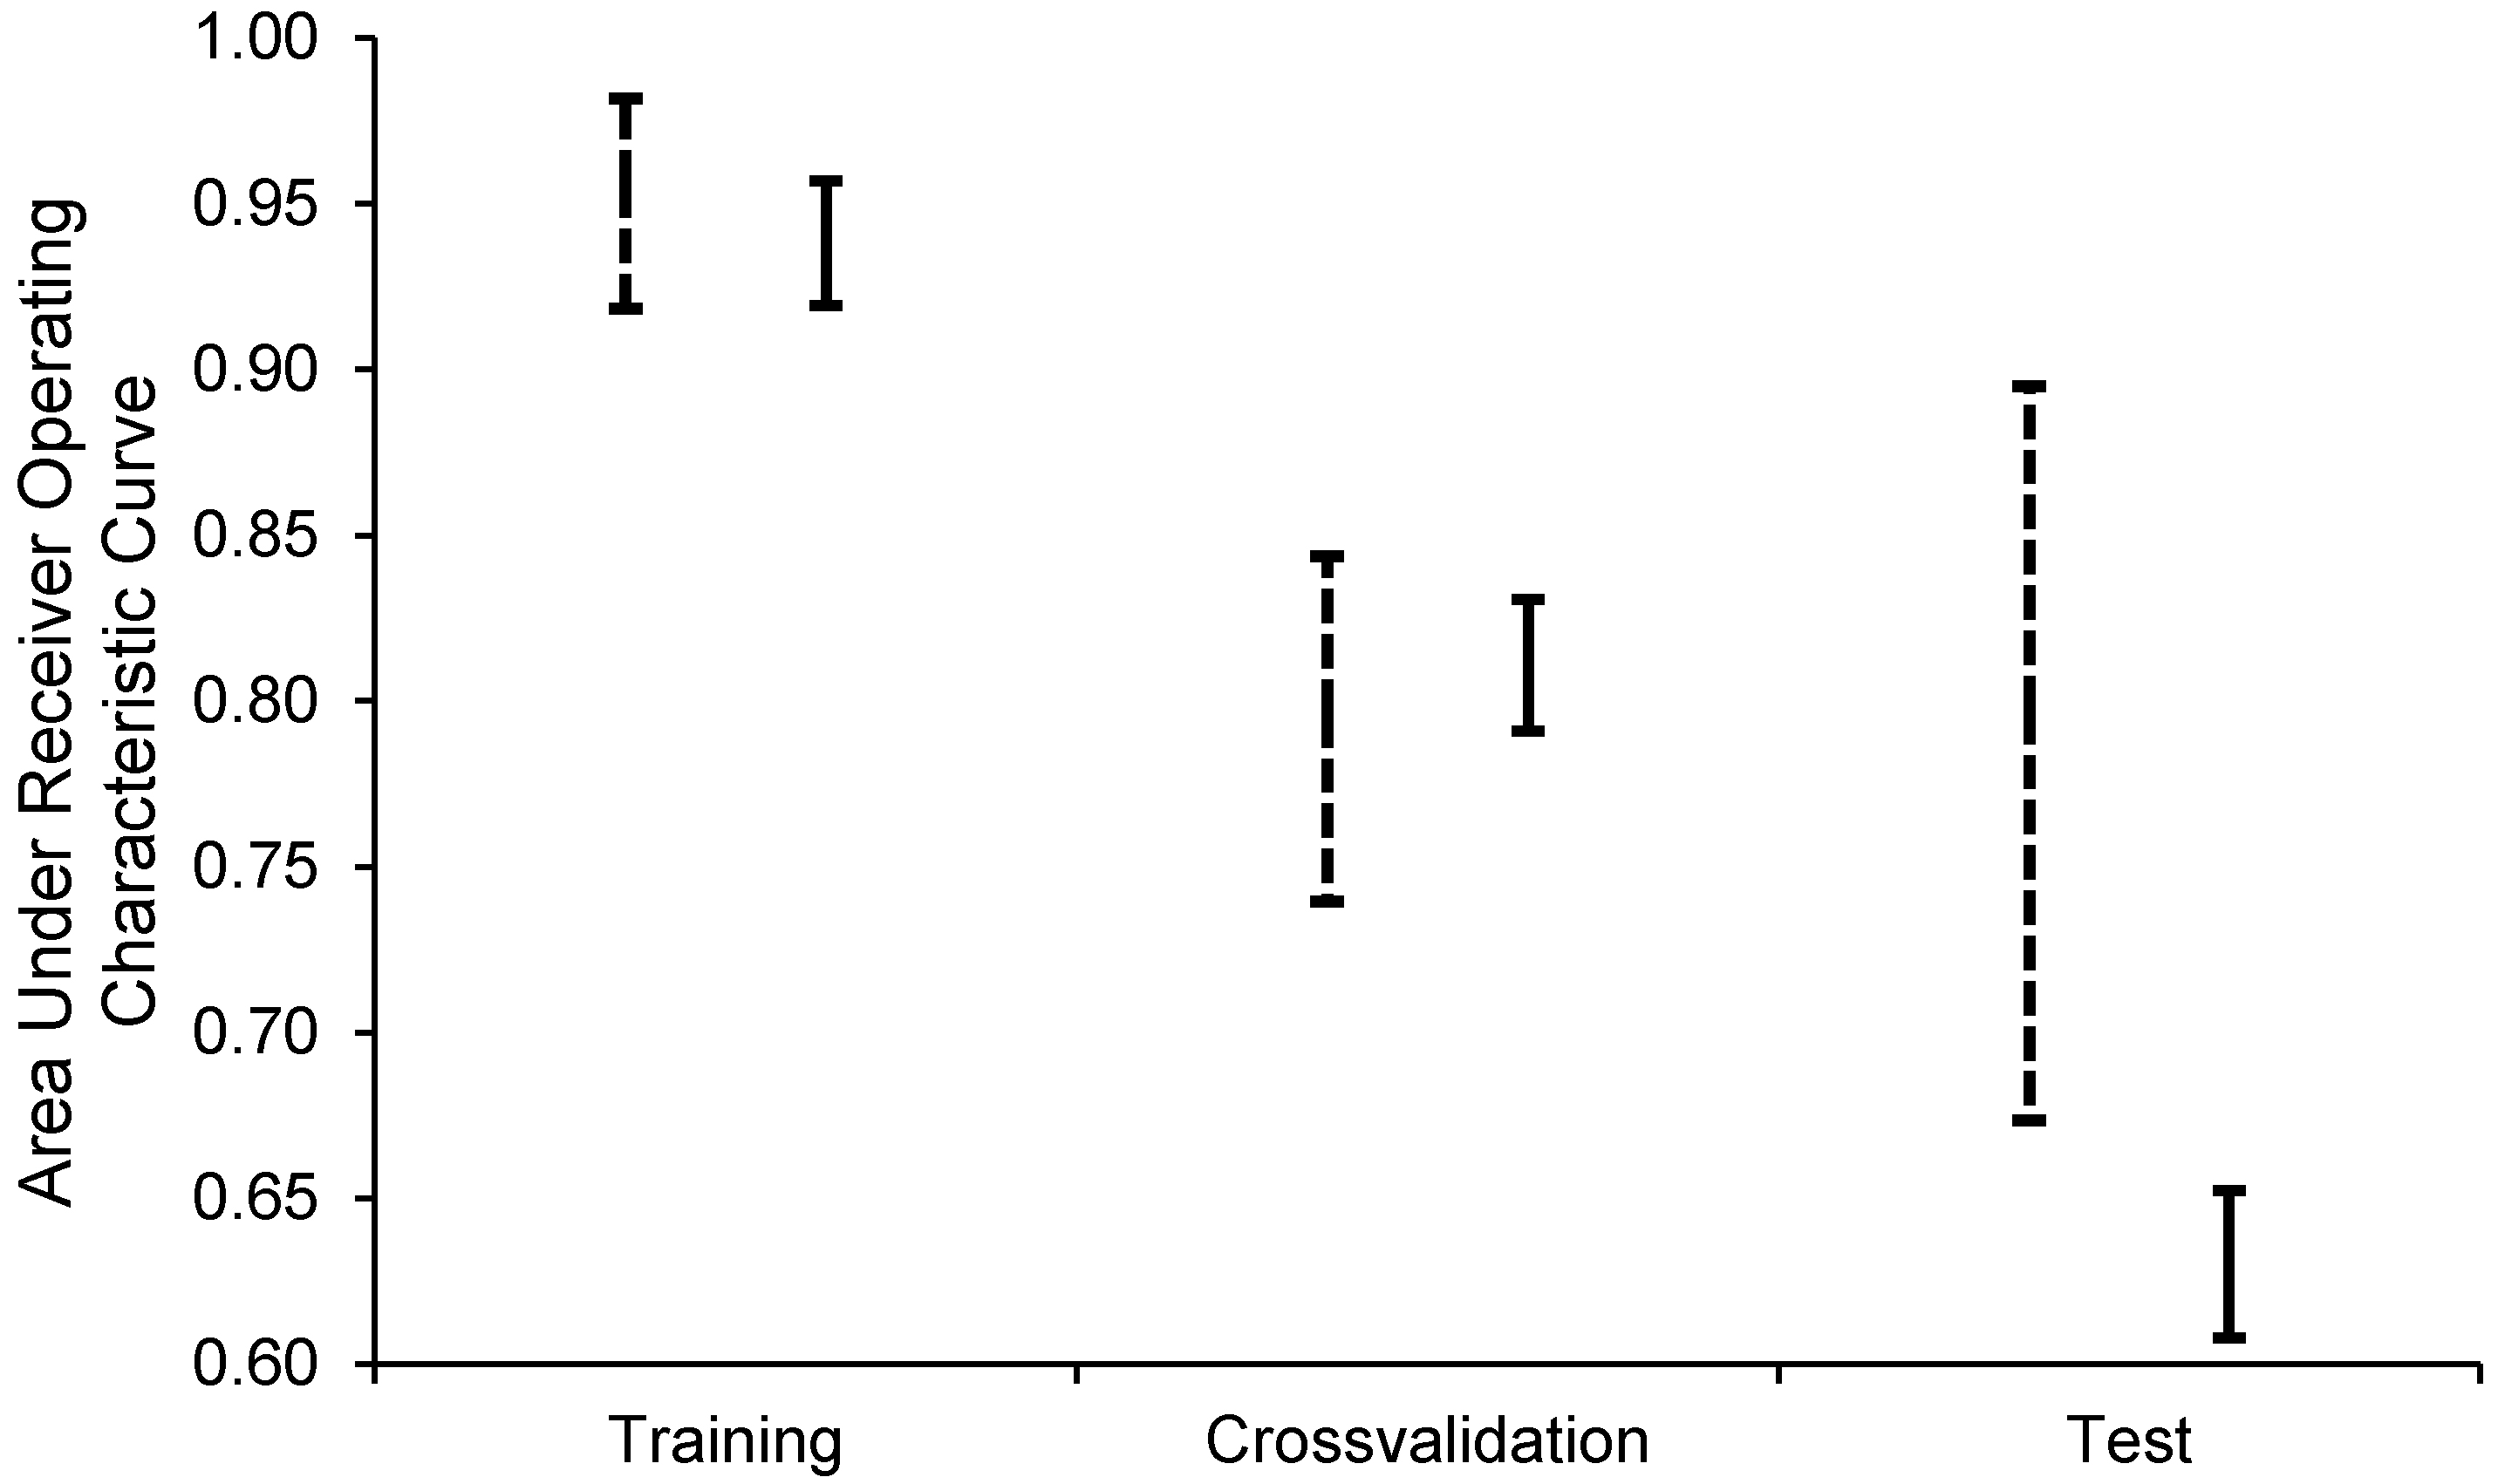
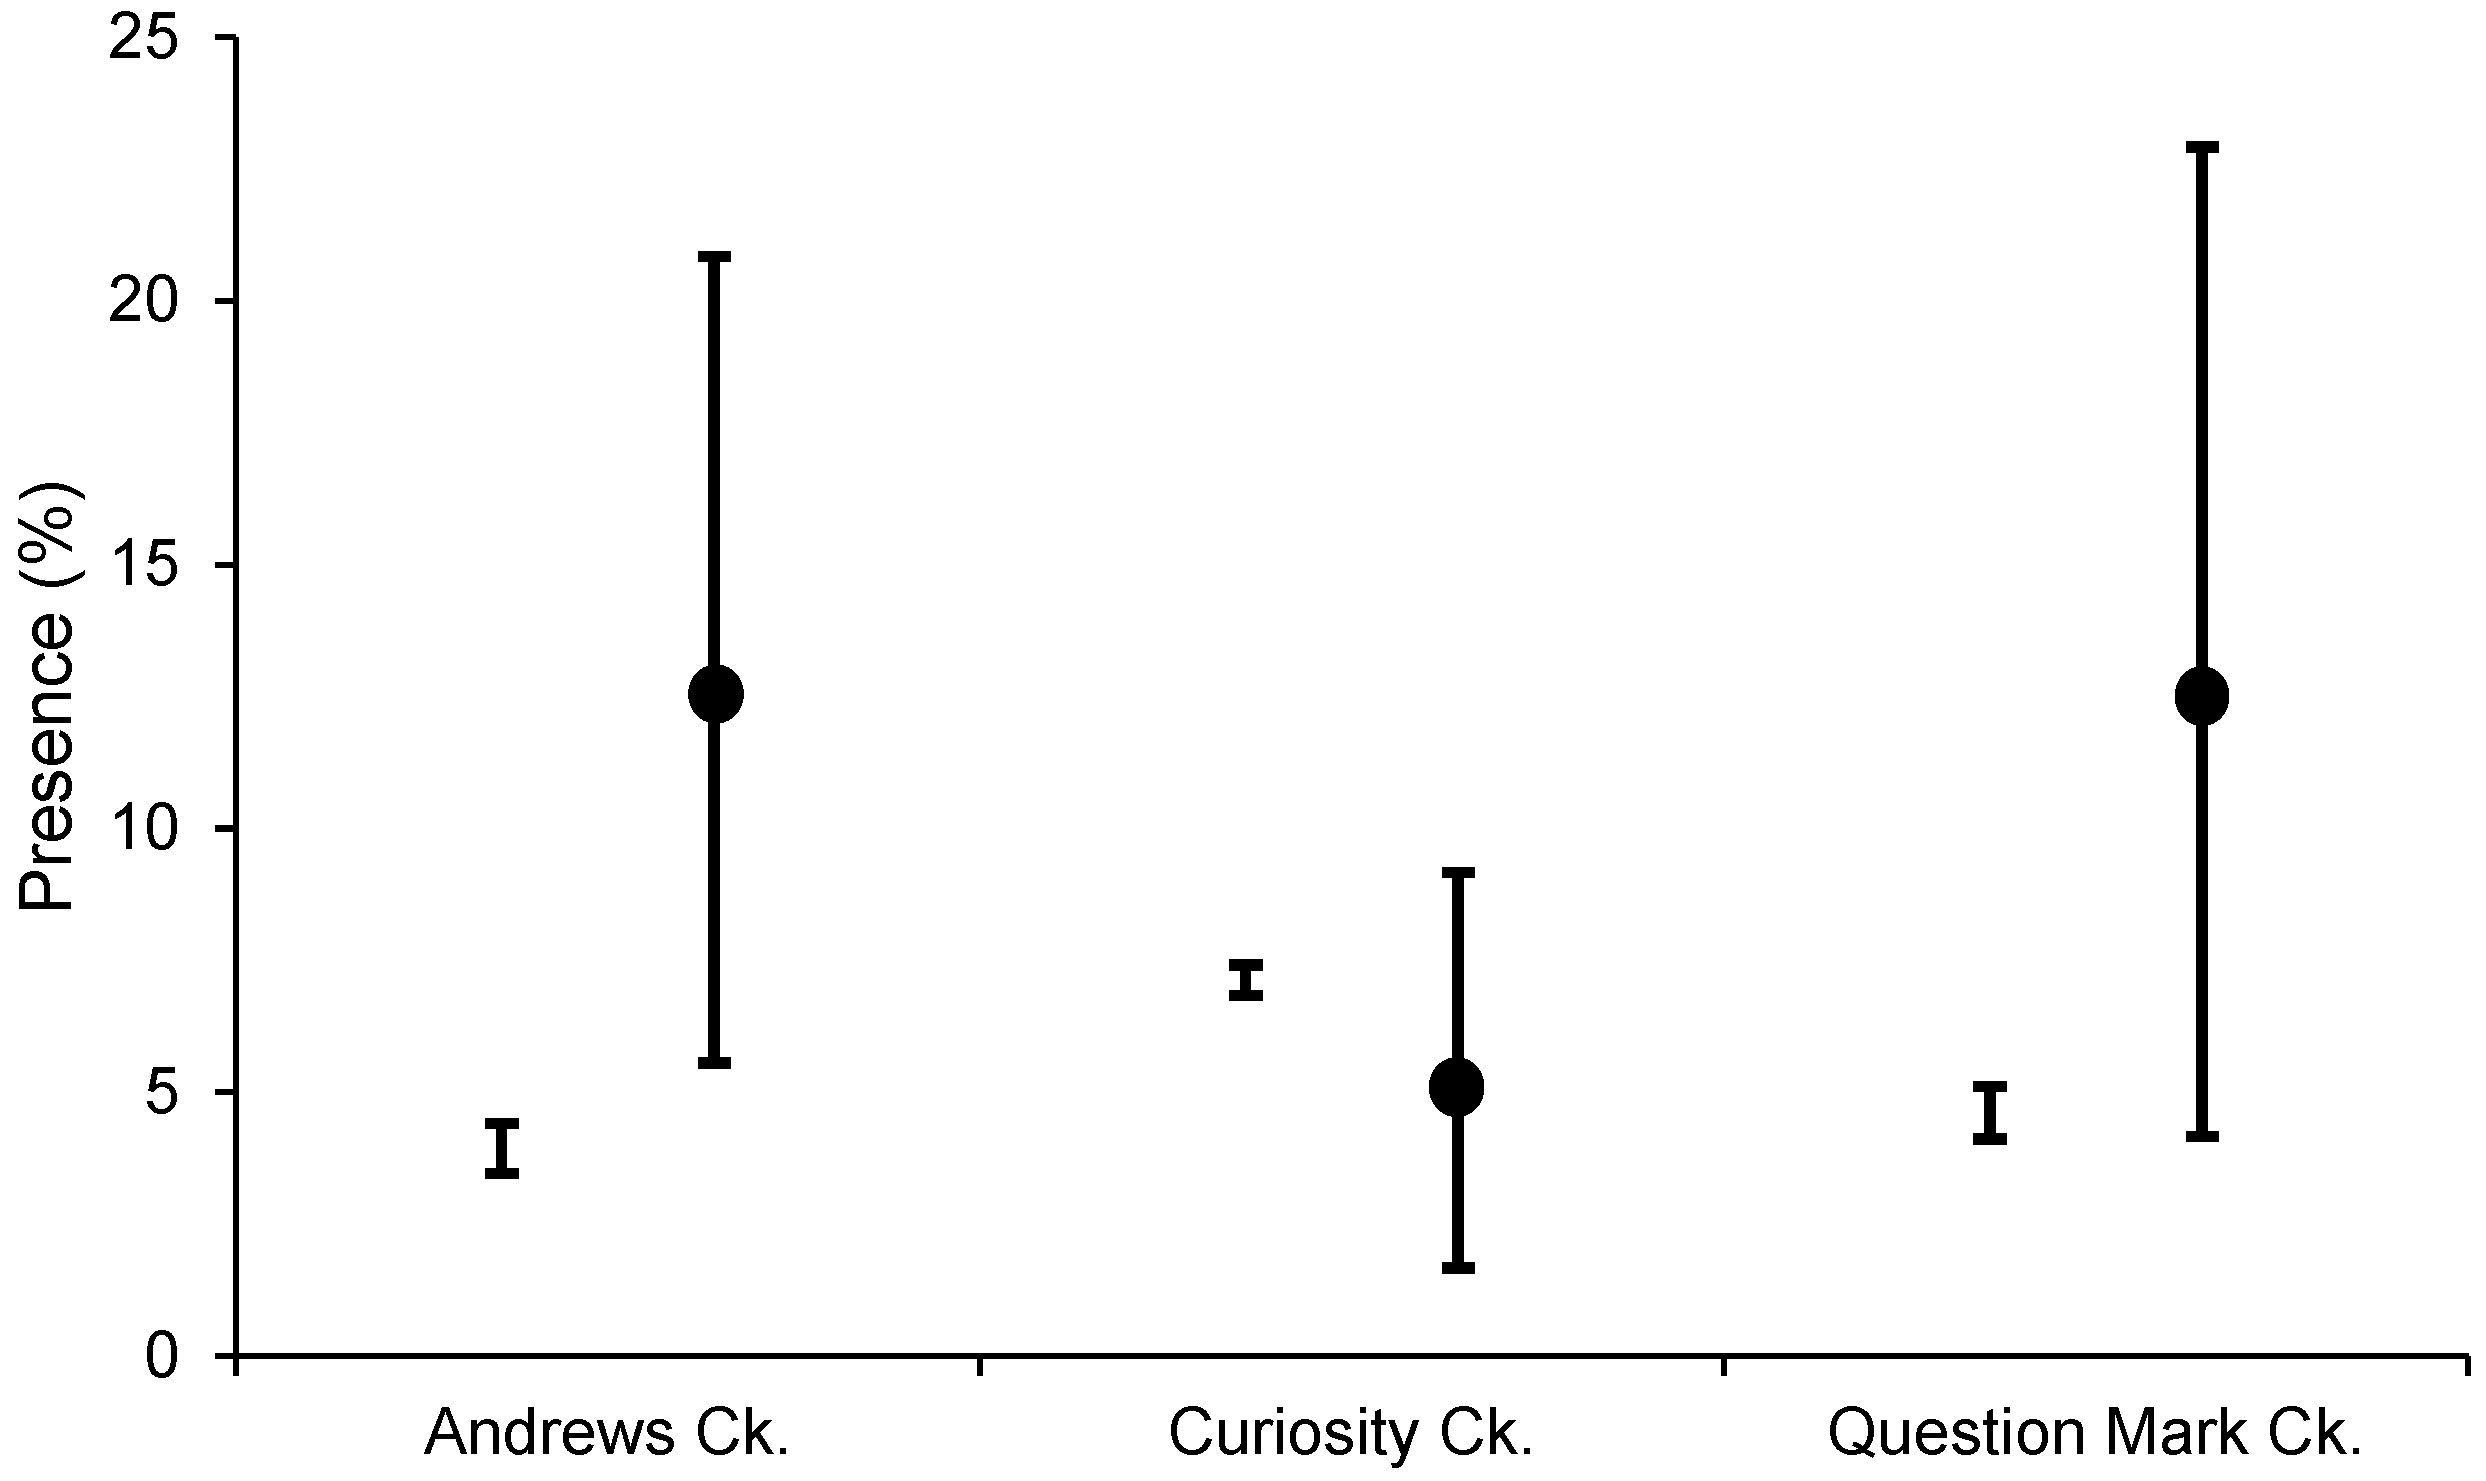
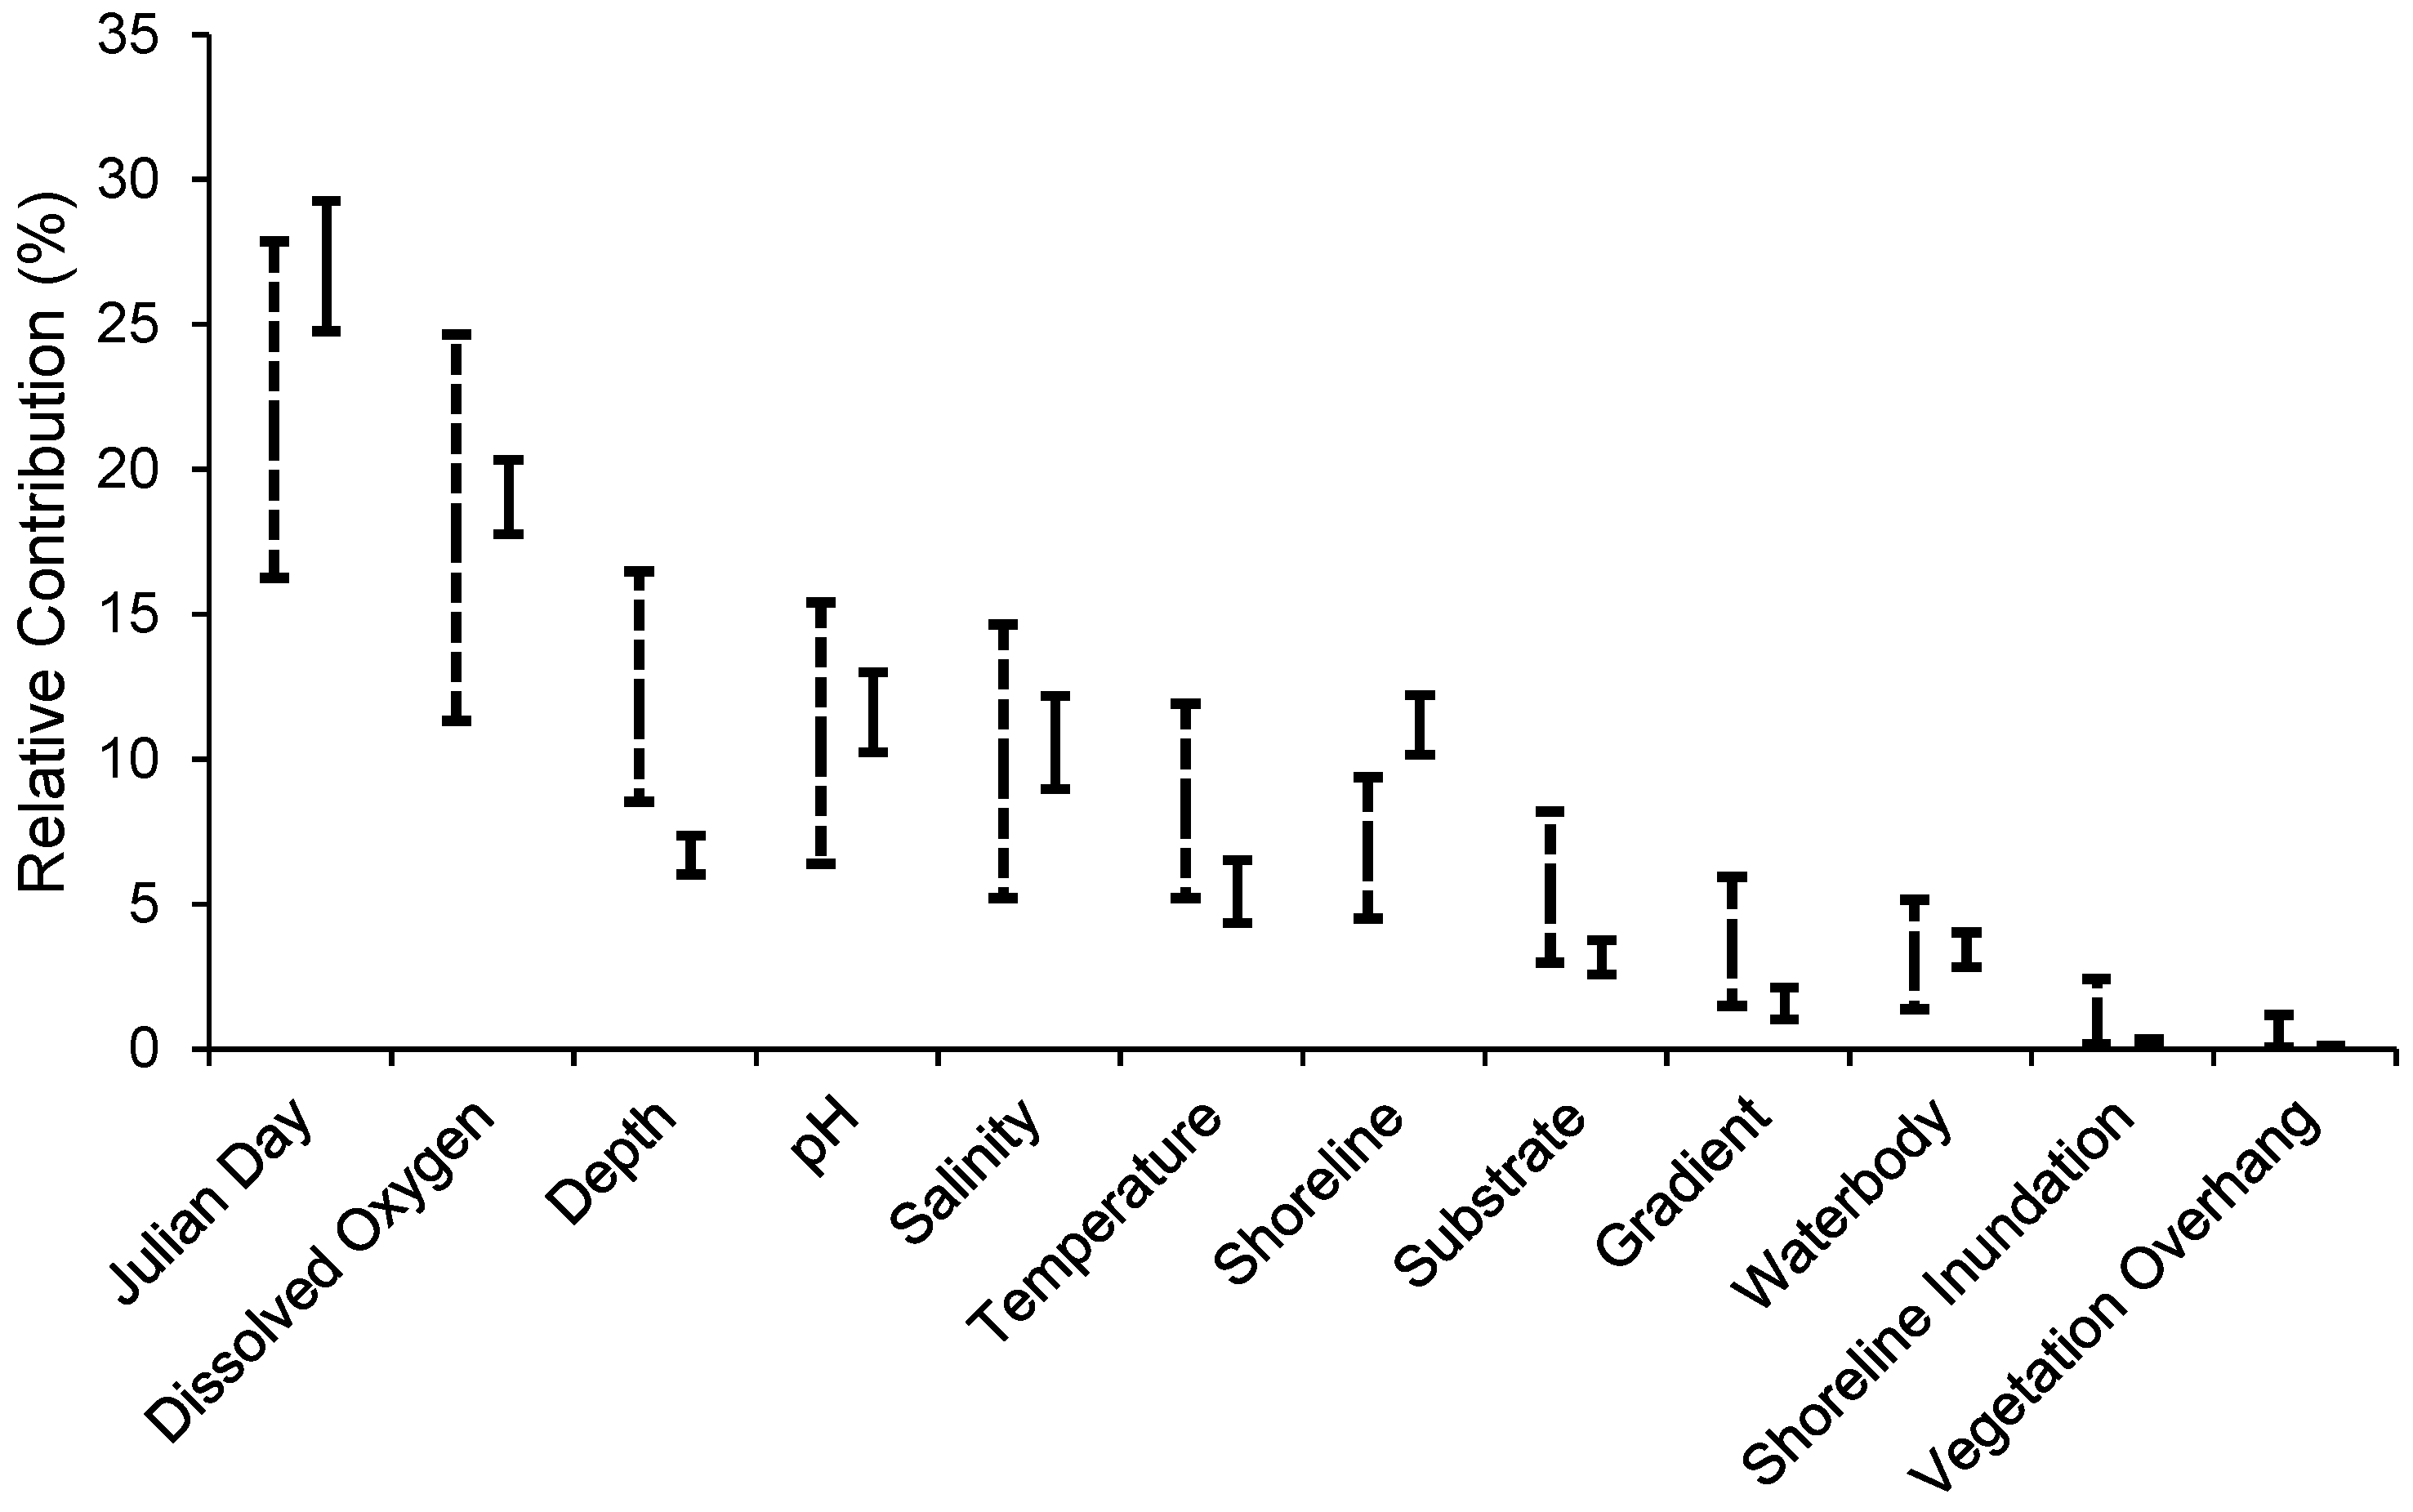
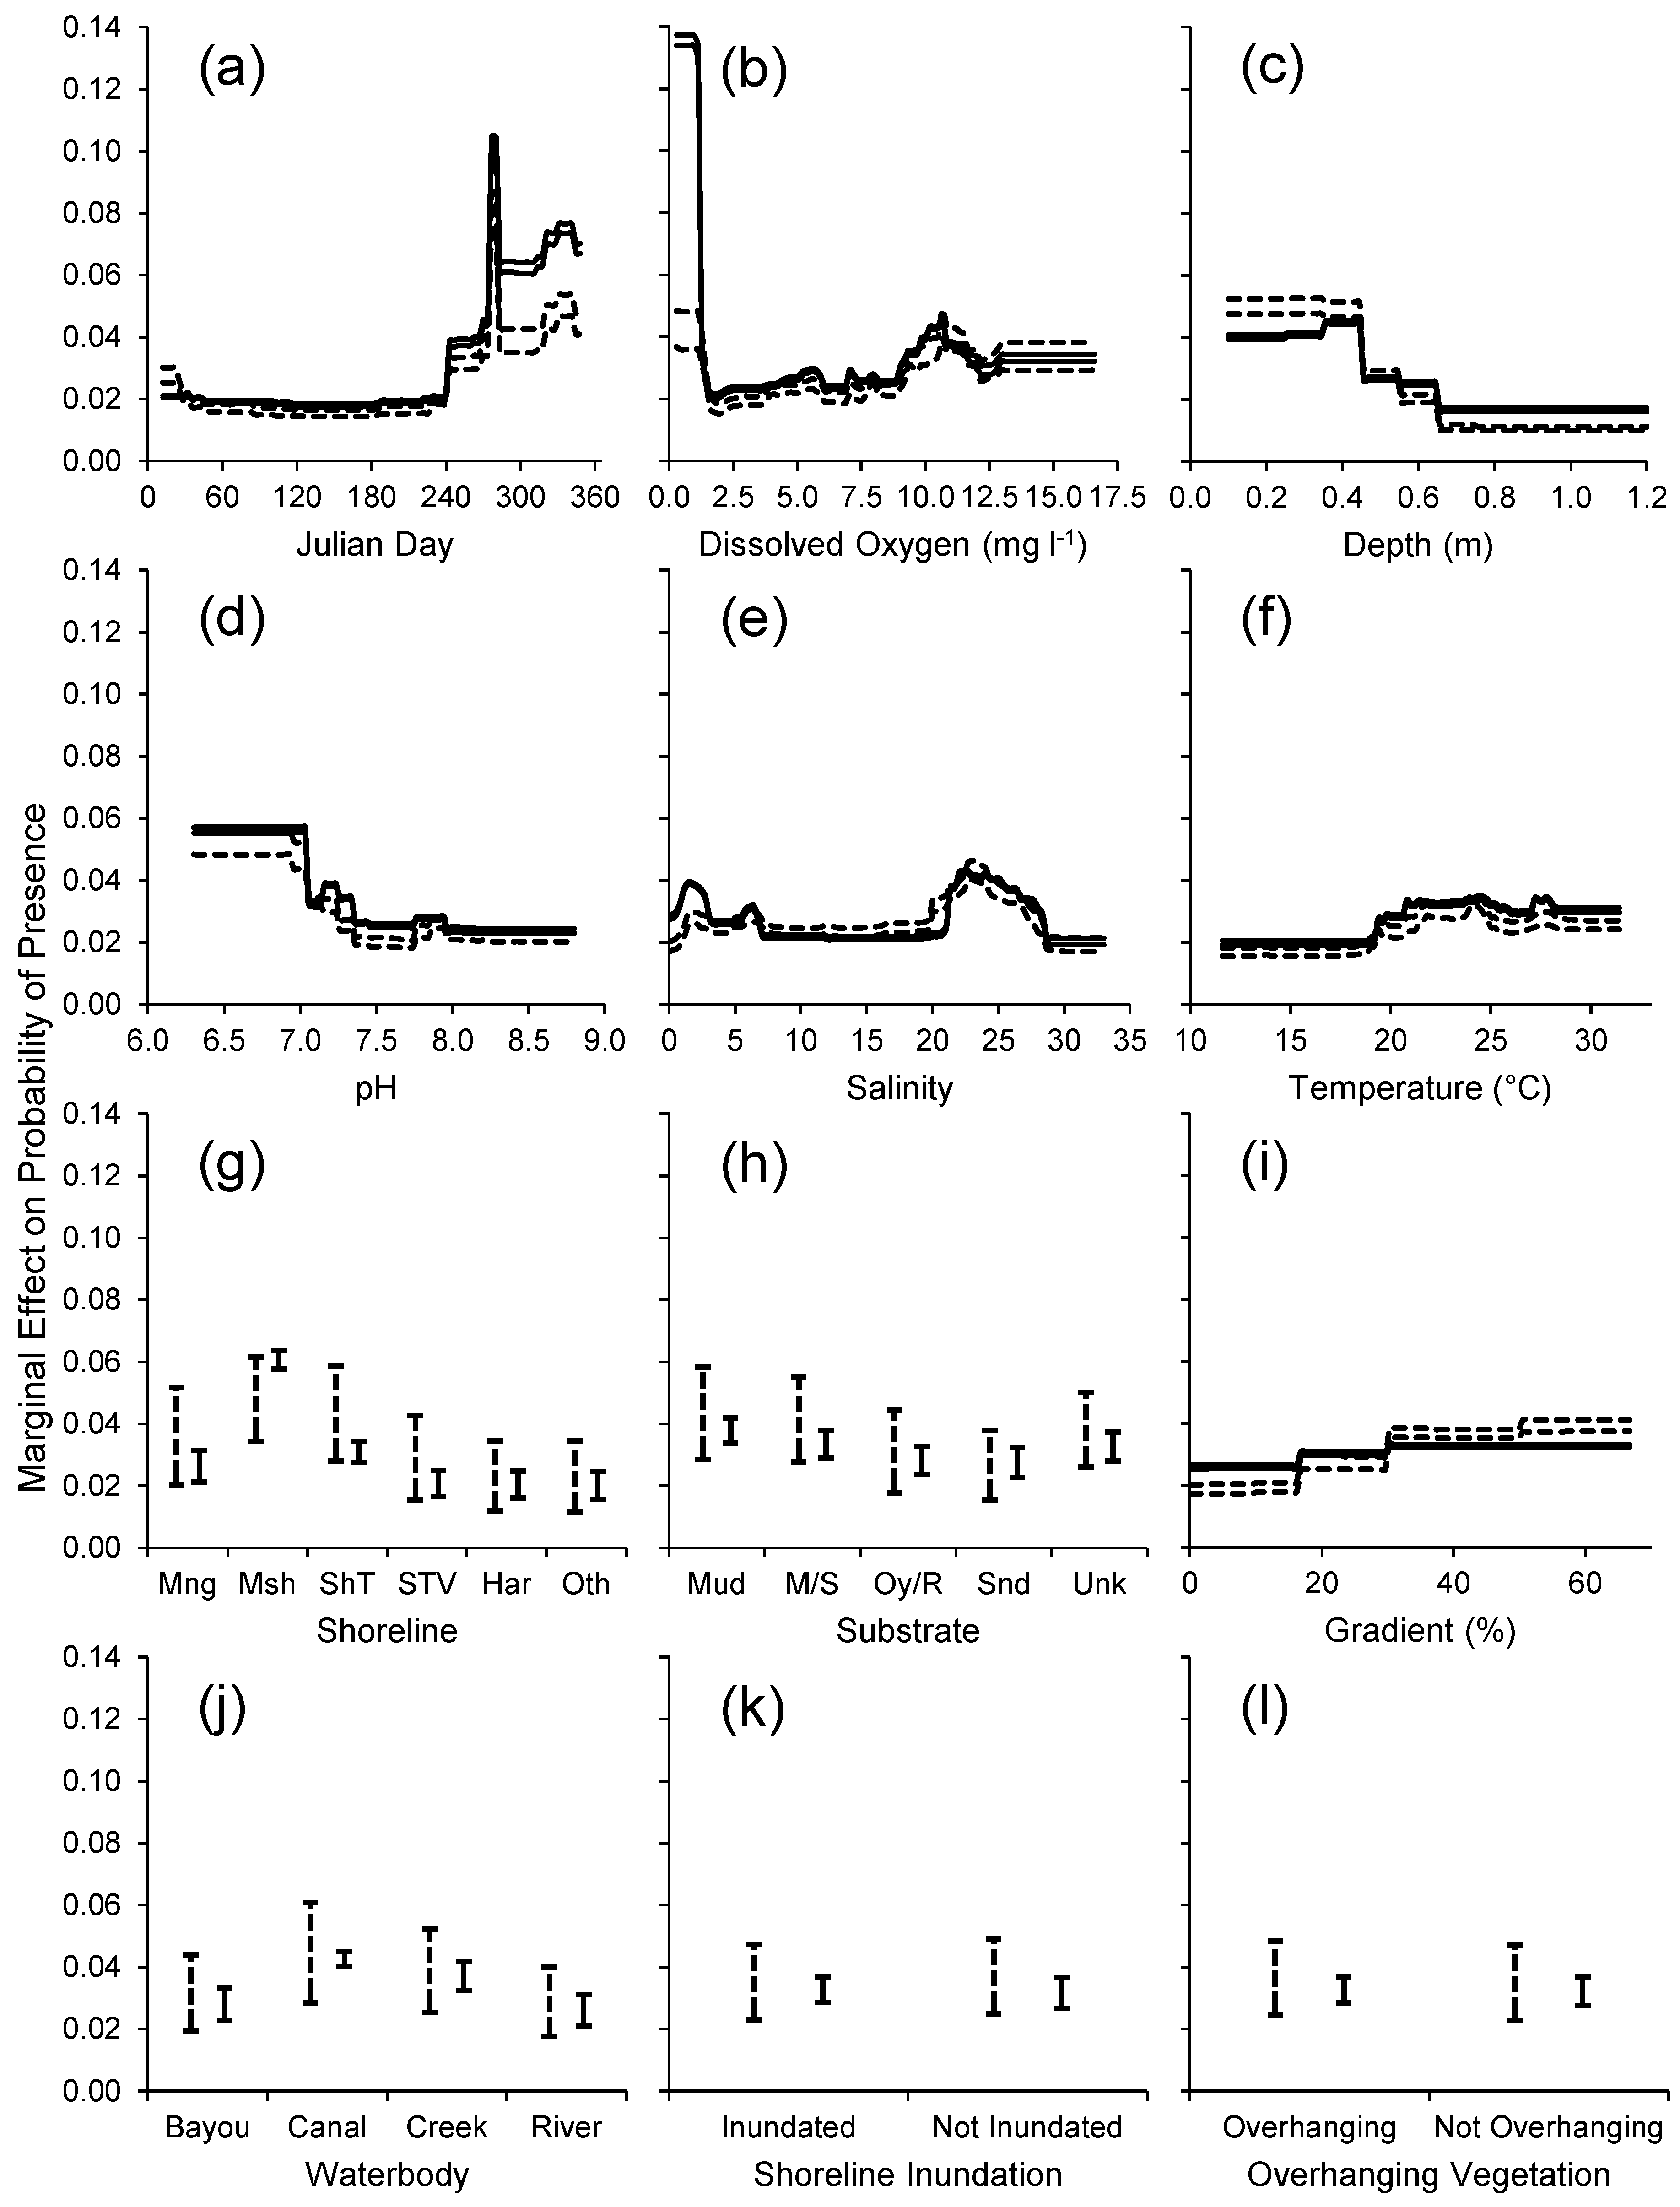
3.2. Habitat Predictability

B. belizanus was found in 7% of shoreline seine samples from the 11 estuarine waterbodies studied during 2006/2007, with the greatest frequency of presence (12%–14%) in two polyhaline mangrove-dominated creeks (Andrews Creek and Cockroach Creek), a mesohaline marsh-dominated creek (Wildcat Creek), and a mesohaline canal mostly lined with shrubs/trees (Question Mark Creek) (Table 3). The species occurred along all shoreline and bottom types sampled with seines, across a broad range of physiochemical variables: salinity 0.2–29.3, temperature 11.8–30.1 °C, dissolved oxygen 0.5–14.7 mg l−1, pH 6.9–8.4, depth 0.1–1.0 m, and gradient 0%–66.7%.
The predictive performance of the BRT models for B. belizanus presence was greatest for the training data, with slightly more variation in the area under the receiver operating characteristic curve (AUC) for the 1000 iterations of the randomly selected data subsets (95% interval: 0.92–0.98) than for the fixed subsets (0.92–0.96) (Figure 3). The 95% interval of AUC for the crossvalidation of the training data overlapped for the randomly selected and fixed subsets of data, again with more variation for the randomly selected subset. With respect to prediction of test data that were not included in development of the models, there was significantly lower AUC for the fixed subset model compared to the randomly selected model, with the latter having broad variation which overlapped the AUC of the crossvalidation models (Figure 3).
The BRT model for the fixed subset of the data provided a reasonable prediction of the presence of B. belizanus in one of the three test waterbodies: the 95% interval of the prediction for Curiosity Creek was 6.8%–7.4%, which was somewhat greater than the actual observed 5.0% presence, but well within the 95% interval for actual presence (Figure 4). In contrast, the BRT model underpredicted the presence in the two other waterbodies, and in the case of Andrews Creek, the 95% intervals for the predicted and actual presence did not overlap (Figure 4).
In general, the BRT models based on the randomly selected and fixed subsets of the data suggested a similar relative ranking of habitat predictor variable importance in predicting B. belizanus presence (Figure 5). The range of variability in importance across the 1000 iterations of the two BRT models was considerably greater for the model based on randomly selected subsets of the data. Julian day was the most important predictor, followed by dissolved oxygen. Depth was suggested to be as important as pH, salinity, temperature and shoreline type in the model based on randomly selected subsets of the data, whereas shoreline type in particular had greater importance in the model based on the fixed subset of data. Substrate, gradient, and waterbody had relatively little importance (generally 5% or less), and shoreline inundation and vegetation overhang had minimal importance (Figure 5).
The relationships between B. belizanus probability of presence and habitat predictors showed some similarities and some differences between the BRT models based on the randomly selected and fixed subsets of the data. Both the randomly selected and fixed subset BRT models suggested that the probability of presence increased from around Julian day 240 (i.e., September) until the end of the year, although the increase was less pronounced for the randomly selected model (Figure 6). A major difference between the randomly selected and fixed subset models was the representation of the effect of dissolved oxygen in hypoxic conditions (<2 mg L−1), for which the fixed subset model suggested a very high marginal effect on probability of presence (up to nearly 0.14) whereas the randomly selected subset model gave a marginal effect of around 0.04. This difference principally arose from high frequency of presence (0.6, i.e., 60% of samples) for B. belizanus during hypoxic conditions in Cockroach Creek in September 2007, with these observations being present in all iterations of the fixed subset model; the predicted effect of dissolved oxygen was more consistent between the randomly selected and fixed subset models over the rest of the variable’s range.
Other habitat predictors with relatively high contributions for which the predicted marginal effect on B. belizanus presence was reasonably consistent between randomly selected and fixed subset BRT models were depth and pH, for which the probability of presence decreased by two to three times over the range of each variable (Figure 6). The predicted marginal effect of salinity was not mononotic and predicted B. belizanus presence as a peak between salinity of about 20 and 30 for both randomly selected and fixed subset models, whereas somewhat higher probability of presence at low salinity (<7) was only suggested by the fixed subset model. The increased probability of presence with increasing temperature, particularly above ~19 °C, was consistent for fixed and randomly selected BRT models.
The fixed subset model suggested some significant differences between shoreline types (with marsh having greater probability of B. belizanus presence than other types), substrate (greater probability of presence over mud than oyster/rock or sand), and waterbody (greater probability of presence in canals and creeks than rivers, with bayou intermediate); however, the random subset model suggested a greater extent of overlap in the different levels of these predictors. A somewhat increasing probability of presence with increasing gradient was more pronounced in the random subset model than the fixed subset model (Figure 6).

4. Discussion

4.1. Distribution and Spread Rate

The present study demonstrated that B. belizanus is well distributed in some estuarine portions of the Tampa Bay watershed, principally in the Alafia and Little Manatee River basins (Figure 1). From the first recorded presence in the Alafia River drainage in 1994, the species was subsequently detected in the Little Manatee River drainage in 1998. The mouths of these two rivers are approximately a straight-line distance of 17 km apart. Given the indentations along the Tampa Bay shoreline between the two rivers (Figure 1), as well as numerous convoluted potential inshore pathways (e.g., mosquito ditches and county road drainage ditches), the first presence of B. belizanus in the Little Manatee River nearly five years after the first recorded presence in the Alafia River is consistent with the estimated rate of spread in the Little Manatee River (5.5–13 km year−1; Figure 2). Subsequent sampling in non-tidal freshwater ditches that are ultimately connected to estuarine tributaries has shown that B. belizanus has spread extensively inland in these drainages [56]. Collections of B. belizanus in south Florida following initial introduction indicates a spread rate of about 1.8 km in just over two months (from latitude 25.559516°, longitude −80.331945° in early December 1957 to approximately latitude 25.543571°, longitude −80.331424° on 18 February 1958; [14]). Extrapolation of this rate to a full year gives a value (9 km year−1) within the range estimated in the present study. Additional study of B. belizanus spread rates in south Florida based on the extensive available collection database [15] was beyond the scope of the present study but would be valuable.
Invasion success is often linked with a rapid rate of spread [58], and spread rate has been shown to correlate with factors such as the availability of vacant ecological niches [59]. The shallow-water piscivore niche of B. belizanus has other members [28], although the fact that the species is immediately piscivorous after birth [20] and is resident year-round in such systems generally differentiates it from other piscivores. The niche (described as “piscivorous in open water habitat in the middle and high water column, principally using pectoral fins for motility”) is recognized as being quite distinct from other fishes in the native range [60]. The spread rate of B. belizanus estimated in the present study is intermediate to those of other invasive poeciliids. Invasive mosquitofishes (Gambusia affinis and G. holbrooki) spread much more quickly than B. belizanus, with rates ranging from ~38 km year−1 in the Colorado River watershed [59] to several hundred meters per day in small-scale studies [61,62]. These rapid rates have been attributed to relatively high boldness of invasive mosquitofishes that contributes to their classification as some of the world’s worst invasive species [58]. In contrast, B. belizanus rate of spread is greater than the 1.6-km year−1 spread of Trinidadian Guppy Poecilia reticulata [59], another invasive poeciliid known for negative ecological effects [63], and similar to the 7.9 km year−1 spread of Sailfin Molly P. latipinna [59]. Among non-poeciliids, the B. belizanus spread rate is comparable to that of Round Goby Neogobius melanostomus, for which estimates range from 0.5 to 17 km year−1 in the Great Lakes and Danube River [64,65,66]. Some larger invasive fishes of particular concern exhibit very rapid spread rates, e.g., Nile Perch Lates niloticus (150 km 6 month−1 to 50 km week−1; [67], Bighead Carp (1.7–2.4 km day−1; [68]), and Northern Snakehead Channa argus (18 km month−1; [69]). Mayan Cichlid Cichlasoma urophthalmus spread from south to east-central Florida was estimated to be 15 km year−1 [70]; this species has been shown to negatively affect native fishes [71], with a range that includes Tampa Bay and is expanding [56,72]. Depletion of prey in a given area by B. belizanus may increase the likelihood of range expansion [19], as may agonistic intraspecific interactions such as territoriality [73] and avoidance of cannibalism [14].
The disjunct distribution of the western population of B. belizanus in Tampa Bay relative to the eastern population is not likely to have resulted from swimming because over 15 km of deeper, open water separates the two populations and the species has not been collected in offshore habitat or in the many km of shoreline around the bay between the two populations (Figure 1). Data are lacking to determine when the species first occurred in western Tampa Bay, but potential mechanisms facilitating occurrence include aquarium release [74], bait bucket release [65,75], or bird carry-off [11,76]. A single inseminated female B. belizanus released into a water body may be sufficient to establish a population because of large potential brood sizes (>300; [20]) and no evidence for deleterious phenotypic effects in poeciliid populations founded by a single individual [63].
Given the ability of B. belizanus to spread at up to 13 km year−1, why then after over 20 years in Tampa Bay does the main, eastern population appear to be confined to a region that is a crow’s-fly distance of ~30 km from north to south? Movement rates of fishes can be influenced by a number of factors, including the presence of suitable habitat [77]. The B. belizanus range on the eastern fringe of Tampa Bay is bounded by large port facilities to the north and south (Figure 1) which are characterized by dredged ship channels and several km of extensive seawalls creating deep-water habitat at the shoreline. As shown in the habitat predictability analysis, the probability of presence of B. belizanus decreased with increasing depth. On the basis of the present study’s results, it is hypothesized that the deep port seawall habitats with little cover could function as “soft” ecological barriers (sensu Bond and Lake [78]) to B. belizanus because of avoidance of such areas as a result of habitat preference [77] or because predation is high in the deeper water and no individuals survive [79]. Between the two ports, the shoreline possesses a considerable amount of shallow-depth habitat including natural shorelines, mosquito ditches, and inland county drainage ditches, which probably facilitated spread of B. belizanus. The small western population may also be constrained by deep-water, seawalled habitats in the harbor adjacent to the creeks where the species was found in the present study. Spread of B. belizanus through the Everglades and south Florida was essentially unhindered by such potential soft barriers, at least to the south and west, and likely occurred through the extensive system of agricultural canals that include shallow nearshore areas. Thus, the species has reached the southwest coast to the first major urban area (near the city of Naples) but has not spread farther north (Figure 1) to other estuaries [80,81]. The BRT habitat predictability analysis indicated that B. belizanus does occur along hardened shorelines (such as seawalls) in shallower water, albeit at somewhat lower probability of occurrence than other shoreline types (Figure 6), emphasizing the hypothesis that the deep-water aspect of seawalls in ports and harbors may be more important than the shoreline type.

4.2. Habitat Predictability

The present study displayed a common feature of species distribution modeling: the performance of the BRT models fitted to training data was higher than the cross-validation BRT models, which in turn was higher than the test data prediction model performance [7,46]. Such patterns arise because prediction to test data is more difficult than simple interpolations to the sampled (training) regions, as a result of spatial habitat heterogeneity and varying ecological relationships [7]. The BRT model of B. belizanus probability of presence based on the fixed subset of data had some value in its transferability, per the >0.6 AUC criterion of Huang and Frimpong [7], but the comparison to the BRT model based on the randomly selected subset of training data demonstrated that some of the apparent habitat relationships were idiosyncratic as opposed to general [8]. The present study’s emphasis on using prediction as a means of demonstrating ecological understanding [9] drove the need to consider model transferability not just in terms of cross-validation and prediction to test data, but also the consistency of observed species–habitat relationships through the comparison of the fixed and randomly selected subsets of data. Conducting 1000 iterations of the fixed and randomly selected BRT models allowed generation of 95% intervals, a novel approach that facilitated examination of the consistency of the observed relationships in order to evaluate which relationships appeared ecologically reasonable and therefore the predictability of habitat use. This approach is readily applicable to studies of other species where it is desirable to provide additional validation of observed species–habitat relationships.
Challenges in predictability of B. belizanus presence (Figure 4) may have reflected interannual differences in recruitment [37]—most waterbodies were sampled in 2006, but two were sampled in 2007—as well as differences between waterbodies in the equilibrium status of B. belizanus spread [82]. In addition, B. belizanus is comparatively rare, even in the waterbodies with the highest percentage presence (Table 3). Rarity can hinder prediction of species–habitat relationships as a result of overfitting few presences with many covariates, suggesting that exploration of techniques such as ensemble-based modeling would be worthwhile in the future [83]. Occupancy modeling based on repeated sampling at each site to account for imperfect detection may also provide additional insight [84]. Initial colonization of new waterbodies can result in high abundance of B. belizanus, with numbers declining thereafter [85]. Relatively low abundance generally appears to be typical of the species, even in the native range, and may reflect a conserved life history trait [37] which could be a function of some of the same factors influencing spread, e.g., territoriality [73], cannibalism [14], and resource depletion [19].
Dissolved oxygen was the second most important (after Julian day) of the habitat variables predicting B. belizanus presence in the studied estuarine waterbodies of Tampa Bay, although there was a considerable difference in the relationship between the BRT models based on the fixed and random subsets of data (Figure 6). The fixed data model showed occurrence was high at hypoxic conditions, reflecting a short-term event in Cockroach Creek during September 2007. Similar to other cyprinodontoids, B. belizanus may employ aquatic surface respiration in hypoxic conditions [86,87], possibly allowing the species to occupy such areas in relatively high numbers and prey successfully on species less adapted to low dissolved oxygen [88]. Alternatively, aquatic surface respiration may have allowed B. belizanus to remain within low dissolved oxygen habitat, albeit with greater susceptibility to capture during sampling, akin to greater susceptibility to predation observed in other fishes exhibiting aquatic surface respiration [88]. Although B. belizanus appears sufficiently physiologically flexible to cope with low dissolved oxygen, as observed in other invasive fishes in Florida [89], the relationships suggested in the present study were somewhat idiosyncratic rather than general and useful for prediction.
The greater probability of presence of B. belizanus with declining pH was consistent between fixed and random subset BRT models (Figure 6), and there are both similarities and differences with the patterns observed in previous studies. In freshwater habitat of south Florida’s Everglades National Park, Kerfoot et al. [37] found a positive relationship between pH (range: ~7.4–8.0) and B. belizanus density at one site, a weak positive relationship at another site (pH range: ~7.2–7.4), and negative relationships at two other sites (pH ranges: ~7.3–7.6 and ~7.6–8.1). Multispecies ordination analyses within the native range do not demonstrate strong or consistent relationships between pH and B. belizanus populations [33,34,35,36]. As noted by Kerfoot et al. [37], changes in pH are known to directly affect ion uptake across gills and internal acid–base balance in fishes, ultimately affecting survival rates. For example, low concentration of calcium ions was found to negatively affect the predation functional response of invasive N. melanogobius [90]. Given potential future changes in pH as a result of climate change [91], future laboratory studies on B. belizanus could assess whether physiology and behavior (e.g., predation) are significantly affected by pH in a manner consistent with the lower probability of presence at higher pH observed in the present study.
The Environmental Matching Hypothesis predicts that the impacts of an invader decline as habitat conditions move further from its physiological optimum [90]. The present study found that B. belizanus is widely distributed across the salinity gradient, with evidence for greatest presence in polyhaline conditions (Figure 6). The observed effects of B. belizanus on small prey fish abundance in Tampa Bay estuarine waterbodies were consistent over a broad salinity gradient [24]. The present study contrasts with that of Kerfoot et al. [37], who found decreasing B. belizanus density with increasing salinity in south Florida red mangrove habitats; a negative relationship with salinity has also been found in the native range [33]. Water temperature in the coldest month is 2–3 °C cooler in the Tampa Bay watershed than south Florida [92], so that occupation of higher salinity by B. belizanus could ameliorate low-temperature effects. Such an effect was found for Tilapia mossambica (now Oreochromis mossambicus, a euryhaline freshwater species), which is restricted to estuaries near the southern limit of its range in Africa, possibly in order to maintain near-normal sodium and chloride ion concentrations during low winter temperatures [93]. A similar mechanism was not found for C. urophthalmus, however [94]. Nekton abundance often increases with increasing salinity because of the increasing contribution of marine-derived juveniles [43,95] and this may provide a greater potential pool of prey resources for B. belizanus at higher salinity. The estuarine focus of the sampling in the present study precludes any firm conclusions about the distribution or abundance of B. belizanus in the permanent, non-tidal freshwater reaches upstream of the study area; expansion of sampling in this habitat using similar seining methods would clarify the significance of the present study’s findings with respect to salinity.
Lower lethal temperature (~9.5 °C) for B. belizanus is surprisingly low and rarely experienced in Tampa Bay [96]; feeding is, however, reduced (or ceases) at ~11–16 °C [92,97], which are more commonly observed winter temperatures in the area. During an 80-year cold front in south Florida, water temperature in some areas dropped below the laboratory-determined B. belizanus mean lethal temperature, yet the species persisted [98]. It would be informative to repeat Shafland and Pestrak’s [92] and Kerfoot’s [97] experiments, which were undertaken in freshwater aquaria, at a variety of salinity levels to assess potential ameliorating effects on low temperature effects. The present study found a consistent drop-off in B. belizanus probability of presence below about 19.5 °C (Figure 6), whereas Kerfoot et al. [37] found that density of B. belizanus in south Florida red mangroves increased as temperature decreased, although the lowest temperature in their dataset was 23 °C. Long-term temperature increases may favor the species’ increased expansion [38], as noted for C. uropthalmus [71], producing effects on native species that may not yet have been manifested [99].

4.3. Management Implications

The range of shoreline habitats and physicochemical conditions at which B. belizanus was present in this study suggests that within certain parameters (i.e., nearshore, shallow-water habitat), the species has generally broad environmental tolerance, a key trait of successful invasive fishes [6]. The consistent importance of Julian day in predicting probability of presence suggests that future studies aiming to assess the occurrence of B. belizanus in Tampa Bay estuarine waterbodies should be focused on the period from September to December/January in order to maximize the likelihood of capture (Figure 6). The present study suggests that B. belizanus in estuarine areas of Tampa Bay spread at a modest rate compared to the most notable invasive fishes and that its distribution may be constrained by soft ecological barriers, i.e., deep seawall habitat. The recent classification as moderately invasive [23] appears appropriate. Nevertheless, strong evidence for negative effects on small-bodied fishes [24] and potential competition with C. undecimalis [15] indicates that consideration of possible management actions is warranted. Under current climate conditions, B. belizanus would be predicted to be able to occur 150–200 km farther north than Tampa Bay based on lower lethal temperature [92,97]. However, the present study’s hypothesis that spread of B. belizanus is restricted by deep, anthropogenically altered habitats leads to the conclusion that movement north may be very much dependent on human-facilitated pathways, recently referred to as “jump dispersal” [100], for which the main vectors are releases from aquaria and bait buckets [75]. Internet-based sales of ornamental fish allow species to be spread easily within the U.S., suggesting that education of hobbyists and retailers is paramount [74] and particularly important in the case of B. belizanus, given that aggression by piscivores is one reason for release of fish from aquaria [101].
Regarding bait bucket releases, B. belizanus is not raised commercially as bait, but releases could occur as surplus fish from anglers cast-netting [102] and catching the species along with other small-bodied fishes. This is particularly true within the eastern portion of the B. belizanus Tampa Bay range, which is notably good habitat for sub-adults and adults of the primary inshore sportfish C. undecimalis [103]. One possible means of limiting spread by this vector would be to produce simple educational materials for anglers (e.g., posters at boat ramps) illustrating the current range of B. belizanus, emphasizing the need to not release it beyond this range, and giving warnings about its potential effects through competition with prized sportfishes that anglers may be targeting. Such materials could be combined with similar warnings for other spreading invasive fishes, such as C. uropthalmus [56]. Emphasis on not releasing B. belizanus from aquaria or bait buckets is also relevant for freshwater habitat because of the similarity in prey capture and potential competition with juveniles of another prized sportfish, Largemouth Bass Micropterus salmoides [104].
Restoration is being undertaken in the Tampa Bay watershed with the goal of approximately restoring the balance of estuarine habitat observed ca. 1950 [41]. Projections of habitat change as a result of sea level rise suggest that mangrove habitat will increase its percentage of coastal habitat coverage from ~74% to 85–89% by 2100, with a concomitant decrease in salt marsh from 25% to 10–14% [41]. The habitat predictability analysis demonstrated that B. belizanus is sufficiently flexible in terms of shoreline habitat occupation (Figure 6) that such changes would not be expected to result in considerable effects to the species. With a spread rate of several km year−1, it would be expected that B. belizanus would colonize restored areas relatively quickly, particularly because some of the major restored sites are directly upstream of two of the waterbodies in the present study, Andrews Creek and Cockroach Creek [105]. This could disrupt typical successional fish assemblage dynamics that are observed in restored areas [106,107,108], as evidenced by effects on small-bodied resident fishes elsewhere in Tampa Bay [24] and potential competition for prey with transients using restored areas as a nursery, in particular C. undecimalis [15].

Supplementary Materials

The following are available online at www.mdpi.com/2410-3888/2/2/6/s1. Table S1. Presence-absence data from Figure 1; Table S2. Upstream spread data from Figure 2; Table S3. BTR data; Table S4. Metadata.

Acknowledgments

Thanks to personnel from the FWC-FWRI Fisheries-Independent Monitoring Program for collection and processing of fish samples. J. Buhrman and P. Shafland (FWC-FWRI), J. Krebs (University of South Florida), and C. Barker (University of California at Davis) procured several references. J. Sullivan and R. Dickerson (Hillsborough County Parks, Recreation and Conservation Department), and W. Anastasiou (Tampa Electric Company) facilitated access to several sampling sites. Data used in this study were derived from projects supported in part by funding from State of Florida Saltwater Fishing License sales; by the Department of the Interior, US Fish and Wildlife Service, Federal Aid for Sport Fish Restoration Grant Number F-43; by the Pinellas County Environmental Fund, Tidal Tributary Habitat Initiative Grant 2005-0003-003; by State Wildlife Grant SWG05-015; and by grants CM-254 and CM-280 from the Florida Office of Coastal Management, Department of Environmental Regulation, with funds provided by the US Office of Ocean and Coastal Resource Management, National Oceanic and Atmospheric Administration, under the Coastal Zone Management Act of 1972, as amended.

Conflicts of Interest

The author declares no conflict of interest. The funding sponsors had no role in the design of the study; in the collection, analyses, or interpretation of data; in the writing of the manuscript, and in the decision to publish the results.

References

  1. Wilcove, D.S.; Rothstein, D.; Dubow, J.; Phillips, A.; Losos, E. Quantifying Threats to Imperiled Species in the United States. Bioscience 1998, 48, 607–615. [Google Scholar] [CrossRef]
  2. Obama, B. Executive Order—Safeguarding the Nation from the Impacts of Invasive Species; The White House, Office of the Press Secretary: Washington, DC, USA, 2016. Available online: https://www.whitehouse.gov/the-press-office/2016/12/05/executive-order-safeguarding-nation-impacts-invasive-species (accessed on 11 January 2017).
  3. Matlock, G.C. Temporal Trends in Non-Native Fishes Established in the Continental United States. Manag. Biol. Invasion 2014, 5, 349–355. [Google Scholar] [CrossRef]
  4. Mills, M.D.; Rader, R.B.; Belk, M.C. Complex Interactions between Native and Invasive Fish: The Simultaneous Effects of Multiple Negative Interactions. Oecologia 2004, 141, 713–721. [Google Scholar] [CrossRef] [PubMed]
  5. Pimentel, D.; Zuniga, R.; Morrison, D. Update on the Environmental and Economic Costs Associated with Alien-Invasive Species in the United States. Ecol. Econ. 2005, 52, 273–288. [Google Scholar] [CrossRef]
  6. Moyle, P.B.; Marchetti, M.P. Predicting Invasion Success: Freshwater Fishes in California as a Model. Bioscience 2006, 56, 515–524. [Google Scholar] [CrossRef]
  7. Huang, J.; Frimpong, E.A. Limited Transferability of Stream-Fish Distribution Models among River Catchments: Reasons and Implications. Freshw. Biol. 2016, 61, 729–744. [Google Scholar] [CrossRef]
  8. Wenger, S.J.; Olden, J.D. Assessing Transferability of Ecological Models: An Underappreciated Aspect of Statistical Validation. Methods Ecol. Evol. 2012, 3, 260–267. [Google Scholar] [CrossRef]
  9. Houlahan, J.E.; McKinney, S.T.; Anderson, T.M.; McGill, B.J. The Priority of Prediction in Ecological Understanding. Oikos 2016, 126, 1–7. [Google Scholar] [CrossRef]
  10. Shafland, P.L.; Gestring, K.B.; Stanford, M.S. Florida’s Exotic Freshwater Fishes—2007. Fla. Sci. 2008, 71, 220–245. [Google Scholar]
  11. Tuckett, Q.M.; Ritch, J.L.; Lawson, K.M.; Hill, J.E. Landscape-Scale Survey of Non-Native Fishes near Ornamental Aquaculture Facilities in Florida, USA. Biol. Invasions 2017, 19, 223–237. [Google Scholar] [CrossRef]
  12. Schofield, P.J.; Loftus, W.F. Non-Native Fishes in Florida Freshwaters: A Literature Review and Synthesis. Rev. Fish Biol. Fish 2015, 25, 117–145. [Google Scholar] [CrossRef]
  13. Schofield, P.J.; Morris, J.A.; Akins, L. Field Guide to Nonindigenous Marine Fishes of Florida; NOAA Technical Memorandum NOS NCCOS 92; National Oceanic and Atmospheric Administration: Silver Spring, MD, USA, 2009. Available online: https://repository.library.noaa.gov/view/noaa/12675 (accessed on 13 February 2017).
  14. Belshe, J.F. Observations of an Introduced Tropical Fish (Belonesox belizanus) in Southern Florida. Master’s Thesis, University of Miami, Coral Gables, FL, USA, 1961. [Google Scholar]
  15. Schofield, P.J.; Nico, L.; Neilson, M. Belonesox belizanus; USGS Nonindigenous Aquatic Species Database: Gainesville, FL, USA, 2013. Available online: https://nas.er.usgs.gov/queries/factsheet.aspx?SpeciesID=843 (accessed on 19 January 2017).
  16. Obregon-Barboza, H.; Contreras-Balderas, S.; Lozano-Vilano, M.L. The Fishes of Northern and Central Veracruz, Mexico. Hydrobiologia 1994, 286, 79–95. [Google Scholar] [CrossRef]
  17. Miller, R.R.; Minckley, W.L.; Norris, S.M. Freshwater Fishes of México; University of Chicago Press: Chicago, IL, USA, 2007. [Google Scholar]
  18. Ferry, L.A.; Paig-Tran, E.M.; Gibb, A.C. Suction, Ram, and Biting: Deviations and Limitations to the Capture of Aquatic Prey. Integr. Comp. Biol. 2015, 55, 97–109. [Google Scholar] [CrossRef] [PubMed]
  19. Miley, W.W. Ecological Impact of the Pike Killifish, Belonesox belizanus Kner, (Poeciliidae) in Southern Florida. Master’s Thesis, Florida Atlantic University, Boca Raton, FL, USA, 1978. [Google Scholar]
  20. Turner, J.S.; Snelson, F.F.J. Population Structure, Reproduction and Laboratory Behavior of the Introduced Belonesox belizanus (Poeciliidae) in Florida. Environ. Biol. Fishes 1984, 10, 89–100. [Google Scholar] [CrossRef]
  21. Greenwood, M.F.D.; Malkin, E.; Peebles, E.B.; Stahl, S.D.; Courtney, F.X. Assessment of the Value of Small Tidal Streams, Creeks, and Backwaters as Critical Habitat for Nekton in the Tampa Bay Watershed. Report to the Florida State Wildlife Grants Program, Project SWG05-15; Florida Fish and Wildlife Conservation Commission Fish and Wildlife Research Institute and University of South Florida College of Marine Science: St Petersburg, FL, USA, 2008; Available online: https://www.researchgate.net/publication/313398996_Assessment_of_the_value_of_small_tidal_streams_creeks_and_backwaters_as_critical_habitat_for_nekton_in_the_Tampa_Bay_watershed_Report_to_the_Florida_State_Wildlife_Grants_Program_Project_SWG05–15 (accessed on 13 February 2017).
  22. Harms, C.A.; Turingan, R.G. Dietary Flexibility Despite Behavioral Stereotypy Contributes to Successful Invasion of the Pike Killifish, Belonesox belizanus in Florida, USA. Aquat. Invasions 2012, 7, 547–553. [Google Scholar] [CrossRef]
  23. Lawson, L.L., Jr.; Hill, J.E.; Hardin, S.; Vilizzi, L.; Copp, G.H. Evaluation of the Fish Invasiveness Screening Kit (Fisk V2) for Peninsular Florida. Manag. Biol. Invasion 2015, 6, 413–422. [Google Scholar] [CrossRef]
  24. Greenwood, M.F.D. Assessing Effects of the Nonindigenous Pike Killifish on Indigenous Fishes in Tampa Bay, Florida, Using a Weighted-Evidence Approach. Trans. Am. Fish Soc. 2012, 141, 84–99. [Google Scholar] [CrossRef]
  25. Fulford, R.; Yoskowitz, D.; Russell, M.; Dantin, D.; Rogers, J. Habitat and Recreational Fishing Opportunity in Tampa Bay: Linking Ecological and Ecosystem Services to Human Beneficiaries. Ecosyst. Serv. 2016, 17, 64–74. [Google Scholar] [CrossRef]
  26. Stevens, P.W.; Blewett, D.A.; Boucek, R.E.; Rehage, J.S.; Winner, B.L.; Young, J.M.; Whittington, J.A.; Paperno, R. Resilience of a Tropical Sport Fish Population to a Severe Cold Event Varies across Five Estuaries in Southern Florida. Ecosphere 2016, 7, e01400. [Google Scholar] [CrossRef]
  27. MacDonald, T.C.; Matheson, R.E.; Peebles, E.B.; McMichael, R.H.; Greenwood, M.F.D. Tidal Creeks as Nekton Habitat in the Tampa Bay Estuary. In Proceedings of the Tampa Bay Area Scientific Information Symposium (BASIS 5), St Petersburg, FL, USA, 20–23 October 2009; Cooper, S.T., Ed.; Tampa Bay Estuary Program and Tampa Bay Regional Planning Council: Tampa Bay, FL, USA, 2010; pp. 109–122. [Google Scholar]
  28. Krebs, J.M.; Bell, S.S. Risk of Predation Reflects Variation in the Reproductive Strategy of a Dominant Forage Fish in Mangrove Tidal Tributaries. Oecologia 2012, 168, 737–748. [Google Scholar] [CrossRef] [PubMed]
  29. Krebs, J.M.; McIvor, C.C.; Bell, S.S. Nekton Community Structure Varies in Response to Coastal Urbanization near Mangrove Tidal Tributaries. Estuar. Coasts 2014, 37, 815–831. [Google Scholar] [CrossRef]
  30. Miller, N. The Fishes of the Motagua River, Guatemala. Bull. Am. Mus. Nat. Hist. 1905, 23, 95–123. [Google Scholar]
  31. Greenfield, D.W.; Thomerson, J.E. Fishes of the Continental Waters of Belize; University Press of Florida: Gainesville, FL, USA, 1997. [Google Scholar]
  32. Taylor, D.S.; Reyier, E.A.; McIvor, C.C.; Davis, W.P. An Assessment of Ichthyofaunal Assemblages within the Mangal of the Belize Offshore Cays. Bull. Mar. Sci. 2007, 80, 721–737. [Google Scholar]
  33. Lopez-Lopez, E.; Sedeno-Diaz, J.E.; Romero, F.L.; Trujillo-Jimenez, P. Spatial and Seasonal Distribution Patterns of Fish Assemblages in the Rio Champoton, Southeastern Mexico. Rev. Fish Biol. Fish 2008, 19, 127–142. [Google Scholar] [CrossRef]
  34. Esselman, P.; Allan, J. Relative Influences of Catchment-and Reach-Scale Abiotic Factors on Freshwater Fish Communities in Rivers of Northeastern Mesoamerica. Ecol. Freshw. Fish 2010, 19, 439–454. [Google Scholar] [CrossRef]
  35. Vega-Cendejas, M.E.; Santillana, M.H.d.; Norris, S. Habitat Characteristics and Environmental Parameters Influencing Fish Assemblages of Karstic Pools in Southern Mexico. Neotrop. Ichthyol. 2013, 11, 859–870. [Google Scholar] [CrossRef]
  36. Jourdan, J.; Krause, S.T.; Lazar, V.M.; Zimmer, C.; Sommer-Trembo, C.; Arias-Rodriguez, L.; Klaus, S.; Riesch, R.; Plath, M. Shared and Unique Patterns of Phenotypic Diversification Along a Stream Gradient in Two Congeneric Species. Sci. Rep. 2016, 6, 38971. [Google Scholar] [CrossRef] [PubMed]
  37. Kerfoot, J.R., Jr.; Lorenz, J.J.; Turingan, R.G. Environmental Correlates of the Abundance and Distribution of Belonesox belizanus in a Novel Environment. Environ. Biol. Fishes 2011, 92, 125–139. [Google Scholar] [CrossRef]
  38. Rahel, F.J.; Olden, J.D. Assessing the Effects of Climate Change on Aquatic Invasive Species. Conserv. Biol. 2008, 22, 521–533. [Google Scholar] [CrossRef] [PubMed]
  39. Lewis, R.R.; Estevez, E.D. The Ecology of Tampa Bay, Florida: An Estuarine Profile; U.S. Department of the Interior, Fish and Wildlife Service: Washington, DC, USA, 1988.
  40. Raabe, E.A.; Roy, L.C.; McIvor, C.C. Tampa Bay Coastal Wetlands: Nineteenth to Twentieth Century Tidal Marsh-to-Mangrove Conversion. Estuar. Coasts 2012, 35, 1145–1162. [Google Scholar] [CrossRef]
  41. Sherwood, E.T.; Greening, H.S. Potential Impacts and Management Implications of Climate Change on Tampa Bay Estuary Critical Coastal Habitats. Environ. Manag. 2014, 53, 401–415. [Google Scholar] [CrossRef] [PubMed]
  42. Lewis, R.R., III; Robison, D. Setting Priorities for Tampa Bay Habitat Protection and Restoration: Restoring the Balance; Tampa Bay National Estuary Program: St. Petersburg, FL, USA, 1996. [Google Scholar]
  43. Greenwood, M.F.D.; Matheson, R.E., Jr.; McMichael, R.H., Jr.; MacDonald, T.C. Community Structure of Shoreline Nekton in the Estuarine Portion of the Alafia River, Florida: Differences Along a Salinity Gradient and Inflow-Related Changes. Estuar. Coast. Shelf Sci. 2007, 74, 223–238. [Google Scholar] [CrossRef]
  44. Ben Rais Lasram, F.; Tomasini, J.A.; Guilhaumon, F.; Romdhane, M.S.; Do Chi, T.; Mouillot, D. Ecological Correlates of Dispersal Success of Lessepsian Fishes. Mar. Ecol. Prog. Ser. 2008, 363, 273–286. [Google Scholar] [CrossRef]
  45. Tampa Bay Tidal Tributary Research Team. Tampa Bay Tidal Tributary Habitat Initiative Project: Final Report and Management Recommendations. Tampa Bay Estuary Program Technical Report #02-08; Report to the Pinellas County Environmental Fund; Sherwood, E.T., Ed.; Tampa Bay Estuary Program: St. Petersburg, FL USA, 2008; Available online: https://www.tbeptech.org/TBEP_TECH_PUBS/2008/TBEP_02_08_Tidal_Tributary_Habitat_Initiative_Integrated_Summary_Report.pdf (accessed on 13 February 2017).
  46. Elith, J.; Leathwick, J.R.; Hastie, T. A Working Guide to Boosted Regression Trees. J. Anim. Ecol. 2008, 77, 802–813. [Google Scholar] [CrossRef] [PubMed]
  47. Rozas, L.P.; Minello, T.J. Estimating Densities of Small Fishes and Decapod Crustaceans in Shallow Estuarine Habitats: A Review of Sampling Design with Focus on Gear Selection. Estuaries 1997, 20, 199–213. [Google Scholar] [CrossRef]
  48. Cocheret de la Moriniere, E.; Nagelkerken, I.; van der Melj, H.; van derVelde, G. What Attracts Juvenile Coral Reef Fish to Mangroves: Habitat Complexity or Shade? Mar. Biol. 2004, 144, 139–145. [Google Scholar] [CrossRef]
  49. Ellis, W.L.; Bell, S.S. Conditional Use of Mangrove Habitats by Fishes: Depth as a Cue to Avoid Predators. Estuaries 2004, 27, 966–976. [Google Scholar] [CrossRef]
  50. Hijmans, R.J.; Phillips, S.; Leathwick, J.; Elith, J. Dismo: Species Distribution Modeling. R Package Version 1.1-1. 2016. Available online: https://CRAN.R-project.org/package=dismo (accessed on 22 October 2016).
  51. R Core Team. R: A Language and Environment for Statistical Computing; R Foundation for Statistical Computing: Vienna, Austria, 2016; Available online: https://www.R-project.org/ (accessed on 22 October 2016).
  52. Broennimann, O.; Guisan, A. Predicting Current and Future Biological Invasions: Both Native and Invaded Ranges Matter. Biol. Lett. 2008, 4, 585–589. [Google Scholar] [CrossRef] [PubMed]
  53. Brown, M.L.; Allen, M.S.; Beard, T.D. Data Management and Statistical Techniques. In Fisheries Techniques, 3rd ed.; Zale, A.V., Parrish, D.L., Sutton, T.M., Eds.; American Fisheries Society: Bethesda, MD, USA, 2012; pp. 15–77. [Google Scholar]
  54. Friedman, J.H.; Meulman, J.J. Multiple Additive Regression Trees with Application in Epidemiology. Stat. Med. 2003, 22, 1365–1381. [Google Scholar] [CrossRef] [PubMed]
  55. Ridgeway, G. with Contributions from others. gbm: Generalized Boosted Regression Models. R Package Version 2.1.1. 2015. Available online: https://CRAN.R-project.org/package=gbm (accessed on 12 October 2016).
  56. Lawson, K.M.; Tuckett, Q.M.; Ritch, J.L.; Nico, L.G.; Fuller, P.L.; Matheson, R.E.; Gestring, K.; Hill, J.E. Distribution and Status of Five Non-native Fish Species in the Tampa Bay Drainage (USA), a Hot Spot for Fish Introductions. Bioinvasions Rec. (under review).
  57. MacDonald, T. Personal Communication, Florida Fish and Wildlife Conservation Commission, Fish and Wildlife Research Institute: St. Petersburg, FL, USA, 2016.
  58. Rehage, J.S.; Sih, A. Dispersal Behavior, Boldness, and the Link to Invasiveness: A Comparison of Four Gambusia Species. Biol. Invasions 2004, 6, 379–391. [Google Scholar] [CrossRef]
  59. Olden, J.D.; Poff, N.L.; Bestgen, K.R. Life-History Strategies Predict Fish Invasions and Extirpations in the Colorado River Basin. Ecol. Monogr. 2006, 76, 25–40. [Google Scholar] [CrossRef]
  60. Córdova-Tapia, F.; Zambrano, L. Fish Functional Groups in a Tropical Wetland of the Yucatan Peninsula, Mexico. Neotrop. Ichthyol. 2016, 14. [Google Scholar] [CrossRef]
  61. Armstrong, R.C. Dispersal Rates of Mosquitofish through Cattails in Drainage Ditches. Proc. Calif. Mos. Control Assoc. 1977, 45, 103–104. [Google Scholar]
  62. Alemadi, S.D.; Jenkins, D.G. Behavioral Constraints for the Spread of the Eastern Mosquitofish, Gambusia Holbrooki (Poeciliidae). Biol. Invasions 2008, 10, 59–66. [Google Scholar] [CrossRef]
  63. Deacon, A.E.; Ramnarine, I.W.; Magurran, A.E. How Reproductive Ecology Contributes to the Spread of a Globally Invasive Fish. PLoS ONE 2011, 6, e24416. [Google Scholar] [CrossRef] [PubMed]
  64. Bronnenhuber, J.E.; Dufour, B.A.; Higgs, D.M.; Heath, D.D. Dispersal Strategies, Secondary Range Expansion and Invasion Genetics of the Nonindigenous Round Goby, Neogobius melanostomus, in Great Lakes Tributaries. Mol. Ecol. 2011, 20, 1845–1859. [Google Scholar] [CrossRef] [PubMed]
  65. Kornis, M.; Mercado-Silva, N.; Vander Zanden, M. Twenty Years of Invasion: A Review of Round Goby Neogobius melanostomus Biology, Spread and Ecological Implications. J. Fish Biol. 2012, 80, 235–285. [Google Scholar] [CrossRef] [PubMed]
  66. Brandner, J.; Cerwenka, A.F.; Schliewen, U.K.; Geist, J. Bigger Is Better: Characteristics of Round Gobies Forming an Invasion Front in the Danube River. PLoS ONE 2013, 8, e73036. [Google Scholar] [CrossRef] [PubMed]
  67. Ligtvoet, W.; Mkumbo, O.C. Synopsis of ecological and fishery research on Nile perch (Lates niloticus) in Lake Victoria, conducted by HEST/TAFIRI. In Proceedings of the CIFA. Report of the 5th session of the Sub-Committee for the Development and Management of the Fisheries in Lake Victoria, Mwanza, Tanzania, 12–24 September 1989; FAO Fisheries Report 430. Food and Agriculture Organization of the United Nations: Rome, Italy, 1990; pp. 35–74. [Google Scholar]
  68. Peters, L.M.; Pegg, M.A.; Reinhardt, U.G. Movements of Adult Radio-Tagged Bighead Carp in the Illinois River. Trans. Am. Fish Soc. 2006, 135, 1205–1212. [Google Scholar] [CrossRef]
  69. Lapointe, N.W.R.; Odenkirk, J.S.; Angermeier, P.L. Seasonal Movement, Dispersal, and Home Range of Northern Snakehead Channa argus (Actinopterygii, Perciformes) in the Potomac River Catchment. Hydrobiologia 2013, 709, 73–87. [Google Scholar] [CrossRef]
  70. Nico, L.G.; Beamish, W.H.; Musikasinthorn, P. Discovery of the Invasive Mayan Cichlid Fish “Cichlasomaurophthalmus (Günther 1862) in Thailand, with Comments on Other Introductions and Potential Impacts. Aquat. Invasions 2007, 2, 197–214. [Google Scholar] [CrossRef]
  71. Harrison, E.; Lorenz, J.J.; Trexler, J.C. Per Capita Effects of Non-Native Mayan Cichlids (Cichlasoma urophthalmus; Gunther) on Native Fish in the Estuarine Southern Everglades. Copeia 2013, 2013, 80–96. [Google Scholar] [CrossRef]
  72. Paperno, R.; Ruiz-Carus, R.; Krebs, J.M.; McIvor, C.C. Expansion of the Mayan Cichlid, Cichlasoma urophthalmus (Pisces, Cichlidae), above the 28° N Latitude in Florida. Fla. Sci. 2008, 71, 293–304. [Google Scholar]
  73. Bisazza, A.; Novarini, N.; Pilastro, A. Male Body Size and Male-Male Competition: Interspecific Variation in Poeciliid Fishes. Ital. J. Zool. 1996, 63, 365–369. [Google Scholar] [CrossRef]
  74. Padilla, D.K.; Williams, S.L. Beyond Ballast Water: Aquarium and Ornamental Trades as Sources of Invasive Species in Aquatic Ecosystems. Front. Ecol. Environ. 2004, 2, 131–138. [Google Scholar] [CrossRef]
  75. Rahel, F.J. Biogeographic Barriers, Connectivity and Homogenization of Freshwater Faunas: It’s a Small World after All. Freshw. Biol. 2007, 52, 696–710. [Google Scholar] [CrossRef]
  76. Frederick, P.C.; Spalding, M.G.; Sepulveda, M.S.; Williams, G.E.; Nico, L.; Robins, R. Exposure of Great Egret (Ardea albus) Nestlings to Mercury through Diet in the Everglades Ecosystem. Environ. Toxicol. Chem. 1999, 18, 1940–1947. [Google Scholar] [CrossRef]
  77. Gilliam, J.F.; Fraser, D.F. Movement in Corridors: Enhancement by Predation Threat, Disturbance, and Habitat Structure. Ecology 2001, 82, 258–273. [Google Scholar] [CrossRef]
  78. Bond, N.R.; Lake, P.S. Local Habitat Restoration in Streams: Constraints on the Effectiveness of Restoration for Stream Biota. Ecol. Manag. Restor. 2003, 4, 193–198. [Google Scholar] [CrossRef]
  79. McIvor, C.C.; Odum, W.E. Food, Predation Risk, and Microhabitat Selection in a Marsh Fish Assemblage. Ecology 1988, 69, 1341–1351. [Google Scholar] [CrossRef]
  80. Idelberger, C.F.; Stafford, C.J.; Erickson, S.E. Distribution and Abundance of Introduced Fishes in Florida’s Charlotte Harbor Estuary. Gulf. Caribb. Res. 2011, 23, 13–22. [Google Scholar] [CrossRef]
  81. Idelberger, C.F.; Stevens, P.W.; Weather, E. Fishes of the Lemon Bay Estuary and a Comparison of Fish Community Structure to Nearby Estuaries Along Florida’s Gulf Coast. Fla. Sci. 2016, 79, 159–177. [Google Scholar]
  82. Elith, J.; Leathwick, J.R. Species Distribution Models: Ecological Explanation and Prediction across Space and Time. Annu. Rev. Ecol. Evol. Syst. 2009, 40, 677–697. [Google Scholar] [CrossRef]
  83. Breiner, F.T.; Guisan, A.; Bergamini, A.; Nobis, M.P. Overcoming Limitations of Modelling Rare Species by Using Ensembles of Small Models. Methods Ecol. Evol. 2015, 6, 1210–1218. [Google Scholar] [CrossRef]
  84. Hegel, T.M.; Cushman, S.A.; Evans, J.; Huettmann, F. Current State of the Art for Statistical Modelling of Species Distributions. In Spatial Complexity, Informatics, and Wildlife Conservation; Cushman, S.A., Huettmann, F., Eds.; Springer: New York, NY, USA, 2010; pp. 273–311. [Google Scholar]
  85. Trexler, J.C.; Loftus, W.F.; Jordan, F.; Lorenz, J.J.; Chick, J.H.; Kobza, R.M. Empirical Assessment of Fish Introductions in a Subtropical Wetland: An Evaluation of Contrasting Views. Biol. Invasions 2000, 2, 265–277. [Google Scholar] [CrossRef]
  86. Nordlie, F.G. Physicochemical Environments and Tolerances of Cyprinodontoid Fishes Found in Estuaries and Salt Marshes of Eastern North America. Rev. Fish Biol. Fish 2006, 16, 51–106. [Google Scholar] [CrossRef]
  87. Stevens, P.W.; Blewett, D.A.; Casey, J.P. Short-Term Effects of a Low Dissolved Oxygen Event on Estuarine Fish Assemblages Following the Passage of Hurricane Charley. Estuar. Coasts 2006, 29, 997–1003. [Google Scholar] [CrossRef]
  88. Domenici, P.; Lefrancois, C.; Shingles, A. Hypoxia and the Antipredator Behaviours of Fishes. Philos. Trans. R. Soc. Lond. B Biol. Sci. 2007, 362, 2105–2121. [Google Scholar] [CrossRef] [PubMed]
  89. Schofield, P.J.; Loftus, W.F.; Brown, M.E. Hypoxia Tolerance of Two Centrarchid Sunfishes and an Introduced Cichlid from Karstic Everglades Wetlands of Southern Florida, U.S.A. J. Fish Biol. 2007, 71, 87–99. [Google Scholar] [CrossRef]
  90. Iacarella, J.C.; Ricciardi, A. Dissolved Ions Mediate Body Mass Gain and Predatory Response of an Invasive Fish. Biol. Invasions 2015, 17, 3237–3246. [Google Scholar] [CrossRef]
  91. Duarte, C.M.; Hendriks, I.E.; Moore, T.S.; Olsen, Y.S.; Steckbauer, A.; Ramajo, L.; Carstensen, J.; Trotter, J.A.; McCulloch, M. Is Ocean Acidification an Open-Ocean Syndrome? Understanding Anthropogenic Impacts on Seawater Ph. Estuar. Coasts 2013, 36, 221–236. [Google Scholar] [CrossRef]
  92. Shafland, P.L.; Pestrak, J.M. Lower Lethal Temperatures for Fourteen Non-Native Fishes in Florida. Environ. Biol. Fishes 1982, 7, 149–156. [Google Scholar] [CrossRef]
  93. Allanson, B.R.; Bok, A.; van Wyk, N.I. The Influence of Exposure to Low Temperature on Tilapia Mossambica Peters (Cichlidae). II. Changes in Serum Osmolarity, Sodium and Chlorida Ion Concentrations. J. Fish Biol. 1971, 3, 181–185. [Google Scholar] [CrossRef]
  94. Stauffer, J.R.J.; Boltz, S.E. Effect of Salinity on the Temperature Preference and Tolerance of Age-0 Mayan Cichlids. Trans. Am. Fish Soc. 1993, 123, 101–107. [Google Scholar] [CrossRef]
  95. Peterson, M.S.; Ross, S.T. Dynamics of Littoral Fishes and Decapods Along a Coastal River-Estuarine Gradient. Estuar. Coast. Shelf Sci. 1991, 33, 467–483. [Google Scholar] [CrossRef]
  96. Gilmore, R.G., Jr.; Bullock, L.H.; Berry, F.H. Hypothermal Mortality in Marine Fishes of South-Central Florida, January, 1977. Northeast Gulf. Sci. 1978, 2, 77–97. [Google Scholar]
  97. Kerfoot, J. Thermal Tolerance of the Invasive Belonesox Belizanus, Pike Killifish, Throughout Ontogeny. J. Exp. Zool. A Ecol. Genet. Physiol. 2012, 317, 266–274. [Google Scholar] [CrossRef] [PubMed]
  98. Boucek, R.E.; Rehage, J.S. Examining the Effectiveness of Consumer Diet Sampling as a Nonnative Detection Tool in a Subtropical Estuary. Trans. Am. Fish Soc. 2014, 143, 489–494. [Google Scholar] [CrossRef]
  99. Strayer, D.L.; Eviner, V.T.; Jeschke, J.M.; Pace, M.L. Understanding the Long-Term Effects of Species Invasions. Trends Ecol. Evol. 2006, 21, 645–651. [Google Scholar] [CrossRef] [PubMed]
  100. Everman, E.; Klawinski, P. Human-Facilitated Jump Dispersal of a Non-Native Frog Species on Hawai’i Island. J. Biogeogr. 2013, 40, 1961–1970. [Google Scholar] [CrossRef]
  101. Gertzen, E.; Familiar, O.; Leung, B. Quantifying Invasion Pathways: Fish Introductions from the Aquarium Trade. Can. J. Fish Aquat. Sci. 2008, 65, 1265–1273. [Google Scholar] [CrossRef]
  102. Stevens, P.W. Sampling Fish Communities in Saltmarsh Impoundments in the Northern Indian River Lagoon, Florida: Cast Net and Culvert Trap Gear Testing. Fla. Sci. 2006, 69, 135–147. [Google Scholar]
  103. Winner, B.L.; Blewett, D.A.; McMichael, R.H.; Guenther, C.B. Relative Abundance and Distribution of Common Snook Along Shoreline Habitats of Florida Estuaries. Trans. Am. Fish Soc. 2010, 139, 62–79. [Google Scholar] [CrossRef]
  104. Kerfoot, J.R., Jr.; Turingan, R.G. Similarity and Disparity in Prey-Capture Kinematics between the Invasive Pike Killifish (Belonesox Belizanus) and the Native Florida Largemouth Bass (Micropterus Floridanus). Fla. Sci. 2011, 74, 137. [Google Scholar]
  105. Henningsen, B.F.; Norton, N.T.; Young, B.E. The Rock Ponds Ecosystem Restoration Project—A True Mosaic of Coastal Habitats for Tampa Bay. Proceedingso of the Tampa Bay Area Scientific Information Symposium (BASIS 6), St. Petersburg, FL, USA, 28–30 September 2015; Burke, M., Ed.; Tampa Bay Estuary Program and Tampa Bay Regional Planning Council: St. Petersburg, FL, USA, 2015; p. 60. Available online: https://www.tbeptech.org/BASIS/BASIS6/BASIS6_Proceedings_FINAL.pdf#page=67 (accessed on 12 February 2017).
  106. Motta, P.J. Fisheries Evaluation of Restoration of Peanut Lake, Tampa Bay, Florida; Department of Biology, University of South Florida: Tampa, FL, USA, 1995. [Google Scholar]
  107. Kurz, R.C.; Fenwick, R.W.; Davis, K.A. A Comparison of Fish Communities in Restored and Natural Salt Marshes in Tampa Bay, Florida; Southwest Florida Water Management District: Tampa, FL, USA, 1998. Available online: http://images.library.wisc.edu/EcoNatRes/EFacs/Wetlands/Wetlands24/reference/econatres.wetlands24.rkurz.pdf (accessed on 13 February 2017).
  108. Bahk, B.M. Succession of Ichthyofauna in a Constructed Tidal Creek Salt Marsh in Cockroach Bay, Florida; Resource Management Department, Southwest Florida Water Management District: Brooksville, FL, USA, 1999.
Figure 1. Presence of Belonesox belizanus in estuarine waterbodies of Tampa Bay, 1989–2007/2008, amended with permission from [24], with inset showing collections from elsewhere in Florida [15]. For main map, red dots represent presence (with a red star indicating the first occurrence, 1994), green dots represent absence. QC = Question Mark Creek; RW = Riverview West Creek; DC = Dogleg Creek; MBC = Mill Bayou Canal; SCS = Sun City Slough. Total n = 16,113 shoreline seines (see Supplementary Material). Underlined waterbodies were included in the boosted regression tree modeling of habitat predictability. Collections from elsewhere in Florida represent clustered records ranging from one specimen (white circle) to 20 or more specimens (dark blue circle).
Fishes 02 00006 g001
Figure 2. Presence (red dots with last two digits of year annotation) of B. belizanus in the lower Little Manatee River sampling area (km 0–13) from regular shoreline seine monitoring, 1997–2007. The first six presences are highlighted, along with the most upstream presence. The broken yellow line divides the upstream and downstream zones of monthly sampling. The inset graph shows rate of upstream spread from the first to sixth occurrence in 1997/1998.
Fishes 02 00006 g002
Figure 3. Predictive performance of boosted regression tree models for B. belizanus presence in Tampa Bay estuarine waterbodies for randomly selected (|- - -|) and fixed (|–––|) subsets of 935 9.1-m shoreline seine samples, expressed as 95% intervals of the area under the receiver operating characteristic curve from 1000 model iterations. Randomly selected and fixed subset models included training data (n = 695 samples) and prediction data (n = 240 samples).
Fishes 02 00006 g003
Figure 4. Predictions (|–––|, 95% interval) of B. belizanus presence (% of samples) in three estuarine waterbodies of Tampa Bay, based on 1000 boosted regression tree model iterations for a fixed subset training dataset (n = 695 samples), in comparison to actual occurrence (|—●—|, with 95% interval generated by 1000 bootstrapped resamples of the data).
Fishes 02 00006 g004
Figure 5. Relative contribution of habitat predictors from boosted regression tree models for B. belizanus presence in Tampa Bay estuarine waterbodies for randomly selected (|- - -|) and fixed (|–––|) subsets of 935 9.1-m shoreline seine samples, expressed as 95% intervals from 1000 model iterations.
Fishes 02 00006 g005
Figure 6. Partial dependence plots of habitat predictors from boosted regression tree models for B. belizanus presence in Tampa Bay estuarine waterbodies for randomly selected (|- - -|) and fixed (|–––|) subsets of 935 total 9.1-m shoreline seine samples, expressed as 95% intervals from 1000 model iterations. (a) Julian day; (b) dissolved oxygen; (c) water depth; (d) pH; (e) salinity; (f) temperature; (g) shoreline type: Mng (mangrove), Msh (marsh), ShT (shrubs/trees), STV (small terrestrial vegetation), Har (hardened), Oth (other); (h) substrate type: Mud, M/S (mud/sand), Oy/R (oyster/rock), Snd (sand), Unk (unknown); (i) gradient; (j) waterbody type; (k) shoreline inundation; (l) overhanging vegetation.
Fishes 02 00006 g006
Table 1. Tampa Bay estuarine waterbodies sampled to assess Belonesox belizanus habitat predictability, including mean and range of continuous habitat predictors.
Waterbody NameWaterbody TypeYear SampledNumber of 9.1-m Seine SamplesTemperature (°C)Salinity (Practical Salinity Scale) Dissolved Oxygen (mg L−1)pHDepth (m)Gradient (%)
Alafia RiverRiver200616722.9 (13.9–30.3)3.5 (0.1–20.1)7.3 (3.4–16.5)7.7 (6.8–8.8)0.5 (0.1–1.0)20.6 (0.0–66.7)
Andrews CreekCreek20077225.1 (17.3–32.3)22.4 (6.3–32.8)5.5 (2.9–9.9)7.8 (7.5–8.1)0.5 (0.2–1.0)21.4 (0.0–66.7)
Cockroach CreekCreek200712023.8 (16.1–29.7)19.3 (0.4–33.0)3.8 (0.3–12.2)7.3 (6.8–8.1)0.5 (0.2–1.2)21.1 (0.0–60.0)
Curiosity CreekCreek200612022.5 (11.9–30.0)3.3 (0.2–17.2)6.5 (2.7–10.6)7.3 (6.4–7.9)0.7 (0.1–1.2)26.8 (0.0–66.7)
Dogleg CreekCanal20064822.6 (15.1–28.3)1.3 (0.2–4.0)6.9 (4.5–9.8)7.7 (7.3–8.3)0.7 (0.3–1.0)29.0 (6.7–53.3)
Hayes BayouBayou20064823.7 (12.8–30.5)11.6 (0.6–23.6)7.0 (3.6–10.3)7.6 (7.0–8.3)0.4 (0.1–1.0)14.3 (0.0–40.0)
Little Manatee RiverRiver20069623.8 (11.8–31.4)8.5 (0.1–27.0)6.7 (3.6–12.9)7.4 (6.3–7.9)0.5 (0.1–1.0)18.3 (0.0–53.3)
Question Mark CreekCanal20064823.4 (13.4–30.1)8.0 (1.0–16.4)6.5 (2.6–13.7)7.6 (6.9–8.4)0.5 (0.2–1.0)23.1 (0.0–46.7)
Rice CreekCreek20064821.7 (15.4–29.2)1.3 (0.1–8.1)8.1 (2.0–13.5)7.6 (7.1–8.8)0.5 (0.1–1.0)12.6 (0.0–66.7)
Riverview West CreekCanal20064823.3 (15.1–30.6)2.5 (0.2–8.9)7.8 (2.7–16.6)7.7 (6.9–8.7)0.5 (0.1–1.0)15.7 (0.0–40.0)
Wildcat CreekCreek200612022.7 (11.6–28.9)7.3 (0.2–23.4)6.5 (2.7–15.2)7.4 (7.0–8.1)0.5 (0.1–1.2)21.0 (0.0–66.7)
Overall 93523.2 (11.6–32.3)8.3 (0.1–33.0)6.4 (0.3–16.6)7.5 (6.3–8.8)0.5 (0.1–1.2)20.9 (0.0–66.7)
Table 2. Shoreline and substrate type in Tampa Bay estuarine waterbodies sampled to assess B. belizanus habitat predictability.
Waterbody NameShoreline TypeSubstrate Type
MangroveMarshShrubs/TreesSmall Terrestrial Veg.HardenedMudMud-SandSandOyster-Rock
Alafia River0.0%14.4%21.6%13.8%49.1%7.2%26.3%49.7%16.8%
Andrews Creek94.4%0.0%1.4%0.0%2.8%72.2%18.1%1.4%6.9%
Cockroach Creek99.2%0.0%0.0%0.0%0.0%69.2%20.8%1.7%8.3%
Curiosity Creek0.0%50.8%27.5%20.0%0.0%19.2%35.8%45.0%0.0%
Dogleg Creek0.0%0.0%39.6%29.2%4.2%33.3%41.7%20.8%4.2%
Hayes Bayou0.0%100.0%0.0%0.0%0.0%33.3%25.0%41.7%0.0%
Little Manatee River21.9%56.3%3.1%2.1%12.5%3.1%22.9%55.2%18.8%
Question Mark Creek2.1%10.4%66.7%4.2%14.6%22.9%41.7%33.3%2.1%
Rice Creek0.0%8.3%18.8%33.3%27.1%10.4%31.3%54.2%4.2%
Riverview West Creek0.0%2.1%0.0%25.0%72.9%68.8%18.8%6.3%6.3%
Wildcat Creek4.2%86.7%4.2%2.5%0.0%50.8%40.0%9.2%0.0%
Table 3. Abundance and percentage presence of B. belizanus in Tampa Bay estuarine waterbodies sampled to assess habitat predictability.
Waterbody NameNumber of 9.1-m Seine SamplesNumber of Fish% Presence
Alafia River16721.2%
Andrews Creek721412.5%
Cockroach Creek1202611.7%
Curiosity Creek120105.0%
Dogleg Creek4824.2%
Hayes Bayou4836.3%
Little Manatee River9665.2%
Question Mark Creek48812.5%
Rice Creek4800.0%
Riverview West Creek4846.3%
Wildcat Creek1202214.2%
Overall935977.2%

