1. Introduction
Safety management in transport has changed substantially in the past 15–20 years. A wave of deregulation started around 1980 [
1]. Subsequently, the organization of transport policy agencies has changed in many countries, in particular by establishing separate organizations for: (1) the development and maintenance of infrastructure; (2) regulation of transport operators; (3) safety management. As an example, the mainline railways in Norway used to be operated as a vertically integrated state monopoly (Norwegian State Railways, abbreviated NSB in Norwegian). The NSB was in charge of everything that had to do with railways. In 1996, the NSB was split into three organizations:
The National Rail Administration, which manages infrastructure (tracks, signals, stations) and issues permissions to operate trains.
The Norwegian Railway Authority, which issues safety regulations, approves rolling stock and infrastructure, and performs safety inspections.
The Norwegian State Railways, which operates trains on a commercial basis. It no longer has a monopoly and although it remains dominant, several companies now operate trains in Norway.
The Norwegian Railway Authority is a safety inspectorate; i.e., it drafts and enforces safety regulations, issues type approvals of rolling stock and infrastructure, performs safety inspections, receives incident reports, and keeps accident statistics. Before it was established, these functions were either not performed at all (incident reporting), or performed “in-house” by the Norwegian State Railways, usually without any publicity or external review. An independent accident investigation board, now responsible for investigating accidents in all modes of transport was established in 1989. It originally investigated aviation accidents only, but its mandate was extended to rail accidents in 2002.
There has been concern that deregulation and privatization of aviation and rail transport may harm safety [
2,
3,
4,
5]. It has been argued that competition may induce cost-cutting that reduces safety margins, for example, by using planes and rolling stock more intensely or by cutting staff to the minimum and prolonging working hours. One measure that can be taken to maintain or improve safety under these circumstances is the creation of a safety inspectorate with powers to issue safety instructions to transport operators.
The objective of this paper is to assess whether the creation of independent safety inspectorates in Norway, in particular in aviation and rail, is associated with changes in the long-term trends in safety in these modes of transport. Long-term trends in accident rates were determined for the period before the safety inspectorates were established. These trends were then projected to the period after the safety inspectorates were created. The projected trends were then compared to actual accident rates in the period after the safety inspectorates were created. This approach to analysis is identical to the approach taken in studies of the privatization of railways [
6,
7].
It should be noted that for rail, the changes made in 1996 included more than just establishing a safety inspectorate. Therefore, the paper can only evaluate the whole package of reforms. However, competition between train operators was very limited until 2006.
2. Background and Literature Review
Independent safety inspectorates in transport are a comparatively recent phenomenon in Norway. By contrast, Evans [
6] reports that Great Britain has had a Railway Inspectorate since 1840.
Table 1 gives an overview of safety inspectorates in transport in Norway as of 2015 [
8].
There are safety inspectorates for all modes of transport. The most recently established inspectorate is for roads. It was created in 2012, which is too recent to assess any potential safety effects. The maritime safety inspectorate, which is both a regulatory body and an inspectorate, was established in 1962. This is too long ago to meaningfully reconstruct data for a before-period. Thus, the only inspectorates for which there are sufficiently long before- and after-periods to study long-term changes in safety are the inspectorates for aviation and rail.
An attempt was made to locate previous studies of the effects of creating safety inspectorates by searching for studies in Sciencedirect using “safety inspectorate” and “safety management” as keywords. Based on this literature search, there seem to be few, if any, previous studies that have evaluated safety inspectorates. Hedlund [
9] evaluated the effects on fatal and disabling injuries of a voluntary five-star occupational health and safety management system developed in South Africa. It was found that companies with a high star rating had a better safety performance than those with a low star rating or companies that did not use the star-rating system. Mooren
et al. [
10] reviewed the literature on safety management for heavy vehicle transport. The study identified elements of safety management that were associated with a superior safety performance. Some of these elements, such as management commitment to safety and the use of risk analysis to identify hazards, could perhaps be stimulated by regular safety inspections.
3. Data and Analysis
3.1. Aviation
Data were obtained on accidents, traffic volume, and transport volume for aviation and railways in Norway. Detailed accident statistics for the period from 1970 to 2012 were obtained from the Civil Aviation Authority. These statistics list the number of accidents, identified as either fatal or non-fatal, and the number of fatalities each year from 1970 to 2012. Five types of commercial operations are identified: (1) scheduled flights; (2) charter flights; (3) air taxi; (4) aerial work; and (5) instruction flights. Only two indicators of exposure are available for the entire period: (1) kilometers flown, which comprises only scheduled flights and charter flights; and (2) passenger kilometers of travel. Long-term trends in safety were therefore described by means of the following two estimators:
The data that were used in the analyses are shown in
Table A1 and
Table A2 in the
Appendix to the paper. Changes over time in these two estimators are shown in
Figure 1 and
Figure 2.
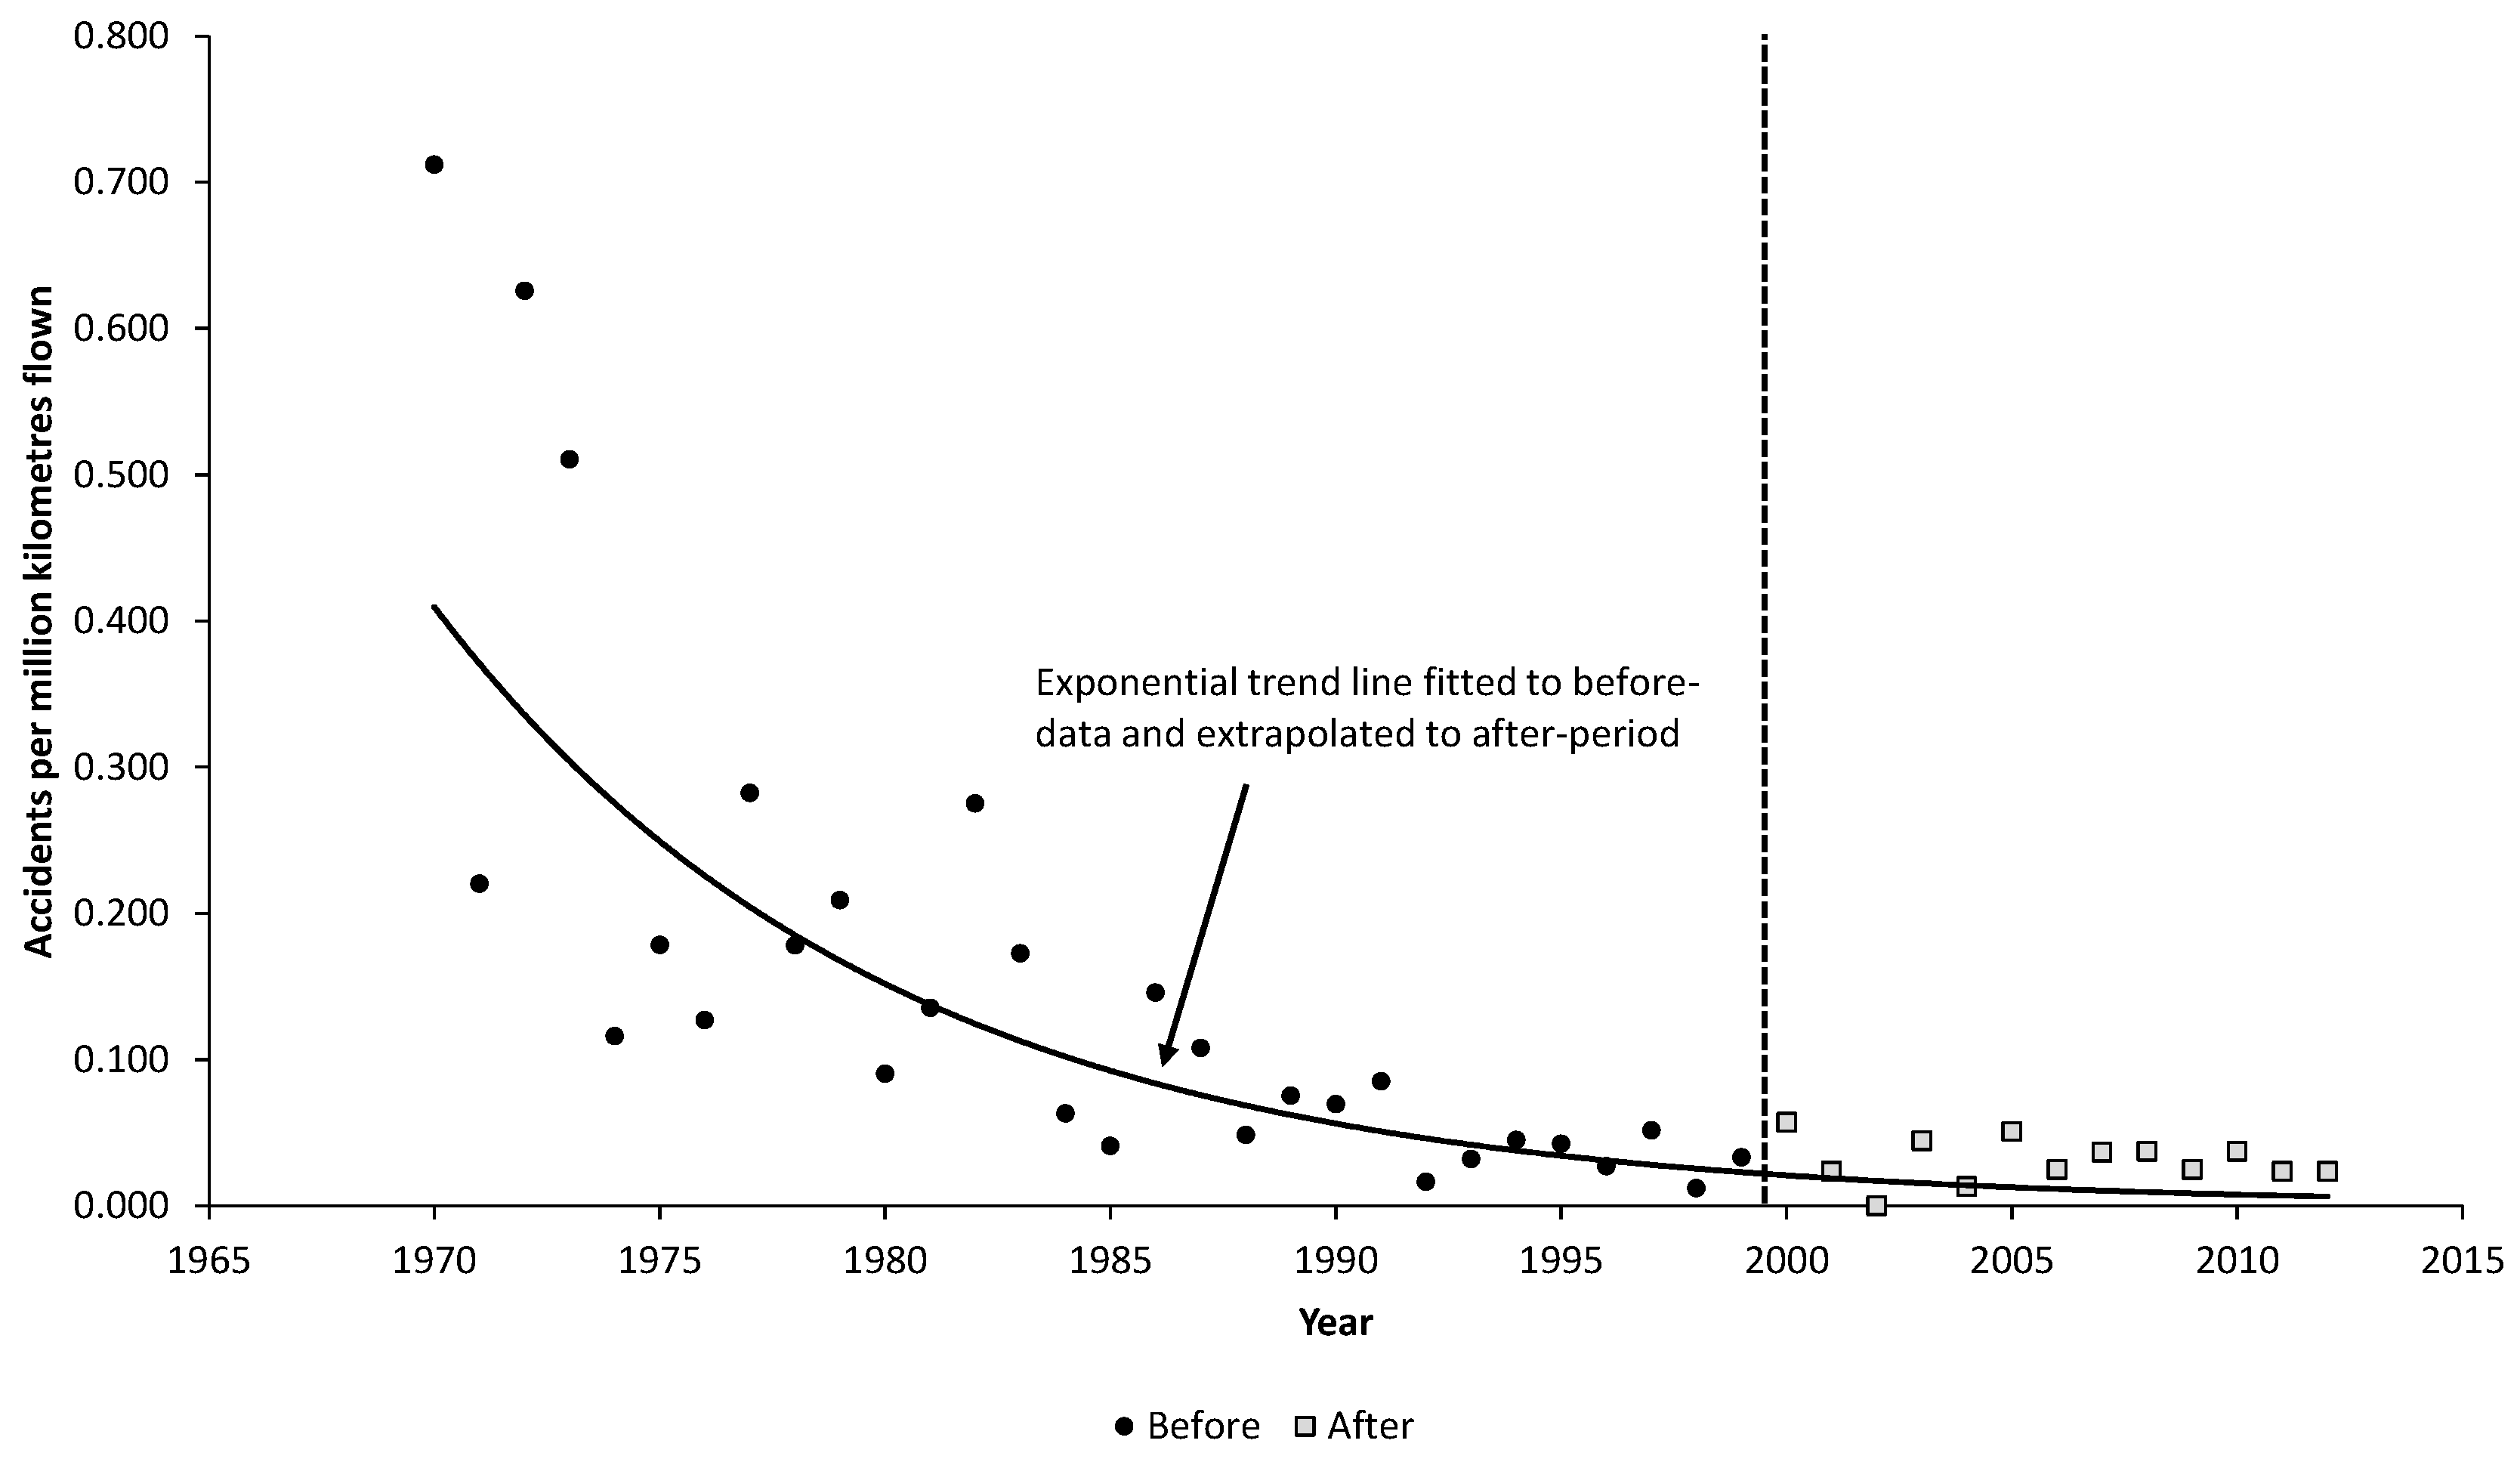
Figure 1 shows the annual accident rate for scheduled and charter flights per million kilometers flown. The rate includes all reported accidents, both fatal and non-fatal. It is seen that the rate has declined sharply over time.
An exponential trend line has been fitted to the data points for the before-period (1970–1999) and extrapolated to the after-period (2000–2012). The extrapolated part of the trend line is intended as an estimate of what the accident rate would have been if a safety inspectorate had not been created and the long-term trend had remained unchanged from the before-period. The squared correlation coefficient for the trend line is 0.742. It is particularly important that the trend line fits the data well for the end of the before-period. If, for example, the trend line is located below most of the data points close to the end of the before-period, extrapolating it may produce biased (
i.e., too low) estimates of the accident rate expected in the after-period. The trend line in
Figure 1 runs right in the middle of the data points. There is no statistically significant autocorrelation of the residuals, which indicates that there are no strings of adjacent data points that consistently are above or below the trend line.
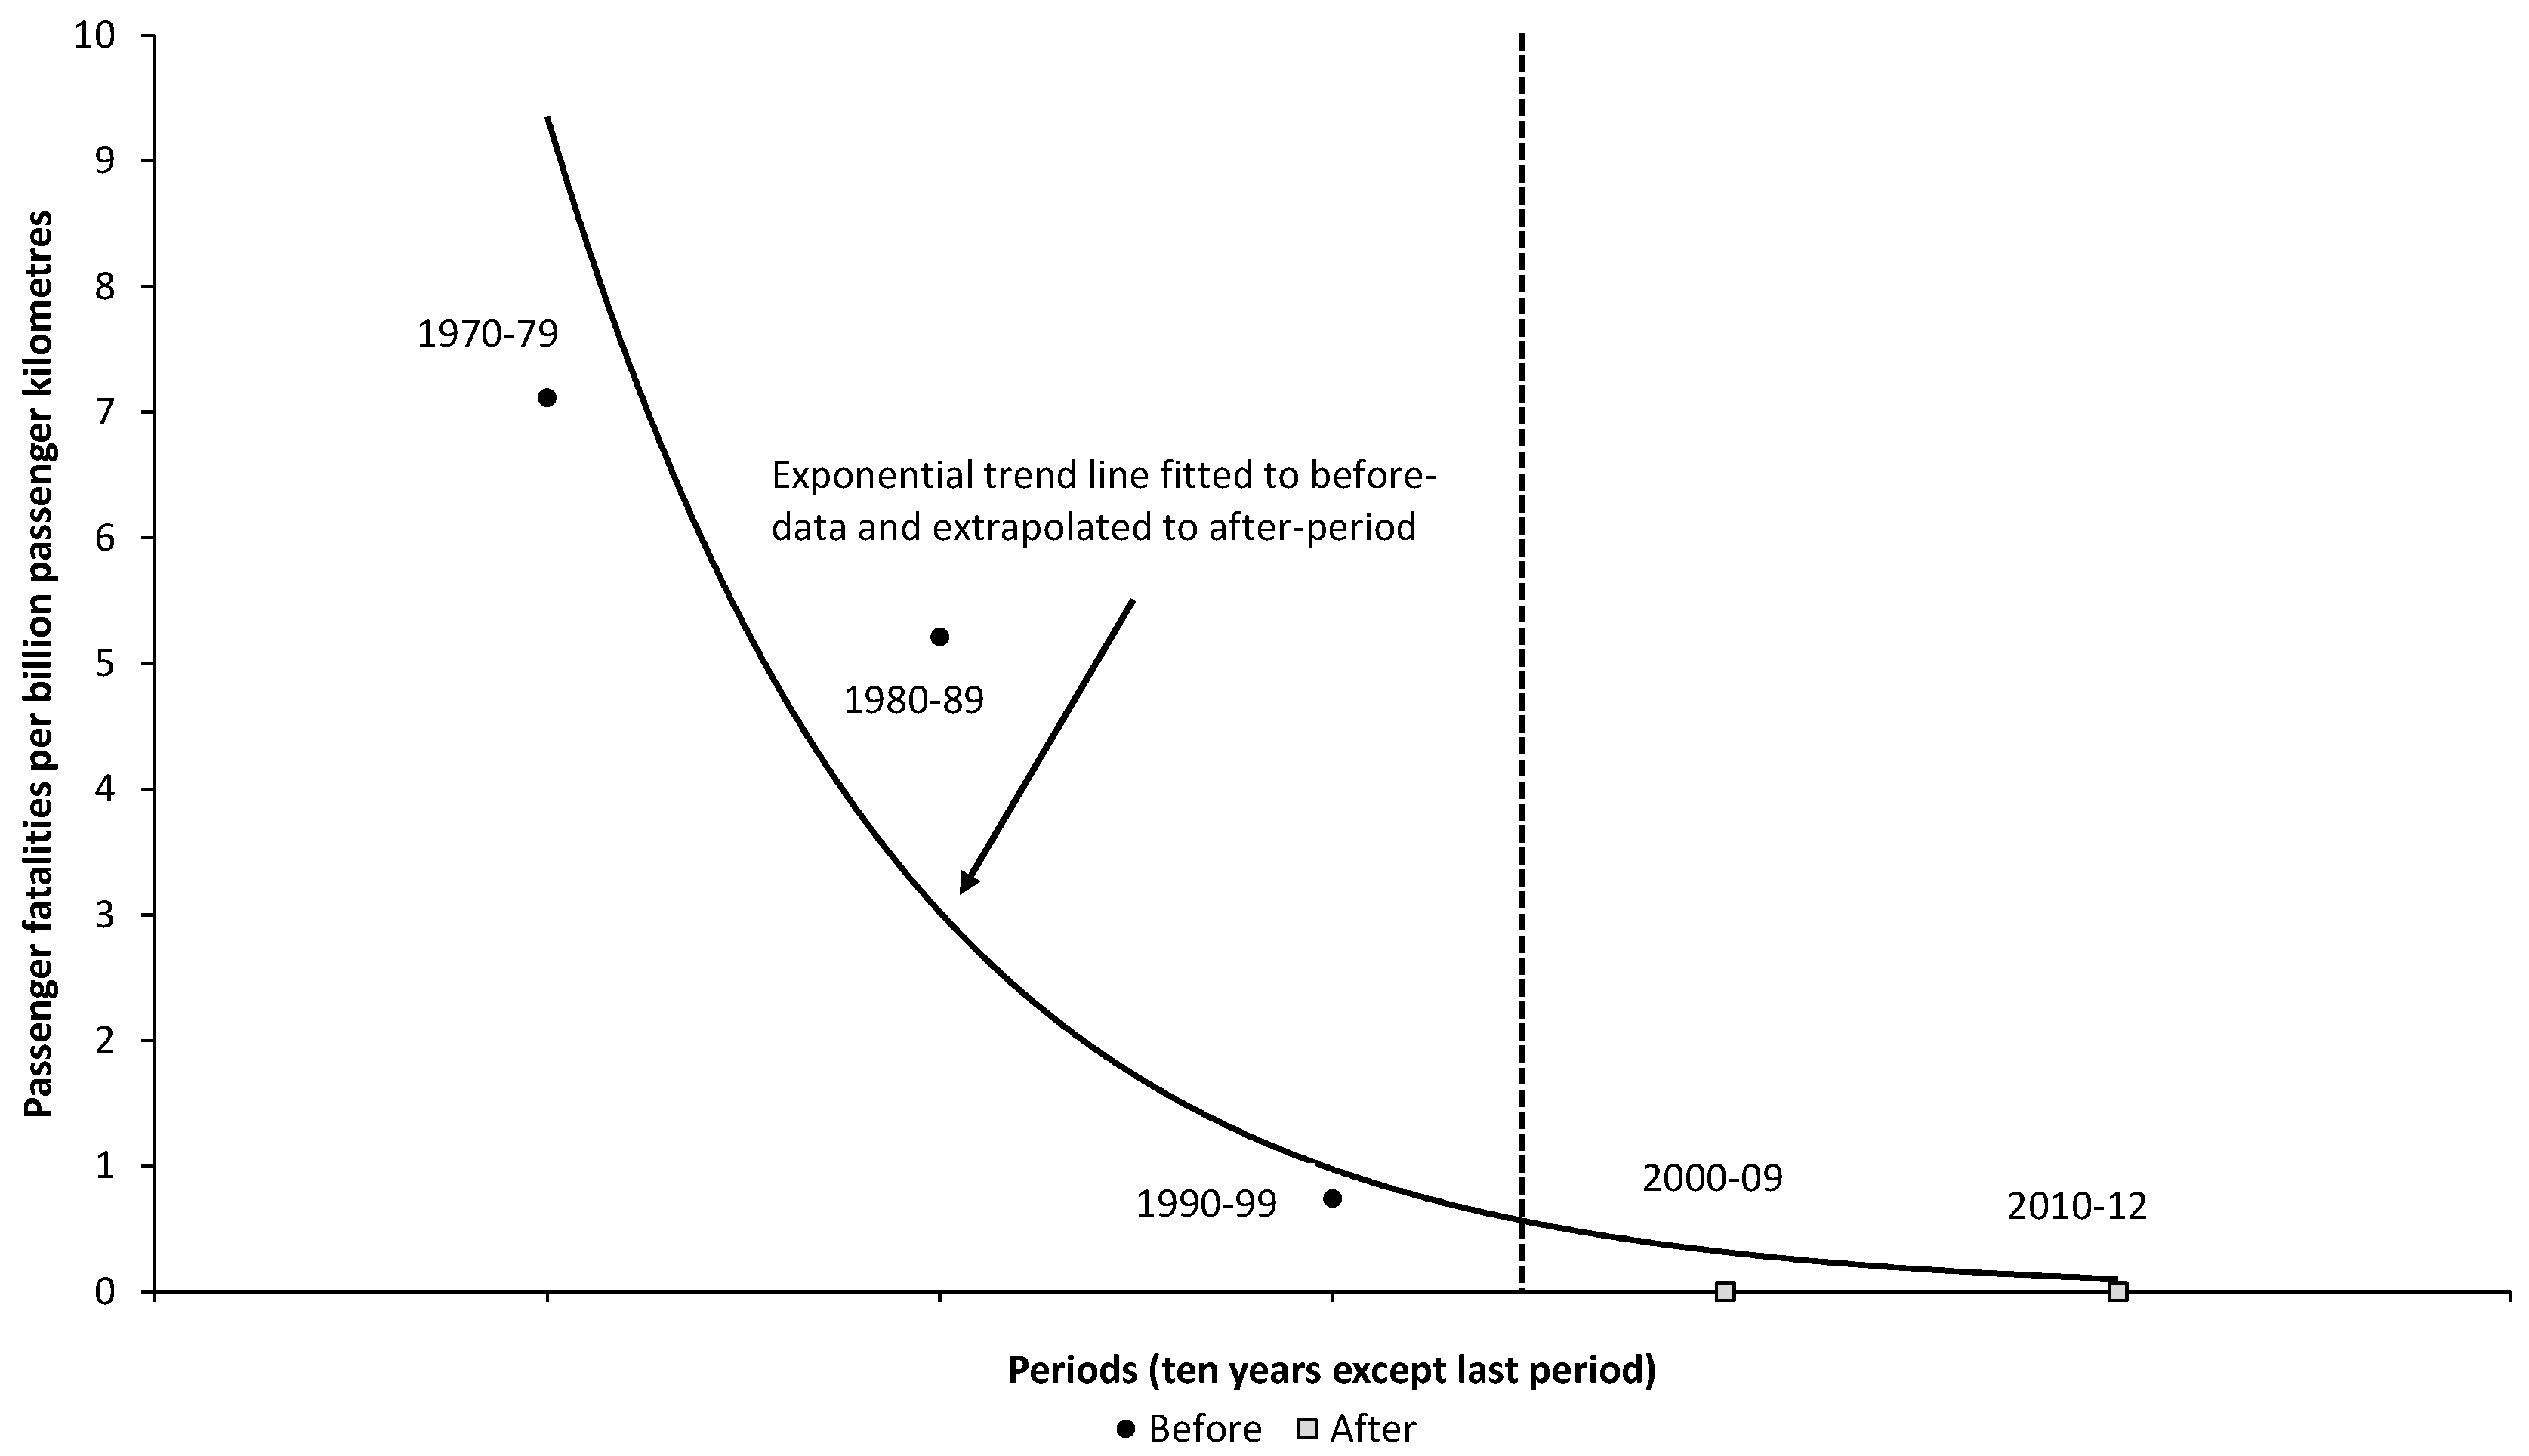
The number of passenger fatalities is low. Estimates of the long-term trend have therefore been based on periods of ten years (1970–79, 1980–89, and 1990–99). As shown in
Figure 2, the fatality rate declined sharply during this period, in particular in the third decade (1990–99). There have not been any passenger fatalities after 1997.
3.2. Railways
A comprehensive data set for railways was developed in a previous study [
11]. That data set ended in 2011 and data for the years 2012 and 2013 have been added. Two estimators of the long-term trends in safety have been developed:
The data that were used in the analyses are shown in
Table A3 and
Table A4 in the
Appendix to the paper.
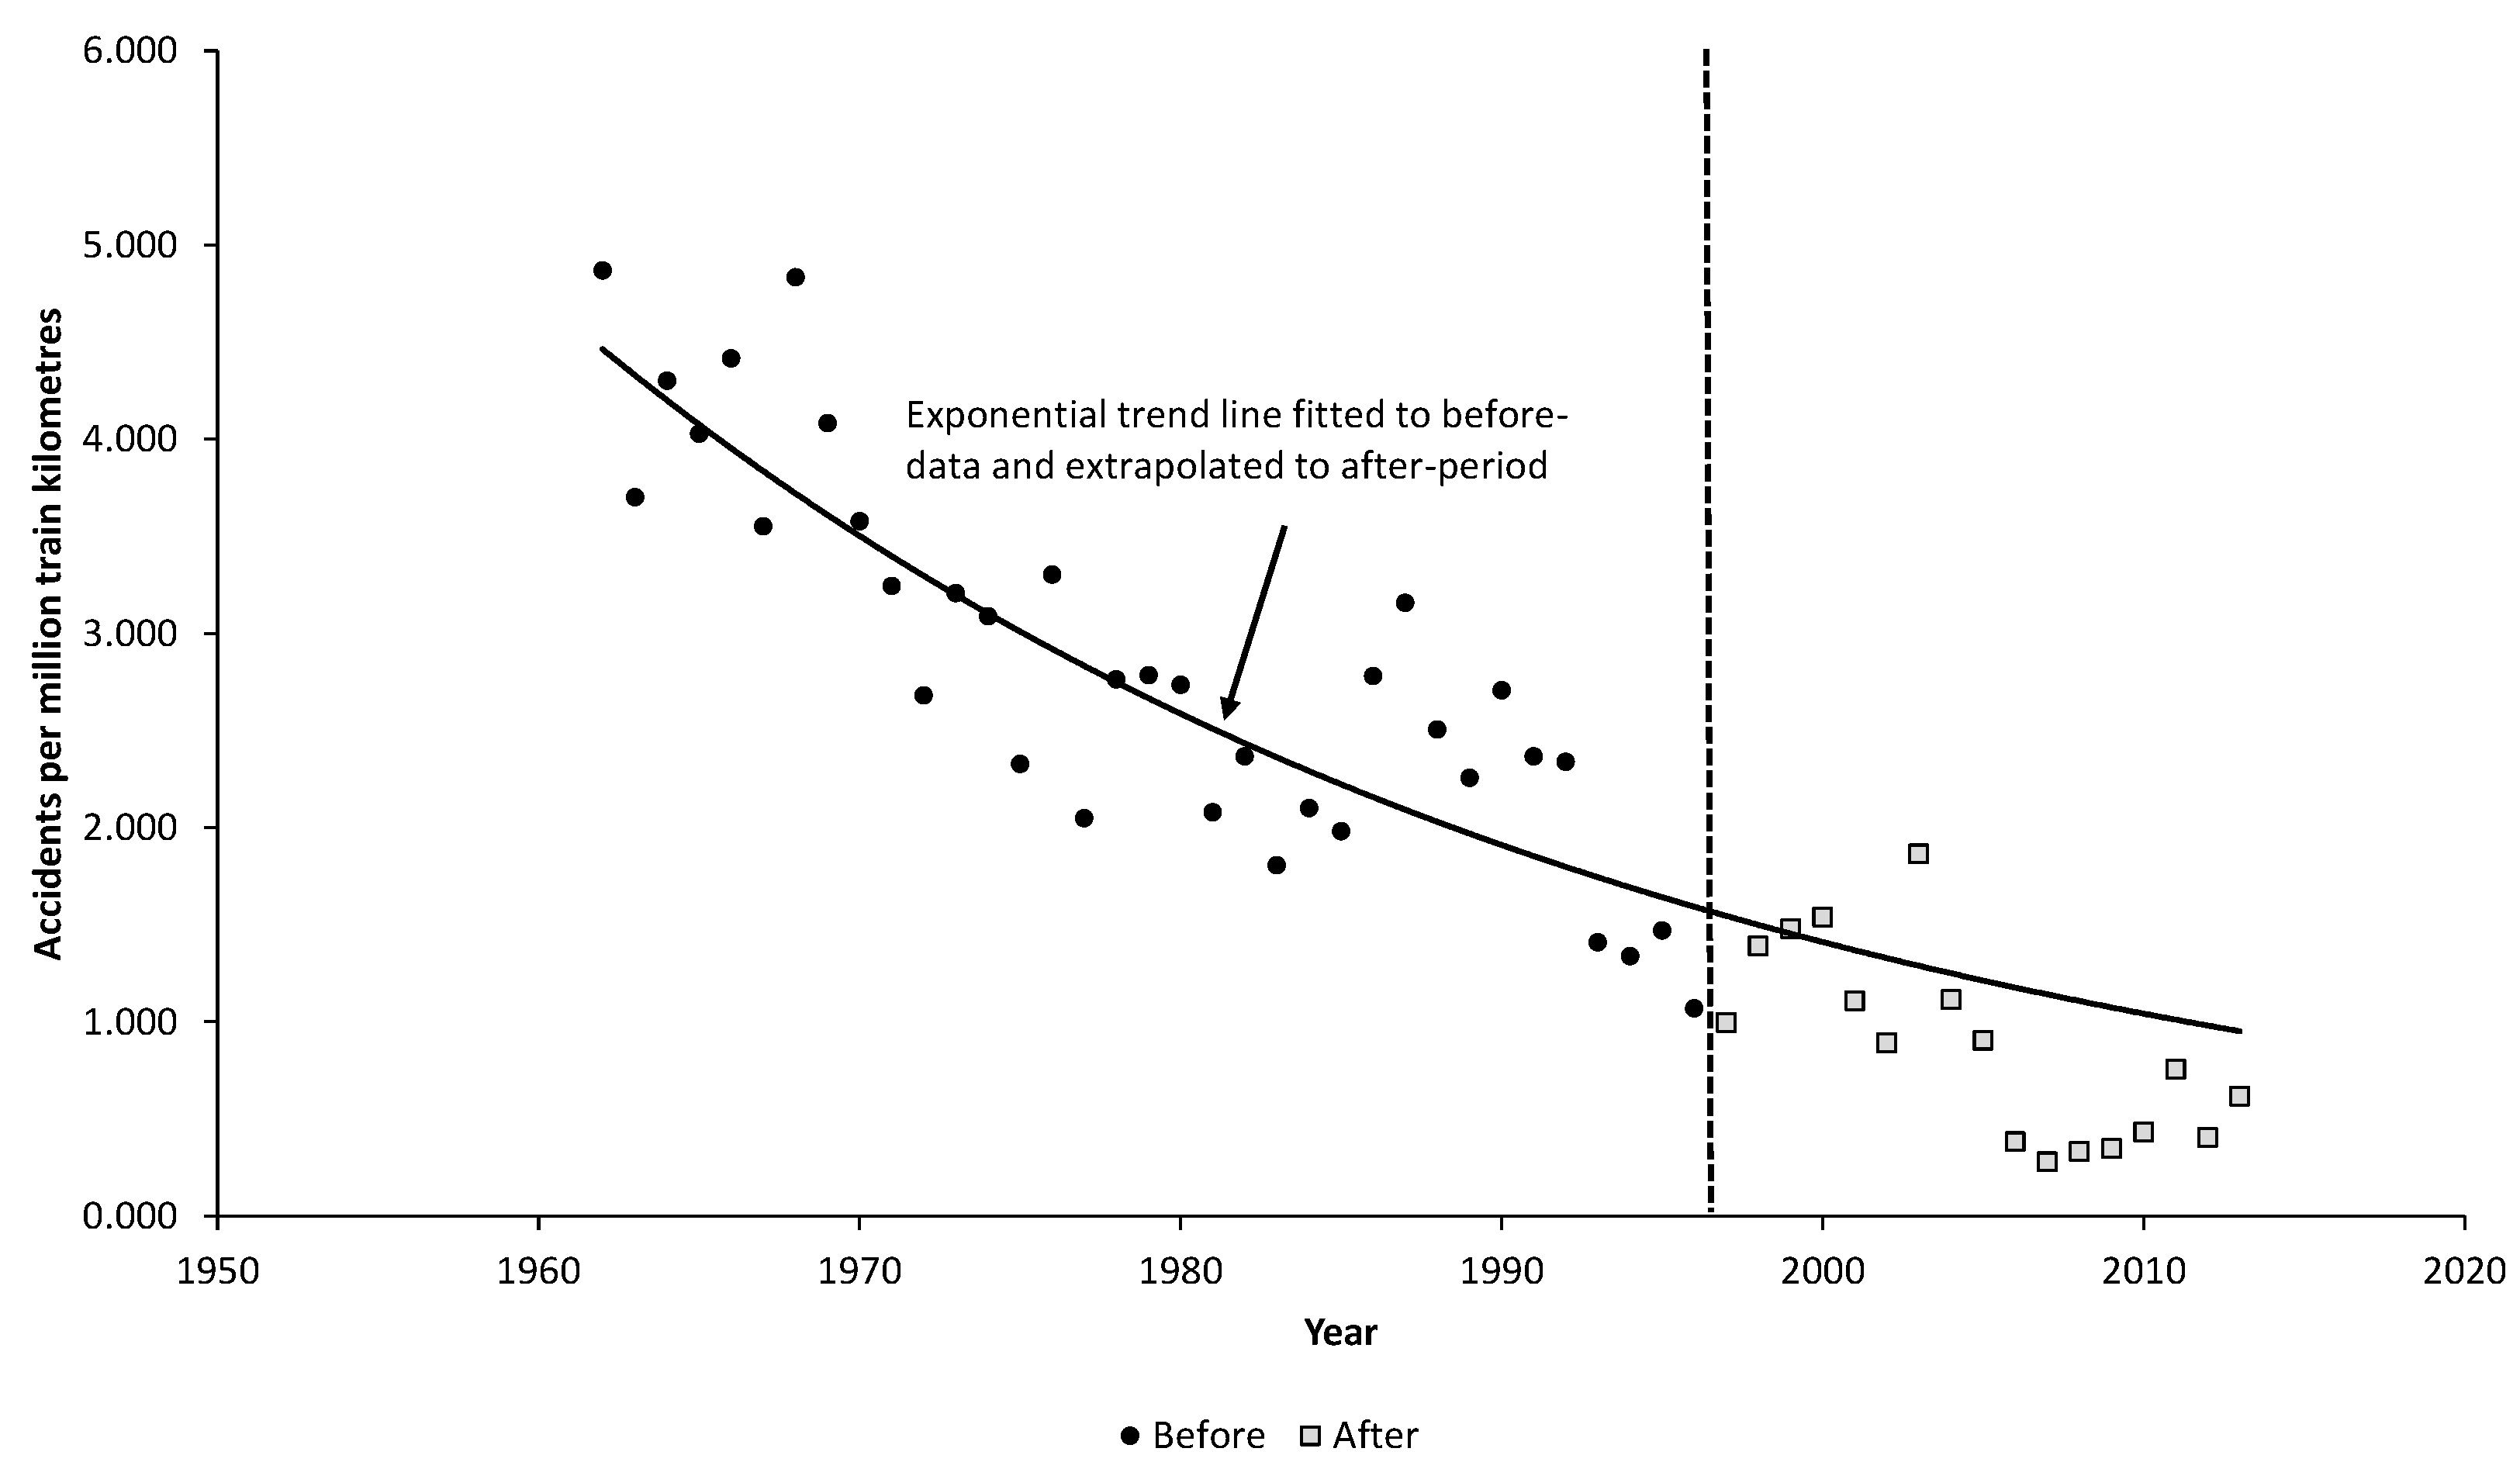
Figure 3 shows the trend in the first of these estimators. The trend line fits the data points quite well (
R2 = 0.713; no significant autocorrelation in residual terms). The four last data points in the before-period (1962–1996) are located below the trend line, but the extrapolation of the trend line passes through the data points in the after-period until 2004. All data points after 2004 are located below the extrapolated trend line.
Figure 4 shows the long-term trend in the passenger fatality rate. Passenger fatalities include all passengers on board a train as well as those who are boarding or alighting a train. Events where no train was involved are not included. Data have been aggregated into five-year periods. Even so, there is great variation. The period 1972–76 is an outlier, attributable to a large train accident in 1975 with 27 victims. The trend line passes close to the data points for the periods 1977–81, 1982–86, 1987–91, and 1992–96. The first data point in the after-period is again somewhat of an outlier (although not as extreme as the 1972–76 data point) due to a major accident in 2000 (16 passengers and three train staff were killed).
3.3. Statistical Analysis
The statistical analysis consisted of the following steps:
Using the trend lines, an expected number of accidents or fatalities was estimated for the after-period.
The standard error of the expected number of accidents was estimated.
The recorded number of accidents in the after-period was compared to the expected number.
The difference between the recorded and expected number of accidents and the standard error of the difference were determined.
These steps will be illustrated using aviation accidents as an example. The trend line was fitted by means of a function of the form:
where,
α is a constant term, e is the exponential function, and λ is a parameter showing the percentage change in accident rate from one period to the next. The period is one year in analyses relying on annual data, 10 years in the analysis of air passenger fatalities, and five years in the analysis of rail passenger fatalities. Years were numbered from 1 to n when fitting the function. For accidents in commercial civil aviation in Norway (
Figure 1), the parameter
λ was estimated to a value of −0.099 with a standard error of 0.011. Thus, for the first year in the after-period (year 31) , the expected number of accidents was estimated as the product of fitted accident rate (0.452 ∙ e
(31 ∙ −0.099)) and million flight kilometers flown that year (87.331):
The exponential function gives the expected accident rate. Multiplying this with million flight kilometers (87.331) gives the expected number of accidents. Similar estimates were made for each year in the after-period; these estimates were then summed in order to determine the total expected number of accidents. Using this method, the total expected number of accidents was determined to be 12.88. The standard error of this number was estimated as: 12.88 ∙ (0.011/0.099) = 1.43.
The recorded number of accidents in the after-period was 32. The recorded number of accidents was assumed to be Poisson-distributed. Hence, the standard error is the square root of the number, or 5.66. The difference between the recorded and expected number of accidents is 32 − 12.88 = 19.12. The standard error of this difference is equal to:
where SE is standard error; expected is the expected number of accidents; and recorded is the recorded number of accidents. In the numerical example, this becomes 5.83. The difference between the recorded and expected number of accidents is therefore statistically significant at the 5% level. The accident modification factor is estimated as 32/12.88 = 2.48. The standard error of the accident modification factor is:
where SE is standard error; expected is the expected number of accidents; and recorded is the recorded number of accidents. The standard error of the accident modification factor becomes 0.519 in the present numerical example.
4. Results
Results are presented in
Table 2. The results are somewhat mixed, in particular for aviation. For accidents, the accident modification factor suggests an increase of 148 percent. For passenger fatalities, the predicted number for the years 2000–2012 (thirteen years) is 14.8. The recorded number of fatalities was zero. Nominally, therefore, the number of passenger fatalities has been reduced by 100 percent. The standard error of the accident modification factor for fatalities (0.00) cannot be estimated.
It is unlikely that the long-term expected number of passenger fatalities in commercial aviation in Norway is zero. However, until the time of writing this paper (January 2016), no fatalities had been recorded after 1997. The largest number of fatalities ever recorded in an aviation accident in Norway was 55. Even if an accident involving this number of fatalities were to occur in the near future, the mean number of passenger fatalities per year for all years after 2000 (15 years) would be only 3.7. The annual mean number of passenger fatalities was 7.4 during 1970–79, 10.6 during 1980–89 and 2.6 during 1990–99. It is therefore likely that passenger safety has improved after 2000.
Results for railways are more consistent. The number of accidents was about 40 percent lower than predicted, if the trend before the safety inspectorate was created had continued. The reduction in the number of accidents was statistically highly significant. The number of fatalities was about 30 percent lower, but this decline was not statistically significant.
5. Discussion
The deregulation of transport that started around 1980 was intended to stimulate competition, in the belief that increased competition would lead to improved service and lower fares. This has certainly been the case for aviation in Norway. A new main airport opened in 1998. Initially, competition between airlines did not change much. In 2003, however, the airline Norwegian started a rapid growth of service and a fierce competition with the flag carrier, Scandinavian Airlines. Fares have been reduced and the number of flights and destinations served have increased.
There are, to be sure, worries about safety and about the working conditions of airline employees [
5]. As far as safety is concerned, these worries have so far proved groundless, at least if one judges safety in terms of accidents and fatalities. The analyses presented in this paper do not indicate that the creation of a safety inspectorate for aviation in 2000 has been associated with a reduction of the number of non-fatal accidents in scheduled and charter flights. One may wonder, however, if it really is possible to further reduce the number of accidents. The mean annual number of accidents in the thirteen years from 2000 to 2012 was 2.46. The annual recorded numbers varied between zero and five and did not differ significantly from a Poisson-distribution, suggesting that the accidents occur at random. All the accidents were property-damage-only accidents.
The fact that aviation accidents occur at random should not be taken to imply that they cannot be prevented. It is a misunderstanding to think that randomness in accident occurrence means that the accidents are unpreventable. Randomness over time simply means that the mean number of accidents has not changed during the study period. However, the mean number of accidents can often be reduced by introducing new technology or new procedures. It is, perhaps, more a matter of a lack of interest in trying to further improve safety if the number of accidents per years gets as low as two or three.
It is a fact that the Civil Aviation Authority has had a troubled history. When created in 2000, it was located in Oslo. In 2003, the government proposed to relocate it to the city of Bodø in northern Norway. This decision was very unpopular among employees of the authority and was resisted. In 2005, however, the government forced the director of the authority to resign and gave employees the choice between quitting or moving to Bodø. A very large number quit and new staff had to be hired after the agency opened its new main office in Bodø in 2008. This turbulence may have reduced the efficiency of the agency, although quantifying its efficiency is beyond the scope of this paper.
The railways in Norway are no longer a state monopoly, although competition is much more limited than in aviation. The National Rail Administration, created in 1996, initially had the same managing director as the state railway company. This arrangement ended in 1999. On 4 January 2000 a major train accident with 19 fatalities in total occurred. This lead to extensive investigations and, perhaps as an unintended by-product, made the Norwegian Railway Authority a key organization in matters related to safety. The relationship between the Railway Authority and the National Rail Administration was at first uneasy, but has gradually improved [
8]. It seems clear that railway safety has improved after the inspectorate was created, although claiming a causal relationship is not possible, based on the analyses reported in this paper.
The basic limitation of the analyses presented in this paper is the absence of a comparison group. Thus, the only manner in which the paper can answer the question ‘What would have happened if the safety inspectorates had not been created?’ is simply to assume that before-period trends in accident rates would have continued. While this is sometimes a quite reasonable assumption, there is no way of showing how reasonable it is. Clearly, it is never entirely satisfactory to rely on an assumption whose accuracy cannot be demonstrated.
6. Conclusions
The main results of the study presented in this paper can be summarized as follows:
Following the creation of a safety inspectorate for aviation in 2000, there have been no passenger fatalities in civil aviation in Norway. The number of accidents (all non-fatal) has varied between zero and five per year, which is higher than predicted according to the long-term trend before the safety inspectorate was established.
The number of railway accidents has been about 40 percent lower than predicted from trends before the National Railway Authority was established. The number of fatalities has been about 30 percent lower than predicted on the basis of prior trends.
The findings in this paper show statistical associations only and cannot be interpreted as causal relationships. However, a statistical relationship is generally regarded as a necessary condition for a causal relationship.
Acknowledgments
This research was funded by the Research Council of Norway.
Author Contributions
Rune Elvik designed the study and performed the statistical analyses. Beate Elvebakk collected data on safety inspectorates and described their function. Both authors contributed to writing the paper, with Elvik as principal author.
Conflicts of Interest
The funding agencies had no role in the design of the study; in the collection, analyses and interpretation of data; in the writing of the manuscript, and in the decision to publish the results.
Appendix: Data Used in the Study
The tables in this appendix list the data that were used in the analyses presented in the paper.
Table A1.
Total aircraft accidents in scheduled and charter operation per million flight kilometers.
Table A1.
Total aircraft accidents in scheduled and charter operation per million flight kilometers.
| Year | Before (0) or after (1) Safety Inspectorate | Number of Accidents | Million Flight Kilometers | Accidents per Million Flight Kilometer |
|---|
| 1970 | 0 | 13 | 18.250 | 0.712 |
| 1971 | 0 | 5 | 22.697 | 0.220 |
| 1972 | 0 | 15 | 23.963 | 0.626 |
| 1973 | 0 | 13 | 25.459 | 0.511 |
| 1974 | 0 | 3 | 25.813 | 0.116 |
| 1975 | 0 | 5 | 28.023 | 0.178 |
| 1976 | 0 | 4 | 31.466 | 0.127 |
| 1977 | 0 | 10 | 35.419 | 0.282 |
| 1978 | 0 | 7 | 39.308 | 0.178 |
| 1979 | 0 | 9 | 43.046 | 0.209 |
| 1980 | 0 | 4 | 44.221 | 0.090 |
| 1981 | 0 | 6 | 44.256 | 0.136 |
| 1982 | 0 | 13 | 47.235 | 0.275 |
| 1983 | 0 | 8 | 46.352 | 0.173 |
| 1984 | 0 | 3 | 47.448 | 0.063 |
| 1985 | 0 | 2 | 48.851 | 0.041 |
| 1986 | 0 | 9 | 61.733 | 0.146 |
| 1987 | 0 | 6 | 55.565 | 0.108 |
| 1988 | 0 | 3 | 61.869 | 0.048 |
| 1989 | 0 | 4 | 53.095 | 0.075 |
| 1990 | 0 | 4 | 57.343 | 0.070 |
| 1991 | 0 | 5 | 58.579 | 0.085 |
| 1992 | 0 | 1 | 60.403 | 0.017 |
| 1993 | 0 | 2 | 62.255 | 0.032 |
| 1994 | 0 | 3 | 66.493 | 0.045 |
| 1995 | 0 | 3 | 70.468 | 0.043 |
| 1996 | 0 | 2 | 73.482 | 0.027 |
| 1997 | 0 | 4 | 77.334 | 0.052 |
| 1998 | 0 | 1 | 82.138 | 0.012 |
| 1999 | 0 | 3 | 90.418 | 0.033 |
| 2000 | 1 | 5 | 87.331 | 0.057 |
| 2001 | 1 | 2 | 84.794 | 0.024 |
| 2002 | 1 | 0 | 75.131 | 0.000 |
| 2003 | 1 | 3 | 67.505 | 0.044 |
| 2004 | 1 | 1 | 74.989 | 0.013 |
| 2005 | 1 | 4 | 78.860 | 0.051 |
| 2006 | 1 | 2 | 80.484 | 0.025 |
| 2007 | 1 | 3 | 81.748 | 0.037 |
| 2008 | 1 | 3 | 80.554 | 0.037 |
| 2009 | 1 | 2 | 80.039 | 0.025 |
| 2010 | 1 | 3 | 80.630 | 0.037 |
| 2011 | 1 | 2 | 84.471 | 0.024 |
| 2012 | 1 | 2 | 84.781 | 0.024 |
Table A2.
Passenger fatalities per million passenger kilometers flown – by decades.
Table A2.
Passenger fatalities per million passenger kilometers flown – by decades.
| Years | Before (0) or after (1) Safety Inspectorate | Number of Fatalities | Million Passenger Kilometers | Accidents per Million Passenger Kilometer |
|---|
| 1970–1979 | 0 | 74 | 10.399 | 7.116 |
| 1980–1989 | 0 | 106 | 20.332 | 5.213 |
| 1990–1999 | 0 | 26 | 35.029 | 0.742 |
| 2000–2009 | 1 | 0 | 42.405 | 0.000 |
| 2010–2012 | 1 | 0 | 14.068 | 0.000 |
Table A3.
Total railway accidents per million train kilometer.
Table A3.
Total railway accidents per million train kilometer.
| Year | Before (0) or after (1) Safety Inspectorate | Number of Accidents | Million Train Kilometers | Accidents per Million Train Kilometer |
|---|
| 1962 | 0 | 169 | 34.703 | 4.870 |
| 1963 | 0 | 124 | 33.493 | 3.702 |
| 1964 | 0 | 147 | 34.164 | 4.303 |
| 1965 | 0 | 130 | 32.265 | 4.029 |
| 1966 | 0 | 144 | 32.598 | 4.417 |
| 1967 | 0 | 117 | 32.934 | 3.553 |
| 1968 | 0 | 160 | 33.093 | 4.835 |
| 1969 | 0 | 132 | 32.337 | 4.082 |
| 1970 | 0 | 115 | 32.131 | 3.579 |
| 1971 | 0 | 104 | 32.055 | 3.244 |
| 1972 | 0 | 85 | 31.708 | 2.681 |
| 1973 | 0 | 100 | 31.173 | 3.208 |
| 1974 | 0 | 100 | 32.369 | 3.089 |
| 1975 | 0 | 77 | 33.073 | 2.328 |
| 1976 | 0 | 112 | 33.912 | 3.303 |
| 1977 | 0 | 70 | 34.174 | 2.048 |
| 1978 | 0 | 94 | 34.022 | 2.763 |
| 1979 | 0 | 95 | 34.098 | 2.786 |
| 1980 | 0 | 95 | 34.733 | 2.735 |
| 1981 | 0 | 72 | 34.610 | 2.080 |
| 1982 | 0 | 81 | 34.206 | 2.368 |
| 1983 | 0 | 60 | 33.210 | 1.807 |
| 1984 | 0 | 69 | 32.837 | 2.101 |
| 1985 | 0 | 65 | 32.794 | 1.982 |
| 1986 | 0 | 93 | 33.441 | 2.781 |
| 1987 | 0 | 104 | 32.939 | 3.157 |
| 1988 | 0 | 79 | 31.535 | 2.505 |
| 1989 | 0 | 70 | 31.022 | 2.256 |
| 1990 | 0 | 88 | 32.504 | 2.707 |
| 1991 | 0 | 79 | 33.358 | 2.368 |
| 1992 | 0 | 80 | 34.208 | 2.339 |
| 1993 | 0 | 49 | 34.754 | 1.410 |
| 1994 | 0 | 50 | 37.342 | 1.339 |
| 1995 | 0 | 54 | 36.712 | 1.471 |
| 1996 | 0 | 40 | 37.364 | 1.071 |
| 1997 | 1 | 37 | 37.103 | 0.997 |
| 1998 | 1 | 52 | 37.417 | 1.390 |
| 1999 | 1 | 56 | 37.871 | 1.479 |
| 2000 | 1 | 59 | 38.325 | 1.539 |
| 2001 | 1 | 43 | 38.779 | 1.109 |
| 2002 | 1 | 35 | 39.223 | 0.892 |
| 2003 | 1 | 74 | 39.686 | 1.865 |
| 2004 | 1 | 46 | 41.217 | 1.116 |
| 2005 | 1 | 37 | 40.853 | 0.906 |
| 2006 | 1 | 16 | 41.828 | 0.383 |
| 2007 | 1 | 12 | 42.904 | 0.280 |
| 2008 | 1 | 14 | 42.025 | 0.333 |
| 2009 | 1 | 15 | 43.064 | 0.348 |
| 2010 | 1 | 20 | 46.097 | 0.434 |
| 2011 | 1 | 35 | 46.306 | 0.756 |
| 2012 | 1 | 19 | 46.765 | 0.406 |
| 2013 | 1 | 30 | 48.518 | 0.618 |
Table A4.
Passenger fatalities per million passenger kilometers in trains—by five-year periods.
Table A4.
Passenger fatalities per million passenger kilometers in trains—by five-year periods.
| Years | Before (0) or after (1) Safety Inspectorate | Number of Fatalities | Million Passenger Kilometers | Fatalities per Billion Passenger Kilometer |
|---|
| 1962–1966 | 0 | 9 | 8.740 | 1.030 |
| 1967–1971 | 0 | 6 | 8.070 | 0.743 |
| 1972–1976 | 0 | 40 | 9.006 | 4.441 |
| 1977–1981 | 0 | 11 | 11.169 | 0.985 |
| 1982–1986 | 0 | 8 | 11.035 | 0.725 |
| 1987–1991 | 0 | 8 | 10.698 | 0.748 |
| 1992–1996 | 0 | 7 | 11.676 | 0.600 |
| 1997–2001 | 1 | 16 | 13.779 | 1.161 |
| 2002–2006 | 1 | 2 | 13.278 | 0.151 |
| 2007–2011 | 1 | 0 | 15.306 | 0.000 |
| 2012–2013 | 1 | 0 | 6.337 | 0.000 |
References
- Elvik, R. Economic deregulation and transport safety: A synthesis of evidence from evaluation studies. Accid. Anal. Prev. 2006, 38, 678–686. [Google Scholar] [CrossRef] [PubMed]
- Moore, T.G. The myth of deregulation’s negative effect on safety. In Transportation Safety in an Age of Deregulation; Moses, L.N., Savage, I., Eds.; Oxford University Press: New York, NY, USA, 1989; pp. 8–20. [Google Scholar]
- Nance, J.J. Economic deregulation’s unintended but inevitable impact on airline safety. In Transportation Safety in an Age of Deregulation; Moses, L.N., Savage, I., Eds.; Oxford University Press: New York, NY, USA, 1989; pp. 186–205. [Google Scholar]
- Wolmar, C. On the Wrong Line. How Ideology and Incompetence Wrecked Britain’s Railways; Aurum Press: London, UK, 2005. [Google Scholar]
- Hagesæther, P.V. Fritt fall. På jobb i lufta til lavpris; Pax forlag: Oslo, Norway, 2014. [Google Scholar]
- Evans, A. Rail safety and rail privatisation in Britain. Accid. Anal. Prev. 2007, 39, 510–523. [Google Scholar] [CrossRef] [PubMed]
- Evans, A. Rail safety and rail privatisation in Japan. Accid. Anal. Prev. 2010, 42, 1296–1301. [Google Scholar] [CrossRef] [PubMed]
- Elvebakk, B. Between Control and Collaboration: Transport Safety Inspectorates in Norway; Report 1404; Institute of Transport Economics: Oslo, Norway, 2015. [Google Scholar]
- Hedlund, F.H. The relationship between the implementation of voluntary Five-Star occupational health and safety management system and the incidence of fatal and permanently disabling injury. Saf. Sci. 2014, 63, 94–103. [Google Scholar] [CrossRef]
- Mooren, L.; Grzebieta, R.; Williamson, A.; Olivier, J.; Friswell, R. Safety management for heavy vehicle transport: A review of the literature. Saf. Sci. 2014, 62, 79–89. [Google Scholar] [CrossRef]
- Elvik, R.; Voll, N.G. Challenges of improving safety in very safe transport systems. Saf. Sci. 2014, 63, 115–123. [Google Scholar] [CrossRef]
© 2016 by the authors; licensee MDPI, Basel, Switzerland. This article is an open access article distributed under the terms and conditions of the Creative Commons Attribution (CC-BY) license (http://creativecommons.org/licenses/by/4.0/).


