Article

Performance of the Commercial PP/ZnS:Cu and PP/ZnS:Ag Scintillation Screens for Fast Neutron Imaging

by
Malgorzata G. Makowska
1,2,*,
Bernhard Walfort
3,
Albert Zeller
3,
Christian Grünzweig
4 and
Thomas Bücherl
5
1
Heinz Maier-Leibnitz Zentrum (MLZ), Technische Universität München, Lichtenbergstr. 1, 85748 Garching, Germany
2
Bavarian Research Institute of Experimental Geochemistry and Geophysics (BGI), University of Bayreuth, 95440 Bayreuth, Germany
3
RC Tritec AG/LumiNova AG, Speicherstrasse 60 a, CH-9053 Teufen, Switzerland
4
Laboratory for Neutron Scattering and Imaging (LNS), Paul Scherrer Institut, WBBA 108, CH-5232 Villigen, Switzerland
5
ZTWB Radiochemie München, Technische Universität München, Lichtenbergstr. Walther-Meißner-Str. 3, 85748 Garching, Germany
*
Author to whom correspondence should be addressed.
J. Imaging 2017, 3(4), 60; https://doi.org/10.3390/jimaging3040060
Submission received: 31 October 2017 / Revised: 1 December 2017 / Accepted: 7 December 2017 / Published: 10 December 2017
(This article belongs to the Special Issue Neutron Imaging)

Abstract

:
Fast neutron imaging has a great potential as a nondestructive technique for testing large objects. The main factor limiting applications of this technique is detection technology, offering relatively poor spatial resolution of images and low detection efficiency, which results in very long exposure times. Therefore, research on development of scintillators for fast neutron imaging is of high importance. A comparison of the light output, gamma radiation sensitivity and spatial resolution of commercially available scintillator screens composed of PP/ZnS:Cu and PP/ZnS:Ag of different thicknesses are presented. The scintillators were provided by RC Tritec AG company and the test performed at the NECTAR facility located at the FRM II nuclear research reactor. It was shown that light output increases and the spatial resolution decreases with the scintillator thickness. Both compositions of the scintillating material provide similar light output, while the gamma sensitivity of PP/ZnS:Cu is significantly higher as compared to PP/ZnS:Ag-based scintillators. Moreover, we report which factors should be considered when choosing a scintillator and what are the limitations of the investigated types of scintillators.

1. Introduction

Neutron imaging is a rapidly developing technique in non-destructive testing. At various large-scale neutron sources, neutron imaging beamlines are available for users offering cold or thermal neutron radiography and tomography. The most advanced imaging instruments ICON [1], CONRAD-2 [2], ANTARES [3], NIST Neutron Imaging Facility [4] and DINGO [5] are located at continuous neutron sources, the relatively new instruments, RADEN [6], IMAT [7] and soon available VENUS [8] and ODIN [9] at pulsed neutron sources. In contrast, there is only one beamline offering fission neutron 2D and 3D imaging in an official user program: the NECTAR (NEutron Computed Tomography And Radiography) facility, an instrument located at the FRM II research reactor at MLZ [10]. Currently, an upgrade of the facility is being conducted aiming to enable usage of both fission and thermal spectra [11], which will give the unique possibility of combining thermal and fission neutron imaging on the same instrument even without moving the sample. The scheme of the current setup of the NECTAR instrument is presented in the Figure 1.
The larger interest in thermal and cold neutron imaging is mainly due to larger fields of applications related especially to the variety of techniques utilizing cold neutrons, e.g., radiography, tomography, energy resolved neutron imaging, dark field contrast and phase contrast imaging, and polarized neutron imaging [12,13]. On the other hand, these fields of applications are so broad also due to cold neutron detection technology, where the detection efficiency is tremendously higher and offers much higher spatial resolution as compared to the fission neutron imaging. The possibilities and applications of fission and fast neutron imaging are still very limited. This technique keeps gaining increasing interest due to the availability of small accelerator-based or D-D, D-T neutron generators providing acceptable neutron fluxes [14,15,16,17]. Therefore, there is a growing demand for development of fast neutron imaging technologies and, in particular, fast neutron detection.
Detection technology for neutron imaging has been rapidly developing in the last decades and different technologies are applied. The most common standard detector system is based on scintillator screens converting neutron radiation into electromagnetic radiation in the visible wavelength range, combined with a highly light sensitive CCD or CMOS camera acquiring light images. Such a system is additionally equipped with an optical lens system for focusing and adjusting the size of the field of view (FOV) and with mirrors preventing placing a camera directly in the neutron beam [18,19,20]. Detector technology of this type is well established and “ready to use” setups are already commercially available. The scintillators for thermal and cold neutron imaging are typically based on two main components: absorber and a luminescent material. The most common types are based on 6LiF/ZnS:Cu or 6LiF/ZnS:Ag and Gadox (Gd2O2S:Tb) materials [21]. The light emission from the scintillator screens based on lithium fluoride and zinc sulfide activated with silver occurs in two steps: incoming neutrons are absorbed by 6Li-nuclei followed by emission of α and T (3H) particles. Zinc sulfide is a well-known inorganic phosphor and the energy of the product particles (α and T) transferred to the zinc sulfide particles leads to scintillation events. Image spatial resolution depends on the scintillator thickness and as a very rough approximation, the spatial resolution is comparable to the scintillator thickness. On the other hand, decreasing thickness lowers the number of the captured neutrons, resulting in longer exposure times. Thus, the thickness of the scintillator is always a compromise between detection efficiency and spatial resolution. Typical thicknesses of 6LiF/ZnS:Cu scintillators are in the range of 50–300 µm. For high resolution imaging, Gadox scintillators ranging from 5 µm to about 40 µm are used.
There are several technologies proposed for fast neutron imaging detectors reported in literature. A very interesting and promising alternative for using scintillator–camera-based systems are the detectors based on THick gaseous electron multiplier (THGEM) demonstrated in [21,22,23].
The detector setup implemented at the NECTAR facility is analogous to the above-described system for cold and thermal neutron imaging combining a scintillator and a CCD camera, but the scintillator screen must be optimized for fission neutron detection.
The mean energy of the fission neutron spectrum is about 1.9 MeV and these high energies result in a significantly larger penetration depth in materials. Furthermore, the cross sections for nuclear reactions are extremely low. Thus, the scintillator screens must be correspondingly thicker. Moreover, the attenuation coefficients of fission neutrons exhibit different dependence on the atomic number as compared to thermal neutrons. Consequently, different materials must be used for converting fission neutrons in visible light. Different types of scintillators for fast neutrons are investigated and proposed in the literature, e.g., plastic fiber screens used in [24,25], wavelength-shifting fiber (WSF) converters [26,27] and others [28]. This work focuses on the results of a characterization of different screens based on polypropylene (PP) mixed with zinc sulfide (ZnS) phosphor rather than on alternative detection systems [20,22].
The scintillation in such composites is a two-step process. Fission neutrons induce proton recoil in PP, followed by the transfer of the recoil proton energy to the luminescent material. This energy is utilized for generating excited states in ZnS by transferring electrons from the valence band to the conduction band. In case of excitation with high energy particles, the electrons from deeper shells are excited (as compared to excitation by lower energy particles). Doping ZnS with Cu or Ag atoms creates acceptor levels in the bandgap, which can be occupied by the excited electrons. In Phosphors, such dopants are called activators. Transfer of the excited electrons to the free acceptor levels is accompanied by photon emission. The wavelength of the emitted photons depends on the difference between the ZnS conduction band and the energy level introduced by the activator atoms. Thus, by selecting an appropriate dopant element, the spectrum of the emitted light can be tuned to the desired wavelength [29].
Versatile scintillator screens for fast neutron imaging, among others, have been studied before in order to find an optimum screen thickness and composition. It has been demonstrated that depending on the screen type and application (aiming either for better detection efficiency or spatial resolution), the thickness should be in the range of 1.5–3 mm [28,30]. In this paper, the performance of commercial scintillator screens for fission neutrons produced by RC Tritec AG company [31] is reported.

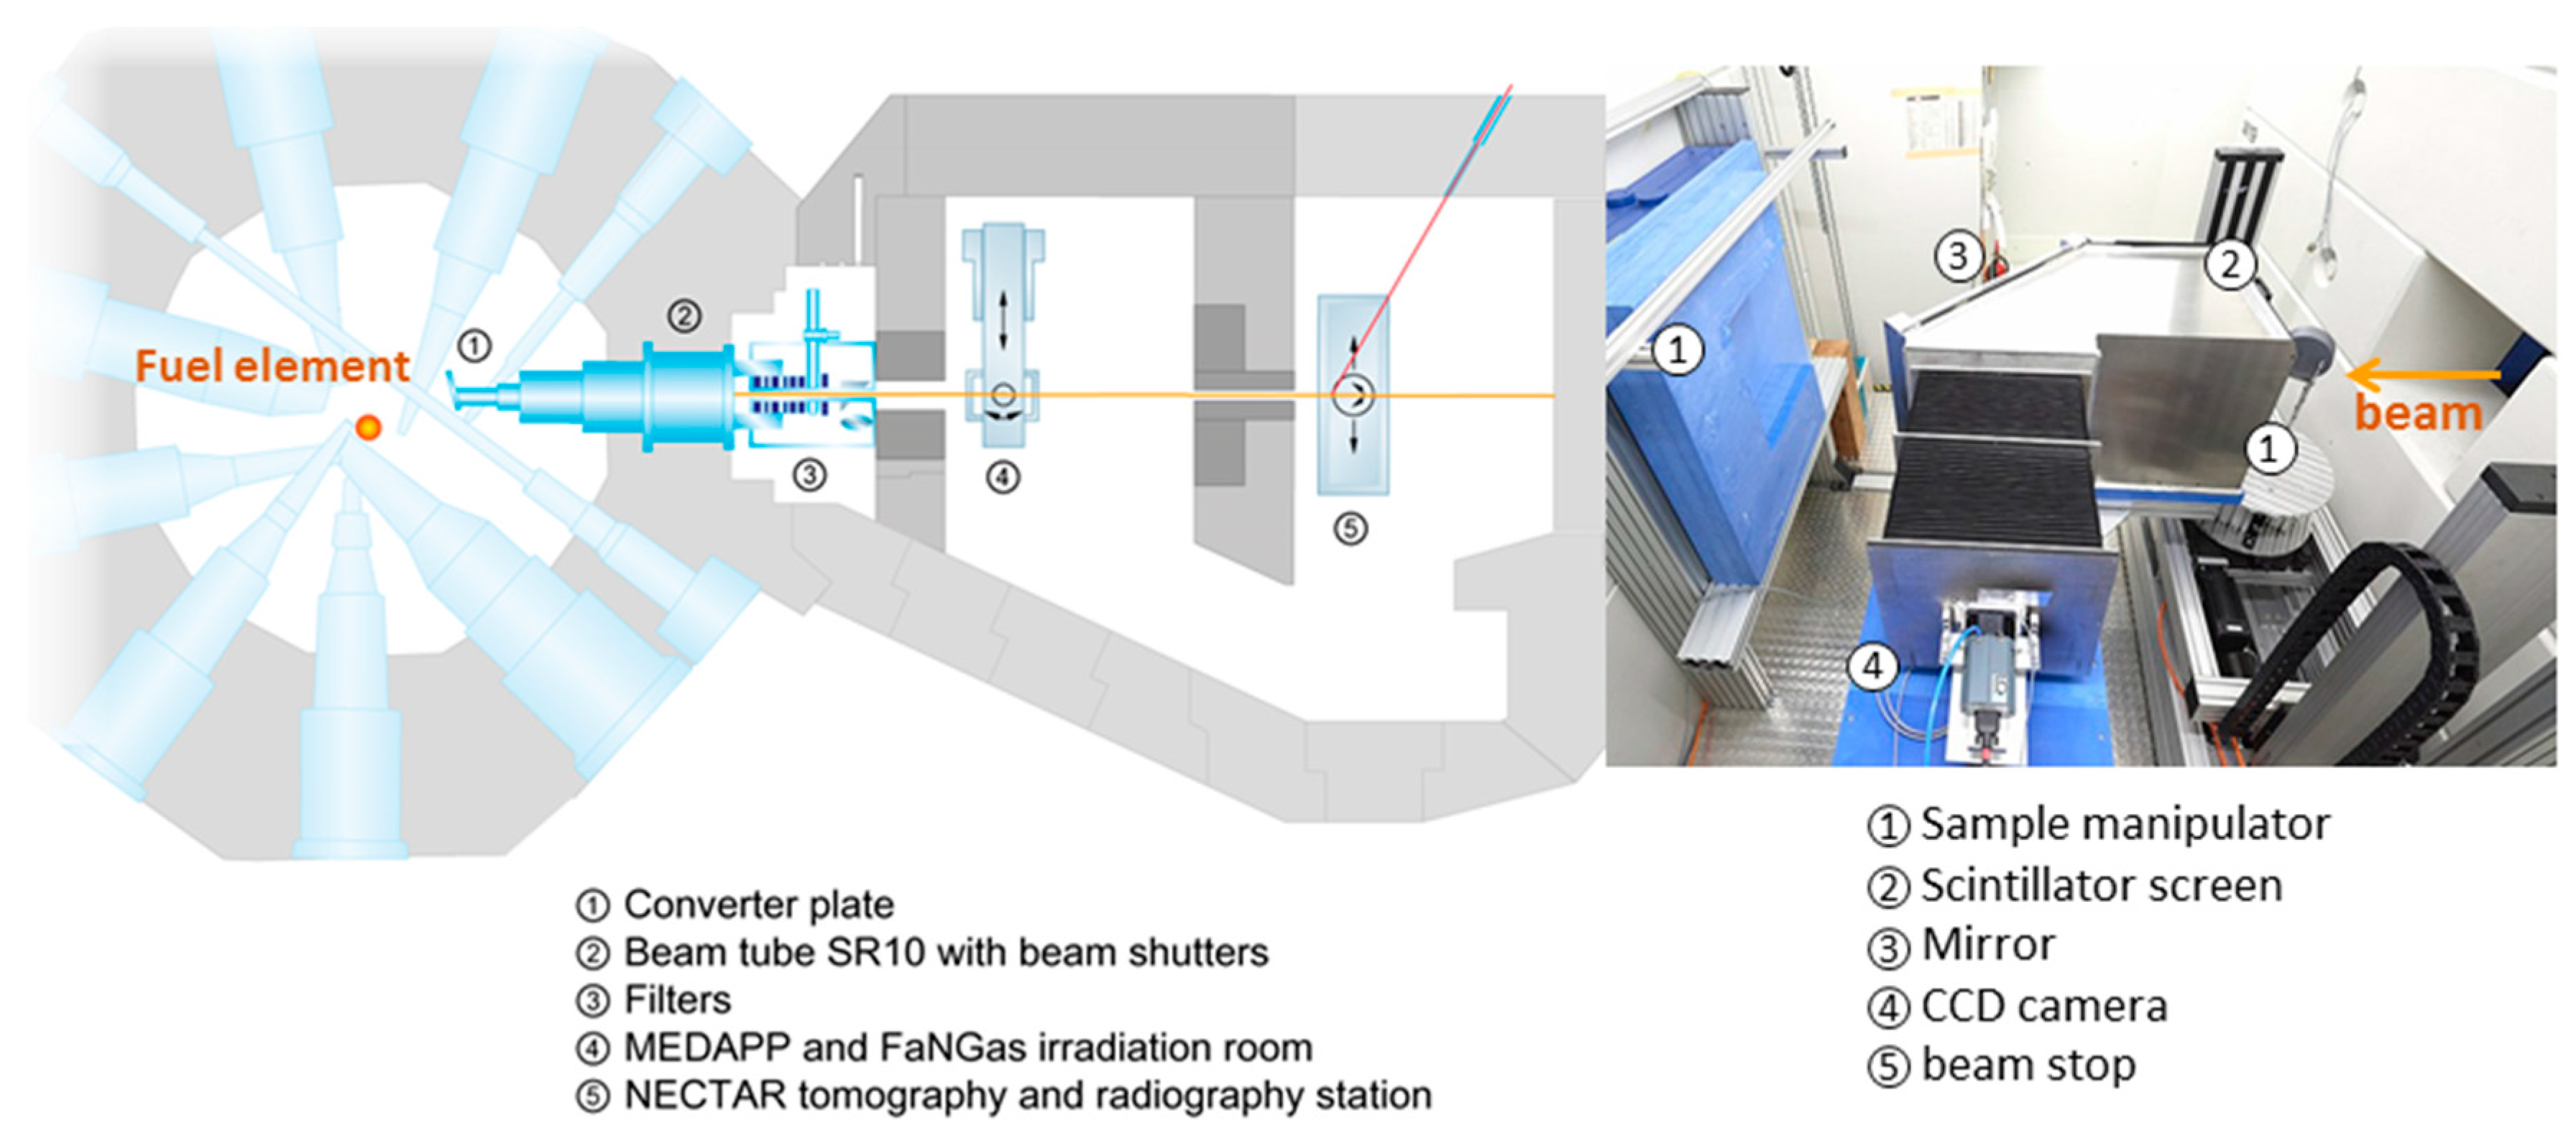
2. Materials and Methods

Within this study, eight scintillator screens composed of polypropylene ((C3H6)n) with 30% of ZnS activated with Ag or Cu of different thicknesses (1.5 mm, 2.0 mm, 2.4 mm, 3.0 mm) provided by RC Tritec AG have been characterized in terms of light output, gamma radiation sensitivity and spatial resolution.
The testing of the scintillator screens was performed at the NECTAR facility utilizing its fission neutron beam, which is provided by the so-called converter facility installed at FRM II nuclear fission reactor. Neutrons produced in the reactor core travel through the heavy water moderator and reach the SR10 beam tube window in their thermal energy state. The fission neutron spectrum with its mean energy at about 1.9 MeV is obtained by moving converter plates in front of the entrance window of the beam tube. Full energy spectrum of the beam available at NECTAR was presented elsewhere [32]. The plates consist of 2 slabs of highly enriched uranium (93% 235U)-silicide with a total weight of 540 g. During reactor operation they act as a secondary neutron source. The incoming thermal neutrons cause fission reactions in the converter plates, producing fission neutrons, which enter the beam tube without any further moderation. Via the fission reaction of enriched uranium, besides fission neutron beam, a significant amount of gamma radiation is produced. During one fission reaction of 235U approximately 2.44 neutrons and 6.6 gamma photons are produced on average.
At NECTAR, there are two permanently installed filters made of 10 mm B4C and 10 mm lead, suppressing the thermal neutron contribution and reducing the gamma radiation, respectively. Additional Pb and PE (polyethylene) filters of different thicknesses can be applied. It has been demonstrated that while using an additional Pb filter of 25 mm thickness, the fluxes of fission neutron and gamma radiation are of the same order of magnitude of 107 cm−2s−1 [33]. Therefore, for fission neutron imaging experiments, implementing thicker lead filters is required to suppress the gamma radiation.
The L/D collimation ratio used during the experiments was about 130, which is a measured value [32]. Additionally, to the 10 mm thick permanent Pb filter, different thicknesses of Pb in the range of 0–125 mm were used in the measurements of the gamma sensitivity of the investigated screens. For the light output measurements, as well as for the spatial resolution comparison, an additional Pb filter of 100 mm was applied (based on previous experience, about 100 mm lead is required to decrease gamma flux contributions to negligible amounts).
The used detector setup at NECTAR, besides a scintillator screen, consists of one mirror, a lens system and a CCD ANDOR camera iKon-L BV (ANDOR, Belfast, UK) cooled down to −100 °C [34]. This camera type has 2048 × 2048 pixels of size 13.5 μm × 13.5 μm and an image area 27.6 mm × 27.6 mm. The field of view during the measurements was set to about 330 mm × 330 mm, resulting in an image pixel size of about 161 µm.
The studied scintillator screens exhibit significant light sensitivity and afterglow effects, which are especially well known for Cu-activated ZnS phosphors. Therefore, all screens were kept in the dark before and during testing. Moreover, they were covered with a 1.5 mm Al plate when integrated in the detector setup.

3. Results

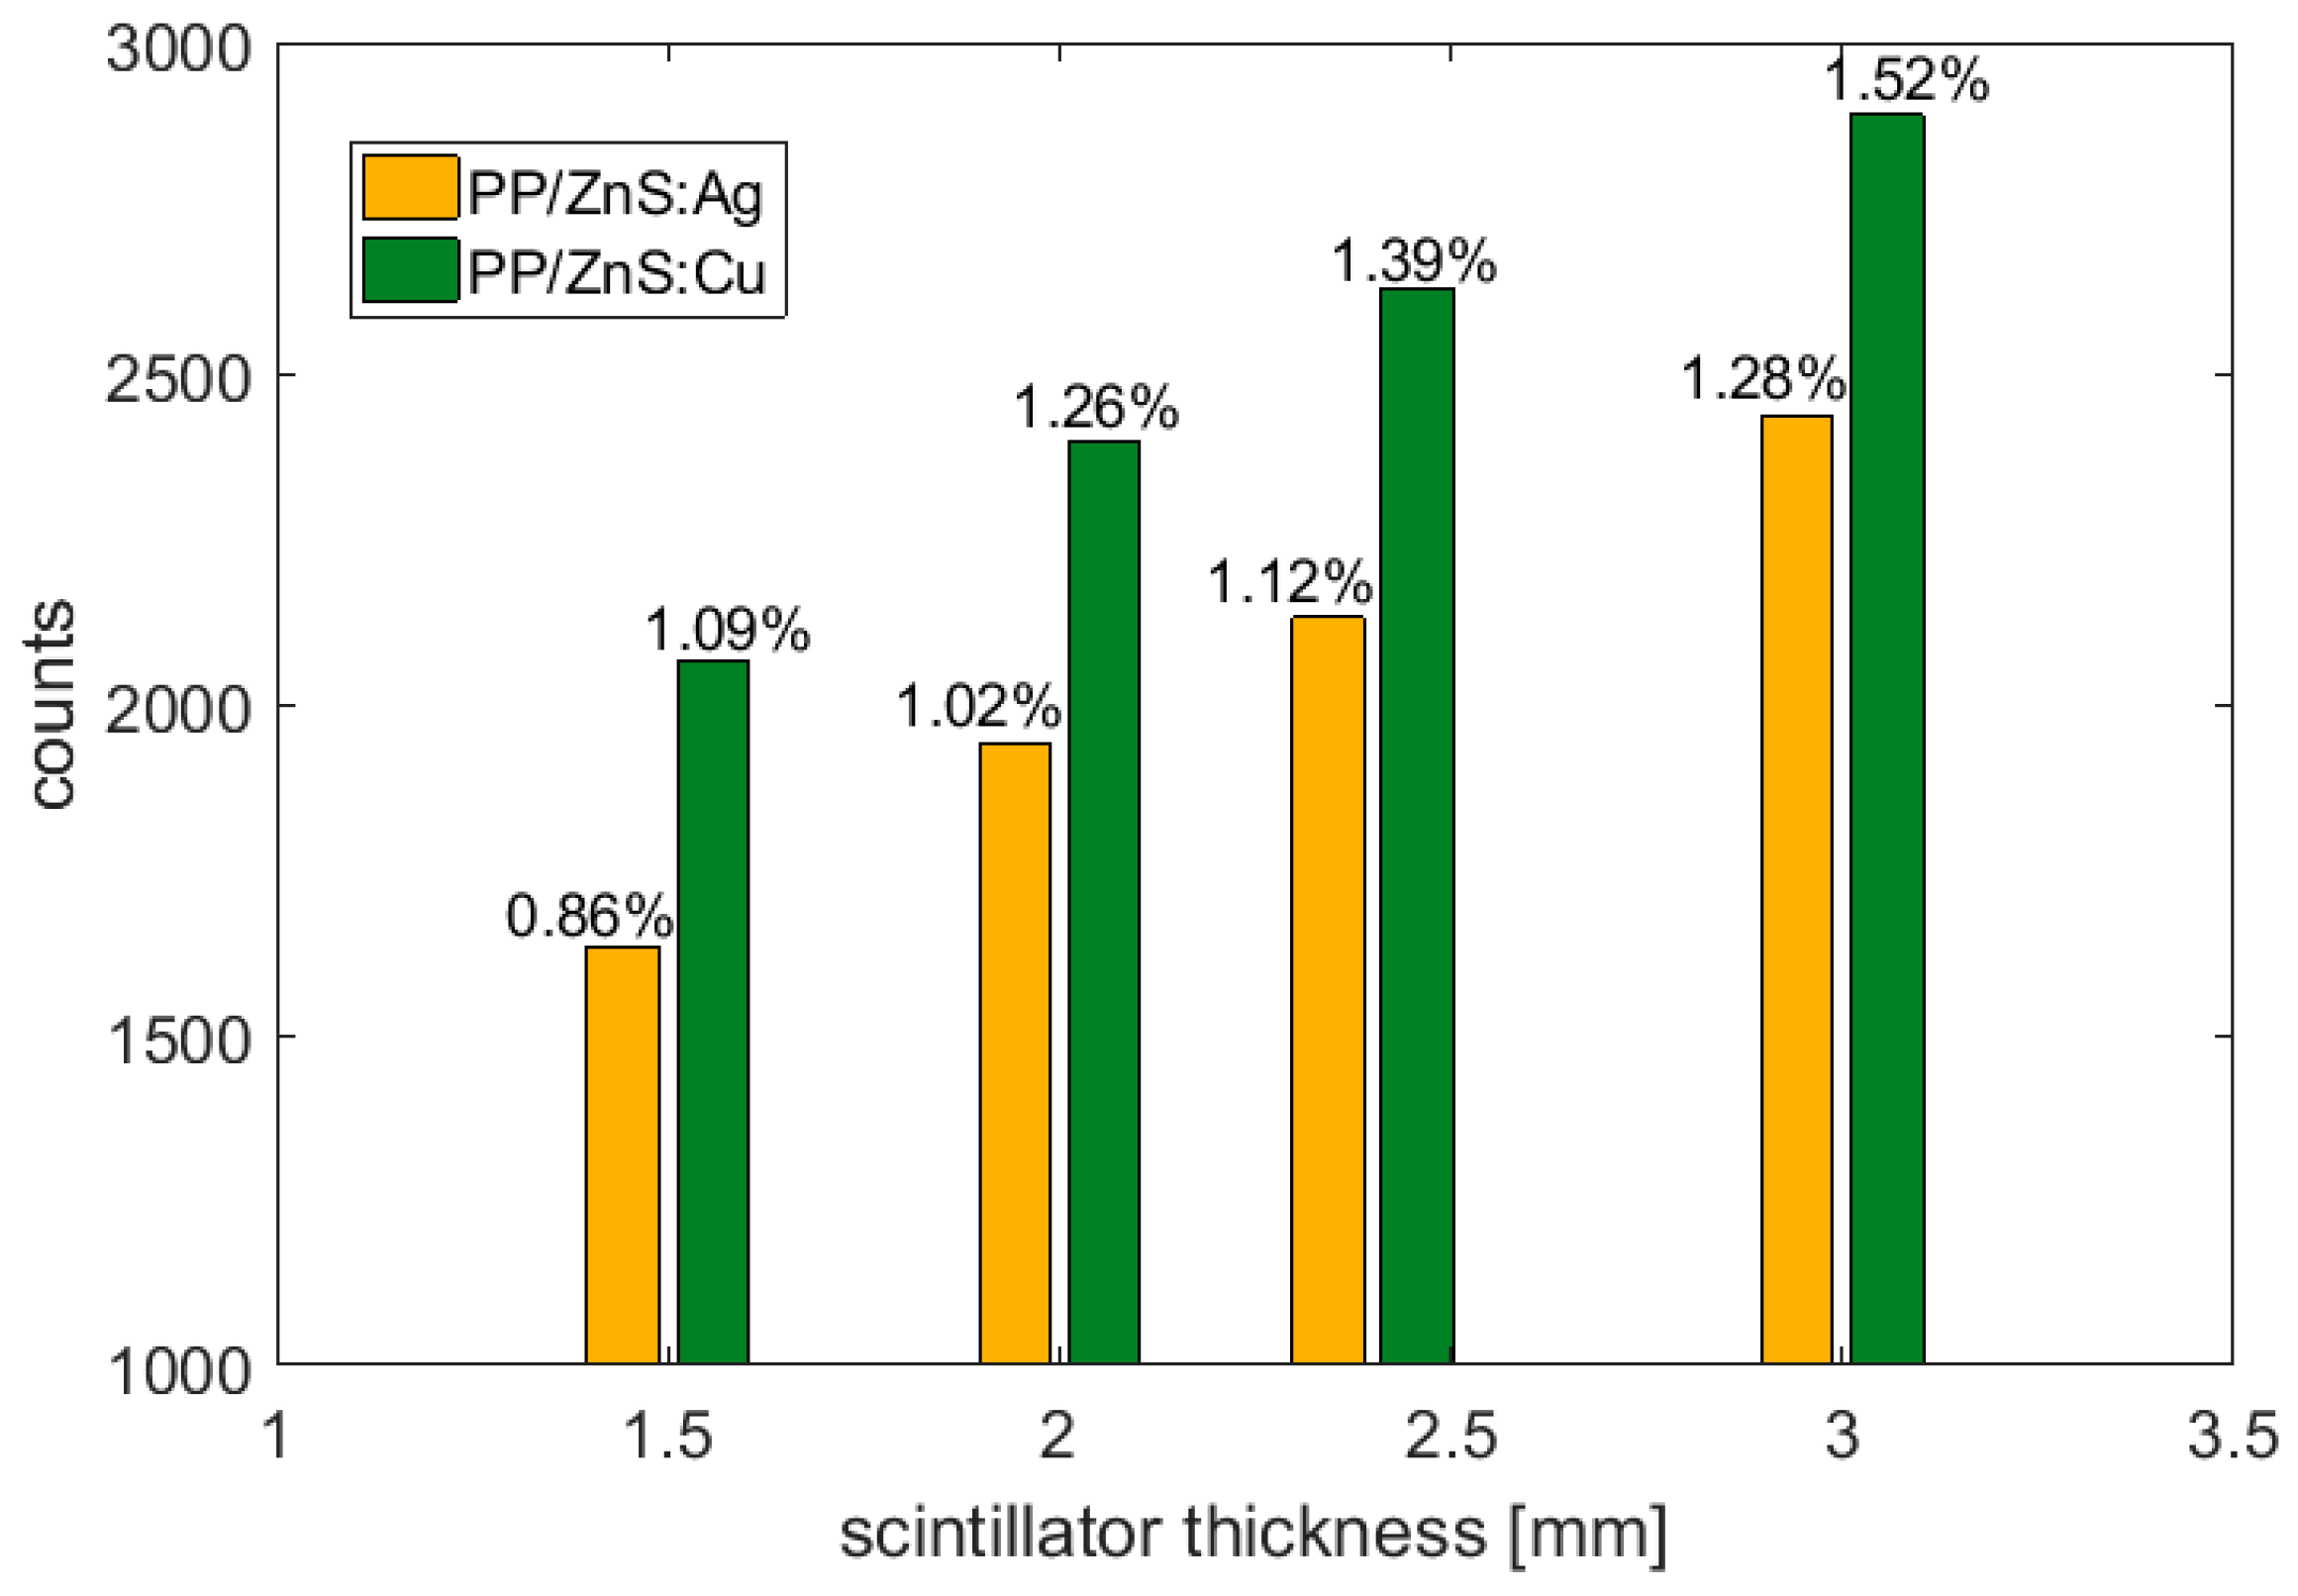
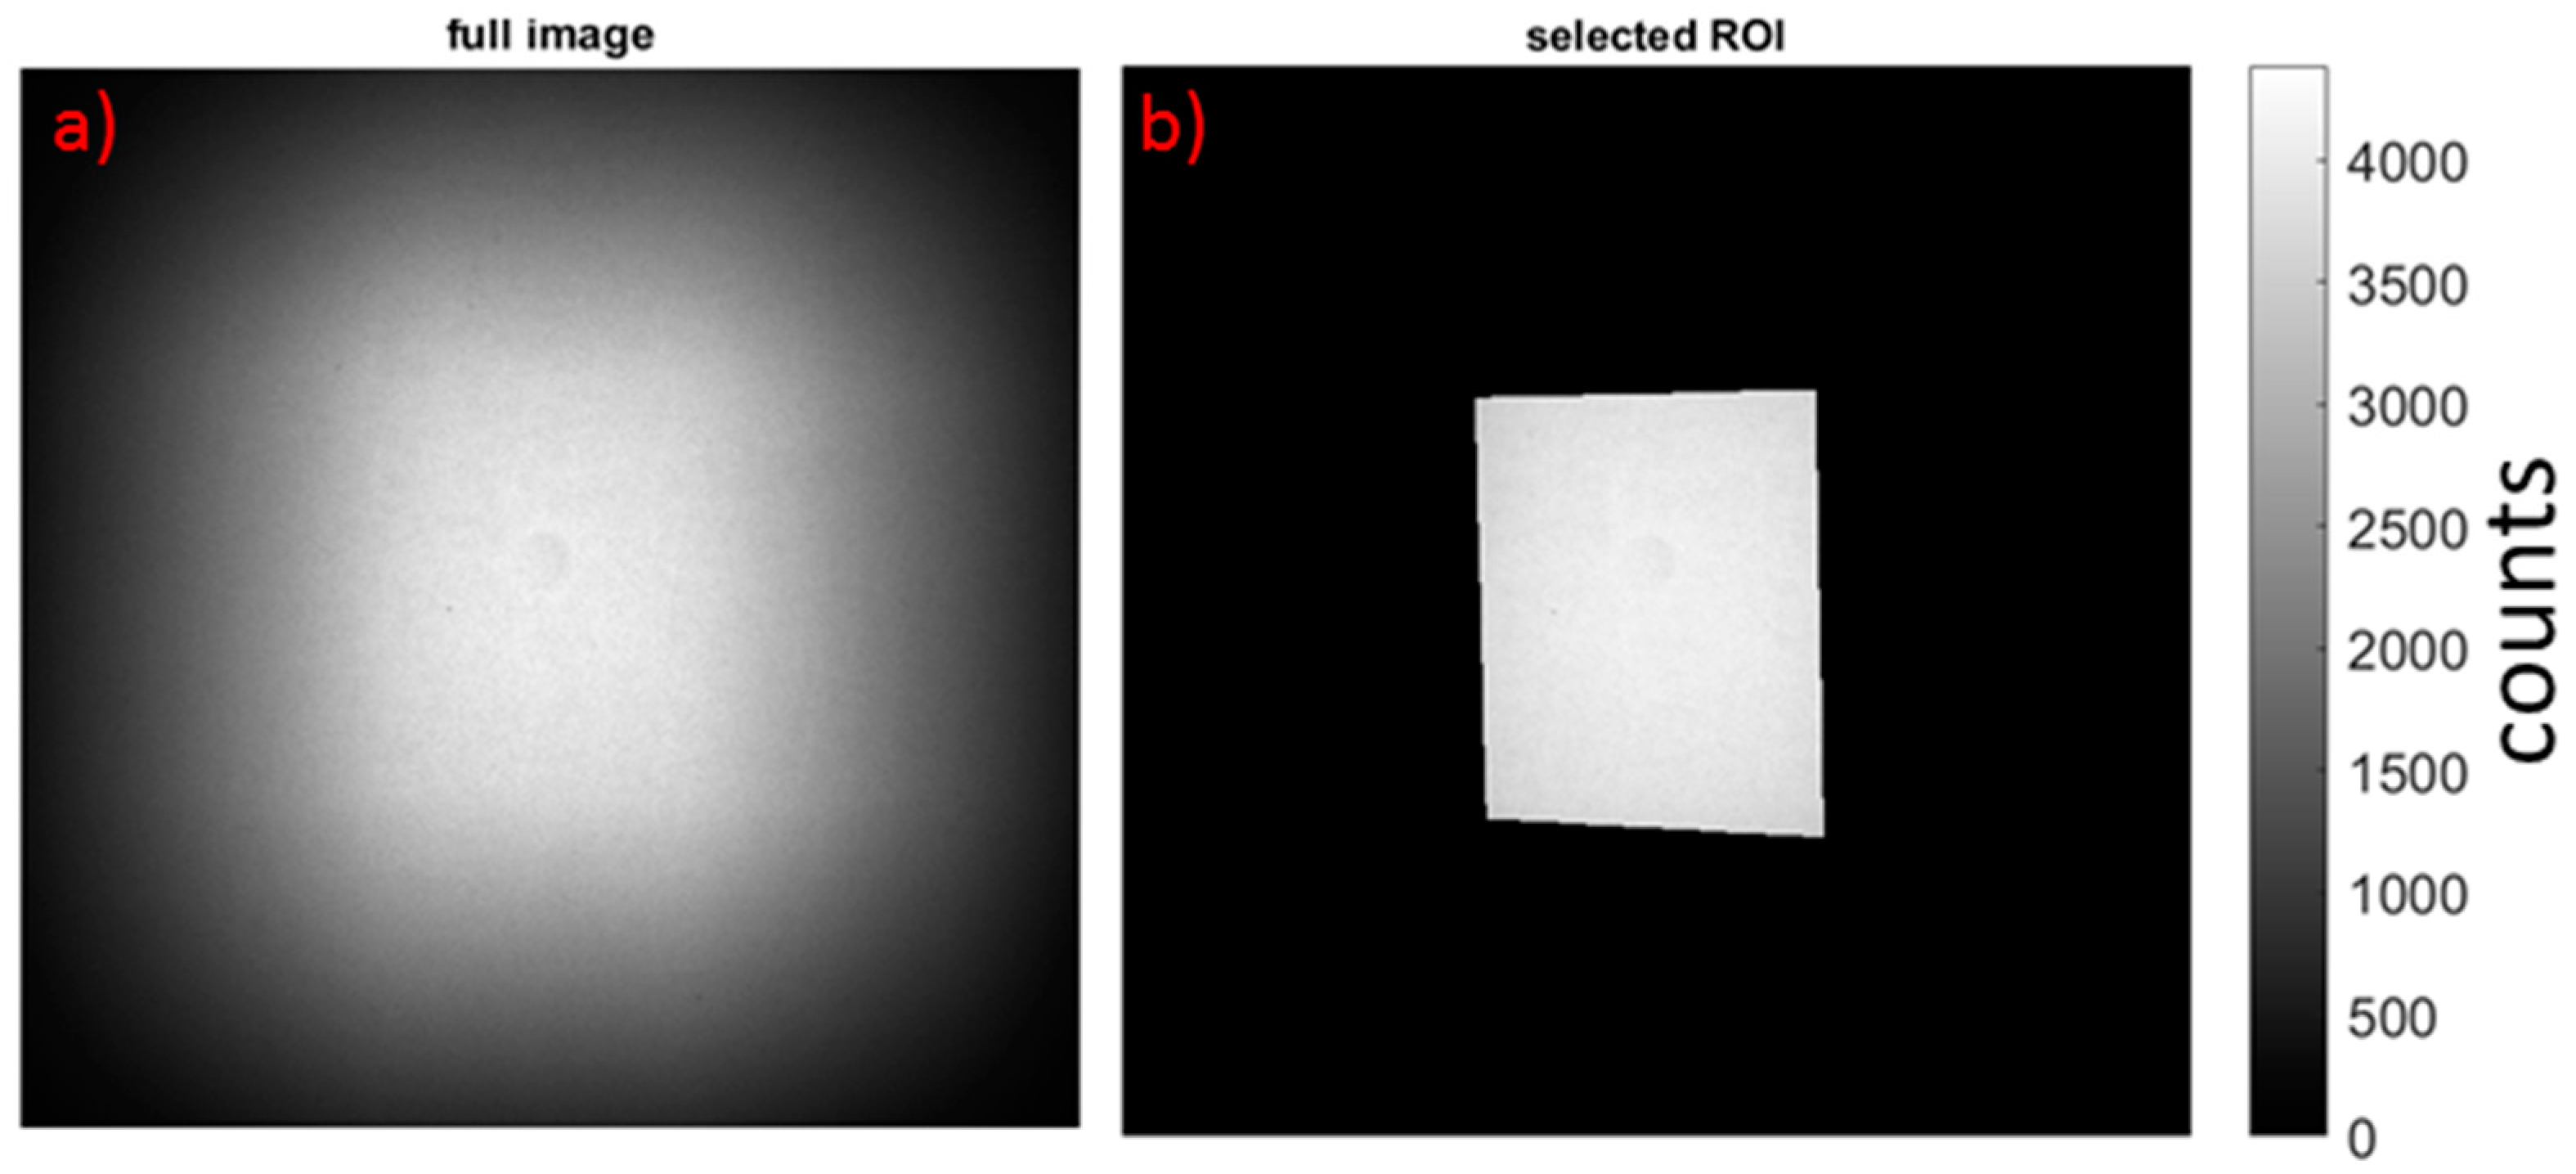
3.1. Light Output Analysis

During the light output measurements an additional 100 mm lead filter was placed in the beam. The filter is used to minimize the gamma contribution in the beam, but it should be noted that it also affects the neutron flux (decreases the flux to approx. 13 ± 2% of the initial value) and its spectrum (shifting the mean neutron energy from 1.9 ± 0.1 MeV to about 1.3 ± 0.1 MeV [32]). For each of the investigated screens, five images with 120 s exposure time were acquired. The images were then corrected by the beforehand-measured dark current images of the CCD. After the corrections, the median of the five images was calculated, which was further used for light output calculations. Figure 1 presents mean count values calculated as the average over a small field of view in the center for different scintillators. The ratio of the counts to the number of incoming neutrons assuming the incident neutron flux value 4.7 cm−2s−1 [35] is displayed in the graph above the bars. This plot shows that the light output increases approximately linearly with the scintillator thickness. It has been demonstrated before, in [30] for scintillators with similar compositions, that detection efficiency increases with thickness up to about 3 mm, but further increase of layer thickness does not improve the light output anymore, as the photons generated closer to the surface on the side, where the neutrons are entering, are not able to escape from the material. It is apparent that for the applied detector setup the Cu-activated scintillator screen is the better choice in terms of detection efficiency. The emission spectra of PP/ZnS:Cu and PP/ZnS:Ag scintillators can be found in [31] and wavelength dependence efficiency curves of the used camera iKonL in [34]. Cu-activated scintillators emit green light with a peak wavelength of ~520 nm and Ag-activated ones emit blue light (~450 nm), which corresponds to about 96% and 80% of quantum efficiency of the camera sensor. This difference fits almost perfectly with the difference in the measured values presented in Figure 2, indicating that the neutron-to-photon conversion efficiency is approximately equal for both Ag- and Cu-activated scintillators. Therefore, when choosing an optimum scintillator screen, the properties of the camera should be considered.

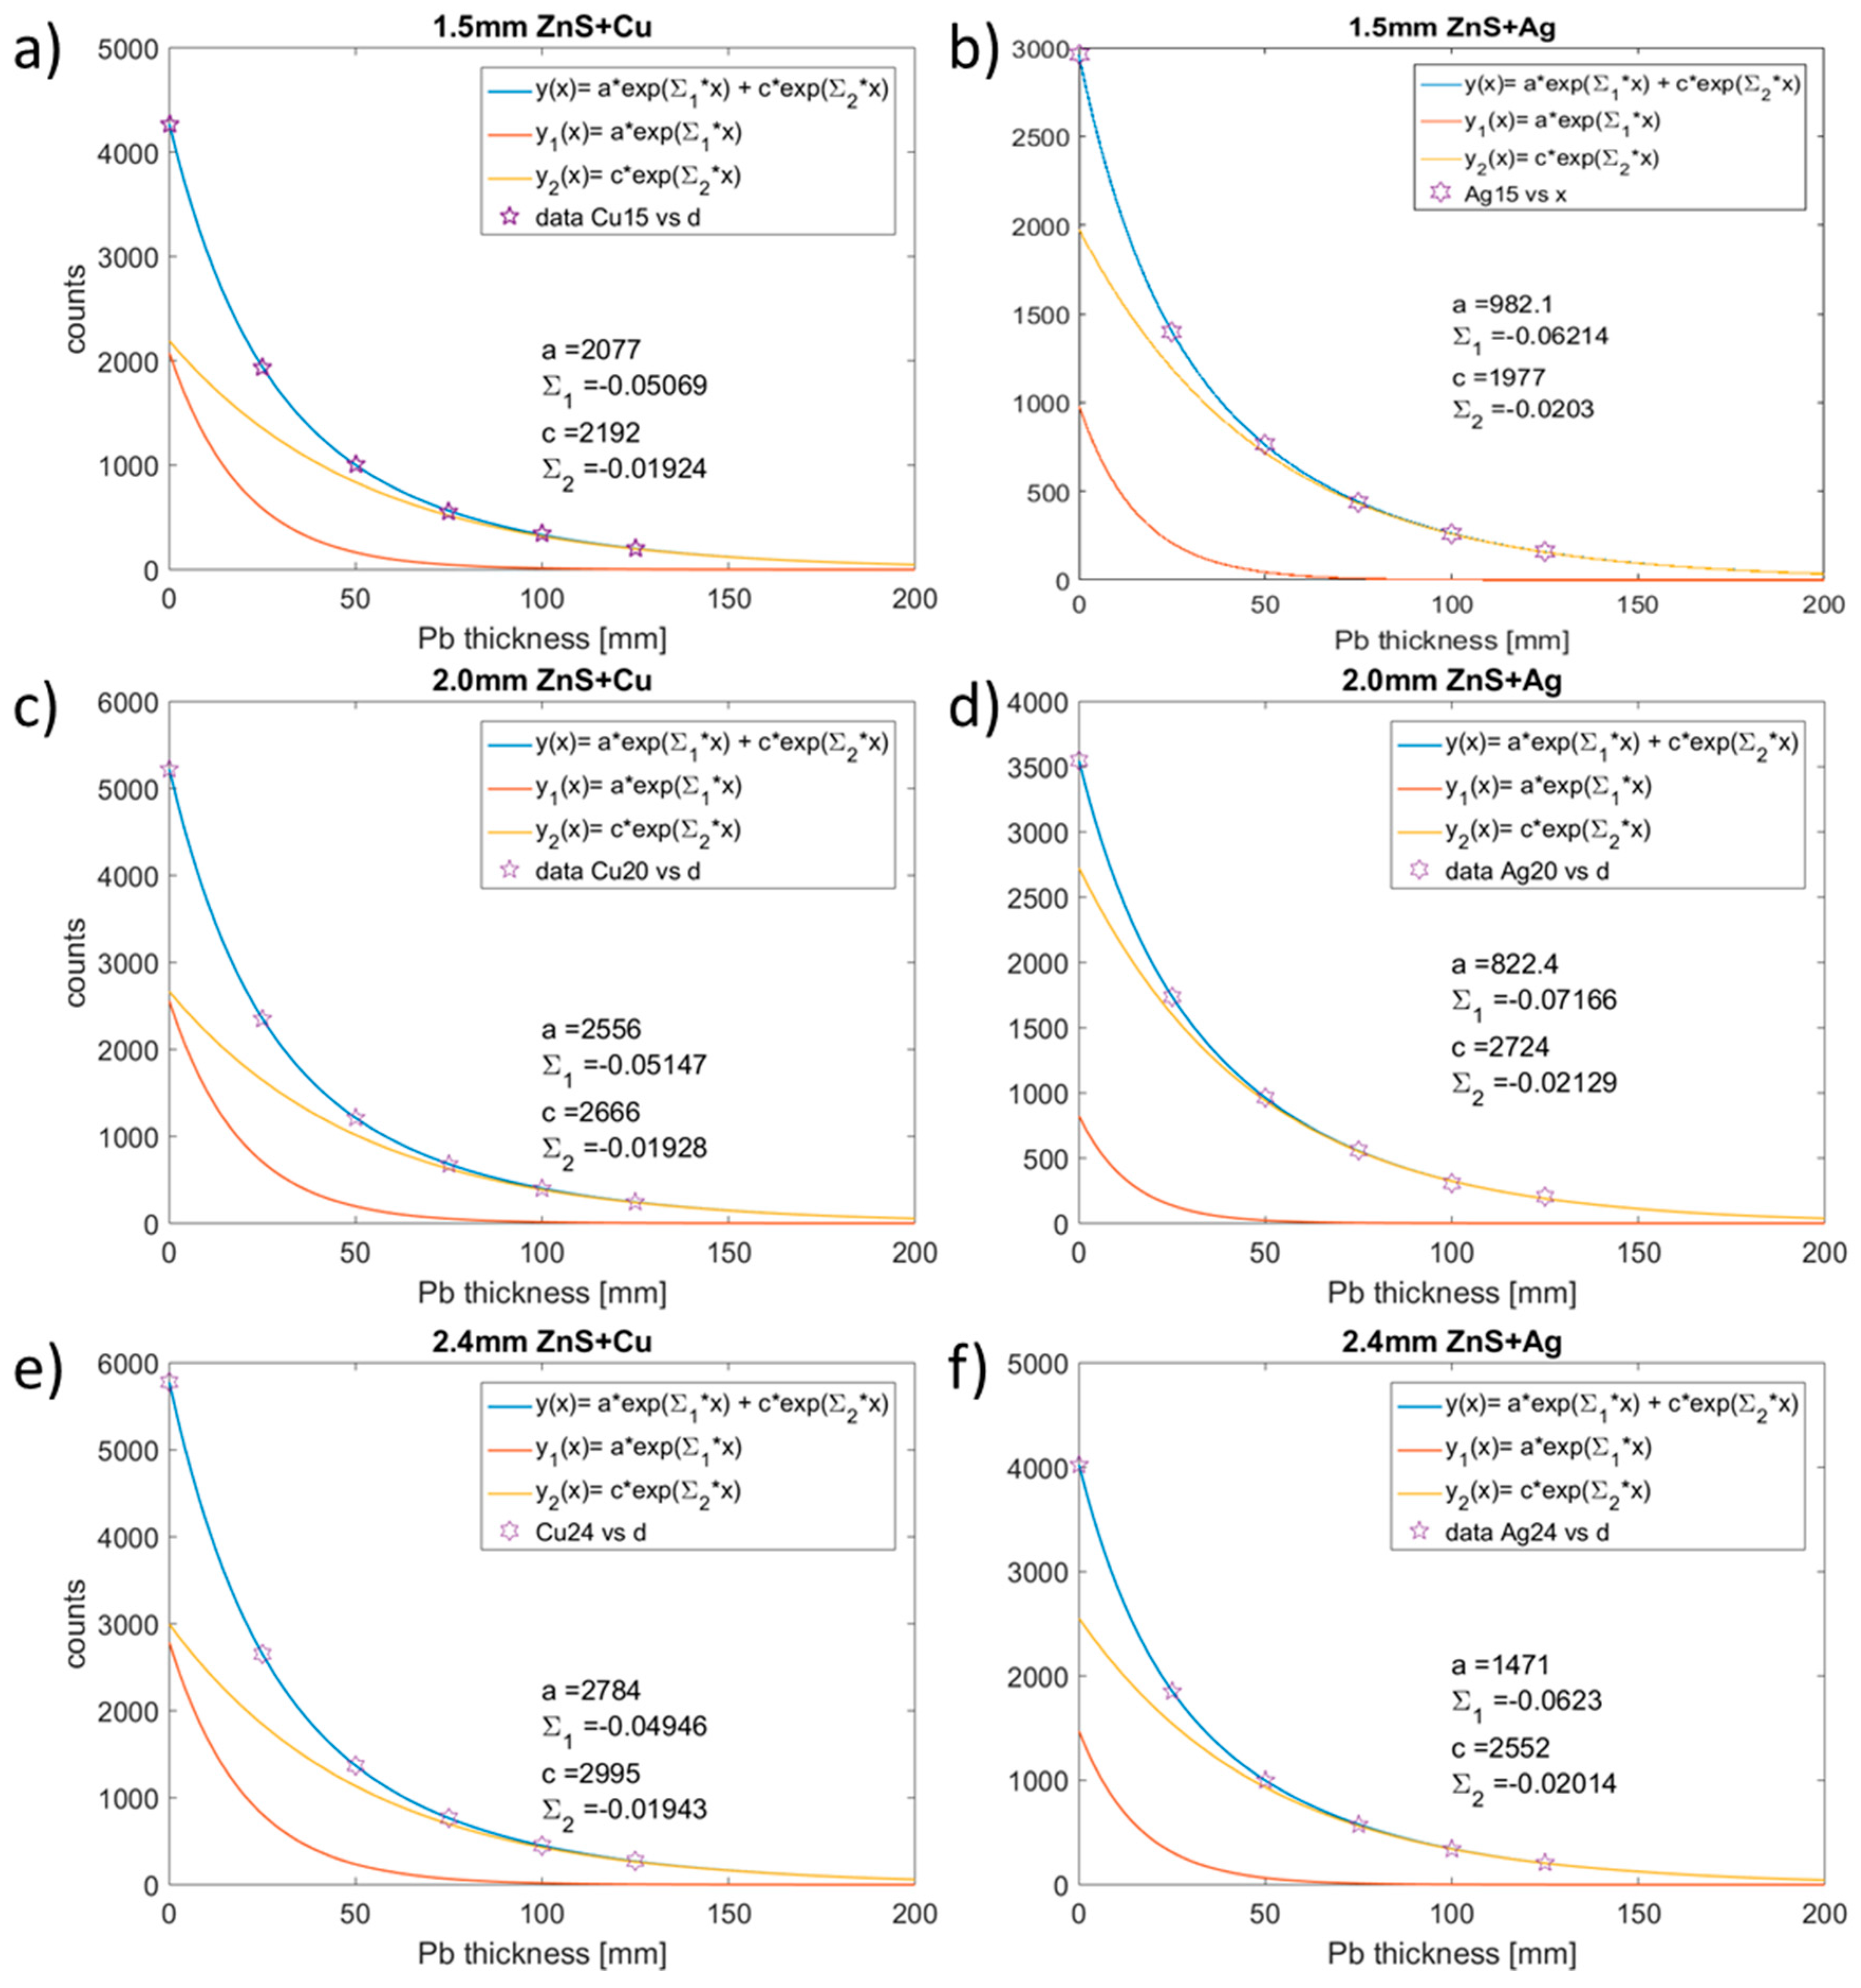
3.2. Gamma Sensitivity of Sctinttilator Screens

As the fission neutron spectrum is contaminated with gamma radiation, an important parameter of scintillator screens for fission neutron imaging is gamma sensitivity. To investigate this property for the studied scintillators, a series of measurements were taken with different thicknesses of lead filters (0, 25, 50, 75, 100, 125 mm). For each filter thickness, five images with 20 s exposure time were recorded. After dark current correction, median images were calculated. Next, for each image, a small region of interest (ROI) was selected (illustrated in Figure 3) and the mean measured intensity was evaluated. It is expected that the beam profile for both neutron and gamma radiation should be similar. Nevertheless, to diminish the effect of any difference in beam profiles of the two kinds of radiation, the ROI was selected in the region where the beam appears to be approximately homogenous.
The measured intensity is a sum of two components corresponding to neutron beam intensity and gamma beam intensity; thus, the experimental data points were fitted by a function of two exponentials, according to Equation (1).
y ( x ) = a · e x p ( Σ 1 · x ) + c · e x p ( Σ 2 · x ) ,
where y ( x ) is the number of counts measured, x stands for the thickness of the lead filter, the coefficients Σ 2 and Σ 1 correspond to the effective total macroscopic cross sections of lead for fission neutrons and the effective attenuation coefficient of gamma rays, respectively, and c and a correspond to the number of counts without lead filter for fission neutrons and gamma rays, respectively.
Figure 4 presents the fitted function for different scintillators (blue curves). The corresponding coefficients of determination (R-squared) were calculated to be 0.9999 or larger indicating perfect fits of the regression lines to the experimental data.
The yellow and red curves represent the exponent functions y 1 (Equation (2)) and y 2 (Equation (3), respectively, which are the summands of the function y (Equation (1)).
y 1 ( x ) = a · e x p ( Σ 1 · x ) ,
y 2 ( x ) = c · e x p ( Σ 2 · x ) ,
Thus, the functions y 2 (yellow curves) describe the attenuation of fission neutrons in lead and the functions y 1 (red curves) the attenuation of the gamma radiation in lead. Consequently, the coefficients Σ 2 and Σ 1 correspond to the total macroscopic cross sections of lead for fission neutrons and the attenuation coefficient of gamma rays, respectively. The total macroscopic neutron cross sections of lead evaluated based on these measurements were 0.1932 cm−1 and 0.2058 cm−1 for the neutron spectra at NECTAR for Cu- and Ag-activated scintillators, respectively. Calculating one attenuation coefficient value is, however, a simplification, as the attenuation of both neutrons and gamma rays depend on energy. When a lead filter is used, this can be especially significant for neutrons, as the NECTAR fission spectrum [32] includes the energy range, for which there are many nuclear resonances in lead. Moreover, the presence of a lead filter in the beam affects the energy spectrum; therefore, the measured values should be considered as the effective attenuation coefficients particularly for the beam available at NECTAR instrument. An interpretation of the discrepancy in the two values is given in the section “discussion”.
Also, the attenuation coefficient for gamma radiation can be calculated from the evaluated functions. Interestingly, in both cases (for neutron and gamma radiation), the cross-section values appear to be slightly higher when calculated for data measured with Ag-doped scintillators than with Cu-doped scintillators.
For a thickness dPb of 25 mm of lead (corresponding to 35 mm including the permanent filter), the fluxes of gamma radiation and fission neutrons are of the same order of magnitude [33]. Thus, without lead filtering (dPb = 0), the gamma flux is significantly higher than the neutron flux. For all the plots in Figure 4, the yellow curves corresponding to the measured neutron beam intensities show higher values than the curves for gamma radiation (red). Thus, the detection efficiency for neutrons for each of the measured PP/ZnS scintillators is significantly higher than for gamma radiation. However, the ratios of neutron and gamma sensitivities are different for PP/ZnS:Cu and PP/ZnS:Ag. Without lead filtering (dPb = 0), the differences between neutron (yellow) and gamma (red) attenuation curves are significantly larger for scintillators doped with Ag than for Cu-doped scintillators. This indicates a higher gamma sensitivity of the Cu-doped scintillators, which is most likely related to different excitation spectra of PP/ZnS:Cu and PP/ZnS:Ag scintillators for both, neutron and gamma radiation. A more detailed interpretation of these results will be given in Section 4.

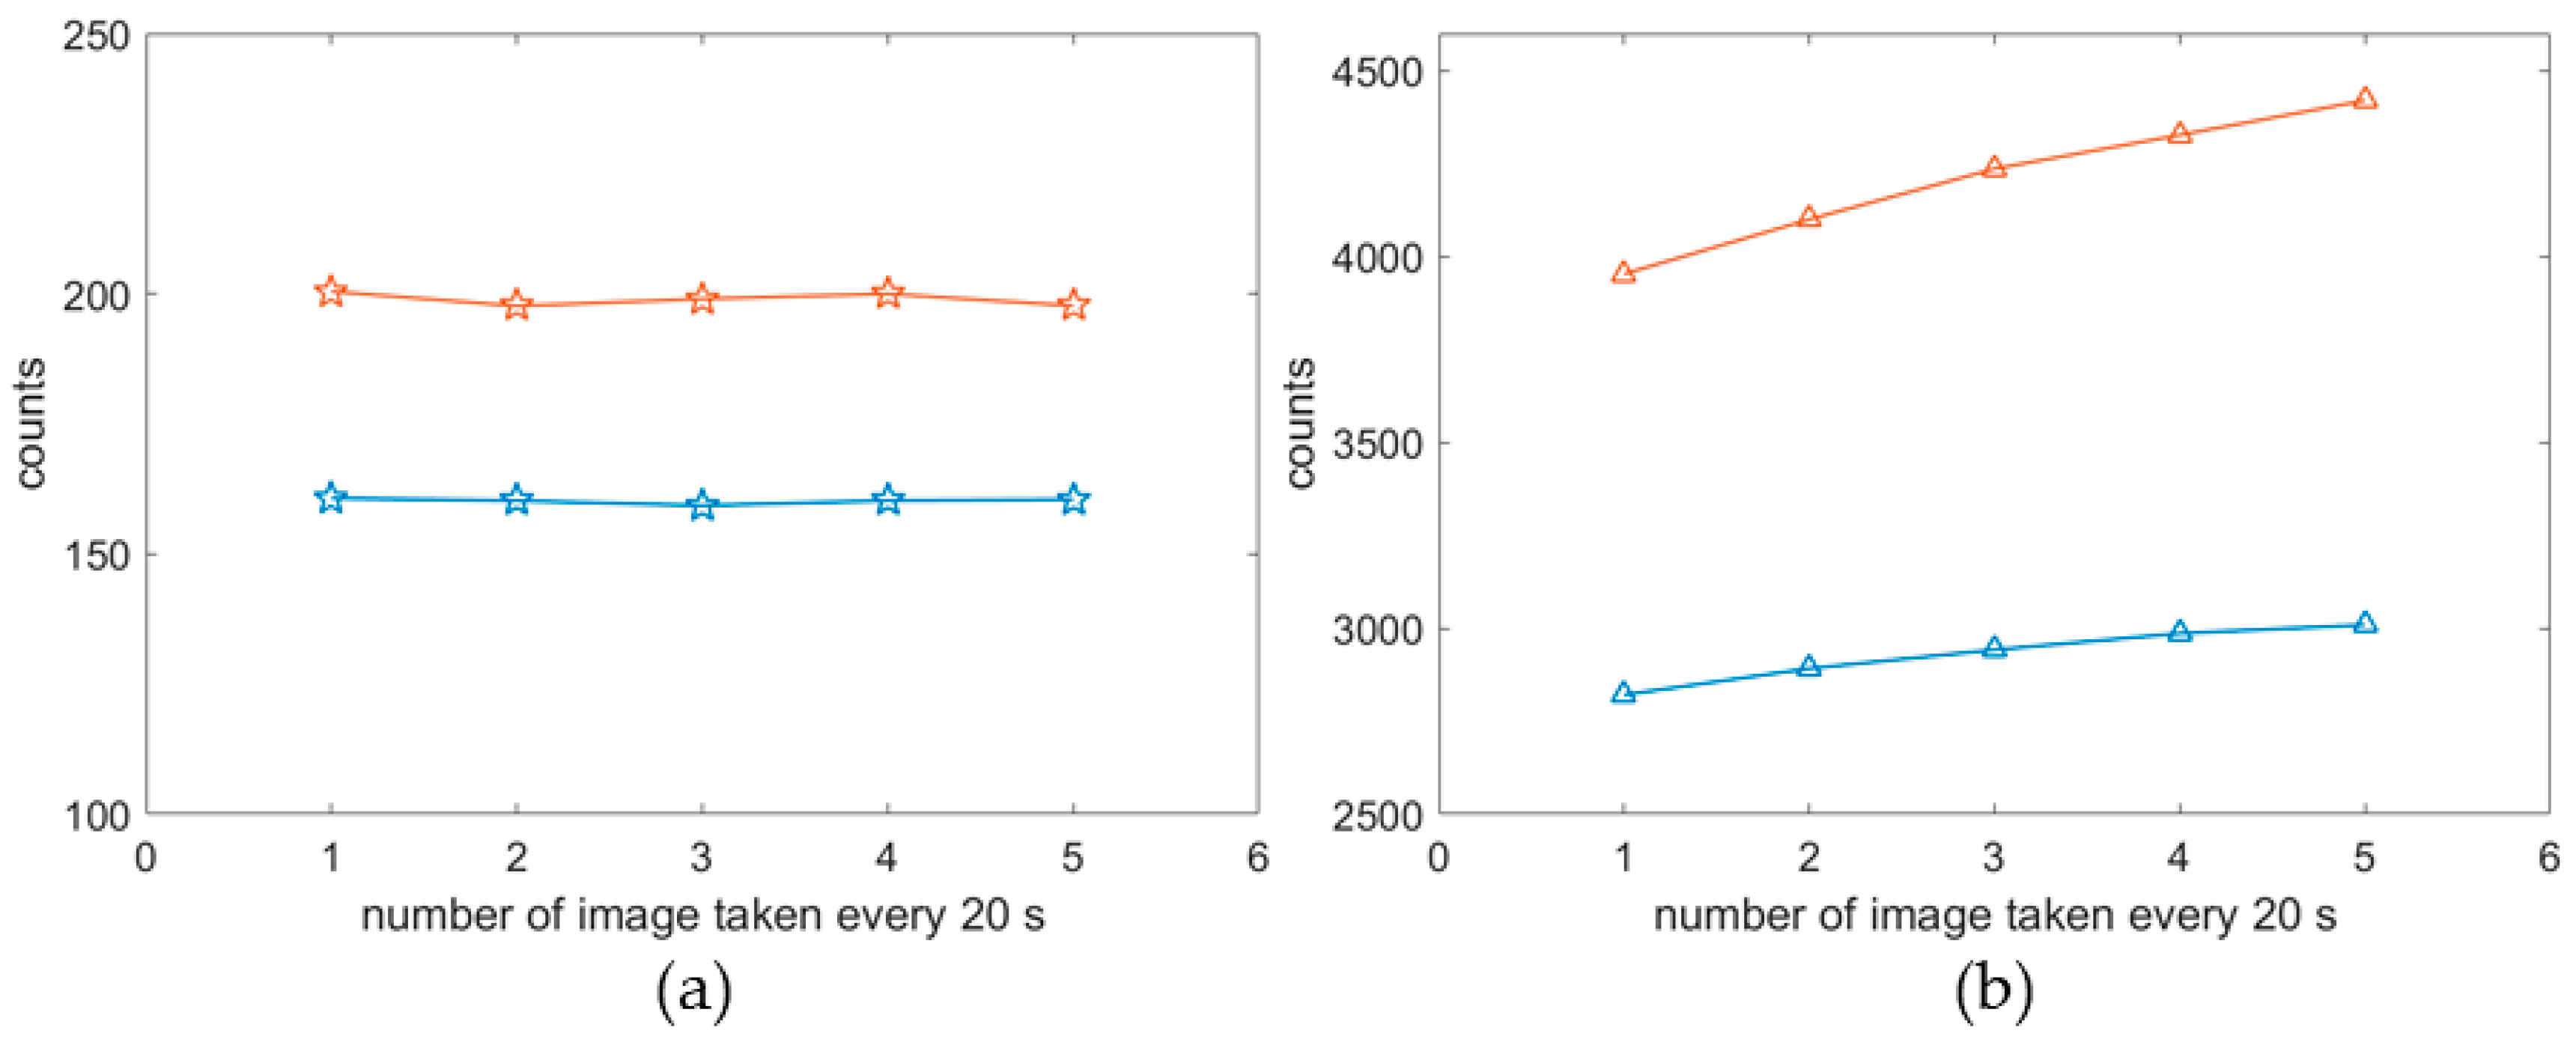
3.3. Influence of the Exposure Times

It has been observed that in some cases, when images were measured in a series of five times 20 s, every subsequent recorded image had a slightly higher intensity than the previous one. Figure 5 presents two examples of different behavior of the scintillators showing different light outputs with time for both Ag- and Cu-activated scintillators of 1.5 mm thickness. Figure 5a shows the intensities averaged over a region of interest selected similarly as in Section 3.1 and calculated for five consecutively measured images with exposure time 20 s and with 125 mm lead filter in the beam. Figure 5b shows analogously evaluated values for measurements without additional lead filter. The red and blue curves correspond to the Cu- and Ag-activated scintillators, respectively. The light outputs of the scintillators increase with time in the example shown in Figure 5b, but remain constant in Figure 5a. It has been noticed that the effects of increasing light outputs were observed in cases when the measurements were performed after a longer break in exposure (more than 5 min). An interpretation of this effect will be given in the Section 4.

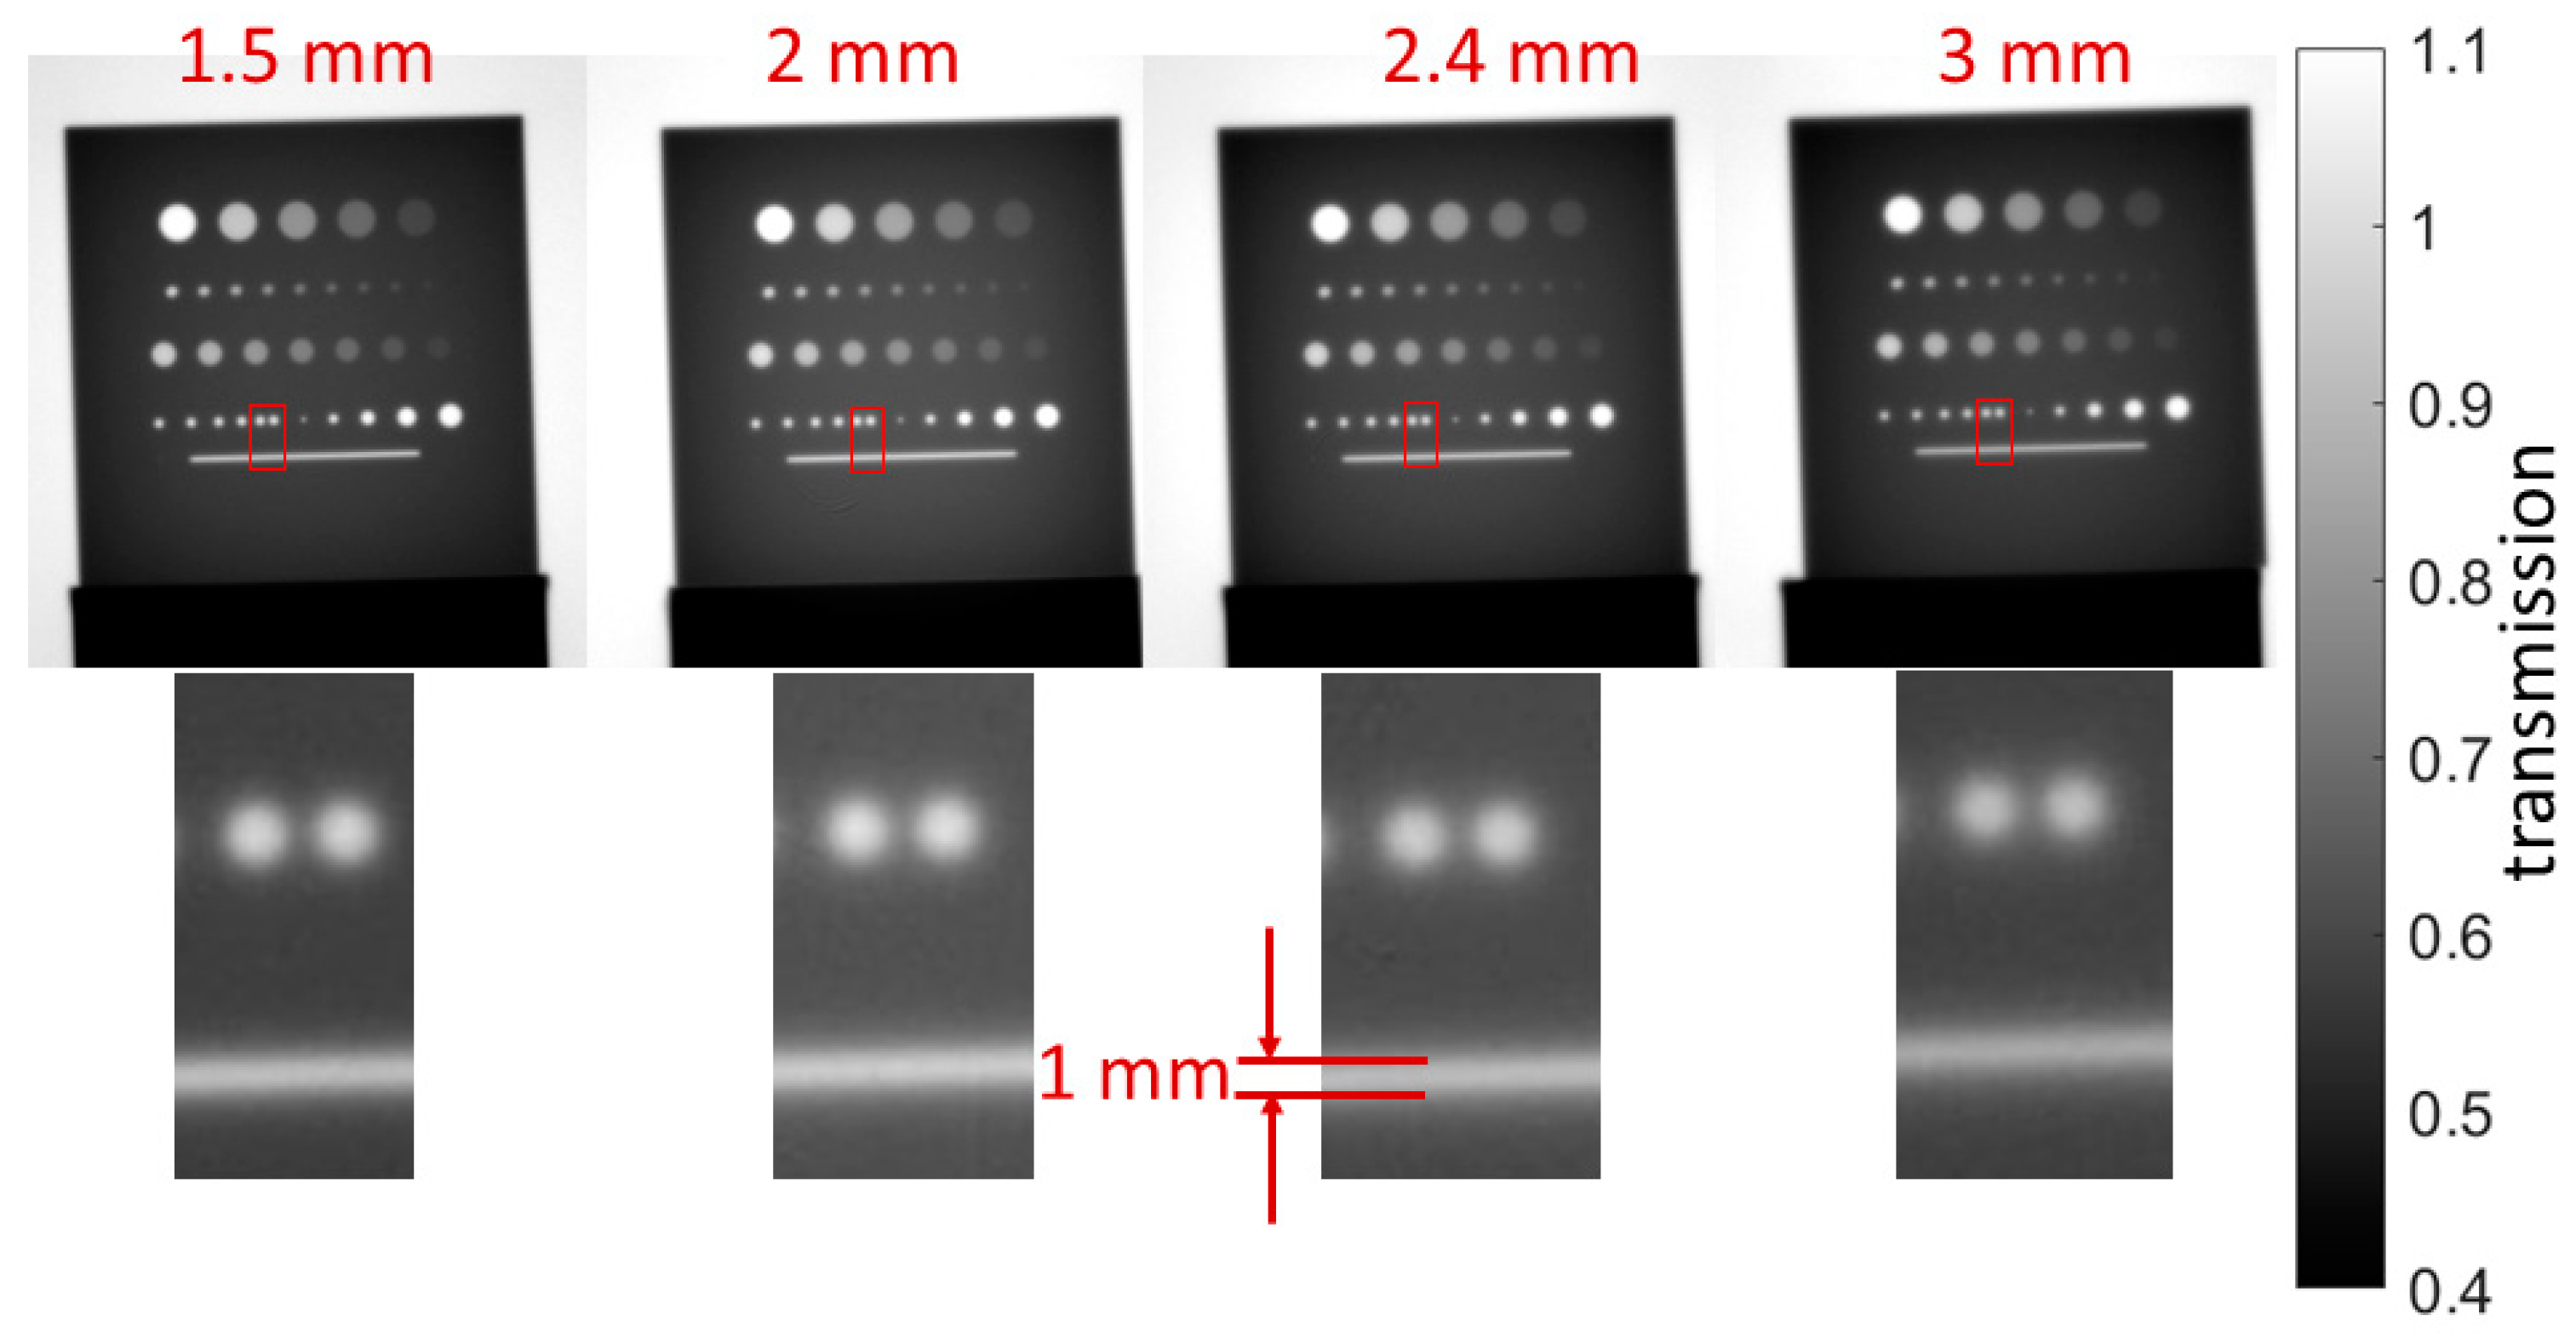
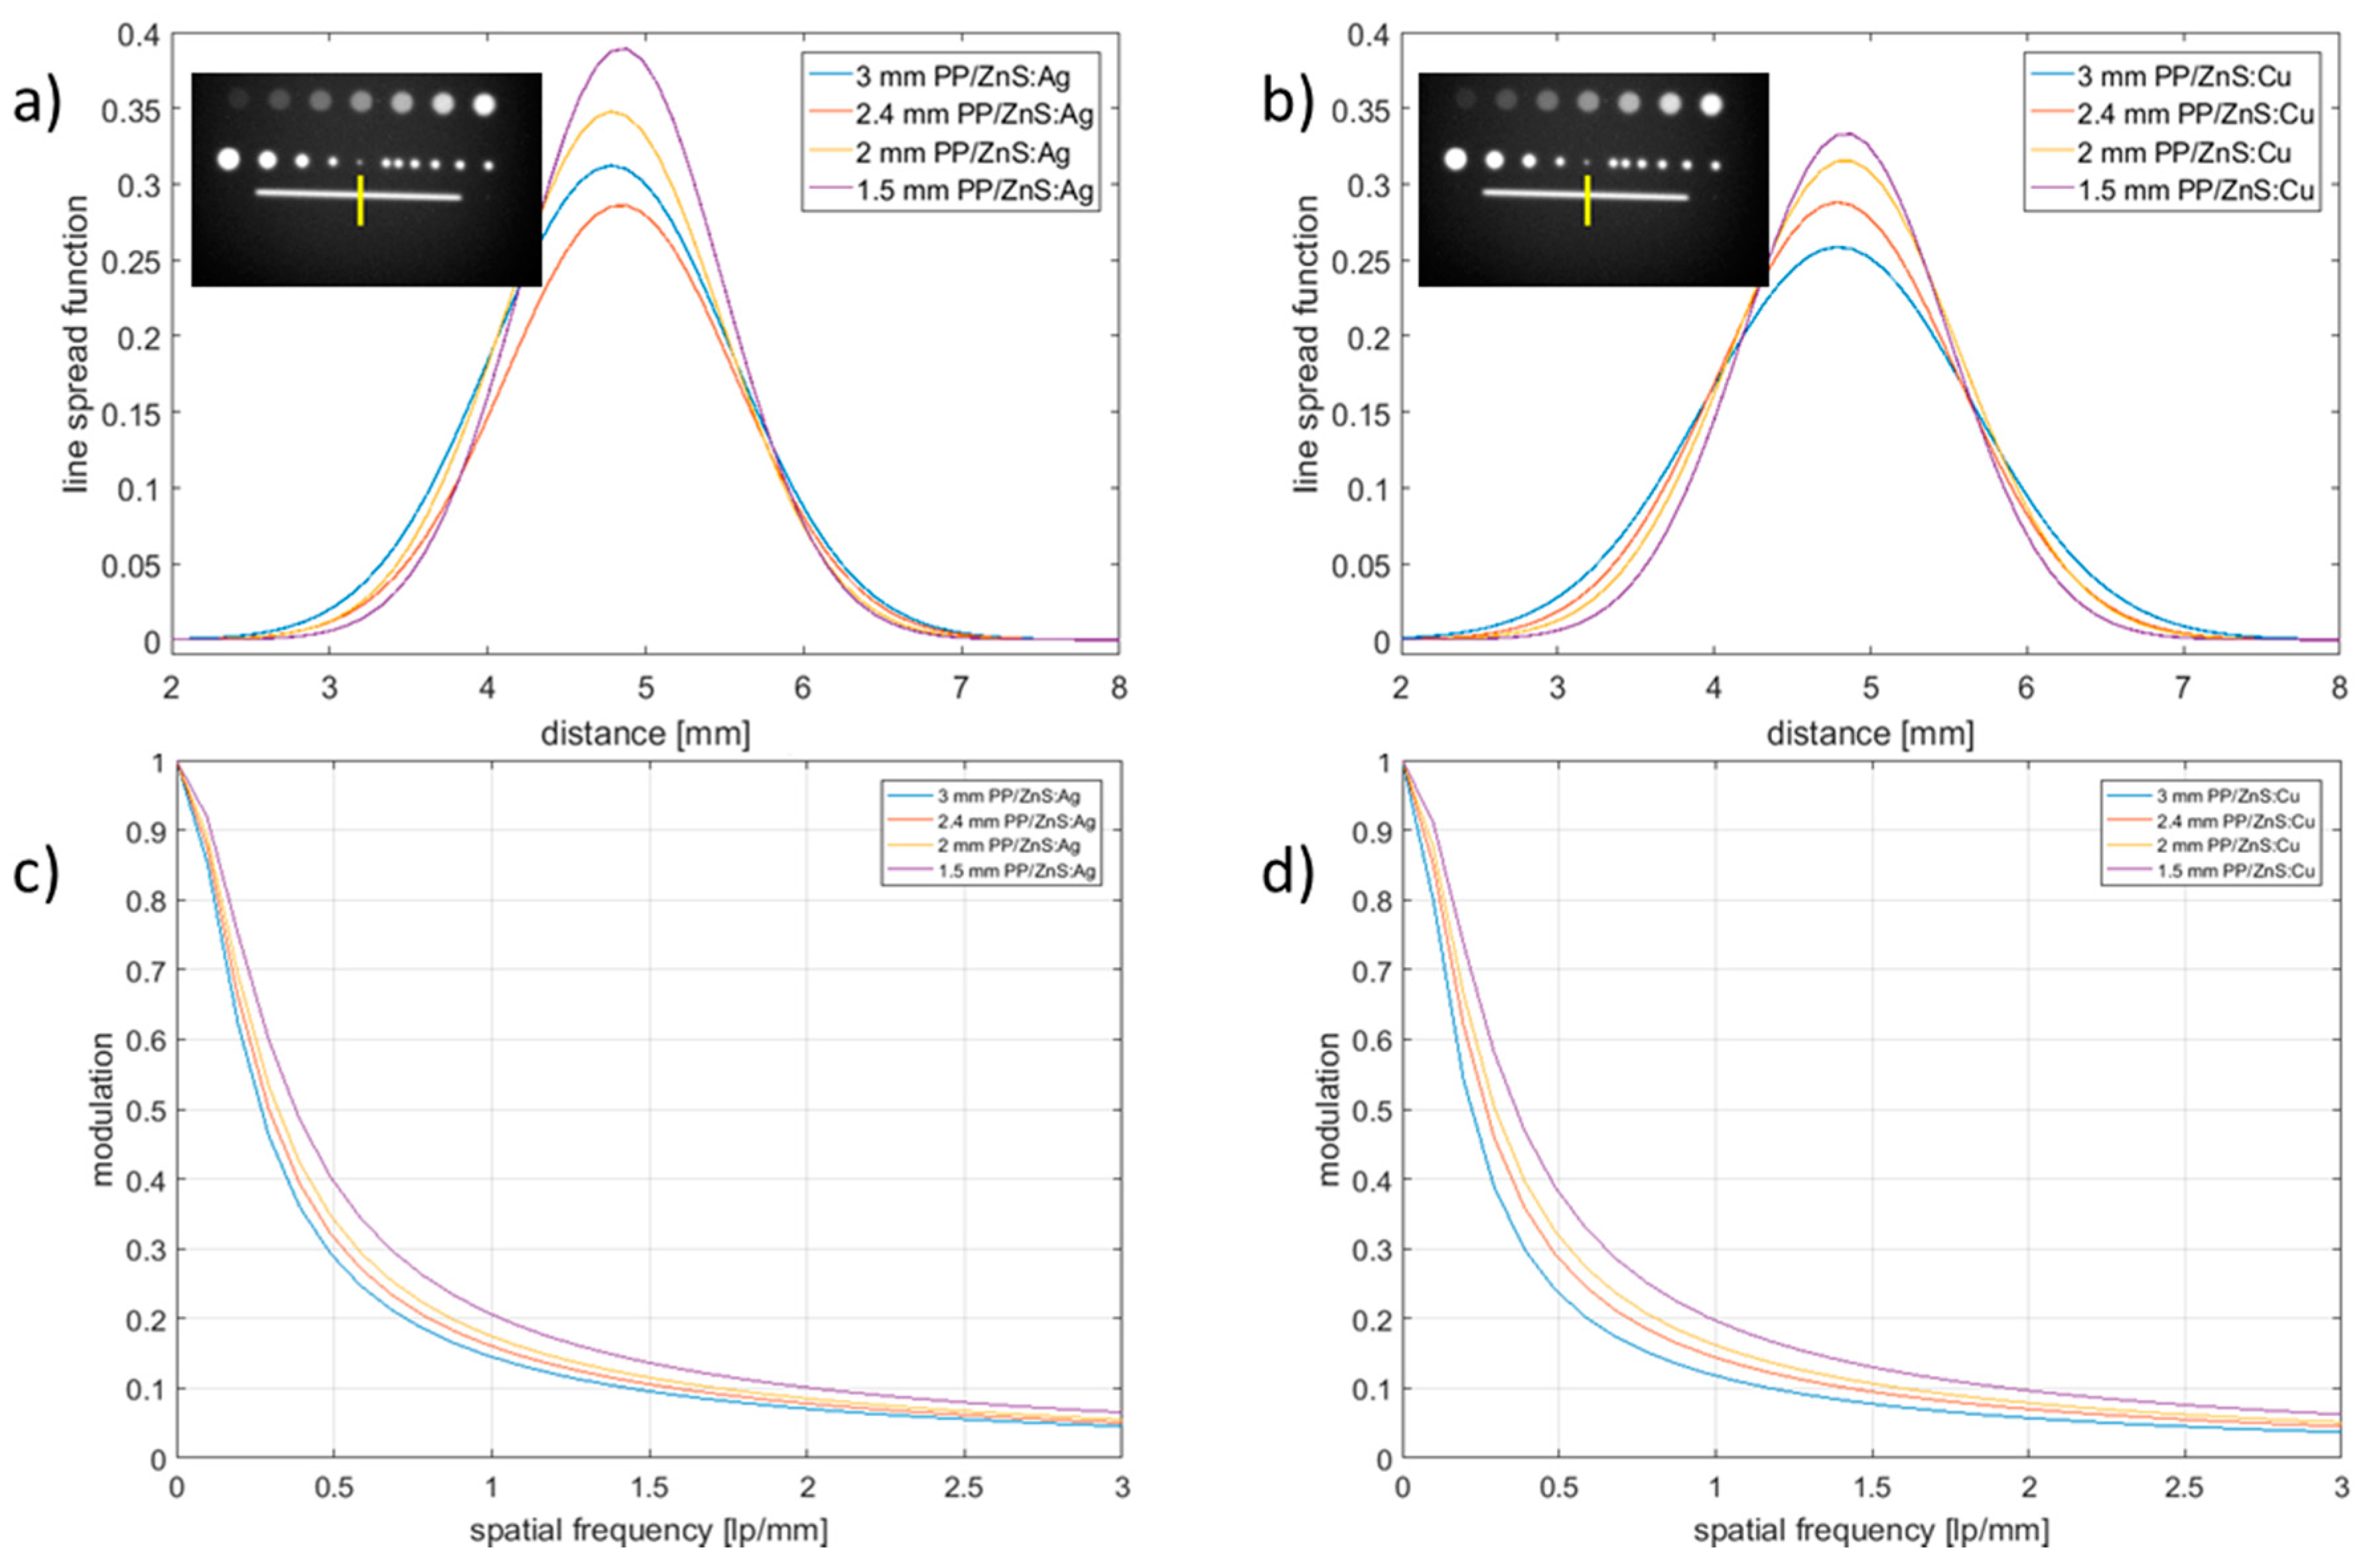
3.4. Spatial Resolution Considerations

The determination of the spatial resolution of fission neutron images is more difficult than it is in case of thermal neutron imaging. In order to determine an intrinsic spatial resolution of the detector setup, the measured object should be placed as close as possible to the scintillator screen to minimize the influence of the beam divergence. This also means that the object must be as thin as possible, but at the same time attenuate the radiation sufficiently to provide good image contrast. In case of cold and thermal neutron imaging, a standard tool for the spatial resolution determination is the so-called Siemens Star covered with 6 µm thick gadolinium layer [36]. Here, for this purpose, a 5-cm thick steel block with holes of diameters of 1 mm and larger and a slit of width 1 mm was used. Some of the holes in rows 1, 2 and 3 have depths lower than 5 cm, which is observed as the intensity drops from the left to the right (Figure 6).
For each screen, five images with 120 s exposure time were acquired. Each image was corrected by the dark current images. After the correction, the median of the five images was calculated, which was further normalized by the open beam image.
Figure 6 illustrates neutron images of the applied resolution mask acquired with scintillators of different thicknesses. All features of the mask can be easily resolved for all scintillators, but as expected, the best resolution seems to be achieved by the scintillator with a thickness of 1.5 mm. The differences are however very small and difficult to define by human eye.
A more quantitative comparison can be evaluated from the line profiles plotted across the 1 mm thick slit corresponding to the position indicated by the yellow lines marked in the inset images in Figure 7a,b. Figure 7a,b illustrate line spread functions (LSF) determined by fitting Gaussian functions to the measured line profiles. Full widths at half maximum of the LSF functions are presented in Table 1. Figure 7c,d present the modulation transfer functions (MTF) calculated as Fourier transforms of the LSFs. The spatial frequency at MTF 10% provides a direct measure of the achieved spatial resolution. Calculated values for the different scintillators are also summarized in Table 1.

4. Discussion

In the presented study, light output, gamma radiation sensitivity and spatial resolution of scintillators with two different compositions (ZnS activated with Ag or Cu mixed in a high density and highly transparent PP) and four different thicknesses of each were investigated.
Based on conducted measurements, it was concluded that the neutron sensitivity of both Ag- and Cu-activated scintillators was similar, and the difference in the obtained light output was caused mainly due to the camera sensor sensitivity spectrum, slightly different than the emission spectrum of the scintillators. It is apparent that emission spectra of the scintillators based on Cu-activated ZnS match the used iKonL BV camera efficiency much better, resulting in higher detection efficiency as compared to the setup combining PP/ZnS:Ag and iKonL BV.
Gamma radiation presence in the beam, not only increases the measured intensity values, but also distorts contrast between different elements. Since the attenuation of gamma radiation increases and attenuation of fission neutrons decreases with atomic number, any contribution of the gamma radiation in the fission neutron beam will result in decreased contrast between different elements. Therefore gamma sensitivity is a crucial parameter for neutron scintillators.
During the gamma sensitivity tests, it was observed that Cu-activated screens combined with this particular camera type, result in higher light outputs for both neutron and gamma radiation as compared to Ag-activated screens; however, the contribution of gamma radiation in the detected beam is higher for PP/ZnS:Cu, which is a significant drawback. This means that for good image quality, thicker lead filters should be applied when using PP/ZnS:Cu scintillators. Table 2 summarizes the calculated thicknesses of lead filters (dPb) required to decrease the contribution of gamma rays in the detected beam to 1% and to 10%, respectively, as well as the ratio of the amount of detected neutrons to detected gamma rays (c/a) without using a lead filter.
The presented measurements allowed for the calculation of the effective attenuation coefficients of lead for the neutron and gamma spectra. The obtained values were slightly different for the two types of investigated scintillators. Attenuation in lead depends on the radiation energy only, thus the macroscopic cross section cannot depend on the detection technology. Therefore, the slightly different values of the obtained attenuation coefficients must be a consequence of different excitation spectra of ZnS:Ag and ZnS:Cu phosphors. Ag and Cu dopants introduce, in the ZnS electronic band structure, additional energy levels which are within the energy gap, due to which excitation by low energy radiation is possible (the order of eV). However, doping ZnS with Ag or Cu creates some additional Ag and Cu levels within or above the conduction band, to which excitation by high energy radiation can occur. Thus, the excitation spectra can also vary by different dopants for high energy radiation.
The fact of obtaining different attenuation coefficients for one material using different kinds of scintillators should be taken into account during image analysis, especially when comparing images measured with different scintillators. On the other hand, this feature could be advantageous, as for some objects, selecting the right scintillator material might potentially improve the contrast between different materials. However, this would be beneficial only in case if measurements with different scintillators would provide more significant differences in attenuation than what was observed here.
An interesting effect was observed during acquisition of several images with the same exposure time in a sequence. The light output was increasing with time while the scintillator was exposed to a beam after a break in exposure longer than several minutes. This period was not well-defined, but the described effect was not observed when the break in exposure was shorter than 1 min and was observed for more than 5 min with closed beam. This was interpreted as an afterglow effect, which after a short time reaches a saturation level and therefore, after several minutes of exposure the light output does not change anymore.
This effect should be considered during measurements and investigated in more detail for the used scintillators before the measurements. When possible, the data acquisition should be started after the time required for stabilization of the light output of the scintillator.
It has been demonstrated that the best spatial resolution can be achieved by the thinnest (1.5 mm) scintillators. Therefore, the choice of the scintillator must be carefully considered depending on the available neutron and gamma spectra, camera sensitivity and on the foreseen applications. Assuming the use of a camera with similar sensitivity as the one used in this studies, for dynamic experiments, where the light output is the most important factor, it is more reasonable to use thicker PP/ZnS:Cu scintillators, while for experiments aiming to achieve higher spatial resolution, thinner PP/ZnS:Ag screens might be better.
In any case, where the images should provide quantitative information, gamma radiation should be eliminated from the beam as much as possible, as it changes contrast and light output, and moreover, can cause the afterglow phenomenon distorting the information contained in the images.

Author Contributions

Malgorzata G. Makowska, Christian Grünzweig and Thomas Bücherl conceived and designed the experiments; Malgorzata G. Makowska performed the experiments; Malgorzata G. Makowska, Bernhard Walfort, Christian Grünzweig and Thomas Bücherl analyzed the data; Bernhard Walfort and Albert Zeller provided the investigated samples; Malgorzata G. Makowska wrote the paper.

Conflicts of Interest

The authors declare no conflict of interest.

References

  1. Kaestner, A.P.; Hartmann, S.; Kühne, G.; Frei, G.; Grünzweig, C.; Josic, L.; Schmid, F.; Lehmann, E.H. The ICON beamline—A facility for cold neutron imaging at SINQ. Nucl. Instrum. Methods Phys. Res. Sect. A Accel. Spectrom. Detect. Assoc. Equip. 2011, 659, 387–393. [Google Scholar] [CrossRef]
  2. Kardjilov, N.; Hilger, A.; Manke, I.; Woracek, R.; Banhart, J. CONRAD-2: The new neutron imaging instrument at the Helmholtz-Zentrum Berlin. J. Appl. Crystallogr. 2016, 49, 195–202. [Google Scholar] [CrossRef]
  3. Schulz, M.; Schillinger, B. ANTARES: Cold neutron radiography and tomography facility. J. Large-Scale Res. Facil. 2015, 1, 17. [Google Scholar] [CrossRef]
  4. NIST Neutron Imaging Facility (NIF). Available online: https://www.nist.gov/laboratories/tools-instruments/neutron-imaging-facility-nif (accessed on 16 October 2017).
  5. Garbe, U.; Ahuja, Y.; Ibrahim, R.; Li, H.; Aldridge, L.; Salvemini, F.; Paradowska, A.Z. Industrial application experiments on the neutron imaging instrument DINGO. Phys. Procedia 2017, 88, 13–18. [Google Scholar] [CrossRef]
  6. Kiyanagi, Y.; Kamiyama, T.; Sato, H.; Shinohara, T.; Kai, T.; Aizawa, K.; Arai, M.; Harada, M.; Sakai, K.; Oikawa, K.; et al. Design study of the imaging beam line at J-PARC MLF, ERNIS. Nucl. Instrum. Methods Phys. Res. Sect. A Accel. Spectrom. Detect. Assoc. Equip. 2011, 651, 16–20. [Google Scholar] [CrossRef]
  7. Kockelmann, W.; Burca, G.; Kelleher, J.F.; Kabra, S.; Zhang, S.Y.; Rhodes, N.J.; Schooneveld, E.M.; Sykora, J.; Pooley, D.E.; Nightingale, J.B.; et al. Status of the Neutron Imaging and Diffraction Instrument IMAT. Phys. Procedia 2015, 69, 71–78. [Google Scholar] [CrossRef]
  8. Bilheux, H.; Herwig, K.; Keener, S.; Davis, L. Overview of the conceptual design of the future venus neutron imaging beam line at the spallation neutron source. Phys. Procedia 2015, 69, 55–59. [Google Scholar] [CrossRef]
  9. Strobl, M. The Scope of the Imaging Instrument Project ODIN at ESS. Phys. Procedia 2015, 69, 18–26. [Google Scholar] [CrossRef]
  10. Bücherl, T.; Söllradl, S. NECTAR: Radiography and tomography station using fission neutrons. J. Large-Scale Res. Facil. 2015, 1, 19. [Google Scholar] [CrossRef]
  11. Mühlbauer, M.J.; Bücherl, T.; Genreith, C.; Knapp, M.; Schulz, M.; Söllradl, S.; Wagner, F.M.; Ehrenberg, H. The Thermal Neutron Beam Option for NECTAR at MLZ. Phys. Procedia 2017, 88, 148–153. [Google Scholar] [CrossRef]
  12. Woracek, R.; Santisteban, J.; Fedrigo, A.; Strobl, M. Diffraction in neutron imaging—A review. Nucl. Instrum. Methods Phys. Res. Sect. A Accel. Spectrom. Detect. Assoc. Equip. 2017. [Google Scholar] [CrossRef]
  13. Strobl, M.; Manke, I.; Kardjilov, N.; Hilger, A.; Dawson, M.; Banhart, J. Advances in neutron radiography and tomography. J. Phys. D Appl. Phys. 2009, 42, 243001. [Google Scholar] [CrossRef]
  14. Rücker, U.; Cronert, T.; Voigt, J.; Dabruck, J.P.; Doege, P.-E.; Ulrich, J.; Nabbi, R.; Beßler, Y.; Butzek, M.; Büscher, M.; et al. The Jülich high-brilliance neutron source project. Eur. Phys. J. Plus 2016, 131, 19. [Google Scholar] [CrossRef]
  15. Adams, R.; Zboray, R.; Prasser, H.-M. A novel fast-neutron tomography system based on a plastic scintillator array and a compact D–D neutron generator. Appl. Radiat. Isot. 2016, 107, 1–7. [Google Scholar] [CrossRef] [PubMed]
  16. Adams, R.; Bort, L.; Zboray, R.; Prasser, H.-M. Development and characterization of a D–D fast neutron generator for imaging applications. Appl. Radiat. Isot. 2015, 96, 114–121. [Google Scholar] [CrossRef] [PubMed]
  17. High Yield Neutron Generator—Phoenix Nuclear Labs. Available online: http://phoenixnuclearlabs.com/product/high-yield-neutron-generator/ (accessed on 18 October 2017).
  18. Tötzke, C.; Manke, I.; Hilger, A.; Choinka, G.; Kardjilov, N.; Arlt, T.; Markötter, H.; Schröder, A.; Wippermann, K.; Stolten, D.; et al. Large area high resolution neutron imaging detector for fuel cell research. J. Power Sources 2011, 196, 4631–4637. [Google Scholar] [CrossRef]
  19. Schillinger, B.; Lehmann, E. Scientific Reviews: Detectors for Neutron Imaging. Neutron News 2006, 17, 19–21. [Google Scholar] [CrossRef]
  20. Lehmann, E.H.; Tremsin, A.; Grünzweig, C.; Johnson, I.; Boillat, P.; Josic, L. Neutron imaging—Detector options in progress. J. Instrum. 2011, 6, 1–15. [Google Scholar] [CrossRef]
  21. Cortesi, M.; Zboray, R.; Adams, R.; Dangendorf, V.; Prasser, H.M. Concept of a novel fast neutron imaging detector based on THGEM for fan-beam tomography applications. J. Instrum. 2012, 7, C02056. [Google Scholar] [CrossRef]
  22. Cortesi, M.; Zboray, R.; Adams, R.; Dangendorf, V.; Meshkian, M.; Prasser, H.-M. Development of large-area THGEM detectors for investigation of thermal-hydraulic phenomena using neutron imaging. J. Instrum. 2013, 8, C10009. [Google Scholar] [CrossRef]
  23. Cortesi, M.; Dangendorf, V.; Zboray, R.; Prasser, H.-M. A novel fast-neutron detector concept for energy-selective imaging and imaging spectroscopy. Rev. Sci. Instrum. 2014, 85, 73305. [Google Scholar] [CrossRef] [PubMed]
  24. Mor, I.; Vartsky, D.; Bar, D.; Feldman, G.; Goldberg, M.B.; Katz, D.; Sayag, E.; Shmueli, I.; Cohen, Y.; Tal, A.; et al. High spatial resolution fast-neutron imaging detectors for Pulsed Fast-Neutron Transmission Spectroscopy. J. Instrum. 2009, 4, P05016. [Google Scholar] [CrossRef]
  25. Brandis, M.; Vartsky, D.; Dangendorf, V.; Bromberger, B.; Bar, D.; Goldberg, M.B.; Tittelmeier, K.; Friedman, E.; Czasch, A.; Mardora, I.; et al. Neutron measurements with Time-Resolved Event-Counting Optical Radiation (TRECOR) detector. J. Instrum. 2012, 7, C04003. [Google Scholar] [CrossRef]
  26. Matsubayashi, M.; Hibiki, T.; Mishima, K.; Yoshii, K.; Okamoto, K. Development of a fast neutron radiography converter using wavelength-shifting fibers. Nucl. Instrum. Methods Phys. Res. Sect. A Accel. Spectrom. Detect. Assoc. Equip. 2003, 510, 325–333. [Google Scholar] [CrossRef]
  27. Zou, Y.; Guo, L.; Guo, Z.; Tang, G.; Zhang, G. Development of a converter made of scintillator and wavelength-shifting fibers for fast neutron radiography. Nucl. Instrum. Methods Phys. Res. Sect. A Accel. Spectrom. Detect. Assoc. Equip. 2009, 605, 73–76. [Google Scholar] [CrossRef]
  28. Guo, J.; Bücherl, T.; Zou, Y.; Guo, Z.; Tang, G. Comparison of the performance of different converters for neutron radiography and tomography using fission neutrons. Nucl. Instrum. Methods Phys. Res. Sect. A Accel. Spectrom. Detect. Assoc. Equip. 2009, 605, 69–72. [Google Scholar] [CrossRef]
  29. Ronda, C.R. Emission and Excitation Mechanisms of Phosphors. In Luminescence: From Theory to Applications; Wiley-VCH Verlag GmbH & Co. KGaA: Weinheim, Germany, 2007; pp. 1–34. [Google Scholar]
  30. Yang, W.; Bin, T.; Heyong, H.; Bin, L.; Ke, T.; Yong, S.; Wei, Y.; Chao, C. The study of zinc sulphide scintillator for fast neutron radiography. Phys. Procedia 2013, 43, 205–215. [Google Scholar] [CrossRef]
  31. Scintillators: RC TRITEC AG, Teufen AR. Available online: http://www.rctritec.com/en/scintillators.html (accessed on 16 October 2017).
  32. Bücherl, T.; Von Gostomski, C.L.; Breitkreutz, H.; Jungwirth, M.; Wagner, F.M. NECTAR—A fission neutron radiography and tomography facility. Nucl. Instrum. Methods Phys. Res. Sect. A Accel. Spectrom. Detect. Assoc. Equip. 2011, 651, 86–89. [Google Scholar] [CrossRef]
  33. Jungwirth, M.; Breitkreutz, H.; Wagner, F.M.; Bücherl, T. Determination of the photon spectrum in an intense fission neutron beam. J. Instrum. 2012, 7, C03022. [Google Scholar] [CrossRef]
  34. Andor’s iKon-L High Dynamic Range CCD Camera. Available online: http://www.andor.com/scientific-cameras/ikon-xl-and-ikon-large-ccd-series/ikon-l-936 (accessed on 16 October 2017).
  35. Bücherl, T.; Kalthoff, O.; von Gostomski, C.L. A feasibility study on reactor based fission neutron radiography of 200-L waste packages. Phys. Procedia 2017, 88, 64–72. [Google Scholar] [CrossRef]
  36. Grünzweig, C.; Frei, G.; Lehmann, E.; Kühne, G.; David, C. Highly absorbing gadolinium test device to characterize the performance of neutron imaging detector systems. Rev. Sci. Instrum. 2007, 78, 53708. [Google Scholar] [CrossRef] [PubMed]
Figure 1. Localization of the instrument NECTAR at the FRM II reactor and a photograph of the detection setup (adapted from [10]).
Jimaging 03 00060 g001
Figure 2. Dependence of the light output on the scintillator thickness (average over a small field of view, FOV, in the center of the scintillators for 120 s exposure time). The percentage numbers above the bars express the ratio of the measured counts to the number of incoming neutrons.
Jimaging 03 00060 g002
Figure 3. (a) Full acquired radiograph showing beam profile; (b) Region of interest (ROI) selected for evaluation.
Jimaging 03 00060 g003
Figure 4. Function fitted to the measured beam intensities for different lead thicknesses (dPb), (blue curves) together with plotted functions evaluated for the neutron (yelow curves) and gamma (red curves) beam components for PP/ZnS:Cu ((a,c,e) and PP/ZnS:Ag (b,d,f)).
Jimaging 03 00060 g004
Figure 5. Measured intensities averaged over a centrally selected ROI of the images taken consecutively every 20 s (a) with 125 mm lead filter and (b) without additional lead filters. Red and blue curves correspond to the Cu- and Ag-activated 1.5 mm-thick scintillators, respectively.
Jimaging 03 00060 g005
Figure 6. Test with resolution mask (5 cm steel block) for PP/ZnS:Cu scintillators mask.
Jimaging 03 00060 g006
Figure 7. (a,b) Line spread functions obtained for the line profiles across the slit in the resolution mask; (c,d) modulation transfer functions corresponding to LSF curves in (a,b), respectively.
Jimaging 03 00060 g007
Table 1. Calculated values of FWHM for the line spread functions presented in Figure 7a,b and spatial frequency values evaluated for MTF 10%.
dscint (mm)FWHM (PP/ZnS:Ag)FWHM (PP/ZnS:Cu)Spatial Freqency at MTF 10% (lp/mm) (PP/ZnS:Ag) Spatial Freqency at MFT 10% (lp/mm) (PP/ZnS:Cu)
1.51.51.5322
2.01.621.701.71.6
2.41.711.801.61.4
3.01.792.001.41.2
Table 2. Ratios of the amount of detected neutrons to detected gamma rays (c/a) without lead filter and thicknesses of lead filters (dPb) required to limit the gamma contribution in the detected beam to less than 1% and 10%, respectively.
dscint
(mm)
c/a (PP/ZnS:Ag)c/a (PP/ZnS:Cu)dPb (mm) (PP/ZnS:Ag) 1% γdPb (mm) (PP/ZnS:Ag) 10% γdPb (mm) (PP/ZnS:Cu) 1% γdPb (mm) (PP/ZnS:Cu) 10% γ
1.52.01.1953614468
2.03.31.0682014167
2.41.71.1964015070

