Article

Greenhouse Gas Emissions and Environmental Impact from Recycling the Organic Fraction of Solid Waste: Comparison of Different Treatment Schemes from a Life Cycle Perspective

by
Francesco Di Maria
1,2,* and
Federico Sisani
1,2
1
LAR Laboratory, Dipartimento di Ingegneria, University of Perugia , Via G. Duranti 93, 06125 Perugia, Italy
2
CIMIS–Interuniversity consortium for machine and systems for the environment Via G. Duranti 67, 06125 Perugia, Italy.
*
Author to whom correspondence should be addressed.
Recycling 2017, 2(3), 13; https://doi.org/10.3390/recycling2030013
Submission received: 24 April 2017 / Revised: 27 July 2017 / Accepted: 11 August 2017 / Published: 11 August 2017
(This article belongs to the Special Issue Organic Waste Management)

Abstract

:
The emission of greenhouse gases and the impact from recycling the organic fraction of solid waste were investigated from a life cycle (LCA) perspective. Three different treatment schemes were investigated with the aid of a pilot apparatus including exclusively composting (COMP), integrated solid anaerobic batch not inoculated and post-composting (SADBPC), and an integrated solid anaerobic batch inoculated and post-composting (SADBPC-I). SADBPC-I and SADBPC generated an average of 300 NL/kgVS and 267 NL/kgVS of biogas, respectively. On the other hand, the amount of stabilized organic carbon contained in the organic fertilizer returned by COMP, SADBPC-I, and SADBPC led to a potential of 470 kgCO2 eq/Mg, 382 kgCO2 eq/Mg, and 545 kgCO2 eq/Mg sequestered in soils for each treatment scheme, respectively. The LCA study highlighted that the impact categories most affected were global warming and human toxicity cancer, and on average, the highest impact was detected for COMP.

1. Introduction

The organic fraction of municipal solid waste (OFMSW) represents the largest component of municipal solid waste (MSW) generated worldwide with a share ranging from about 30% w/w for developed countries up to >60% w/w for developing countries. The main components of OFMSW are made up of waste from kitchens, restaurants, wholesale markets, canteens, green, and other similar food waste. If not properly managed, this waste can represent a serious threat to both the environment and human health given its high degradability and rotting propensity. On the other hand, if properly managed, OFMSW could be an important source of energy and materials to replace fossil and other raw mineral resources. Among the possible options available for OFMSW treatment, anaerobic digestion (AD) has been successfully used for recovering material (e.g., nutrients and organic carbon) and energy [1,2]. AD can also play an important role in the waste management sector for substituting fossil fuels with biogas [3] and in improving the energetic efficiency of the whole biological treatment of the OFMSW. The energetic performances together with biogas yields of the AD of OFMSW have been widely investigated in the literature. Bio-methane yields, expressed in normal liter (NL) (P = 101,325 Pa, T = 27,314 K) per kg of volatile solids (VS), ranging from 201 NL/kgVS to 430 NL/kgVS have been reported by several authors for full, pilot, and lab-scale apparatuses [2,4,5,6]. For full-scale facilities, the amount of energy recoverable ranged from about 200 kWh/Mg to 360 kWh/Mg depending on OFMSW features, plant size and the adopted technologies [2,7].
Full-scale technologies currently in use are mainly wet and dry techniques equipped with continuous flow digesters that are able to process substrates with a total solid (TS) concentration of <15% w/w and <25% w/w, respectively. Before being processed in such facilities, the OFMSW requires important pre-treatments, such as mechanical sorting, shredding, metal separation, moisture increase, and pulping, which are costly and complex operations affect the viability of AD [8]. On the other hand, the main outputs from AD are biogases rich in methane (i.e., about 60% v/v) and carbon dioxide (i.e., about 40% v/v) and a digestate rich in nutrients and organic carbon characterized by a moisture content (MC) of usually >80% w/w. A digestate with a high MC is another important technically and economically negative aspect when using AD for waste in many EU areas [9]. In these cases, the digestate generally undergoes a preliminary solid/liquid separation. The liquid fraction is generally processed in wastewater treatment plants before disposal, whereas the solid fraction is composted for recycling. In addition to being a further increase in cost, the dewatering process can remove up to 80% of the nutrients from the solid fraction of the digestate, consequently reducing the concentration of the nutrients in the final soil amendment [10]. As already demonstrated in previous studies [2,11,12], a solid anaerobic digestion batch (SADB), which operates with TS up to 40% w/w, can significantly reduce these problems even if biogas yields are lower. The amount of liquid digestate generated spontaneously during SADB is usually <10% w/w of the amount of OFMSW processed [2], whereas the solid digestate is directly treatable in the successive post-composting (PC) phase. As reported by several authors, the PC treatment is a mandatory step for reducing the residual phytotoxicity of the digestate and for achieving a high quality and stabilized soil amendment [13,14,15,16]. Among the different properties required for high quality organic fertilizer, the organic carbon concentration [17,18,19] is of particular interest given its importance in carbon sink (Csink) restoration in soils [20] and CO2 storage [21]. During biological treatments, the organic matter is affected by two main processes: mineralization and humidification. Mineralization transforms organic carbon into non-gaseous and gaseous product (mainly CO2 and/or CH4), whereas humidification creates new stable organic substances (e.g., humus), characterized by amendment properties. Humus is a composition of humins, humic acids (HA), and fulvic acids (FA). For this reason, biological treatments aimed at material recovery from OFMSW should generate amendments with a high, but also a stable organic matter content. Evaluation of organic matter together with the HA and FA concentrations has been found to be a suitable approach for assessing the quality of the amendment obtained after biological treatments [17,19]. Similarly, Binner et al., Di Maria et al., and Smidt et al. [17,18,19] showed how non-intensive AD pre-treatment followed by PC can enhance HA and FA production, resulting in an organic fertilizer with a higher stabilized organic carbon concentration. Energy recovery combined with high quality organic fertilizer production is a key factor in improving the environmental sustainability of OFMSW recycling. Life cycle assessment (LCA) has been widely used in the literature for comparing different options for OFMSW management based mainly on the adoption of composting, AD, and incineration [22,23,24,25,26,27]. The recycling option based on composting has been reported to be environmentally credited due to the replacement of mineral fertilizers [22], but direct and indirect emissions from the process generate an environmental burden. Composting was indicated by Kim and Kim [23] as one of the most sustainable options for food waste management on the basis of global warming potential and avoided resources. In analyzing different options for organic waste from the winery industry, Ruggieri et al. [24] reported similar results, indicating that composting was the most environmentally sustainable option. Antonopoulos et al. [25], however, found that AD gave better environmental performances compared to composting for the Peloponnese region. In a similar study performed in Singapore by Khoo et al. [26], AD was indicated as the treatment able to mitigate greenhouses gas emissions compared to composting and incineration. On the other hand, Di Maria et al. [27] reported a lower impact for incineration compared to AD with post-composting with the exclusion of the human toxicity potential. All these studies indicate that there is no definitive agreement on which treatment system is most suitable for OFMSW.
For this reason, the aim of this study was to use a life cycle assessment perspective (LCA) to study the global impact and greenhouse gas emissions (GHG) for three different treatment schemes of OFMSW based on:
(1)
Exclusively aerobic treatment (COMP);
(2)
Integrated treatment based on non-inoculated SADB followed by post-composting of the digestate (SADBPC); and
(3)
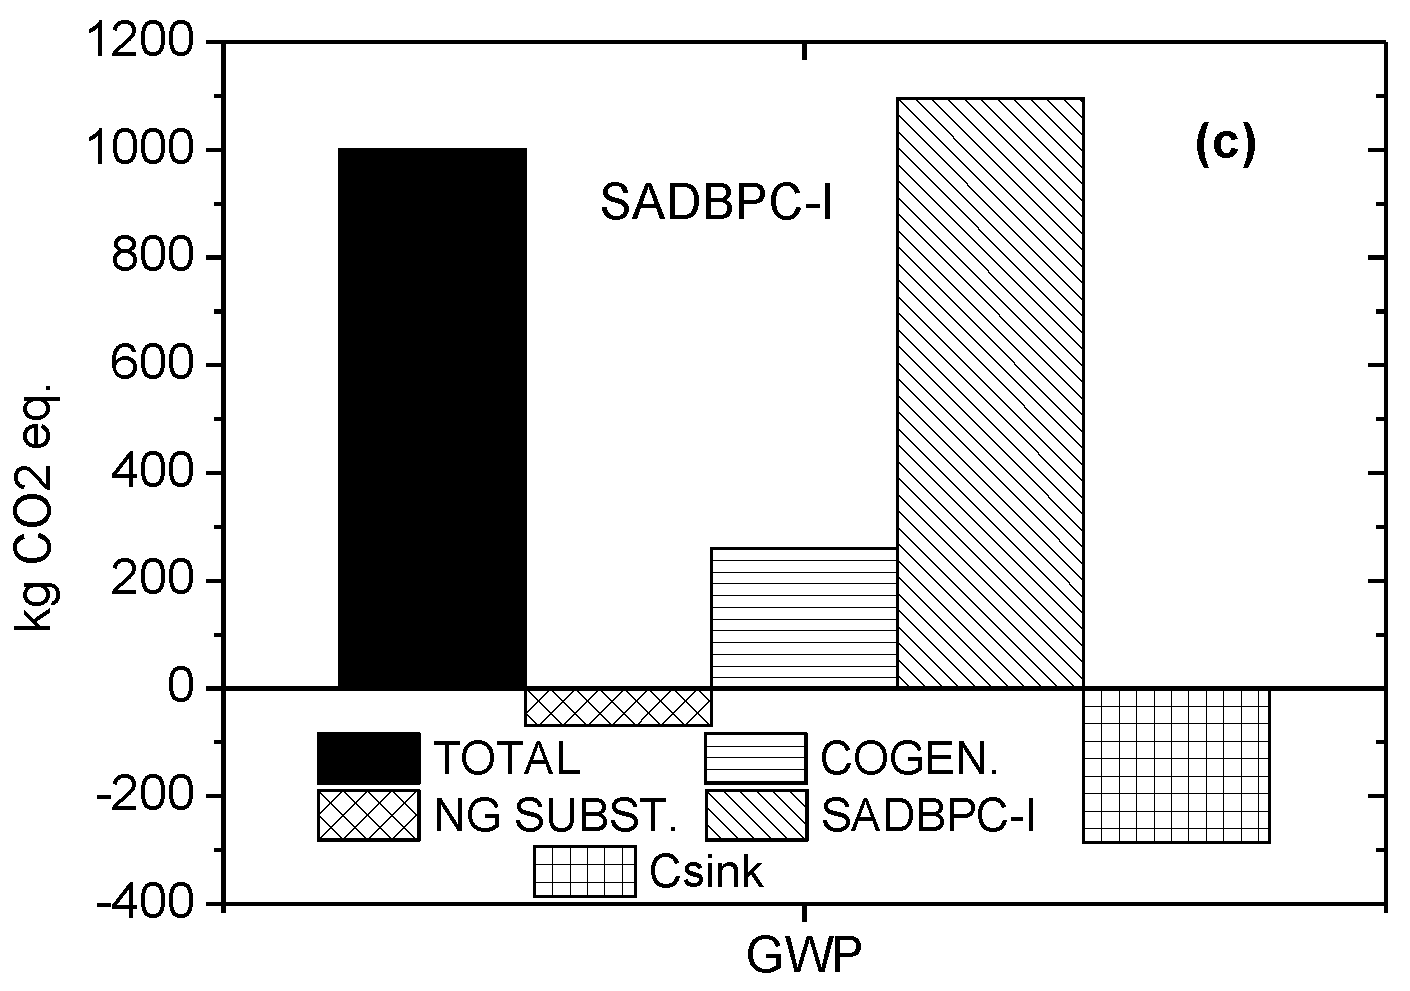
Integrated treatment based on inoculated SADB followed by post-composting of the digestate (SADBPC-I).

2. Material and Methods

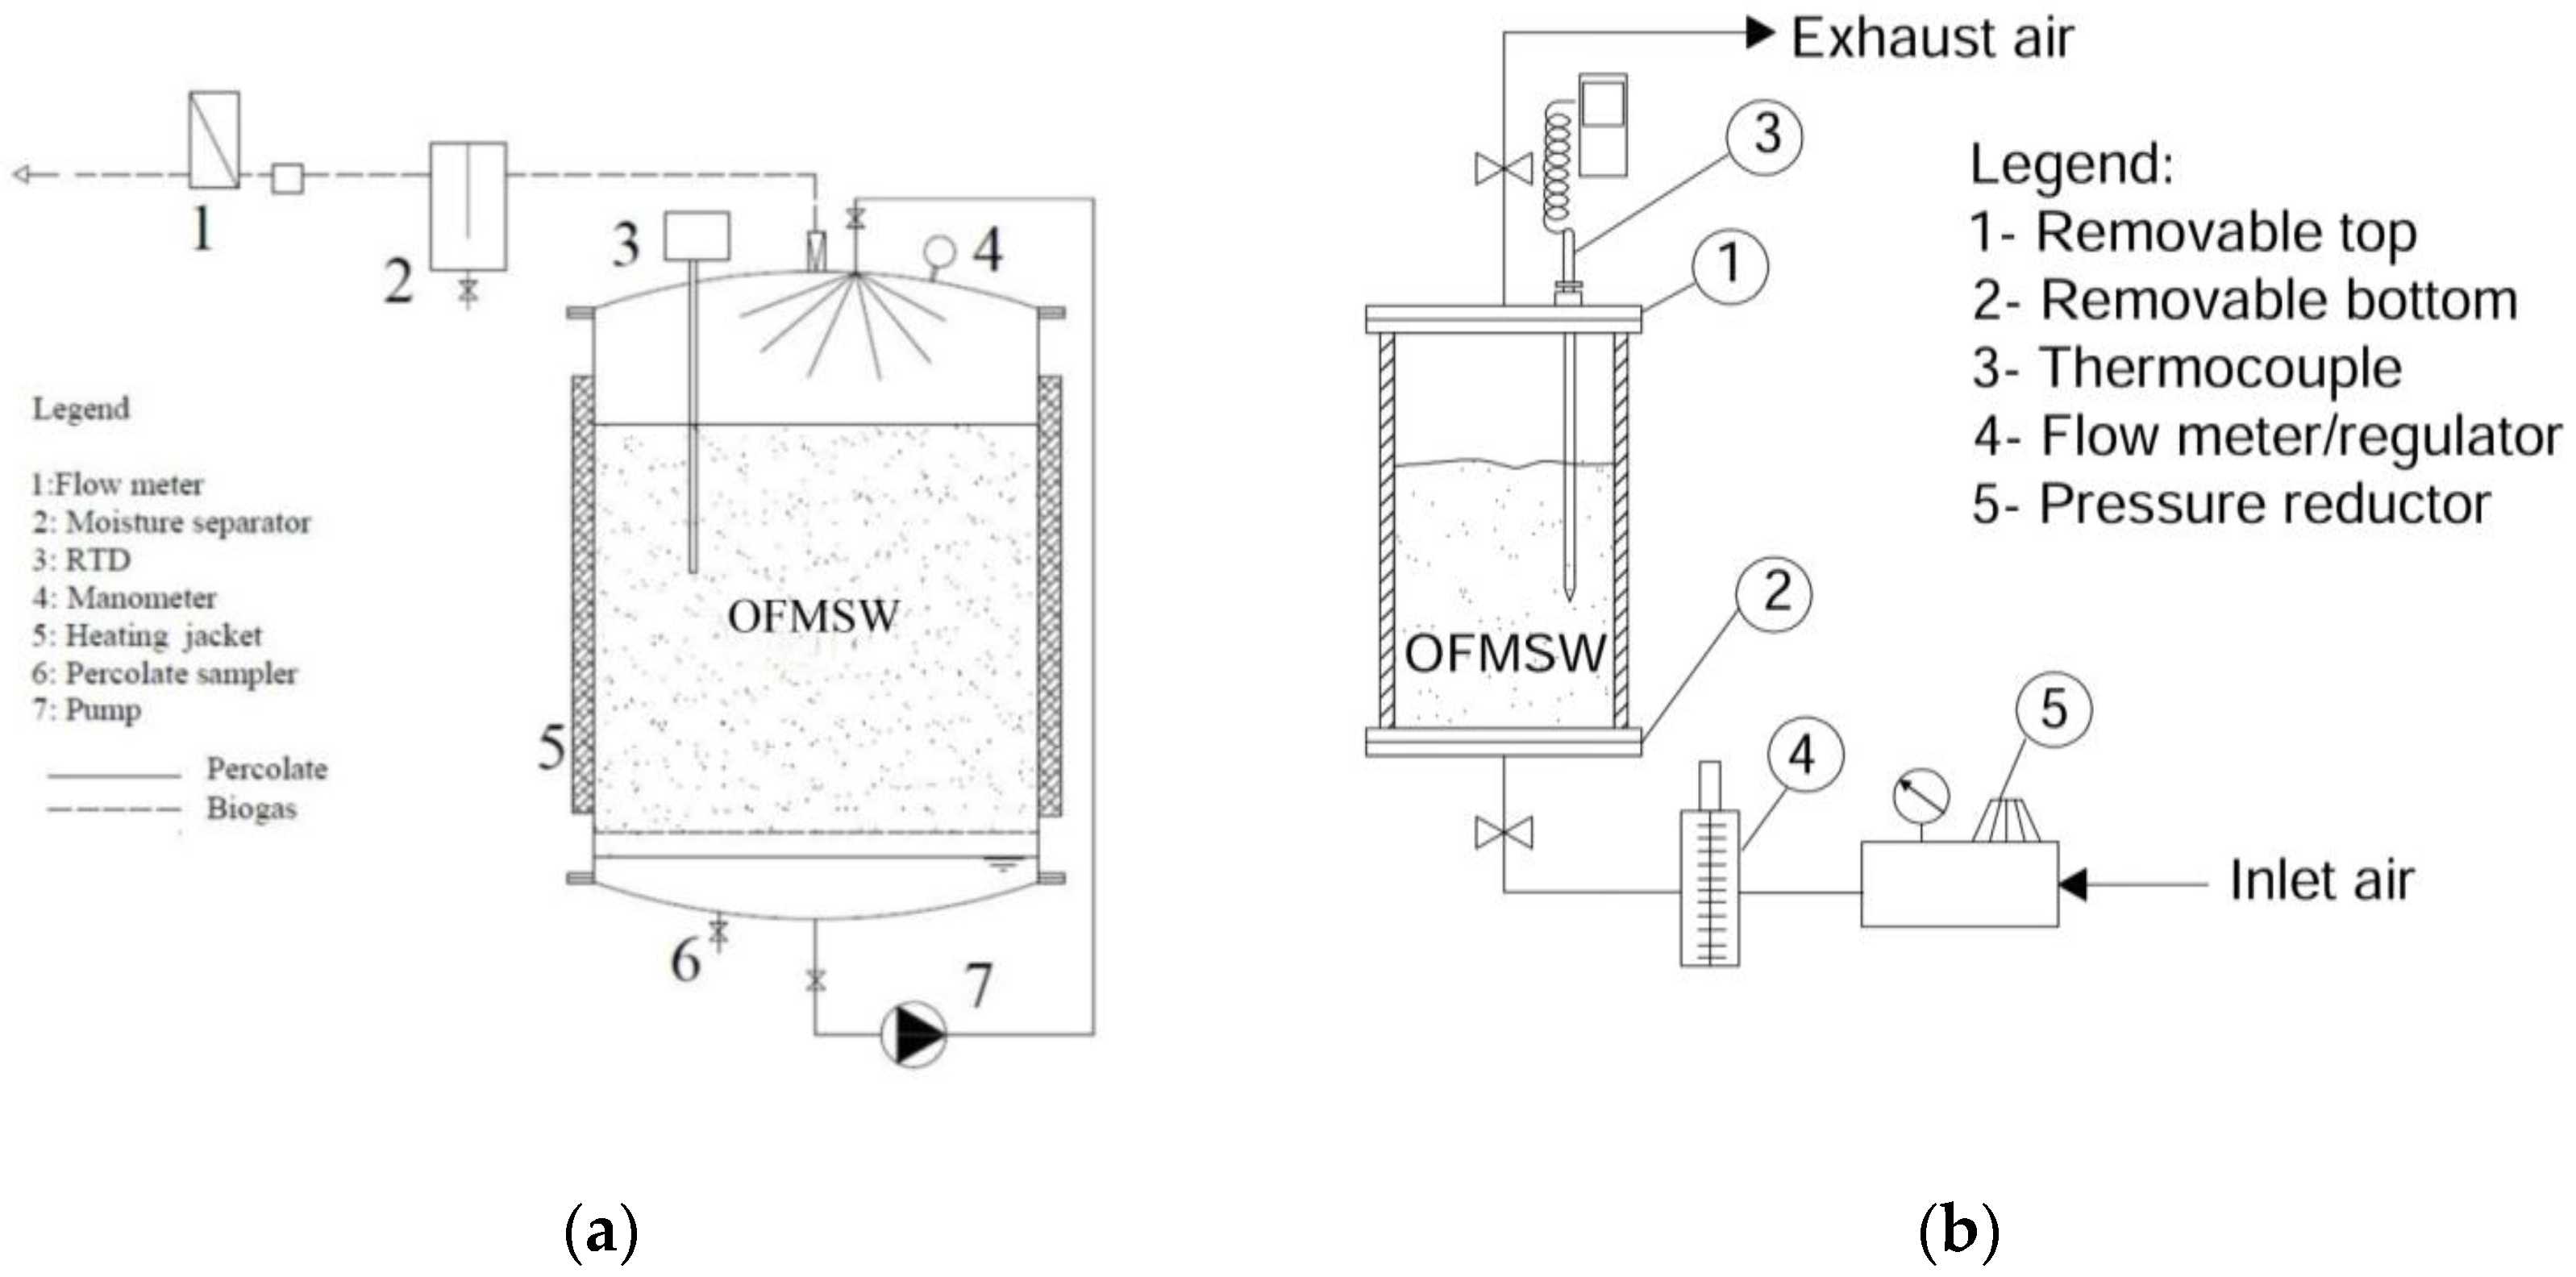
2.1. Pilot-Scale Apparatus and Run Procedure

Three separate pilot-scale apparatuses were used; one for performing the SADB test and two for performing the aerobic processes. The pilot-scale apparatus used in analyzing the SADB was the same as that reported in References [2,14]. Briefly, it consisted of a 100-L gas-tight anaerobic reactor with a removable top (Figure 1a). The temperature of the OFMSW mass was maintained at 35 °C ± 2 °C with the aid of a thermal heating jacket wrapped around the digester as well as a 2 cm thick insulated layer. The temperature was continuously monitored with a resistance temperature probe inserted inside the processed substrate. During each test, a temporized pump withdrew a given rate of liquid digestate from the reactor bottom and spread it on the OFMSW on the top of the reactor. Gas produced during the process was continuously withdrawn from the reactor top, piped first to the dehumidification system and then to the thermal gas flow meter (±0.1 FS). Gas composition was determined with infrared sensors for CH4 and CO2 concentrations (% v/v) (±1%) and with electrochemical cells for O2 and H2S (% v/v) (±2%) (portable gas analyzer, model: GA5000, Geotech, Sovereign House, Queensway, Leamington Spa, UK).
Aerobic processes were conducted in a gastight HDPE cylindrical reactor, 30 cm in diameter and 100 cm high (Figure 1b) equipped with a removable top and bottom. Each cylinder (one for the integrated SADB with post-composting and one for the exclusively aerobic test) was filled with the solid digestate generated by the SADB and with fresh OFMSW, respectively. Five cubic meters (5 mn3) of air per kgVS of substrate of processed air delivered by a compressor was injected at the reactor bottom and withdrawn from the reactor top. A pressure reduction system coupled with a flow meter/regulator was used for setting an adequate amount of air, whereas the process temperature was monitored by the aid of a thermocouple inserted directly in the processed material.
Samples used for the tests were generated from about 100 kg of fresh OFMSW withdrawn during different periods of the year from vehicles returning from collecting separated waste in a waste management district in central Italy. After the preliminary, manual removal of impurities and bulky components, the OFMSW was mixed and two large samples >20 kg were generated. One sample was processed exclusively using the aerobic apparatus (i.e., composting, COMP), whereas the second sample was first processed by the SADB and successively by the aerobic apparatus (i.e., post-composting, SADBPC). Both tests started simultaneously and lasted for 90 days. In the integrated SADBPC, the OFMSW was first processed anaerobically for 30 days and then the solid digestate was further processed aerobically for another 60 days. Six parallel runs were performed. During the first three SADBPC runs, the SADBs were performed without inoculum, whereas in the second three tests (SADBPC-I), the OFMSW was mixed 1:1 by weight with the digestate generated from the previous run before SADB (SADB-I).
At least three samples were withdrawn at the beginning and end of each test.

2.2. Chemical Characterization

Total solids (TS), moisture content (MC), and volatile solids (VS) were determined according to standard methods [28]. The pH was determined by the use of a glass electrode and a 1:10 w/v solid/water suspension. The total organic carbon (TOC) content was determined by the Springer-Klee wet dichromate oxidation method [28]. Fresh samples were used for the total Kjeldahl-N macro-Kjeldahl distillation methods, respectively [29]. Humic (HA) and fulvic (FA) acids together with total extractable carbon (TEC) of the final compost were evaluated according to the procedures previously reported in References [30,31,32,33]. The degree of humidification (DH%) was also calculated as the percentage of the ratio (HA + FA)/TEC. All analyses were carried out in triplicate.

2.3. Life Cycle Analysis

Life cycle analysis (LCA) was performed with the aim of assessing the impact and the amount of GHG emissions as kgCO2eq generated by the different treatment schemes of the OFMSW. The study was performed in compliance with ISO 14040 [34] and ISO 14044 [35], as well as also following the indications of the international reference life cycle data system (ILCD) Handbook [36]. Calculations were performed using SimaPro 8.3.0 (Prè Consultants, Amersfoort, Netherlands).

2.3.1. Scope, Context Situation, and Functional Unit

The functional unit was the biological treatment of the OFMSW generated in a given Italian waste management district aimed at producing an organic fertilizer for agricultural use. In this case, the amount of mineral fertilizer substituted as N, P, and K was assumed to be the same for all scenarios and was consequently neglected as was the disposal of the waste generated. Biogas was used as the fuel for electrical energy recovery by co-generators. The replacement of organic carbon supplied by other soil amendments such as peat or straw was not considered in this study. One Mg of OFMSW was considered as the reference flow and the final MC of the organic fertilizer was assumed to be 40% for all scenarios. The backgrounds of the exclusively composting (COMP) scenario (Figure 2a) were represented by OFMSW, energy and fuels, whereas the foregrounds were emissions and stabilized organic carbon able to restore the carbon sink of soils. For both SADBPC (Figure 2b) and SADBPC-I (Figure 2c) scenarios, the amount of electrical energy recovered by the co-generators fuelled by the biogas was greater than the amount of energy required by the PC phase. For these reasons, the background scenarios were OFMSW and fuels. Foregrounds were emissions, energy and stabilized organic carbon. To consider multi-functionality, the boundaries of the systems were expanded. Furthermore, considering that the systems interact with other systems, according to the ILCD [36], the context situation was C1.

2.3.2. Life Cycle Inventory Framework

Even if the amount of waste entering the system was considered constant, different schemes affect the amount of effectively replaced electrical energy as the amount of stabilized organic carbon generated. According to the context situation C1, the life cycle inventory (LCI) framework was considered important for analyzing the consequences in the changes of the replaced energy and restored carbon sink. According to Turconi et al. [37], natural gas has been considered as marginal energy for Italy to be substituted by the energetic recovery from the biogas. Similarly, natural gas has also been considered as the primary energy consumed for the energy needs of the COMP scenario.

2.3.3. Life Cycle Inventory (LCI) of Composting

The inventory of direct emissions from the composting process was retrieved from the European Commission [36] (Table 1). Indirect emissions were energy consumption due to electric fans for process air supply and emission control and fuels for the shredder, wheeled loader, and other vehicles used for OFMSW and compost handling. As reported in other studies described in Reference [38] the electrical energy consumption was assumed to be 40 kWh/Mg OFMSW at the plant inlet, whereas fuel consumption was assumed to be 0.134 kg/Mg OFMSW for diesel. Due to its limited influence, the latter was included in the direct emissions for biological processes in the LCA. The generated compost was considered as effectively exploited for agricultural soils. Consequently, carbon sequestration was calculated as 3.67 kg CO2 avoided for each kg of stable organic carbon contained in the fertilizer.

2.3.4. LCI of Solid Anaerobic Digestion Batch (SADB) and post-composting (PC)

Emissions from internal combustion engines fueled by biogas were retrieved and adjusted from Ecoinvent 3.0 [39] (Table 2), where the net electrical efficiency was assumed to be 37% [40]. Biogas upgrading for bio-methane generation used for both injection in natural gas networks and as fuel for transport was not considered due to the absence of fully implemented inventories on the different upgrading technologies currently adopted [41]. Direct emissions of the SADBPC and SADBPC-I processes were retrieved from both the European Commission [36], concerning the SADB, and from the composting process (see Section 2.3.3), for the PC. Additionally, the amount of electrical energy required by PC was assumed to be 40 kWh/Mg and was completely supplied by the energy recovered from the biogas. This meant that the amount of energy replaced was the net generated by the treatments investigated. The amount of liquid digestate generated during the integrated treatment SADB and PC was assumed to be negligible. Furthermore, carbon sequestration due to the effective exploitation of the final compost for agricultural use was accounted as 3.67 kgCO2 avoided per kg of stable organic carbon.

2.3.5. Selection of Impact Categories

The ILCD midpoint impact assessment method was used [36]. Impact categories were (Table 3): global warming potential at 100 years (GWP); ozone depletion potential (ODP); human toxicity, non-cancer effects (HTnc); human toxicity, cancer effects (HTc); particulate matter (PM); photochemical ozone formation (POF); acidification (A); eutrophication terrestrial (ET); fresh water eutrophication (FWE); fresh water ecotoxicity (FWec); water resource depletion (WRD); and mineral, fossil, and renewable resource depletion (RD). To obtain an impression of which of the impact categories above-mentioned was most affected by the scenarios considered, a normalization procedure was used. This procedure was based on normalization factors representing the domestic extraction of resources and emissions per person with respect to the year 2010 of the EU 27 citizens (Table 3).

3. Results and Discussion

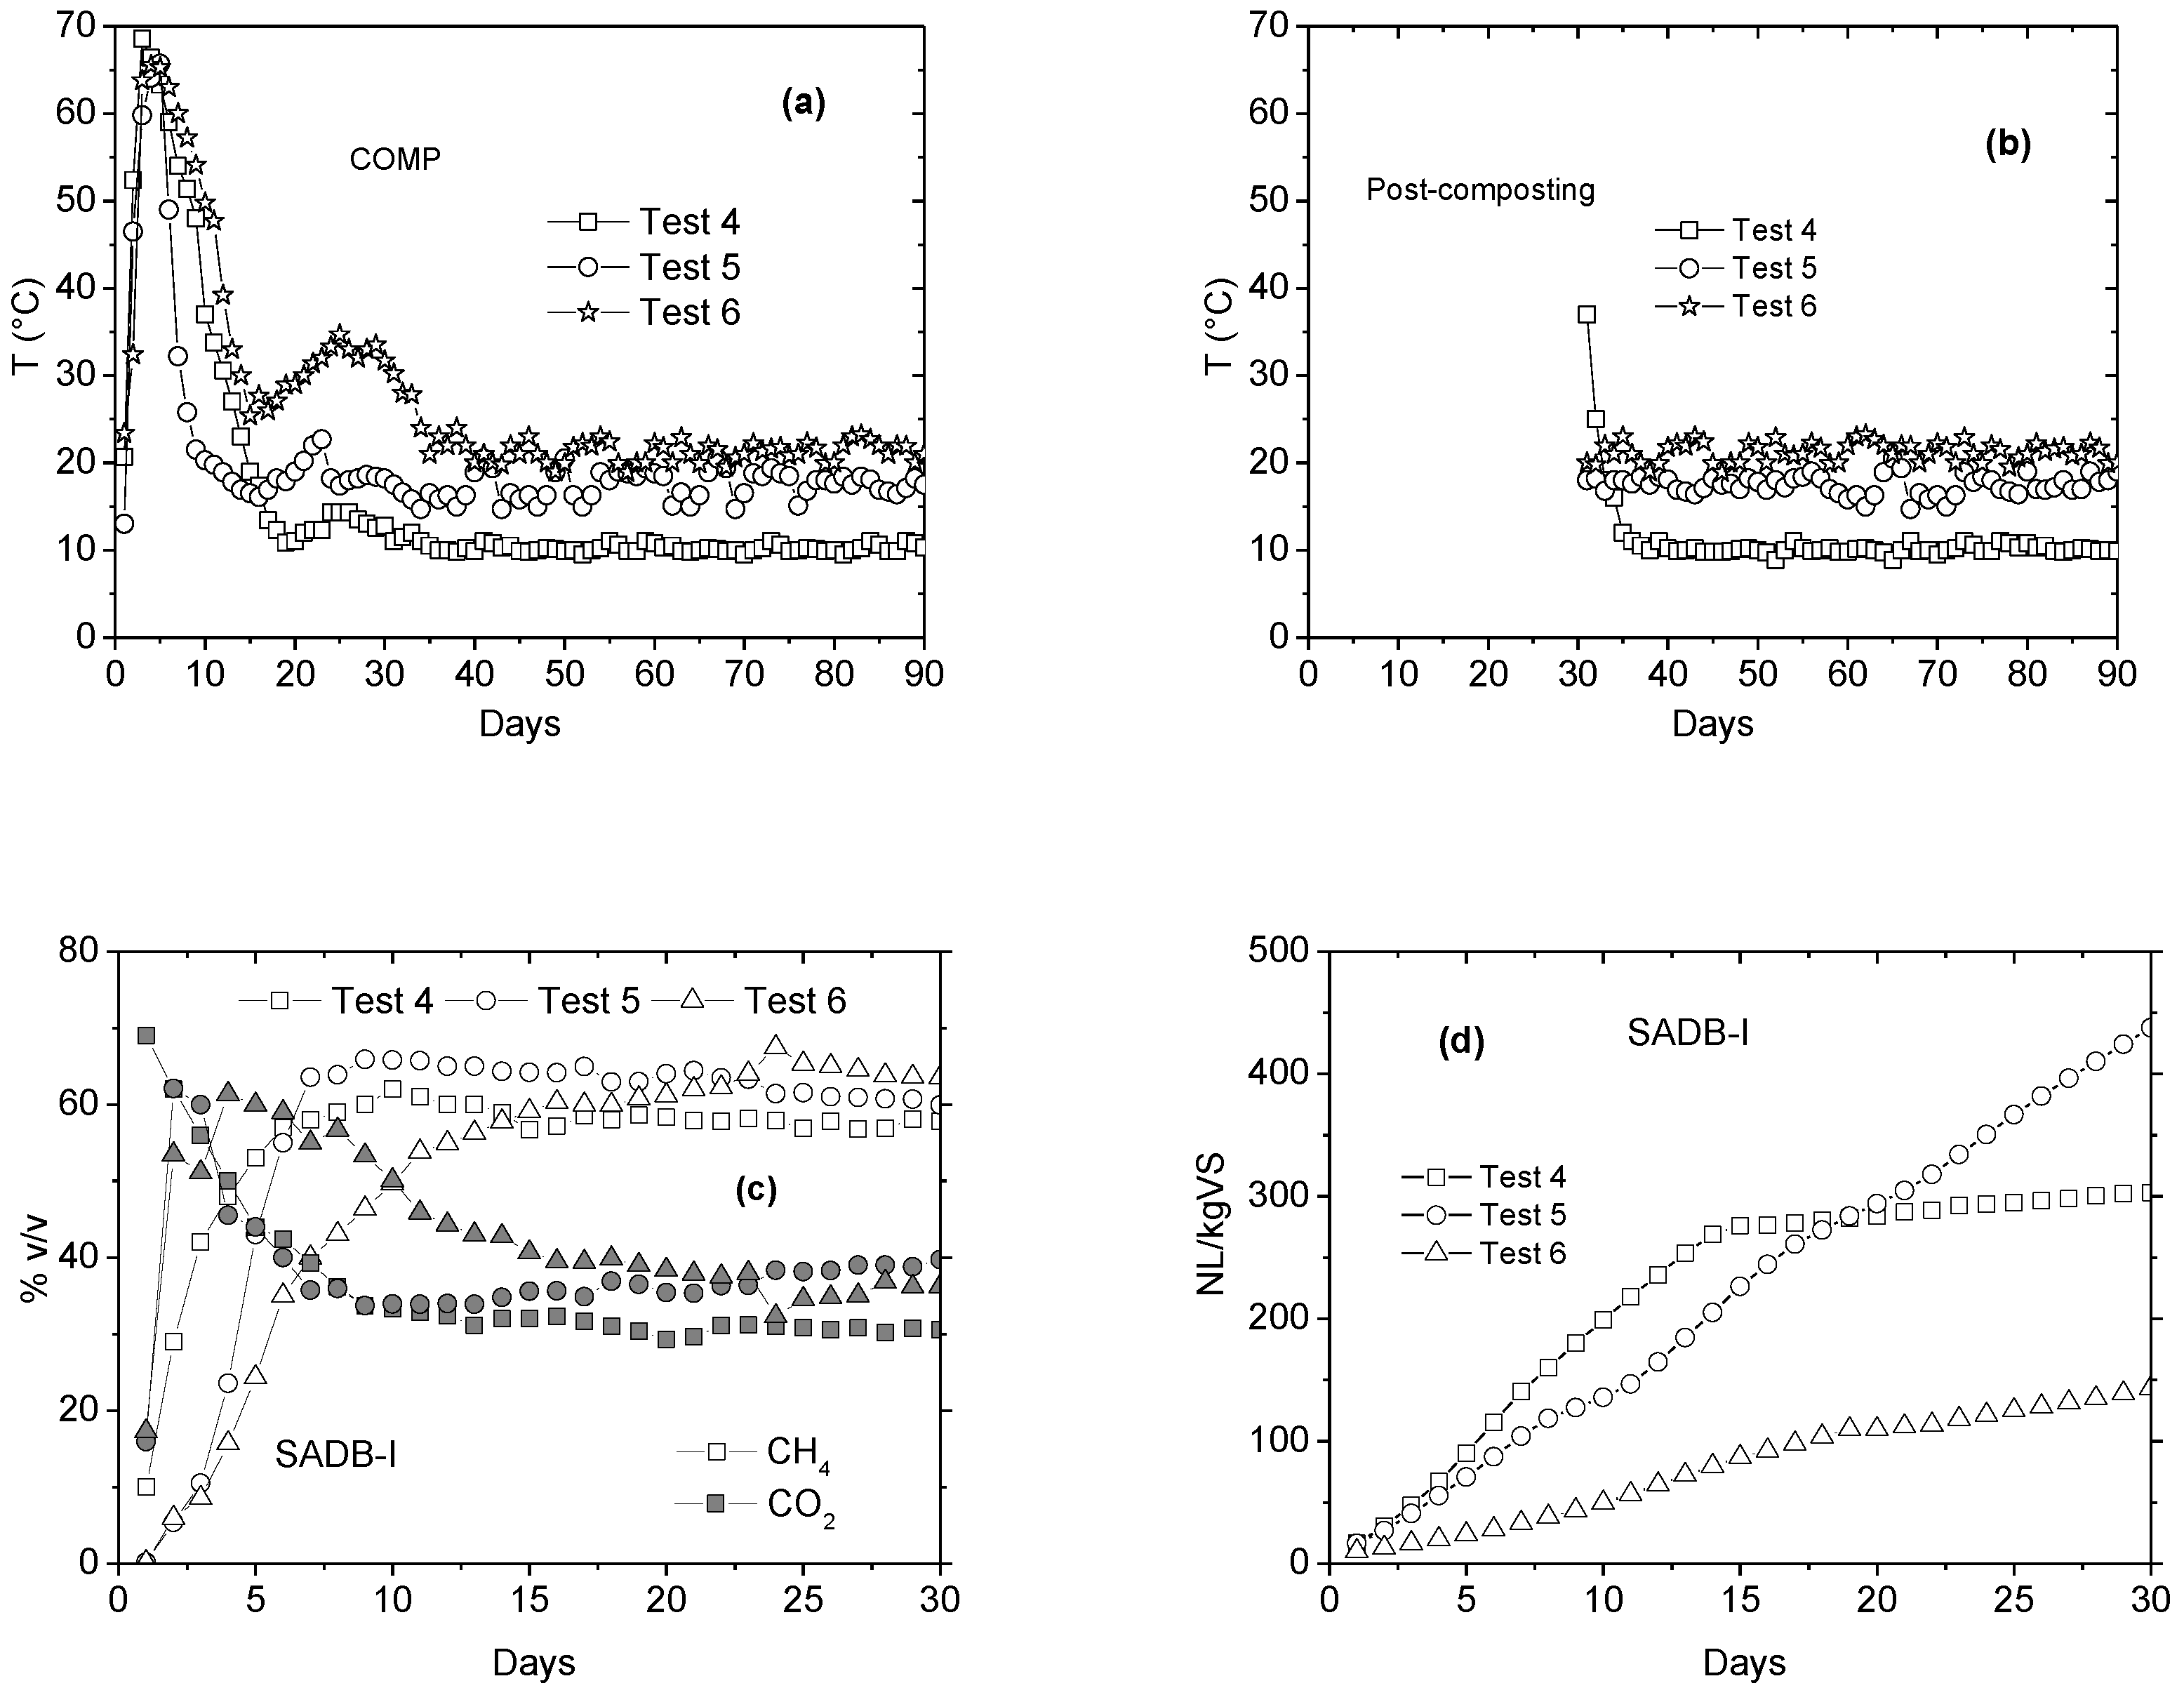
3.1. Experimental Test

Chemical characterization of the OFMSW samples (Table 4) showed values consistent with those reported by other authors. MC ranged from about 50–65% w/w, whereas the VS concentration ranged from about 60% to about 77% TS. The organic carbon concentration varied from about 30% TS up to 38% TS, whereas TKN varied from 0.86% TS to 1.99% TS. HA + FA concentration ranged from about 7% TS to about 11% TS with a DH generally lower than 60% with the exception of Sample 1 for which DH was about 72%. As expected, all samples had quite acidic pH values with the exception of Sample 5. The variance (σ2) associated with the average values in Table 4 indicated a limited dispersion of values. For biogenic waste from a separate collection, Smit et al. [19] reported a TOC ranging from 26% TS to 47% TS, with a corresponding VS concentration ranging from 60–85% TS. On the other hand, an MC of 73% w/w, a VS concentration of 93% TS, a TOC of 29% TS and TKN of 2.7% TS were reported by Di Maria et al. [12] for the source-segregated organic fraction of solid waste.
The absence of temperature increases during post-composting (Figure 3b and Figure 4b) when compared to that recorded during COMP (Figure 3a and Figure 4a), confirmed the ability of SADB to mineralize organic compounds. The amount of biogas generated per kgVS during SADB-I was, in general, higher than that of SADB (Figure 3d and Figure 4d), with the exception of test 6. In fact, on average, SADB-I generated about 300 NL/kgVS versus about 267 NL/kgVS for SADB. The maximum methane content in the biogas (about 60% v/v) was quite similar for both tests even if it increased more rapidly during the first days for SADB-I (Figure 3c and Figure 4c). The lower biogas production for test 6 was a consequence of the higher TS concentration (Table 4), generating an increase in mass transfer resistance through the media [42]. Both biogas yield and its relation to TS content and process inoculation were in accordance with the data reported by other authors [4,12,43,44,45].
At the end of the 90th day of treatment, there was a higher concentration of TOC for the SADBPC tests (Table 5). For tests 1 and 2, the TOC of SADBPC was from 10–14% higher than for the corresponding COMP runs. There was a smaller difference for test 3 (i.e., about 0.7%). Similar results were also obtained for DH.
Contrasting results were found for SADBPC-I (i.e., tests 4–6). In fact, both the TOC concentration and DH were lower in comparison to the corresponding values obtained at the end of the COMP run (Table 5). These findings indicated that the quality of the amendment in terms of TOC, HA, and FA content was higher for the integrated SADBPC treatment with respect to both SADBPC-I and COMP. The main components of HA and FA were organic carbon and nutrients (e.g., N), which are compounds in a stable form useful for crops and for improving the agricultural properties of soils [17,46]. The final concentration of HA and FA was influenced by several factors among which were their initial concentration in the fresh OFMSW, their compositions, a well-balanced proportion between reactive and less reactive components and the nature and intensity of the processes. As demonstrated by Binner et al. [17] the lack of well-balanced reactive and less reactive organic compounds limited the humidification process. As seen in Table 5, these conditions were well respected during SADB in contrast to SADB-I.
The ability of more intensive anaerobic digestion (i.e., SADB-I) to mineralize the organic matter with limited effect on the humic generation process was also reported by Marcato et al. [47] and Tambone et al. [48,49]. In analyzing more than 200 composting and integrated anaerobic and aerobic treatment facilities for bio-waste, Binner et al. [17] reported that the amendment with the higher HA concentration was obtained by an anaerobic pre-treatment lasting for a short period (i.e., less intensive). Similar results were also reported in References [15,19,50]. The average amount of fixed TOCf (calculated as TCO-NH) per Mg of fertilizer at 40% humidity was 128 kg/Mg for COMP; 149 kg/Mg for SADBPC; and 104 kg/Mg for SADBPC-I (Table 5). Correspondingly, the amount of CO2eq stored per Mg of fertilizer exploited for agricultural use was 470 kgCO2 eq/Mg for COMP; 545 kgCO2 eq/Mg for SADBPC; and 382 kgCO2 eq/Mg for SADBPC-I.

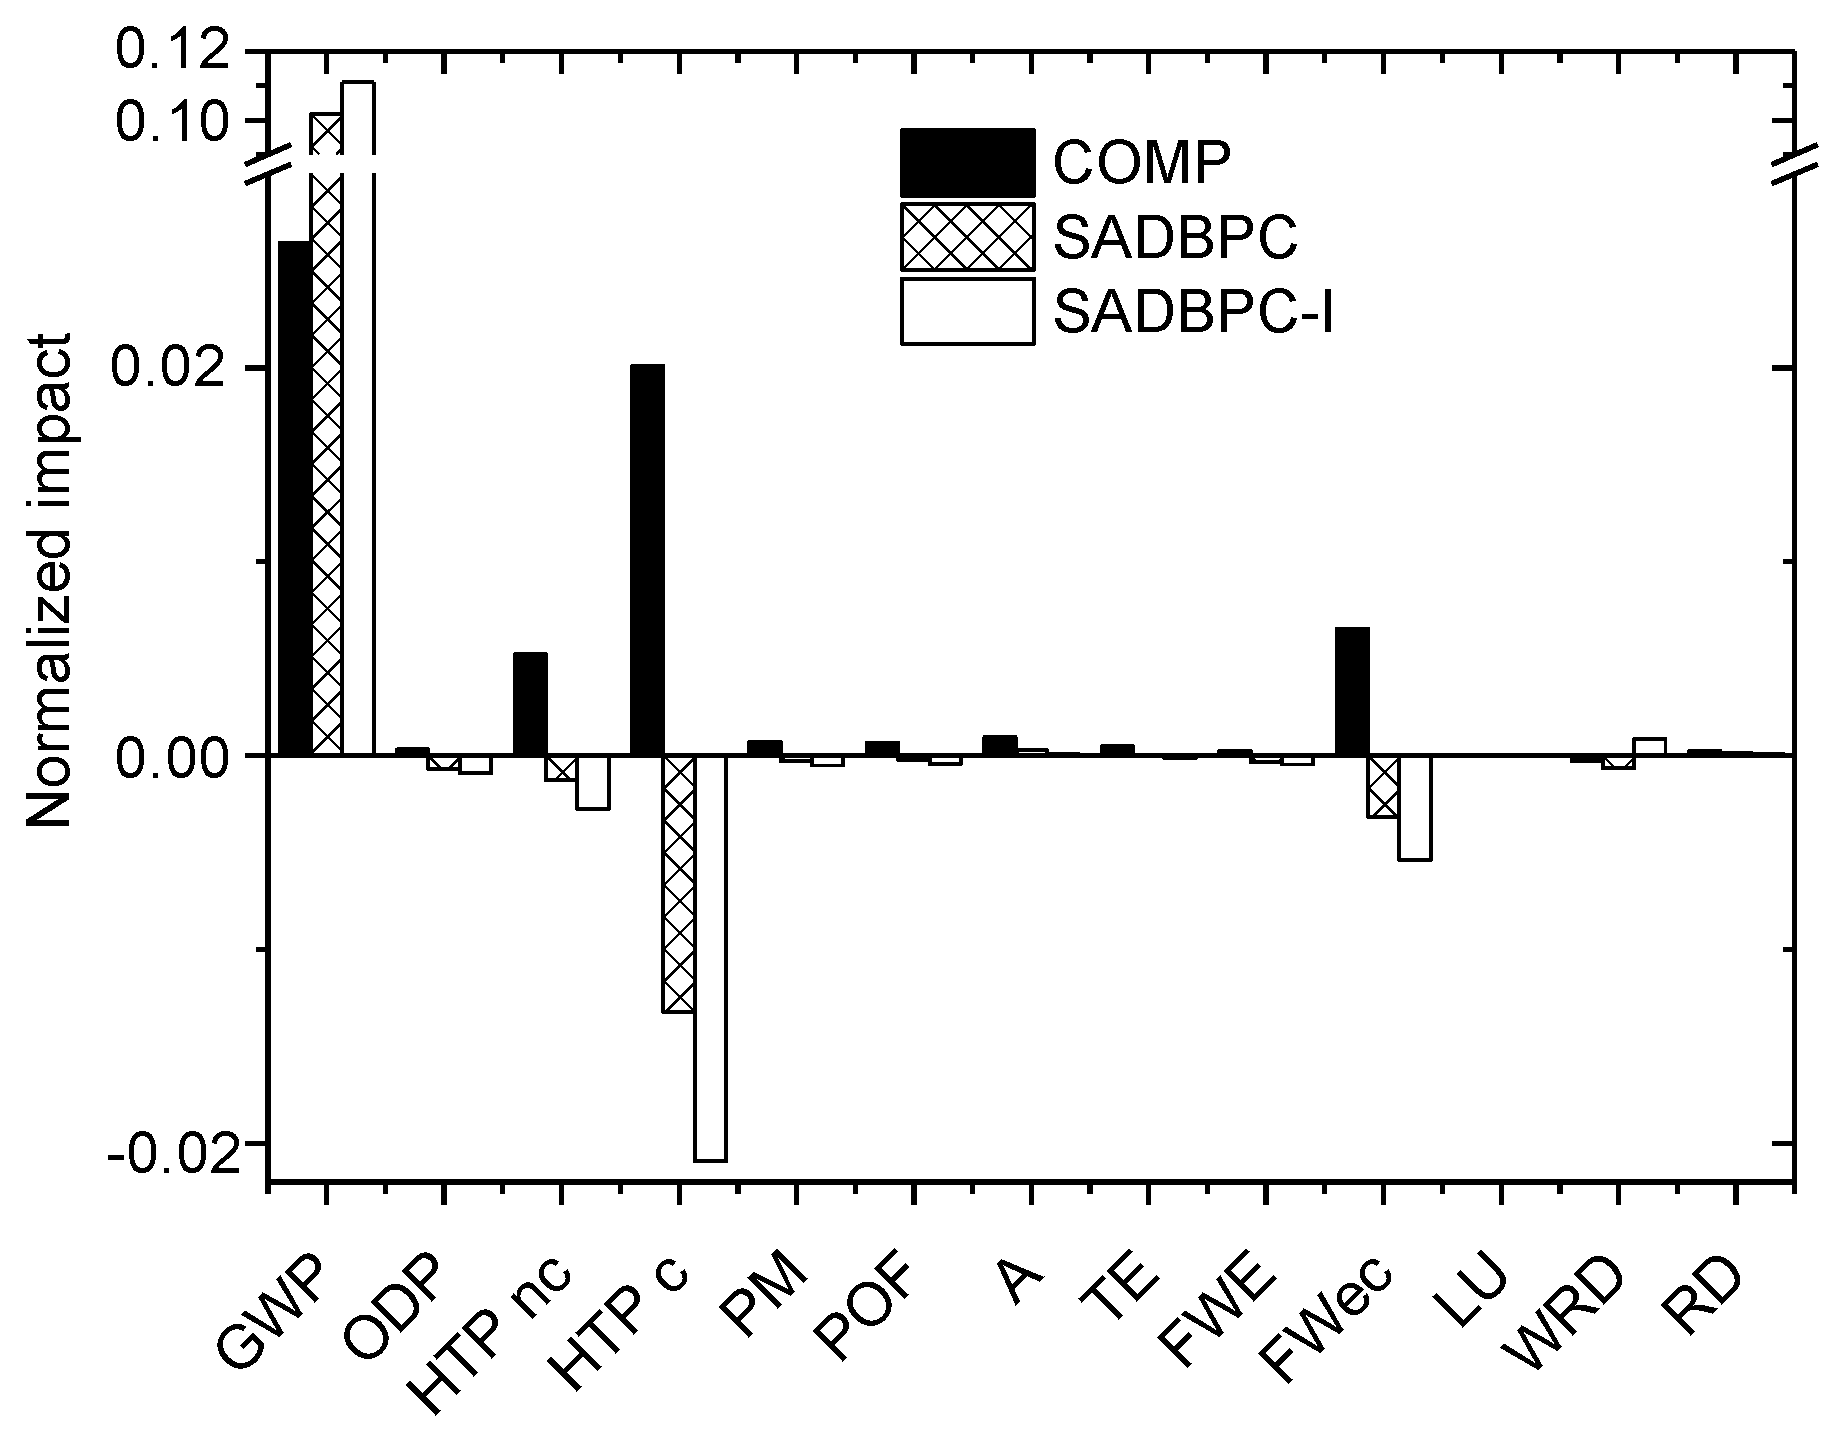
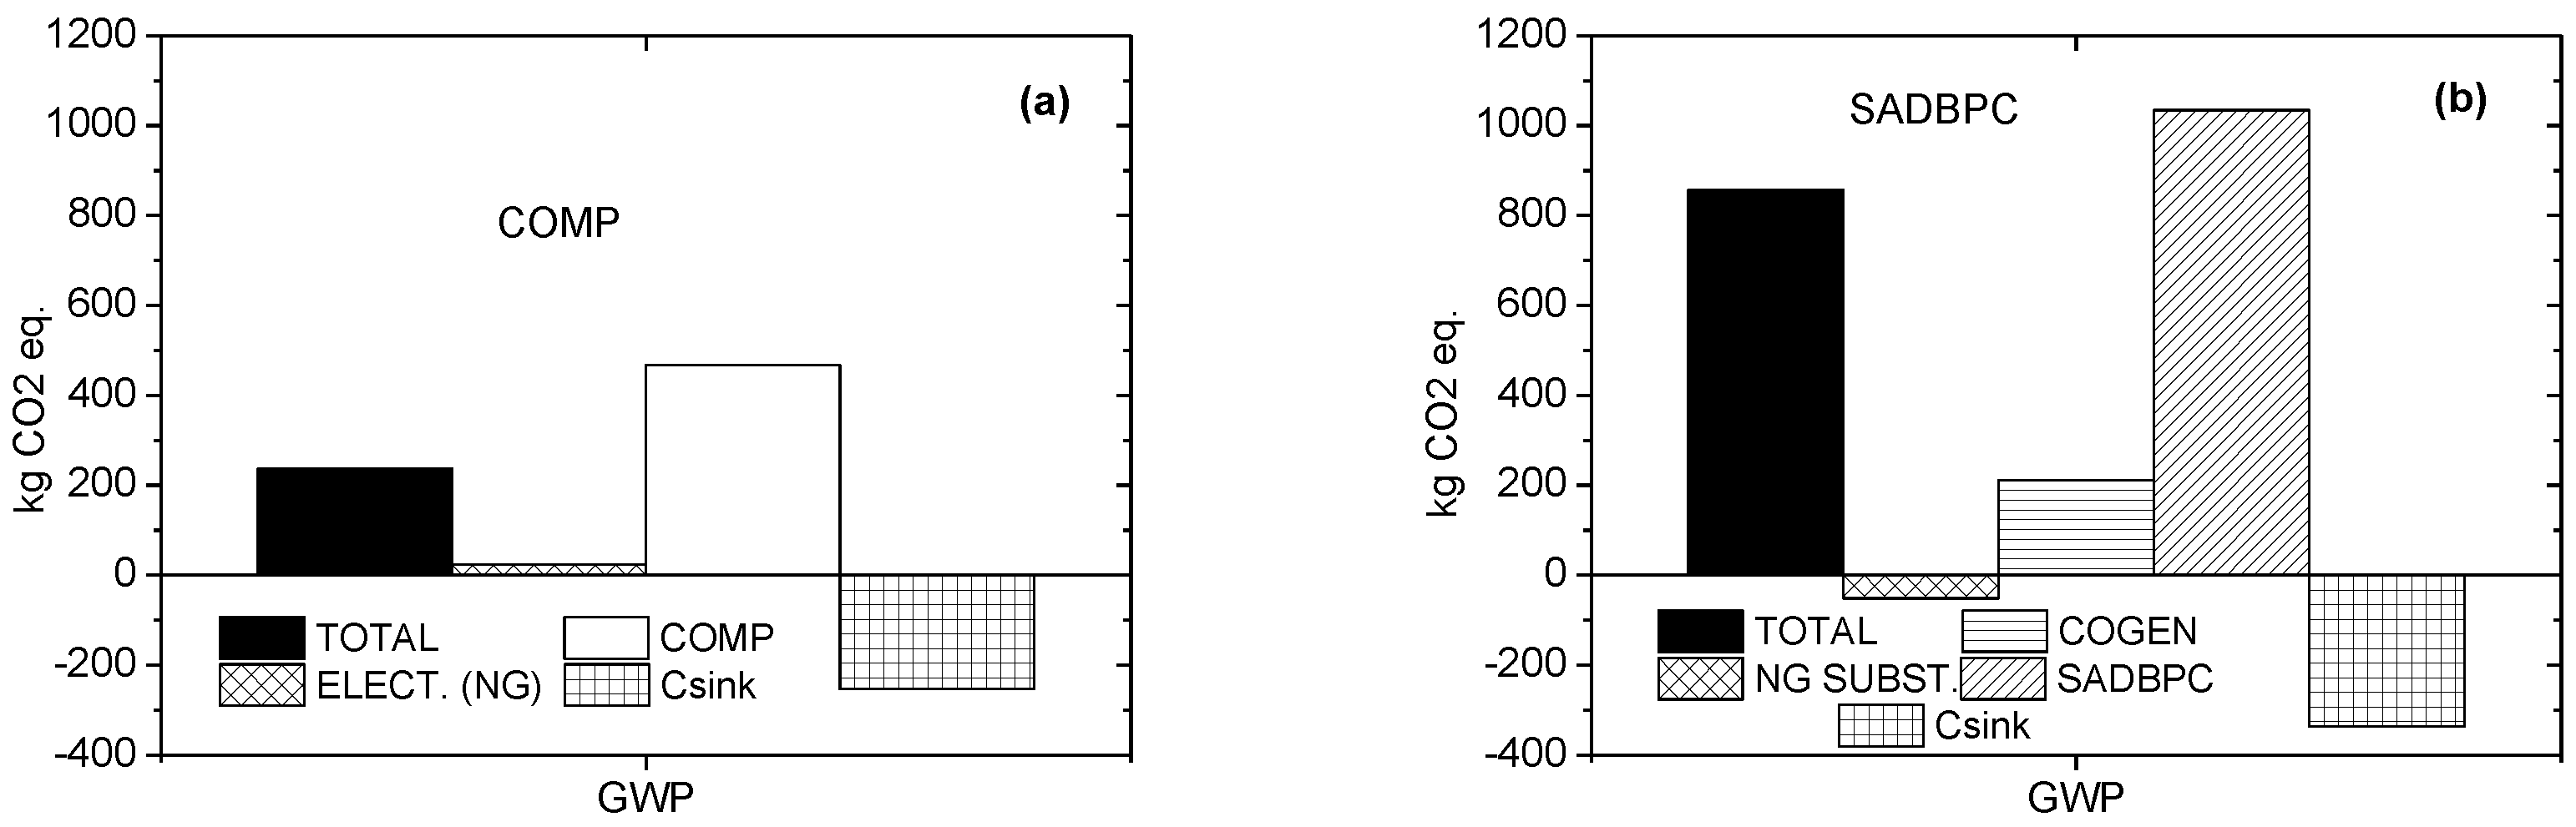
3.2. Life Cycle Assessment (LCA)

From an environmental point of view, normalization of the impact categories highlighted that the ones most affected by the considered scenarios were GWP, HTPc, and FWec (Figure 5). Avoided emissions were detected for both integrated treatment scenarios, particularly for SADBPC-I. The COMP scenario always showed practically positive values for the impact categories.
In other studies concerning the environmental performances of organic waste recycling and treatment, a relevant contribution to avoided impacts was assigned to the replacement of fossil fuels by biogas recovery and mineral fertilizer by organic ones presented in References [22,51]. Khoo et al. [26] reported that an integrated treatment of food waste based on AD and post-composting showed lower impacts for global warming, acidification, and eutrophication potentials when compared to exclusive composting treatment. Contradictory results were reported for the photochemical oxidation potential.
Figure 6 shows the contribution of the single processes and components following within the expanded boundaries of the systems analyzed to the total value of GWP (TOTAL). For the COMP scenario (Figure 6a), direct kgCO2 eq emissions from the process were higher than the avoided emissions due to carbon sink restoration, whereas indirect emissions due to energy consumption were quite negligible. For both SADBPC and SADBPC-I (Figure 6b,c), direct and indirect kgCO2 eq were emitted due to biological processes and gas engines (COGEN) were definitively higher than the avoided emissions due to fossil fuel substitution and carbon sink restoration. Limited values of GWP emissions avoided due to natural gas substitution reported in this study were a consequence of the low value of net energy effectively delivered by the integrated scenarios.
A high contribution from the direct emissions of biological process in GWP determination has previously been confirmed in the studies of Blengini [22] and Maulini-Duran et al. [52]. Marginal benefits due to carbon sink restoration compared to the direct kgCO2 eq emitted from the biological process were also consistent with References [27,50]. Similarly, Kim and Kim [23] reported direct GWP emissions from the composting process, about 10 times higher than the emissions avoided due to mineral fertilizer replacement.
As already reported by other authors, in general, GHG emissions generated by biological and non-biological processes are influenced by a high level of uncertainty. In evaluating the GHG effect of coal used in thermal power plants, Maurice et al. [53] found a rather high uncertainty due mainly to the dispersion of values related to the chemical composition of the coal. In analyzing the uncertainty of LCA, Lanzuela et al. [54] reported that there was a large quantitative uncertainty for GWP associated with the integrated management of waste from restaurants and catering in Spain. Furthermore, a high uncertainty for GWP when AD was used for biogas production from defatted algal biomass was also reported by Sillis et al. [55], while Hermann et al. [56] reported higher global warming emissions for composting instead of for AD.
All these results indicate the relevant role that SADB pre-treatment can have in improving the amount of TCOf in the organic fertilizer from OFMSW. However, they also show the environmental burden and related uncertainty associated with the biogenic emissions of these processes. For this reason, a sensitivity analysis was performed by varying the amount of such emissions with respect to the reference ones reported in Table 1.

3.3. Sensitivity Analysis

A sensitivity analysis was performed by varying from ±75%, step ±25%, the emissions in the air for the biological processes starting from the reference ones reported in Table 1. This analysis confirmed the lower GWP emissions for COMP (Table 6). At reference conditions (i.e., 0%) the emissions from COMP were about 28% and about 24% for those of SADBPC and SADBPC-I, respectively. This percentage increased to about 36% and 32%, respectively, direct emissions had an increase of +75%, whereas it dramatically decreased for a reduction in direct emissions of −75%. In these conditions, COMP gave avoided GWP emissions of −111.8 kgCO2 eq/Mg. The main reason for these results was due to the higher GWP emissions associated with the integrated processes compared to exclusively COMP (Figure 6) and the emissions associated with the co-generators exploited for the energetic recovery of the biogas. Both energy for the consumed and replaced natural gas played a minor role, which was not so relevant in detrimentally influencing the whole GWP of the different treatment schemes (Figure 6).
In particular, the environmental gain associated with natural gas substitution by biogas was significantly lower when compared to the direct emissions of the co-generators (Figure 6b,c).

4. Conclusions

Currently, organic fertilizer recovery from organic waste via biological treatments is a largely-implemented and viable option in compliance with the 3Rs (i.e., Reuse, Recycle, and Recovery). Furthermore, the proper exploitation and management of biological processes can also contribute to improving the quality of the final fertilizer and the entire environmental performance of the recycling activities. From an environmental point of view, integrated treatments, performed by anaerobic digestion and post-composting, showed the best performances when compared to exclusive composting for all the impact categories considered, with the exclusion of the global warming potential.
Integrated anaerobic treatments are of some interest since they result in benefits due to fossil fuel replacement and return a stabilized organic fertilizer. Less intensive anaerobic pre-treatment enhances the amount of organic carbon contained in the generated organic fertilizer after the post-composting phase, thus improving the contribution that the waste sector can provide in the restoration of carbon sinks in soils and greenhouse gas (GHG) emission reduction. The global GHG emissions of integrated anaerobic and post-composting treatments results were significantly affected by both direct emissions from the biological processes and from the gas engines exploited for biogas recovery.
On the basis of these results, exclusive treatment through composting resulted in the most reduction in GHG emissions due to organic fraction recycling. Integrated treatment was able to maximize energy recovery, resulting in avoiding the emissions affecting both human health and fresh water toxicity.

Acknowledgments

The present work was also carried out with the economic support of the grant LIFE12 ENV/IT/000411 project of the EC.

Author Contributions

Francesco Di Maria conceived and designed the experiment and the simulation model Federico Sisani performed the experiments and the calculations.

Conflicts of Interest

The authors declare no conflict of interest.

References

  1. Bolzonella, D.; Pavan, P.; Mace, S.; Cecchi, F. Dry anaerobic digestion of differently sorted organic municipal solid waste: A full-scale experience. Water Sci. Technol. 2006, 53, 23–32. [Google Scholar] [CrossRef] [PubMed]
  2. Di Maria, F.; Sordi, A.; Micale, C. Energy production from mechanical biological treatment and composting plants exploiting solid anaerobic digestion batch: An Italian case study. Energy Convers. Manag. 2012, 56, 112–120. [Google Scholar] [CrossRef]
  3. Beurskens, L.W.M.; Hekkenberg, M.; Vethman, P. ECN—Renewable Energy Projection as Published in the National Renewable Energy Action Plans of the European Members States. Available online: http://www.ecn.nl/docs/library/report/2010/e10069.pdf (accessed on 26 April 2016).
  4. Bouallagui, H.; Touhami, Y.; Ben Cheikh, R.; Hamdi, M. Bioreactor performance in anaerobic digestion of fruit and vegetable wastes. Process Biochem. 2005, 40, 989–995. [Google Scholar] [CrossRef]
  5. Lin, J.; Zuo, J.; Gan, L.; Li, P.; Liu, F.; Wang, K.; Chen, L.; Gan, H. Effects of mixture ration on anaerobic co-digestion with fruit and vegetable waste and food waste of China. J. Environ. Sci. 2011, 23, 1403–1408. [Google Scholar] [CrossRef]
  6. Scano, E.A.; Aquer, C.; Pistis, A.; Ortu, L.; Demontis, V.; Cocco, D. Biogas from anaerobic digestion of fruit and vegetable wastes: Experimental results on pilot-scale and preliminary performances evaluation of a full-scale power plant. Energy Convers. Manag. 2014, 77, 22–30. [Google Scholar] [CrossRef]
  7. ISPRA. Rapporto Rifiuti Urbani. Edizione 2016; Rapporti 251/2016; ISPRA: Rome, Italy, 2016; ISBN 978-88-448-0791-7. [Google Scholar]
  8. Vinot, M.; Perez, C.A.; Turm, P.; Maillo, A. Improvements in anaerobic digestion units and in pre-treatments performances beforehand. In Proceedings of the Third International Symposium on Energy from Biomass and Waste, Venice, Italy, 8–11 November 2010. [Google Scholar]
  9. Fricke, K.; Santen, H.; Wallmann, R. Comparison of selected aerobic and anaerobic procedures for MSW treatment. Waste Manag. 2005, 25, 799–810. [Google Scholar] [CrossRef] [PubMed]
  10. Rico, C.; Rico, J.L.; Tejero, I.; Munoz, N.; Gomex, B. Anaerobic digestion of the liquid fraction of dairy manure in pilot plant for biogas production: Residual methane yield of digestate. Waste Manag. 2011, 31, 2167–2173. [Google Scholar] [CrossRef] [PubMed]
  11. Ten Brummeler, E. Full scale experience with BIOCEL process. Water Sci. Technol. 2000, 41, 299–304. [Google Scholar] [PubMed]
  12. Di Maria, F.; Gigliotti, G.; Sordi, A.; Micale, C.; Zadra, C.; Massaccesi, L. Hybrid solid anaerobic digestion batch: Biomethane production and mass recovery from the organic fraction of solid waste. Waste Manag. Res. 2013, 31, 869–873. [Google Scholar] [CrossRef] [PubMed]
  13. Abdullahi, Y.A.; Akunna, J.C.; White, N.A.; Hallet, P.D.; Weatley, R. Investigating the effects of anaerobic and aerobic post-treatment on quality and stability of organic fraction of municipal solid waste as soil amendment. Bioresource Technol. 2008, 99, 8631–8636. [Google Scholar] [CrossRef] [PubMed]
  14. Di Maria, F.; Sordi, A.; Cirulli, G.; Gigliotti, G.; Massaccesi, L.; Cucina, M. Co-treatment of fruit and vegetable waste in sludge digesters. An analysis of the relationship among bio-methane generation, process stability and digestate phytotoxicity. Waste Manag. 2014, 34, 1603–1608. [Google Scholar] [CrossRef] [PubMed]
  15. Massaccesi, L.; Sordi, A.; Micale, C.; Cucina, M.; Zadra, C.; Di Maria, F.; Gigliotti, G. Chemical characterization of percolate and digestate during the hybrid solid anaerobic digestion batch process. Process Biochem. 2013, 48, 1361–1367. [Google Scholar] [CrossRef]
  16. Ponsa, S.; Gea, T.; Alerm, L.; Cerezo, J.; Sanchez, A. Comparison of aerobic and anaerobic stability indices through a MSW biological treatment process. Waste Manag. 2008, 28, 2735–2742. [Google Scholar] [CrossRef] [PubMed]
  17. Binner, E.; Smidt, E.; Tinter, J.; Bohm, K.; Lecher, P. How to enhance humidification during composting of separately collected biowaste: Impact of feedstock and processing. Waste Manag. Res. 2011, 29, 1153–1163. [Google Scholar] [CrossRef] [PubMed]
  18. Di Maria, F.; Segoloni, E.; Pezzolla, D. Solid anaerobic digestion batch of bio-waste as pre-treatment for improving amendment quality: The effect of inoculum recirculation. Waste Manag. 2016, 56, 106–112. [Google Scholar] [CrossRef] [PubMed]
  19. Smidt, E.; Tintner, J.; Bohm, K.; Binner, E. Transformation of biogenic waste materials through anaerobic digestion and subsequent composting of residues—A case study. Dyn. Soil Dyn. Plant 2011, 5, 63–69. [Google Scholar]
  20. Kohler, M.; Volsgen, F. Geomikrobiologie—Grundlagen und Anvendungen; Wiley-VCH: Weinheim, Germany, 1997. [Google Scholar]
  21. Linzner, R.; Mostbauer, P. Composting and its impact on climate change with regard to process engineering and compost application—A case study in Vienna. In Sardinia 2005, Proceedings of the Tenth International Waste Management and Landfill Symposium, S. Margherita di Pula—Cagliari, Sardinia, Italy, 3–7 October 2005; CISA Environmental Sanitary Engineering Centre: Sardinia, Italy, 2005. [Google Scholar]
  22. Blengini, G.A. Using LCA to evaluate impacts and resource conservation potential of composting: A case study of the Asti District in Italy. Resour. Conserv. Recycl. 2008, 52, 1373–1381. [Google Scholar] [CrossRef]
  23. Kim, M.H.; Kim, J.W. Comparison through a LCA evaluation analysis of food waste disposal options from the perspective of global warming and resource recovery. Sci. Total Environ. 2010, 408, 3996–4006. [Google Scholar] [CrossRef] [PubMed]
  24. Ruggieri, L.; Cadena, E.; Martinez-Blanco, J.; Gasol, C.M.; Rieradevall, J.; Gabarrell, X.; Gea, T.; Sort, X.; Sanchez, A. Recovery of organic wastes in the Spanish wine industry. Technical, economic and environmental analyses of the composting process. J. Clean. Prod. 2009, 17, 830–838. [Google Scholar] [CrossRef]
  25. Antonopoulos, L.S.; Karangiamnidis, A.; Tsatsarelis, T.; Perkoulidis, G. Applying waste management scenarios in the Peloponnese region in Greece: A critical analysis in the frame of life-cycle assessment. Environ. Sci. Pollut. Res. 2013, 20, 2499–2511. [Google Scholar] [CrossRef] [PubMed]
  26. Khoo, H.H.; Lim, T.Z.; Tan, R.B.H. Food waste conversion in Singapore: Environmental impacts based on an LCA perspective. Sci. Total Environ. 2010, 408, 1367–1373. [Google Scholar] [CrossRef] [PubMed]
  27. Di Maria, F.; Micale, C. Life cycle analysis of incineration compared to anaerobic digestion followed by composting for managing organic waste: The influence of system components for an Italian district. Int. J. LCA 2015, 20, 377–388. [Google Scholar] [CrossRef]
  28. APHA. Standard Methods for the Examination of Water and Wastewater, 18th ed.; American Public Health Association: Washington, DC, USA, 1992. [Google Scholar]
  29. Nelson, D.W.; Sommers, L.E. Total carbon, organic carbon and organic matter. In Methods of Soil Analysis. Part. 3-Chemical Method; Bigham, J.M., Ed.; American Society of Agronomy-Soil Science Society of America: New York, NY, USA, 1996; pp. 961–1010. [Google Scholar]
  30. Agenzia Nazionale per la Protezione dell’Ambiente (ANPA). Metodi di analisi del compost Manuali e linee guida; ISPRA: Rome, Italy, 2001. [Google Scholar]
  31. Ciavatta, C.; Govi, M.; Vittori Antisari, L.; Sequi, P. Characterization of humidified compounds by extraction and fractionation on solid polyvinylpyrrolidone. J. Chromatogr. 1990, 509, 141–146. [Google Scholar] [CrossRef]
  32. Petrussi, F.; De Nobili, M.; Viotto, M.; Sequi, P. Characterization of organic matter from animal manures after digestion by earthworms. Plant Soil 1988, 105, 41–46. [Google Scholar] [CrossRef]
  33. Cheshire, M.V. Nature and Origin of Carbohydrates in Soil; Academic Press: London, UK, 1979. [Google Scholar]
  34. ISO 14040. Environmental Management: Life Cycle Assessment, Principles and Guidelines; International Organization of Standardization: Geneva, Switzerland, 2006. [Google Scholar]
  35. ISO 14044. Environmental Management: Life Cycle Assessment—Requirements and Guidelines; International Organization of Standardization: Geneva, Switzerland, 2006. [Google Scholar]
  36. EC-European Commission. Characterization factors of the ILCD Recommended Life Cycle Impact Assessment Methods, Database and Supporting Information, 1st ed.; Publications Office of the European Union: Luxembourg, 2012. [Google Scholar]
  37. Turconi, R.; Butera, S.; Boldrin, A.; Grosso, M.; Rigamonti, L.; Astrup, T. Life cycle assessment of waste incinerations in Denmark and Italy using two LCA models. Waste Manag. Res. 2011, 29, 78–90. [Google Scholar] [CrossRef] [PubMed] [Green Version]
  38. Di Maria, F. Upgrading of a Mechanical Biological Treatment (MBT) plant with a Solid Anaerobic Digestion Batch: A Real Case Study. Waste Manag. Res. 2012, 30, 1089–1094. [Google Scholar] [CrossRef] [PubMed]
  39. Wernet, G.; Bauer, C.; Steubing, B.; Reinhard, J.; Moreno-Ruiz, E.; Weidema, B. The ecoinvent database version 3 (part I): Overview and methodology. Int. J. LCA 2016, 21, 1218–1230. [Google Scholar] [CrossRef]
  40. Walla, C.; Schneeberger, W. The optimal size for biogas plants. Biomass Bioenergy 2008, 32, 551–557. [Google Scholar] [CrossRef]
  41. Di Maria, F.; Micale, C.; Contini, S.; Morettini, E. Impact of biological treatments of bio-waste for nutrients, energy and bio-methane recovery in a life cycle perspective. Waste Manag. 2016, 52, 86–95. [Google Scholar] [CrossRef] [PubMed]
  42. Abbassi-Guendouz, A.; Brockmann, D.; Trably, E.; Dumas, C.; Delgenes, J.P.; Steyer, J.P.; Escudie, R. Total solids content drives high solid anaerobic digestion via mass transfer limitation. Bioresour. Technol. 2012, 111, 55–61. [Google Scholar] [CrossRef] [PubMed]
  43. Cho, J.K.; Park, S.C. Biochemical methane potential and solid-state anaerobic digestion of Korean food waste. Bioresour. Technol. 1995, 52, 245–253. [Google Scholar] [CrossRef]
  44. Di Maria, F.; Sordi, A.; Micale, C. Optimization of solid state anaerobic digestion by inoculum recirculation: The case of an existing mechanical biological treatment plant. Appl. Energy 2012, 97, 462–469. [Google Scholar] [CrossRef]
  45. Schievano, A.; D’Imporzato, G.; Malagutti, L.; Fragali, E.; Ruboni, G.; Adani, F. Evaluating inhibition conditions in high-solids anaerobic digestion of organic fraction of municipal solid waste. Bioresour. Technol. 2010, 101, 5728–5732. [Google Scholar] [CrossRef] [PubMed]
  46. Moller, K.; Muller, T. Effects of anaerobic digestion on digestate nutrient availability and crop growth: A review. Eng. Life Sci. 2012, 3, 242–257. [Google Scholar] [CrossRef]
  47. Marcato, C.E.; Mohtar, R.; Revel, J.C.; Pouech, P.; Hafidi, M.; Guiressem, M. Impact of anaerobic digestion on organic matter quality in pig slurry. Int. Biodeterior. 2009, 63, 260–266. [Google Scholar] [CrossRef] [Green Version]
  48. Tambone, F.; Genevini, P.; D’Imporzato, G.; Adani, F. Assessing amendment properties of digestate by studying the organic matter composition and the degree of biological stability during the anaerobic digestion of the organic fraction of MSW. Bioresour. Technol. 2009, 100, 3140–3142. [Google Scholar] [CrossRef] [PubMed]
  49. Tambone, F.; Scaglia, B.; D’Imporzato, G.; Schievano, A.; Orzi, V.; Salati, S.; Adani, F. Assessing amendment and fertilizer properties of digestates from anaerobic digestion through a comparative study with digested sludge and compost. Chemosphere 2010, 81, 577–583. [Google Scholar] [CrossRef] [PubMed]
  50. Sanchez-Mondero, M.A.; Roig, A.; Cegarra, J.; Bernal, M.P. Relationship between water-soluble carbohydrate and phenol fractions and the humidification indices of different organic wastes during composting. Bioresour. Technol. 1999, 70, 193–201. [Google Scholar] [CrossRef]
  51. Di Maria, F.; Micale, C. Life cycle analysis of management options for organic waste collected in urban area. Environ. Sci. Pollut. Res. 2014, 22, 248–263. [Google Scholar] [CrossRef] [PubMed]
  52. Maulini-Duran, C.; Artola, A.; Font, X.; Sanchez, A. A systematic study of the gaseous emissions from biosolids composting: Raw sludge versus anaerobically digested sludge. Bioresour. Technol. 2013, 147, 43–51. [Google Scholar] [CrossRef] [PubMed]
  53. Maurice, B.; Frischknecht, R.; Coelho-Schwirtz, V.; Hungerbuhler, K. Uncertainty analysis in life cycle inventory. Application to the production of electricity with French coal power plants. J. Clean. Prod. 2000, 8, 95–108. [Google Scholar] [CrossRef]
  54. Lanzuela, N.E.; Sanchis, F.J.R.; Sener, A.R.; Polo, G.C.; Vidla, A.P.; Pellicer, N.S. Uncertainty analysis in the environmental assessment of an integrated management system for restaurant and catering waste in Spain. Int. J. LCA 2015, 20, 244–262. [Google Scholar] [CrossRef]
  55. Sills, D.L.; Paramita, V.; Franke, M.J.; Jhonson, M.C.; Akabas, T.M.; Greene, C.H.; Tester, J.W. Quantitative uncertainty analysis of life cycle assessment for algal biofuel production. Environ. Sci. Technol. 2012, 47, 687–694. [Google Scholar] [CrossRef] [PubMed]
  56. Hermann, B.G.; Debeer, L.; De Qilde, B.; Blok, K.; Patel, M.K. To compost or not compost: Carbon and energy footprints of biodegradable materials waste treatment. Polym. Degrad. Stab. 2011, 96, 1159–1171. [Google Scholar] [CrossRef]
Figure 1. Scheme of the (a) solid anaerobic digestion batch (SADB) and (b) aerobic pilot-scale apparatuses.
Recycling 02 00013 g001
Figure 2. System boundaries for (a) composting (COMP), (b) solid anaerobic digestion batch and post-composting (SADBPC), and (c) solid anaerobic digestion batch with inoculum and post-composting (SADBPC-I).
Recycling 02 00013 g002
Figure 3. Temperatures during composting of the OFMSW (a) and of post-composting of the digestate (b), biogas composition (c) and the cumulative production vs. days for the runs with SADB without inoculum (d).
Recycling 02 00013 g003
Figure 4. Temperatures during composting of the OFMSW (a) and of post-composting of the digestate (b), biogas composition (c) and the cumulative production vs. days for the runs with SADB-I (with inoculum) (d).
Recycling 02 00013 g004
Figure 5. Normalized impact categories for the different scenarios.
Recycling 02 00013 g005
Figure 6. Contribution of main activities in GWP emission for the different scenarios: (a) composting (COMP), (b) solid anaerobic digestion batch and post-composting (SADBPC), and (c) solid anaerobic digestion batch inoculated and post-composting (SADBPC-I).
Recycling 02 00013 g006aRecycling 02 00013 g006b
Table 1. Direct emissions in air for composting and post-composting (PC) and for solid anaerobic digestion batch (SADB) per kg of organic fraction of municipal solid waste (OFMSW) processed.
ParameterComposting/PC (g)SADB (g)
NH30.9780.203
CO28.430-
CO2,bio520.0579.2
CO1.2802.153
N2O0.2810.069
H2S0.5280.169
CH410.105.897
NOx0.453-
Table 2. Direct emissions in air of internal combustion engines per kWh.
ParameterValue
CO2,bio (kg)1.594
CObio (mg)916.3
N2O (mg)47.73
CH4,bio (mg)916.3
NOx (mg)285.4
NMVOC (mg)38.17
Pt (ng)133.6
SO2 (mg)478.0
Table 3. Impact categories and normalization factors.
Impact CategoryUnitNorm. f. EU27 (2010)Unit
Global warming potential—GWPkgCO2 eq.1.10 × 10−4kgCO2 eq./a.
Ozone depletion layer—ODPkgCFC−11 eq.46.3kgCFC-11 eq./a.
Human toxicity, non-cancer effects—HTncCTUh1876CTUh
Human toxicity, cancer effects—HTcCTUh27100CTUh
Particulate matter—PMkgPM2.5 eq.2.63 × 10−1kgPM2.5 eq./a.
Photochemical ozone formation—POFkgNMVOC eq.3.15 × 10−2kgNMVOC eq./a.
Acidification—Amolc H+ eq.2.11 × 10−2molc H+ eq./a.
Eutrophication terrestrial—ETmolc N eq.5.68 × 10−3molc. N eq./a.
Fresh water eutrophication—FWEkg P eq.6.76 × 10−1kg P eq./a.
Fresh water ecotoxicity—FWecCTUe1.14 × 10−4CTUe/a.
Water resource depletion—WRDm3 water eq.1.23 × 10−2m3 water eq./a.
Min., foss. & ren. Res. Depletion—RDkg Sb eq.9.9kg Sb eq./a.
Table 4. Organic carbon, nitrogen, humic acids (HA) + fulvic acids (FA) and total extractable carbon (TEC) for six samples of the organic fraction of municipal solid waste (OFMSW) with related variances (σ2).
Sample nMC/σ2 (%w/w)VS/σ2 (%TS)TOC/σ2 (%TS)TKN/σ2 (%TS)HA + FA/σ2 (%TS)TEC/σ2 (%TS)pH/σ2
164.8/0.6377.2/0.0337.9/0.211.99/4 × 10−411.3/0.2115.4/0.136.47/0.57
264.5/7.6976.1/0.8735.5/0.021.74/5 × 10−410.6/0.1518.9/0.125.56/0.07
360.2/4.8369.6/11.529.5/1.230.88/4.5 × 10−38.87/0.2316.6/0.196.18/2E-3
461.9/12.167.8/1.9330.2/1.431.05/5 × 10−38.35/0.1114.5/0.216.69/7E-3
555.3/2.2259.2/0.1631.7/0.910.86/3 × 10−37.33/0.2115.4/0.307.19/2E-4
648.7/2.6773.6/5.6333.2/0.821.53/3.4 × 10−310.0/0.1818.3/0.335.81/0.01
Table 5. Total organic carbon (TOC), humic acids (HA) + fulvic acids (FA), degree of humidification (DH), and pH of the amendment at the end of the COMP and integrated SADBPC or SADBPC-I processes with relative variances (σ2).
Test No.Parameter
Amendment (after 90 days)
Treatment SchemeTOC/σ2 (%TS)TOCf/Mg a (g)HA + FA/σ2 (%TS)DH (%)pH/σ2
SADB not inoculated
1COMP26.1/0.691319.17/0.2168.08.9/3 × 10−3
SADBPC30.3/0.5515610.5/0.1669.88.5/6 × 10−3
2COMP23.7/3.8112310.8/0.1477.38.7/0.05
SADBPC26.0/0.191458.36/0.2282.18.9/6 × 10−4
3COMP15.4/0.371213.64/0.1676.08.7/8 × 10−3
SADBPC15.5/0.021476.12/0.1992.68.9/1 × 10−3
SADB inoculated
4COMP23.1/0.191287.25/0.0280.89.6/2 × 10−3
SADBPC-I22.7/0.6875.06.56/0.1139.18.8/0.02
5COMP23.3/0.071207.17/0.3268.69.4/5 × 10−3
SADBPC-I21.1/0.421076.07/0.2464.89.4/2 × 10−3
6COMP24.5/0.521475.30/0.0198.79.2/2 × 10−3
SADBPC-I23.5/0.631327.26/0.0982.39.2/3 × 10−3
Legend: a = kg of TOCf = TCO-NH per Mg of final fertilizer with MC of 40% w/w.
Table 6. The kgCO2 eq emitted per Mg of organic fraction for different values of direct emissions of the different treatment schemes (Table 1).
Direct Emissions Variation (%)−75%−50%−25%0+25%+50%+75%
GWP (kgCO2 eq)
Treatment scheme
COMP−111.84.459120.7237.0353.3469.6585.9
SADBPC80.90339.7598.5857.3111613751634
SADBPC−I176.8451.5726.11000127515501824

