The Impact of Environmental Factors on the Thermal Characteristic of a Lithium–ion Battery


DLR Institute of Networked Energy Systems, 26123 Oldenburg, Germany
*
Author to whom correspondence should be addressed.
Batteries 2020, 6(1), 3; https://doi.org/10.3390/batteries6010003
Submission received: 29 November 2019
/
Revised: 23 December 2019
/
Accepted: 30 December 2019
/
Published: 2 January 2020
/
Corrected: 23 October 2023
(This article belongs to the Special Issue Thermal Characteristics of Batteries 2019)
Abstract
:To draw reliable conclusions about the thermal characteristic of or a preferential cooling strategy for a lithium–ion battery, the correct set of thermal input parameters and a detailed battery layout is crucial. In our previous work, an electrochemical model for a commercially-available, 40 prismatic lithium–ion battery was validated under heuristic temperature dependence. In this work the validated electrochemical model is coupled to a spatially resolved, three dimensional (3D), thermal model of the same battery to evaluate the thermal characteristics, i.e., thermal barriers and preferential heat rejection patterns, within common environment layouts. We discuss to which extent the knowledge of the batteries’ interior layout can be constructively used for the design of an exterior battery thermal management. It is found from the study results that: (1) Increasing the current rate without considering an increased heat removal flux at natural convection at higher temperatures will lead to increased model deviations; (2) Centralized fan air-cooling within a climate chamber in a multi cell test arrangement can lead to significantly different thermal characteristics at each battery cell; (3) Increasing the interfacial surface area, at which preferential battery interior and exterior heat rejection match, can significantly lower the temperature rise and inhomogeneity within the electrode stack and increase the batteries’ lifespan.
1. Introduction
Lithium–ion batteries that are manufactured without consideration of thermal performance characteristics and optimal specifications with respect to the battery systems application might fail at an early stage in their expected product lifetime [1,2,3]. A strong correlation between battery temperature and battery degradation is reported for battery performance in the literature [2,3,4,5,6,7]. Therefore, the research on battery degradation induced by temperature effects is a vital multidisciplinary field with research branches in battery temperature monitoring and regulation [3,4,8], battery performance prediction [9,10,11,12,13,14,15] and optimization [8,16,17], as well as battery system design [1,18,19,20]. The shared aim is to decrease the impact of temperature-induced fault mechanisms and battery cell performance flaws within the associated battery system, while, as the applications demand, safety objectives and durability ambitions are met [17,21,22].
From a physics point of view, the thermal characteristic of a lithium–ion battery within the system is a balance between heat generated and incorporated within its encapsulated electrode stack, and the current conducting components against heat removal by an interior or exterior heat rejection method [3,6,23].
Heat generation within the electrode stack relates to irreversible sources connected to internal resistance [24,25] contributions by ionic, electrical and interfacial phenomena, reversible sources connected to entropy [14,26] and the heat of mixing [27,28]. Heat incorporation is a passive phenomenon quantified by material heat capacity [29,30,31]. Interior design improvements in heat removal are reported for electrode and stack modification with the focus on the minimizing of internal resistance contributions, enhancing thermal conductivity on a material level [32], or within the stack arrangement [33], as well as the customizing of the battery tap [34,35,36] and the terminal layout [37]. Exterior design cooling types in general embrace air [38,39,40], liquid [41,42], heat pipe [3,43], phase change material (PCM) [44,45] or hybrids [18,46] with a focus on multiple cell arrangements and interconnects under the influence of system application and management.
Modeling of the thermal aspects of lithium–ion battery operation states relies on model parameterization [47,48,49,50], validation of key performance variables [21,47,51,52] and the correct interpretation of model deviations [53,54], as well as behavioral indicators [55]. Therefore, the model accuracy strongly depends on the accurate modeling of each of the aforementioned physical phenomena that influences the flux of heat within and around the battery cell.
In our previous study [47] an electrochemical thermal coupled model was established based on the COMSOL Multiphysics® simulation platform (Stockholm, Sweden) and validated dependent upon heuristic cell temperature without the geometrically resolved battery and test environment. The present study aims to get a thorough understanding of the thermal processes and their implications within and around a prismatic (PHEV2) battery cell to evaluate the layout of thermal barriers and preferential heat rejection patterns within controlled validation scenarios. Finally, the parameterized model is adopted to analyze conductive cooling strategies considered in a recent market ready battery thermal management system (BTMS) under variable battery form factors with similar thermal characteristics.
2. Methods
2.1. Experimental Techniques
The model parameterization involves multiple steps from battery cell disassembly, sample extraction and preparation, measurement execution and data evaluation [48,52,53,56,57]. The opening and sample preparation from a discharged battery cell with a zero state of charge was explained and discussed in detail in our previous study with its focus on the electrochemical model parameterization [47]. In this study the focus is set on the thermal model parameterization.
2.1.1. Battery Description
For model parameterization, a commercially-available PHEV2 battery of a nickel–manganese–cobalt (NMC)/graphite (G) type was used. The cell has a nominal theoretical capacity of 40 Ah and 144 Wh, measured at C constant current rate. Thereby, 1 C equals an applied current of 40 A. A voltage range between 2.8 V to 4.2 V is recommended by the manufacturer with a nominal voltage of 3.6 V. Charging is allowed within a temperature range of 0 °C to 45 °C up to a maximal discharge current rate of 5 C, while discharging is approved up to 10 °C within −20 °C to 55 °C.
2.1.2. Thermal Parameter Assessment
The heat capacity and the temperature diffusivity for each component of the electrode stack were measured by Differential Scanning Calorimetry (DSC 204 F1, Netzsch, Selb, Germany) and Laser Flash Analysis (LFA 467, Netzsch, Germany), respectively. The characterized cell component categories comprised a double coated graphite anode on copper foil, double coated NMC cathode on aluminum foil and a separator sheet.
The DSC device setup and measurement fundamentals for the heat capacity evaluation are described by Höhne et al. [58]. Coating material is removed from the electrodes metal foil by a scalpel. Separator sheets were sliced into small pieces. Each material was loaded into a separate pierced aluminum crucible.
The measurement parameters were defined within DSC phoenix software (Netzsch, Germany) to be within a temperature range of 25 °C to 80 °C and with a heating rate of 10 K/min. As a reference, a baseline correction measurement was executed with an empty crucible and a calibration measurement was performed with a sapphire standard of 12.73 mg, thickness of 0.25 mm and a diameter of 4 mm. The final heat capacity analysis is done within Proteus Analysis software (Netzsch, Germany) to access the heat capacity values needed for further modeling steps.
The principle of the LFA measurement and evaluation procedure is described by Parker et al. [59]. Applications of the methods for the characterization of lithium–ion battery components were demonstrated by Bohn et al. [21] and Koo et al. [33]. The laser flash technique directly measures the sample’s temperature diffusivity. Each sample is placed into a stage. A xenon flash lamp heats the samples surface, while the temperature rise is measured on the other side with an InSb infrared (IR) detector. Within the thermal diffusivity measurements, all samples were measured with 270 V for 0.5 ms at temperatures between room temperature and 80 °C (5 °C steps). The separator was coated with a homogenous thin graphite layer prior to its measurement to avoid energy loss of the laser by reflection at the separators surface. The anisotropic thermal conductivity of the electrode stack was approximated by Equations (10) and (11) based on the sample results.
2.1.3. Thermal Validation Assessment
The validation tests were performed by a Maccor series 4000 Potentiostat multiple cell tester with 0 V to 8 V (0.02% accuracy) range for the voltage and 0 A to 150 A range for the current (0.05% accuracy). The temperature environment was regulated within a Vötsch climate chamber, VC 7018 with a temperature range of −75 °C to 180 °C, by air circulation to control the applied measurement conditions. An Agilent 34972A with PT100 sensors, having a −40 °C to 85 °C ( K accuracy) temperature range each, was used to measure the temperature pointwise within the test setup. Climate conditions exterior to the climate chamber and reflective radiation at the interior chamber surfaces are assumed to have a negligible effect upon the measurements.
Two different experimental test setups of the prismatic battery cell were used to analyze the temperature behavior of the prismatic battery cell type under varying typical environmental and procedural test conditions. The focus of the first validation experiment was the evaluation of localized temperature magnitudes and temperature inhomogeneity at varying current rates under natural convection conditions for the chosen prismatic battery type. Within the second validation experiment the temperature on top of the battery was evaluated during a forced cooling condition at a fixed current rate with varying position within a battery pack-like test arrangement.
Within the first setup, current rates of 0.5 C, 1 C and 2 C, separated discharge and charge phases and an initial temperature set to 25 °C, were considered. Twelve temperature sensors were positioned on the surface of the battery cell on predefined locations. The battery was positioned and fixed with two thermally low, conducting synthetic fasteners. The climate chamber temperature regulation is turned off during the battery cycling processes to avoid undesired cooling effects. After each heating phase, a cooling phase of several hours was considered. Before a new test was initiated, an evenly homogenized temperature distribution was reestablished.
In contrast, the second test setup was composed of six prismatic batteries, which were cycled at 2 C current rate and an environment temperature of 22 °C, a thermally high conducting metal fastener holding each. Thereby, the climate chamber is actively fan cooling the test arrangement, while the battery cells are not directly electrically connected to each other. Three electrical and thermal battery cell profiles were chosen for the further evaluation based on their location in the center, middle and side positions within the test arrangement.
2.2. Simulation Techniques
The developed model is implemented in the COMSOL Multiphysics® v5.4 simulation platform using the “Lithium–ion Battery” submodule for the definition of the electrochemical behavior and the “Heat Transfer in Solids and Fluids” submodule to describe the thermal behavior within the battery and the test environment.
The governing set of equations for the electrochemistry and the evaluation of heat dissipations sources are denoted in Table A1 and Table A2 in the Appendix A, since the focus in this paper is on external influences on the thermal characteristics of the battery cell. The schematic of the model implemented is shown in Figure 1, where the material property representatives annotated within the electrochemical model are the negative electrode coating layer (ne), the positive electrode coating layer (pe), the separator layer (sep) and the current collecting layers (cc-cu) and (cc-al):
2.2.1. Heat Transfer in Solids
The heat propagation within solid domains at position and time is calculated by the transient heat transfer equation as follows:
where is the temperature, is the heat dissipation density dependent on average temperature within the electrode stack volume and applied current within the electrochemical model, is density, is temperature-dependent, specific heat capacity under constant pressure, and is the thermal conductivity matrix. The matrix components of are modeled direction- and temperature-dependent in the case of the electrode stack , as discussed in Section 2.2.5, and direction- and temperature-independent in any other solid domain. The equation is applied in the solid domain of the battery and the experimental setup. Joule heating at current conducting components beside the electrode stack is neglected in this study.
2.2.2. Heat Transfer in Fluids
The heat propagation within the fluid domain surrounding the experimental setup is considered at position and time as follows:
where is the temperature, is the density, is the specific heat capacity under constant pressure and is the thermal conductivity matrix. The vector describes airstream velocity within the fluid domain . Each of the fluid domain’s material parameters are modeled temperature-dependent. Work induced by temperature-dependent pressure is neglected.
2.2.3. Convection
The heat transferred via convection is usually considered on a boundary of a solid volume pointwise for by the following Robin condition:
Therein, is the normalized orthogonal vector associated to the boundary , is the weighted temperature gradient, is the temperature, is the temperature of an external domain, and is the heat transfer coefficient at the boundary . Natural convection and forced convection are subcategories with respect to a fluid flow with and without the induced external fluid force. Heat transfer coefficients vary in literature within to for natural convection and higher for forced convection [60,61,62], when the fluid is considered to be air. A clearly defined transition zone does not exist, since mixed convection in dependence of temperature, pressure and gravity is known to occur as the superposition of the aforementioned convection types [63].
In many studies, the heat transfer coefficient on the battery surface is considered as a fitting parameter to improve model errors, which could relate to a false interpretation of other battery parameters [53,55]. Instead, in this study, the environment surrounding the battery test arrangement is modeled with stationary equations of both momentum balance Equation (4) and continuity Equation (5), to replicate the weakly compressible fluid flow behavior within the fluid domain representing air:
Therein, is density and is dynamic viscosity; both being temperature-dependent. The vector is airstream velocity, is the pressure variable and is the identity matrix. The climate chamber fan-induced fluid flow force is modeled at the boundary opposite to the battery test arrangement by the following Neumann boundary condition:
where is the velocity vector on the boundary , is the normalized orthogonal vector on the boundary and is the inlet velocity control parameter.
2.2.4. Radiation
The heat transferred by radiation is considered on a boundary of a solid volume pointwise for by the following Robin condition:
where is the normalized orthogonal vector associated to the boundary , is the weighted temperature gradient, is the Stefan-Boltzmann constant, is the emissivity coefficient, is the temperature and is the external environment temperature.
2.2.5. Electrode Stack Thermal Behavior
For the electrode stack domain of the battery, the effective density and effective heat capacity are calculated based on the volume averaging method: [21]
where is the -th volume fraction, is the -th density and is the -th heat capacity of the -th component within the electrode stack,. The set contains a representative of each material within the electrode stack: The negative electrode coating (ne), the positive electrode coating (pe), the current collector sheet of the negative electrode (cc-cu), the current collector sheet of the positive electrode (cc-al) and a layer of the separator (sep), as visualized in Figure 1. The effective density is considered to be temperature-independent within the operation temperature range of interest, similar as reported by others [21,55,64,65].
The lamination of the electrode stack matches a network of series and parallel connections of thermal resistors that correspond to the contact resistances at the transition zones of each layer. Hence, anisotropic temperature propagation within the electrode stack is considered by defining the orthotropic effective temperature diffusivity parallel (in-plane) and perpendicular to (through-plane) the direction of the layers:
Therein, is the -th materials temperature diffusivity, is the thickness of the -th stack component, is the electrode surface of the -th stack component, is the total electrode surface and is the total cell sheet thickness [38]. Overall, the effective thermal conductivity matrix within the electrode stack of the three dimensional battery model is defined with respect to the effective stack density , heat capacity and temperature diffusivities and as follows:
where is in-plane and is though-plane thermal conductivity.
2.2.6. Coupling of Physics
The governing equations shown in Table A1 in the Appendix A represent the electrochemical behavioral model of the battery. The total heat dissipation density of the battery with respect to the aforementioned setting is defined in Table A2 in the Appendix A. In Equations (1)–(7), the thermal behavior of the battery and test environment is calculated in dependence of the heat dissipated within the electrode stack, while simultaneously exchanging the average of the electrode stack temperature with the electrochemical model variables of the particle, electrode and electrolyte domains. By Equations (2), (4)–(6), air flow phenomena under temperature dependence are modeled.
3. Results and Discussion
The experimental thermal characterization of the battery cell results is evaluated, discussed and incorporated into the simulation model of the commercially available 40 Ah battery cell. The temperature distribution of the battery cell model is simulated in three scenarios within a test environment. In the first two studies, the thermal model behavior will be analyzed based on the variation of the exterior test conditions of the battery within the climate chamber during controlled external conditions. In the third study, the restrictions and benefits of varying the standard reference cell design with similar internal structure will be evaluated and discussed from a BTMS point of view.
3.1. Geometrical Battery Characterization
A representation of the PHEV battery geometry was created based on details of the materials extracted during the cell disassembly. In Figure 2 the virtual battery cell replication steps are shown:
Geometrical design and material assumptions were made within the battery cell replication process to simplify the model layout. Therefore, redundant fillets and thin shapes are reduced to avoid mesh inaccuracies and excess computational demand. Accordingly, the axial symmetry to the center of the battery cell within the -plane is considered. The model’s overall battery volume is , and the electrode stack sub volume is ; each a half versus reality.
An analysis of several mesh variations up to an element size of roughly 500,000 elements indicated a negligible influence of the spatial discretization on the resulting temperature distribution within the model when a thermal mesh composed of 63,505 tetrahedral elements with the following quality quantities is chosen: The average skewness is 0.60 and the minimal skewness is 0.15, while the average condition number is 0.79 and the minimal condition number is 0.26, as presented in Figure 2. The quantity skewness evaluates the anisotropy of angles within mesh elements, whereas the quantity condition number qualifies the matrix isometric transformation properties of the actual elements, in comparison to an ideal tetrahedral element with both equally adjusted angles and maximal condition number. Mesh refinement is considered at areas with more detailed contours like the case and the thinner shapes of the negative and positive current collectors, where high material thermal conductivity exists.
3.2. Characterization Results of Thermal Parameters
The experimental procedures undertaken for this section are explained in Section 2.1.2. The radiation-related surface properties used in Equation (7) of the battery compartments are taken from a material data sheet provided by Optris GmbH® (Berlin, Germany) [66]. The geometry parameters used for the averaging procedures mentioned in Equations (8)–(11) were characterized and reported in our previous study [47]. Altogether, the set of thermal parameters derived for the model parameterization in this study is considered to replicate the battery behavior realistically. The obtained values for the electrode stack components are in good agreement with data reported for a NMC/Graphite type stack in several other studies [17,29,31,32,67]. An overview of the thermal parameters for the electrode stack, the battery and the environment at the 25 °C reference temperature is shown in Table 1:
Temperature dependency of the electrode stacks thermal properties had often been assumed to be constants in the temperature range of interest in previous battery modeling approaches [64,65,71]. However, there are several studies that report temperature dependency on material level, and suggest a similar tendency on cell level [30,32,72]. Therefore, the temperature influence on the effective heat capacity and the effective thermal conductivity of the electrode stack is considered for the model parameterization with respect to the temperature range of 20 °C to 80 °C in this study. Finally, fitting polynomials are derived that will be used to parameterize the thermal properties of the electrode stack in Equation (1).
The experimentally determined stack component’s heat capacity and the calculated effective stack variable are shown in Figure 3. The measured values of the heat capacity interval are within 900 to 1300 for the electrode coating materials, are within 1200 to 1900 for the separator, and are within 900 to 1200 for the calculated effective stack heat capacity. The effective stack heat capacity interval is more comparable to the electrode coating’s range than to the separator’s range. The dominant influence of the electrode coatings is presumably based on the volume ratio within the effective stack capacity. The electrode’s coatings are represented by approximately 70%, the separator by 16% and the collector sheets by 14% of the overall stack volume. The value intervals for the different material types are in good agreement with heat capacity measurements in the temperature range up to 50 °C at 0% from similar battery cell materials in the literature [29,31]. For each of the measurement objects a least-squares curve fitting procedure is used to analyze the heat capacity trend dependent on the temperature evolution. The resulting curves are nonlinear, and the related coefficient of determination is above 0.97 in each case. Therefore, it can be concluded that each curve reproduces the temperature dependence seen within the experiments reasonably well. The polynomial orders derived in this study for the different materials, however, remain to be suggestions for the cell under use, since polynomials of orders varying in several degrees are reported in literature [29,72].
In case of the separator, the experimental values up to 27 are not considered for the fitting procedure, since such a steep slope is not reported in the literature within the temperature range of interest. Such a physical behavior would be a contrast to the evaluated results of similar separator material reported by others [29]. The measurement error might be attributed to a gap or contact flaw between the separator sample and the crucible bottom, which would lead to an increased heat resistance within the sample system. Therefore, a decrease of the sample system’s DSC signal in comparison to the reference system’s DSC signal would lead to a decrease of the calculated heat capacity [73].
Additional variable dependencies of heat capacity will be named for completeness, but will not be further considered in this model study. In [29], a nonlinear dependency on is reported for NMC-type lithium–ion batteries, whereas a similar effect is not seen in iron–phosphate (LFP)-type lithium–ion batteries [72].
In a study by Maleki et al. [31], the influence of ageing on heat capacity is considered, and measurements of fresh and cycled cells, 500 cycles at 45 °C, on cobalt–oxide type battery cells were compared. It was concluded that ageing is negligible in the context of heat capacity in contrast to a study by Vertize at al. [74], where a visible decrease in heat capacity up to 1 at the end of the cell’s lifetime was attributed to the change of internal chemical structures.
The temperature diffusivity of the stack components are considered with respect to the temperature range 20 °C to 80 °C within this study, as shown in Figure 4. The measured sample temperature diffusivity and the calculated through-plane temperature diffusivity values are within the interval of 0.1 to 0.65 , while the in-plane temperature diffusivity values are two factors of ten higher within a small interval around 11.1 . A positive linear trend is visible for the separator within the temperature range 20 °C to 80 °C, while the porous material temperature diffusivity shows a negative linear trend.
The in-plane temperature diffusivity is based on arithmetic averaging and the through-plane temperature diffusivity is calculated based on harmonic averaging. Therefore, the rise in magnitude related to the in-plane temperature diffusivity is due to the high thermal diffusivity of the current collector sheet materials, while the low values of the through-plane temperature diffusivity can be related to the short current collector thicknesses and the low magnitudes of the sample material values. For each of the measurement objects, a least-squares curve fitting procedure is considered to analyze the temperature diffusivity trend dependent on the temperature evolution. The resulting curves are linear, and the related coefficients of determination are within the interval range of 0.75 to 0.98. While the fit for the separator explains the variance of the measurements results less accurately, the fitting curves for the sample materials and the effective values are well matched.
Based on equation Equations (12) and (13), the effective thermal conductivity variables are calculated with respect to the previous thermal characterization results. The calculated through-plane thermal conductivity values are within the interval 0.6 to 0.72 , while the in-plane thermal conductivity values are almost two magnitudes higher within the interval 27.5 to 35.0 .
In both cases, a nonlinear, positive trend of the effective thermal conductivities is derived. Both quantities of interest increase roughly 15% in magnitude within the temperature range 20 to 80 , which is comparable to an increase of of roughly 20% in the same temperature range, while and are decreased by 0.2% and 5%. While the ratio in magnitude of and is clearly induced by and , the positive temperature dependency trend is enhanced by . The heat propagation effect based on the presented results would relate to the following: “Enhanced temperature levels within the electrode stack will lead to increased heat propagation and a decrease of its temperature non-uniformity”. Recent research advances focusing on the enhanced thermal conductivity of electrodes for NMC-type batteries have shown that a positive temperature dependency could be realistic, and even higher thermal conductivity magnitudes can be achieved by innovative electrode designs [33]. The contrary effect, however, was deducted in former studies [32,75] on commercially-available, NMC-type, lithium–ion batteries, which derived twice a decrease in the magnitude of , and an almost constant within the overall temperature range of 0 to 40 under the presence of an electrolyte. Therefore, the derived temperature dependency results of the thermal parameters are considered to be trustworthy for the thermal model parameterization of the present study based on the same electrode type, but their transferability to other battery models is limited.
3.3. Thermal Model Study
From a physics point of view, the temperature behavior of a battery cell could be analyzed with a focus on heat dissipation within or heat removal from its encapsulated electrode stack. The battery cells’ temperature distribution is realistically predicted when the balance of the two characteristics is properly matched. While the heat dissipation setting is analyzed and validated for the electrochemical part of the aforementioned battery model in our previous study [47], the present study will further examine the characteristics of heat removal within exterior test settings and realistic battery applications. Three model categories are evaluated in this study with a focus upon the natural convection condition, forced convection condition and the influence of the battery cell design. The underlying cooling type categories and model parameter variations are presented in Figure 5:
In the first two model studies, the temperature modeling approach is evaluated in comparison to real case scenarios measured in our laboratory as described in Section 2.1.3.
In the first study, the focus is set on temperature variation dependent on current rates within the battery cell, while an external flow force is considered to be negligible. In the second study the maximal temperature and average heat rejections are analyzed at a constant current rate under varying air inlet velocities to match experimentally determined surface temperature patterns of a battery cell located within a test cell array. The test setups are performed to quantify the model accuracy and understand the dynamic of heat generation and heat rejection.
Frequently stated BTMS strategies applied to lithium–ion batteries are bottom cooling (BC), small side cooling (SC) or large face cooling (FC) [29,65]. From the known cooling strategies, a hybrid of high conductive heat pipes with an externally-connected heat removal mechanism is reported to be very effective [3]. A layout of the used cooling concepts is shown in Figure 6:
The exterior thermal management might benefit from the known anisotropic thermal conductivity within the electrode stack, when cooling on surfaces next to enhanced heat flux patterns is prioritized. Therefore, model study three aims to evaluate the effectiveness of the proposed cooling concept by evaluating the maximal temperature rise and cooling times until temperature equilibrium is reestablished. The heat removal mechanism is considered to be ideal, which is modeled by a fixed temperature condition on a surface boundary on the heat pipe.
3.3.1. Thermal Validation—Natural and Forced Conditions
For the analysis of the scenario under natural convection, both of the temperature curves during 0.5 C, 1.0 C and 2.0 C during the discharge and charge phase and a subsequent rest phase were taken into account, as shown in Figure 7a,b:
The simulated curves match well for the current levels 0.5 C and 1.0 C with a maximal error below 3.4%; however, at the current level 2.0 C, the error increased up to 7.9%. The absolute difference is comparable to a maximal temperature difference of roughly 0.8 K in the first two cases and a maximal temperature difference up to 2.2 K in the third case.
As a result of the error analysis, the model tends to overestimate the average battery surface temperature at the 2 C current rate, while those lower rates are properly matched. A fluid force dependent on a significant temperature rise, which could present the difference, would be based on the buoyancy effect; an upstream of heated air created under the influence of gravity. Its impact, however, is stated to be negligible when advection is present [8,18].
In the scenario under forced convection the influence of centralized fan air cooling within a climate chamber on the temperature magnitude of the batteries is studied. Therefore, the measured surface temperature curves of three battery cells, which were measured during 2 C cycles, are taken into account. Between each experimental curve a significant deviation of up to a two and a half degree Kelvin temperature difference is observable during the heating phase, each evaluated at the top of the battery. The result proves that the centralized fan is cooling each cell differently based on the position within the test arrangement. Three equivalent air cooling velocities were estimated by matching the measured surface temperature curves of the batteries within the test arrangement and a simulated average temperature curve of the battery model. All results are shown in Figure 8:
The simulated curves deviate more pronounced for the batteries corresponding to the center and the midway position with equivalent inlet velocities 0.125 and 0.325 with a maximal error below 8.42% at and 6.20 % at , as compared to the battery at the side with a maximal error below 3.68% at and an equivalent inlet velocity of . The errors relate to a maximal absolute temperature difference of , and respectively. While in the first two cases the real battery surface temperature is overestimated, in the last case it is slightly underestimated. Due to the position of the batteries at the center and the middle within the test arrangement, a superimposed cooling influence is visible that is not considered, when only one battery is simulated alone. The superimposed experimental effect could be conductive cooling induced by the highly conductive metal fasteners. The battery at the side that is mostly exposed to fluctuating air is simulated with good accuracy. Hence, the thermal model accuracy increases with increasing equivalent air velocity.
The simulated surface temperature distribution of the battery cell in both validation cases is shown in Figure 9a,b:
In both cases, the maximal temperature level on the surface is located at the short sides and at the battery cell bottom, which coincides with the direction of in-plane thermal conductivity of the electrode stack. The minimal surface temperature is on the top of the battery cell in both cases, which might be due to presence of the low thermally conducting synthetic cradle on top of the electrode stack. The temperature around the terminal is slightly elevated compared to the rest of the top battery surface, which is due to its direct connection to the electrode stack.
In conclusion of both studies, the model accuracy resembles the realistic match of heat dissipation and heat removal. While heat dissipation increases with the current rate, heat removal is increased with exterior air inlet velocity. During the natural convection scenario, higher deviation occurred, when the temperature increase was more pronounced and heat rejection effects were not fully met within the simulation. During the forced convection scenario, the model accuracy was increased by matching the inlet velocity with the resulting average battery surface temperature during a 2 C cycle. The result at the forced convection scenario supports the suggestion that the temperature deviation between the simulated and experimental results in the natural convection scenario might be induced by the missing buoyancy flow force in the simulation. Altogether, the thermal model is able to predict the spatial temperature behavior of a battery within the test environment under the current rates and airstream velocities of interest with good accuracy.
3.3.2. Model Study—BTMS Compatibility under Battery form Factor Variation
The temperature levels might actually be effectively further decreased compared to the validation scenarios when conductive cooling plates are attached. A direct comparison for the cooling types BC, SC and FC with respect to the form factors I, II and III for the maximal temperature rise of the electrode stack is shown in Figure 10:
An evaluation of the thermal characteristic within the electrode stack is performed based on the following equations:
therein, is the maximal temperature rise during the cycle , is the maximal spatial temperature difference during the cycle , is the average temperature rise during the heating phase , is the average temperature inhomogeneity indication factor during the heating phase and is the cooling time until temperature equilibrium is reached after heating is stopped. variable is evaluated within the electrode stack volume during the denoted test time where is the heating phase and is the rest time.
A rating system compares the results at the current rate of the standard PHEV2 design I against all other cases. Highlighted color modes and associated thresholds are shown in Table 2. The results for the validation and model study scenarios are shown in Table 3.
The best case scenario for each quantity of interest is given at cell design III/SC and III/BC. The worst case scenario for each quantity of interest is given at III/FC, I/SC and I/BC. The difference between the best and worst case to remove heat gradually increases from design I over II to III. Therefore, a BTMS could maintain an improved battery temperature performance at design III, especially with a strategy based on SC. However, if SC and BC are not applicable, a significant performance reduction is expected to occur in comparison with the best reference case I/FC.
During the natural convection, forced convection and isolation case at 2 C, higher temperature levels were reached than within each case with dominant cooling by conduction. From isolation, over natural convection to the forced convection case, the maximal and average temperature rise gradually decreases, while the maximal temperature difference and average temperature inhomogeneity indication factor gradually increase. The inverse proportionality of the two subcategories: “Temperature magnitude and temperature inhomogeneity” is reported in other studies [55,76] as well. This is deemed to be a challenge for an appropriate BTMS design.
Work at National Renewable Energy Laboratory was conducted to develop ageing models of lithium–ion cells that consider the impact of temperature and charge/discharge cycles on battery lifetime. The study [7] by Smith et al. on an NMC/Graphite chemistry type battery cell reported on the influence of the battery cell’s yearly average temperature on the battery life. Within an average depth of discharge (DOD) range in between 20% to 75% for an average battery temperature of 20 °C, a lifetime of roughly ten years, and for an average battery temperature of 33 °C, a lifetime of approximately five years, was stated [7]. The difference in 13 K average battery temperature equals a lifetime difference of roughly five years [19], which likewise equals a lifetime difference of four to five months per degree Kelvin. Hence, from the evaluated cases in the present model study, the highest average temperature increase in each cell design combined with isolation would be comparable to a lifetime reduction of roughly two years. Similarly, each battery in scenario I/FC, III/SC or III/BC would equally benefit by the appropriately chosen BTMS cooling with a maximal lifetime enhancement of seven to eight months; a difference up to one year and four to five months.
4. Conclusions
The developed electrochemical–thermal battery model allows simulations of the spatial–thermal behavior of a commercial lithium–ion battery cell under realistic environmental conditions with good accuracy, and is a trustworthy tool to investigate the correlation between the system layout and the thermal characteristic of the incorporated battery type.
Within validation scenarios, the influence of convection-induced cooling at a commercially available PHEV2 format lithium ion battery was analyzed under different current rates and fan airstream velocities. Heat removal by forced convection is an effective choice to decrease the temperature of the battery cell based on controlled air velocity. The maximal relative error of the model depends on the current rate and the airstream inlet velocity. During natural convection the maximal relative model deviation at the end of discharge increased from 3.4% to 7.8% with an increasing current rate. However, forced convection with increasing airstream velocity decreased the model deviations from 8.2% to 3.68%. Therefore, we conclude that the increased model deviation at a high current rate during natural convection is rather due to missing heat removal phenomena, which are not captured by the thermal battery model, than to a model error related to heat generation. From a modeling practice point of view, an improvement of the model results at natural convection is expected when the physics of a buoyancy flow is considered.
Conductive cooling strategies are even more reliable than convective cooling strategies when the internal battery structure is considered. The work shows that preferential heat rejection patterns within the battery cell geometry can effectively be used within a BTMS cooling strategy to reduce the impact of temperature on the battery cell life. A comparison of the worst and best case situations for heat removal from batteries of similar thermal characteristics has shown that the use of a properly designed BTMS relates to a battery lifespan enhancement of almost one and a half years, when the battery is cycled within an application with average demand at a 2 C current rate and room temperature conditions. A parallel improvement in temperature magnitude and temperature homogeneity was realized with a battery form factor change from the PHEV2 format to the design variants or at a BTMS conductive cooling strategy with SC or BC, instead of FC.
The results show that the electrochemical–thermal model with the derived set of parameters is able to make adequate quantitative predictions about the thermal state of the battery during cycling. Furthermore, is can be used to draw conclusions about the performance of the batteries in arbitrary cell and system designs.
Author Contributions
Conceptualization, G.L., S.G., F.S., and C.A.; Data curation, G.L., O.Z. and U.K. Formal analysis, G.L.; Funding acquisition, F.S.; Investigation, G.L., O.Z. and U.K.; Methodology, G.L., O.Z. and S.G.; Project administration, U.K.; Resources, U.K. and F.S.; Software, G.L. and O.Z.; Supervision, C.A.; Validation, G.L. and O.Z.; Visualization, G.L. and O.Z.; Writing—Original draft, G.L.; Writing—Review and editing, U.K., S.G., F.S. and C.A. All authors have read and agreed to the published version of the manuscript.
Funding
This research “BaSyMo” (FKZ: 03ET6087I) was funded by the Federal Ministry of Economic Affairs and Energy (BMWi).
Acknowledgments
The authors gratefully acknowledge the financial support provided by BMWi, the German Federal Ministry of Economic Affairs and Energy, for funding of the project BaSyMo (FKZ: 03ET6087I). We like to thank our project partner for their excellent collaboration on the topic of battery research: ElringKlinger AG.
Conflicts of Interest
The authors declare no conflict of interest. The founding sponsors had no role in the design of the study; in the collection, analysis, or interpretation of data; in the writing of the manuscript, and in the decision to publish the results.
Appendix A
The derivation and discussions of the model type [77,78,79] and the implementation in COMSOL Multiphysics® [65] can be found within the reference list. For details on the model parameterization, the reader is referred to the study [47] by Liebig et al. The governing equations are shown Table A1. Parameter modifications with respect to the underlying modifications are denoted by . Phase and domain indices are denoted by and , respectively:

Table A1.
The governing equations of the physicochemical model.
| Domain/Meaning | Governing Equation | Boundary Condition |
|---|---|---|
| Solid Phase/Electrodes | ||
| Mass Conservation | ||
| Charge Conservation | ||
| Liquid-Phase/Electrolyte | ||
| Mass Conservation | ||
| Charge Conservation | ||
| Reaction Kinetics | ||
| Reaction Rate Pore Wall Flux | ||
| Over-Potential | ||
| Electrode Stack | ||
| Terminal Voltage | ||
Based on the solution variables, the heat dissipation sources will be quantified. The total battery heat dissipation density is implemented in this study as the sum of the integrated heat dissipation sources resulting during the energy transfer processes [27]. Heat by side reactions and particle mixing within the electrode domains is considered negligible [17,80]. The heat dissipation density variable definitions are shown in Table A2:
Table A2.
The heat dissipation sources within the physicochemical model.
| Domain/Meaning | Equation |
|---|---|
| Electrode | |
| Reversible Heat | |
| Irreversible Polarization Heat | |
| Irreversible Ohmic Heat | |
| Separator | |
| Irreversible Ohmic Heat | |
| Terminal/Current Collector | |
| Irreversible Ohmic Heat | |
| Electrode Stack | |
| Total Heat Dissipation | |
The upcoming set of equations is chosen and partially refined to reproduce the electrode balancing and reaction kinetics of the cell with respect to the governing equations and underlying domains defined in Table A1:
- The inactive fraction of the electrodes’ SoC windows is calculated by:
- The actual electrode capacities and are calculated based on the fact that the usable capacity represents the active material loading, while the counterparts in each electrode remain inactive:
- The theoretical electrode capacities are calculated as follows:
- The electrodes’ active material fraction is received by calculating the ratio of the actual electrode capacity of the theoretical electrode capacity:
- The specific surface area is calculated as follows:
- Similarly the actual surface area is calculated as follows:
- The temperature dependence of model variables is considered by applying the Arrhenius relation:where is the variable, is the variables value at the reference temperature , is the activation energy, is the universal gas constant and is the temperature variable.
- Each electrode’s exchange current density is defined as temperature-dependent with respect to [56]:
- Each electrode’s diffusion coefficient is dependent upon the electrodes SoC and temperature. Therefore, the following equations are defined with respect to [56]:whereand
- The electrolyte diffusion coefficient is defined as follows, as is taken from Nyman et al. [81]:where
- The transference number is defined as follows, as taken from Nyman et al. [81]:
- The effective thermodynamic activity coefficient is defined as follows, as taken from [81]:
- The effective electrode conductivity is defined as follows:
- The effective diffusional electrolyte conductivity is defined as follows:
Table A3.
Summary of the all material and cell properties resembling the analyzed battery cell.
| Meaning | Symbol | Unit | Negative Electrode | Separator | Positive Electrode | Reference |
|---|---|---|---|---|---|---|
| Design Specifications | ||||||
| Domain Thickness | L | 47.5 | 24.7 | 54.5 | [47] | |
| Electrode Plate Area | A | 2.1024 | [47] | |||
| Particle Radius | 9.89 | 1.72 | [47] | |||
| Actual Capacity | 48.17 | 69.20 | (A2) | |||
| Active Electrode Volume | 99.86 | 114.58 | [47] | |||
| Molar Mass | ( | 72.0 | 96.5 | [56] | ||
| Density | 2260 [83] | 4670 [84] | [56] | |||
| Theoretical Capacity | 84.01 | 148.61 | (A3) | |||
| Lower Electrode SoC | 0.01 | 0.415 | [47] | |||
| Upper Electrode SoC | 0.785 | 0.955 | [47] | |||
| Active Material Fraction | 0.548 | 0.457 | (A4) | |||
| Specific Surface Area | 172,730 | 825880 | (A5) | |||
| Surface Area | 17.25 | 94.63 | (A6) | |||
| Electrolyte Volume Fraction | 0.308 | 0.395 [56] | 0.191 | [47,56] | ||
| Inactive Volume Fraction | 0.189 | 0.45 | (A1) | |||
| Kinetic and Transport Properties | ||||||
| Open-Circuit Potential | U | Taken from [47] | Taken from [56] | [47,56] | ||
| Temperature derivative of Open-Circuit Potential | Taken from [27] | [26] | [26,27] | |||
| Charge Transfer Symmetry Factor | 0.5 | 0.5 | [53] | |||
| Maximum Lithium Intercalation Concentration | 31389 | 48396 | [56] | |||
| Equilibrium Electrolyte Concentration | 1000 | [56] | ||||
| Effective Electrode Diffusion Coefficient | (A9) | (A9) | [56] | |||
| Reference Electrode Diffusion Coefficient | (A10) | (A11) | [56] | |||
| Effective Electrode Electronic Conductivity | (A18) | (A18) | [56] | |||
| Reference Electrode Electronic Conductivity | 100 | 10 | [56] | |||
| Effective Electrolyte Conductivity | (A16) | [81] | ||||
| Reference Electrolyte Conductivity | (A17) | [81] | ||||
| Bruggeman Exponent | 1.5 | 1.5 | 1.5 | [85] | ||
| Effective Diffusional Electrolyte conductivity | (A19) | [60] | ||||
| Effective Electrolyte Diffusion Coefficient | (A12) | [81,82] | ||||
| Reference Electrolyte Diffusion Coefficient | (A13) | [81] | ||||
| Li-transference Number | (A14) | [81] | ||||
| Effective Electrolyte Activity coefficient | (A15) | [81,82] | ||||
| Reaction Rate Coefficient | [47] | |||||
| Double Layer Capacitance | 5.18 | 0.96 | [47] | |||
| Ohmic Resistance | 1.24 | [47] | ||||
| Exchange Current Density Activation Energy | 48.9 | 78.1 | [56] | |||
| Electrode Diffusion Activation Energy | 28.8 | 49.6 | [56] | |||
| Electrolyte Diffusion Activation Energy | 16.5 | [82] | ||||
| Electrolyte Conductivity Activation Energy | 4.0 | [82] | ||||
| Electrolyte Activity Coefficient | −1.0 | [82] | ||||
References
- Arora, S. Selection of thermal management system for modular battery packs of electric vehicles: A review of existing and emerging technologies. J. Power Sources 2018, 400, 621–640. [Google Scholar] [CrossRef]
- Khan, M.; Swierczynski, M.; Kær, S. Towards an ultimate battery thermal management system: A review. Batteries 2017, 3, 9. [Google Scholar] [CrossRef]
- Zhao, R.; Zhang, S.; Liu, J.; Gu, J. A review of thermal performance improving methods of lithium ion battery: Electrode modification and thermal management system. J. Power Sources 2015, 299, 557–577. [Google Scholar] [CrossRef]
- Waldmann, T.; Wilka, M.; Kasper, M.; Fleischhammer, M.; Wohlfahrt-Mehrens, M. Temperature dependent ageing mechanisms in Lithium-ion batteries—A Post-Mortem study. J. Power Sources 2014, 262, 129–135. [Google Scholar] [CrossRef]
- Barré, A.; Deguilhem, B.; Grolleau, S.; Gérard, M.; Suard, F.; Riu, D. A review on lithium-ion battery ageing mechanisms and estimations for automotive applications. J. Power Sources 2013, 241, 680–689. [Google Scholar] [CrossRef]
- Ma, S.; Jiang, M.; Tao, P.; Song, C.; Wu, J.; Wang, J.; Deng, T.; Shang, W. Temperature effect and thermal impact in lithium-ion batteries: A review. Prog. Nat. Sci. Mater. Int. 2018, 28, 653–666. [Google Scholar] [CrossRef]
- Smith, K.; Shi, Y.; Wood, E.; Pesaran, A. Advanced automotive battery conference, Detroit, Michigan. In Presentation: Optimizing Battery Usage and Management for Long Life; National Renewable Energy Laboratory: Golden, CO, USA, 2016. [Google Scholar]
- Ye, B.; Rubel, M.; Li, H. Design and optimization of cooling plate for battery module of an electric vehicle. Appl. Sci. 2019, 9, 754. [Google Scholar] [CrossRef]
- Liu, L.; Park, J.; Lin, X.; Sastry, A.M.; Lu, W. A thermal-electrochemical model that gives spatial-dependent growth of solid electrolyte interphase in a Li-ion battery. J. Power Sources 2014, 268, 482–490. [Google Scholar] [CrossRef]
- Liu, L.; Zhu, M. Modeling of SEI layer growth and electrochemical impedance spectroscopy response using a thermal-electrochemical model of Li-ion batteries. ECS Trans. 2014, 61, 43–61. [Google Scholar] [CrossRef]
- Bizeray, A.M.; Zhao, S.; Duncan, S.R.; Howey, D.A. Lithium-ion battery thermal-electrochemical model-based state estimation using orthogonal collocation and a modified extended Kalman filter. J. Power Sources 2015, 296, 400–412. [Google Scholar] [CrossRef]
- Behrou, R.; Maute, K. Numerical modeling of damage evolution phenomenon in solid-state lithium-ion batteries. J. Electrochem. Soc. 2017, 164, 2573–2589. [Google Scholar] [CrossRef]
- Cai, L.; White, R.E. Mathematical modeling of a lithium ion battery with thermal effects in COMSOL Inc. Multiphysics (MP) software. J. Power Sources 2011, 196, 5985–5989. [Google Scholar] [CrossRef]
- Jalkanen, K.; Aho, T.; Vuorilehto, K. Entropy change effects on the thermal behavior of a LiFePO 4/graphite lithium-ion cell at different states of charge. J. Power Sources 2013, 243, 354–360. [Google Scholar] [CrossRef]
- Capron, O.; Jaguemont, J.; Gopalakrishnan, R.; Van Den Bossche, P.; Omar, N.; Van Mierlo, J. Impact of the temperature in the evaluation of battery performances during long-term cycling—Characterisation and modelling. Appl. Sci. 2018, 8, 1364. [Google Scholar] [CrossRef]
- Liu, C.; Liu, L. Optimal design of Li-ion batteries through multi-physics modeling and multi-objective optimization. J. Electrochem. Soc. 2017, 164, 3254–3264. [Google Scholar] [CrossRef]
- Mei, W.; Chen, H.; Sun, J.; Wang, Q. The effect of electrode design parameters on battery performance and optimization of electrode thickness based on the electrochemical–thermal coupling model. Sustain. Energy Fuels 2019, 3, 148–165. [Google Scholar] [CrossRef]
- Vega-Garita, V.; Ramirez-Elizondo, L.; Bauer, P. Physical integration of a photovoltaic-battery system: A thermal analysis. Appl. Energy 2017, 208, 446–455. [Google Scholar] [CrossRef]
- Keyser, M.; Pesaran, A.; Li, Q.; Santhanagopalan, S.; Smith, K.; Wood, E.; Ahmed, S.; Bloom, I.; Dufek, E.; Shirk, M.; et al. Enabling fast charging—Battery thermal considerations. J. Power Sources 2017, 367, 228–236. [Google Scholar] [CrossRef]
- Rahn, C.D.; Wang, C.Y. Battery Systems Engineering; John Wiley & Sons Ltd.: Chichester, UK, 2013. [Google Scholar]
- Bohn, P.; Liebig, G.; Komsiyska, L.; Wittstock, G. Temperature propagation in prismatic lithium-ion-cells after short term thermal stress. J. Power Sources 2016, 313, 30–36. [Google Scholar] [CrossRef]
- Becker, J.; Nemeth, T.; Wegmann, R.; Sauer, D. Dimensioning and optimization of hybrid Li-ion battery systems for EVs. World Electr. Veh. J. 2018, 9, 19. [Google Scholar] [CrossRef]
- Liu, H.; Wei, Z.; He, W.; Zhao, J. Thermal issues about Li-ion batteries and recent progress in battery thermal management systems: A review. Energy Convers. Manag. 2017, 150, 304–330. [Google Scholar] [CrossRef]
- Schweiger, H.G.; Obeidi, O.; Komesker, O.; Raschke, A.; Schiemann, M.; Zehner, C.; Gehnen, M.; Keller, M.; Birke, P. Comparison of several methods for determining the internal resistance of lithium ion cells. Sensors 2010, 10, 5604–5625. [Google Scholar] [CrossRef] [PubMed]
- Park, M.; Zhang, X.; Chung, M.; Less, G.B.; Sastry, A.M. A review of conduction phenomena in Li-ion batteries. J. Power Sources 2010, 195, 7904–7929. [Google Scholar] [CrossRef]
- Viswanathan, V.V.; Choi, D.; Wang, D.; Xu, W.; Towne, S.; Williford, R.E.; Zhang, J.G.; Liu, J.; Yang, Z. Effect of entropy change of lithium intercalation in cathodes and anodes on Li-ion battery thermal management. J. Power Sources 2010, 195, 3720–3729. [Google Scholar] [CrossRef]
- Thomas, K.E.; Newman, J. Heats of mixing and of entropy in porous insertion electrodes. J. Power Sources 2003, 119, 844–849. [Google Scholar] [CrossRef]
- Bernardi, D.; Newman, J.; Pawlikowski, E. A general energy balance for battery systems. J. Electrochem. Soc. 1985, 132. [Google Scholar] [CrossRef]
- Loges, A.; Herberger, S.; Seegert, P.; Wetzel, T. A study on specific heat capacities of Li-ion cell components and their influence on thermal management. J. Power Sources 2016, 336, 341–350. [Google Scholar] [CrossRef]
- Maleki, H.; Al Hallaj, S.A.H.; Selman, R.; Dinwiddie, R.B.; Wang, H. Thermal properties of lithium-ion battery and components. J. Electrochem. Soc. 1999, 146, 947. [Google Scholar] [CrossRef]
- Maleki, H.; Wang, H.; Porter, W.; Hallmark, J. Li-Ion polymer cells thermal property changes as a function of cycle-life. J. Power Sources 2014, 263, 223–230. [Google Scholar] [CrossRef]
- Werner, D.; Loges, A.; Becker, D.J.; Wetzel, T. Thermal conductivity of Li-ion batteries and their electrode configurations—A novel combination of modelling and experimental approach. J. Power Sources 2017, 364, 72–83. [Google Scholar] [CrossRef]
- Koo, B.; Goli, P.; Sumant, A.V.; Dos Santos Claro, P.C.; Rajh, T.; Johnson, C.S.; Balandin, A.A.; Shevchenko, E.V. Toward lithium ion batteries with enhanced thermal conductivity. ACS Nano 2014, 8, 7202–7207. [Google Scholar] [CrossRef] [PubMed]
- Reimers, J.N. Accurate and efficient treatment of foil currents in a spiral wound Li-ion cell. J. Electrochem. Soc. 2013, 161, 118–127. [Google Scholar] [CrossRef]
- Erhard, S.V.; Osswald, P.J.; Keil, P.; Höffer, E.; Haug, M.; Noel, A.; Wilhelm, J.; Rieger, B.; Schmidt, K.; Kosch, S.; et al. Simulation and measurement of the current density distribution in lithium-ion batteries by a multi-tab cell approach. J. Electrochem. Soc. 2017, 164, 6324–6333. [Google Scholar] [CrossRef]
- Yi, J.; Kim, U.S.; Shin, C.B.; Han, T.; Park, S. Three-dimensional thermal modeling of a lithium-ion battery considering the combined effects of the electrical and thermal contact resistances between current collecting tab and lead wire. J. Electrochem. Soc. 2013, 160, 437–443. [Google Scholar] [CrossRef]
- Hales, A.; Diaz, L.B.; Marzook, M.W.; Zhao, Y.; Patel, Y.; Offer, G. The cell cooling coefficient: A standard to define heat rejection from lithium-ion batteries. J. Electrochem. Soc. 2019, 166, 2383–2395. [Google Scholar] [CrossRef]
- Yu, K.; Yang, X.; Cheng, Y.; Li, C. Thermal analysis and two-directional air flow thermal management for lithium-ion battery pack. J. Power Sources 2014, 270, 193–200. [Google Scholar] [CrossRef]
- Park, H. A design of air flow configuration for cooling lithium ion battery in hybrid electric vehicles. J. Power Sources 2013, 239, 30–36. [Google Scholar] [CrossRef]
- Wang, T.; Tseng, K.J.; Zhao, J. Development of efficient air-cooling strategies for lithium-ion battery module based on empirical heat source model. Appl. Therm. Eng. 2015, 90, 521–529. [Google Scholar] [CrossRef]
- Sun, H.; Dixon, R. Development of a liquid cooled battery module. J. Electrochem. Soc. 2016, 163, 313–321. [Google Scholar] [CrossRef]
- Zhao, C.; Cao, W.; Dong, T.; Jiang, F. Thermal behavior study of discharging/charging cylindrical lithium-ion battery module cooled by channeled liquid flow. Int. J. Heat Mass Transf. 2018, 120, 751–762. [Google Scholar] [CrossRef]
- Tran, T.-H.; Harmand, S.; Desmet, B.; Filangi, S. Experimental investigation on the feasibility of heat pipe cooling for HEV/EV lithium-ion battery. Appl. Therm. Eng. 2014, 63, 551–558. [Google Scholar] [CrossRef]
- Khateeb, S.A.; Amiruddin, S.; Farid, M.; Selman, J.R.; Al-Hallaj, S. Thermal management of Li-ion battery with phase change material for electric scooters: Experimental validation. J. Power Sources 2005, 142, 345–353. [Google Scholar] [CrossRef]
- Somasundaram, K.; Birgersson, E.; Mujumdar, A.S. Thermal–electrochemical model for passive thermal management of a spiral-wound lithium-ion battery. J. Power Sources 2012, 203, 84–96. [Google Scholar] [CrossRef]
- Zhao, L.; Wang, J.; Li, Y.; Liu, Q.; Li, W. Experimental investigation of a lithium battery cooling system. Sustainability 2019, 11, 5020. [Google Scholar] [CrossRef]
- Liebig, G.; Gupta, G.; Kirstein, U.; Schuldt, F.; Agert, C. Parameterization and validation of an electrochemical thermal model of a lithium-ion battery. Batteries 2019, 5, 62. [Google Scholar] [CrossRef]
- Ecker, M.; Tran, T.K.D.; Dechent, P.; Kabitz, S.; Warnecke, A.; Sauer, D.U. Parameterization of a physico-chemical model of a lithium-ion battery: I. Determination of parameters. J. Electrochem. Soc. 2015, 162, A1836–A1848. [Google Scholar] [CrossRef]
- Schmalstieg, J.; Rahe, C.; Ecker, M.; Sauer, D.U. Full cell parameterization of a high-power lithium-ion battery for a physico-chemical model: Part I. Physical and electrochemical parameters. J. Electrochem. Soc. 2018, 165, 3799–3810. [Google Scholar] [CrossRef]
- Dai, H.; Jiang, B.; Wei, X. Impedance characterization and modeling of lithium-ion batteries considering the internal temperature gradient. Energies 2018, 11, 220. [Google Scholar] [CrossRef]
- Schmalstieg, J.; Sauer, D.U. Full cell parameterization of a high-power lithium-ion battery for a physico-chemical model: Part II. Thermal parameters and validation. J. Electrochem. Soc. 2018, 165, 3811–3819. [Google Scholar] [CrossRef]
- Ecker, M.; Kabitz, S.; Laresgoiti, I.; Sauer, D.U. Parameterization of a Physico-chemical model of a lithium-ion battery: II. Model validation. J. Electrochem. Soc. 2015, 162, 1849–1857. [Google Scholar] [CrossRef]
- Erhard, S. Mehrdimensionale Elektrochemisch-Thermische Modellierung Von Lithium-Ionen-Batterien. Ph.D. Thesis, Technische Universität München, Munich, Germany, 2017. [Google Scholar]
- Christen, R.; Rizzo, G.; Gadola, A.; Stöck, M. Test method for thermal characterization of Li-ion cells and verification of cooling concepts. Batteries 2017, 3, 3. [Google Scholar] [CrossRef]
- Wu, B.; Li, Z.; Zhang, J. Thermal design for the pouch-type large-format lithium-ion batteries: I. Thermo-electrical modeling and origins of temperature non-uniformity. J. Electrochem. Soc. 2014, 162, 181–191. [Google Scholar] [CrossRef]
- Schmalstieg, J. Physikalisch-Elektrochemische Simulation Von Lithium-Ionen-Batterien: Implementierung, Parametrierung und Anwendung. Ph.D. Thesis, RWTH Aachen University, Aachener Beiträge des ISEA, Aachen, Germany, 2017. [Google Scholar]
- Ecker, M. Lithium Plating in Lithium-Ion Batteries: An Experimental and Simulation Approach. Ph.D. Thesis, RWTH Aachen University, Aachener Beiträge des ISEA, Aachen, Germany, 2016. [Google Scholar]
- Höhne, G.W.H.; Hemminger, W.F.; Flammersheim, H.J. Theoretical fundamentals of differential scanning calorimeters. In Differential Scanning Calorimetry; Springer: Berlin, Heidelberg, 2003; pp. 31–63. [Google Scholar]
- Parker, W.J.; Jenkins, R.J.; Butler, C.P.; Abbott, G.L. Flash method of determining thermal diffusivity, heat capacity, and thermal conductivity. J. Appl. Phys. 1961, 32, 1679–1684. [Google Scholar] [CrossRef]
- Kim, S.U.; Albertus, P.; Cook, D.; Monroe, C.W.; Christensen, J. Thermoelectrochemical simulations of performance and abuse in 50-Ah automotive cells. J. Power Sources 2014, 268, 625–633. [Google Scholar] [CrossRef]
- Pals, C.R.; Newman, J. Thermal modeling of the lithium/polymer battery, I. Discharge behavior of a single cell. J. Electrochem. Soc. 1995, 10, 3274–3281. [Google Scholar] [CrossRef]
- Zhang, G.; Cao, L.; Ge, S.; Wang, C.Y.; Shaffer, C.E.; Rahn, C.D. In situ measurement of radial temperature distributions in cylindrical Li-ion cells. J. Electrochem. Soc. 2014, 161, 1499–1507. [Google Scholar] [CrossRef]
- Pop, I.; Ingham, D.B. Chapter 2—Mixed convection boundary-layer flow along a vertical flat plate. In Convective Heat Transfer; Pop, I., Ingham, D.B., Eds.; Pergamon: Oxford, UK, 2001; pp. 45–85. [Google Scholar]
- Kim, G.H.; Smith, K.; Lee, K.J.; Santhanagopalan, S.; Pesaran, A. Multi-domain modeling of lithium-ion batteries encompassing multi-physics in varied length scales. J. Electrochem. Soc. 2011, 158, 955. [Google Scholar] [CrossRef]
- Lundgren, H.; Svens, P.; Ekström, H.; Tengstedt, C.; Lindström, J.; Behm, M.; Lindbergh, G. Thermal management of large-format prismatic lithium-ion battery in PHEV application. J. Electrochem. Soc. 2015, 163, 309–317. [Google Scholar] [CrossRef]
- Optris GmbH. Basic Principles of Non-Contact Temperature Measurement. Available online: https://www.optris.de/lexikon?file=tl_files/pdf/Downloads/Zubehoer/IR-Grundlagen.pdf (accessed on 3 July 2019).
- Zhang, J.; Wu, B.; Li, Z.; Huang, J. Simultaneous estimation of thermal parameters for large-format laminated lithium-ion batteries. J. Power Sources 2014, 259, 106–116. [Google Scholar] [CrossRef]
- Touloukian, Y.S.; Liley, P.E.; Saxena, S.C. Thermophysical Properties of Matter—The TPRC Data Series. Volume 3. Thermal Conductivity—Nonmetallic Liquids and Gases. Available online: https://apps.dtic.mil/dtic/tr/fulltext/u2/a951937.pdf (accessed on 30 December 2019).
- Brainard, A.J.; Keenan, J.H.; Chao, J.; Kaye, J. Gas tables: International version second edition (SI units). AIChE J. 1984, 30, 172. [Google Scholar] [CrossRef]
- Klein, S.A.; Alvarado, F.L. Table Properties of Air at 1 Atm Pressure. Available online: https://www.me.psu.edu/cimbala/me433/Links/Table_A_9_CC_Properties_of_Air.pdf (accessed on 16 October 2019).
- Lee, K.J.; Smith, K.; Pesaran, A.; Kim, G.H. Three dimensional thermal-, electrical-, and electrochemical-coupled model for cylindrical wound large format lithium-ion batteries. J. Power Sources 2013, 241, 20–32. [Google Scholar] [CrossRef]
- Bazinski, S.J.; Wang, X. Experimental study on the influence of temperature and state-of-charge on the thermophysical properties of an LFP pouch cell. J. Power Sources 2015, 293, 283–291. [Google Scholar] [CrossRef]
- Sarge, S.M.; Poeßnecker, W. The influence of heat resistances and heat transfers on the uncertainty of heat-capacity measurements by means of differential scanning calorimetry (DSC). Thermochim. Acta 1999, 329, 17–21. [Google Scholar] [CrossRef]
- Vertiz, G.; Oyarbide, M.; Macicior, H.; Miguel, O.; Cantero, I.; Fernandez De Arroiabe, P.; Ulacia, I. Thermal characterization of large size lithium-ion pouch cell based on 1d electro-thermal model. J. Power Sources 2014, 272, 476–484. [Google Scholar] [CrossRef]
- Loges, A.; Herberger, S.; Werner, D.; Wetzel, T. Thermal characterization of Li-ion cell electrodes by photothermal deflection spectroscopy. J. Power Sources 2016, 325, 104–115. [Google Scholar] [CrossRef]
- Jarrett, A.; Kim, I.Y. Influence of operating conditions on the optimum design of electric vehicle battery cooling plates. J. Power Sources 2014, 245, 644–655. [Google Scholar] [CrossRef]
- Uddin, K.; Perera, S.; Widanage, W.; Somerville, L.; Marco, J. Characterising lithium-ion battery degradation through the identification and tracking of electrochemical battery model parameters. Batteries 2016, 2, 13. [Google Scholar] [CrossRef]
- Dao, T.S.; Vyasarayani, C.P.; McPhee, J. Simplification and order reduction of lithium-ion battery model based on porous-electrode theory. J. Power Sources 2012, 198, 329–337. [Google Scholar] [CrossRef]
- Hadigol, M.; Maute, K.; Doostan, A. On uncertainty quantification of lithium-ion batteries: Application to an LiC6/LiCoO2 cell. J. Power Sources 2015, 300, 507–524. [Google Scholar] [CrossRef]
- Liu, G.; Ouyang, M.; Lu, L.; Li, J.; Han, X. Analysis of the heat generation of lithium-ion battery during charging and discharging considering different influencing factors. J. Therm. Anal. Calorim. 2014, 116, 1001–1010. [Google Scholar] [CrossRef]
- Nyman, A.; Behm, M.; Lindbergh, G. Electrochemical characterisation and modelling of the mass transport phenomena in LiPF6–EC–EMC electrolyte. Electrochim. Acta 2008, 53, 6356–6365. [Google Scholar] [CrossRef]
- Zavalis, T.G.; Behm, M.; Lindbergh, G. Investigation of short-circuit scenarios in a lithium-ion battery cell. J. Electrochem. Soc. 2012, 159, 848–859. [Google Scholar] [CrossRef]
- Pierson, H.O. Handbook of Carbon, Graphite, Diamonds and Fullerenes—Processing, Properties and Applications; Noyes Publications: Park Ridge, NJ, USA, 1993. [Google Scholar]
- Villars, P.; Cenzual, K. Li[Ni1/3Co1/3Mn1/3]O2 Crystal Structure: Datasheet from “PAULING FILE Multinaries Edition—2012”. Available online: https://materials.springer.com/isp/crystallographic/docs/sd_1125611 (accessed on 5 September 2019).
- Von Srbik, M.T.; Marinescu, M.; Martinez-Botas, R.F.; Offer, G.J. A physically meaningful equivalent circuit network model of a lithium-ion battery accounting for local electrochemical and thermal behaviour, variable double layer capacitance and degradation. J. Power Sources 2016, 325, 171–184. [Google Scholar] [CrossRef]
Figure 1.
Schematics of the lithium–ion battery and heat transfer model.
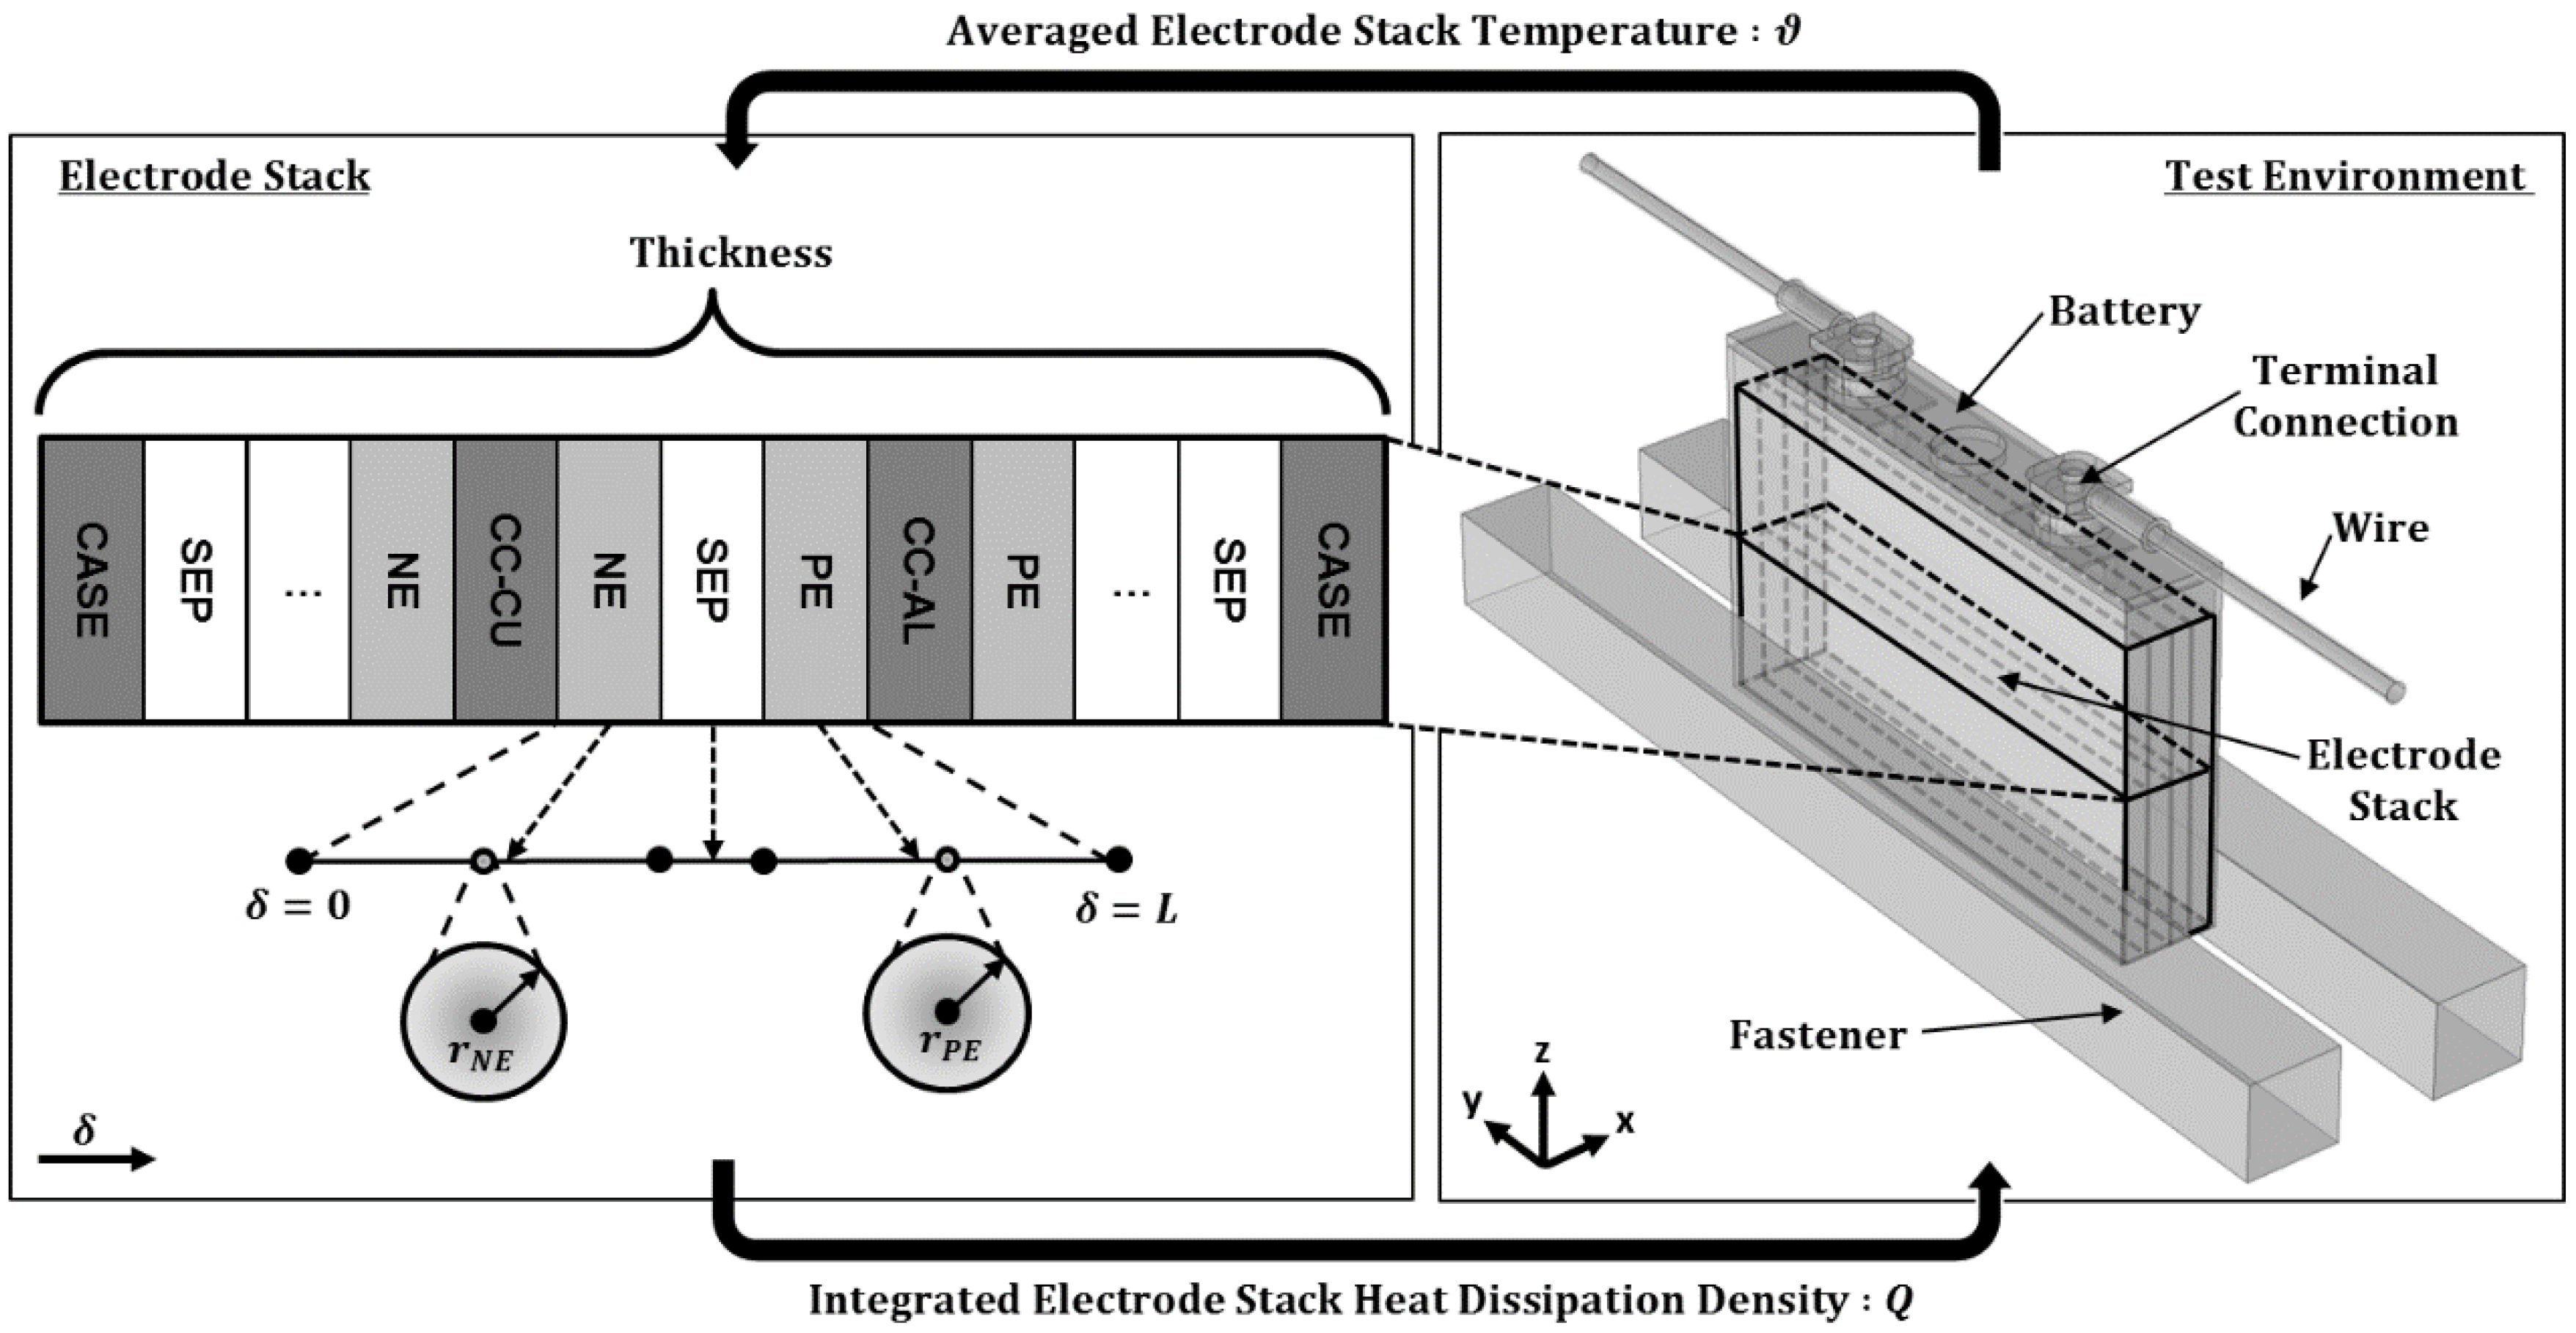
Figure 2.
Virtual battery design replication process in three steps.
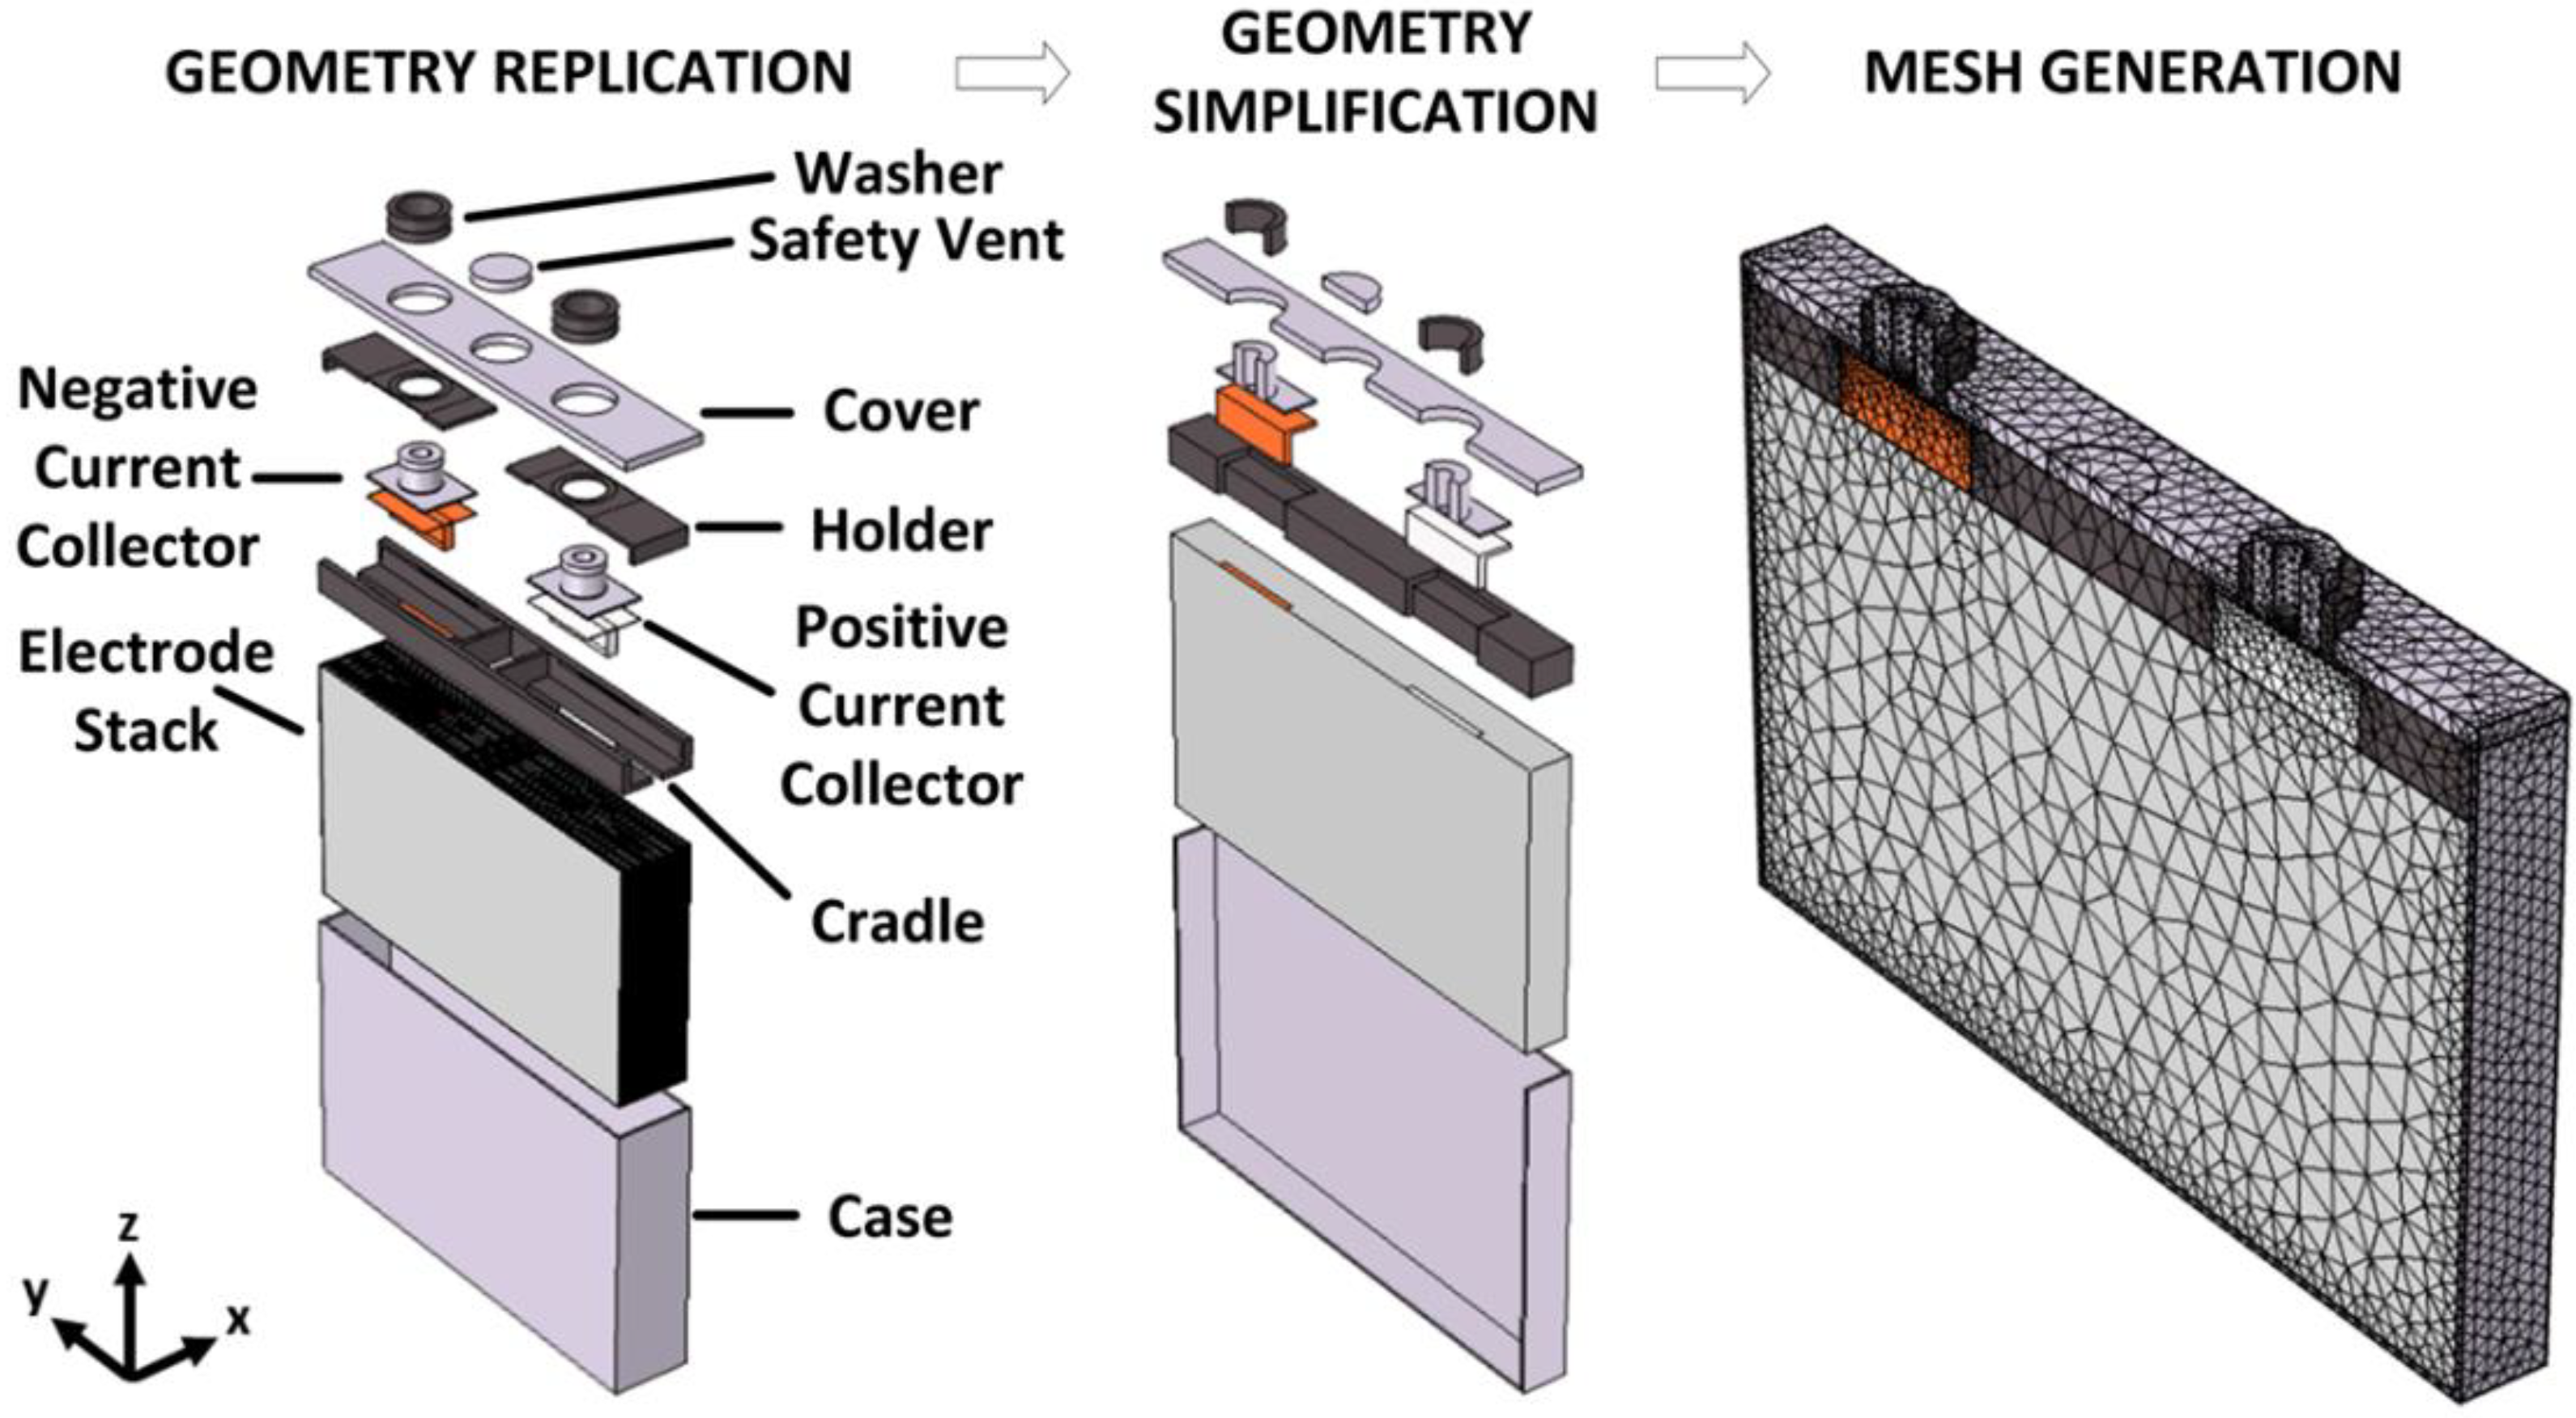
Figure 3.
The specific heat capacity of each component of the electrode stack is shown as a function of the temperature defined using Differential Scanning Calorimetry (DSC) measurements.
Figure 3.
The specific heat capacity of each component of the electrode stack is shown as a function of the temperature defined using Differential Scanning Calorimetry (DSC) measurements.
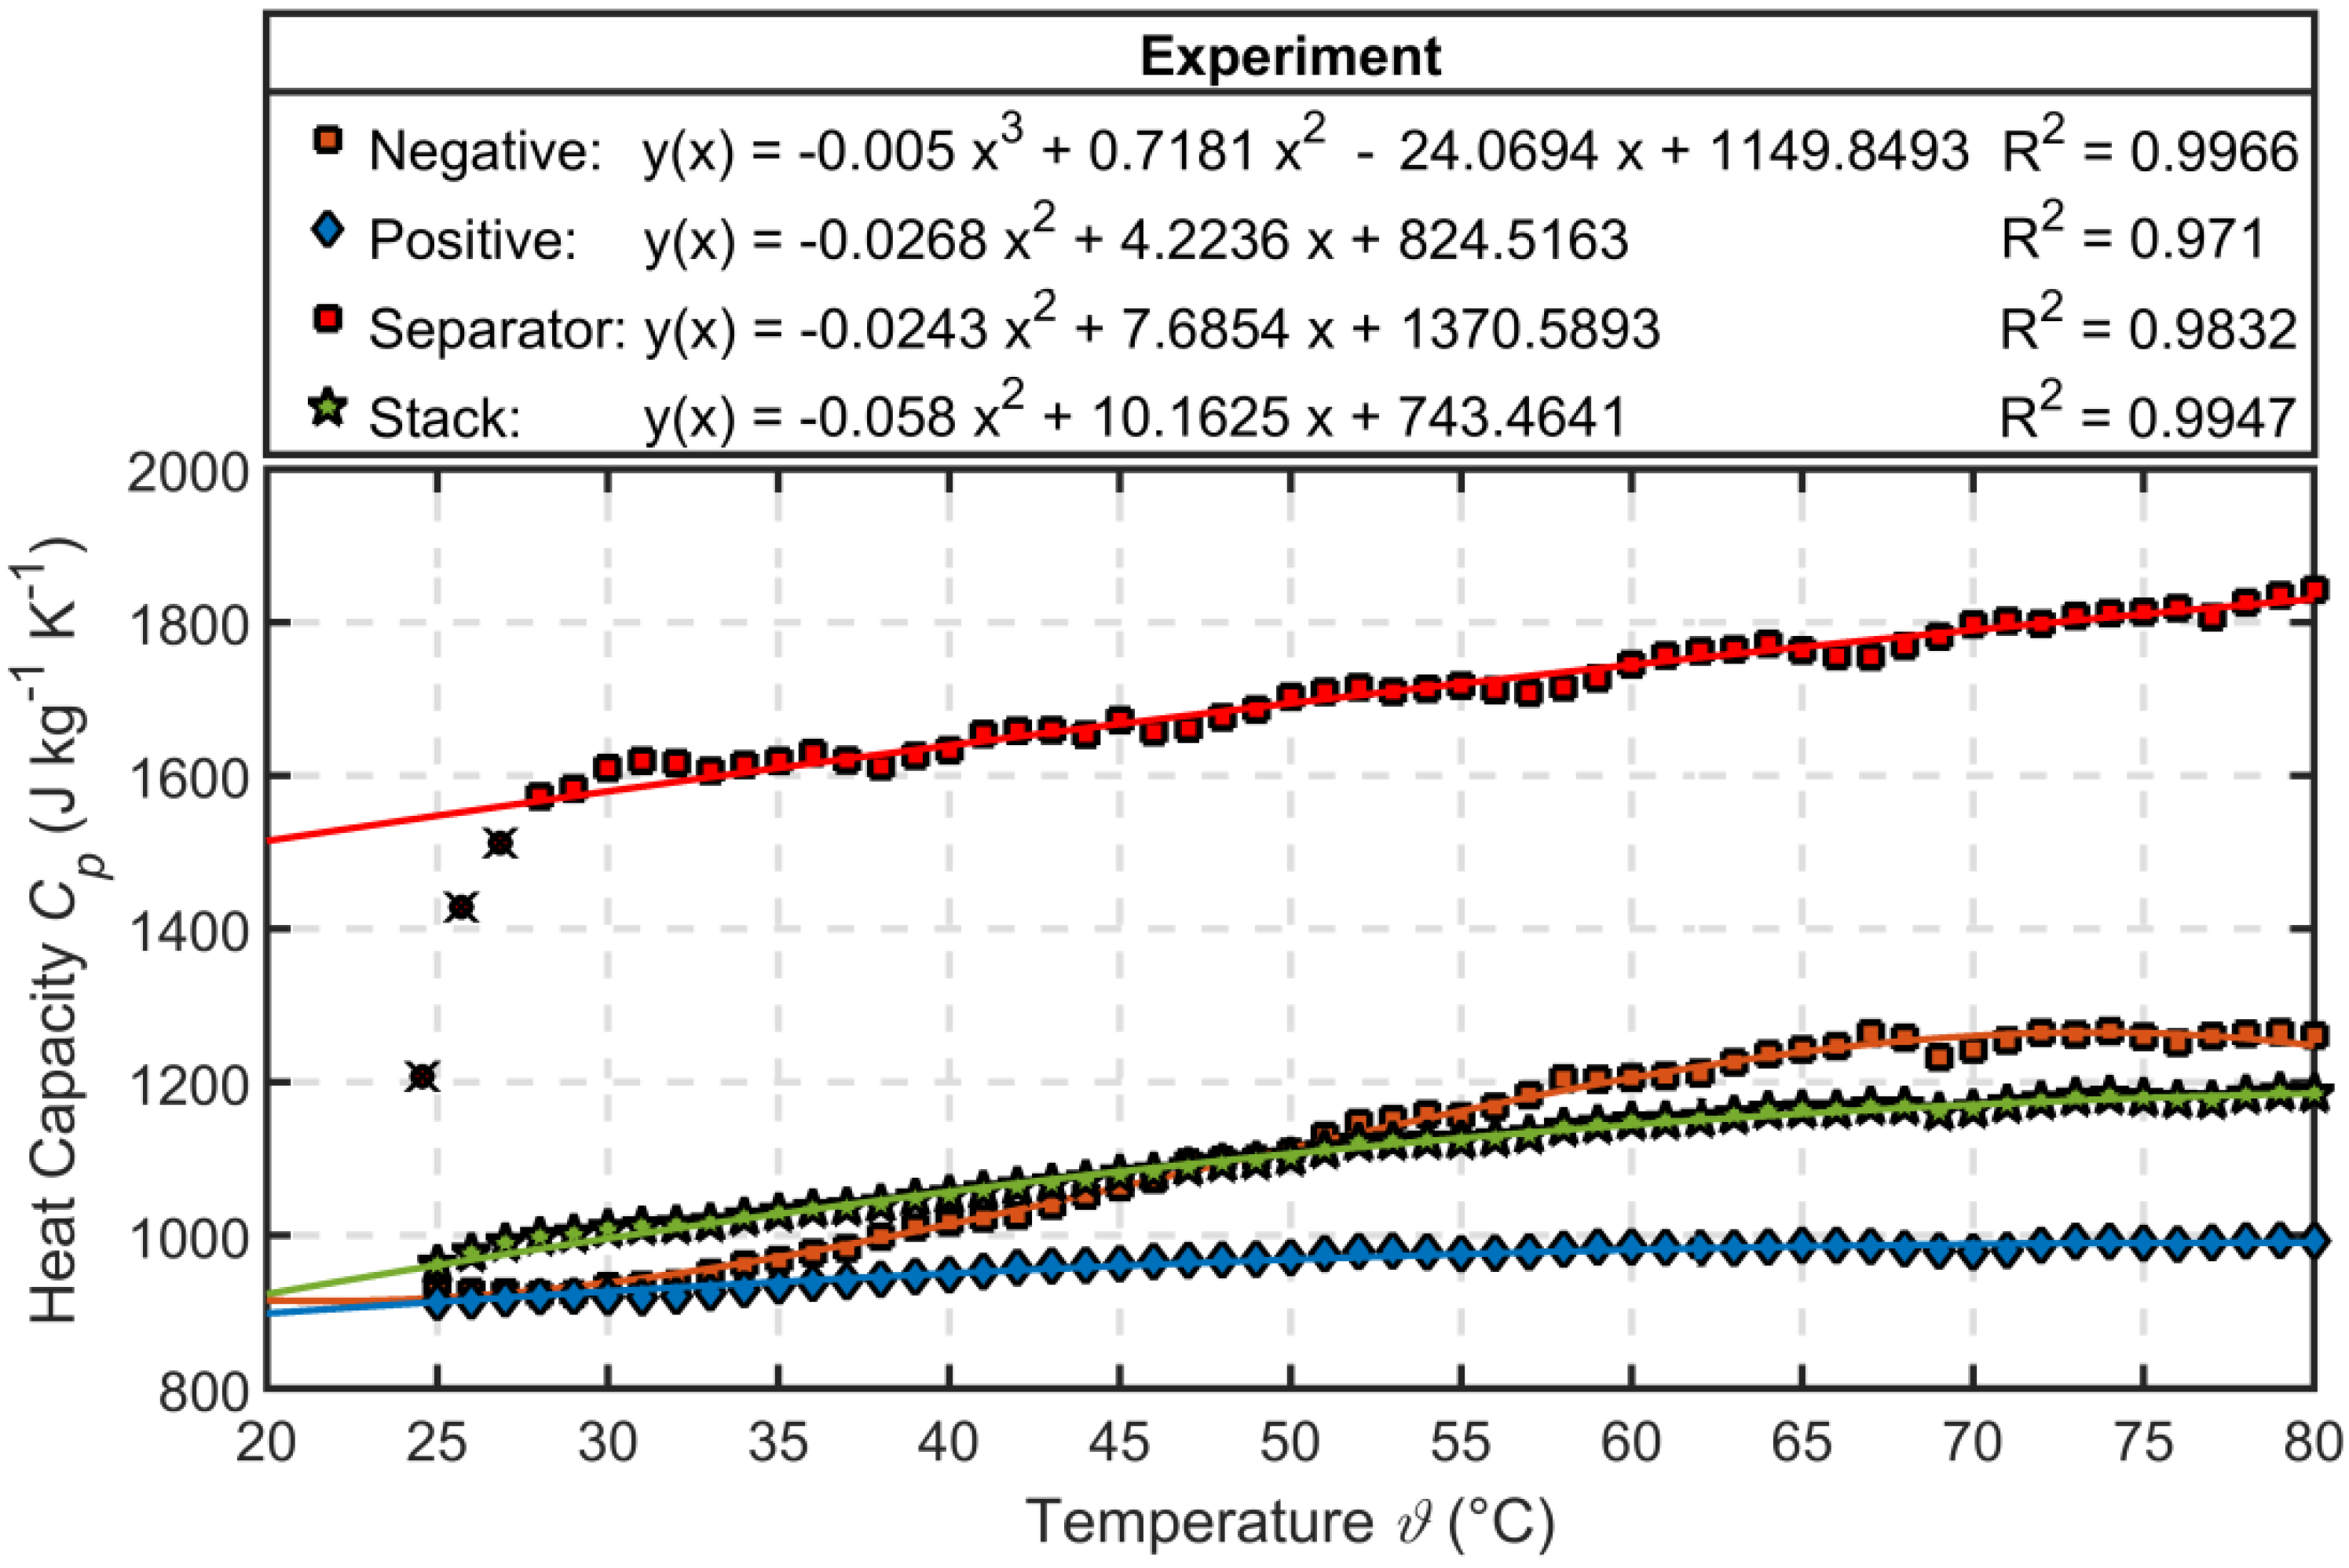
Figure 4.
The in-plane and through-plane thermal diffusivity for each electrode stack component is shown as a function of temperature obtained from Laser Flash Analysis (LFA) measurements.
Figure 4.
The in-plane and through-plane thermal diffusivity for each electrode stack component is shown as a function of temperature obtained from Laser Flash Analysis (LFA) measurements.
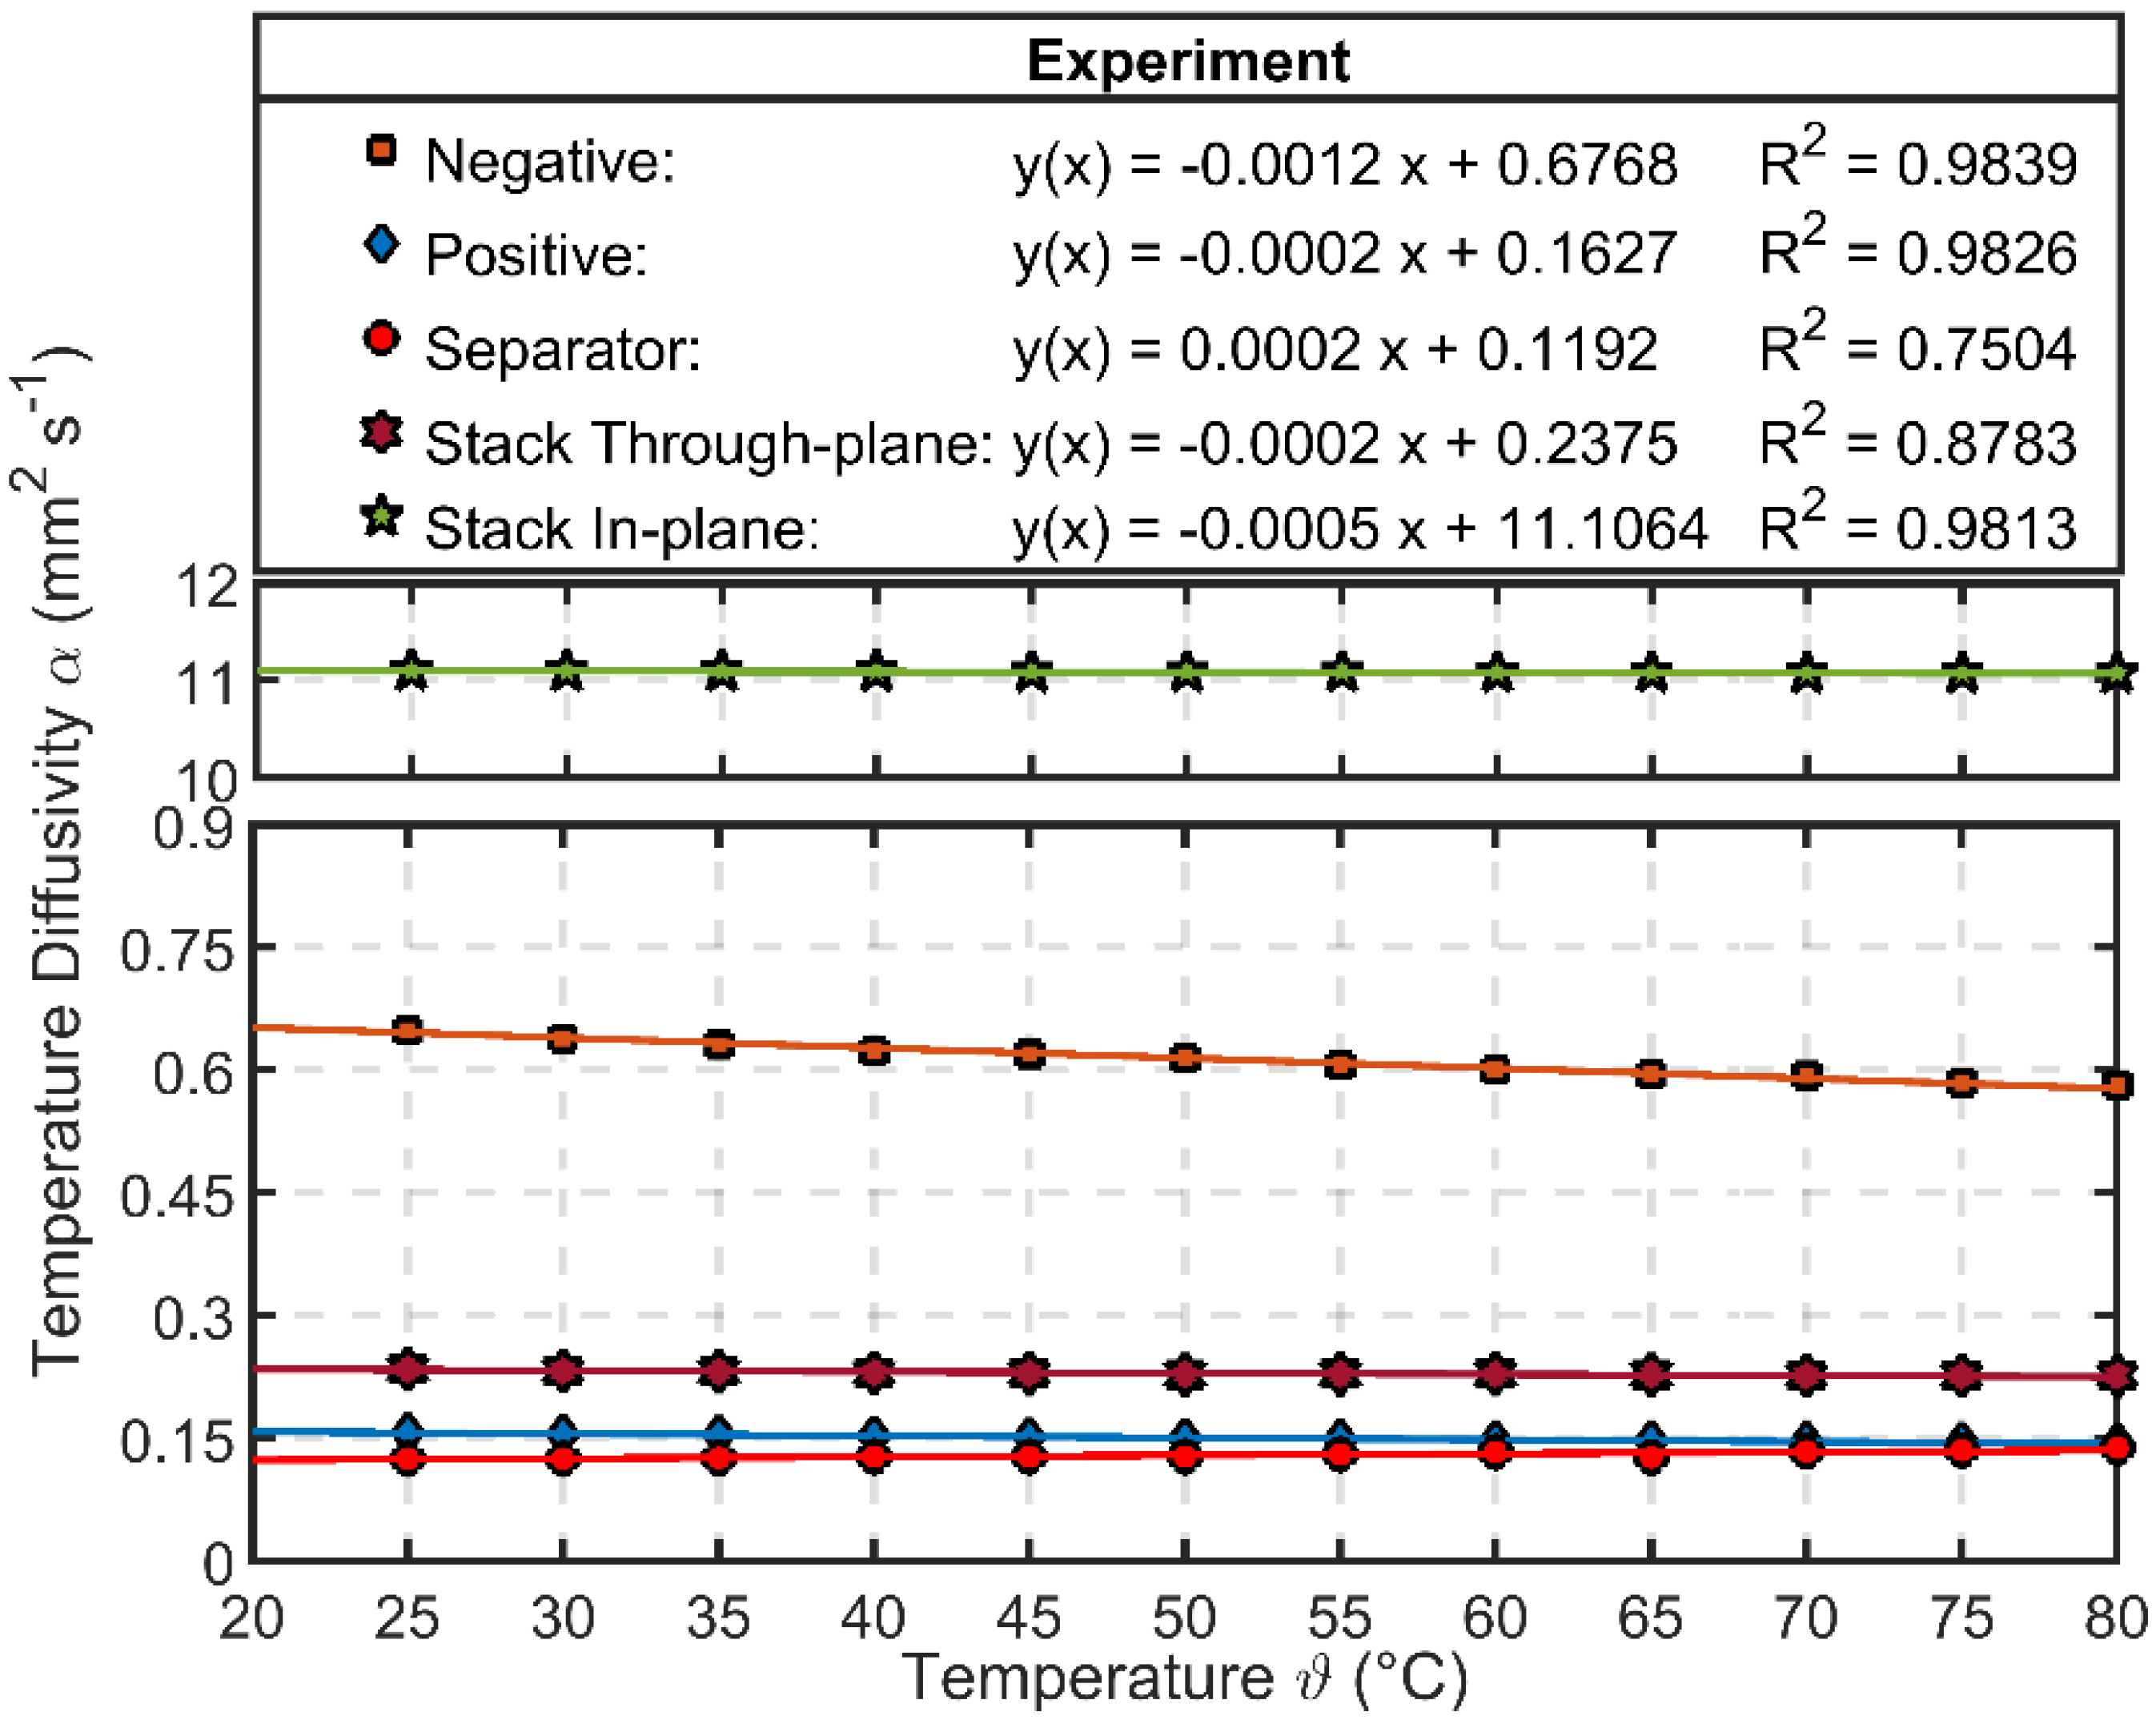
Figure 5.
Model study design variants shown with respect to the underlying degrees of freedom.
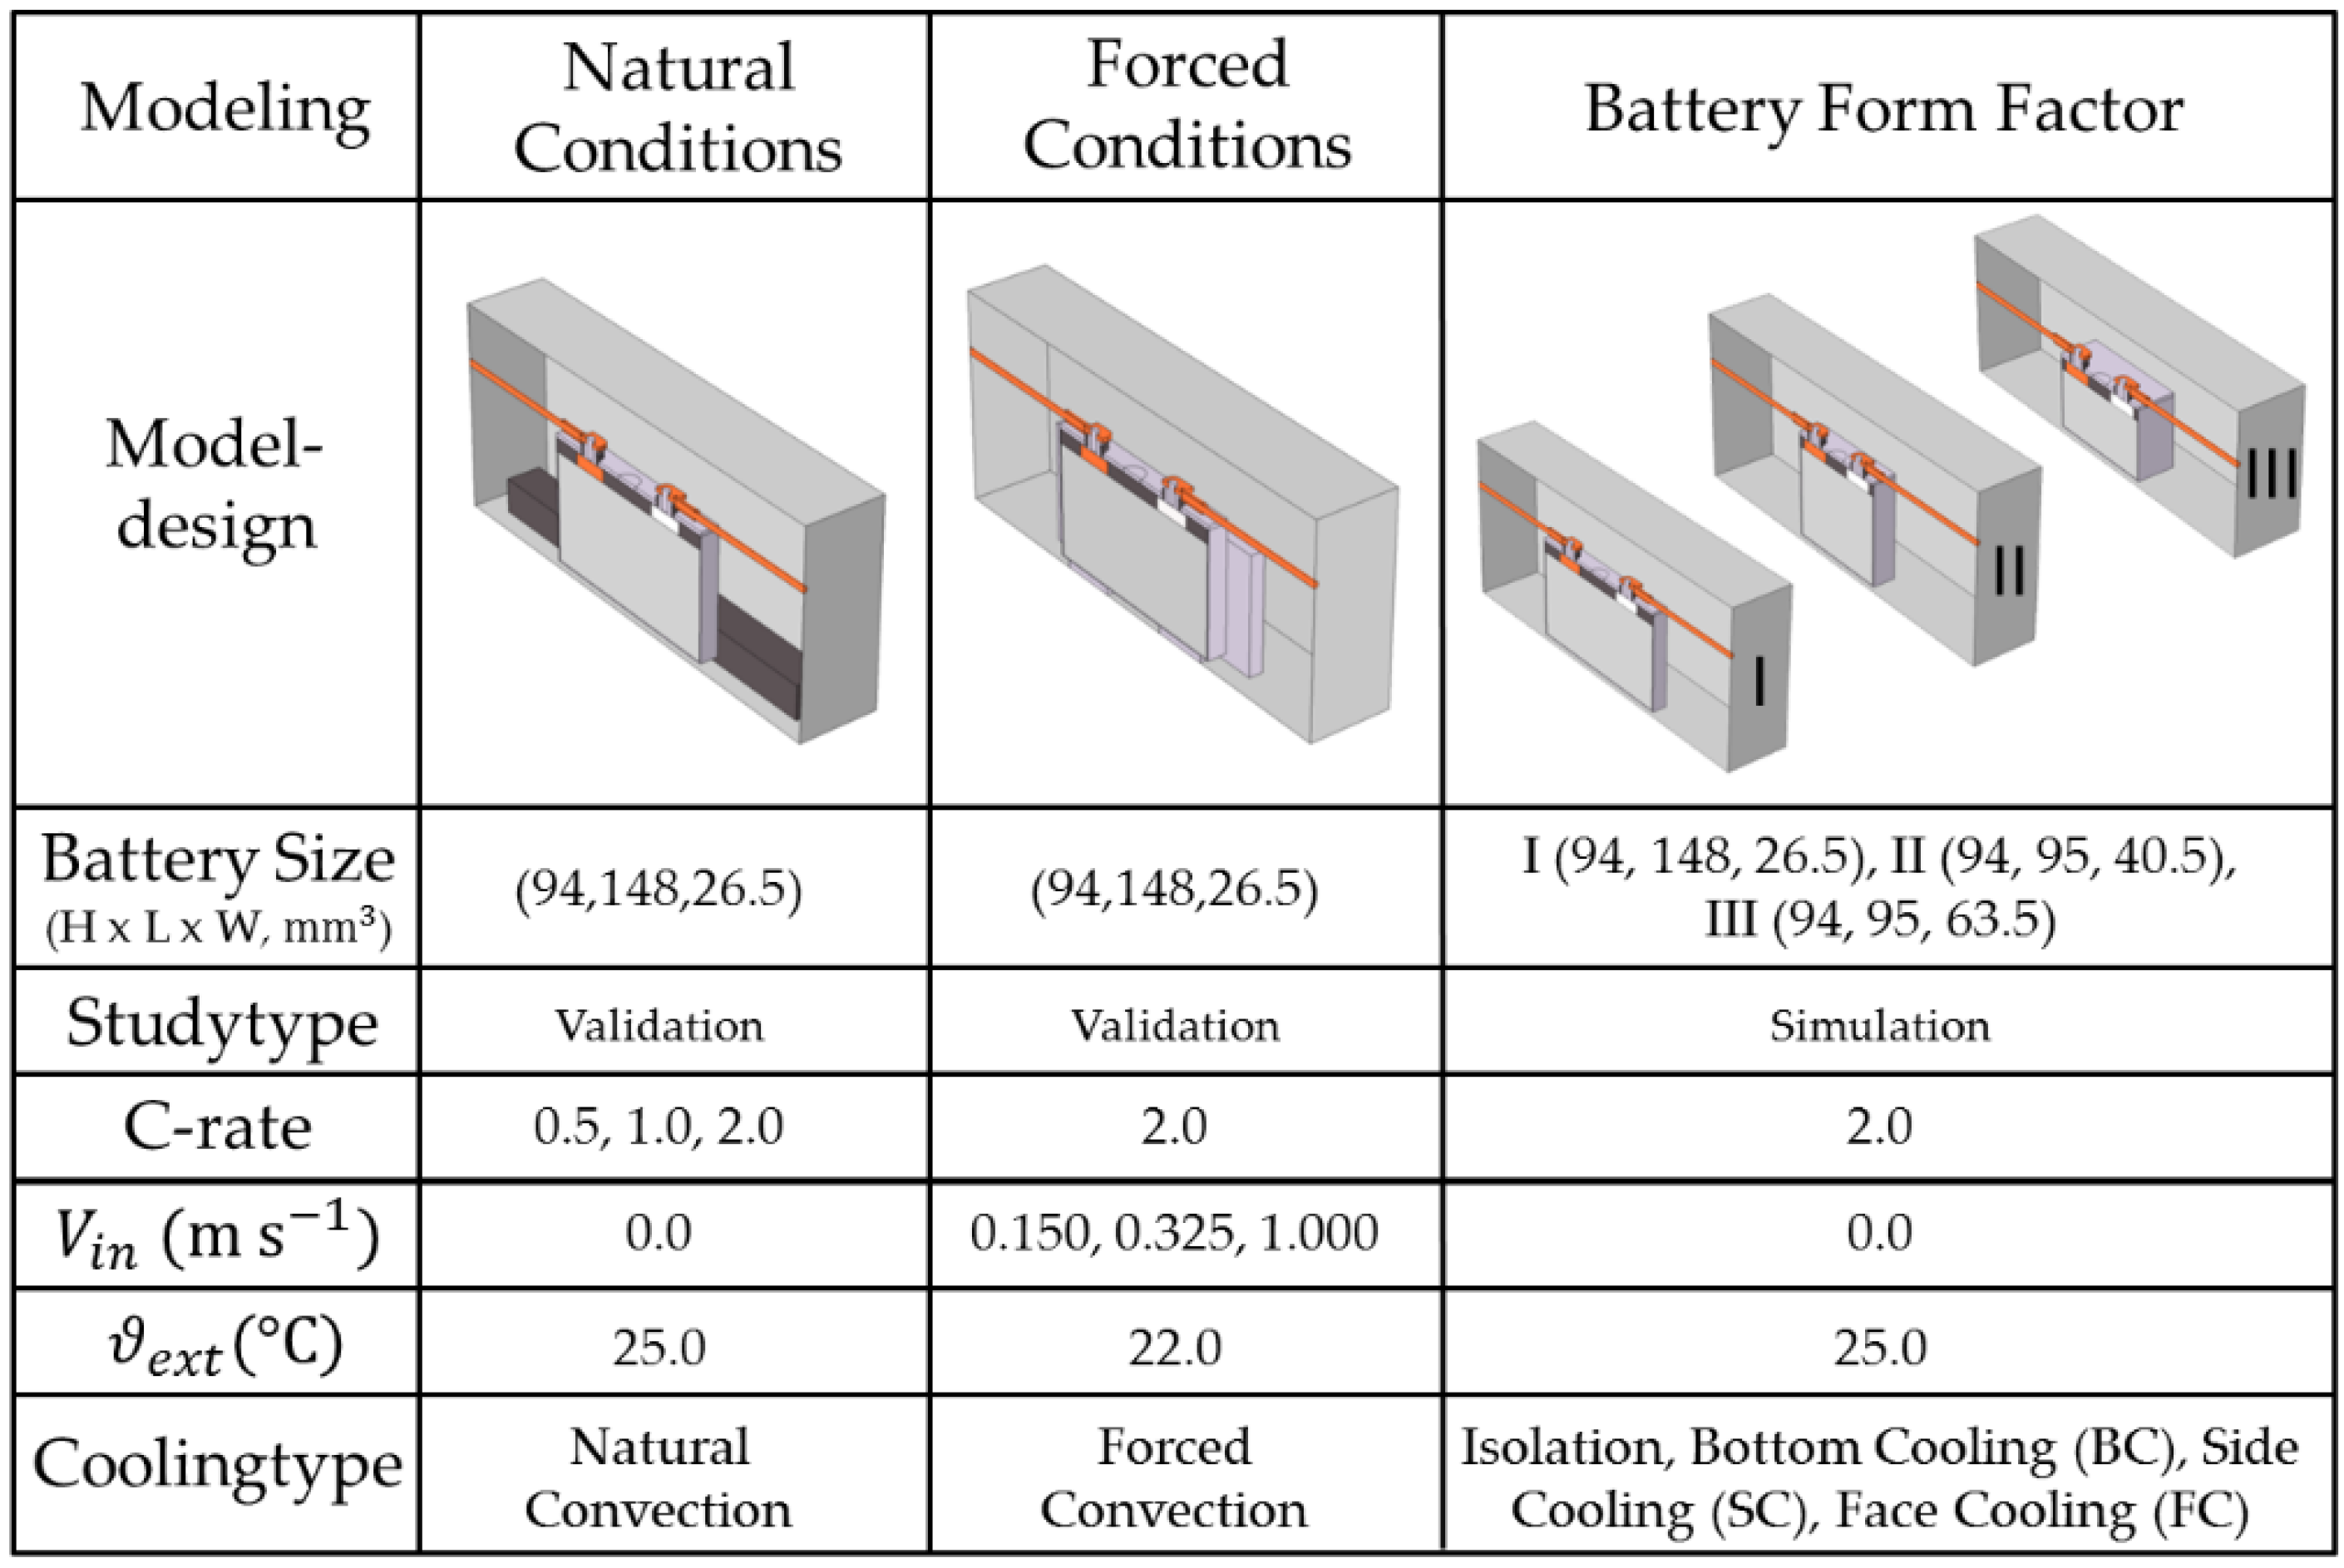
Figure 6.
Layout of the conductive cooling concept variations bottom cooling (BC), small side cooling (SC) and large face cooling (FC).
Figure 6.
Layout of the conductive cooling concept variations bottom cooling (BC), small side cooling (SC) and large face cooling (FC).
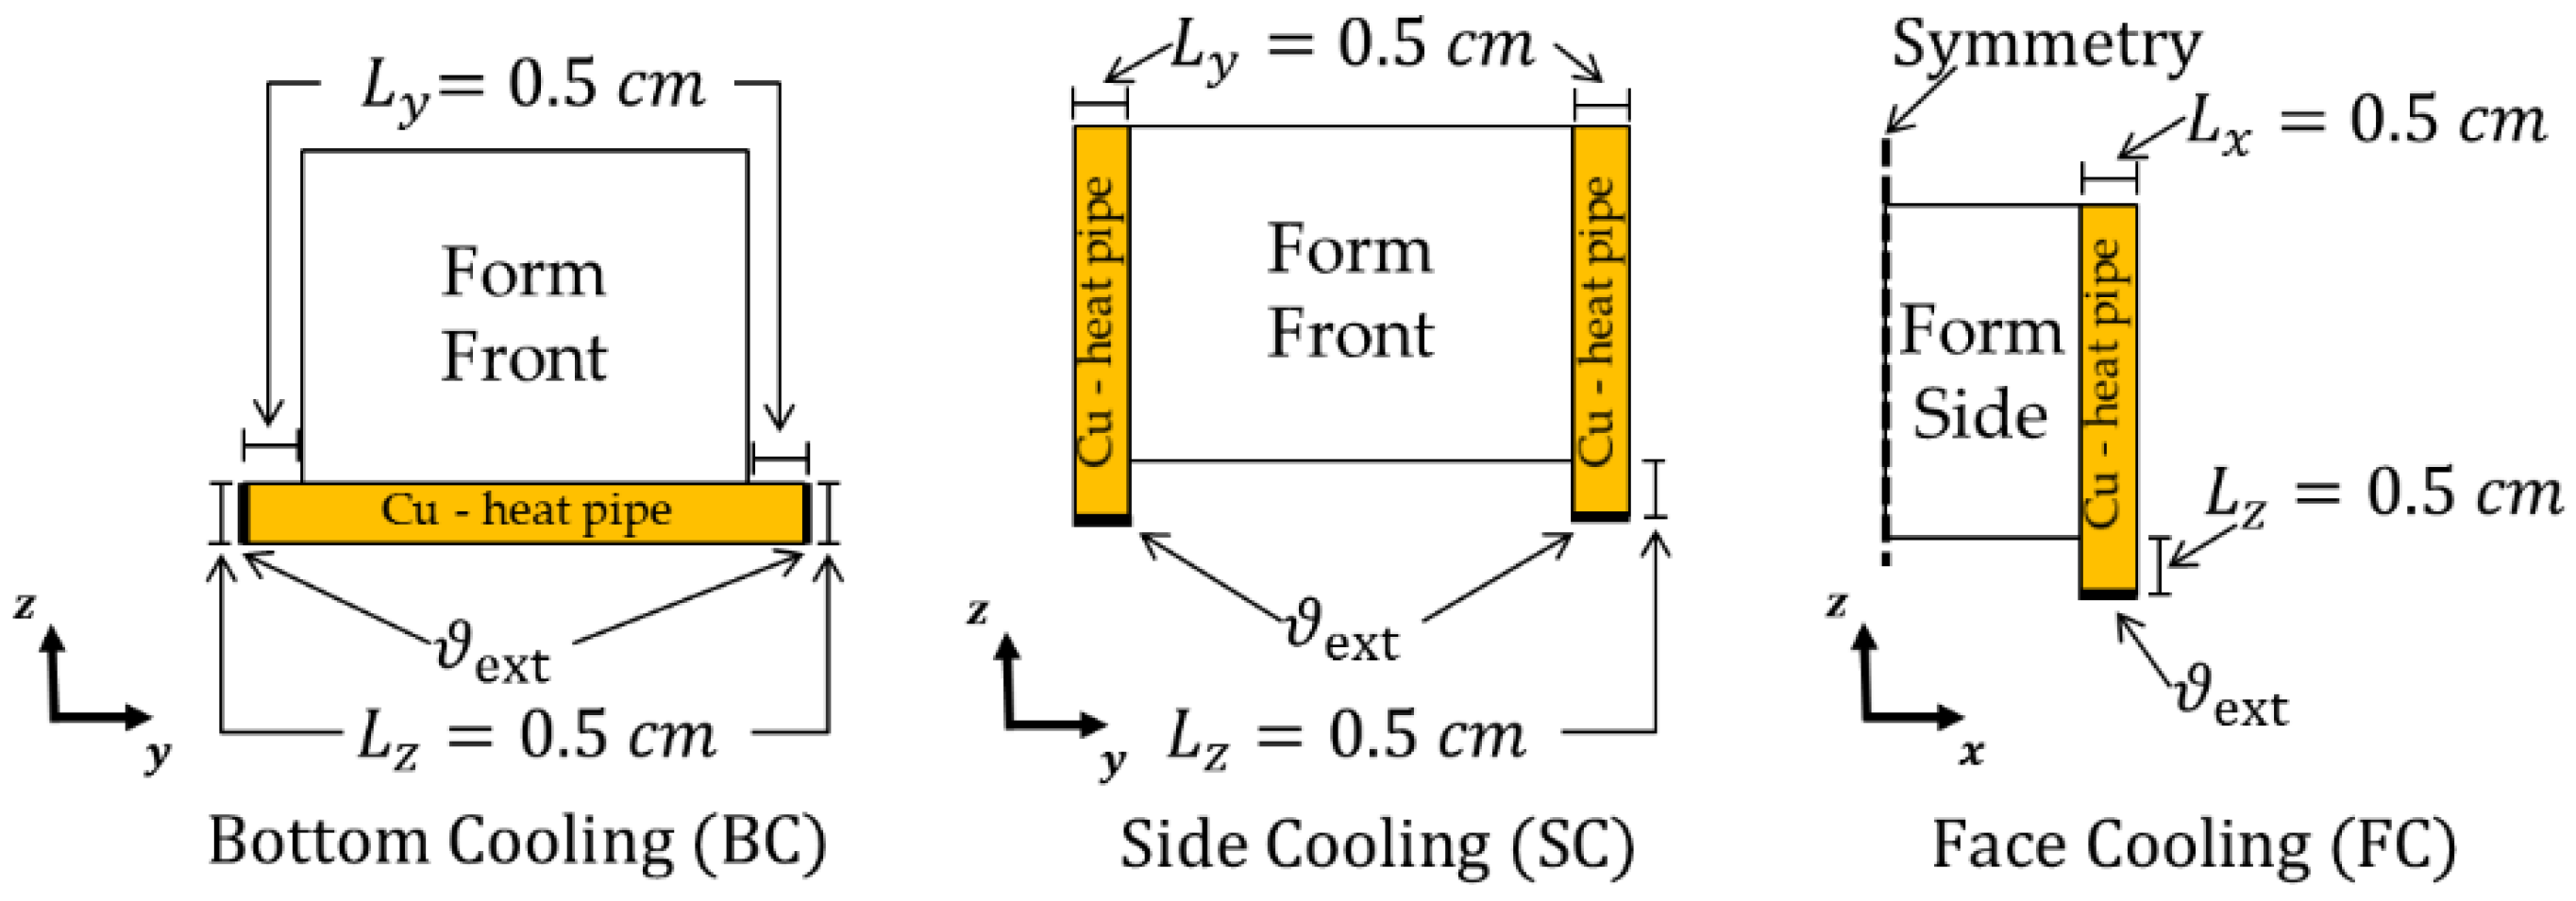
Figure 7.
The maximal mean experimental surface temperature , the average simulated surface temperature and the relative error during (a) charge and rest phases and (b) discharge and rest phases dependent on the current rates 0.5 C, 1.0 C and 2.0 C are shown as a function of time . The ends of the charge times are denoted by and the ends of discharge times are denoted by ; each associated with the corresponding current rate. The reader is referred to Figure 5 for a closer look on the test conditions.
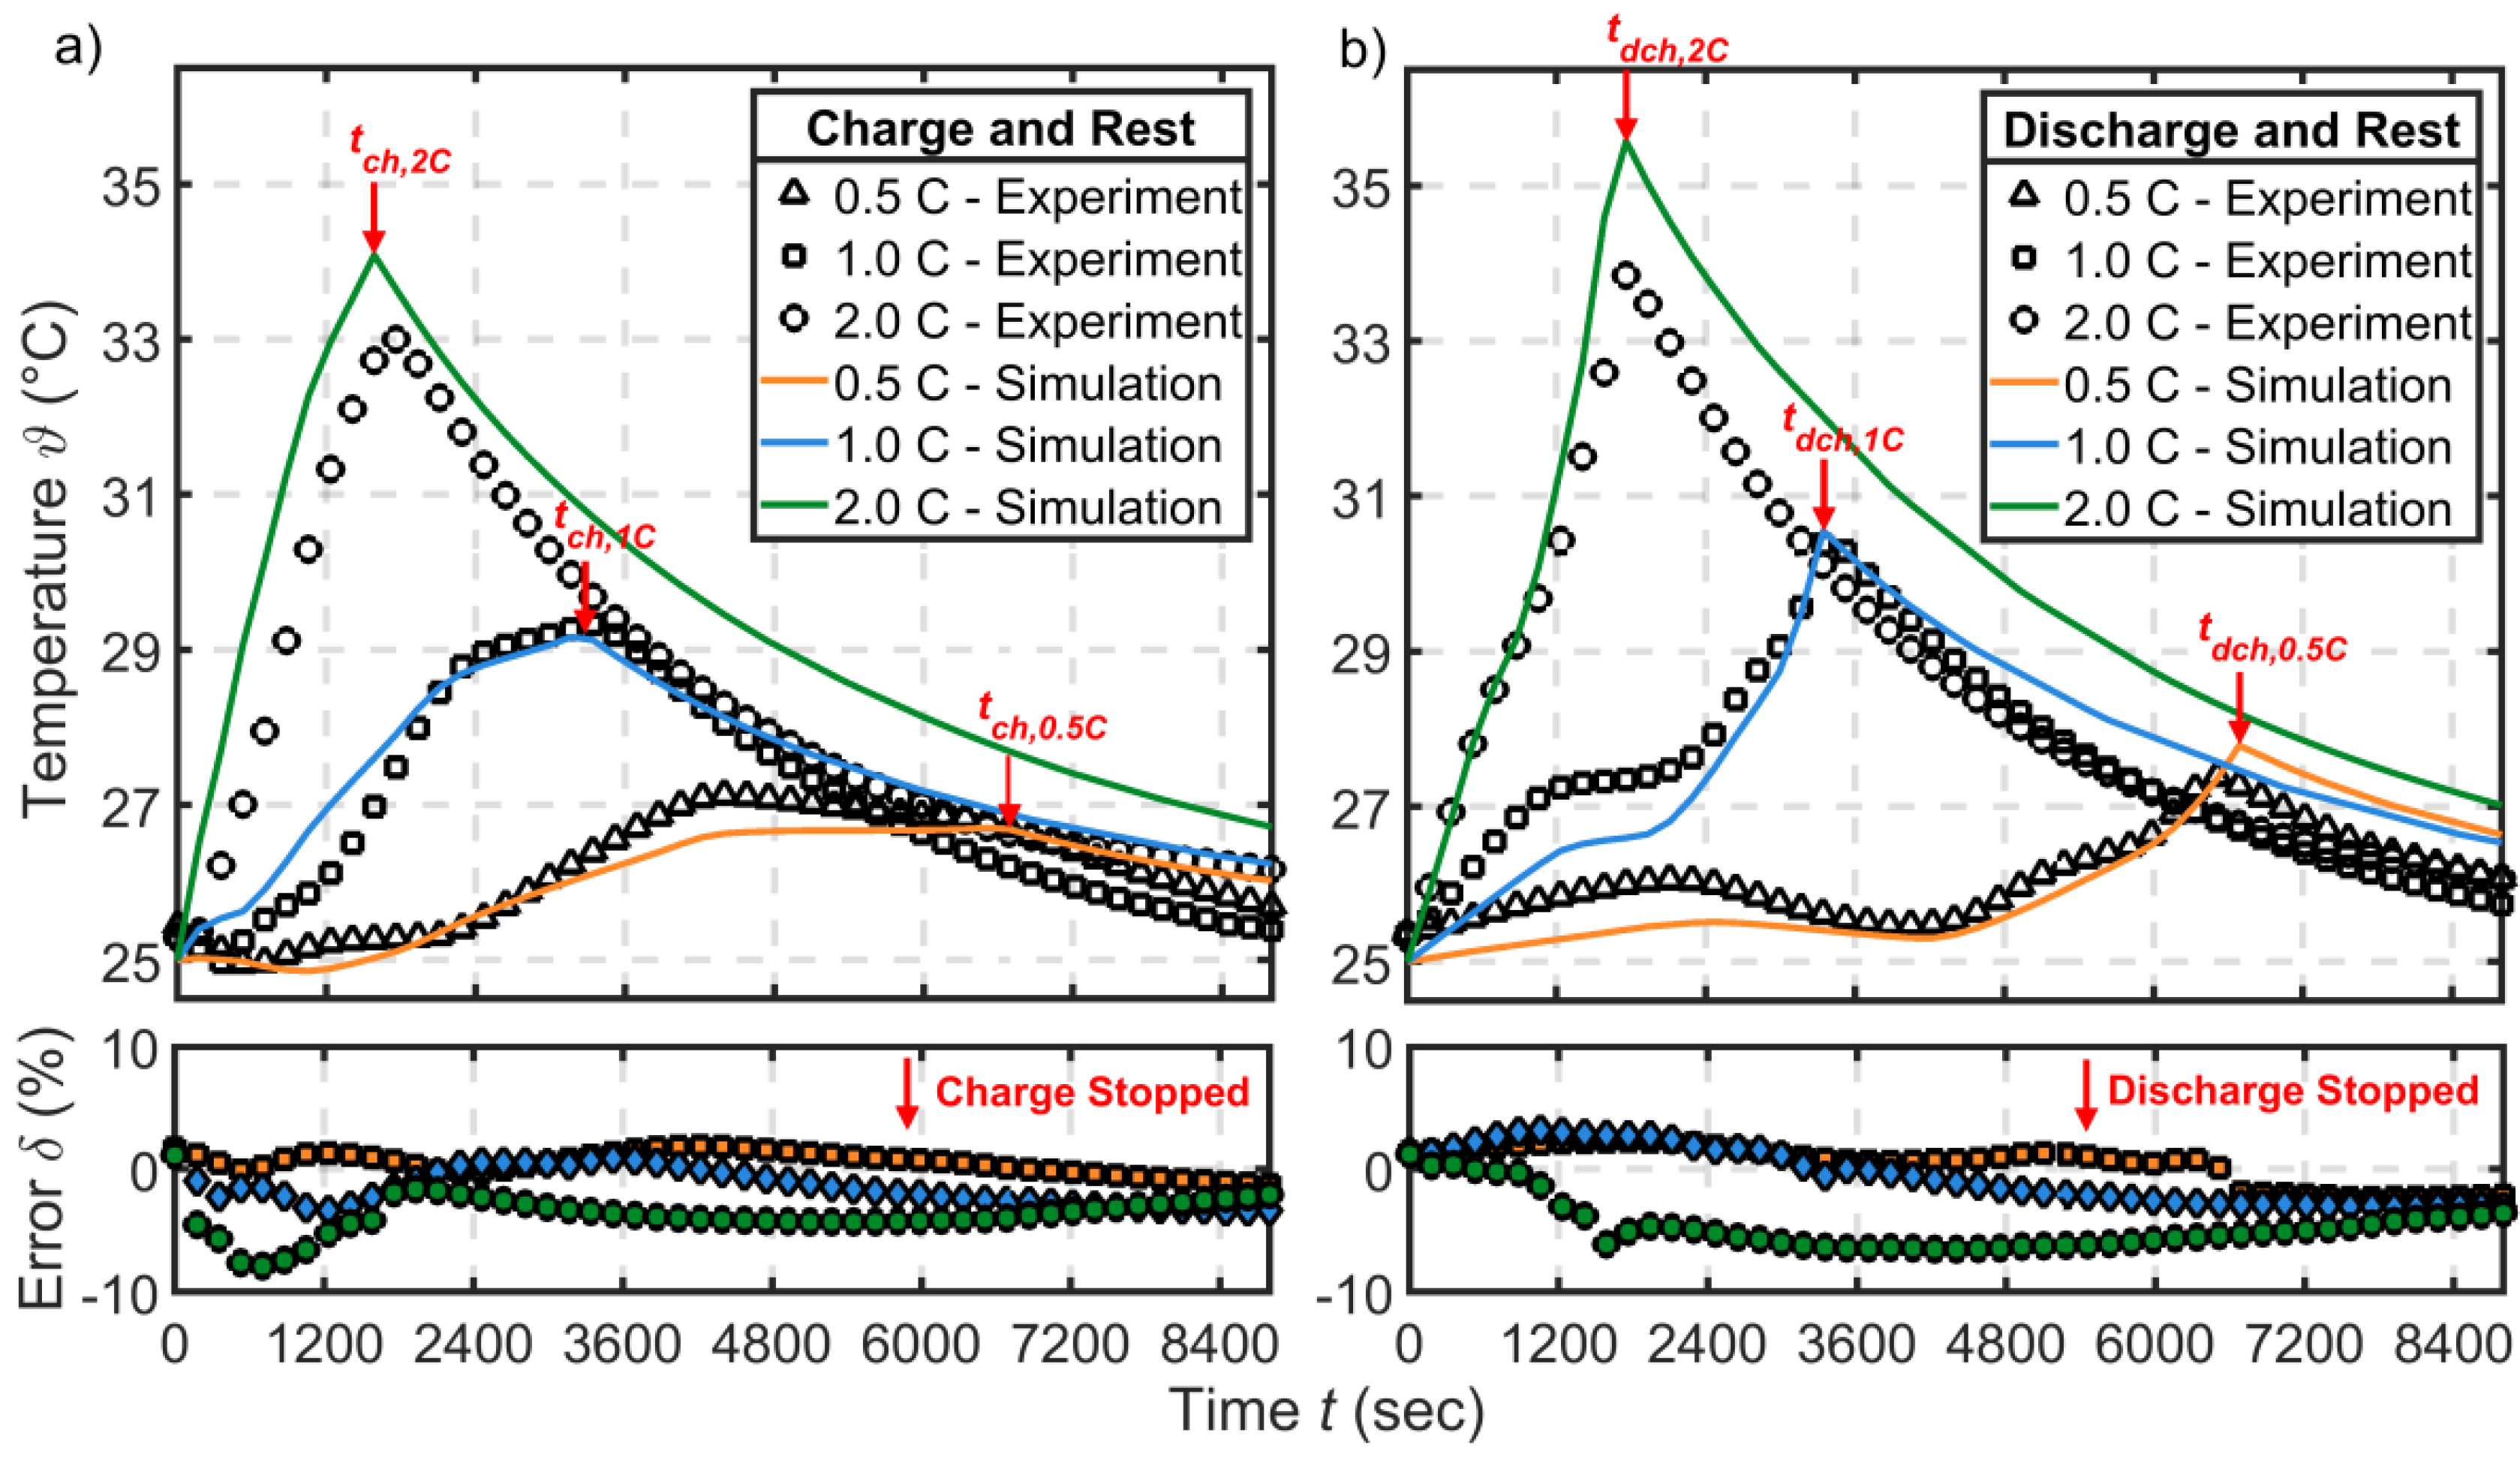
Figure 8.
Experimental temperature curves of three similar battery cells at different locations within the battery test setup, simulated temperature curves at three different fluid flow inlet magnitudes and the relative error between experimental and simulated results are shown as a function of time . The reader is referred to Figure 5 for a closer look on the test conditions.
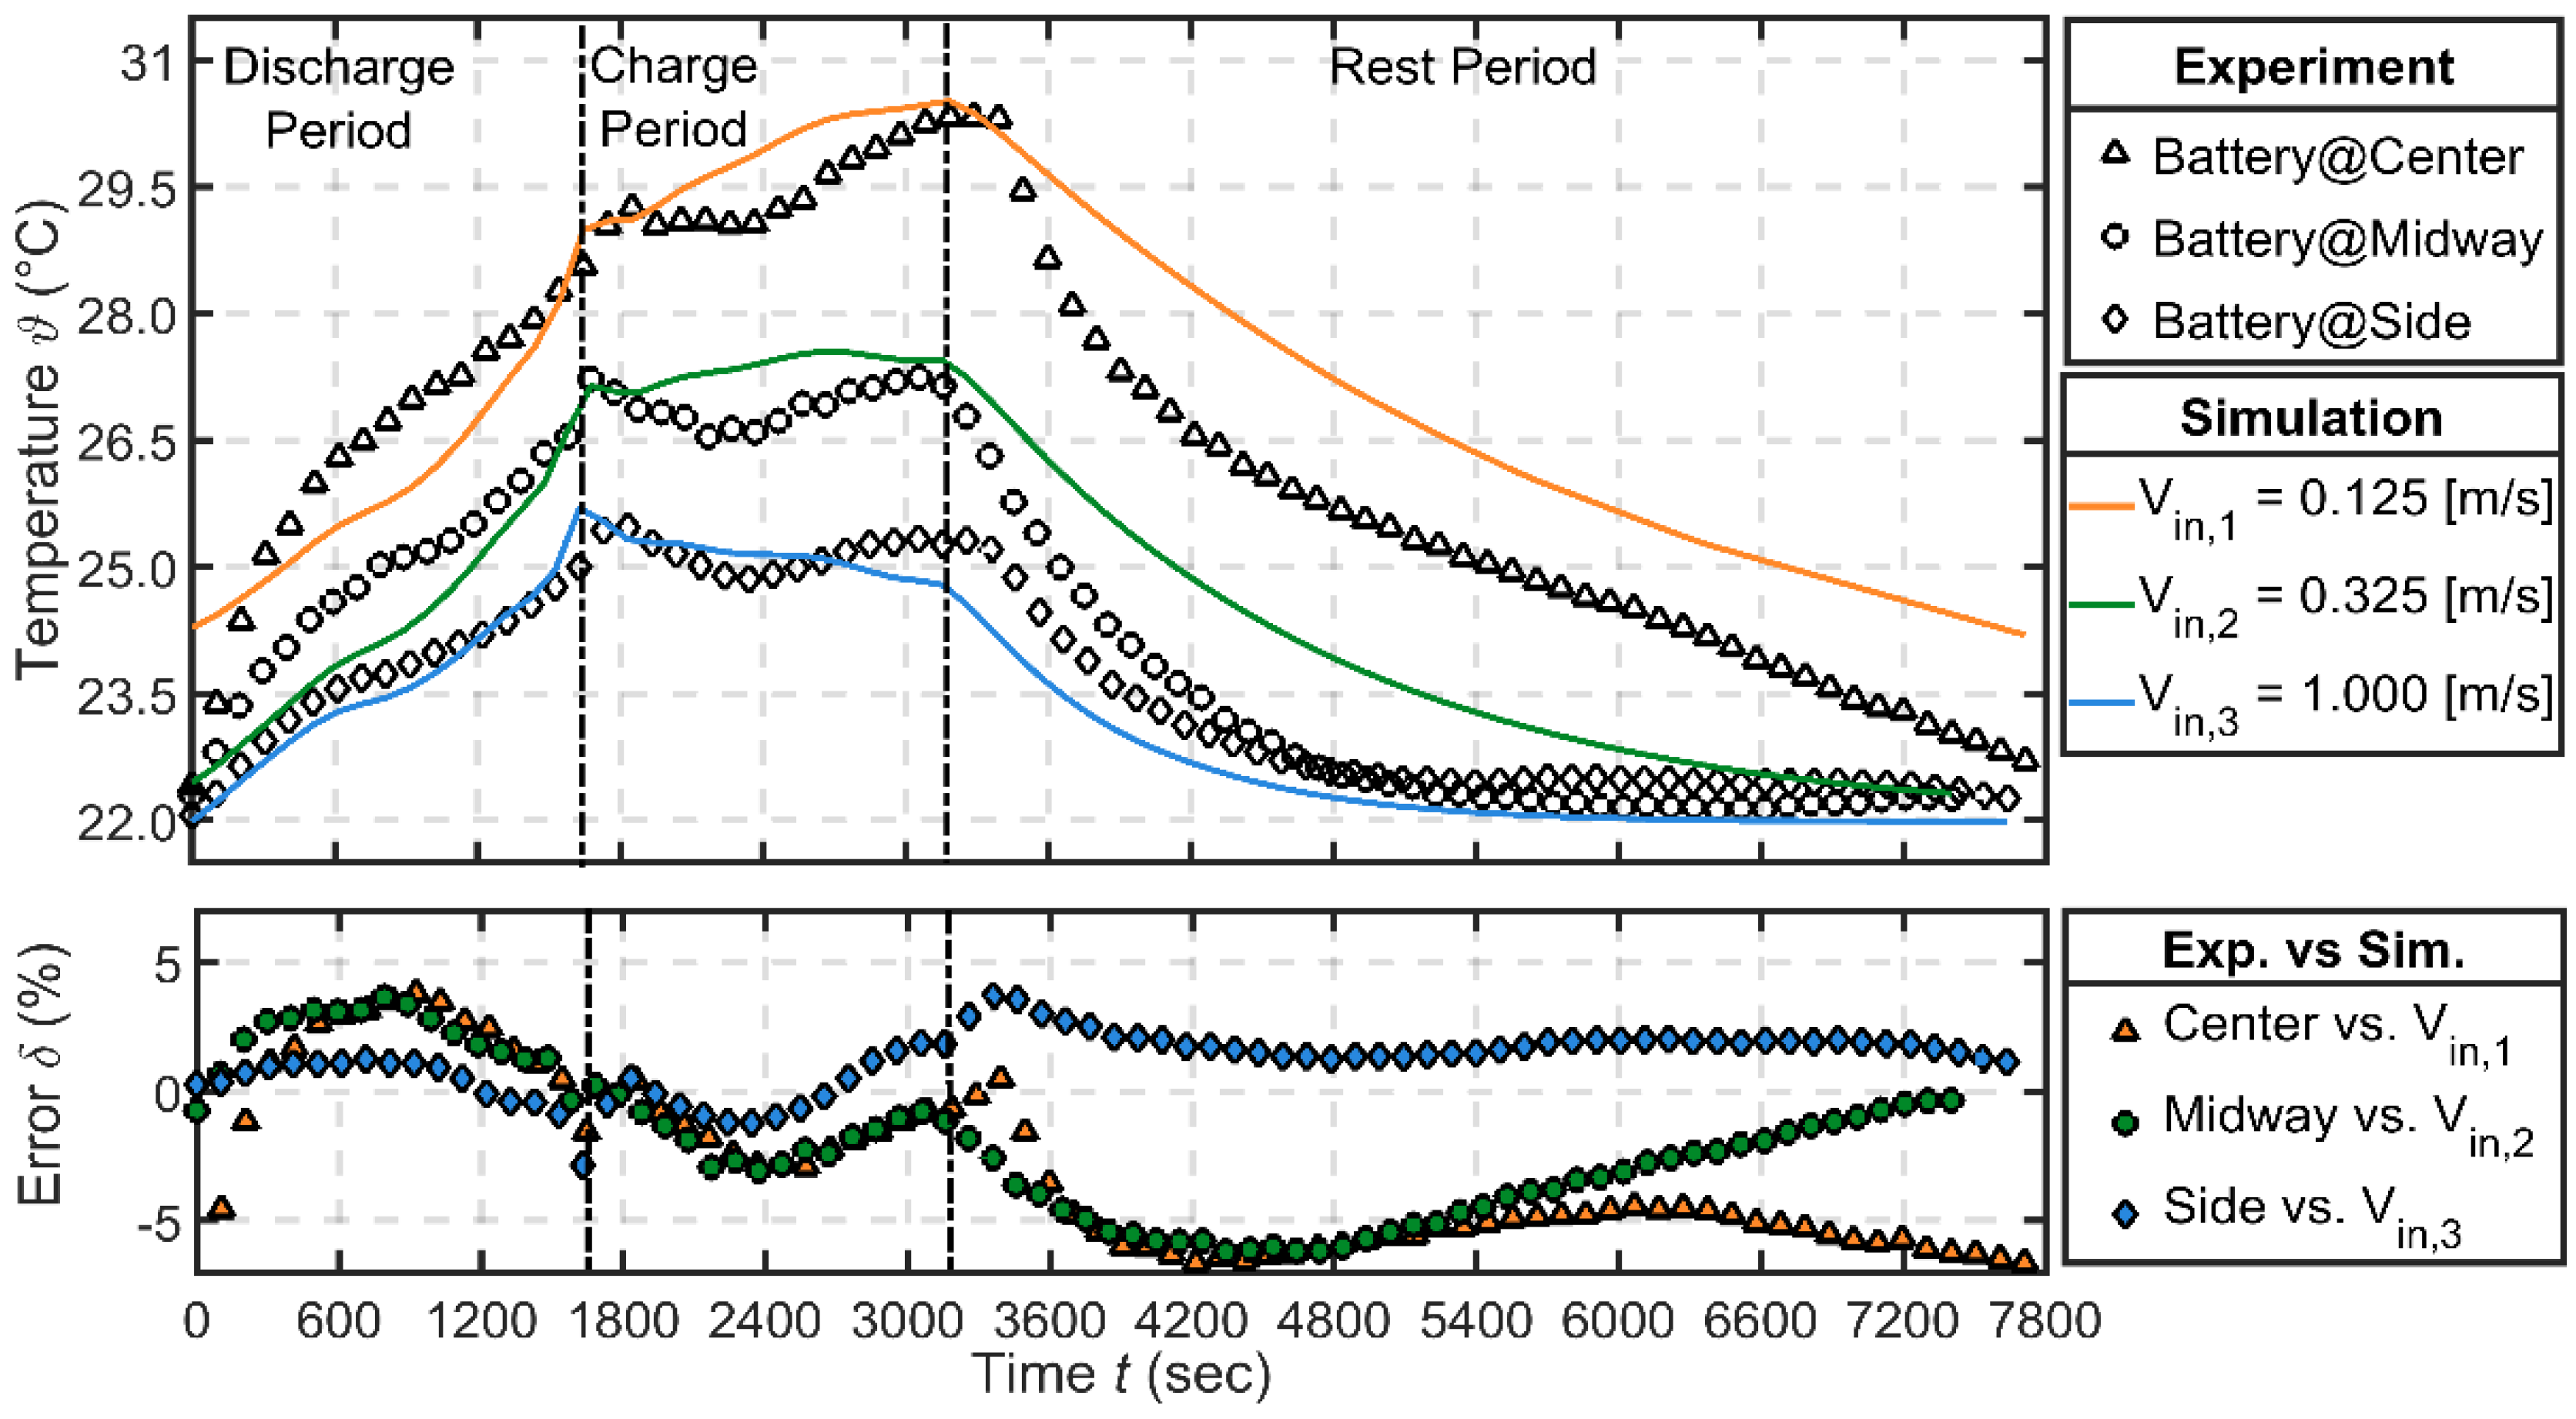
Figure 9.
(a) Simulated battery surface temperature distribution during the natural convection scenario and (b) simulated battery surface temperature distribution and velocity streamlines at an inlet velocity of , both shown at a current rate of at the end of discharge.
Figure 9.
(a) Simulated battery surface temperature distribution during the natural convection scenario and (b) simulated battery surface temperature distribution and velocity streamlines at an inlet velocity of , both shown at a current rate of at the end of discharge.
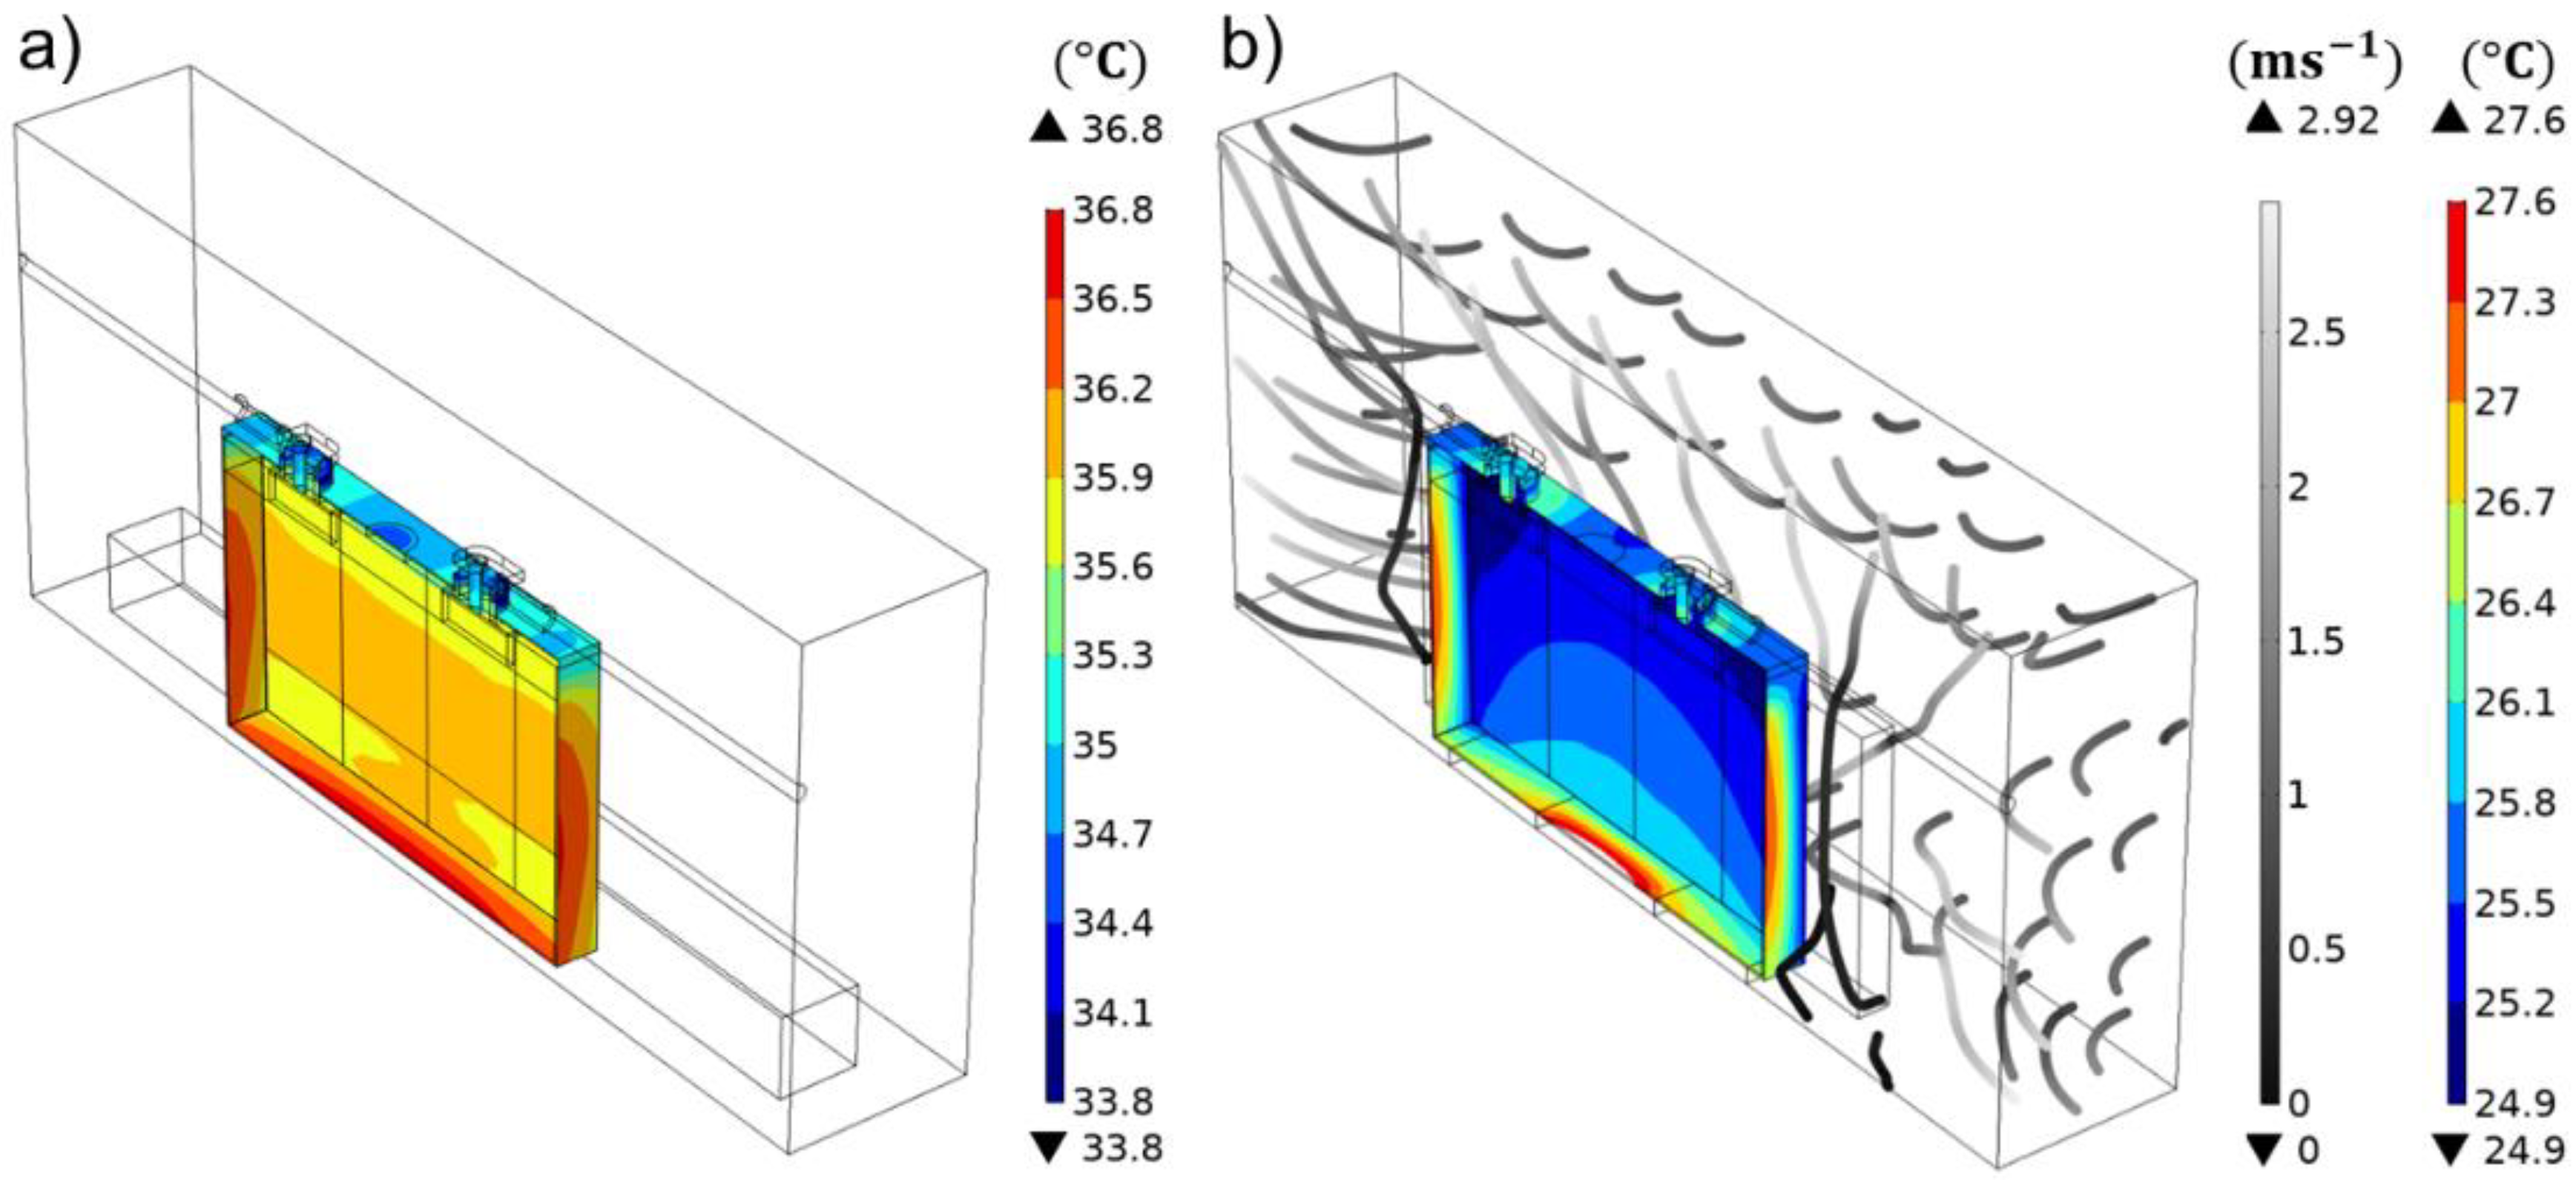
Figure 10.
Simulated maximal temperature rise in dependence of the cell design and the cooling types BC, SC and FC during a 2 C cycle and 1 hour rest time.
Figure 10.
Simulated maximal temperature rise in dependence of the cell design and the cooling types BC, SC and FC during a 2 C cycle and 1 hour rest time.
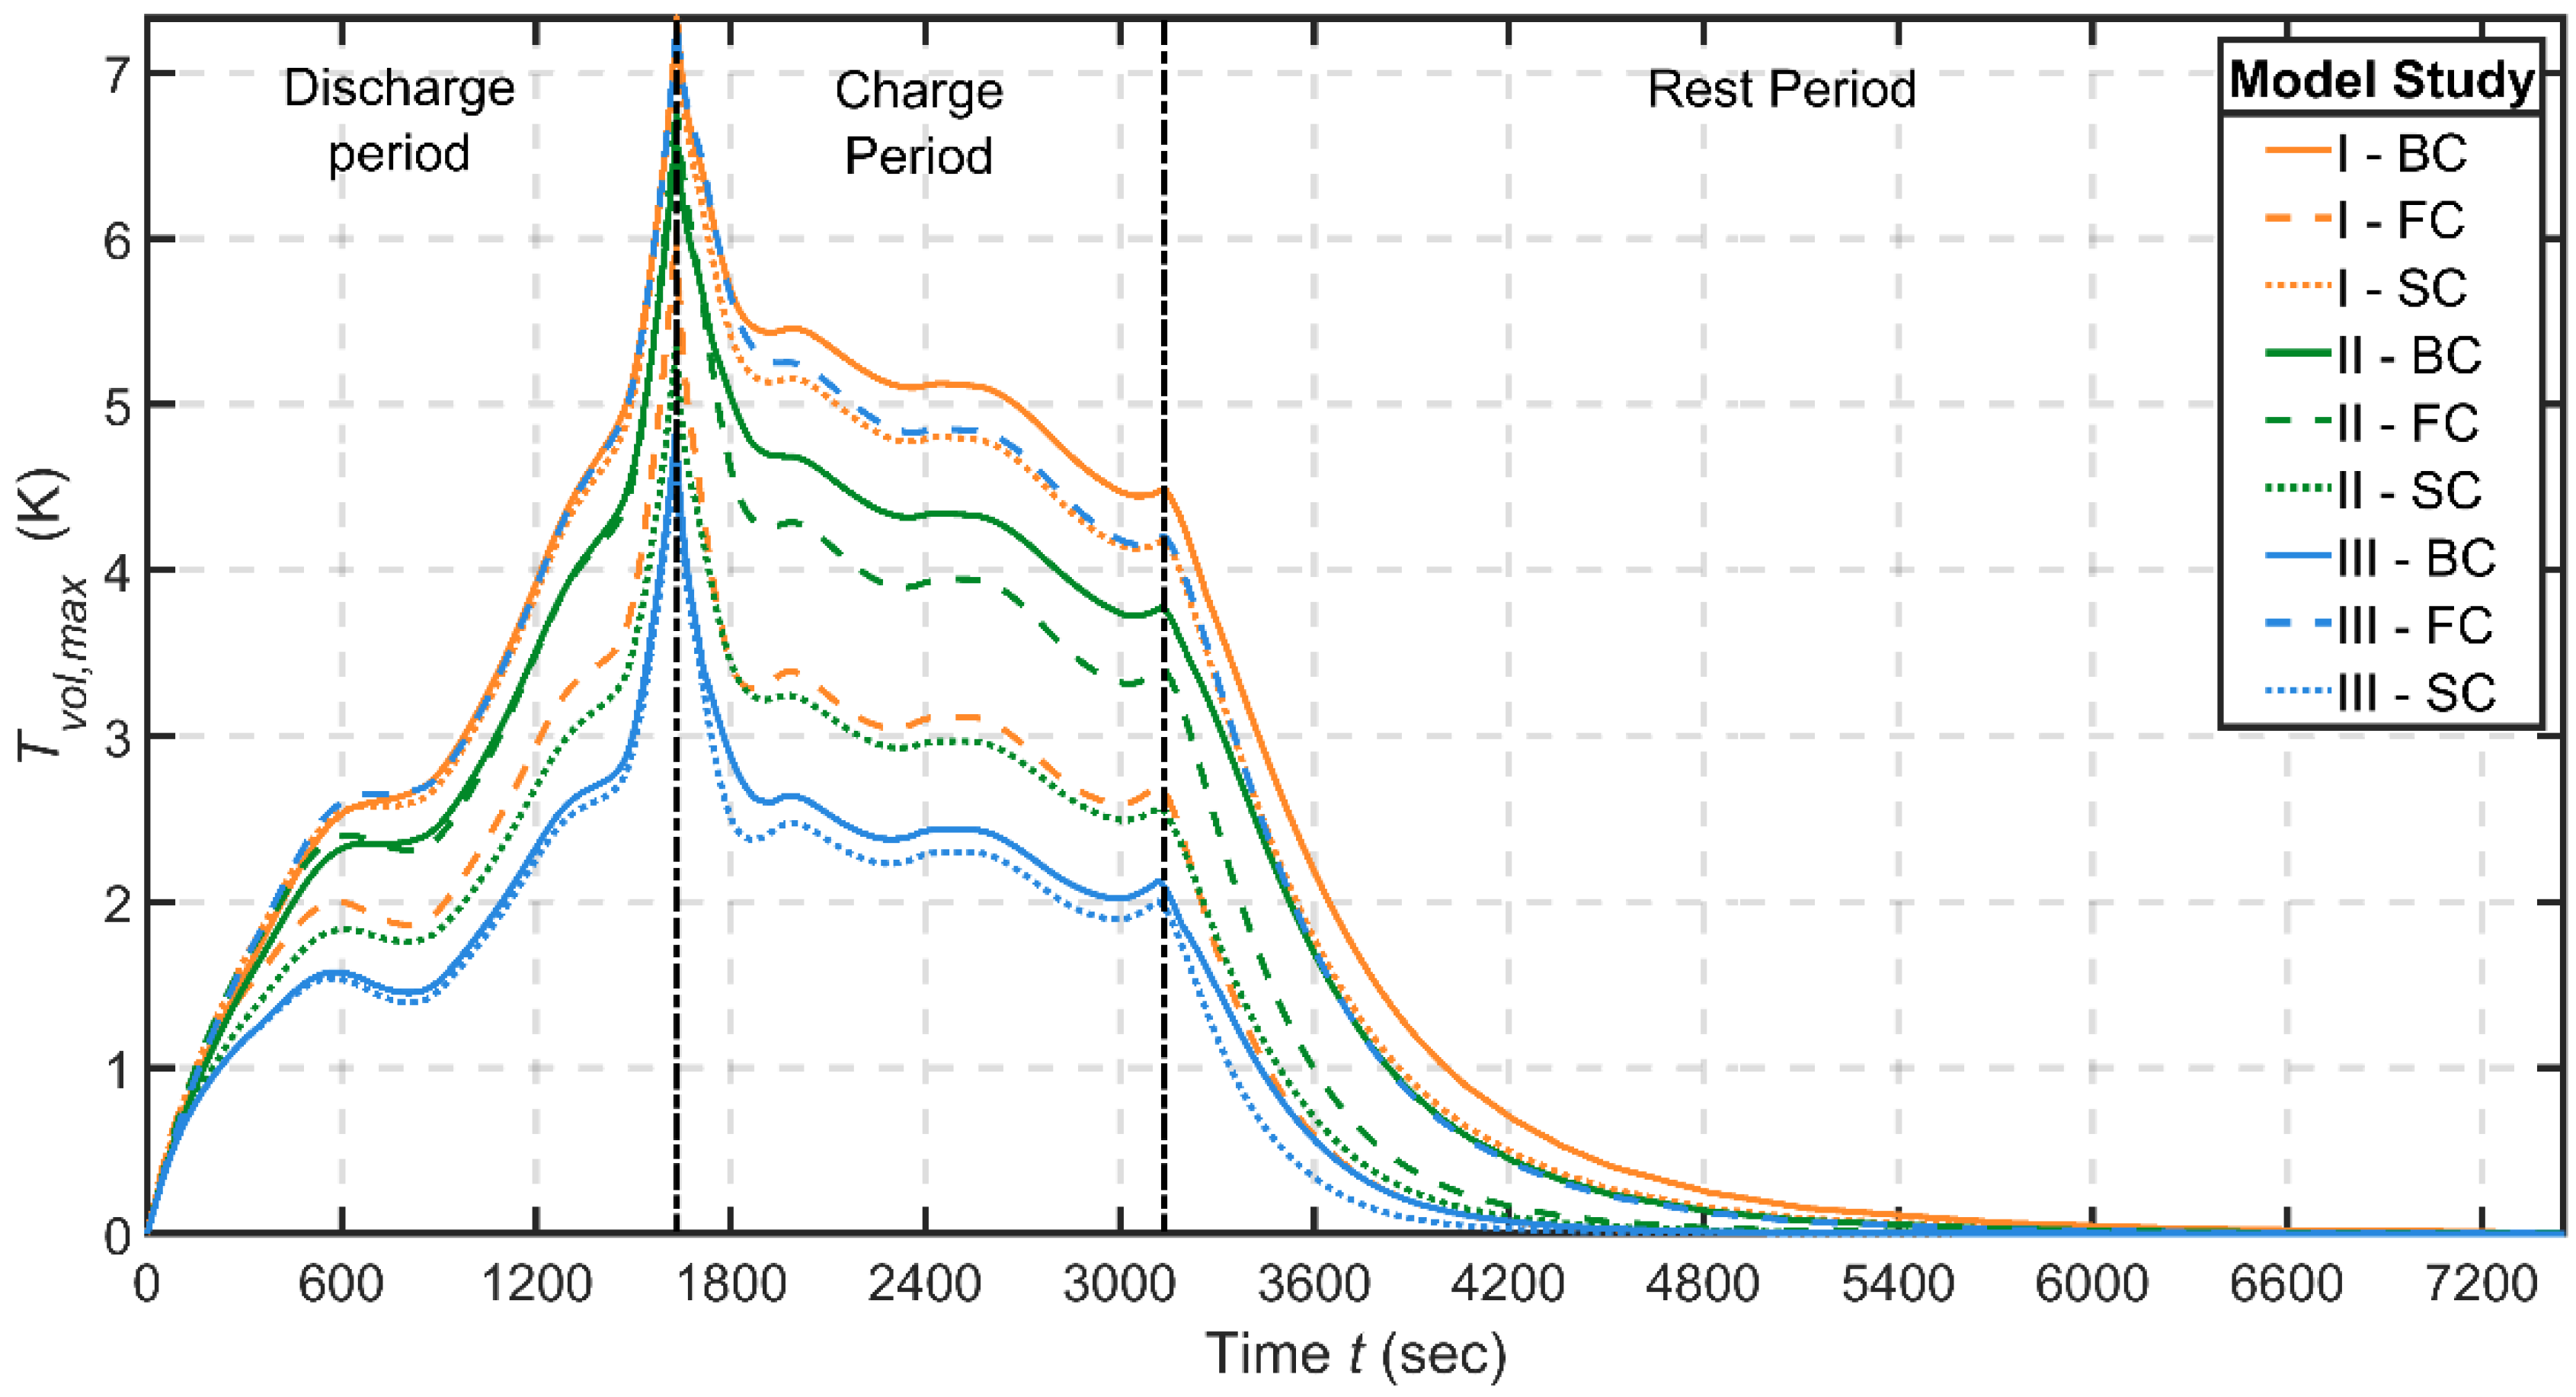
Table 1.
The thermophysical properties of all components at the 25 °C reference temperature.
| Material/Meaning | |||||
|---|---|---|---|---|---|
| Electrode Stack | |||||
| Positive Electrode Coating | 29.29 | 4670 [56] | 940.00 | 0.150 | 0.66 |
| Negative Electrode Coating | 25.53 | 2260 [56] | 1040.00 | 0.615 | 1.45 |
| Separator | 12.90 | 1009.00 | 1907.00 | 0.352 | 0.68 |
| Aluminum [21] | 4.03 *1 | 2700.0. | 900.00 | 84.00 | 238 |
| 0.26 *2 | |||||
| Copper [21] | 5.37 *1 | 8700.00 | 385.00 | 111.00 | 400 |
| 0.26*2 | |||||
| Battery | |||||
| Electrode Stack | 77.12 | 2650.98 | 987.55 | 11.095 *3 | 29.50 *3 |
| 0.234 *4 | 0.62 *4 | ||||
| Steel [60] | 13.00 | 8030.00 | 502.48 | 4.03 | 16.27 |
| Synthetic [65] (Acrylic Plastic) | 9.36 | 1190.00 | 1470.00 | 0.10 | 0.18 |
| Environment | |||||
| Air [68,69,70] | - | 1.184 | 1007 | 21.14 | 0.026 |
*1: Current Collector; *2: Terminal Contact; *3: (in-plane); *4: (through-plane).
Table 2.
Rating criteria and associated thresholds for the model study comparison.*1
| Significantly Better *2 | Better | Reference | Worse | Significantly Worse *3 |
|---|---|---|---|---|
*1: The color code indicates improvement in green types and worsening in red types versus the reference case in yellow. The meanings coincide with the column headings; *2: 0.75 times reference; *3: 1.25 times reference.
Table 3.
Quantities of interest of the model studies.
| Study Type | Model Parameter | |||||
|---|---|---|---|---|---|---|
| Natural Convection | 1.8 | 0.9 | 0.1 | 0.2 | >60:00 | |
| 3.0 | 0.7 | 0.3 | 0.3 | >60:00 | ||
| 4.5 | 2.5 | 0.3 | 0.7 | >60:00 | ||
| 6.2 | 1.9 | 0.8 | 0.8 | >60:00 | ||
| 9.8 | 5.4 | 0.8 | 2.2 | >60:00 | ||
| 12.2 | 4.4 | 1.7 | 2.0 | >60:00 | ||
| Forced Convection | 10.0 | 6.3 | 3.4 | 4.7 | >60:00 | |
| 8.3 | 4.2 | 3.7 | 5.9 | >60:00 | ||
| 7.2 | 2.9 | 4.2 | 7.2 | 26:44 | ||
| Conduction– Face – | 6.1 | 1.8 | 5.4 | 8.8 | 16:20 | |
| 6.8 | 2.4 | 6.1 | 10.7 | 21:00 | ||
| 7.3 | 3.0 | 6.6 | 12.6 | 30:20 | ||
| Conduction– Side – | 7.3 | 3.1 | 6.4 | 11.9 | 31:17 | |
| 5.4 | 2.1 | 4.4 | 7.8 | 18:12 | ||
| 4.7 | 1.6 | 3.8 | 6.1 | 12:45 | ||
| Conduction– Bottom – | 7.3 | 3.1 | 6.4 | 12.4 | 39:09 | |
| 6.7 | 2.6 | 5.8 | 11.1 | 31:09 | ||
| 4.8 | 1.7 | 3.9 | 6.6 | 16:29 | ||
| Isolation | 14.7 | 5.7 | 1.5 | 1.7 | / | |
| 15.0 | 5.8 | 1.6 | 1.9 | / | ||
| 14.4 | 5.5 | 1.4 | 1.7 | / |
© 2020 by the authors. Licensee MDPI, Basel, Switzerland. This article is an open access article distributed under the terms and conditions of the Creative Commons Attribution (CC BY) license (http://creativecommons.org/licenses/by/4.0/).
Share and Cite
MDPI and ACS Style
Liebig, G.; Kirstein, U.; Geißendörfer, S.; Zahid, O.; Schuldt, F.; Agert, C. The Impact of Environmental Factors on the Thermal Characteristic of a Lithium–ion Battery. Batteries 2020, 6, 3. https://doi.org/10.3390/batteries6010003
AMA Style
Liebig G, Kirstein U, Geißendörfer S, Zahid O, Schuldt F, Agert C. The Impact of Environmental Factors on the Thermal Characteristic of a Lithium–ion Battery. Batteries. 2020; 6(1):3. https://doi.org/10.3390/batteries6010003
Chicago/Turabian StyleLiebig, Gerd, Ulf Kirstein, Stefan Geißendörfer, Omio Zahid, Frank Schuldt, and Carsten Agert. 2020. "The Impact of Environmental Factors on the Thermal Characteristic of a Lithium–ion Battery" Batteries 6, no. 1: 3. https://doi.org/10.3390/batteries6010003
Note that from the first issue of 2016, this journal uses article numbers instead of page numbers. See further details here.