State-of-Charge Monitoring and Battery Diagnosis of NiCd Cells Using Impedance Spectroscopy


1
Electrochemistry Laboratory, University of Applied Sciences (OTH), Kaiser-Wilhelm-Ring 23, 92224 Amberg, Germany
2
Diehl Aerospace GmbH, Donaustraße 120, 90451 Nürnberg, Germany
*
Author to whom correspondence should be addressed.
Batteries 2020, 6(1), 4; https://doi.org/10.3390/batteries6010004
Submission received: 14 December 2019
/
Revised: 6 January 2020
/
Accepted: 6 January 2020
/
Published: 9 January 2020
(This article belongs to the Special Issue Batteries and Supercapacitors Aging)
Abstract
:With respect to aeronautical applications, the state-of-charge (SOC) and state-of-health (SOH) of rechargeable nickel–cadmium batteries was investigated with the help of the frequency-dependent reactance Im Z(ω) and the pseudo-capacitance C(ω) in the frequency range between 1 kHz and 0.1 Hz. The method of SOC monitoring using impedance spectroscopy is evaluated with the example of 1.5-year long-term measurements of commercial devices. A linear correlation between voltage and capacitance is observed as long as overcharge and deep discharge are avoided. Pseudo-charge Q(ω) = C(ω)⋅U at 1 Hz with respect to the rated capacity is proposed as a reliable SOH indicator for rapid measurements. The benefit of different evaluation methods and diagram types for impedance data is outlined.
1. Introduction
Emergency power supplies in aircrafts require high reliability. After parking for a longer period of time without electric supply, the state-of-charge (SOC) of airplane batteries drops by self-discharge. Scheduled take-offs may be delayed by this. According to the state-of-the-art, the complete procedure of capacity determination lasts several hours. As a costly precaution, freshly charged batteries must be held in stock. With respect to more extended maintenance intervals, a reliable method for fast battery diagnosis is required, which reflects at least the upper SOC range.
Based on preliminary work on SOC determination by impedance spectroscopy [1,2,3,4,5,6,7], we studied new and aged batteries. Since the frequency response depends on the cell chemistry, we focused on nickel–cadmium batteries [8,9,10] in this work. In the following, the significance of the imaginary part of impedance is evaluated with respect to aging time and state-of-charge.
1.1. State-of-Charge Indicators
Rated capacity [11] denotes the electric charge QN, which is stored by a new battery conditions. The actually available capacity Q(t), however, is lower by the already consumed charge Q1, and the capacity loss QL in the course of aging during the time t. Moreover, the capacity Q0 of the fully charged battery depends on temperature and previous charge–discharge cycles at given C-rates.
α, the state-of-charge (SOC) [12], describes the ratio between the actually momentary available capacity Q(t) and maximum total available capacity Q0 at the previous full charge. α = 1 (100% SOC) represents the full charge, and α = 0 (0% SOC) is an empty battery. For SOC determination [13,14], voltage measurements were general practice since the 1930s. Since the mid-1970s, impedance spectroscopy [15], coulomb counting [16], bookkeeping methods [17,18], and look-up tables [19] came along, which were complemented by fuzzy logic, Kalman filters, learning algorithms and predictive methods [14], and the analysis of relaxation times [20] over the past decades. The C-rate is defined by the current–capacity ratio. The indication 1C says that the battery was fully charged or discharged within one hour. 5C requires 0.2 h (12 min).
The state-of-health (SOH) [12] considers the actually available residual capacity in aged batteries Q0 with regard to the nominal rated capacity QN of the new battery.
1.2. Aging Phenomena
Aging starts immediately after the battery has left the fabrication facilities. The degradation rate depends on cycling stress, temperature, charging method, overcharge, and deep-discharge. Some aging phenomena are reversible, but most are irreversible. Calendar aging during storage with time happens in the battery at rest at any temperature and state-of-charge, independently of the power load. Cyclic aging depends on current (C-rate), temperature, depth-of-discharge, power demand, and the load profile. Repeated charge–discharge events at 0%–20% SOC and 80%–100% SOC are more harmful to the battery than continuous operation at medium SOC levels.
The memory effect [21] or lazy battery effect is a special type of aging phenomenon with rechargeable nickel–cadmium (NiCd) chemistry that causes the battery to hold less charge (Figure 1). The battery gradually loses its maximum energy capacity when it is repeatedly recharged after being only partially discharged [22]. The battery seems to remember the previous state of charge, and causes an undesired early voltage drop when charged again. Due to crystal formation at the anode, the stored energy becomes available only at a lower voltage than before. Unfortunately, the memory effect is exceedingly difficult to reproduce in model experiments. In modern NiCd batteries, the resulting loss of capacity is partly compensated by a discharge reserve. The memory effect can be repaired by a complete charge–discharge cycle, which recovers the original capacity (except for calendar and cycle aging).
The voltage cutout is a widely used to prevent overcharge. The NiCd battery is continuously charged until the voltage drops by 0.01–0.02 V per cell although energy is supplied (Figure 1b).
1.3. Impedance Spectroscopy
The observed ac resistance of every electrochemical cell is caused by the electrolyte resistance and the kinetic inhibitions of the electrode processes, which act like non-ideal resistors and capacitances. With electrochemical impedance spectroscopy (EIS) [23], a periodically changing voltage (at constant cell voltage) or current excitation signal (at constant discharge current), respectively, is applied to the battery. The resulting phase shift ϕ between input signal and cell response is recorded frequency by frequency. The amplitude of the usually sinusoidal input signal must be small, so that the steady-state condition of the cell is not disturbed.
Commercial frequency response analyzers (FRA) deliver the frequency-dependent complex impedance Z(jω) or admittance Y(jω) in various mathematical formats, with respect to angular frequency ω = 2π f, resistance R = Re Z (real part of impedance), reactance X = Im Z (imaginary part of impedance), modulus Z = |Z|, and phase shift ϕ = ϕU − ϕI between ac voltage and ac current.
Figure 2 illustrates these quantities in the complex plane and frequency domain.
1.4. Capacitance and Time Constant
We added the pseudo-capacitance C(ω) [1,24,25] to the above list, as a unique measure for the activity of the electrode/electrolyte interface, and as a qualitative indicator for the state-of-charge of the battery. The frequency response of the real part of complex capacitance C = Y/(jω) is given by Equation (4).
At high frequencies (ω → ∞), pseudo-capacitance tends to the geometric double-layer capacitance CD of the electrode/electrolyte interface. The ohmic resistance of the electrolyte solution, Re = Re Z(ω → ∞), is found as the intersection of the complex plane plot with the real axis.
The diagram of frequency-dependent capacitance C(ω) versus resistance R is useful for the direct comparison of battery capacities (see Section 3.5). The approximation in Equation (5) holds only for high frequencies, when the polarization resistance of the battery is negligible.
We think that the classification of aging phenomena is simplified by the apparent time constant of the charge-transfer reaction [26]. As a useful quantity for the comparison of new (at time t = 0) and aged batteries at any time t, we will consider below the relative growth of electrolyte resistance (at a given high frequency, e.g., 1 kHz) and the loss of capacitance (at a low frequency, e.g., 0.1 Hz).
2. Experimental Setup
In the course of a long time, with tests under real conditions as in an airplane, six NiCd battery packs were kept at a state-of-charge of 100% by trickle charge in order to balance self-discharge. With cycling, the packs were charged and discharged at a rate of C/2 between 100% SOC (7.5 V) to 80% SOC (6.0 V), separated by a rest period of 15 min, as shown in Figure 3 and Table 1. The ambient temperature was 50 °C during aging. Impedance spectra were measured at 25 °C after every 400 cycles, because (i) this temperature change is close to the practical application in the airplane, and (ii) helps to standardize the temperature-dependence of impedance, which affects the electrolyte resistance and the polarization resistance and the electrochemical reactions in a different way.
With respect to the investigation of the memory effect, three types of experiments were defined:
- Successive discharge. Pack #1 (fabricated in 2017) was cycled between SOC = 100% and SOC = 0% with 1C rate. Pack #4 (2018) was cycled between SOC = 100% and SOC = 80% at 0.5C rate. After every 400 cycles, the batteries were fully charged and then successively discharged by 2% steps, each characterized by impedance spectroscopy, until SOC = 70% was reached. Capacity was measured at the end of the endurance test, so that no memory effect was eliminated.
- Rapid test. Pack #2 (2017) was cycled between SOC = 100% and SOC = 80% at 1C rate, and pack #5 of 2018 suffered at 0.5C. Every 400 cycles the batteries received (i) full charge, (ii) impedance measurement, (iii) discharge by 0.19 Ah, (iv) again impedance measurement, and (v) capacity measurement by ampere-hour counting. The memory effect was studied between successive tests.
- Extensive test. Pack #3 (2017) was cycled between SOC = 100% and SOC = 80% at 0.1C rate and pack #6 (of 2018) at 0.5C. The analysis combined the above methods: (i) full charge, (ii) successive discharge by 2% and impedance measurement, until SOC = 70% was reached, (iii) full charge, and (iv) capacity determination by ampere-hour counting. The loss of capacity was studied for a large number of charge–discharge cycles.
3. Results and Discussion
3.1. State-of-Charge Monitoring
The stored residual electric charge Q (capacity) of a battery is expected to correlate with the pseudo-capacitance according to the definition C = dQ/dU. The pseudo-capacitance, according to Equation (4), is coined by the reactance, therefore the imaginary part of impedance is expected to show the state-of-charge as well. Unfortunately, we found no linear relationship between state-of-charge and capacity (Figure 4). The reactance at 0.1 Hz drops linearly between 80% and 20% SOC, whereas the edges at high and low SOC do not obey the trend.
The absolute value of reactance Im Z(1 Hz) shows a maximum around 65% SOC. In practice, Im Z(10 Hz) shows a linear trend in the full SOC window. Figure 4 proves that capacitance C(ω) is a proper measure of the actual battery capacity. Low frequencies are useful for capacity determination.
As well, the pseudo-charge Q = C⋅U resolves the SOC characteristics more clearly than the imaginary part of impedance. As a compromise, between high signal level (at low frequencies) and linearity (at high frequencies), the imaginary part at 1 Hz might be appropriate for use in the airplane application, because low charge states are usually not reached in normal use.
3.2. Reactance during Aging and the Memory Effect
In long-term tests, all NiCd packs were aged by 1200 cycles. Impedance was recorded every 400 cycles. After 800 and 1200 cycles, respectively, the cells were refreshed in order to eliminate the memory effect.
Figure 5a compiles the reactance at 1 Hz versus the real state-of-charge, which was defined by ampere-hour counting. During aging, reactance drops due to the loss of available capacity (100% to 80% SOH). At the 800th cycle, 76% SOH is reached. The memory effect is eliminated by a single deep-discharge and the successive full charge. Indeed, capacity improves again to 91% SOH. After 1200 cycles, 97% SOH is restored and 77% SOH without removal of the memory effect.
The rapid method (Section 2, Figure 5b) considers the difference between the full battery, and the state-of-charge after discharge of exactly 190 mAh (independent of SOH). The battery was fully discharged after 400, 800, and 1200 cycles. Obviously, the imaginary part of impedance reflects the state-of-health (capacity) during aging. Again, the memory effect can be eliminated by a single deep-discharge and a full charge and the reactance Im Z(1 Hz) displays the real state-of-charge. The results of battery packs #1 and #4 are qualitatively identical with packs #5 and #6. The ‘old’ packs #2 and #3 were handled in the same way as the ‘new’ packs #5 and #6 except for the changed C-rate, respectively. However, due to previous history with extended dwell times under overcharge, the impedance and aging status do not clearly correlate.
In Figure 5c, the reactance, Im Z(1 Hz), of three fully charged NiCd packs is compared at different aging states, including and excluding the memory effect. According to the residual capacity between 100% and 76% SOH, reactance lies between −40 mΩ and −80 mΩ. Low capacity correlates with highly negative reactance. This relation holds even if the memory effect is taken into account. Different battery packs show the same trend in the same order of magnitude.
In Figure 5d, the old battery pack #1, which suffered from 400 charge–deep discharge cycles before the impedance tests, shows the most serious loss in capacity. After 1200 cycles of the test procedure, residual capacity drops to 44% SOH (including memory effect), and 53% SOH (after refresh of the memory effect), respectively. Again, the reactance shows the state-of-health.
3.3. Capacitance as an Aging Indicator
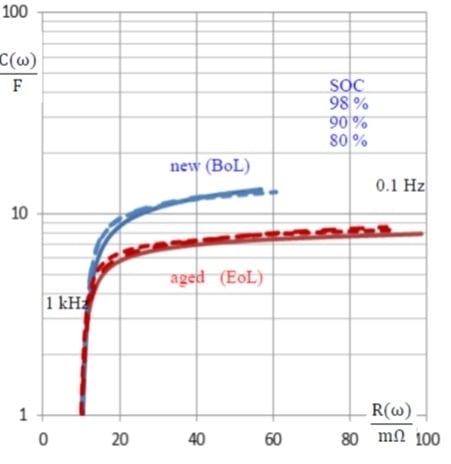
Pseudo-capacitance C(ω) at different frequencies was investigated at different cells between beginning of life (BoL) and end of life (EoL, SOH = 71%) at state-of-charge values between 70% and 100%. In Figure 6, capacitance displays the state-of-health for the charged batteries between the rated voltage U0 and 0.9 U0. Pseudo-capacitance at 0.1 Hz shows the difference in the SOH of new and aged batteries more clearly than the measurement at 0.1 Hz. C calculated by Equation (4) contains the internal resistance of the battery, whereas the approximation CD requires a higher frequency to give a reliable correlation with SOH.
In any case, capacitance allows distinguishing between full charge and partial charge new and aged batteries, whereas the message at low state-of-charge is less reliable.
3.4. Pseudo-Charge as a SOH Indicator
Pseudo-charge, Q(ω) = C(ω)/U, which was calculated by the measured capacitance C and the momentary cell voltage U, correlates more obviously with the state-of-charge along the battery life. For the old battery pack #6 with respect to the new battery, Figure 7 compiles the relative pseudo-charge at different state-of-charge values.
It becomes obvious that the impedance-based pseudo-charge correlates both with the actual Ah-based state-of-charge SOC between 70% and 96%. The fully charged battery (SOC = 100%) creates an outlier, because of the overcharge phenomenon that distorts the impedance-based capacitance measurement by parasitic electrochemical reactions. As an alternative to Figure 7, the relative loss of charge between new and old batteries can be drawn (i.e., ((Q(EoL) − Q(BoL))/Q(BoL)), which shows the same trend in the reverse direction. Useful frequencies for practical SOH determination lie below 1 Hz or below 100 Hz whether or not the internal resistance of the battery is considered as a proper aging criterion with calculating the pseudo-capacitance, C(ω) = Re C, according to Equation (5). Above 500 Hz, the spiral roll of the cell generates inductive impedance values, which are not useful for state-of-charge determination.
3.5. Separation of SOC and SOH
For the comparison of old and new batteries after a given operation time t, the pseudo-charge Q is normalized into a range between 0 and 1, which unlinks the SOC from the SOH.
QN is the rated capacity of the new battery (SOH = 1, SOC = 1). Q0 is the residual capacity of the aged battery (SOC = 1, SOH <1). U0 is the rated voltage and U(t) is the momentary cell voltage.
The normalized pseudo-charge correlates excellently with the real state-of-charge, which was determined by ampere-hour counting (Figure 8). Advantageously, Q(1 Hz) is determined very quickly.
3.6. Impedance-Based Aging Indicators
Diagrams of capacitance versus resistance C(R) have been used for the characterization of supercapacitors, whereby the rated capacitance is reached at low frequencies [1]. Aging generates a growing resistance and a loss of pseudo-capacitance. In Figure 9, however, a constant value of dc pseudo-capacitance is not quickly reached with NiCd batteries at frequencies down to 0.1 Hz. Especially at low SOC, aged batteries show a less steep slope ΔC/ΔR compared with new cells. In any case, the C(R) diagram estimates the extent of aging quickly. We propose this diagram for SOH monitoring.
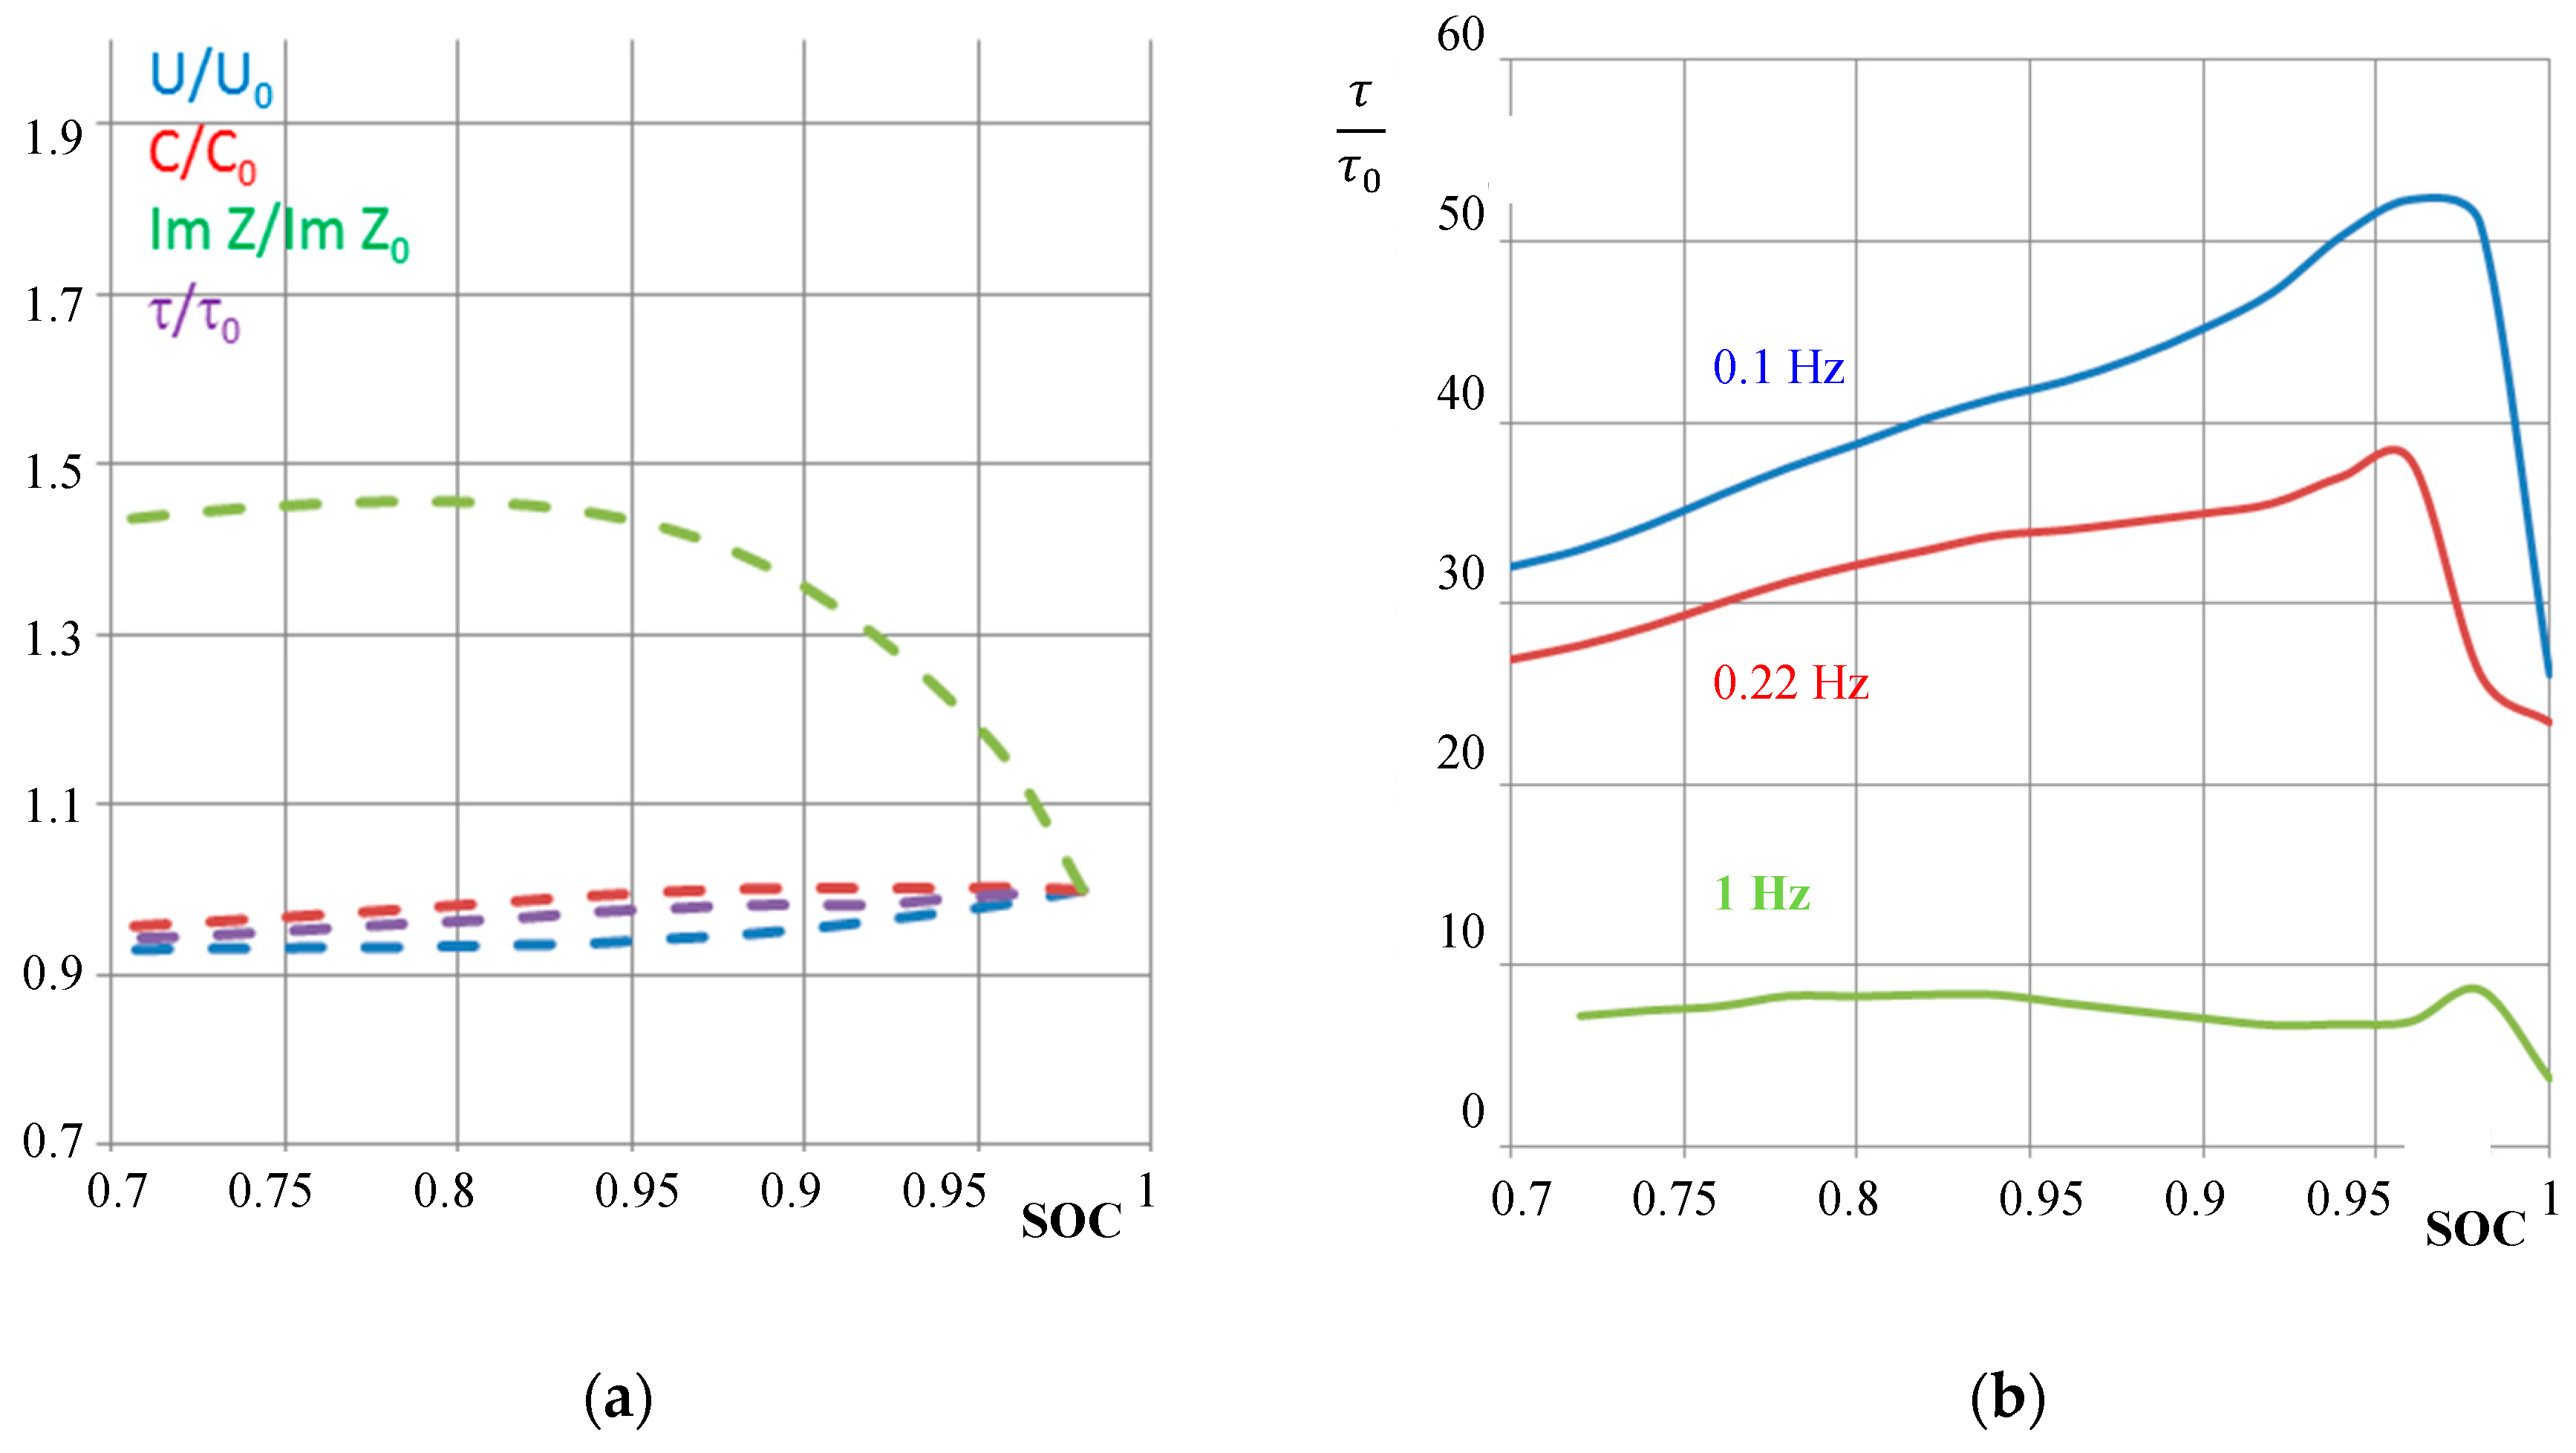
The reactance (imaginary part of impedance) versus SOC shows a local maximum (Figure 10). This quantity is therefore less useful for SOH determinations. In contrast to that, relative pseudo-capacitance C/C0 increases with SOC the same way as cell voltage U/U0 does (Figure 10). This proves why we suggest using capacitance for impedance-based SOC determination.
The relative time constant τ according to Equation (5) was determined by the pseudo-capacitance at 0.1 Hz. With this, new and aged batteries can qualitatively be distinguished by a single quantity. A large value of τ/τ0 means that the aged battery suffers from high electrolyte resistance and low interfacial capacitance.
4. Conclusions
For NiCd batteries used in airplanes at SOC values above 70%, this work proves the impact of cycle aging on the available electric charge (capacity) at different state-of-charge values (SOC) by the help of impedance spectroscopy. During aging, the cell resistance grows and the pseudo-capacitance drops (Figure 9), and the imaginary part of impedance rises (Figure 5). For rapid impedance measurements, we propose a frequency around 0.2 Hz. For practical use, the pseudo-capacitance according to Equation (4) best reflects the real state-of-charge (Figure 10). The imaginary part of impedance is less useful for SOC and SOH monitoring. Thanks to modern electronics, impedance measurements can be performed in airplanes throughout the pre-departure process with little expense and effort.
In addition, we found that pseudo-charge Q(ω) = C(ω)⋅U at 1 Hz is a proper measure for the real state-of-charge of a battery, where U is the momentary voltage of battery at the time of impedance measurement. With this approach, there is no need for any model descriptions or equivalent circuits, which are often unclear and complicate the system analysis during operation. For SOH monitoring, the pseudo-charge of the aged battery with regard to the new battery is considered (Figure 8).
Author Contributions
Writing—original draft preparation, review and editing, P.K. and W.S. All authors have read and agreed to the published version of the manuscript.
Funding
This work was by supported by Diehl Aerospace GmbH.
Conflicts of Interest
The authors declare no conflict of interest.
References
- Kurzweil, P.; Shamonin, M. State-of-Charge Monitoring by Impedance Spectroscopy during Long-Term Self-Discharge of Supercapacitors and Lithium-Ion Batteries. Batteries 2018, 4, 35. [Google Scholar] [CrossRef] [Green Version]
- Dubarry, M.; Truchot, C.; Liaw, B.Y. Synthesize battery degradation modes via a diagnostic and prognostic model. J. Power Sources 2012, 219, 204–216. [Google Scholar] [CrossRef]
- Hammouche, A.; Karden, E.; De Doncker, R.W. Monitoring state-of-charge of Ni–MH and Ni–Cd batteries using impedance spectroscopy. J. Power Sources 2004, 127, 105–111. [Google Scholar] [CrossRef]
- Xiong, R.; Cao, J.; Yu, Q.; He, H.; Sun, F. Critical Review on the Battery State of Charge Estimation Methods for Electric Vehicles. IEEE Access 2017, 6, 1832–1843. [Google Scholar] [CrossRef]
- Sarmah, S.B.; Kalita, P.; Garg, A.; Niu, X.; Zhang, X.-W.; Peng, X.; Bhattacharjee, D. A Review of State of Health Estimation of Energy Storage Systems: Challenges and Possible Solutions for Futuristic Applications of Li-Ion Battery Packs in Electric Vehicles. J. Electrochem. Energy Convers. Storage 2019, 16, 040801. [Google Scholar] [CrossRef] [Green Version]
- Zou, Y.; Hu, X.; Ma, H.; Li, S. Combined State of Charge and State of Health estimation over lithium-ion battery cell cycle lifespan for electric vehicles. J. Power Sources 2015, 273, 793–803. [Google Scholar] [CrossRef]
- Rodrigues, S.; Munichandraiah, N.; Shukla, A.K. A review of state-of-charge indication of batteries by means of a.c. impedance measurements. J. Power Sources 2000, 87, 12–20. [Google Scholar] [CrossRef]
- Bounaga, A. Device and Method for Measuring the Charge State of a Nickel-Cadmium Accumulator. U.S. Patent 5,650,937A, 22 July 1997. [Google Scholar]
- Latner, N. Method for Determining the State of Charge of Nickel Cadmium Batteries by Measuring the Farad Capacitance Thereof. U.S. Patent 3,562,634A, 9 February 1971. Available online: https://worldwide.espacenet.com/searchResults?ST=singleline&locale=de_EP&submitted=true&DB=&query=US3562634 (accessed on 8 January 2020).
- Sathyanarayana, S.; Venugopalan, S.; Gopikanth, M.L. Impedance parameters and the state-of charge. I. Nickel-cadmium battery. J. Appl. Electrochem. 1979, 9, 125–139. [Google Scholar] [CrossRef]
- Wenzl, H. Capacity. In Encyclopedia of Electrochemical Power Sources; Garche, J., Dyer, C.K., Moseley, P., Ogumi, Z., Rand, D., Scrosati, B., Eds.; Elsevier: Amsterdam, The Netherlands, 2009; Volume 1, pp. 395–400. [Google Scholar]
- Waag, W.; Sauer, D.U. State-of-Charge/Health. In Encyclopedia of Electrochemical Power Sources; Garche, J., Dyer, C.K., Moseley, P., Ogumi, Z., Rand, D., Scrosati, B., Eds.; Elsevier: Amsterdam, The Netherlands, 2009; Volume 4, pp. 793–804. [Google Scholar]
- Piller, S.; Perrin, M.; Jossen, A. Methods for state-of-charge determination and their applications. J. Power Sources 2001, 96, 113–120. [Google Scholar] [CrossRef]
- Bergveld, H.J.; Danilov, D.; Notten, P.H.L.; Pop, V.; Regtien, P.P.L. Adaptive State-of-charge determination. In Encyclopedia of Electrochemical Power Sources; Garche, J., Dyer, C.K., Moseley, P., Ogumi, Z., Rand, D., Scrosati, B., Eds.; Elsevier: Amsterdam, The Netherlands, 2009; Volume 1, pp. 450–477. [Google Scholar]
- Dowgiallo, E.J. Method for Determining Battery State of Charge by Measuring A.C. Electrical Phase Angle Change. U.S. Patent 3,984,762A, 5 October 1975. [Google Scholar]
- Finger, E.P.; Sands, E.A. Method and Apparatus for Measuring the State of Charge of a Battery by Monitoring Reductions in Voltage. U.S. Patent 4,193,026A, 11 March 1978. [Google Scholar]
- Kikuoka, T.; Yamamoto, H.; Sasaki, N.; Wakui, K.; Murakami, K.; Ohnishi, K.; Kawamura, G.; Noguchi, H.; Ukigaya, F. System for Measuring State of Charge of Storage Battery. U.S. Patent 4,377,787A, 22 March 1983. [Google Scholar]
- Seyfang, G.R. Battery State of Charge Indicator. U.S. Patent 4,949,046, 14 August 1990. [Google Scholar]
- Peled, E.; Yamin, H.; Reshef, I.; Kelrich, D.; Rozen, S. Method and Apparatus for Determining the State-of-Charge of Batteries Particularly Lithium Batteries. U.S. Patent 4,725,784A, 16 February 1988. [Google Scholar]
- Hahn, M.; Schindler, S.; Triebs, L.C.; Danzer, M.A. Optimized Process Parameters for a Reproducible Distribution of Relaxation Times Analysis of Electrochemical Systems. Batteries 2019, 5, 43. [Google Scholar] [CrossRef] [Green Version]
- Sato, Y.; Takeuchi, S.; Kobayakawa, K. Cause of the memory effect observed in alkaline secondary batteries using nickel electrode. J. Power Sources 2001, 93, 20–24. [Google Scholar] [CrossRef]
- Linden, D.; Reddy, T.B. Handbook of Batteries; McGraw-Hill: New York, NY, USA, 2002. [Google Scholar]
- Barsoukov, E.; Macdonald, J.R. Impedance Spectroscopy: Theory, Experiment, and Applications; John Wiley Sons: Hoboken, NJ, USA, 2018. [Google Scholar]
- Kurzweil, P.; Ober, J.; Wabner, D.W. Method for Correction and Analysis of Impedance Spectra. Electrochim. Acta 1989, 34, 1179–1185. [Google Scholar] [CrossRef]
- Kurzweil, P.; Fischle, H.J. A new monitoring method for electrochemical aggregates by impedance spectroscopy. J. Power Sources 2004, 127, 331–340. [Google Scholar] [CrossRef]
- Kurzweil, P.; Hildebrand, A.; Weiss, M. Accelerated Life Testing of Double-Layer Capacitors: Reliability and safety under Excess Voltage and Temperature. ChemElectroChem 2015, 2, 150–159. [Google Scholar] [CrossRef]
Figure 1.
(a) Qualitative discharge characteristics of a nickel–cadmium battery suffering the memory effect. (b) End-of-charge determination by minus-delta-U cutoff. U = voltage in volts.
Figure 1.
(a) Qualitative discharge characteristics of a nickel–cadmium battery suffering the memory effect. (b) End-of-charge determination by minus-delta-U cutoff. U = voltage in volts.

Figure 2.
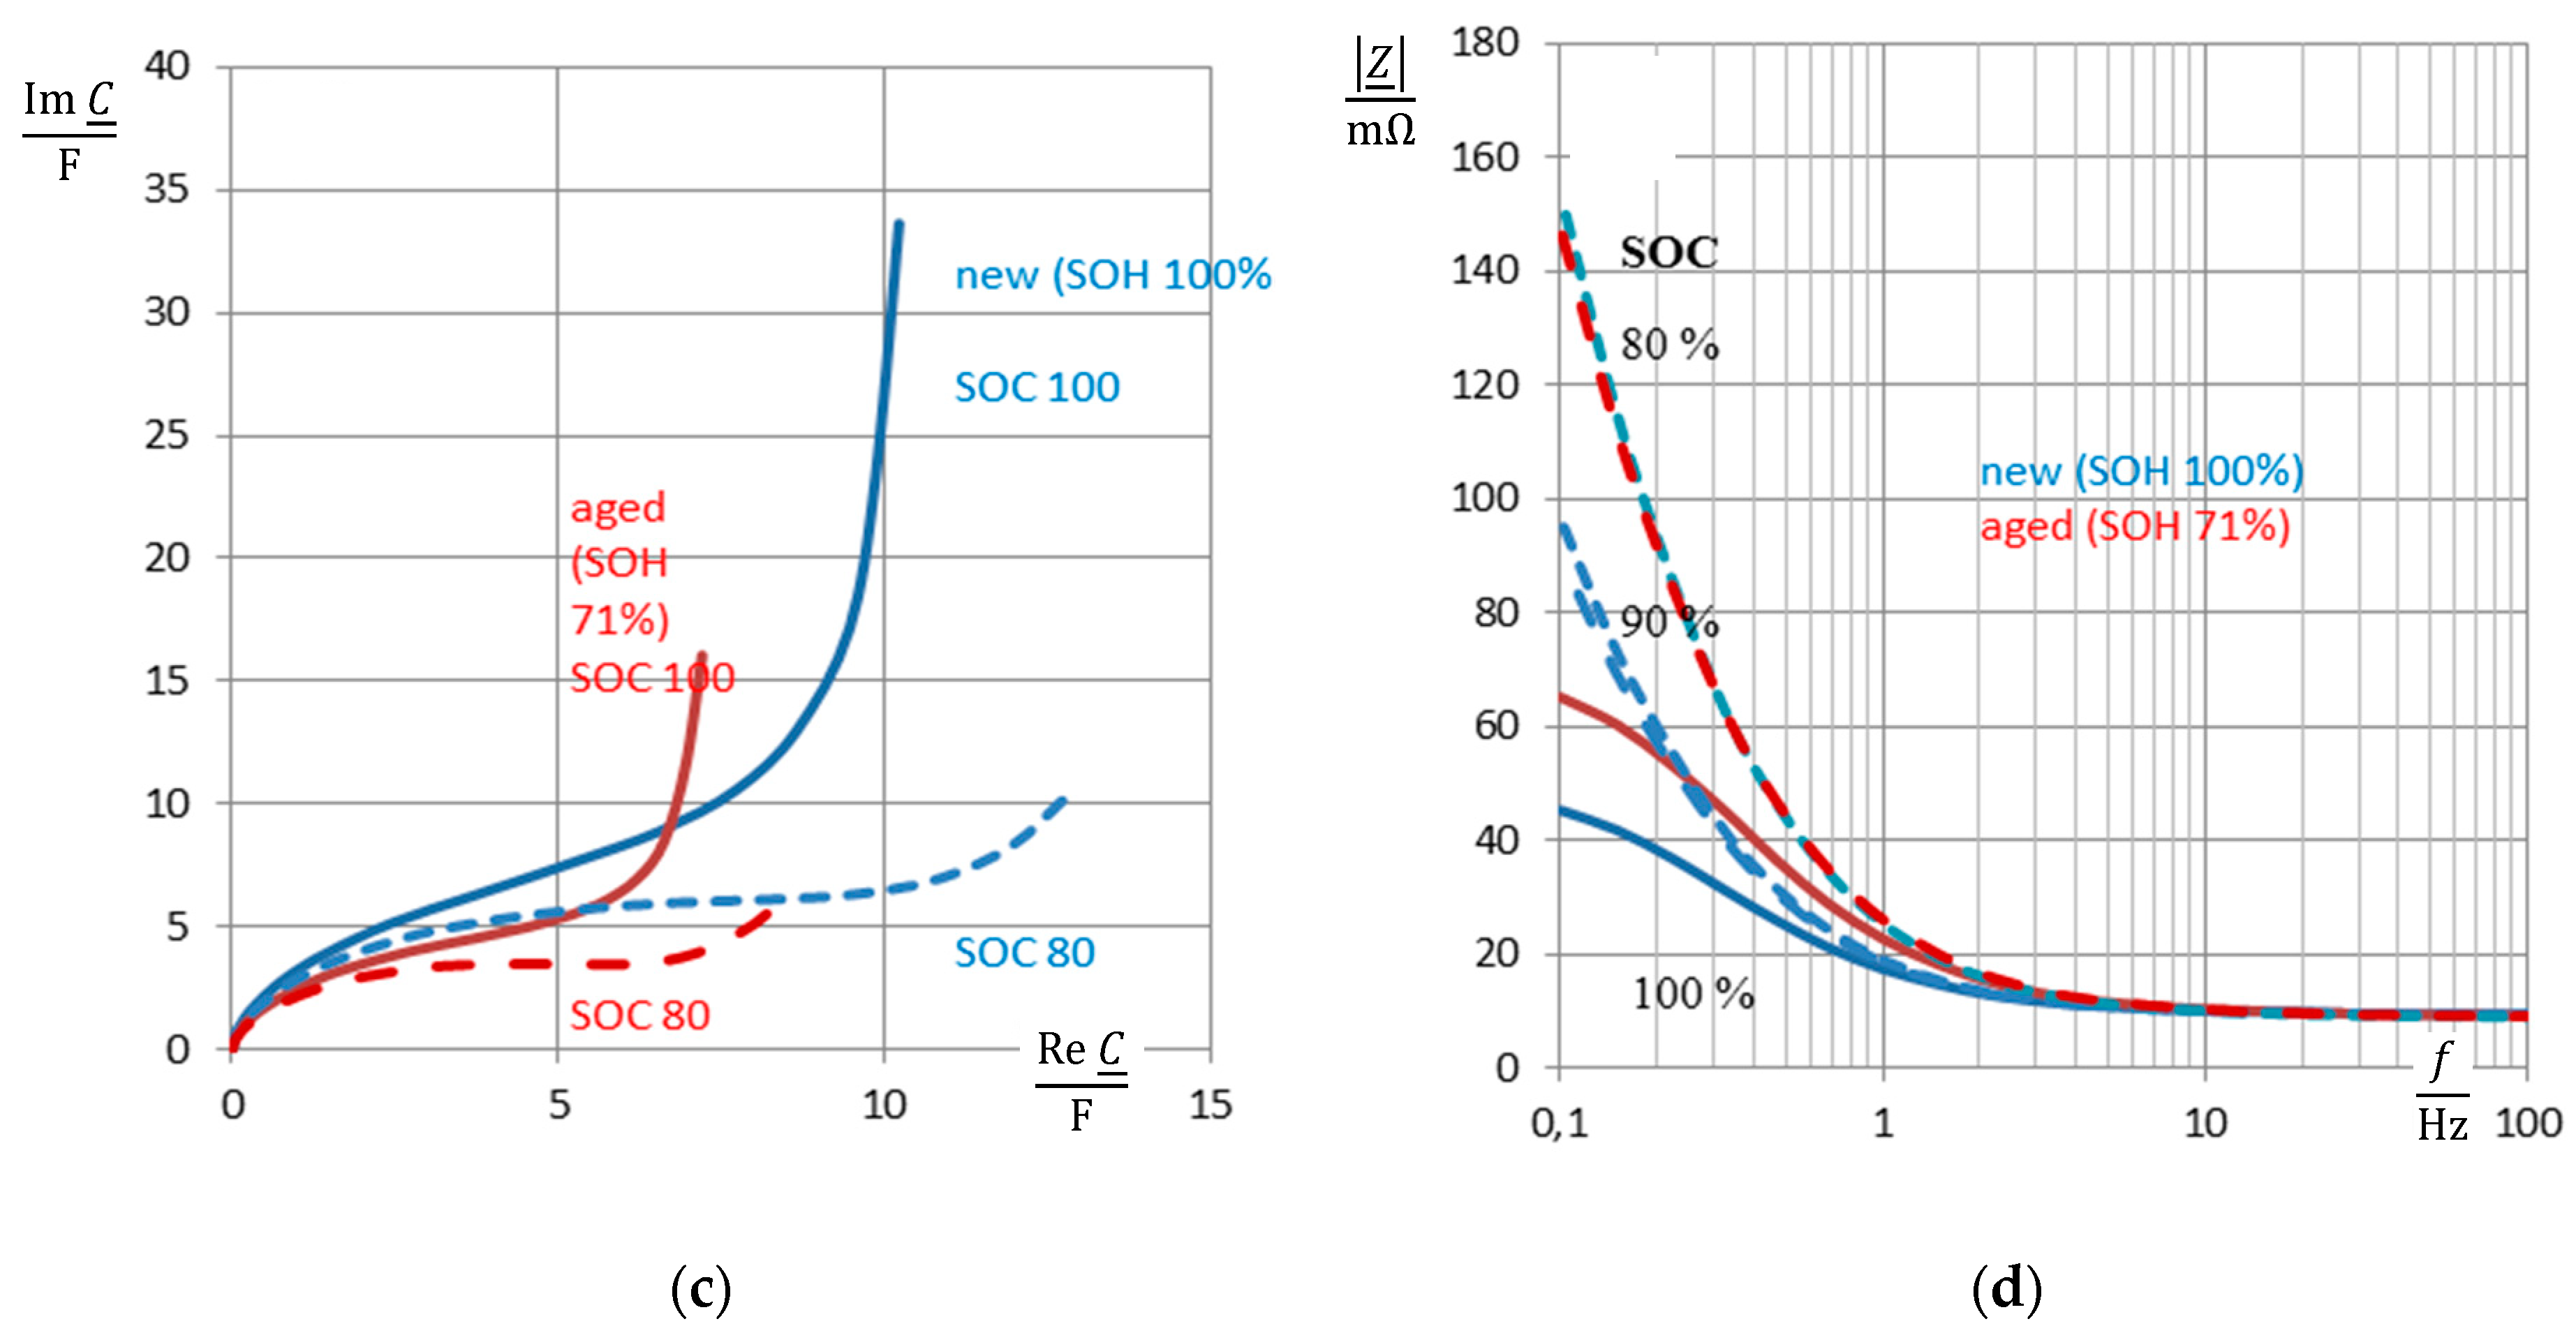
Impedance spectra of a nickel-cadmium (NiCd) battery (cell #5, new: State-of-health (SOH) 100% = 1.7 Ah, aged: SOH 71% = 1.21 Ah) at full charge (state-of-charge (SOC) = 100%, solid line) and 80% state-of-charge (dashed): (a) complex plane plot of impedance Z, so-called Nyquist plot, (b) admittance Y = 1/Z in the complex plane, (c) complex capacitance C = Y/(jω), (d) frequency response of modulus |Z|(ω), part of Bode diagram. Reactance Im Z, susceptance Im Y, and pseudocapacitance Re C reflect the state-of-charge more clearly than the ohmic resistance Re Z, conductance Im Y, and the phase angle ϕ (not shown here).
Figure 2.
Impedance spectra of a nickel-cadmium (NiCd) battery (cell #5, new: State-of-health (SOH) 100% = 1.7 Ah, aged: SOH 71% = 1.21 Ah) at full charge (state-of-charge (SOC) = 100%, solid line) and 80% state-of-charge (dashed): (a) complex plane plot of impedance Z, so-called Nyquist plot, (b) admittance Y = 1/Z in the complex plane, (c) complex capacitance C = Y/(jω), (d) frequency response of modulus |Z|(ω), part of Bode diagram. Reactance Im Z, susceptance Im Y, and pseudocapacitance Re C reflect the state-of-charge more clearly than the ohmic resistance Re Z, conductance Im Y, and the phase angle ϕ (not shown here).
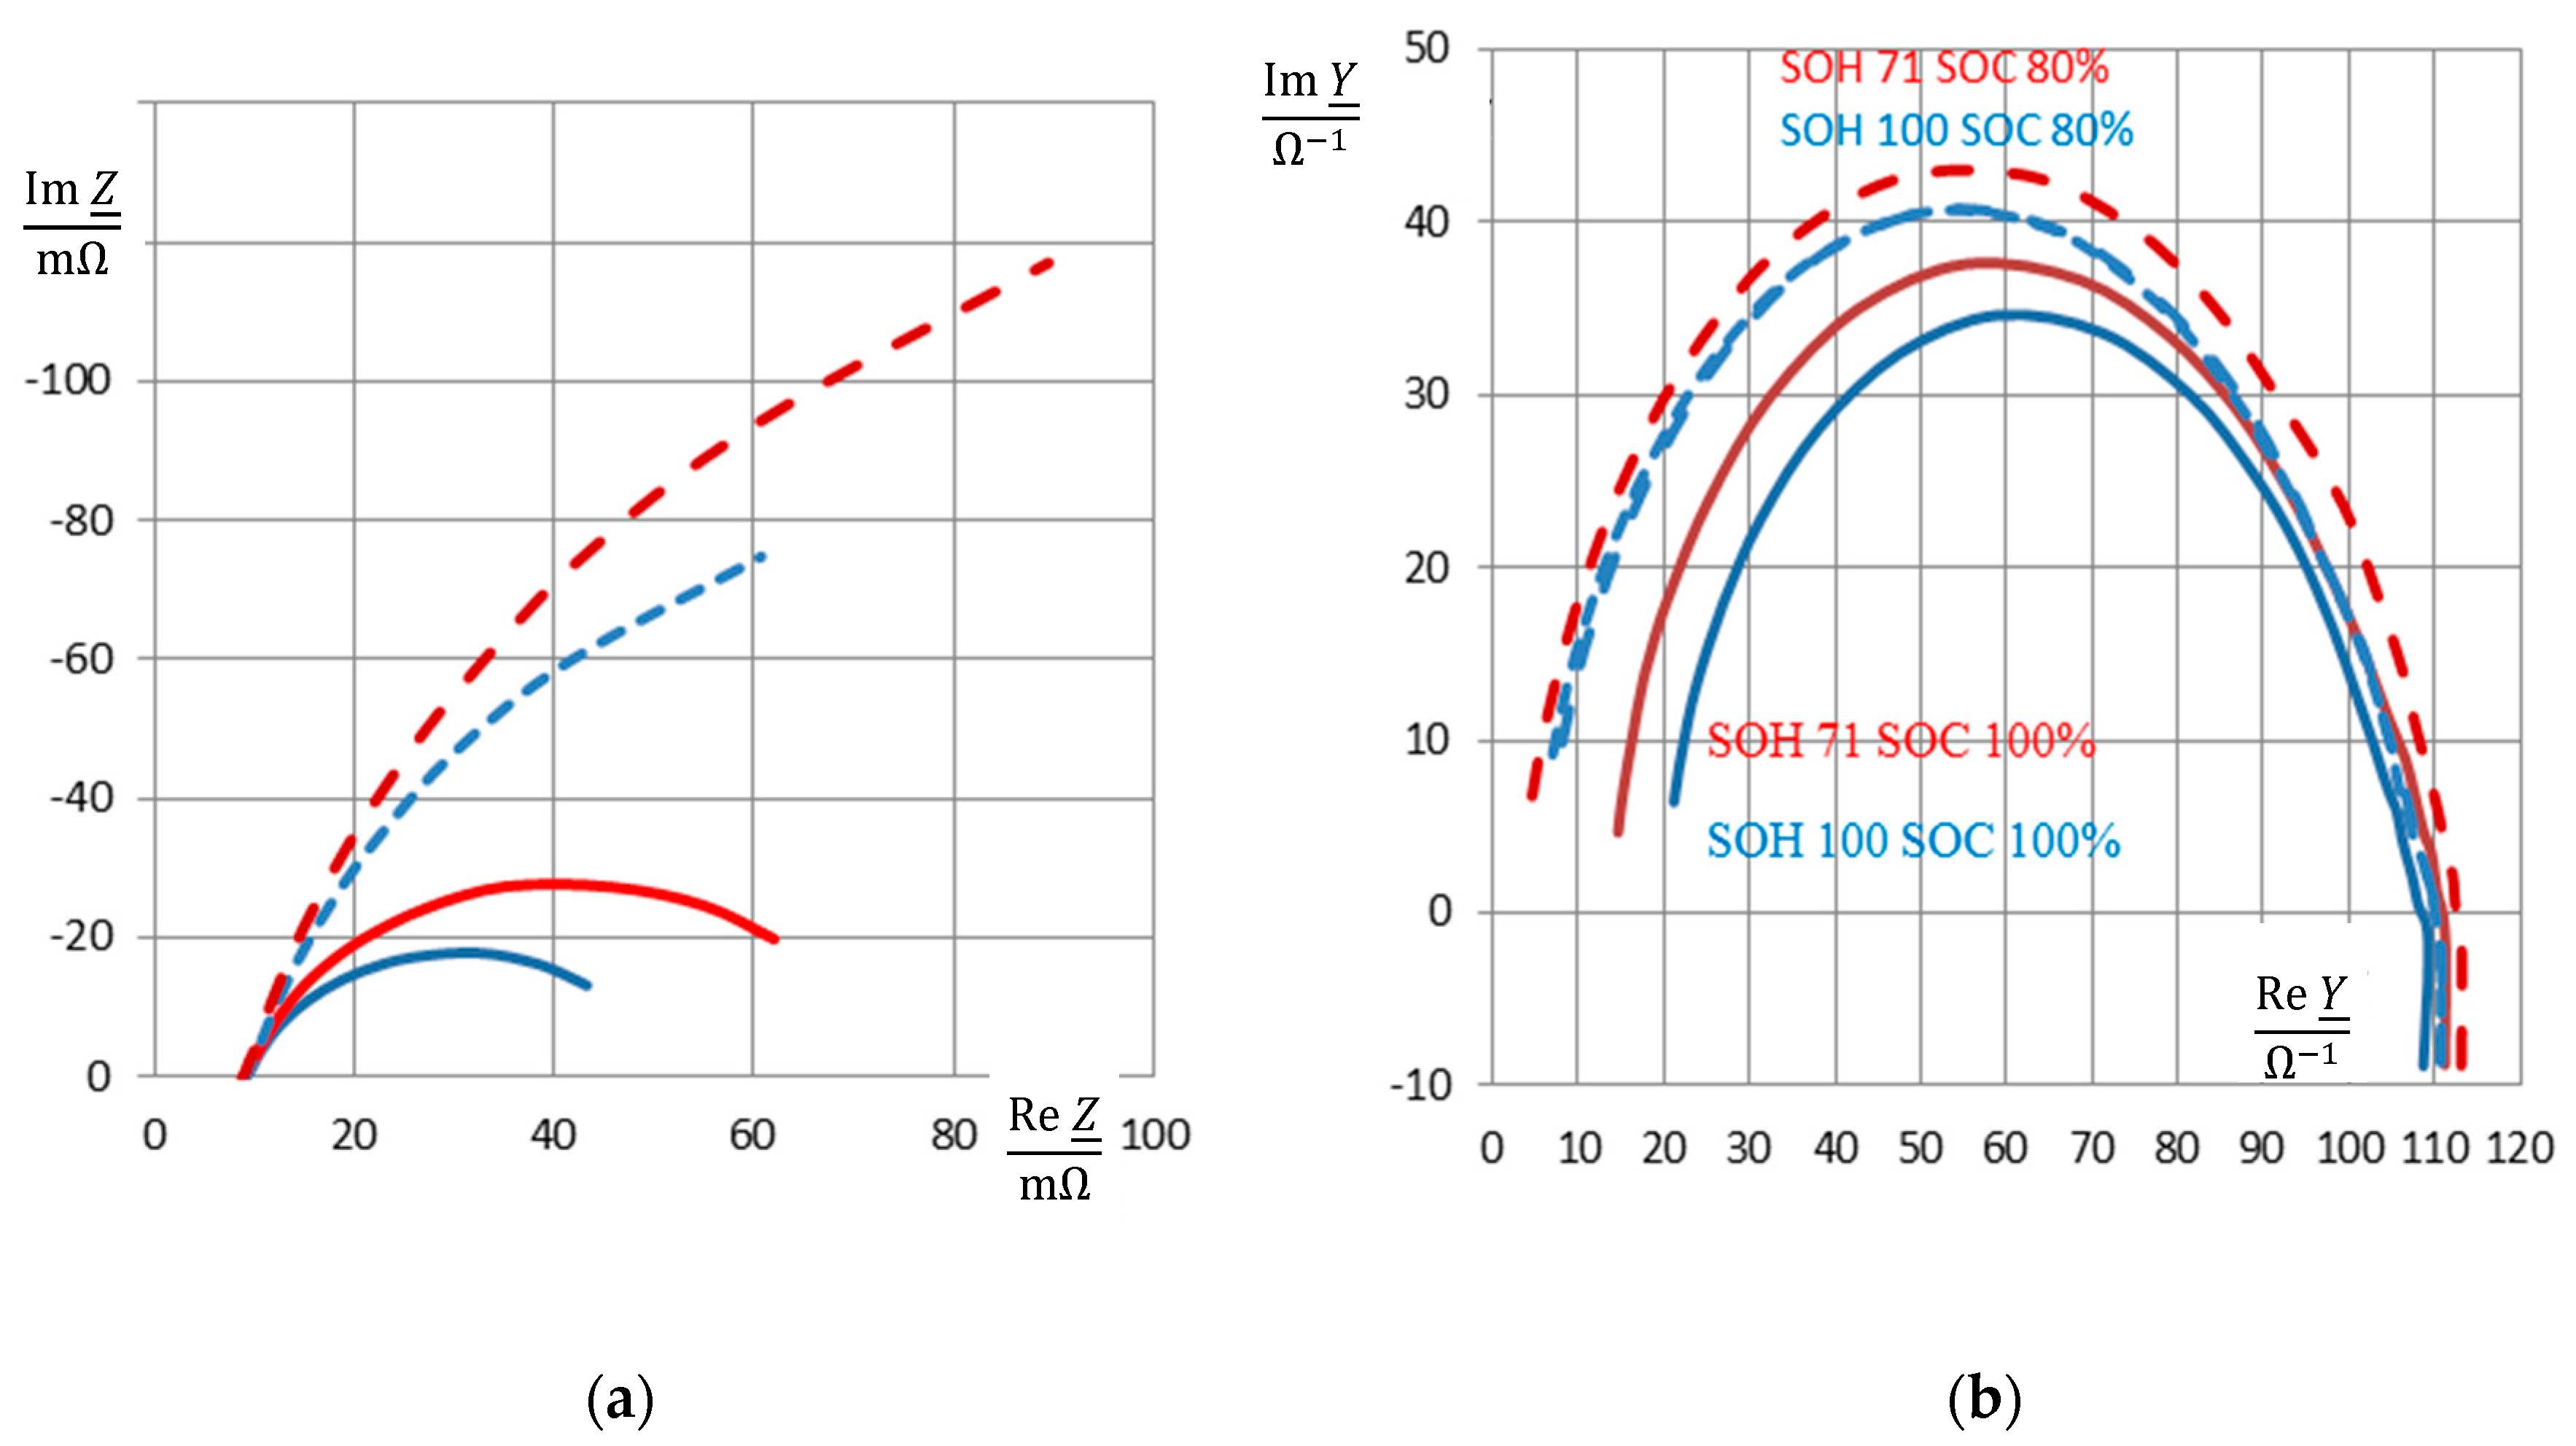

Figure 3.
Voltage during continuous cycle testing at 50 °C (NiCd, 1.7 Ah, 0.5C) for 1200 cycles.

Figure 4.
SOC monitoring by impedance spectroscopy of a used NiCd battery (cell 5 of pack #3 of 2017). (a) Reactance X = Im Z at different frequencies versus state-of-charge. (b) Pseudo-capacitance C and (c) calculated residual electric pseudo-charge Q(t) = C U(t) at the momentary voltage U (SOC).
Figure 4.
SOC monitoring by impedance spectroscopy of a used NiCd battery (cell 5 of pack #3 of 2017). (a) Reactance X = Im Z at different frequencies versus state-of-charge. (b) Pseudo-capacitance C and (c) calculated residual electric pseudo-charge Q(t) = C U(t) at the momentary voltage U (SOC).

Figure 5.
State-of-health monitoring (SOH) by impedance spectroscopy of NiCd batteries. (a) Reactance Im Z(1 Hz) during 1200 charge–discharge cycles (cell of new pack #6, C/2, 50 °C). (b) Rapid method with 0.19 mAh discharge and capacity measurement by ampere-hour counting (cell of new pack #5). (c) Im Z(1 Hz) of fully charged battery packs versus SOH. (d) Cell 5 of pack #1 after 400 pre-cycles. The state-of-health SOH = Q0/QN (ratio of actual and rated available capacity Q) correlates quite well with the reactance Im Z.

Figure 6.
Capacitance-based state-of-health monitoring with respect to terminal voltage U/U0 at (a) 0.1 Hz and (b) 1 Hz. BoL = beginning of life (1.7 Ah), EoL = end of life (1.2 Ah) of cell #5 of pack #6. Solid: C = Im Y/(jω), according to Equation (4). Dashed: Approximation CD = C(ω →∞).
Figure 6.
Capacitance-based state-of-health monitoring with respect to terminal voltage U/U0 at (a) 0.1 Hz and (b) 1 Hz. BoL = beginning of life (1.7 Ah), EoL = end of life (1.2 Ah) of cell #5 of pack #6. Solid: C = Im Y/(jω), according to Equation (4). Dashed: Approximation CD = C(ω →∞).

Figure 7.
Aging study. Relative pseudo-charge Q(ω) = C(ω)⋅U(SOC) of an aged 1.7 Ah battery (pack #6, EoL = end of life) with regard to the new battery (BoL = beginning of life). (a) Impedance measurements at selected frequencies versus the actual state-of-charge SOC = Q/Q0 received by genuine Ah counting. (b) Frequency response of relative pseudo-charge, which is determined by the internal resistance of the battery below 1 Hz, and the surface capacitance above 1 Hz.

Figure 8.
The impact of aging. Ratio of the available electric pseudo-charge Q0(t) of used NiCd batteries with respect to the rated value of the new battery QN (pack #5 and pack #6). Data are taken from Figure 5. Impedance-based pseudo-charge Q0 = C(1 Hz) U (divided by the rated capacity QN) correlates well with the true SOH values from Ah measurements.

Figure 9.
Aging characteristics of NiCd cell #5 of pack #6 (new: 1.7 Ah, aged: 1.3 Ah, SOH = 76%) in the plot of pseudo-capacitance C(ω) and pseudo-charge Q(ω) = C(ω) U versus the internal resistance (real part of impedance). U(SOC) = actual cell voltage at the time of measurement.
Figure 9.
Aging characteristics of NiCd cell #5 of pack #6 (new: 1.7 Ah, aged: 1.3 Ah, SOH = 76%) in the plot of pseudo-capacitance C(ω) and pseudo-charge Q(ω) = C(ω) U versus the internal resistance (real part of impedance). U(SOC) = actual cell voltage at the time of measurement.

Figure 10.
Aging characteristics of a NiCd battery (cell #5 of pack #6). (a) Different normalized state-of-charge quantities with respect to voltage U/U0, pseudo-capacitance C/C0 at 0.22 Hz, imaginary part of impedance at 0.22 Hz, and relative time constant τ/τ0 at 0.22 Hz against the actual state-of-charge received from Ah counting. (b) Relative time constant between the old battery τ = R(1 kHz)⋅C(0.1 Hz) and the new battery τ0 at different frequencies according to Equation (6).


Table 1.
Overview of experiments.
| Test Method | Battery Pack: 7.5 V, 1.7 Ah, 5 Single Cells | A. Cycling (SOC) at 50 °C | B. Impedance Measurements During Discharge (SOC 1 → 0.7) After 400, 800, 1200 Cycles | C. Capacity After Full 0.5C Charge (Ah Counting) |
|---|---|---|---|---|
| 1 Full discharge | (a) old (#1) (b) new (#4) | 1C (1→ 0) 0.5C (1→ 0) | by 2% voltage steps | at cycle 400, 800, and 1200 |
| 2 Partial discharge | (a) old (#2) (b) new (#5) | 1C (1→ 0.8) 0.5C (1→ 0.8) | by 0.19 Ah steps | at cycle 400, 800, and 1200 |
| 3 Partial discharge | (a) old (#3) (b) new (#6) | 0.1C (1→ 0.8) 0.5C (1→ 0.8) | by 2% voltage steps | at cycle 400, 800 and 1200 |
© 2020 by the authors. Licensee MDPI, Basel, Switzerland. This article is an open access article distributed under the terms and conditions of the Creative Commons Attribution (CC BY) license (http://creativecommons.org/licenses/by/4.0/).
Share and Cite
MDPI and ACS Style
Kurzweil, P.; Scheuerpflug, W. State-of-Charge Monitoring and Battery Diagnosis of NiCd Cells Using Impedance Spectroscopy. Batteries 2020, 6, 4. https://doi.org/10.3390/batteries6010004
AMA Style
Kurzweil P, Scheuerpflug W. State-of-Charge Monitoring and Battery Diagnosis of NiCd Cells Using Impedance Spectroscopy. Batteries. 2020; 6(1):4. https://doi.org/10.3390/batteries6010004
Chicago/Turabian StyleKurzweil, Peter, and Wolfgang Scheuerpflug. 2020. "State-of-Charge Monitoring and Battery Diagnosis of NiCd Cells Using Impedance Spectroscopy" Batteries 6, no. 1: 4. https://doi.org/10.3390/batteries6010004
Note that from the first issue of 2016, this journal uses article numbers instead of page numbers. See further details here.