A New Glass-Forming Electrolyte Based on Lithium Glycerolate


1
Section of Chemistry for the Technology (ChemTech), Department of Industrial Engineering, University of Padova, Via Marzolo 9, I-35131 Padova (PD), Italy
2
Centro Studi di Economia e Tecnica dell’Energia Giorgio Levi Cases, Via Marzolo 9, I-35131 Padova (PD), Italy
3
Consorzio Interuniversitario Nazionale per la Scienza e Tecnologia dei Materiali, Via Marzolo 1, I-35131 Padova (PD), Italy
4
Centre for Mechanics of Biological Materials—CMBM, Via Marzolo 9, I-35131 Padova (PD), Italy
5
Material Science and Engineering Department, Universidad Carlos III de Madrid, Escuela Politécnica Superior, Av.de la Universidad, 30, 28911 Leganes, Spain
*
Author to whom correspondence should be addressed.
Batteries 2018, 4(3), 41; https://doi.org/10.3390/batteries4030041
Submission received: 19 July 2018
/
Revised: 7 August 2018
/
Accepted: 24 August 2018
/
Published: 1 September 2018
(This article belongs to the Special Issue Recent Advances in Post-Lithium Ion Batteries)
Abstract
:The detailed study of the interplay between the physicochemical properties and the long-range charge migration mechanism of polymer electrolytes able to carry lithium ions is crucial in the development of next-generation lithium batteries. Glycerol exhibits a number of features (e.g., glass-forming behavior, low glass transition temperature, high flexibility of the backbone, and efficient coordination of lithium ions) that make it an appealing ion-conducting medium and a challenging building block in the preparation of new inorganic–organic polymer electrolytes. This work reports the preparation and the extensive investigation of a family of 11 electrolytes based on lithium glycerolate. The electrolytes have the formula C3H5(OH)3−x(OLi)x, where 0 ≤ x ≤ 1. The elemental composition is evaluated by inductively coupled plasma atomic emission spectroscopy. The structure and interactions are studied by vibrational spectroscopies (FT-IR and micro-Raman). The thermal properties are gauged by modulated differential scanning calorimetry and thermogravimetric analysis. Finally, insights on the long-range charge migration mechanism and glycerol relaxation events are investigated via broadband electrical spectroscopy. Results show that in these electrolytes, glycerolate acts as a large and flexible macro-anion, bestowing to the material single-ion conductivity (1.99 × 10⁻⁴ at 30 °C and 1.55 × 10⁻² S∙cm−1 at 150 °C for x = 0.250).
1. Introduction
The major challenge for the improvement of lithium secondary batteries is the development of stable electrolytes capable of efficiently transferring Li ions in a wide range of temperatures. Polymer Electrolytes (PEs) seem to be the right answer thanks to their mechanical, thermal, chemical, and electrochemical stability, and good conductivity at room temperature [1,2]. Typically, with respect to ceramic [3] and liquid electrolytes [4], PEs show lower conductivity values. Nevertheless, they can be obtained as very-thin-layer systems, reducing the internal resistance of the device and thus compensating for their lower conductivity. Furthermore, the mechanical properties—in particular, their flexibility—allow the maintenance of electrode–electrolyte contact during the charge and discharge of the battery, even if the device is subjected to mechanical stress [5]. Finally, PEs and glasses have the advantage of no grain boundaries, unlike ceramics [6]. The key point to designing new and high-performing PEs is the understanding of ion dissociation phenomena, ion–ion and ion–matrix interactions, and transport events characterizing the long-range charge migration within the polymeric matrix.
Polymers that present suitable oxygen functionalities, such as polyethylene glycol (PEG) [7,8,9,10] and polyvinyl alcohol (PVA) [11], (a) present a high capability to efficiently coordinate lithium cations and (b) facilitate the ion migration events through inter- and intra-chain ion-exchange processes [2]. Glycerol (propane-1,2,3-triol) is a cheap, colorless, odorless, viscous, and nontoxic organic low-molecular-weight component endowed with (a) a glass transition (Tg) at −80 °C and (b) a melting process at 18 °C [12]. Glycerol is also thermally stable up to 195 °C [13,14] and, with its three hydroxyl groups, is able to (i) coordinate lithium ions and (ii) be easily lithiated, so giving rise to the formation of lithium alkoxide functionalities within the same molecule. Furthermore, glycerol is considered a “glass-forming” liquid, i.e., a material that, when it is supercooled, forms a liquid phase and shows no long-range order like normal crystalline solids. Glass-forming liquids are a category of materials that have been studied in several research areas, in particular (a) in low-temperature electrochemistry as electrolytes [15] and (b) in liquid-state physics as soft materials with peculiar molecular and ionic relaxation processes in the long-time domain [16]. These latter properties are crucial to developing a high-performing lithium ion conductor and to understanding the transport phenomena modulating the conductivity in these challenging materials.
In this work a family of 11 lithium glycerolate electrolytes with different Li contents is synthetized and extensively characterized. The general formula of these electrolytes is C3H5(OH)3−x(OLi)x, abbreviated as GlyLix (0 ≤ x ≤ 1). Vibrational studies, carried out by FT-IR and Raman, allow for the clarification of the structure and interactions characterizing the GlyLix electrolytes as a function of lithium concentration. The thermal stability and transitions are revealed by TGA and modulated differential scanning calorimetry (MDSC) analyses. Broadband electrical spectroscopy (BES) is used to investigate the electrical response of the electrolytes in terms of polarization and dielectric relaxations. Merging together vibrational, thermal, and BES results, a reasonable conduction mechanism is proposed for these electrolytes. Finally, the best GlyLix electrolyte demonstrates a conductivity higher than 10−6 S∙cm−1 at −10 °C, 1.99 × 10⁻⁴ S∙cm−1 at 30 °C, and 1.55 × 10⁻² S∙cm−1 at 150 °C.
2. Results and Discussion
2.1. Chemical Composition of GlyLix Electrolytes
During the preparation process, each glycerol molecule exchanges one H+ with one Li+ (see Reaction I and Section 3.1). Lithium glycerolate, C3H5-(OH)2(OLi), is thus obtained; this compound is indicated as GlyLi. H2 is evolved during the reaction.
C3H5-(OH)3 + LiH → C3H5-(OH)2(OLi) + H2
GlyLi is subsequently diluted with different amounts of pristine glycerol (indicated as Gly), yielding the GlyLix electrolytes described in this work. The latter can be indicated as follows (see Equation (1)):
GlyLix = [(GlyLi)x(Gly)1−x].
The assay of Li is obtained by ICP-AES; a summary of the composition of the 11 GlyLix electrolytes is provided in Table 1.
2.2. Vibrational Spectroscopy Studies
2.2.1. Glycerol Conformations
In accordance with results from other studies, glycerol consists of a blend of molecules with different conformations. A brief description of the types of conformations exhibited by glycerol molecules is provided below. It is reported that three structural arrangements of CH2OH and OH groups are possible, namely, α, β, and γ [17]. These latter derive from the allowed rotations of the CH2OH and OH groups around the C–C covalent bond in the backbone. In the α conformation, the C–C–O angle (φ) is equal to 71°, and the terminal oxygen atom of the CH2OH group is in trans position with respect to the carbon atom of the CHOH group. On the other hand, in the β conformation, the two oxygen atoms of CH2OH and CHOH groups are in trans position. Finally, in the γ orientation, φ is equal to 71°, and the terminal oxygen atom of the CH2OH group is in trans position with respect to the hydrogen atom of the CHOH group. The three different conformations are represented in Figure 1a.
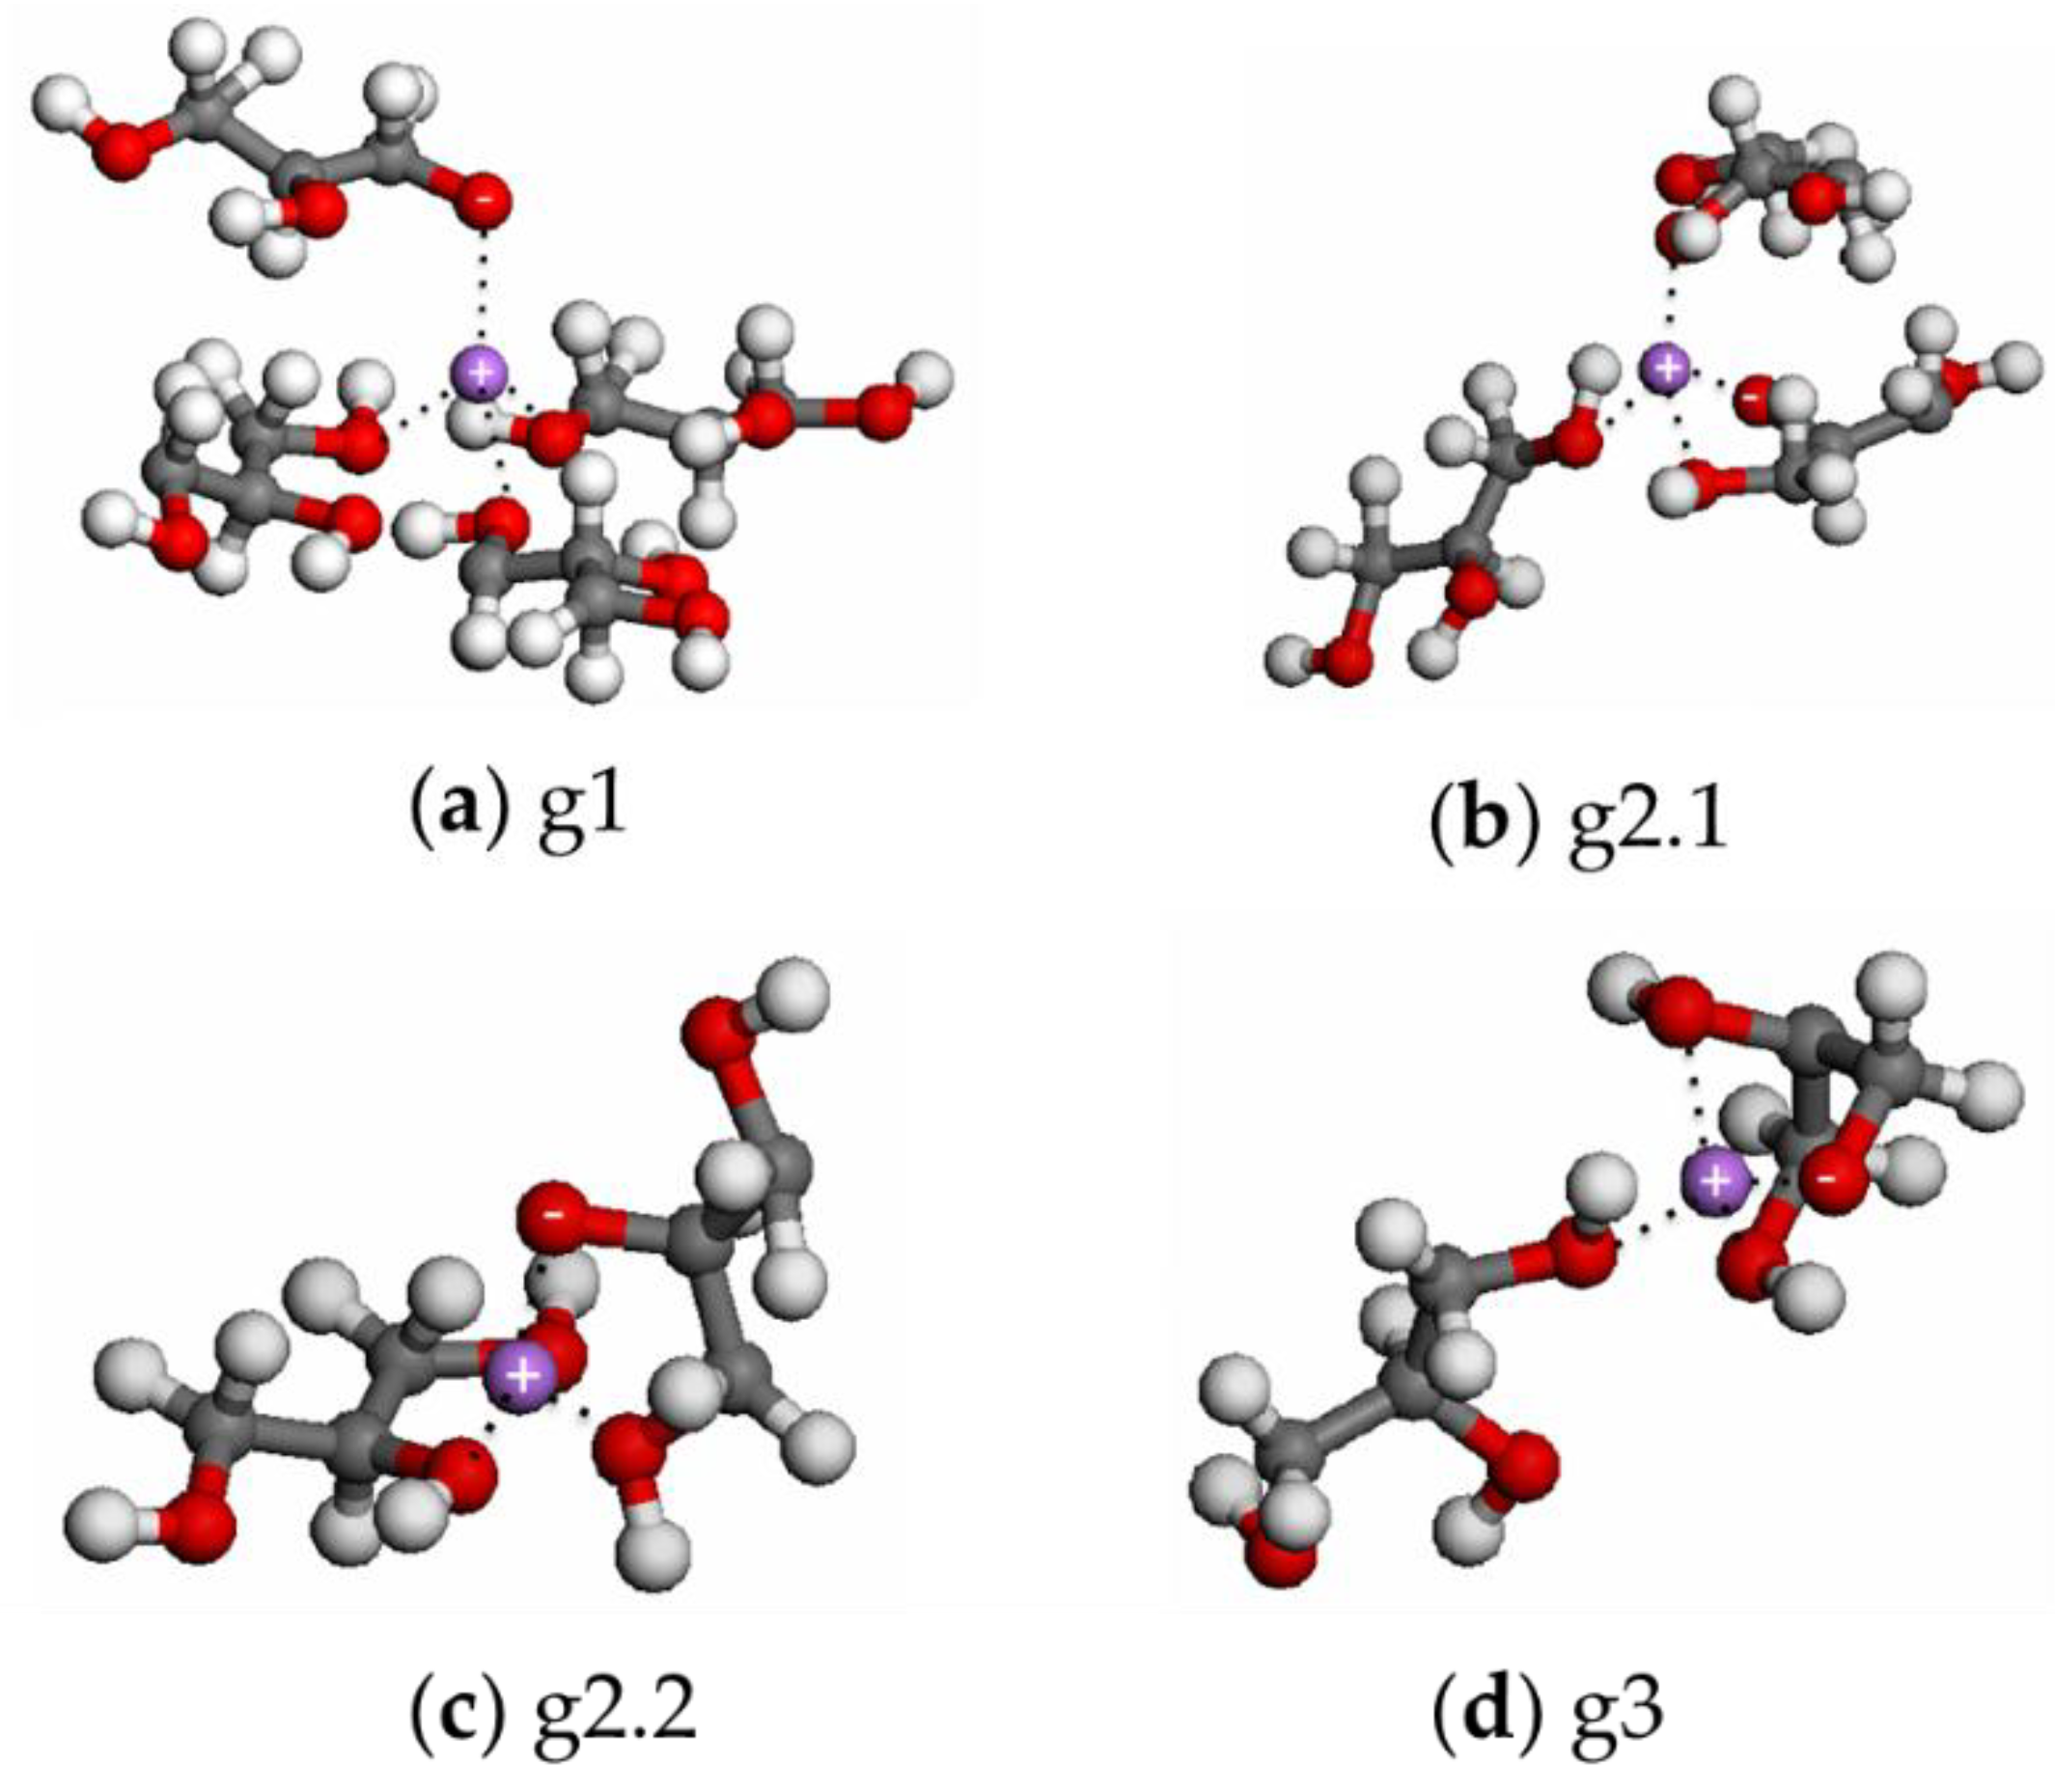
In the crystalline form of glycerol, only the αα conformer exists, while in the liquid both the αα and αγ conformers are identified (Figure 1b) [18]. The γγ conformer might exist, but only with a very low probability. Moreover, dynamic mechanical studies reveal that in glycerol the intra- and inter-molecular H-bonds give rise to the formation of five-member atoms rings in the αα and αγ conformers, while in the γγ conformer a six-atom ring coordination appears [19,20,21]. If we assume that (a) Li+ cations exhibit a tetrahedral coordination geometry [22] and (b) each Li+ is coordinated by one –O− and three electron pairs of different neutral oxygen atoms, then glycerol can assume four different coordination geometries, as follows: (i) g1: glycerol assumes an αα conformation; one Li+ is coordinated by four glycerol molecules through four monodentate bonds (Figure 2a); (ii) g2.1: glycerol is characterized by an αα conformation; one glycerol molecule coordinates Li+ as a bidentate ligand and two more glycerol molecules coordinate Li+ as monodentate ligands (Figure 2b); (iii) g2.2: glycerol exhibits an αα conformation; two glycerol molecules coordinate Li+ as bidentate ligands (Figure 2c); and (iv) g3: glycerol has a γγ conformation; one glycerol molecule coordinates Li+ as a monodentate ligand, while another glycerol molecule coordinates Li+ as a tridentate ligand (Figure 2d). All of these coordination geometries are present in the electrolytes described in this work. FT-IR and micro-Raman studies allow us to understand which coordination geometry is predominant at each nLi/ngly ratio (x).
2.2.2. Fourier Transform Infrared Spectroscopy
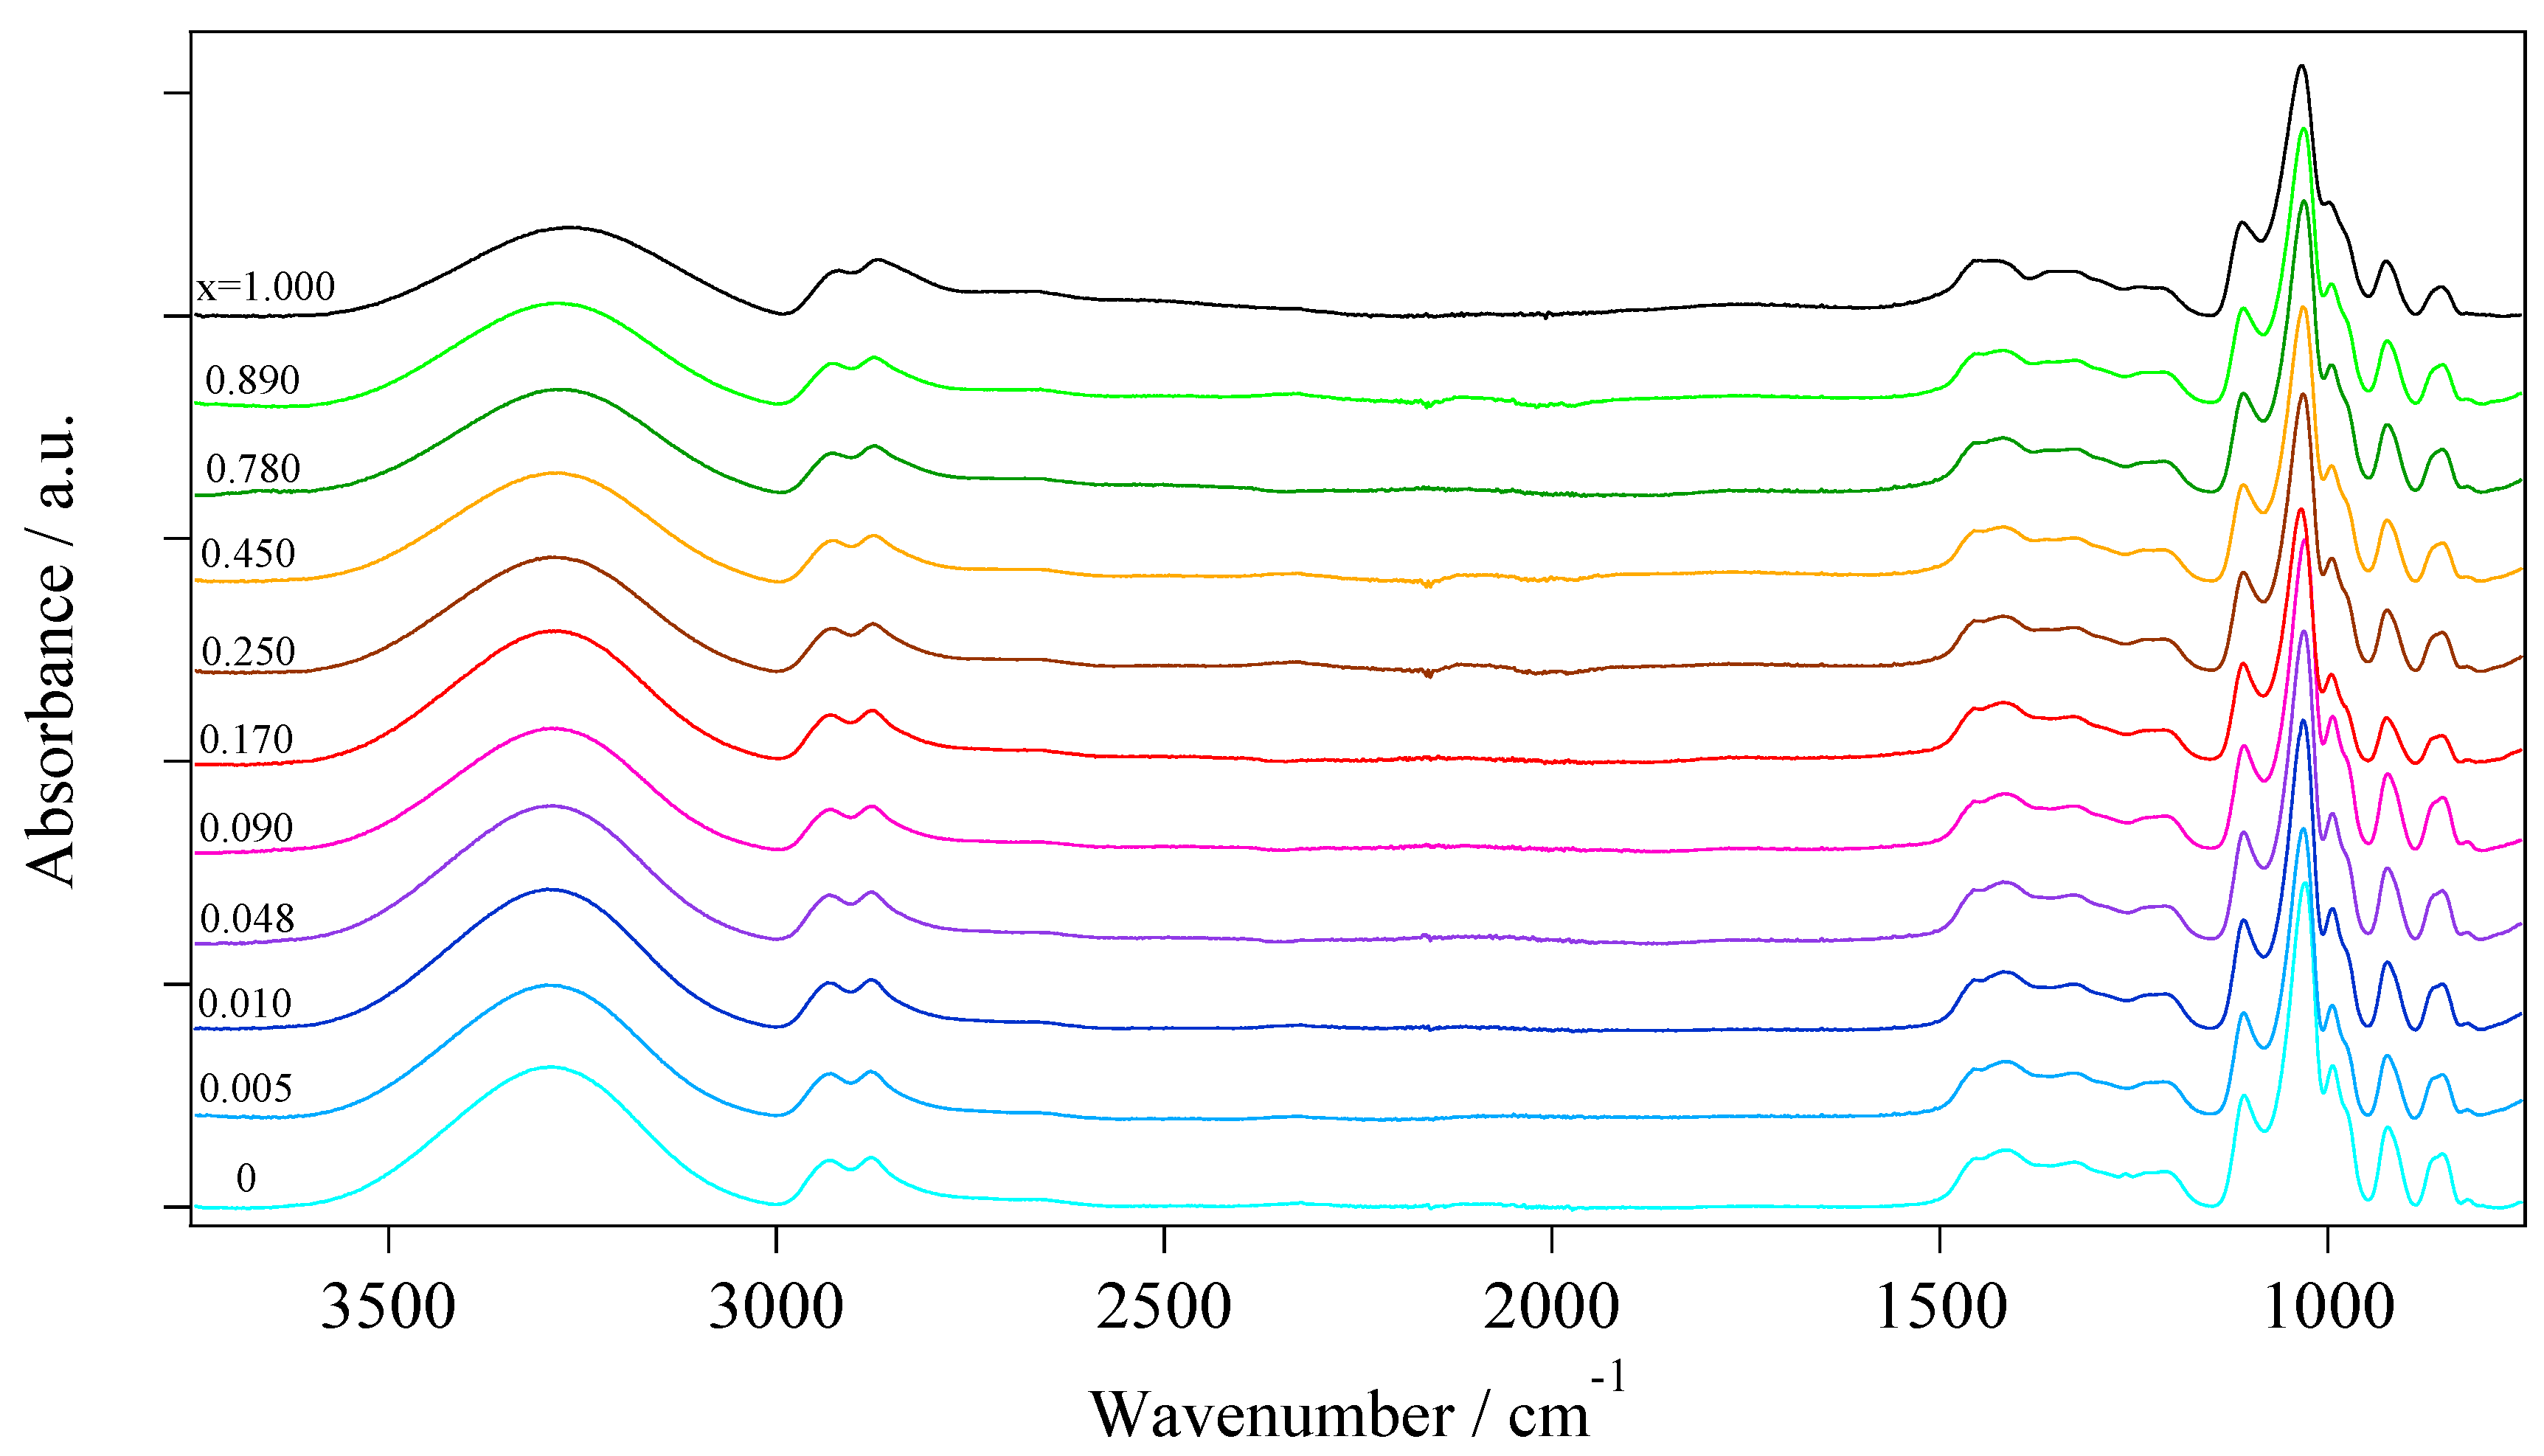
Vibrational spectroscopies are a useful tool to identify which of the coordination geometries represented in Figure 2 predominates at each concentration of Li+ in the different electrolytes. FT-IR spectra are presented in Figure 3.
The vibrational spectra can be divided into three different regions: (i) at wavenumbers higher than 3000 cm−1, the typical OH stretching vibrations (νOH) are observed [19,23,24]; (ii) in the wavenumber range 2700–3000 cm−1, the CH stretching vibrations (νCH) of the glycerol backbone are revealed [19,23,24]; (iii) finally, between 480 and 1500 cm−1, the CH2 scissoring (sr), OH in-plane bending (δip), CO stretching (νCO), CO bending (δCO), CC internal rotations (φCC), and CO rocking (ρCO) vibrations are detected [19,23,24,25,26]. Table 2 reports a complete correlative assignment of all the vibrational modes shown in Figure 3.
The OH stretching vibration centered at ca. 3300 cm−1 and the CO stretching vibrations of primary and secondary alcohols peaking in the range 1000–1100 cm−1 are the most affected by the different concentration of Li+. This is even more evident from the differential spectra reported in Figure S1 of Supplementary Materials, where the spectrum of pristine glycerol is subtracted from the spectrum of each sample to highlight the differences between Gly and the GlyLix electrolytes. It is observed that the ν(OH) vibration shifts to lower wavenumbers as the concentration of Li+ is raised; the intensity of the ν(OH) vibration is concurrently reduced. This trend is easily explained considering that the OH stretching vibrations are involved in the formation of hydrogen bonds, whose number decreases upon the addition of Li+ [27]. Furthermore, the downshift in wavenumber of ν(OH) is the result of a weakening of the hydrogen–oxygen bond strength in glycerol [27]. The second FT-IR peaks that are strongly affected by the concentration of Li+ are those centered at ca. 1034 and 1111 cm−1, which are attributed to the CO stretching of the g1 and g3 conformation geometries, respectively. It is observed that the intensities of both vibrations decrease as the Li+ content is raised. In particular, the latter decreases with a lower magnitude with respect to the former, indicating that, probably, the increase in the lithium content results in the stabilization of the g3 conformation geometry. These trends are plotted in Figure S2 of Supplementary Materials. In summary, the presence of Li+ destabilizes the typical conformation geometry of pristine glycerol, modifying the hydrogen–oxygen interactions.
Further insight into the glycerol conformation geometries at different concentrations of Li+ can be obtained by the Gaussian decomposition of the peaks in the 2500–3700 and 770–1150 cm−1 regions. For the sake of brevity, only the results obtained from pristine glycerol, Gly (x = 0), and lithium glycerolate, GlyLi (x = 1.000), are reported in Figure 4.
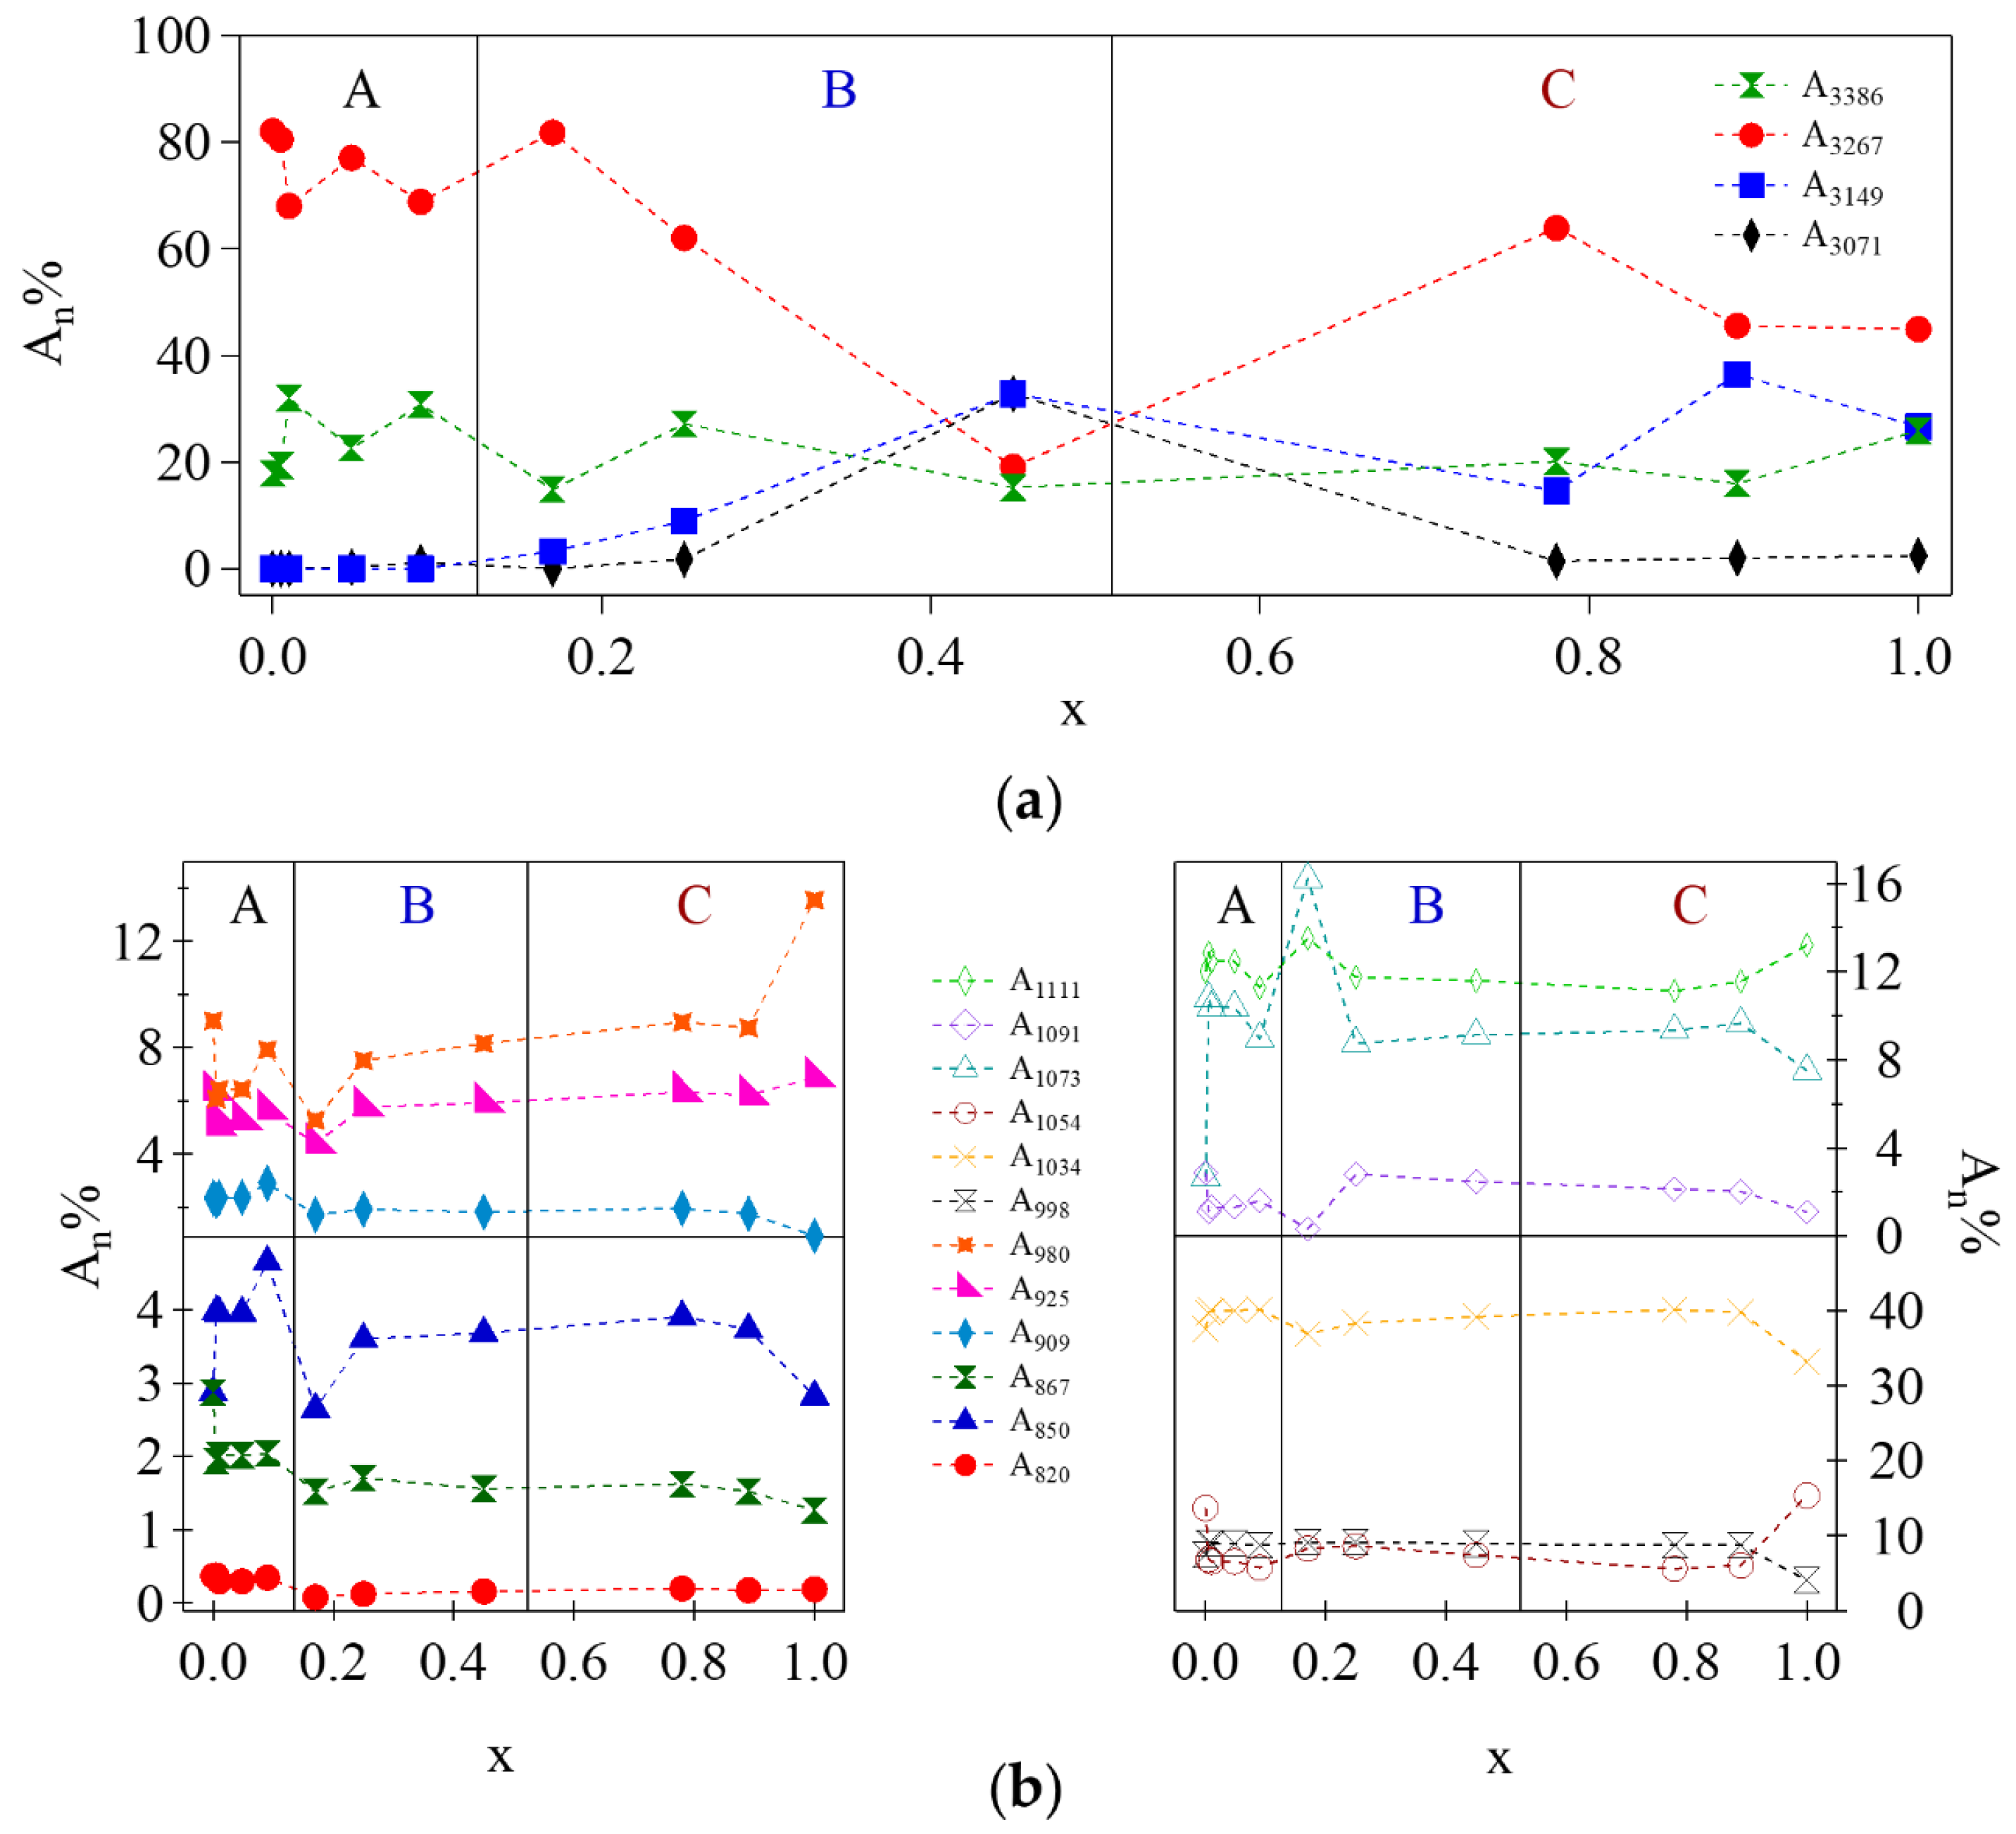
With respect to the spectrum of pristine glycerol (Figure 4a), the spectra of both GlyLi (Figure 4b) and GlyLix electrolytes with x ≥ 0.170 reveal two new peaks at ca. 3071 and 3149 cm−1. These latter peaks are attributed to the OH stretching vibrations of the g2 (Figure 2b,c) and g3 (Figure 2d) coordination geometries of the glycerol molecules, respectively. On the basis of the fitting results, a semiquantitative analysis is carried out based on the areas of the peaks centered at ca. 3386, 3267, 3149, and 3071 cm−1. The areal percentages are calculated following Equation (2):
where An% is the areal percentage of the peak n, An is the calculated area of the peak n, and the sum takes into consideration the areas of all the peaks centered at ca. 3386, 3267, 3149, and 3071 cm−1. Results are reported in Figure 5a.
On the basis of these results, the proposed electrolytes can be divided into three groups, depending on the concentration of Li+:
- Group A: At low concentrations of Li+ (0 ≤ x ≤ 0.090), the areal percentage of the peaks associated to νf(OH) (3386 cm−1) and νHy(OH) (3267 cm−1) varies by no more than 5%. In this group of electrolytes, A3149 and A3071, which are attributed respectively to the νg3Li(OH) and νg2Li(OH) modes, are equal to 0. This suggests that at low values of x, a large number of intra- and inter-molecular hydrogen bonds are present. The coordination geometry remains similar to that of pristine glycerol, i.e., g1 (Figure 2a). Indeed, g1 allows for a higher number of hydrogen bonds with respect to g2 and g3 coordination geometries.
- Group B: In the middle of the concentration range of Li+ (0.170 ≤ x ≤ 0.450), A3386 remains almost constant while A3267 is decreased by ca. 63%, indicating a lower number of hydrogen bonds. A3149 and A3071 appear in the spectra of these samples, reaching values of ca. 30%. The decrease in the number of hydrogen bonds is attributed to the increased number of oxygen atoms involved in the coordination of Li+, as confirmed by the increased intensities of the peaks attributed to the νg3Li(OH) and νg2Li(OH). In samples with 0.170 ≤ x ≤ 0.450, the predominant coordination geometries are g2.1 and g2.2 (Figure 2c,d) due to a lower number of hydrogen bonds and to the formation of lithium coordination by oxygen functionalities.
- Group C: In the high Li+ concentration range (0.780 ≤ x ≤ 1.000), A3386 remains almost constant, and A3267 goes back to medium values of areal percentage (up to 64%). Moreover, in this region the areas of νg3Li(OH) and νg2Li(OH) peaks begin to become clearly different, with the former larger than the latter. This evidence is easily explained if we consider that at x ≥ 0.780 the prevailing coordination geometry is g3. This allows for a higher number of hydrogen bonds with respect to g2; at the same time, a significant number of oxygen atoms is coordinating Li+.
Equation (2) is used also to evaluate the behavior of peak areas at different Li+ concentrations in the range 770–1150 cm−1; the results are reported in Figure 5b. The most interesting peaks to study the different coordination geometries assumed by the glycerol molecules are those centered at ca. 1034, 1054, 1073, 1091, and 1111 cm−1, attributed to νg1,pri(C–C–O), νg3,pri(C–C–O), νg2,sec(C–C–O), νg1,sec(C–C–O), and νg3,sec(C–C–O), respectively.
- Group A: At low concentrations of Li+ (0 ≤ x ≤ 0.090), the νg1,pri(C–C–O) vibration dominates the spectra, indicating that the majority of Li+ is coordinated by the oxygen functionalities of primary alcohols in the g1 coordination geometry.
- Group B: In the middle of the concentration range of Li+ (0.170 ≤ x ≤ 0.450), we observe a decrease in the area of the peak attributed to νg1,pri(C–C–O) vibration, concurrently with a significant increase of both A1073 (here the effect is significant) and A1111 (here the effect is visible, but less pronounced). Indeed, in this region the main coordination geometries assumed by glycerol molecules are g2.1 and g2.2, with secondary alcohol hydroxyl groups coordinating Li+.
- Group C: Finally, at a high concentration of Li+ (0.780 ≤ x ≤ 1.000), the areas of the peaks attributed to νg1,pri(C–C–O), νg3,pri(C–C–O), and νg3,sec(C–C–O) increase. On the contrary, the areas of the peaks associated to νg2,sec(C–C–O) and νg1,sec(C–C–O) show a minimum for x = 1.000. This demonstrates that at a high concentration of Li+ the dominating coordination geometry for glycerol molecules is g3.
The results obtained from the fitting of the 2500–3700 cm−1 region are in accordance with those obtained from the analysis of the spectra in the 770–1150 cm−1 range. Table 3 summarizes the different coordination geometries assumed by the glycerol molecules as a function of x.
2.2.3. Micro-Raman Spectroscopy
With respect to FT-IR, micro-Raman spectroscopy measurements are more sensitive to CH vibrational modes. Thus, the decomposition of the micro-Raman spectra reported in Figure 6 yields additional information on the coordination geometries taken by glycerol as a function of the concentration of Li+.
The Lorentzian fitting of the spectra of pristine glycerol in the 2600–3100 cm−1 range and the areal behavior of the peaks as a function of x are reported in Figures S3 and S4 of the Supplementary Materials. In accordance with FT-IR results, in micro-Raman spectra the electrolytes are clearly divided into three different groups, depending on the concentration of Li+:
- Group A: At low concentrations of Li+ (0 ≤ x ≤ 0.090), A2945, attributed to the νg1,a(CH) vibration, has the highest value among all the other peaks. Again, it is confirmed that at these concentrations of Li+ the predominant coordination geometry taken by glycerol molecules is g1.
- Group B: In the middle of the concentration range of Li+ (0.170 ≤ x ≤ 0.450), it appears that the area attributed to the CH stretching of g1 conformation decreases, while the highest increase is observed for A2966 and A2909. The latter are attributed to νg2,a(CH) and νg2,s(CH), respectively, with a maximum at x = 0.250. In this concentration region, glycerol molecules prefer g2.1 and g2.2 coordination geometries.
- Group C: Finally, at a high concentration of Li+ (0.780 ≤ x ≤ 1.000), a further decrease of the area attributed to νg1,a(CH) vibration is observed. Differently from Group B, a significant increase of A2831 is observed, attributed to νg3,s(CH). This indicates that in this concentration range of Li+, the number of glycerol molecules taking g3 coordination geometry is increased.
In summary, FT-IR analysis is useful to studying how OH and CO stretching vibrations are affected by the different concentrations of Li+. On the other hand, micro-Raman spectroscopy allows us to evaluate the changes in coordination geometry, studying the CH stretching modifications. A clear division into three groups of samples with a different concentrations of Li+ observed: at low Li+ content (x ≤ 0.090), glycerol molecules prefer the g1 coordination geometry (Figure 2a), while at medium concentrations of Li+ (0.170 ≤ x ≤ 0.450), the prevalent coordination geometry is g2 (Figure 2b,c). Finally, at high lithium content (x ≥ 0.780), g3 (Figure 2d) is the most probable conformation for glycerol molecules.
2.3. Thermal Studies
2.3.1. Thermo-Gravimetric Analysis (TGA)
Thermo-gravimetric analyses allow for the determination of the thermal stability of the proposed GlyLix electrolytes, and for evaluation of the effects of the presence of Li+ on the decomposition temperature. Results are reported in Figure 7a and Table 3.
In accordance with the literature, pristine glycerol shows the highest thermal stability among all the samples, with a decomposition temperature (Tdec.) of 195.09 °C and no residual weight [28]. When lithium is added, a high-temperature residue appears, the magnitude of which increases as the lithium content is raised. This evidence is interpreted as admitting that the high-temperature residue consists of lithium oxide, which is formed at high temperatures. Li2O can be formed under nitrogen atmosphere due to the decomposition of the glycerol matrix. The trend of the decomposition temperatures as a function of x reflects the division into the three groups of electrolytes also revealed by the vibrational spectroscopies (see Table 3). In Group A, all the samples are characterized by a decomposition temperature that is similar to that of pristine glycerol. When x reaches 0.170, a drop of more than 16 °C in the thermal stability is observed. In Group C, Tdec. increases again to high values. On the basis of these results, it is deduced that (i) the introduction of Li+ lowers the thermal stability of the electrolytes, promoting the decomposition of glycerol, and (ii) the thermal stability of the electrolytes is correlated to the coordination geometry assumed by the glycerol molecules. Indeed, a decrease in the decomposition temperature of GlyLix could be ascribed to the reduction of the number of hydrogen bonds [29].
2.3.2. Modulated Differential Scanning Calorimetry (MDSC) Studies
Figure 7b shows the MDSC results of the synthetized materials. In all the samples, the presence of two different contributions is observed; these are easily decoupled thanks to the modulated option of the DSC instrument. The separation of reversible and nonreversible heat flow components for pristine glycerol (x = 0) and GlyLi (x = 1.000) are reported in Figure S5 of the Supplementary Materials. The reversible contribution is attributed to the glass transition (Tg) of the glycerol matrix, while the nonreversible component is due to an enthalpic relaxation (ΔHer) associated to Tg. MDSC measurements reveal that with increasing lithium content (x), the Tg of the materials increases (see Table 3), with a difference of more than 35 °C between pristine glycerol (Tg = −78.51 °C, similar to that reported in the literature [30]) and GlyLi (Tg = −42.95 °C). This indicates that Li+, coordinated by glycerol molecules, is able to create a coordination network that increases the energy needed for the structural reorganization of the electrolyte at Tg. The enthalpic relaxation value calculated for pristine glycerol, −2.476 J∙g−1, is in accordance with the literature [31]. All the electrolytes exhibit a negative value of ΔHer (see Table 3), indicating that the transition is endothermic. It is also observed that the coordination geometries assumed by the glycerol molecules influence the enthalpy associated with the glass transition. In Group A, the high number of hydrogen bonds keeps the enthalpy low. As the content of Li+ is increased (Group B), the number of hydrogen bonds is reduced. Correspondingly, ΔHer values are raised. Finally, in Group C, the negative trend of ΔHer as x is raised is explained by the formation of several tetrahedral coordination geometries due to the presence of a high concentration of Li+.
2.4. Broadband Electrical Spectroscopy
The electric response of the electrolytes in terms of polarization and relaxation phenomena is investigated by BES. These measurements are useful to studying the interplay between the structure, relaxations, and conduction mechanism of the proposed electrolytes as a function of the concentration of Li+. Measurements are carried out between −130 and 150 °C, in the 10−1–107 Hz frequency range. The spectra of the complex permittivity versus temperature and frequency are fitted with the following empirical equation [32]:
where ε*(ω) = ε′(ω) − iε″(ω) (σ*(ω) = iωε*(ω)). The first term of Equation (3) is attributed to the conductivity of the electrolyte at zero frequency (this is the residual conductivity of the sample). ε∞ accounts for the permittivity of the electrolyte at infinite frequency (electronic contribution). The second term is associated with the electrode (k = 1) and interdomain (k ≥ 2) polarization phenomena. τk and σk are the relaxation times and the conductivity, respectively, associated with the kth polarization. γk is a pre-exponential factor that varies from 0.5 to 1.0. The third term, attributed to the dielectric relaxation, is described by the Havriliak–Negami theory [32,33]. Δε, τj, αj, and βj correspond to the dielectric strength, relaxation time, and symmetric and antisymmetric shape parameters of the jth relaxation event, respectively.
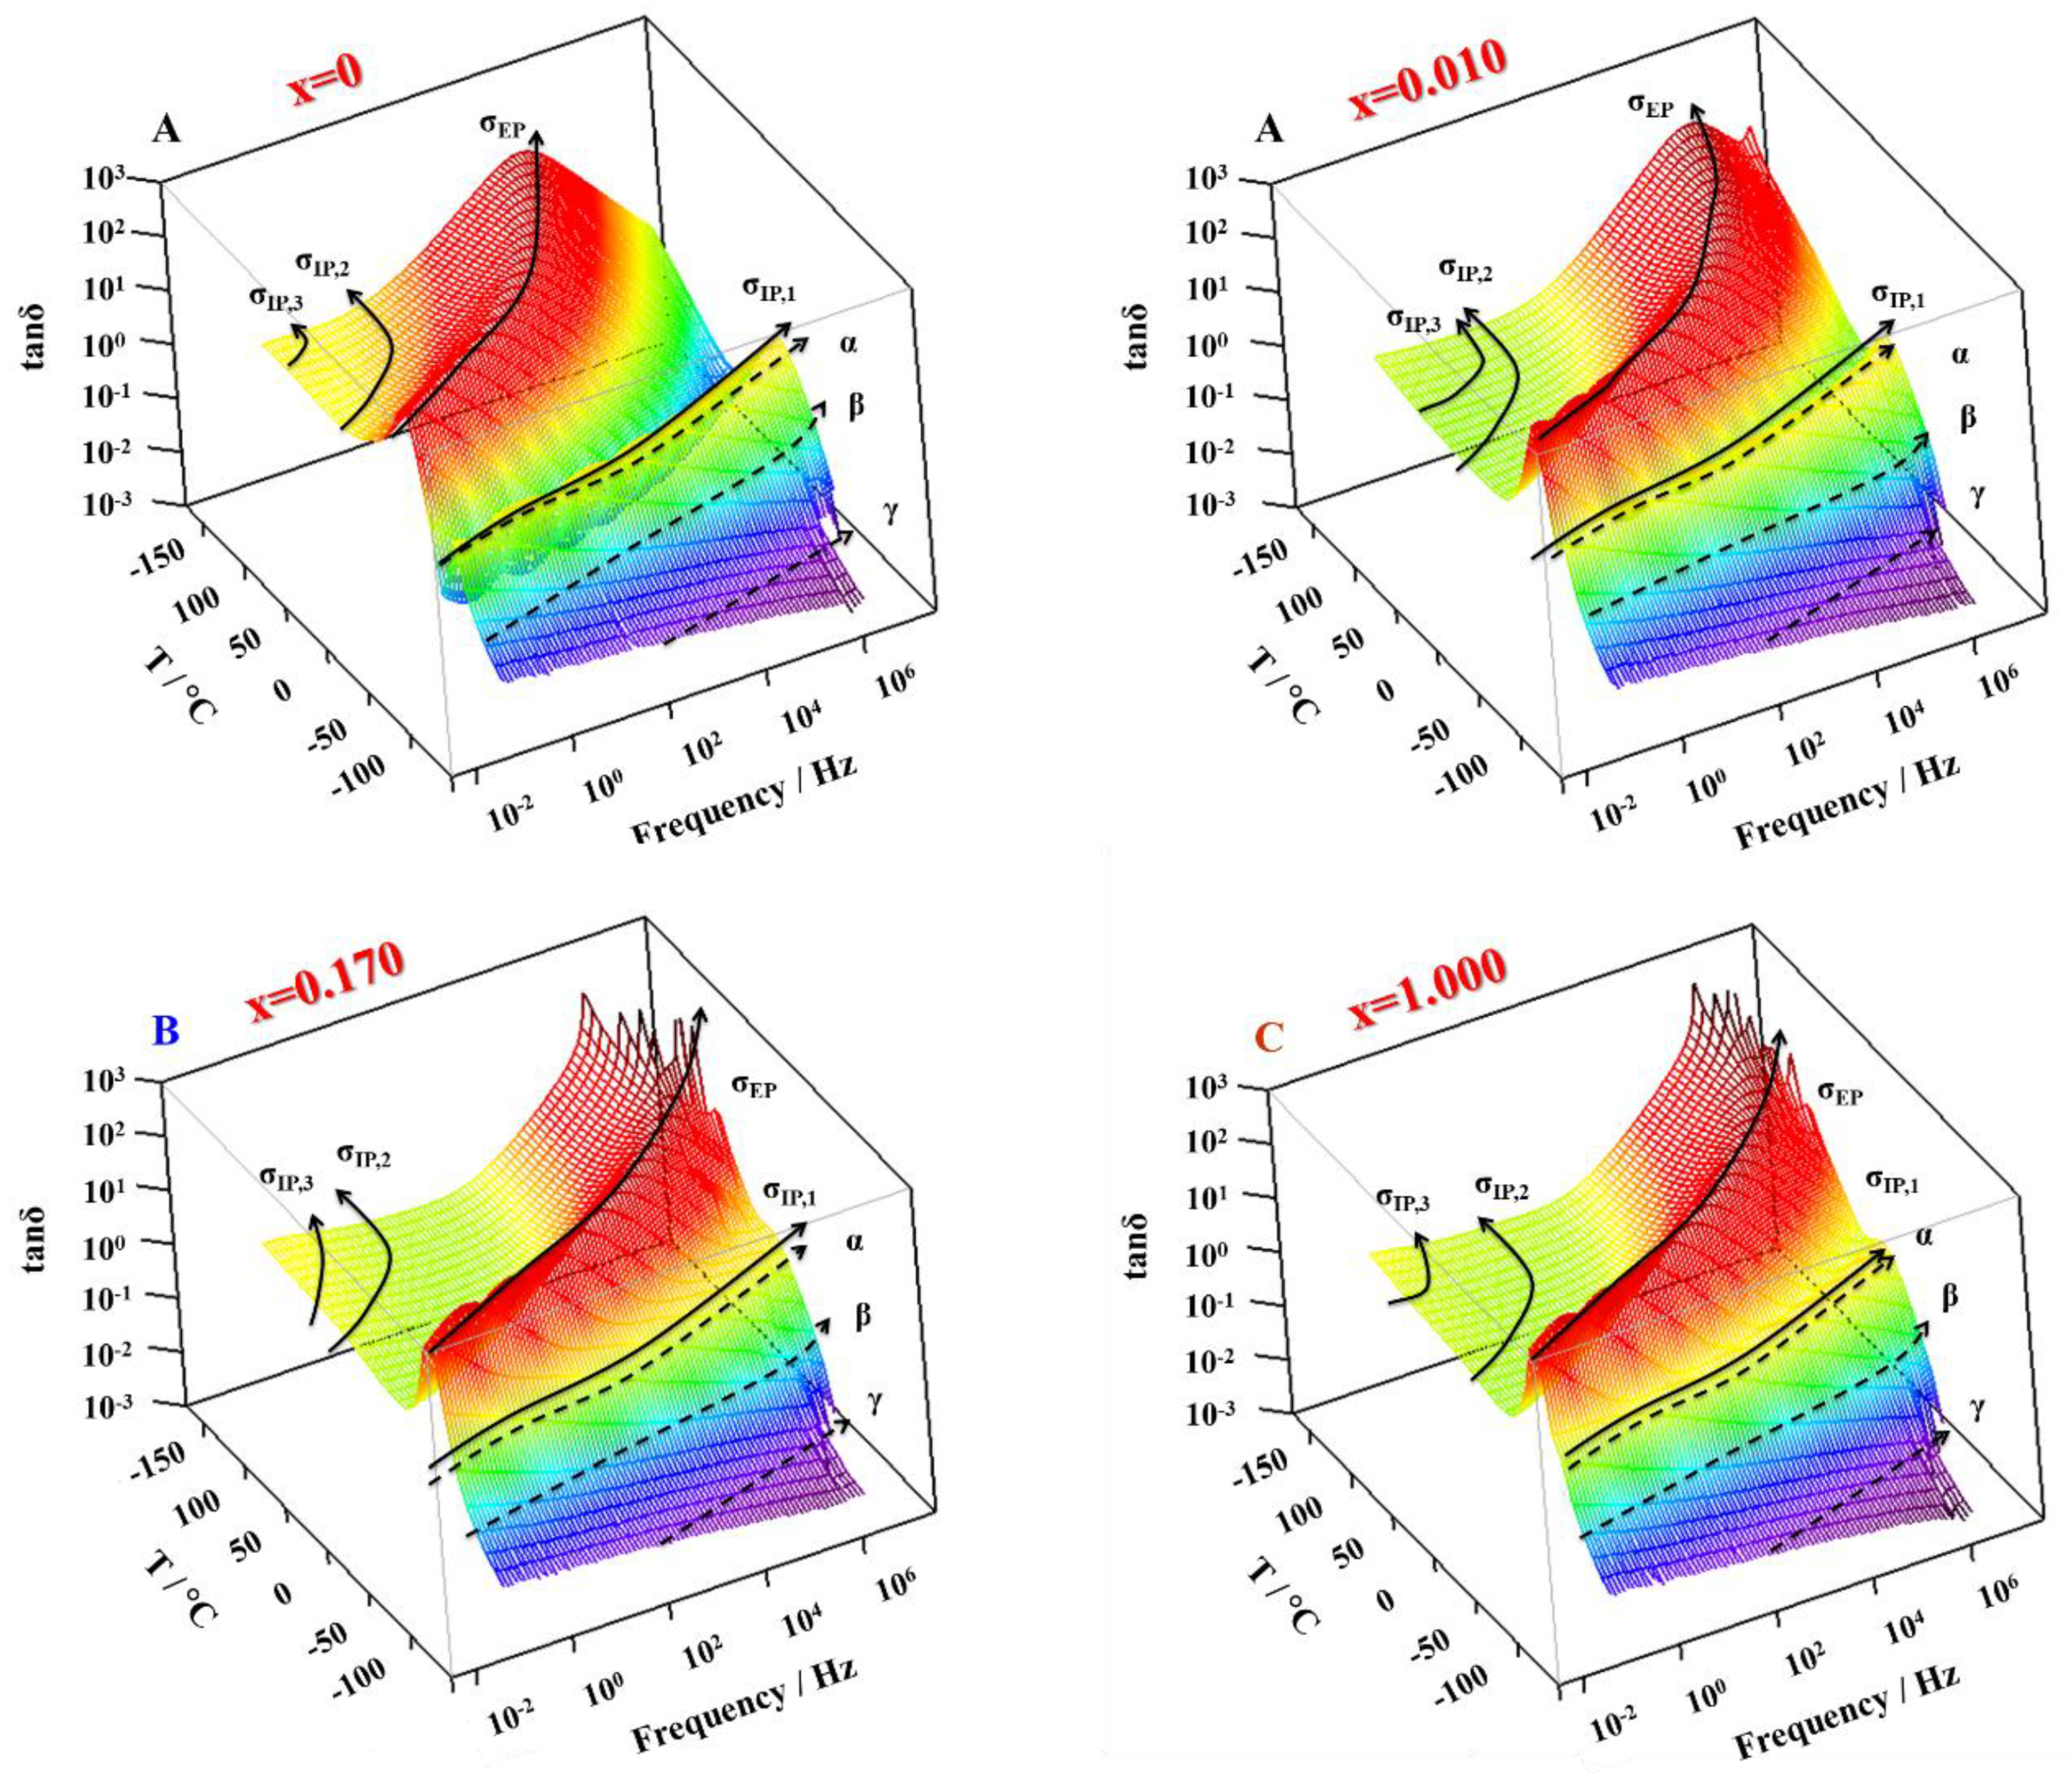
The 3D tanδ (tanδ = ε″/ε′) profiles are adopted to identify the polarization and relaxation phenomena occurring in the electrolytes. The 3D tanδ profiles of four samples—GlyLix with x = 0, 0.010, 0.170, and 1.000, belonging to the three groups of electrolytes A, B, and C—are reported in Figure 8. The 3D tanδ profiles of the other electrolytes are found in Figure S6 of Supplementary Materials.
2.4.1. Polarization Phenomena
Four different polarization phenomena are observed: (i) the electrode polarization event (σEP), which is observed at temperatures higher than −60 °C and corresponds to the accumulation of charge at the interface between the sample and the platinum blocking electrodes; and (ii) three different interdomain polarizations at temperatures ranging between −70 and 10 °C (σIP,1), between 0 and 150 °C (σIP,2), and above 60 °C (σIP,3). These polarizations are attributed to the accumulation of charge at the interface between domains with different permittivity. The presence of these latter polarization phenomena (σIP) indicates that the electrolytes are heterogeneous at the mesoscale and glycerol molecules tend to aggregate, forming nano-domains.
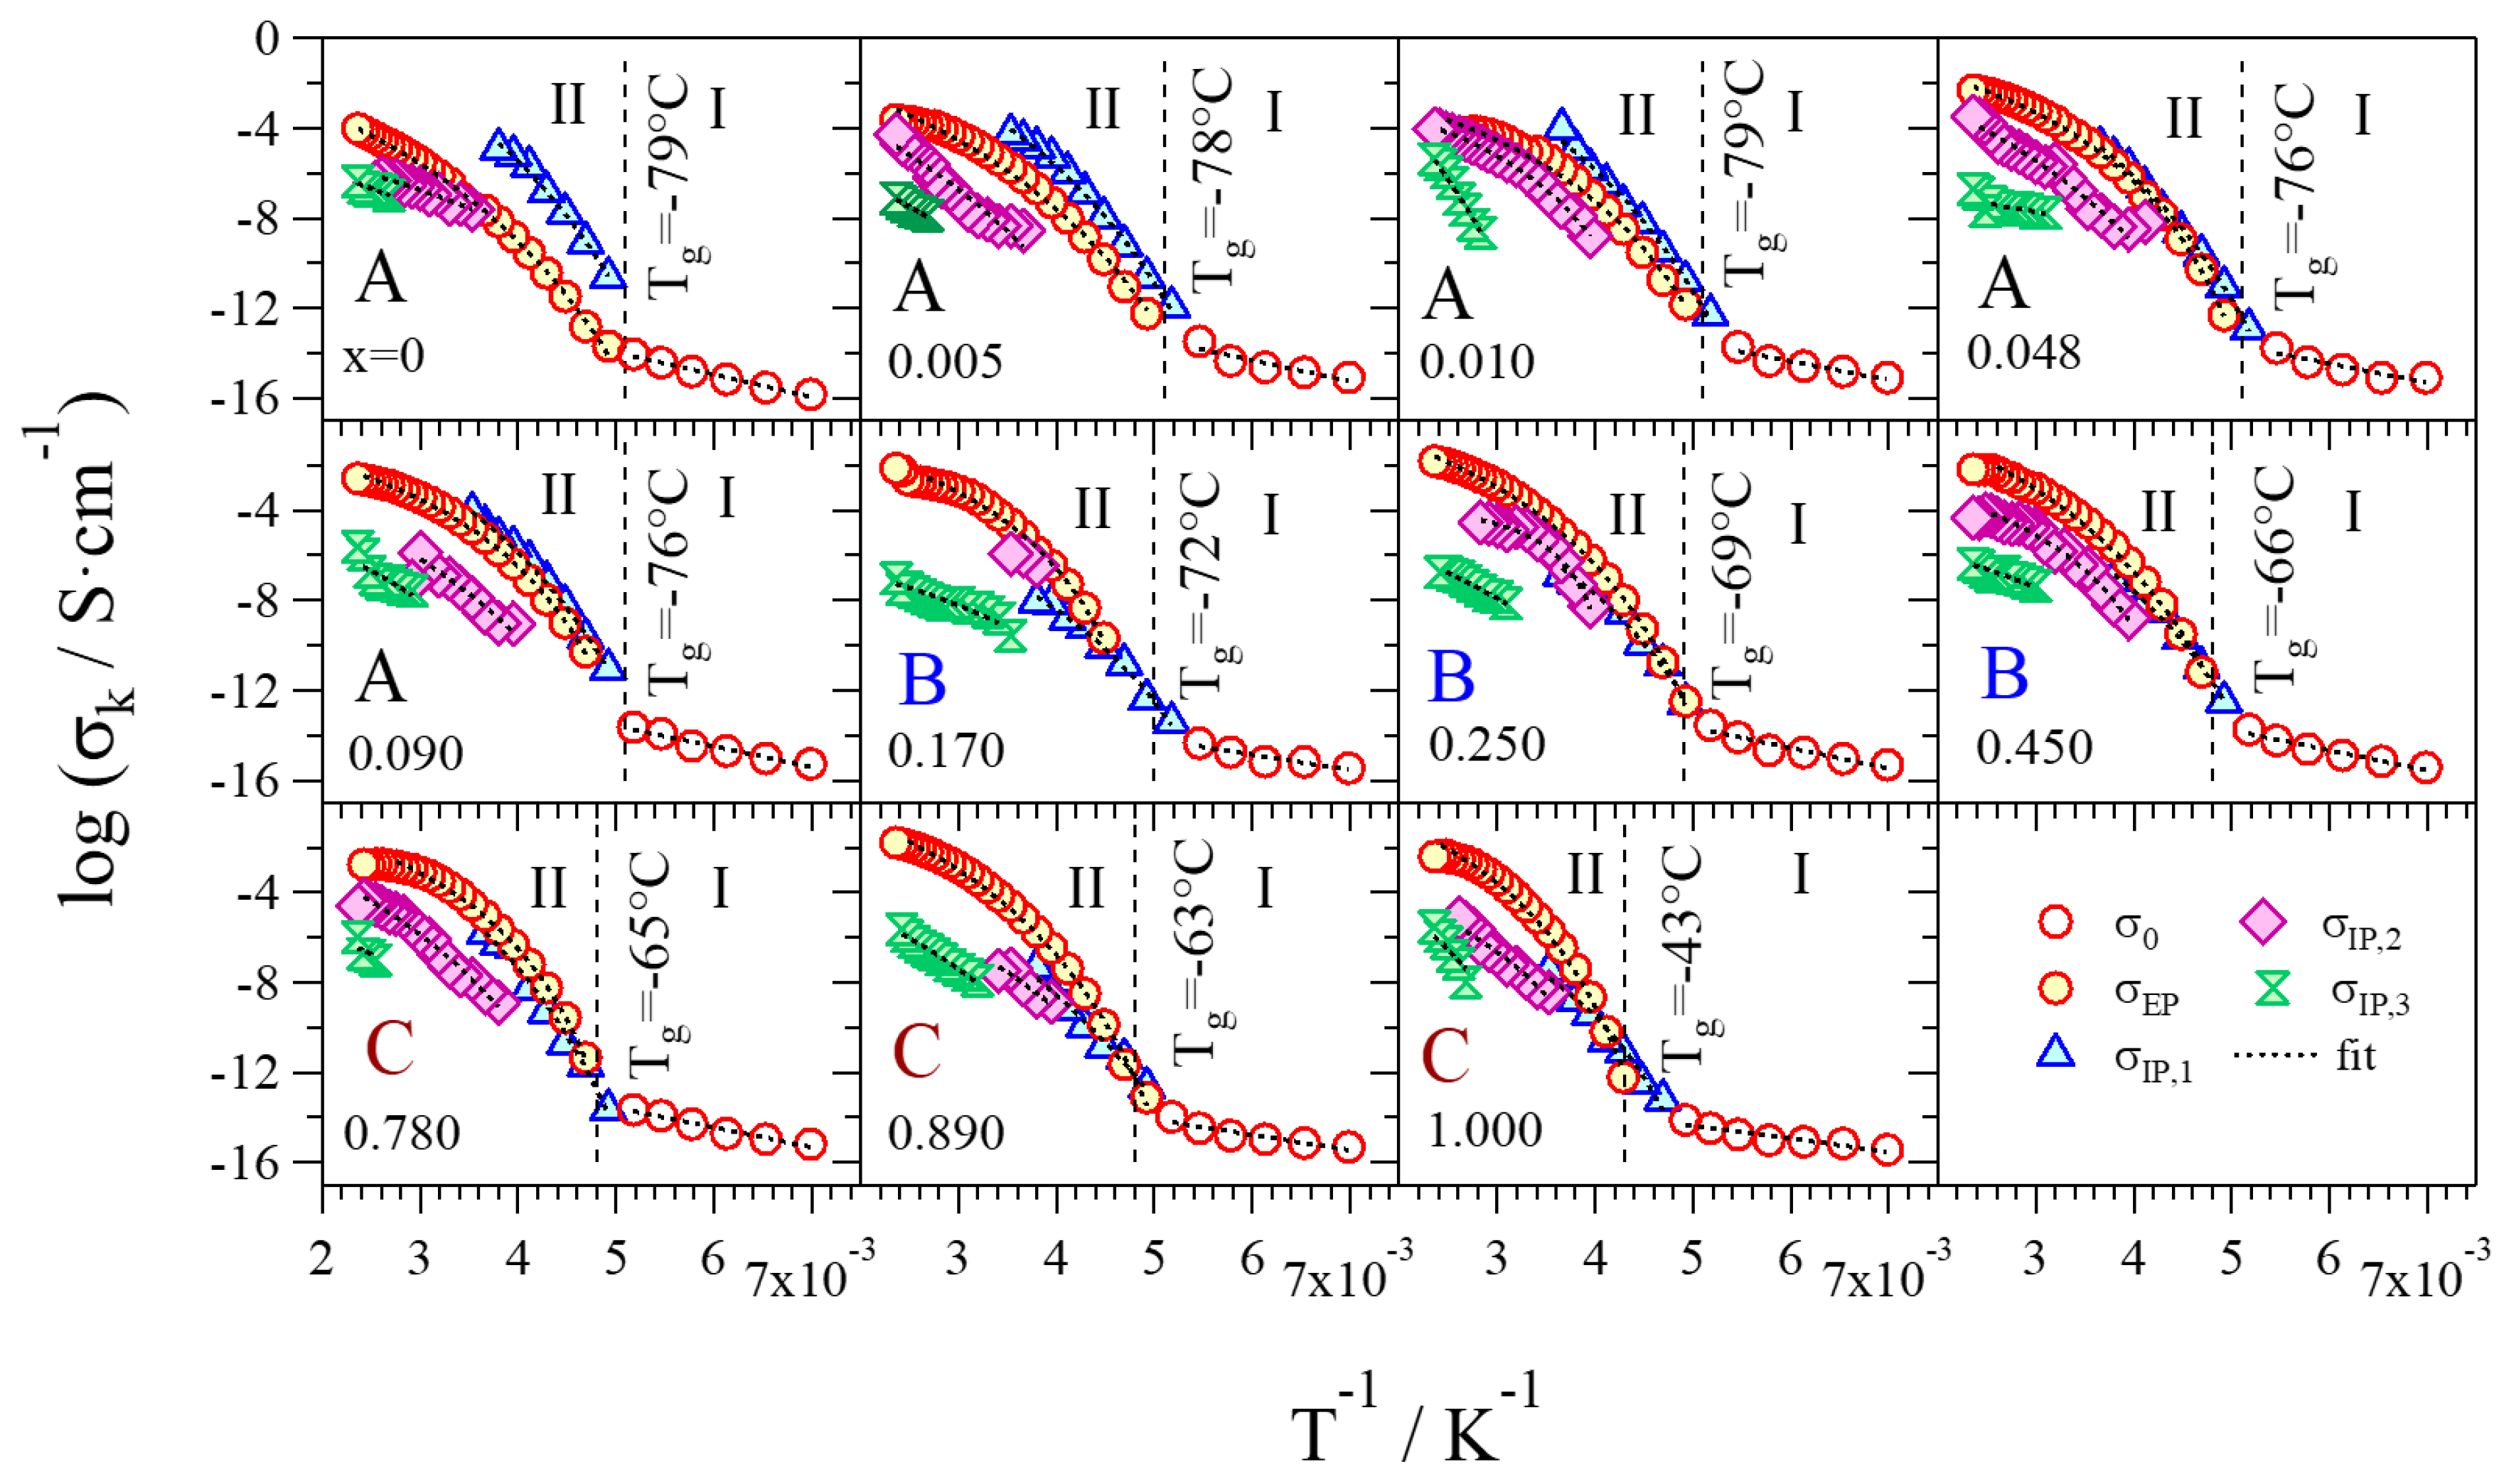
The conductivity values of each polarization, obtained from the fitting parameter associated to all the observed events, are plotted versus T−1. Each curve is fitted with a suitable model, i.e., Vogel–Tammann–Fulcher (VTF) [34] or Arrhenius (A) equation [32]. Results are shown in Figure 9.
At temperatures lower than the Tg, i.e. ca. −60 °C (Region I), the only contribution to the overall conductivity is provided by σ0 and follows an Arrhenius behavior. This evidence witnesses that in this temperature region, charge migration occurs through hopping events between different domains. At temperatures higher than Tg (Region II), all σk reveal a VTF-like behavior, indicating that the conduction mechanism is assisted by the segmental motion of the cluster aggregates. The overall conduction is the sum of the single conductivities of each polarization occurring in the electrolyte (see Equation (4)) [8]:
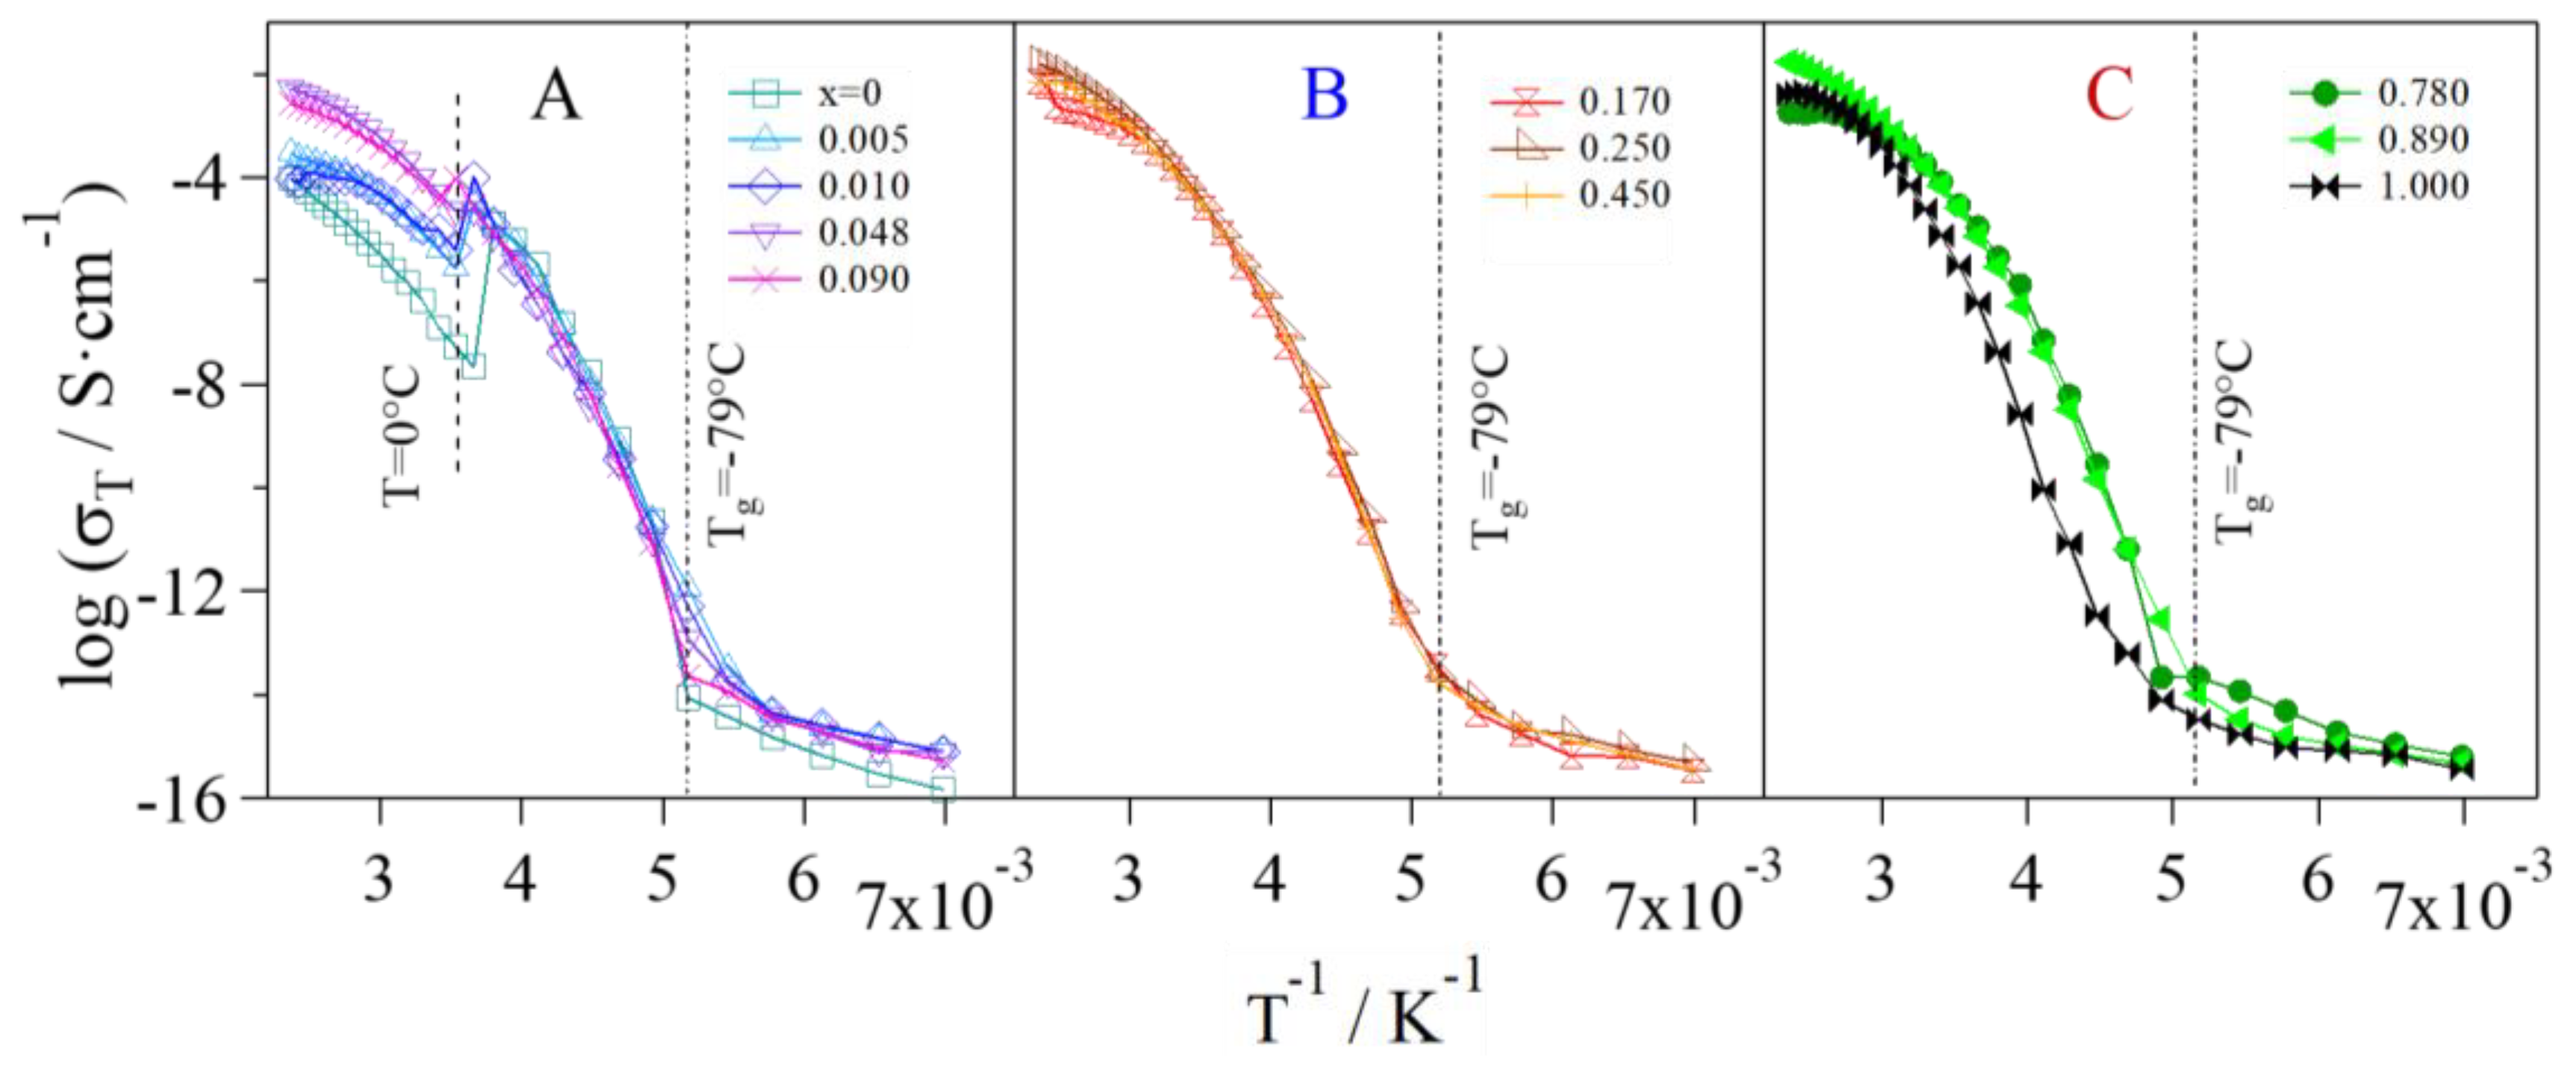
Figure 10 shows the logarithm of the overall conductivity as a function of T−1; the GlyLix samples are divided into the three groups described in Section 2.2.2 on the basis of the concentration of Li+.
- Group A: Pristine glycerol and electrolytes with a low content of Li+ (x ≤ 0.090) show the lowest values of overall conductivity. At low concentrations of Li+, glycerol molecules are in the αα conformation and coordinate Li+ through the g1 geometry, where the highest number of intra- and inter-molecular hydrogen bonds is achieved. Thus, the presence of these interactions gives rise to glycerol structures that hinder the migration of Li+. Furthermore, a low concentration of charge carriers decreases the overall conductivity. In Group A, a conductivity drop is observed at ca. 0 °C, even if MDSC measurements do not reveal any thermal transition. This phenomenon can be explained by considering that, at these concentrations of Li+ and in this particular temperature range (Tg ≤ T ≤ 0 °C), the structure assumed by the glycerol molecules facilitates the σIP,1 polarization, making it the component providing the highest contribution to the overall conductivity (Figure 9) and perturbing the log σT vs T−1 curve behavior. This effect decreases as the content of Li+ is increased. At temperatures higher than 0 °C, the main contribution to the overall conductivity is mostly provided by the electrode polarization.
- Group B: In this concentration region the highest values of overall conductivity are reached. In particular, GlyLi0.250 shows the highest lithium single-ion room temperature conductivity value, i.e., 1.99 × 10⁻⁴ at 30 °C. This value is in line with those present in the literature for lithium-ion-conducting polymer electrolytes. This makes the proposed electrolytes extremely interesting for application in Li-ion batteries [19,35]. Furthermore, this electrolyte is characterized by (i) an impressive high-temperature conductivity of 1.55 × 10⁻² S∙cm−1 at 150 °C; and (ii) a significant low-temperature conductivity, that is higher than 10−6 S∙cm−1 at −10 °C, thanks to the glass-forming behavior of the glycerol matrix. In this concentration range of Li+, the g2 conformation geometry assumed by glycerol molecules does not facilitate the σIP,1 polarization. Indeed, (i) the conductivity of this event strongly decreases; (ii) σEP becomes the most contributing component to the overall conductivity at T > Tg; and (iii) the conductivity drop at 0 °C is no longer detected.
- Group C: Similar to Group B, the electrolytes belonging to this concentration region demonstrate high values of room temperature conductivity (σT > 10−4 S∙cm−1). Nevertheless, GlyLi shows a decrease in conductivity, especially in the Tg ≤ T ≤ 30 °C temperature range. This is probably the result of three concurring effects: (i) as already demonstrated by MDSC measurements, the introduction of a high number of Li+ ions makes the structure of the glycerol host more rigid, hindering the migration process of Li+; (ii) the g3 conformation geometry, which is assumed by glycerol molecules in this concentration region, strongly decreases the σIP,1 polarization contribution and thus lowers the overall conductivity; and (iii) the presence of a huge number of Li+ ions increases the probability to entrap lithium ions into the tetrahedral coordination structures of the glycerol molecules.
In summary, at temperatures lower than the Tg (i.e., ca. −60 °C), the only contribution to the overall conductivity is provided by σ0, and Li+ are exchanged with a hopping process. At high temperatures (T > 10 °C), σEP mainly contributes to the overall conductivity and the migration of Li+ is assisted by the segmental motions of the glycerol aggregates. Finally, at medium temperatures (Tg ≤ T ≤ 10 °C) and at a low concentration of Li+ (x ≤ 0.090), the main contribution to the overall conductivity is given by σIP,1. The σIP,1 contribution decreases as the content of Li+ is raised, while σEP becomes more and more intense, thus providing the largest contribution to the overall conductivity.
2.4.2. Relaxation Events
At temperatures lower than 10 °C, three different dielectric relaxation events are observed, belonging to glycerol and GlyLix samples (Figure 8 and Figure S6): the relaxation that appears at high frequency (>102 Hz) and at temperatures lower than −70 °C is attributed to a γ dielectric relaxation, and it is associated to the rapid local fluctuations of the dipole moments of glycerol hydroxyl terminal functionalities (Figure S7 of the Supplementary Materials) [36]; at lower frequencies with respect to γ, and in the temperature range between −100 and −20 °C, one β dielectric relaxation is observed. This relaxation is attributed to an internal modification in the molecular conformation of glycerol, and it is typically referred to as a “β mode of glass-forming materials” [37,38]. In particular, it is attributed to the local fluctuations of the dipole moments of glycerol molecules that are coordinating protons or lithium cations through the hydrogen bonds (see Figure S7 of the Supplementary Materials) [8]. Finally, the relaxation that is observed at the lowest values of the frequency and at temperatures up to 30 °C is assigned to an α dielectric relaxation mode. This type of relaxation is a dynamic process involving the diffusion of conformational states along the polymer chains and aggregates, and it is known as a “segmental motion” (Figure S7) [37].
The dielectric relaxation frequency (fj) and dielectric strength (Δεj) values, obtained from the fitting of the 3D surfaces of Figure 8 and Figure S6 using Equation (3), are plotted as a function of temperature (T−1) and reported in Figure 11 and Figure S8 of the Supplementary Materials, respectively. All the curves present in Figure 11 are fitted with Vogel–Tammann–Fulcher–Hesse (VTFH) or Arrhenius-like equations.
For all the samples, the α dielectric relaxation is observed in both Region I, where it follows an Arrhenius-like behavior, and Region II, where a VTFH behavior is detected. Thus, only at high temperatures (Region II) is this relaxation assisting the long-range migration of Li+ through the segmental motions of the glycerol aggregates. It is also observed that, at temperatures higher than the Tg, Δεα is the only dielectric strength that gets values higher than 10 (Figure S8), indicating a lower interaction between α dipole moments [19]. As elsewhere described [32], β relaxation shows an Arrhenius-like behavior in the whole temperature range, indicating that it is responsible for the migration of Li+ through hopping events between different glycerol molecules. The dielectric strength of the β relaxation is lower than that of the α event. Finally, the γ dielectric relaxation mode is present only at T < Tg, and it shows an Arrhenius-like dependence on T−1, similarly to β. The corresponding dielectric strength (Δεγ) reaches the lowest values among all the relaxations.
2.4.3. Activation Energies
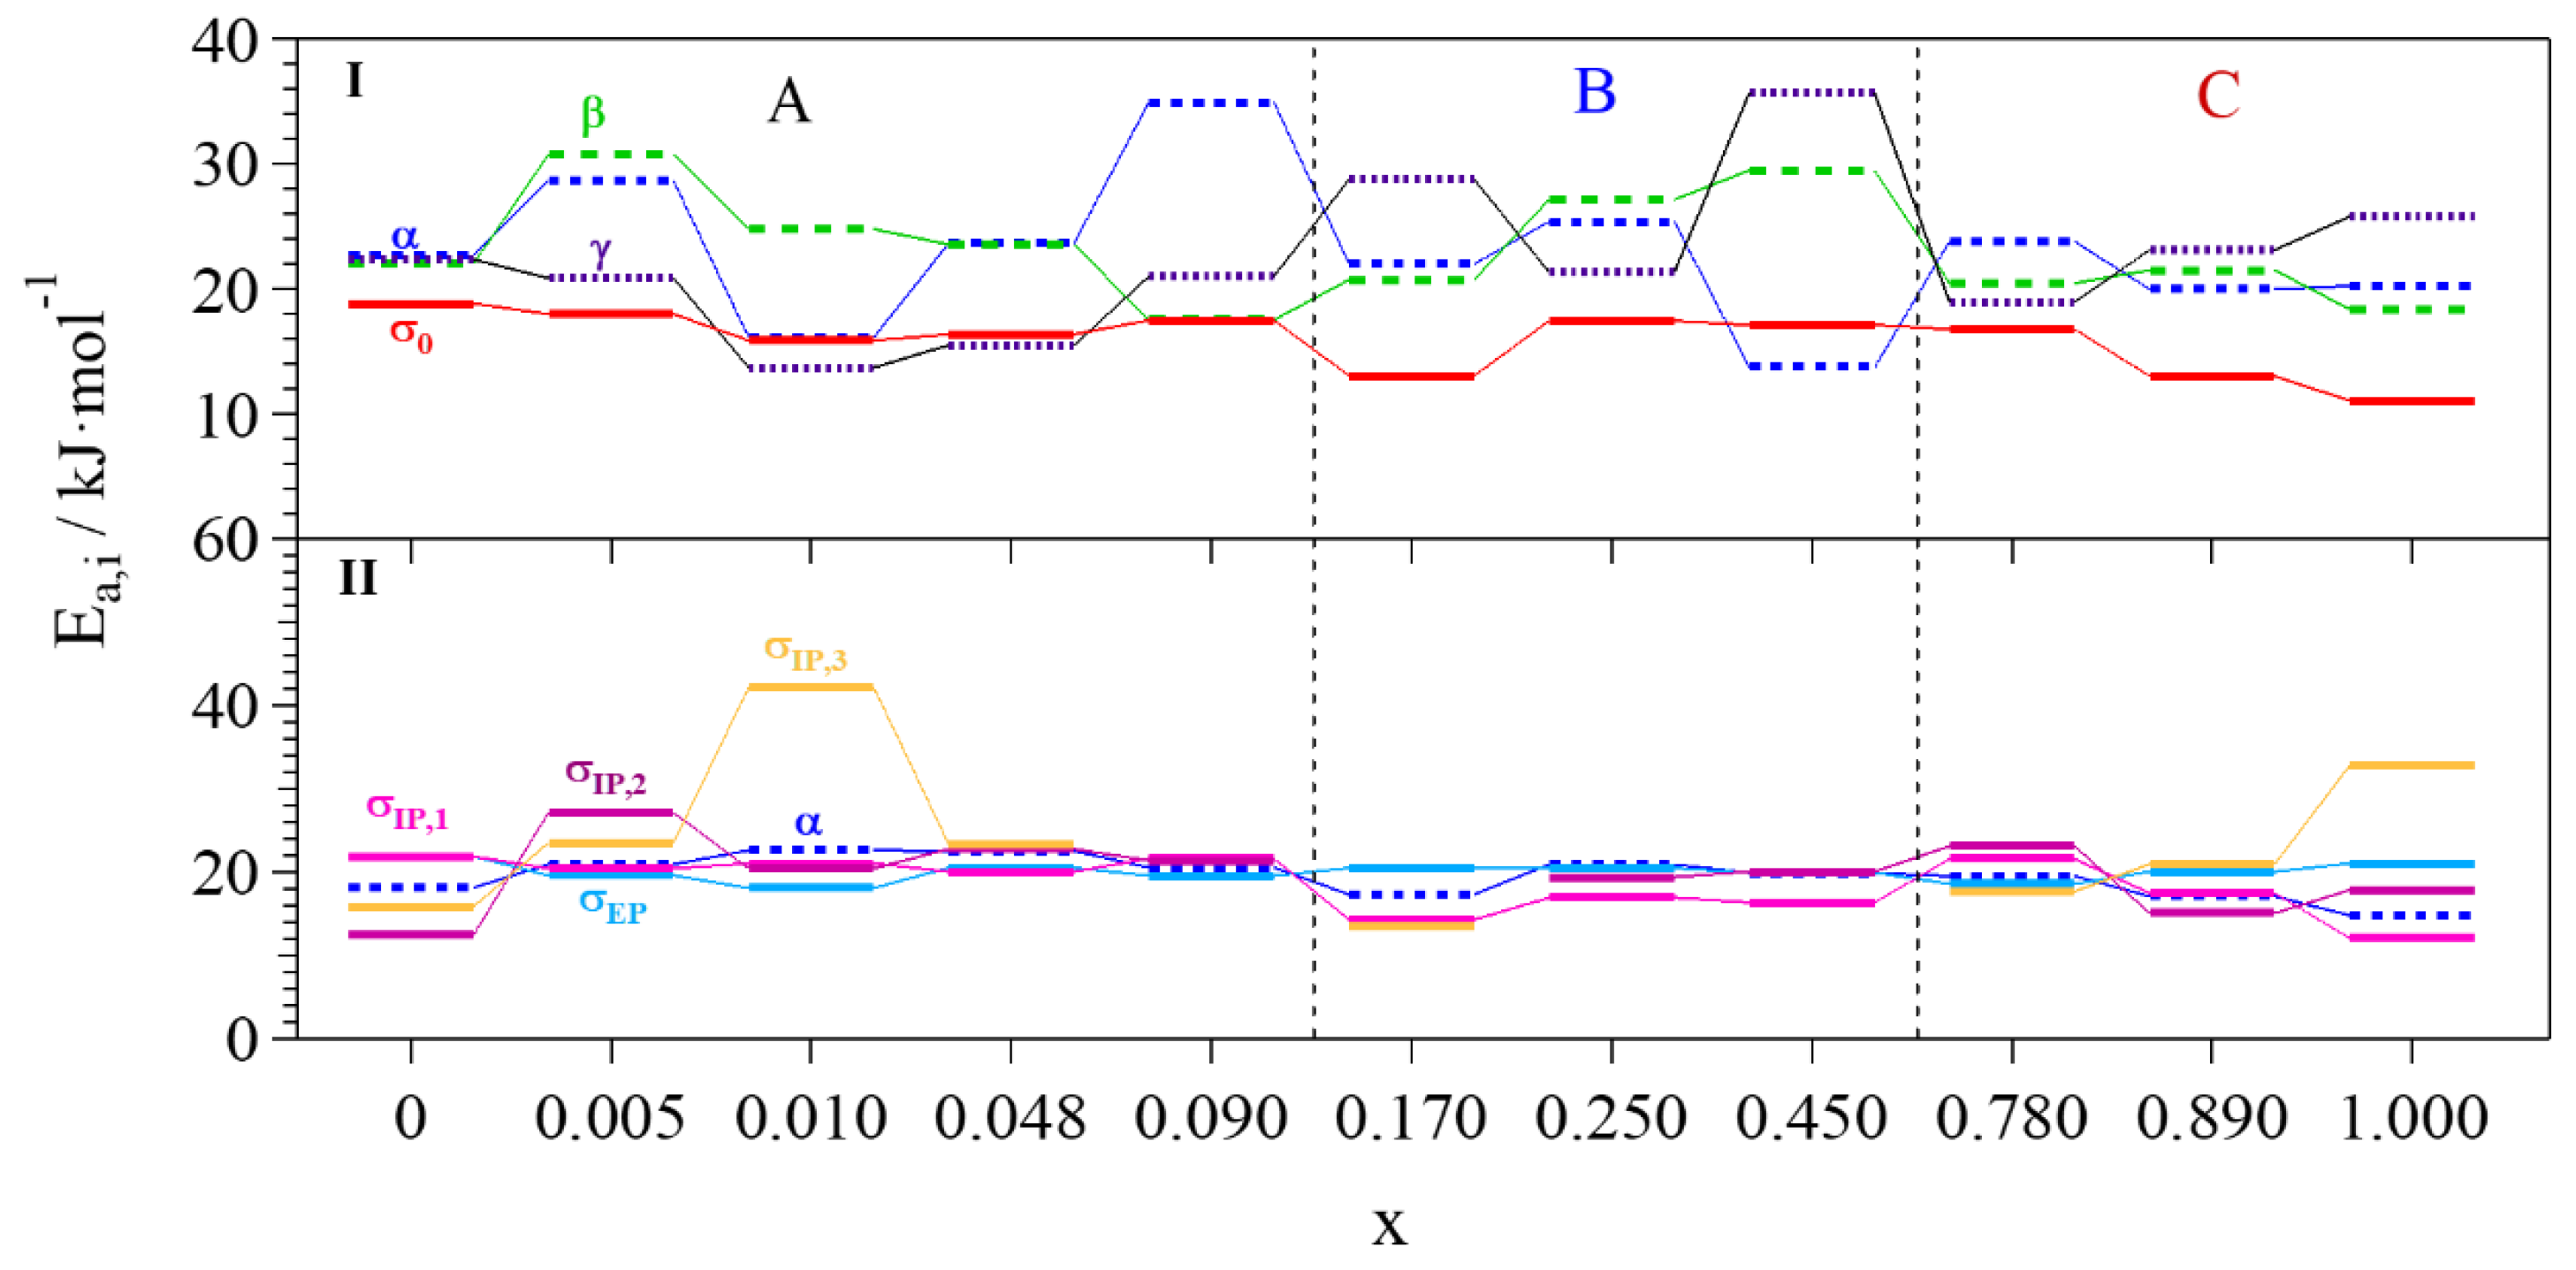
The activation energy (Ea) associated to each conduction pathway is calculated by fitting the profiles of conductivity and dielectric relaxation frequency values vs T−1 shown in Figure 9 and Figure 11, respectively. The obtained results are summarized in Figure 12 and Tables S1 and S2 of the Supplementary Materials.
It is observed that at T < Tg (Region I) and at low concentrations of Li+ (0.005 ≤ x ≤ 0.090), Ea of σ0 is very similar to the activation energy of the γ dielectric relaxation. Thus, for these samples and in this temperature range, the local fluctuations of the dipole moments of glycerol terminal hydroxyl functionalities are modulating the overall conductivity. As the content of Li+ in the electrolytes is raised (x ≥ 0.170), there is not a clear correlation between the activation energy of σ0 and that of any relaxation. This allows us to conclude that in Region I the glycerol relaxations are not assisting the migration process of Li+. In Region II, Ea of σk, and, in particular, Ea of σEP, perfectly overlap with the activation energy of α dielectric relaxation at all x values with a difference of no more than 4 kJ∙mol−1. Hence, independently from which coordination geometry glycerol molecules are assuming, the diffusion of conformational states between cluster aggregates is modulating the overall lithium ion conduction mechanism. Moreover, the activation energy of this relaxation is very low, always lower than 23 kJ∙mol−1. This indicates that the formation and dissolution mechanism of hydrogen bonds in clusters of glycerol molecules, required for the activation of α relaxation, is very efficient in long-range charge migration events.
2.4.4. Diffusion Coefficients and Average Charge Migration Distance
Additional insights into the conduction mechanism and the charge transfer processes occurring in the electrolytes are achieved by evaluating the temperature dependence of the diffusion coefficient (D), and the average charge migration distance (<r>). D is calculated by means of the Nernst–Einstein equation (Equation (5)) [39]:
where R is the gas constant, Ti is the temperature at which D is calculated, σk is the conductivity of the kth polarization, Zk and Ck are the charge and concentration of the kth species exchanged during the σk polarization, and F is the Faraday constant. The relationship between the diffusion coefficient D, associated with each polarization, and the dielectric relaxation events is derived from the Stokes–Einstein equation. The result is Equation (6):
where kb is the Boltzmann constant, τj is the relaxation time of the jth dielectric relaxation, and η is the viscosity of the system. The latter is approximated with the temperature-dependent viscosity of glycerol found in the literature [40]. The analysis of Equation (6) reveals that there is a linear correlation between the logarithm of the diffusion coefficient and the logarithm of the dielectric relaxation frequency. Results are shown in Figure S9 of the Supplementary Materials. The correlation between the diffusion coefficient and the relaxation frequencies at different temperatures and concentrations of Li+ allows for the determination of the relationships between polarization phenomena and dielectric relaxation events. A relationship occurs when a linear dependence of the logarithm of the diffusion coefficient on the logarithm of the dielectric relaxation frequency is observed. Furthermore, this linear dependence has to be superimposable to the ideal one. As can be observed, all the polarizations are influenced by α dielectric relaxation, while β is correlated only to σEP and σIP,1. The γ dielectric relaxation does not influence any migration process. Focusing on the dependence on the lithium concentration it is observed that, at low Li+ content (Group A), experimental and ideal data fit very well for both α and β dielectric relaxations. As the content of Li+ is increased (Group B), experimental data overlap even better with the theoretical values, especially for the α relaxation, indicating that a high migration efficiency is present. Hence, it is expected that these electrolytes exhibit a high conductivity. Group C electrolytes present a good correlation between DσEP, DσIP1, DσIP2, and both α and β dielectric relaxations, even if DσIP1 and DσIP2 are a few cm2∙s−1 lower than the ideal values.
The temperature dependence of the average charge migration distance (<r>) of the different percolation pathways is obtained from the Einstein–Smoluchowski equation (Equation (7)):
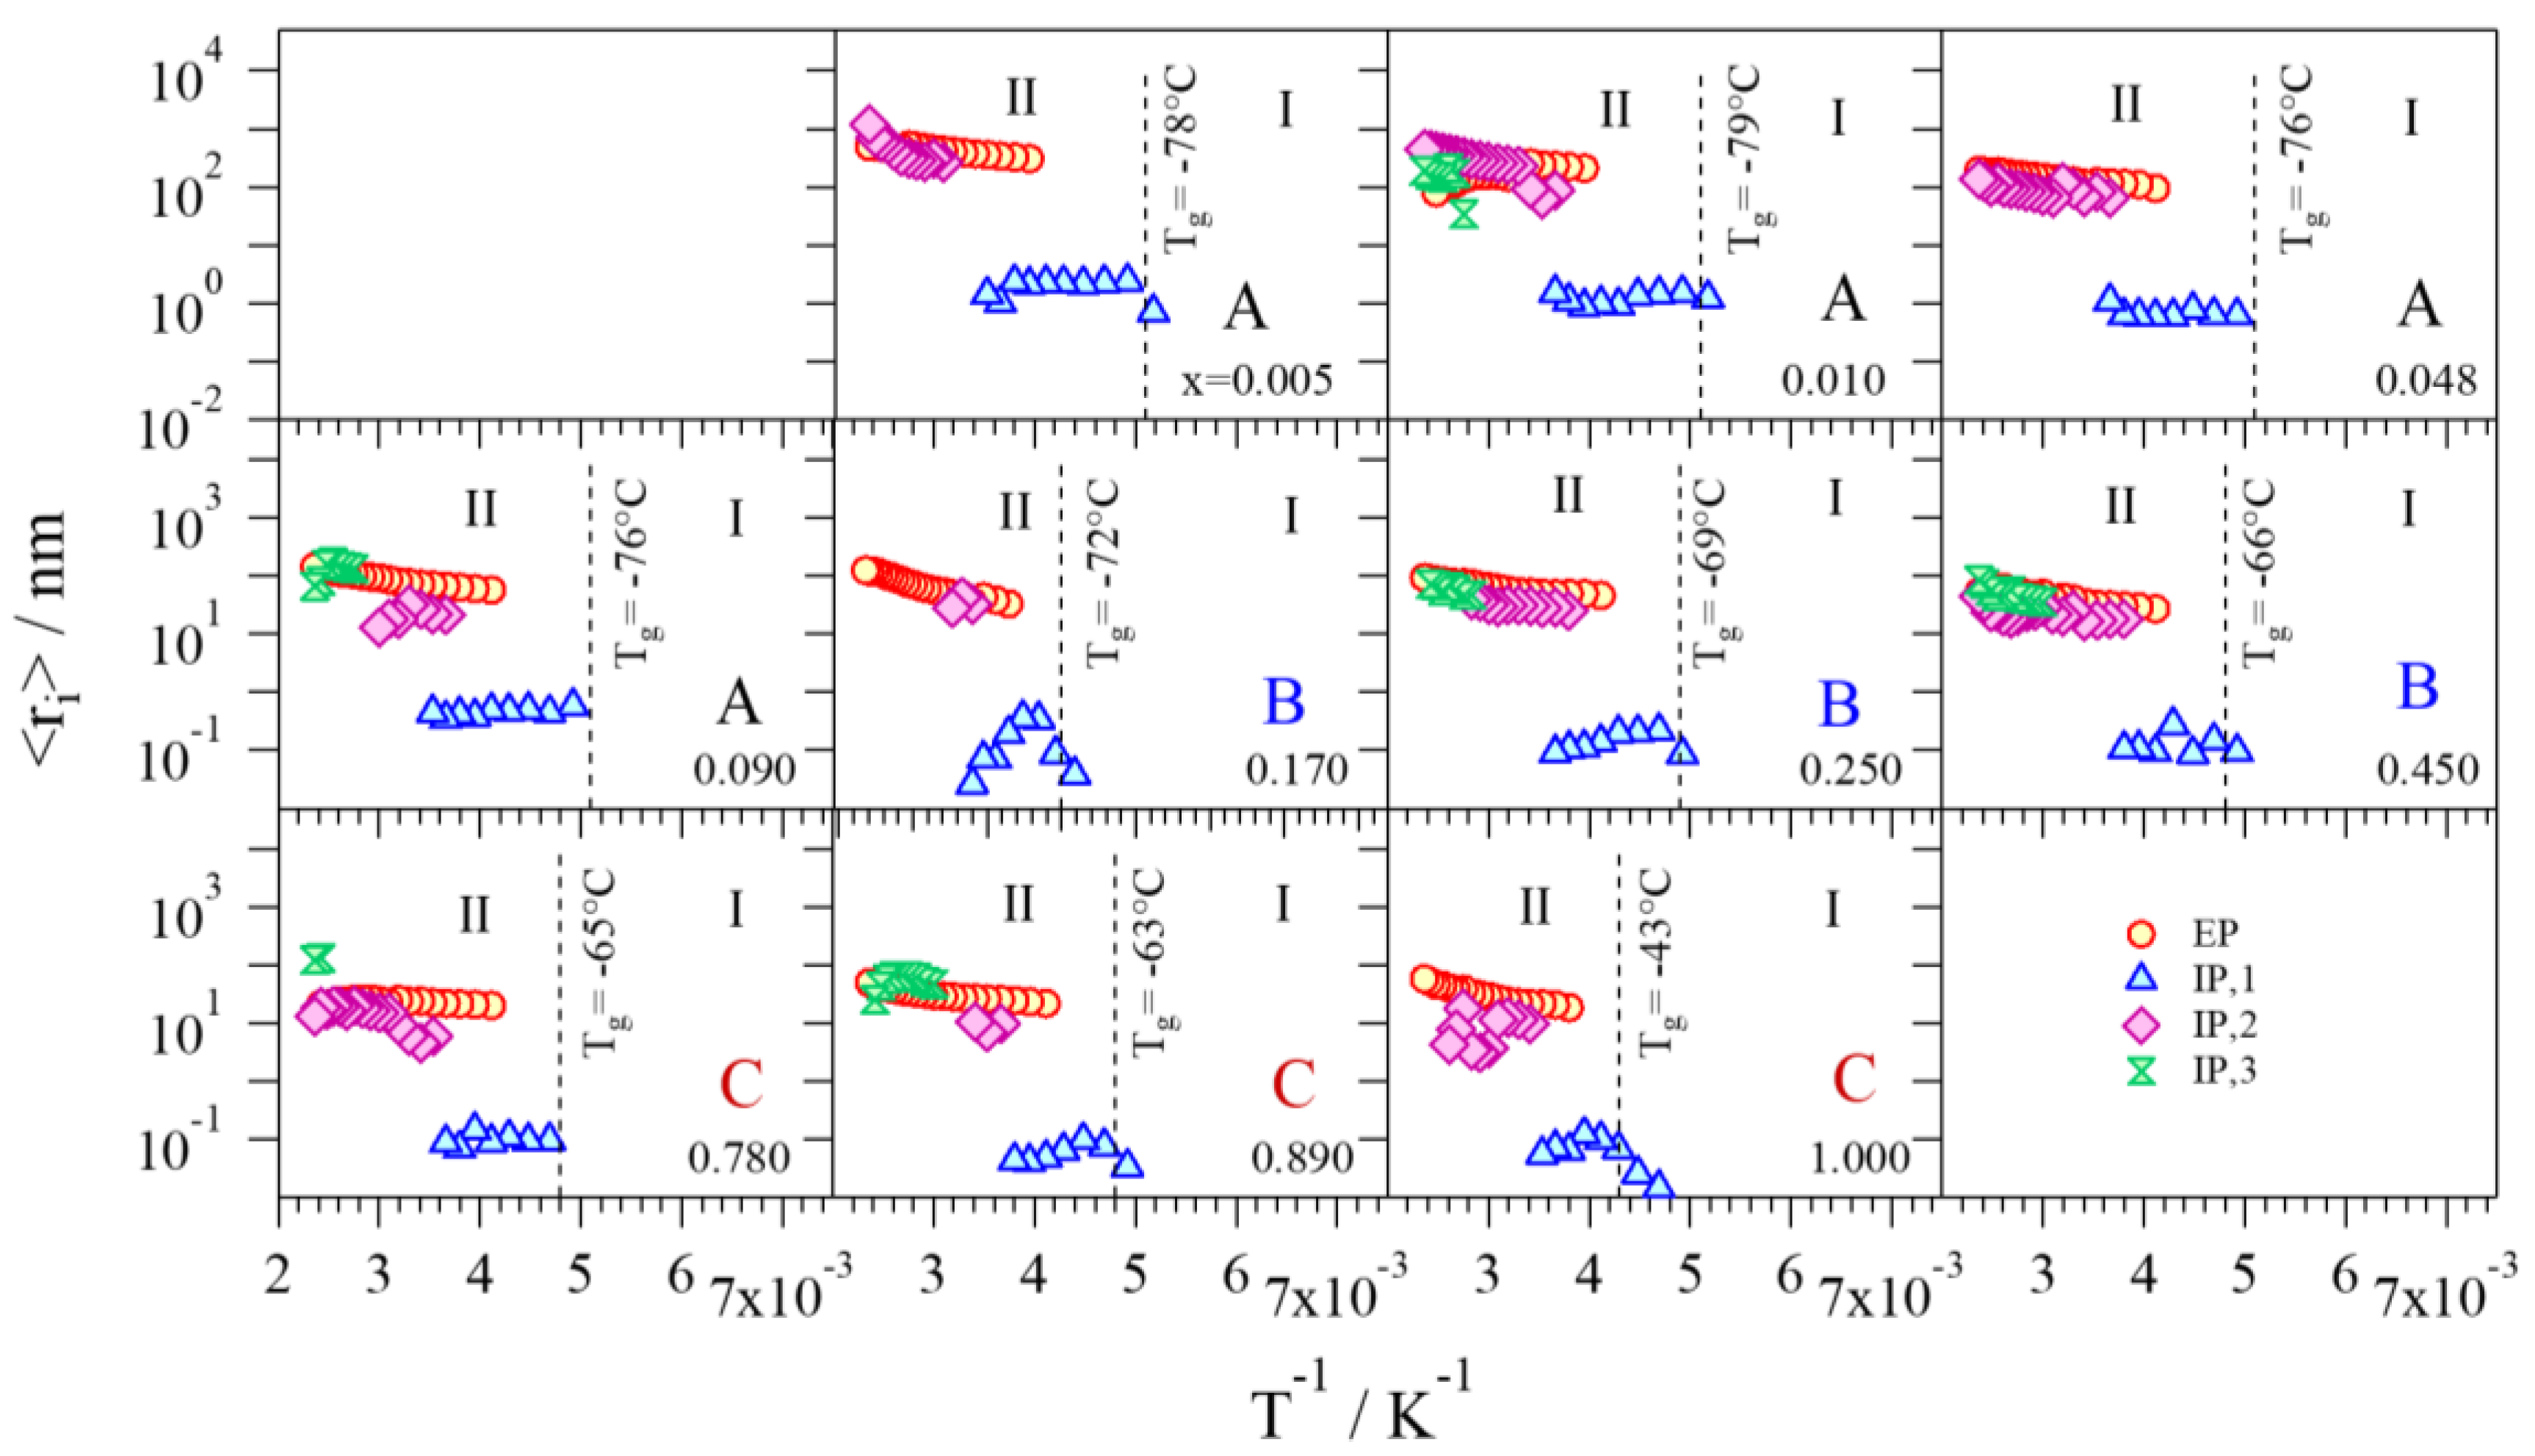
where τk is the relaxation time of the σk polarization. Results are reported in Figure 13.
It is observed that the migration distance increases as the temperature is raised. In Region I (below Tg), this migration is absent: Li+ are entrapped between glycerol molecules, and a huge amount of energy is needed in order to activate the relaxation processes of the cluster aggregates and allow lithium ions to migrate. In Region II (above the Tg), <r> is almost constant with the temperature for all the polarizations. On the contrary, the migration distance is affected by the different concentrations of Li+ in the electrolytes: a decrease of one order of magnitude is observed going from the samples with x = 0.005 to x = 1.000. Indeed, when a high number of Li+ ions able to be exchanged is present in the electrolyte, the dimension of the domains is smaller. The <rEP> values range from 102 to 101 nm; <rEP> is responsible for the long-range migration. On the contrary, <rIP,1> has the lowest values among all the polarizations, indicating that this phenomenon is responsible for the short-range migration. Moreover, this distance is equal to 1 nm, which is similar to the distance between two neighboring glycerol molecules. Thus, interdomain polarization 1 is attributed to the exchange of lithium ions between adjacent glycerol molecules. Similar to <rEP>, <rIP,2> and <rIP,3> account for the long-range charge migration processes, and contribute with a higher intensity in electrolytes with a low concentration of Li+. Furthermore, the average migration distances reflect the dimensions of the domains among which lithium ions are exchanged: IP,2 and IP,3 domains are more distant with respect to the domains involved in the IP,1 percolation pathways.
2.5. Conduction Mechanism
Broadband electrical spectroscopy measurements highlight (i) the presence of three different interdomain polarizations, associated with three Li+ conduction pathways; and (ii) the existence of three types of nanodomains with different permittivities (ε1, ε2, and ε3). Above the Tg, all the polarizations follow a VTF trend, indicating that they are all assisted by the dielectric relaxation modes of the glycerol aggregates, in particular the α relaxation. Each nanodomain is constituted by glycerol molecules in several coordination geometries—g1, g2.1, g2.2, and g3—which influence its permittivity value. Nanodomains 2 and 3 are predominantly present at high concentrations of Li+ (x ≥ 0.170), where σIP,2 and σIP,3 provide an important contribution to the long-range migration.
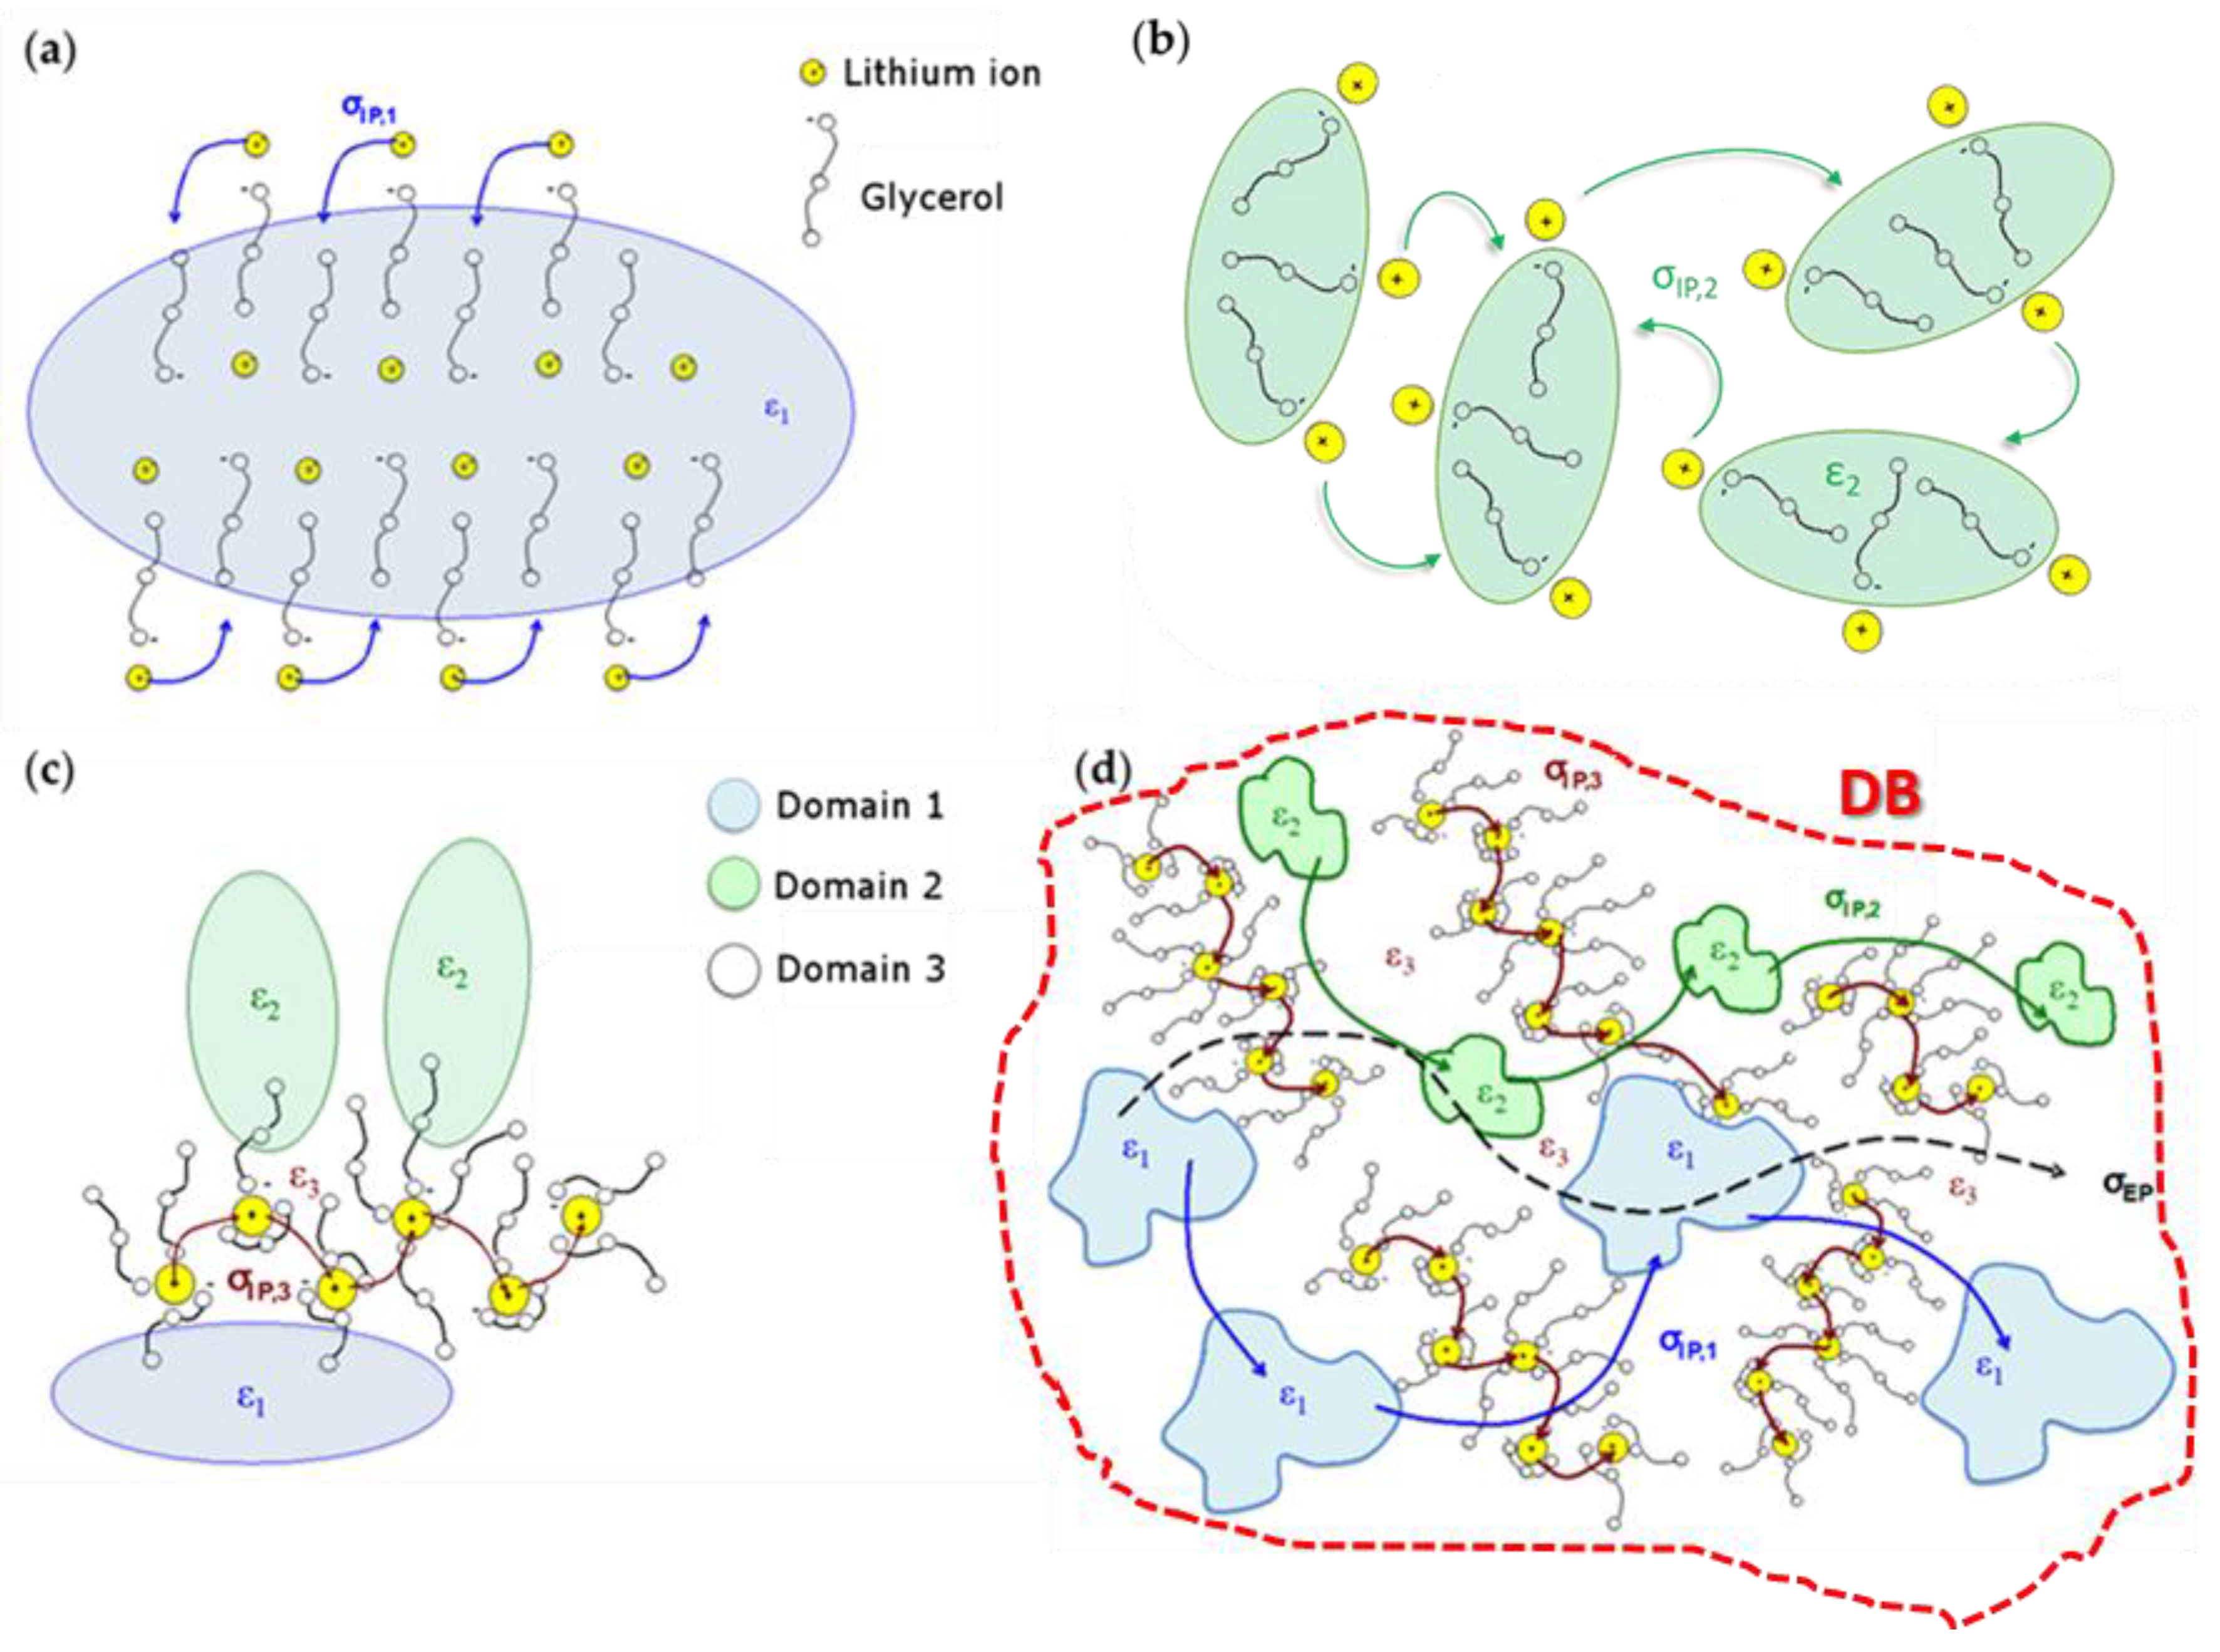
The σIP,1 polarization phenomenon is detected at Tg ≤ T ≤ 10 °C; it is responsible for a migration process IP,1 with a short range (ca. 1 nm). In this temperature range, the domains associated to σIP,1 are predominant and are constituted by large aggregates of crystalline glycerol molecules (“Type 1 domains”) that (i) display the negatively charged −O− functionalities on their external surface and (ii) assume an ordered structure that allows the exchange of Li+ between adjacent molecules. The formation of Type 1 domains allows for the explanation of the short-range migration pathways of Li+ and of the occurrence of this polarization at low temperatures and high frequencies. The structure of Type 1 domains is rigid. Thus, the diffusion of conformational states along the glycerol aggregates is hindered. Hence, the conductivity of the electrolyte is low. An illustration elucidating the σIP,1 polarization phenomenon is shown in Figure 14a.
The σIP,2 polarization phenomenon is observed at temperatures higher than 10 °C and at lower frequencies with respect to σIP,1. σIP,2 is responsible for the long-range charge migration process of Li+, reaching distances of ca. 1 μm. The domains associated with σIP,2 (“Type 2 domains”) are characterized by the presence of a distribution of ordered aggregates with smaller dimensions in comparison with those associated with Type 1 domains. Indeed, σIP,2 occurs at temperatures higher than σIP,1. In σIP,2 polarization, Li+ are exchanged between adjacent Type 2 domains; thus, a longer average charge migration distance is obtained. Moreover, the structure of Type 2 domains is more flexible with respect to that of Type 1 domains, improving the diffusion of conformational states within glycerol aggregates and facilitating the Li+ migration process. The percolation of Li+ following σIP,2 is depicted in Figure 14b.
The σIP,3 polarization appears at temperatures higher than 60 °C and at lower frequencies with respect to σIP,1 and σIP,2. IP,3, similarly to IP,2, accounts for a long-range migration process (ca. 1 μm). Nevertheless, it provides a lower contribution to the total conductivity if compared with IP,2. “Type 3 domains”, which are associated with σIP,3, are composed of amorphous glycerol molecules with a distribution of coordination geometries falling between those observed in Type 1 and Type 2 domains. Indeed, this polarization is observed only at temperatures higher than 60 °C. The structure of Type 3 domains is very flexible. Thus, the migration of Li+ is assisted by the diffusion of conformational states along glycerol molecules. The σIP,3 polarization mechanism is represented in Figure 14c.
Electrode polarization (σEP) starts to be the dominant polarization event at T > 10 °C in all the electrolytes. The presence of domains facilitates the long-range Li+ transfer, which occurs via the exchange between different delocalization bodies (DBs) of the material [41]. A DB is a portion of the electrolyte with a defined volume that comprises Type 1, Type 2, and Type 3 domains. Since the exchange of Li+ ions between the coordination sites present in each DB is very fast, Li+ ions can be considered delocalized in each DB. Thus, in the proposed electrolytes, the long-range charge migration occurs as Li+ ions are exchanged between different DBs as they come into contact, owing to conformational changes caused by the diffusion of conformational states of the glycerol molecules.
The analysis of the polarization phenomena and dielectric relaxation events allows for the proposal of the overall conduction mechanism shown in Figure 14d. In the overall conduction mechanism, the electrode polarization and all the three interdomain polarizations contribute to the diffusion of the Li+ ions through different percolation pathways within the proposed electrolytes.
3. Materials and Methods
3.1. Materials
Glycerol (≥99%) was purchased from Carlo Erba, while lithium hydride (LiH, ≥99%) was obtained from Sigma-Aldrich (Milan, Italy). Glycerol was dried under vacuum at 60 °C for 8 days before use, and then transferred inside an Argon-filled glove-box (MBraun, less than 1 ppm of O2 and H2O). Then, 30 mL of dry glycerol were inserted into a 100 mL round flask, and 1.000 g of LiH were gradually added to the solution. The solution was vigorously stirred under vacuum at 50 °C in order to promote the reaction yielding lithium glycerolate, GlyLi (see Reaction I). GlyLi was diluted with different amounts of pristine glycerol, yielding 11 electrolytes with the general formula GlyLix, 0 ≤ x ≤ 1.
3.2. Chemical and Structural Characterizations
The lithium content in all the electrolytes was determined via inductively coupled plasma atomic emission spectroscopy (ICP-AES) measurements. The ICP-AES analysis was carried out by digesting the samples in concentrated HNO3. The emission line used to evaluate the Li concentration was 670.700 nm. The FT-IR spectra were collected using a Thermo Scientific (Monza, Italy) model Nicolet Nexus spectrometer, with a SPECAC Golden Gate single reflection diamond ATR cell. The spectrum was obtained as the average of 500 scans and with a resolution of 2 cm−1. Micro-Raman analyses were carried out with a confocal DXR-Micro Raman (Thermo Scientific, Monza, Italy) spectrometer with an excitation laser operating at 532 nm. Samples were prepared inside an Ar-filled glove-box (see above), and were maintained under an inert atmosphere during the measurements. Both FT-IR and micro-Raman spectra were baseline subtracted and normalized with respect to the peaks centered at 1323 cm−1 (FT-IR) and 1253 cm−1 (micro-Raman), attributed to the superposition of the in-plane OH bending and CH wagging.
3.3. Thermal Characterizations
The thermal losses were evaluated by high-resolution thermogravimetric analyses (HR-TGA), using a high-resolution microbalance from TA Instruments (Sesto San Giovanni (MI), Italy) (model 2950). Measurements were carried out in the temperature range between 30 and 950 °C, under an N2 atmosphere. The thermal transitions were studied via modulated differential scanning calorimetry (MDSC); measurements were carried out from −150 to 165 °C with a heating ramp of 3 °C∙min−1.
3.4. Electric Response
Broadband electrical spectroscopy (BES) measurements were performed using an Alpha-A analyzer provided by Novocontrol Technologies (Montabaur, Germany). The complex conductivity (σ*(ω)) and permittivity spectra (ε*(ω)) were measured in the −130 to 150 °C temperature range at increments of 10 ± 0.5 °C. The measurements were carried out in the 10−1–107 Hz frequency range. Samples were loaded in a hermetically sealed homemade Teflon cell assembled in an Ar glove-box, and kept under a dry N2 atmosphere during the measurements.
4. Conclusions
In this work, a new family of Li+-conducting glass-forming polymer electrolytes is proposed. Vibrational spectroscopies (i.e., FT-IR and micro-Raman) allow for the interpretation of the coordination geometry assumed by glycerol molecules as a function of lithium concentration. High-resolution thermogravimetric analyses demonstrate that the proposed electrolytes are thermally stable up to 170 °C, while modulated differential scanning calorimetry measurements highlight that, as the content of Li+ is increased, the Tg shifts to higher temperatures (from −78.51 °C for pristine glycerol to −42.95 °C for lithium glycerolate, GlyLi). Furthermore, the thermal behavior of the proposed electrolytes can be explained considering that glycerol molecules assume the coordination geometries hypothesized from vibrational results. Finally, broadband electrical spectroscopy results show that the highest conductivity values are achieved by GlyLi0.25: 1.99 × 10⁻⁴ at 30 °C, higher than 10−6 S∙cm−1 at −10 °C, and 1.55 × 10⁻² S∙cm−1 at 150 °C. Moreover, a detailed analysis of BES results allows us to propose a reasonable conduction mechanism for Li+. In particular, it is shown that Li+ ions are able to migrate between crystalline and amorphous domains thanks to the diffusion of conformational states of glycerol molecule aggregates. At temperatures below the Tg, the conduction mechanism occurs through “hopping” processes between adjacent glycerol molecules. On increasing the temperature, new polarization phenomena arise such as σIP,1, which is the principal event between Tg and 10 °C. At temperatures higher than 10 °C, the electrode polarization σEP becomes the dominant contribution to the overall conductivity. σEP consists of an exchange of lithium ions between different delocalization bodies (DBs), which results in a long-range migration of charge. In this temperature range, the contribution of σIP,2 polarization becomes relevant, and the flexibility obtained from glycerol molecules raises the conductivity of the proposed electrolytes. The best conductivity values obtained by the proposed electrolytes are promising in comparison with state-of-the-art polymer electrolytes for application in Li-ion batteries.
Supplementary Materials
The following are available online at https://www.mdpi.com/2313-0105/4/3/41/s1, Figure S1: FT-IR differential spectra. Figure S2: Intensity and wavenumber behavior of ν(OH), νg3(C–C–O), and νg1(C–C–O) FT-IR vibrations at different x (nLi/ngly) values. Figure S3: Lorentzian fitting of the micro-Raman spectrum of pure glycerol. Figure S4: Areal behavior of the micro-Raman peaks as a function of x. Figure S5: MDSC results of pristine glycerol, Gly (x = 0), and lithium glycerolate, GlyLi (x = 1.000), samples where the reversible and nonreversible heat flow contributions are separated. Figure S6: 3D tanδ surfaces of GlyLix samples, with x = 0.005, 0.048, 0.090, 0.250, 0.450, 0.780, and 0.890. Figure S7: Representation of glycerol α, β, and γ dielectric relaxations. Figure S8: Δεj vs T−1 curves of each dielectric relaxation event for every sample. Figure S9: Diffusion coefficient calculated for each polarization (σEP, σIP,1, and σIP,2 rows) as a function of the dielectric relaxation frequencies (fγ, fβ, and fα, columns). Table S1: Activation energies calculated for each polarization phenomenon. Table S2: Activation energies calculated for each relaxation event.
Author Contributions
V.D.N. conceived and designed the experiments; G.P. and S.T. performed the experiments; G.P., S.T., and K.V. analyzed the data; G.P., S.T., K.V., and V.D.N. discussed the results and agreed on the conclusions; G.P. and V.D.N. wrote the paper.
Funding
This work was supported by the “Budget Integrato per la Ricerca Interdipartimentale—BIRD 2016” of the University of Padova (protocol BIRD164837/16), and the “Centro Studi di Economia e Tecnica dell’Energia Giorgio Levi Cases” of the University of Padova. V.D.N. thanks the University Carlos III of Madrid for the “Cátedras de Excelencia UC3M-Santander” (Chair of Excellence UC3M-Santander).
Conflicts of Interest
The authors declare no conflict of interest.
References
- Di Noto, V.; Lavina, S.; Giffin, G.A.; Negro, E.; Scrosati, B. Polymer electrolytes: Present, past and future. Electrochim. Acta 2011, 57, 4–13. [Google Scholar] [CrossRef]
- Meyer, W.H. Polymer Electrolytes for Lithium-Ion Batteries. Adv. Mater. 1998, 10, 439–448. [Google Scholar] [CrossRef]
- Deng, Y.; Eames, C.; Fleutot, B.; David, R.; Chotard, J.N.; Suard, E.; Masquelier, C.; Islam, M.S. Enhancing the Lithium Ion Conductivity in Lithium Superionic Conductor (LISICON) Solid Electrolytes through a Mixed Polyanion Effect. ACS Appl. Mater. Interfaces 2017, 9, 7050–7058. [Google Scholar] [CrossRef] [PubMed] [Green Version]
- Tarascon, J.M.; Guyomard, D. New electrolyte compositions stable over the 0 to 5 V voltage range and compatible with the Li1+xMn2O4/carbon Li-ion cells. Solid State Ion. 1994, 69, 293–305. [Google Scholar] [CrossRef]
- Canepa, P.; Dawson, J.A.; Sai Gautam, G.; Statham, J.M.; Parker, S.C.; Islam, M.S. Particle Morphology and Lithium Segregation to Surfaces of the Li7La3Zr2O12 Solid Electrolyte. Chem. Mater. 2018, 30, 3019–3027. [Google Scholar] [CrossRef]
- Dawson, J.A.; Canepa, P.; Famprikis, T.; Masquelier, C.; Islam, M.S. Atomic-Scale Influence of Grain Boundaries on Li-Ion Conduction in Solid Electrolytes for All-Solid-State Batteries. J. Am. Chem. Soc. 2018, 140, 362–368. [Google Scholar] [CrossRef] [PubMed]
- Bertasi, F.; Negro, E.; Vezzù, K.; Nawn, G.; Pagot, G.; Di Noto, V. Single-Ion-Conducting Nanocomposite Polymer Electrolytes for Lithium Batteries Based on Lithiated-Fluorinated-Iron Oxide and Poly(ethylene glycol) 400. Electrochim. Acta 2015, 175, 113–123. [Google Scholar] [CrossRef]
- Bertasi, F.; Vezzù, K.; Giffin, G.A.; Nosach, T.; Sideris, P.; Greenbaum, S.; Vittadello, M.; Di Noto, V. Single-ion-conducting nanocomposite polymer electrolytes based on PEG400 and anionic nanoparticles: Part 2. Electrical characterization. Int. J. Hydrogen Energy 2014, 39, 2884–2895. [Google Scholar] [CrossRef]
- Bertasi, F.; Vezzù, K.; Negro, E.; Greenbaum, S.; Di Noto, V. Single-ion-conducting nanocomposite polymer electrolytes based on PEG400 and anionic nanoparticles: Part 1. Synthesis, structure and properties. Int. J. Hydrogen Energy 2014, 39, 2872–2883. [Google Scholar] [CrossRef]
- Bonino, F.; Croce, F.; Panero, S. Electrochemical characterization of an ambient temperature rechargeable Li battery based on low molecular weight polymer electrolyte. Solid State Ion. 1994, 70–71, 654–657. [Google Scholar] [CrossRef]
- Pagot, G.; Bertasi, F.; Vezzù, K.; Nawn, G.; Pace, G.; Nale, A.; Di Noto, V. Correlation between Properties and Conductivity Mechanism in Poly(vinyl alcohol)-based Lithium Solid Electrolytes. Solid State Ion. 2018, 320, 177–185. [Google Scholar] [CrossRef]
- Howell, F.S.; Moynihan, C.T.; Macedo, P.B. Electrical Relaxations in Mixtures of Lithium Chloride and Glycerol. Bull. Chem. Soc. Jpn. 1984, 57, 652–661. [Google Scholar] [CrossRef]
- Adam, G.; Gibbs, J.H. On the Temperature Dependence of Cooperative Relaxation Properties in Glass-Forming Liquids. J. Chem. Phys. 1965, 43, 139–146. [Google Scholar] [CrossRef]
- Lide, D.R.; Milne, G.W.A. Handbook of Data on Organic Compounds, 3rd ed.; CRC Press: Boca Raton, FL, USA, 1994; ISBN 9780849304453. [Google Scholar]
- Van Duyne, R.P.; Reilley, C.N. Low-Temperature Electrochemistry II. Evaluation of Rate Constants and Activation Parameters for Homogeneous Chemical Reactions Coupled to Charge Transfer. Anal. Chem. 1972, 44, 153–158. [Google Scholar] [CrossRef]
- Macedo, P.B.; Moynihan, C.T.; Bose, R. Role of Ionic Diffusion in Polarization in Vitreous Ionic Conductors. Phys. Chem. Glasses 1972, 13, 171–179. [Google Scholar]
- Bastiansen, O. Intra-Molecular Hydrogen Bonds in Ethylene Glycol, Glycerol, and Ethylene Chlorohydrin. Acta Chem. Scand. 1949, 3, 415–421. [Google Scholar] [CrossRef]
- Chelli, R.; Procacci, P.; Cardini, G.; Della Valle, R.G.; Califano, S. Glycerol condensed phases part I. A molecular dynamics study. Phys. Chem. Chem. Phys. 1999, 1, 871–877. [Google Scholar] [CrossRef]
- Di Noto, V.; Vittadello, M.; Greenbaum, S.G.; Suarez, S.; Kano, K.; Furukawa, T. A New Class of Lithium Hybrid Gel Electrolyte Systems. J. Phys. Chem. B 2004, 108, 18832–18844. [Google Scholar] [CrossRef]
- Chelli, R.; Procacci, P.; Cardini, G.; Califano, S. Glycerol condensed phases Part II.A molecular dynamics study of the conformational structure and hydrogen bonding. Phys. Chem. Chem. Phys. 1999, 1, 879–885. [Google Scholar] [CrossRef]
- Chelli, R.; Gervasio, F.L.; Gellini, C.; Procacci, P.; Cardini, G.; Schettino, V. Density Functional Calculation of Structural and Vibrational Properties of Glycerol. J. Phys. Chem. A 2000, 104, 5351–5357. [Google Scholar] [CrossRef]
- Zhao, Y.P.; Zhang, J.W.; Zhao, C.C.; Du, Z.Y. Tetrahedrally coordinated lithium(I) and zinc(II) carboxylate-phosphinates based on tetradentate 2-carboxyethyl(phenyl)phosphinate ligand. Inorg. Chim. Acta 2014, 414, 121–126. [Google Scholar] [CrossRef]
- Liddel, U.; Becker, E.D. Infra-red spectroscopic studies of hydrogen bonding in methanol, ethanol, and t-butanol. Spectrochim. Acta 1957, 10, 70–84. [Google Scholar] [CrossRef]
- Lin-Vien, D.; Colthup, N.B.; Fateley, W.G.; Grasselli, J.G. The Handbook of Infrared and Raman Characteristic Frequencies of Organic Molecules; Academic Press: Cambridge, MA, USA, 1991; ISBN 978–0-12-451160-6. [Google Scholar]
- Mendelovici, E.; Frost, R.L.; Kloprogge, T. Cryogenic Raman spectroscopy of glycerol. J. Raman Spectrosc. 2000, 31, 1121–1126. [Google Scholar] [CrossRef]
- Perova, T.S.; Christensen, D.H.; Rasmussen, U.; Vij, J.K.; Nielsen, O.F. Far-infrared spectra of highly viscous liquids: Glycerol and triacetin (glycerol triacetate). Vib. Spectrosc. 1998, 18, 149–156. [Google Scholar] [CrossRef]
- Zietlow, J.P.; Cleveland, F.F.; Meister, A.G. Substituted methanes. III. Raman spectra, assignments, and force constants for some trichloromethanes. J. Chem. Phys. 1950, 18, 1076–1080. [Google Scholar] [CrossRef]
- Dou, B.; Dupont, V.; Williams, P.T.; Chen, H.; Ding, Y. Thermogravimetric kinetics of crude glycerol. Bioresour. Technol. 2009, 100, 2613–2620. [Google Scholar] [CrossRef] [PubMed] [Green Version]
- Hong, J.L.; Zhang, X.H.; Wei, R.J.; Wang, Q.; Fan, Z.Q.; Qi, G.R. Inhibitory effect of hydrogen bonding on thermal decomposition of the nanocrystalline cellulose/poly(propylene carbonate) nanocomposite. J. Appl. Polym. Sci. 2014, 131. [Google Scholar] [CrossRef]
- Angell, C.A. Entropy and fragility in supercooling liquids. J. Res. Natl. Inst. Stand. Technol. 1997, 102, 171–181. [Google Scholar] [CrossRef] [PubMed]
- Claudy, P.; Jabrane, S.; Létoffé, J.M. Annealing of a glycerol glass: Enthalpy, fictive temperature and glass transition temperature change with annealing parameters. Thermochim. Acta 1997, 293, 1–11. [Google Scholar] [CrossRef]
- Di Noto, V.; Giffin, G.A.; Vezzù, K.; Piga, M.; Lavina, S. Broadband Dielectric Spectroscopy: A Powerful Tool for the Determination of Charge Transfer Mechanisms in Ion Conductors, Solid State Proton Conductors: Properties and Applications in Fuel Cells; John Wiley & Sons: Chichester, UK, 2012; pp. 109–183. [Google Scholar]
- Kitajima, S.; Bertasi, F.; Vezzù, K.; Negro, E.; Tominaga, Y.; Di Noto, V. Dielectric relaxations and conduction mechanisms in polyether-clay composite polymer electrolytes under high carbon dioxide pressure. Phys. Chem. Chem. Phys. 2013, 15, 16626–16633. [Google Scholar] [CrossRef] [PubMed]
- Tammann, G.; Hesse, W. Die Abhängigkeit der Viscosität von der Temperatur bie unterkühlten Flüssigkeiten. Z. Anorg. Allg. Chem. 1926, 156, 245–257. [Google Scholar] [CrossRef]
- Dhatarwal, P.; Choudhary, S.; Sengwa, R.J. Electrochemical performance of Li+-ion conducting solid polymer electrolytes based on PEO–PMMA blend matrix incorporated with various inorganic nanoparticles for the lithium ion batteries. Compos. Commun. 2018, 10, 11–17. [Google Scholar] [CrossRef]
- Di Noto, V.; Piga, M.; Giffin, G.A.; Lavina, S.; Smotkin, E.S.; Sanchez, J.Y.; Iojoiu, C. Influence of anions on proton-conducting membranes based on neutralized nafion 117, triethylammonium methanesulfonate, and triethylammonium perfluorobutanesulfonate. 2. electrical properties. J. Phys. Chem. C 2012, 116, 1370–1379. [Google Scholar] [CrossRef]
- Lunkenheimer, P.; Schneider, U.; Brand, R.; Loid, A. Glassy dynamics. Contemp. Phys. 2000, 41, 15–36. [Google Scholar] [CrossRef]
- Kudlik, A.; Benkhof, S.; Blochowicz, T.; Tschirwitz, C.; Rössler, E. The dielectric response of simple organic glass formers. J. Mol. Struct. 1999, 479, 201–218. [Google Scholar] [CrossRef]
- Di Noto, V.; Vittadello, M.; Yoshida, K.; Lavina, S.; Negro, E.; Furukawa, T. Broadband dielectric and conductivity spectroscopy of Li-ion conducting three-dimensional hybrid inorganic-organic networks as polymer electrolytes based on poly(ethylene glycol) 400, Zr and Al nodes. Electrochim. Acta 2011, 57, 192–200. [Google Scholar] [CrossRef]
- Cheng, N.-S. Formula for the Viscosity of a Glycerol−Water Mixture. Ind. Eng. Chem. Res. 2008, 47, 3285–3288. [Google Scholar] [CrossRef] [Green Version]
- Di Noto, V.; Piga, M.; Giffin, G.A.; Vezzù, K.; Zawodzinski, T.A. Interplay between mechanical, electrical, and thermal relaxations in nanocomposite proton conducting membranes based on nafion and a [(ZrO2)·(Ta2O5)0.119] core-shell nanofiller. J. Am. Chem. Soc. 2012, 134, 19099–19107. [Google Scholar] [CrossRef] [PubMed]
Figure 1.
(a) The α, β, and γ conformations of glycerol; (b) The most probable conformations assumed by the glycerol molecule: αα and αγ. Color legend: C (grey), O (red), H (white), oxygen electron pair (pink). Hydrogen bonds are highlighted with a dotted line; (c) Glycerol intermolecular structure in the liquid phase.
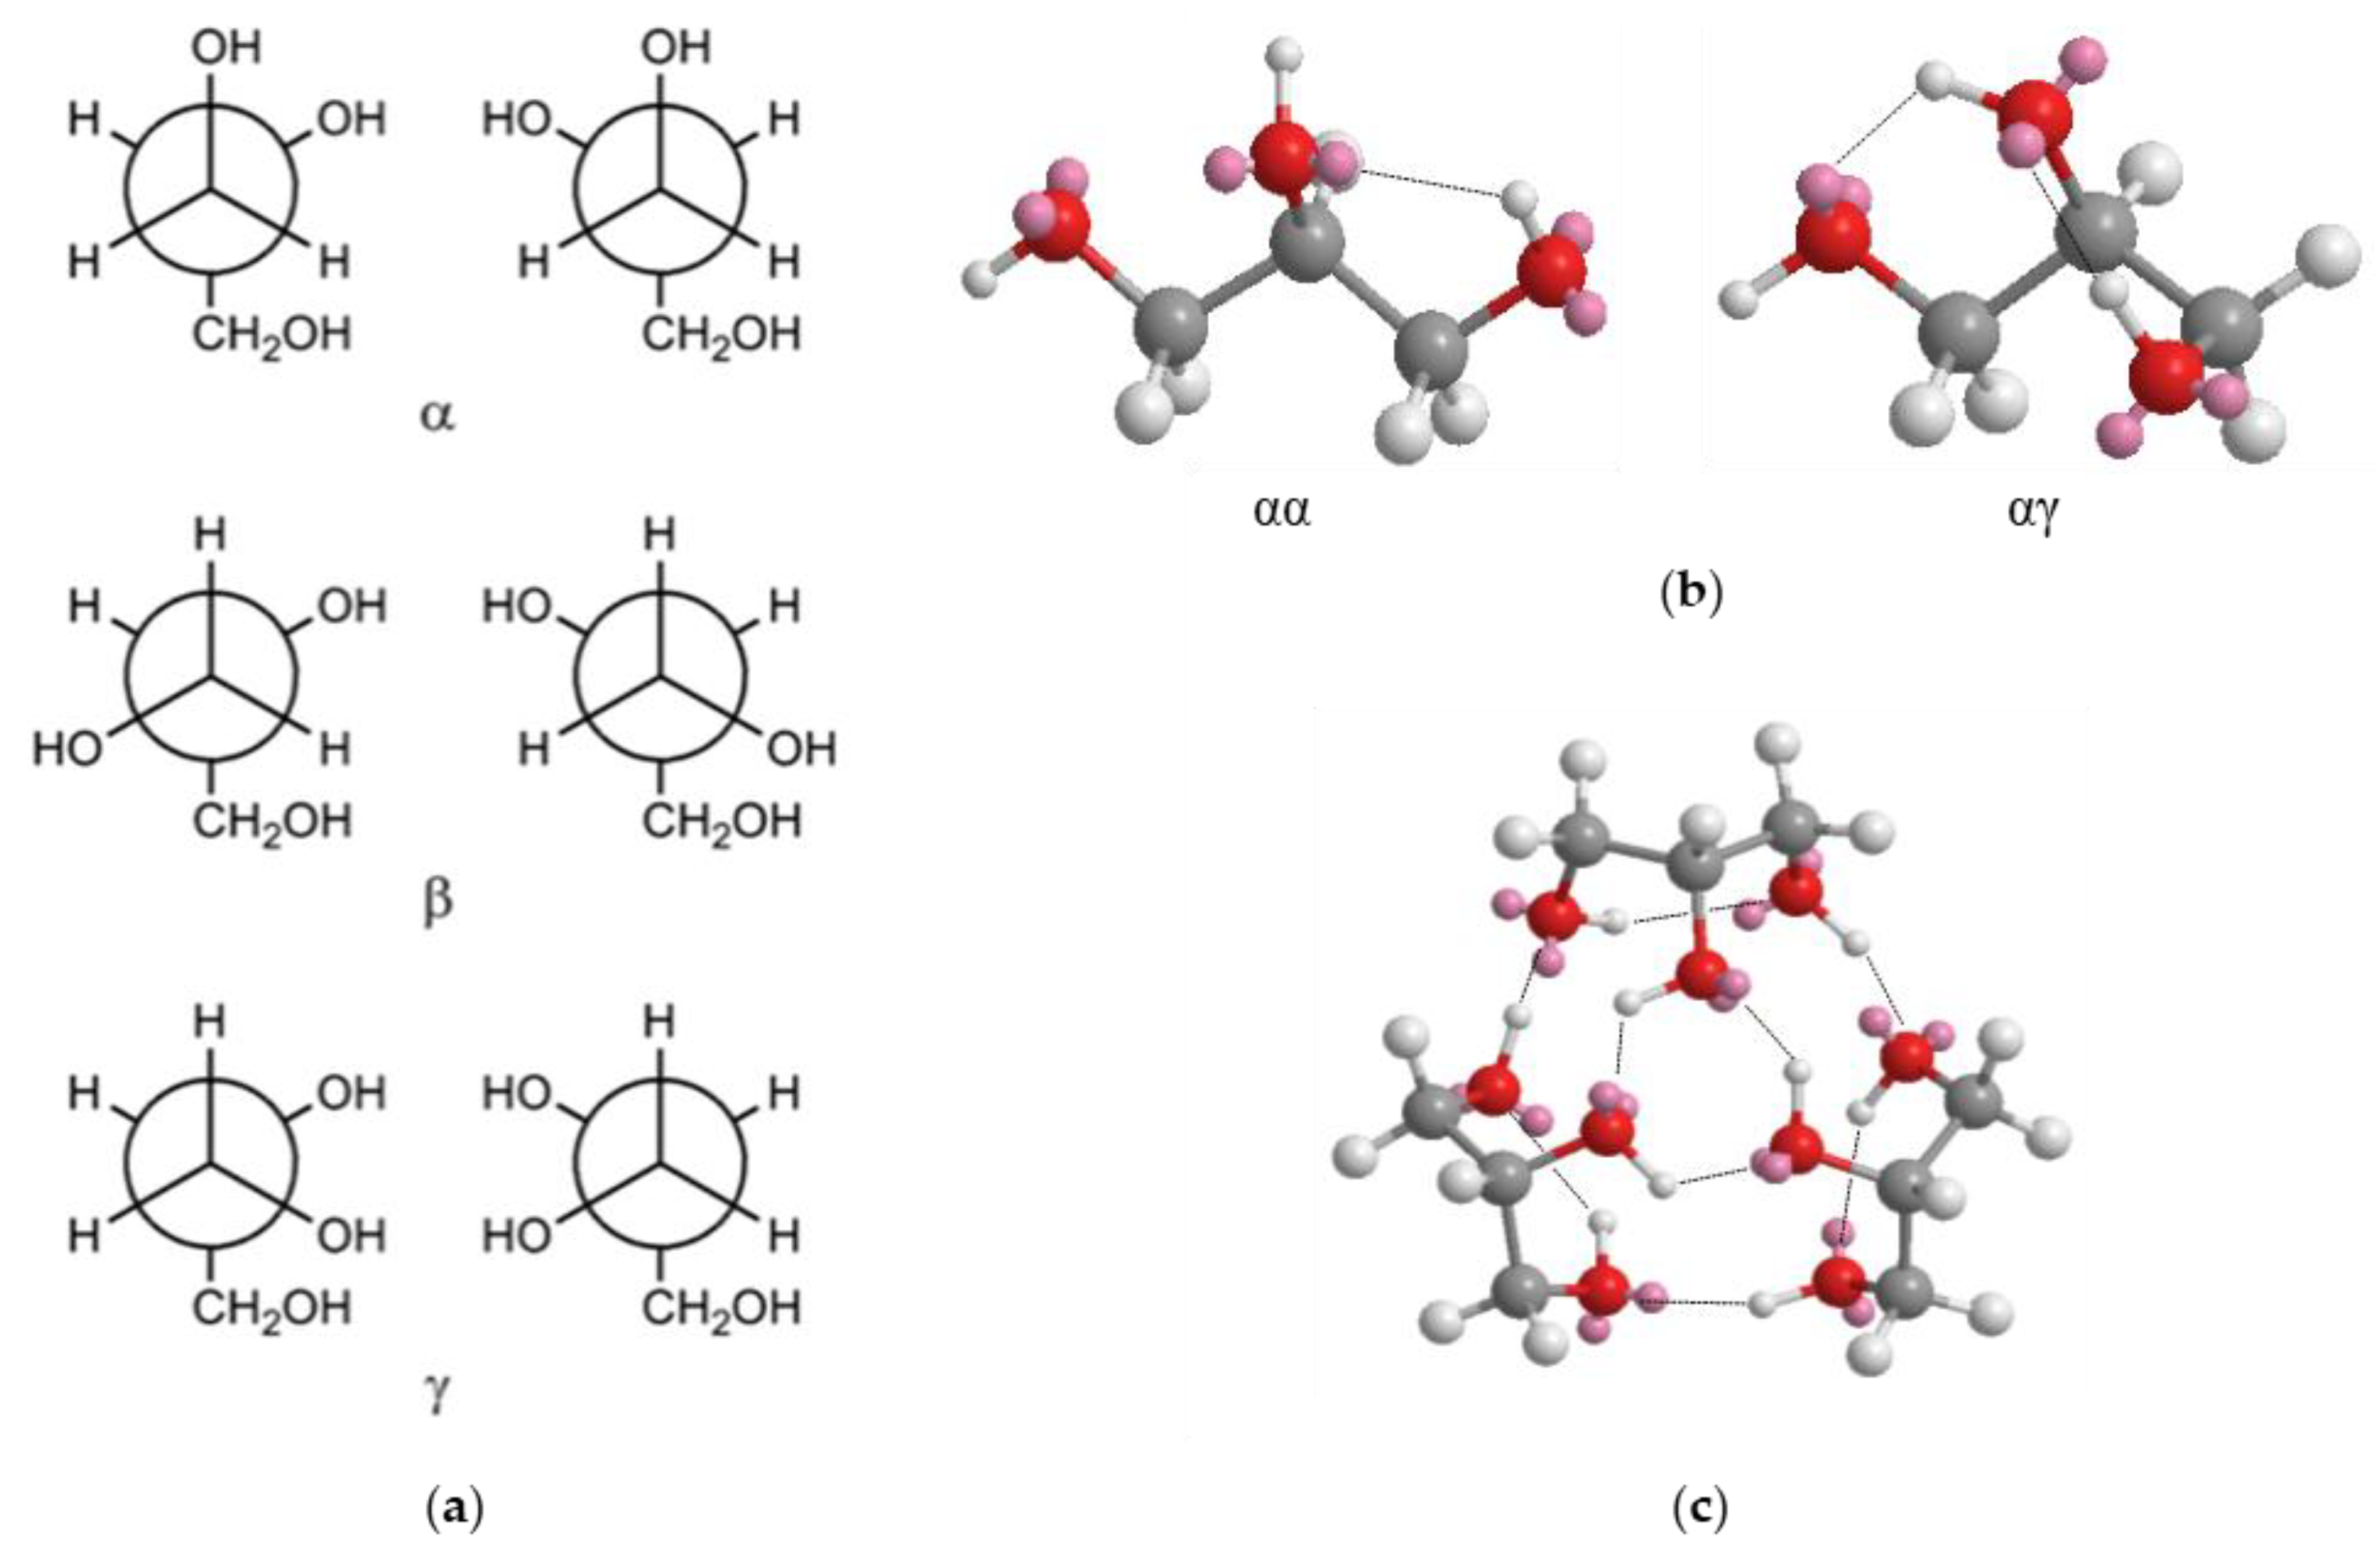
Figure 2.
Coordination geometries assumed by glycerol molecules upon coordination of Li+ cations. Color legend: C (grey), O (red), H (white), Li (violet). Li–O interactions are highlighted with a dotted line. (a) g1 coordination geometry, with four monodentate glycerol ligands; (b) g2.1 coordination geometry, with two monodentate glycerol ligands and one bidentate glycerol ligand; (c) g2.2 coordination geometry, with two bidentate glycerol ligands; (d) g3 coordination geometry, with one monodentate glycerol ligand and one tridentate glycerol ligand.

Figure 3.
FT-IR spectra of GlyLix electrolytes.

Figure 4.
Gaussian fitting of the FT-IR spectra of (a) pristine glycerol, Gly (x = 0), in the 2500–3700 cm−1 region; (b) lithium glycerolate, GlyLi (x = 1.000), in the 2500–3700 cm−1 region; (c) pure glycerol, Gly (x = 0), in the 770–1150 cm−1 region; and (d) lithium glycerolate, GlyLi (x = 1.000), in the 770–1150 cm−1 region.
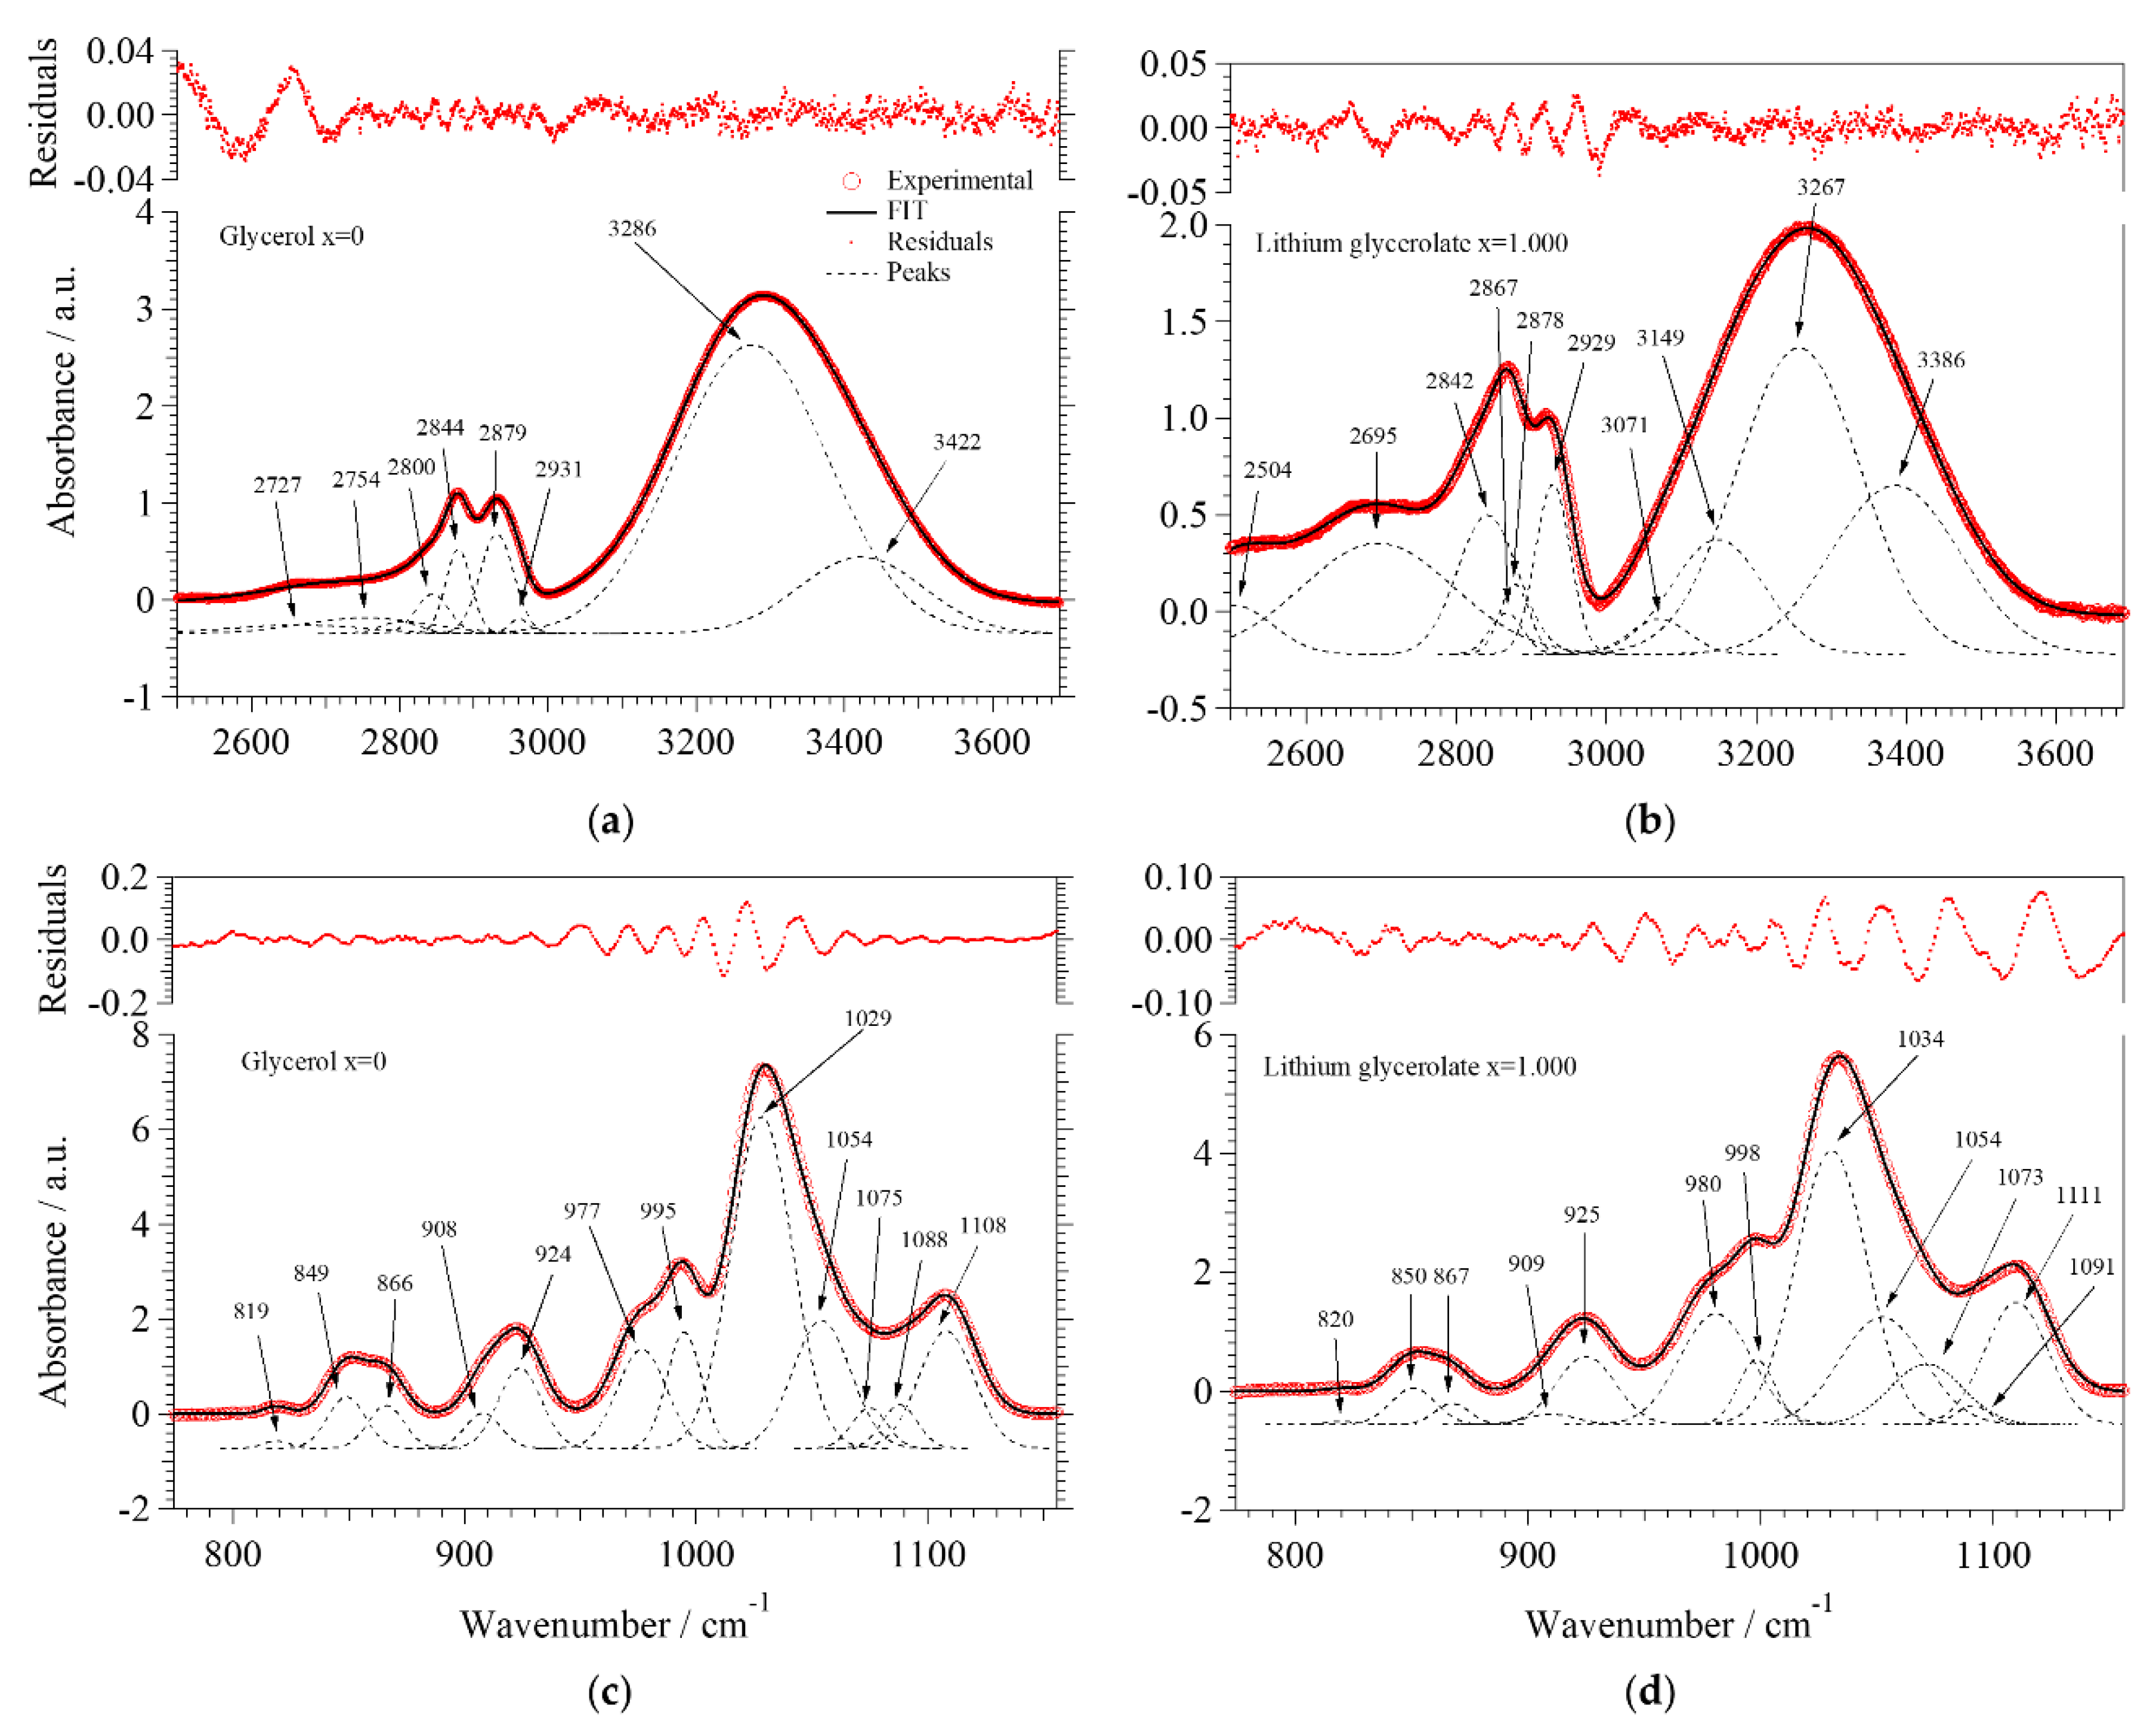
Figure 5.
(a) Semiquantitative analysis of the peaks centered at ca. 3386, 3267, 3149, and 3071 cm−1 as a function of x; (b) Semiquantitative analysis of the peaks in the range 770–1150 cm−1 as a function of x.
Figure 5.
(a) Semiquantitative analysis of the peaks centered at ca. 3386, 3267, 3149, and 3071 cm−1 as a function of x; (b) Semiquantitative analysis of the peaks in the range 770–1150 cm−1 as a function of x.
Figure 6.
Normalized micro-Raman spectra of GlyLix samples.
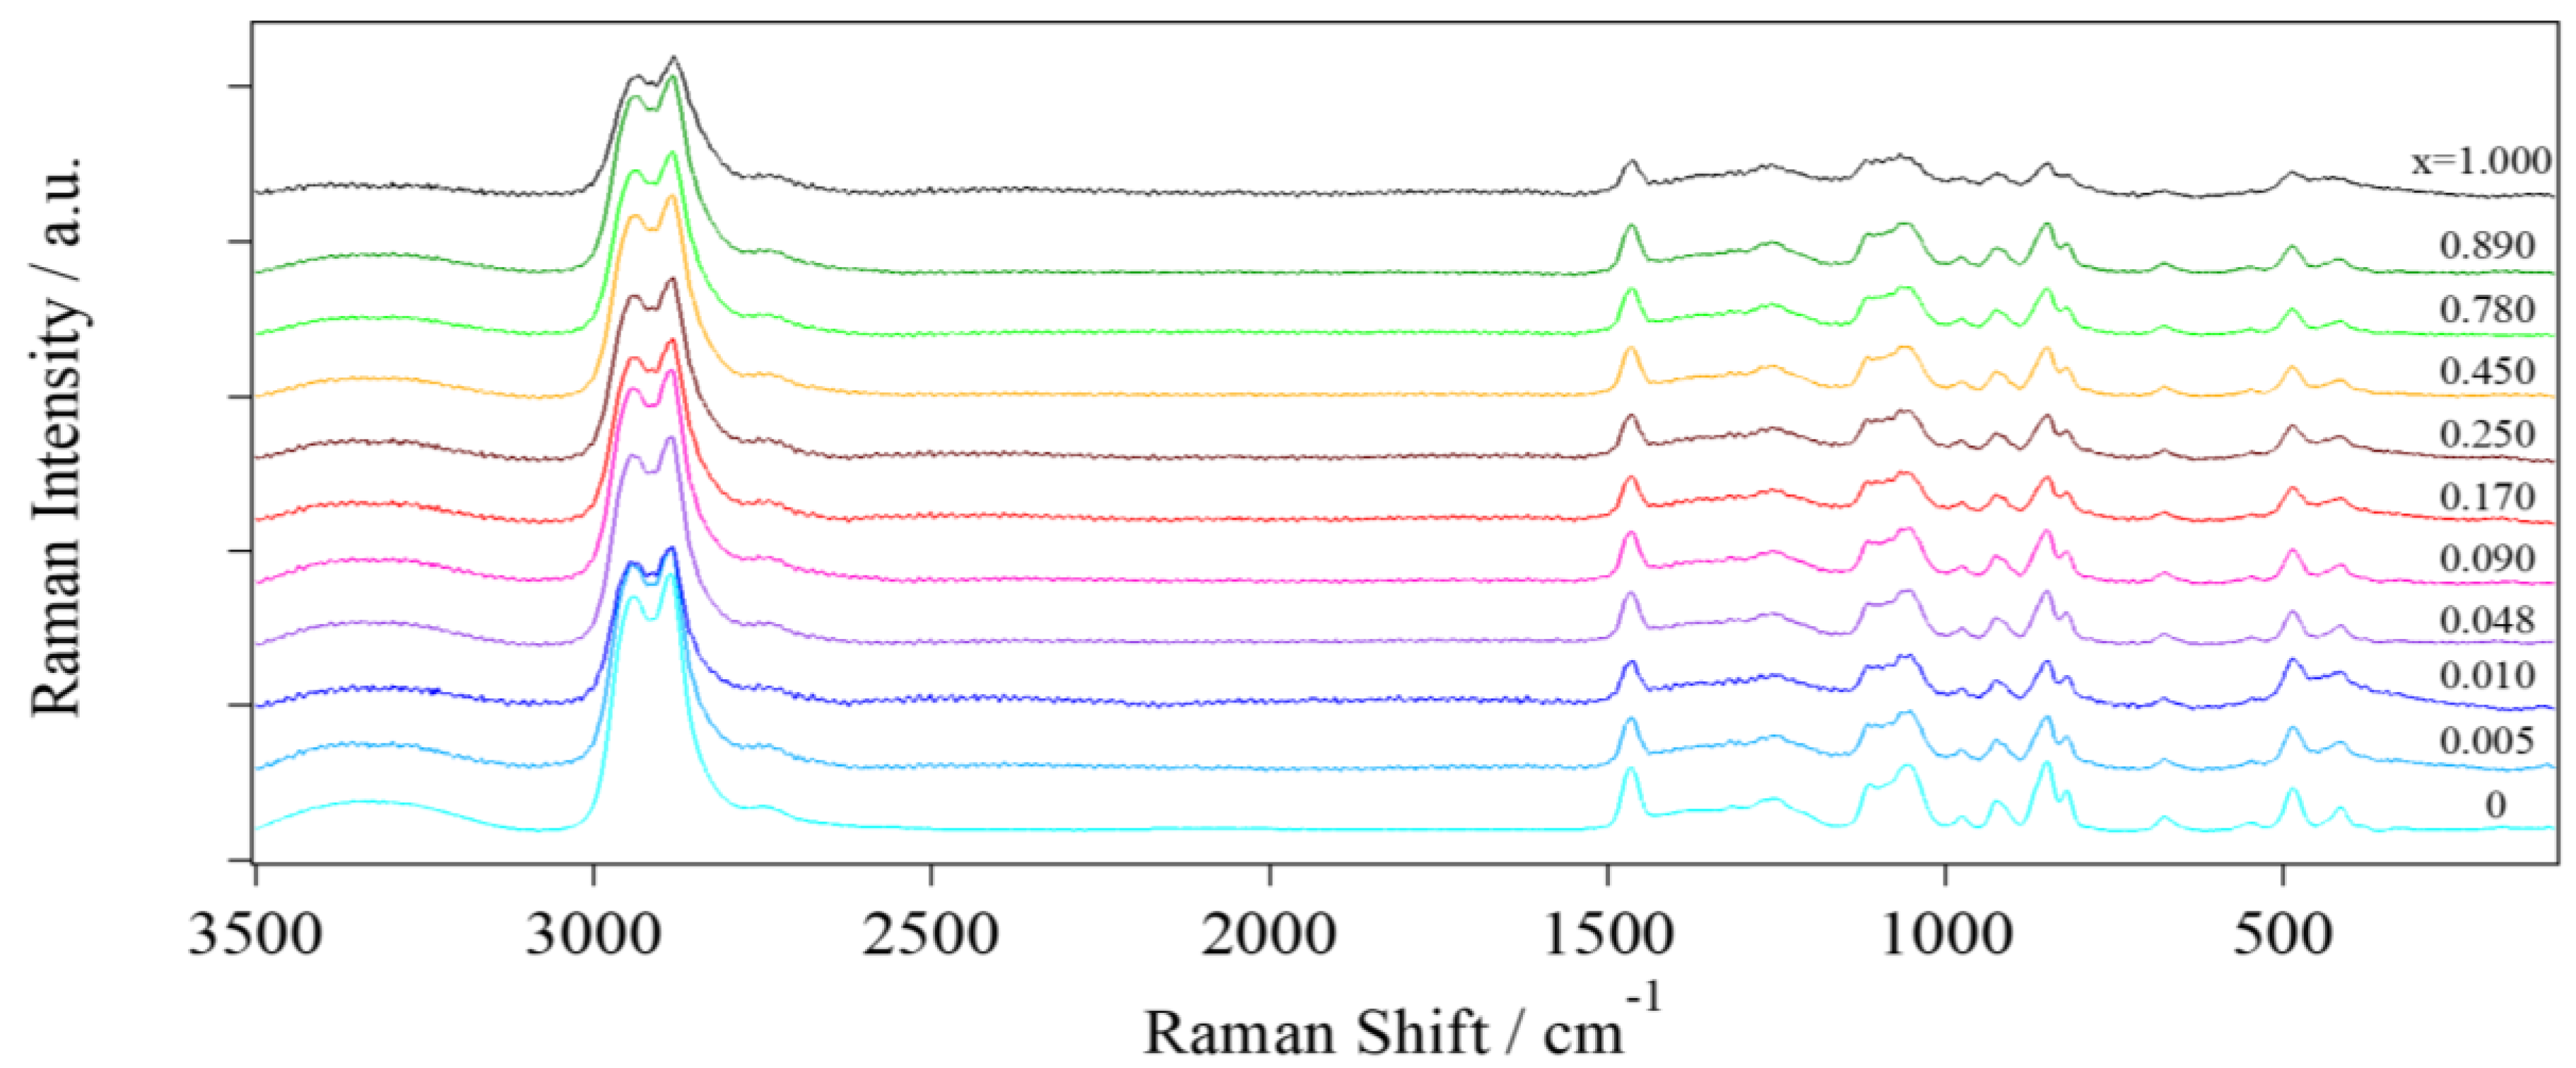
Figure 7.
(a) Thermo-gravimetric analyses of GlyLix. (b) MDSC profiles of GlyLix.
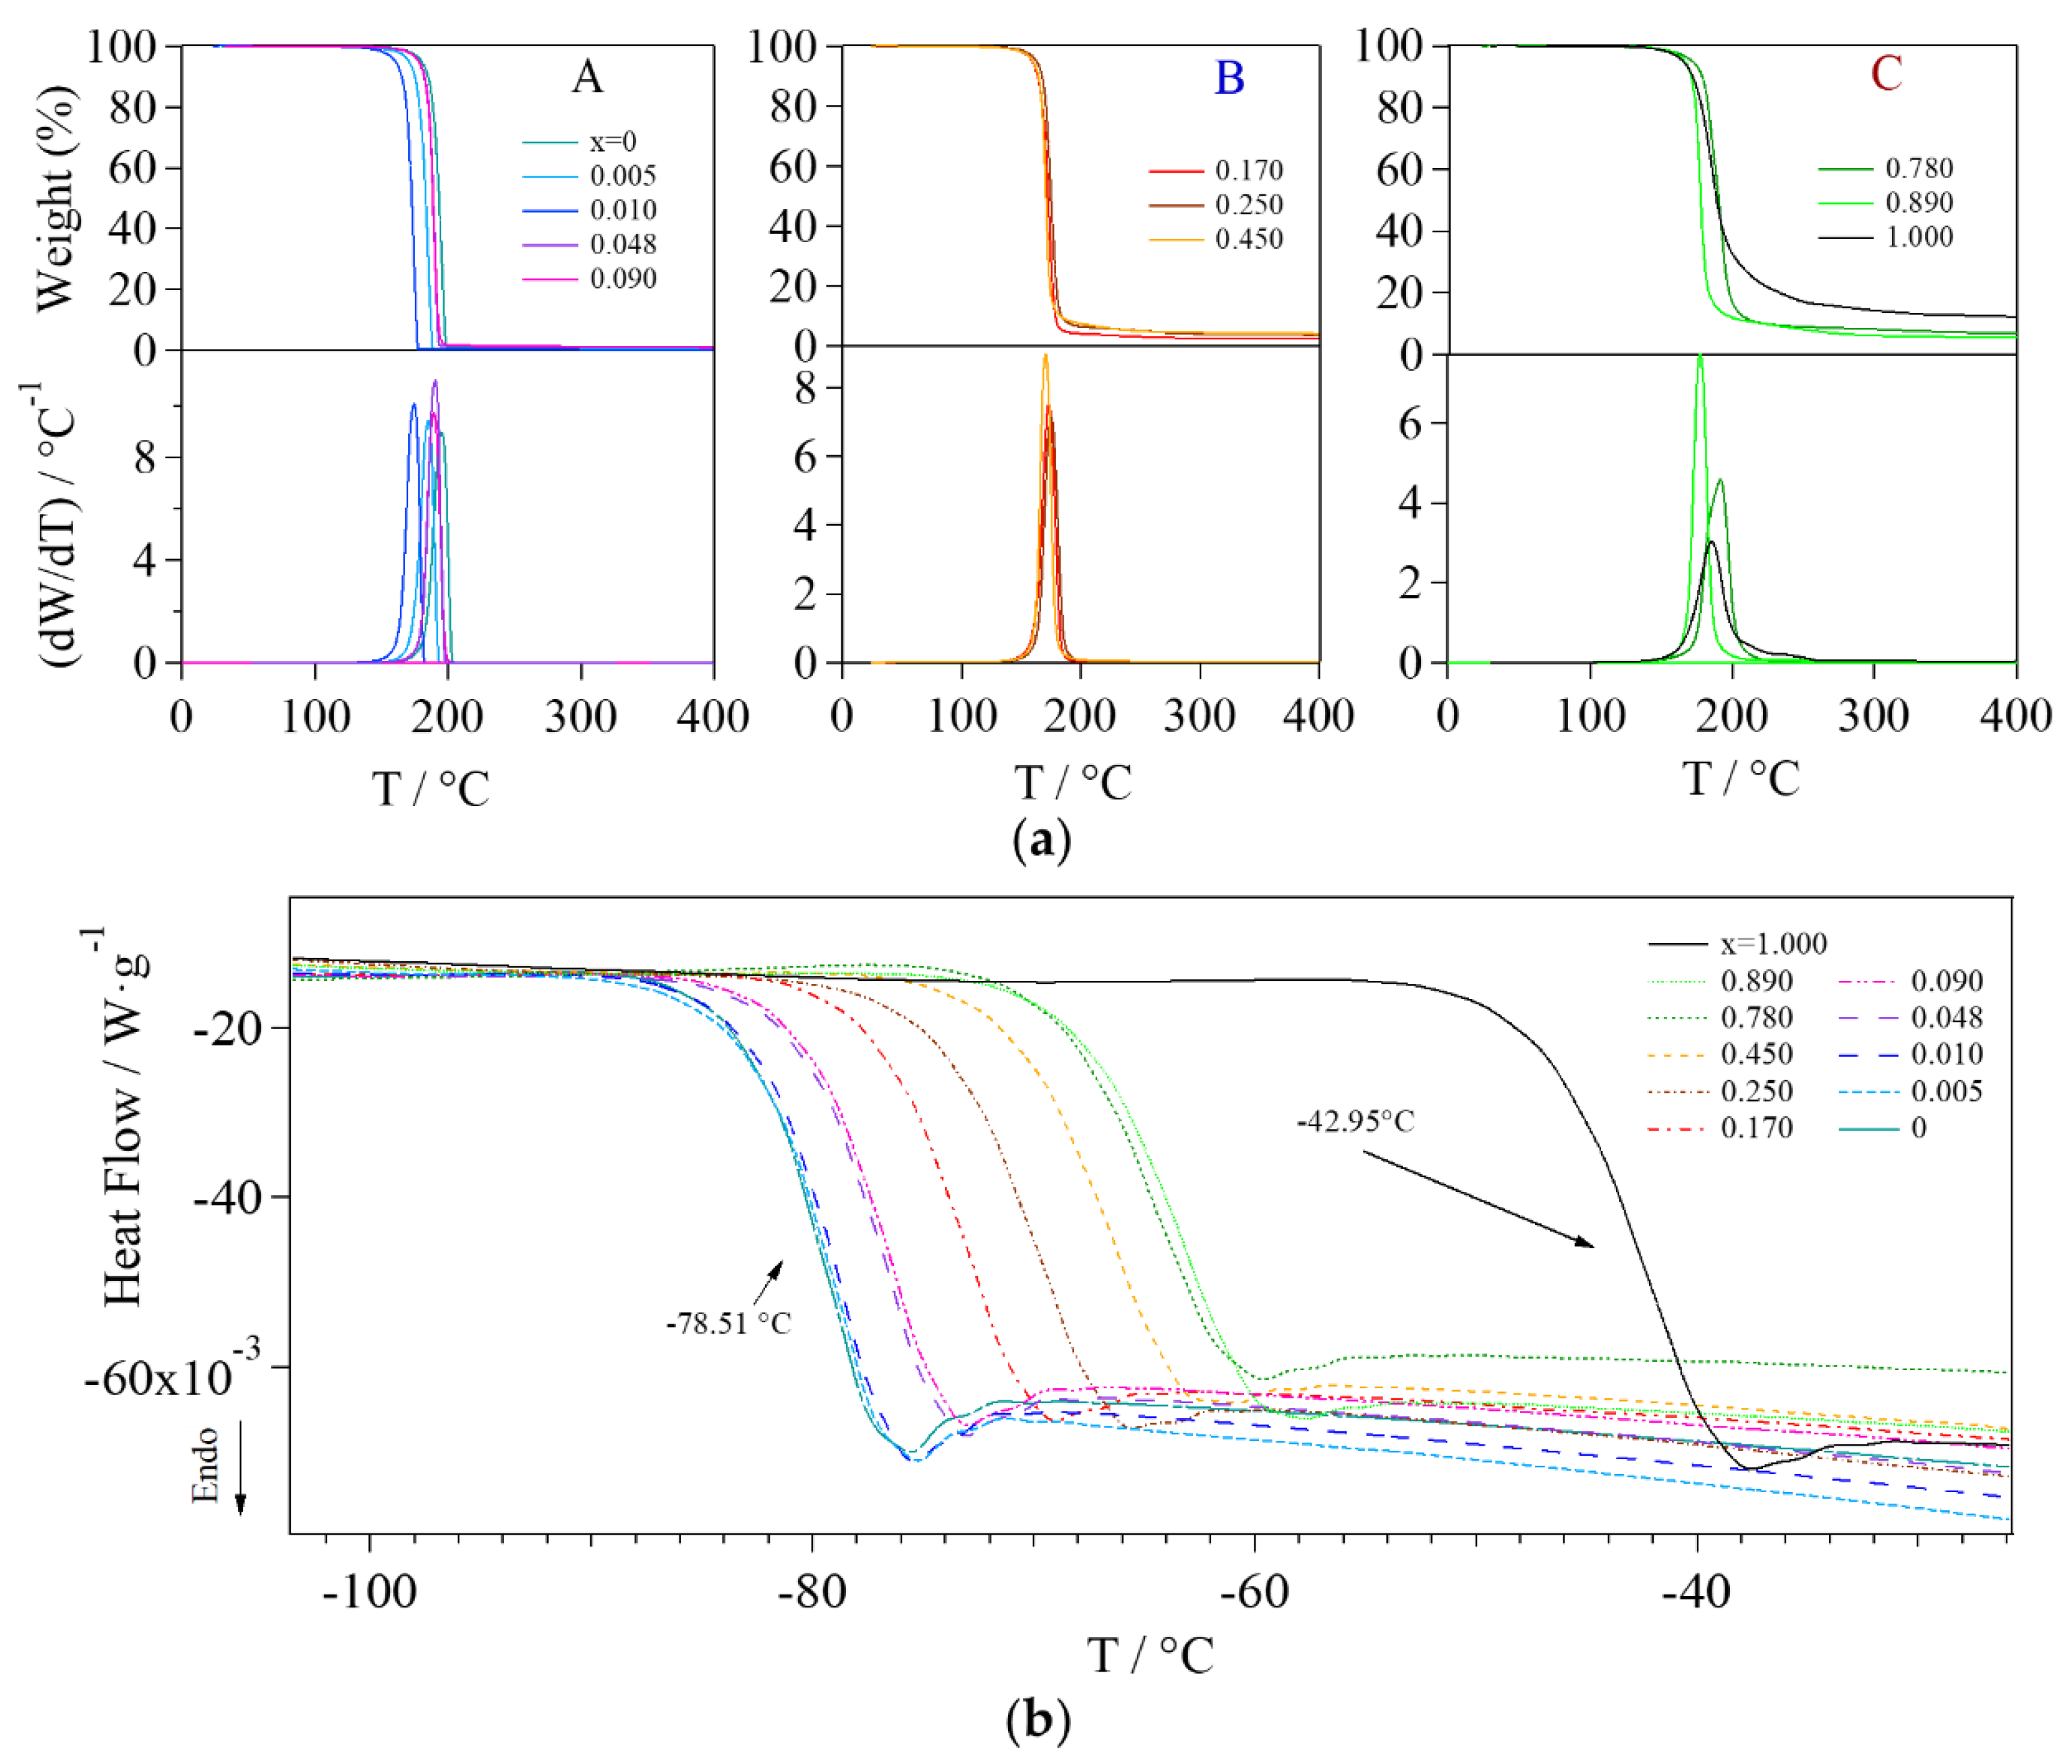
Figure 8.
3D tanδ surfaces of GlyLix samples with x = 0, 0.010, 0.170, and 1.000.

Figure 9.
Log σk vs T−1 curves of each polarization for every sample. Regions I and II are divided by the Tg of the sample.
Figure 9.
Log σk vs T−1 curves of each polarization for every sample. Regions I and II are divided by the Tg of the sample.

Figure 10.
Log σT vs T−1 curves for the various groups of GlyLix samples. Group A: x ≤ 0.090; Group B: 0.170 ≤ x ≤ 0.450; Group C: 0.780 ≤ x ≤ 1.000.
Figure 10.
Log σT vs T−1 curves for the various groups of GlyLix samples. Group A: x ≤ 0.090; Group B: 0.170 ≤ x ≤ 0.450; Group C: 0.780 ≤ x ≤ 1.000.

Figure 11.
Log fj vs T−1 curves of each dielectric relaxation event for every sample. Regions I and II are divided by the Tg of the sample.
Figure 11.
Log fj vs T−1 curves of each dielectric relaxation event for every sample. Regions I and II are divided by the Tg of the sample.
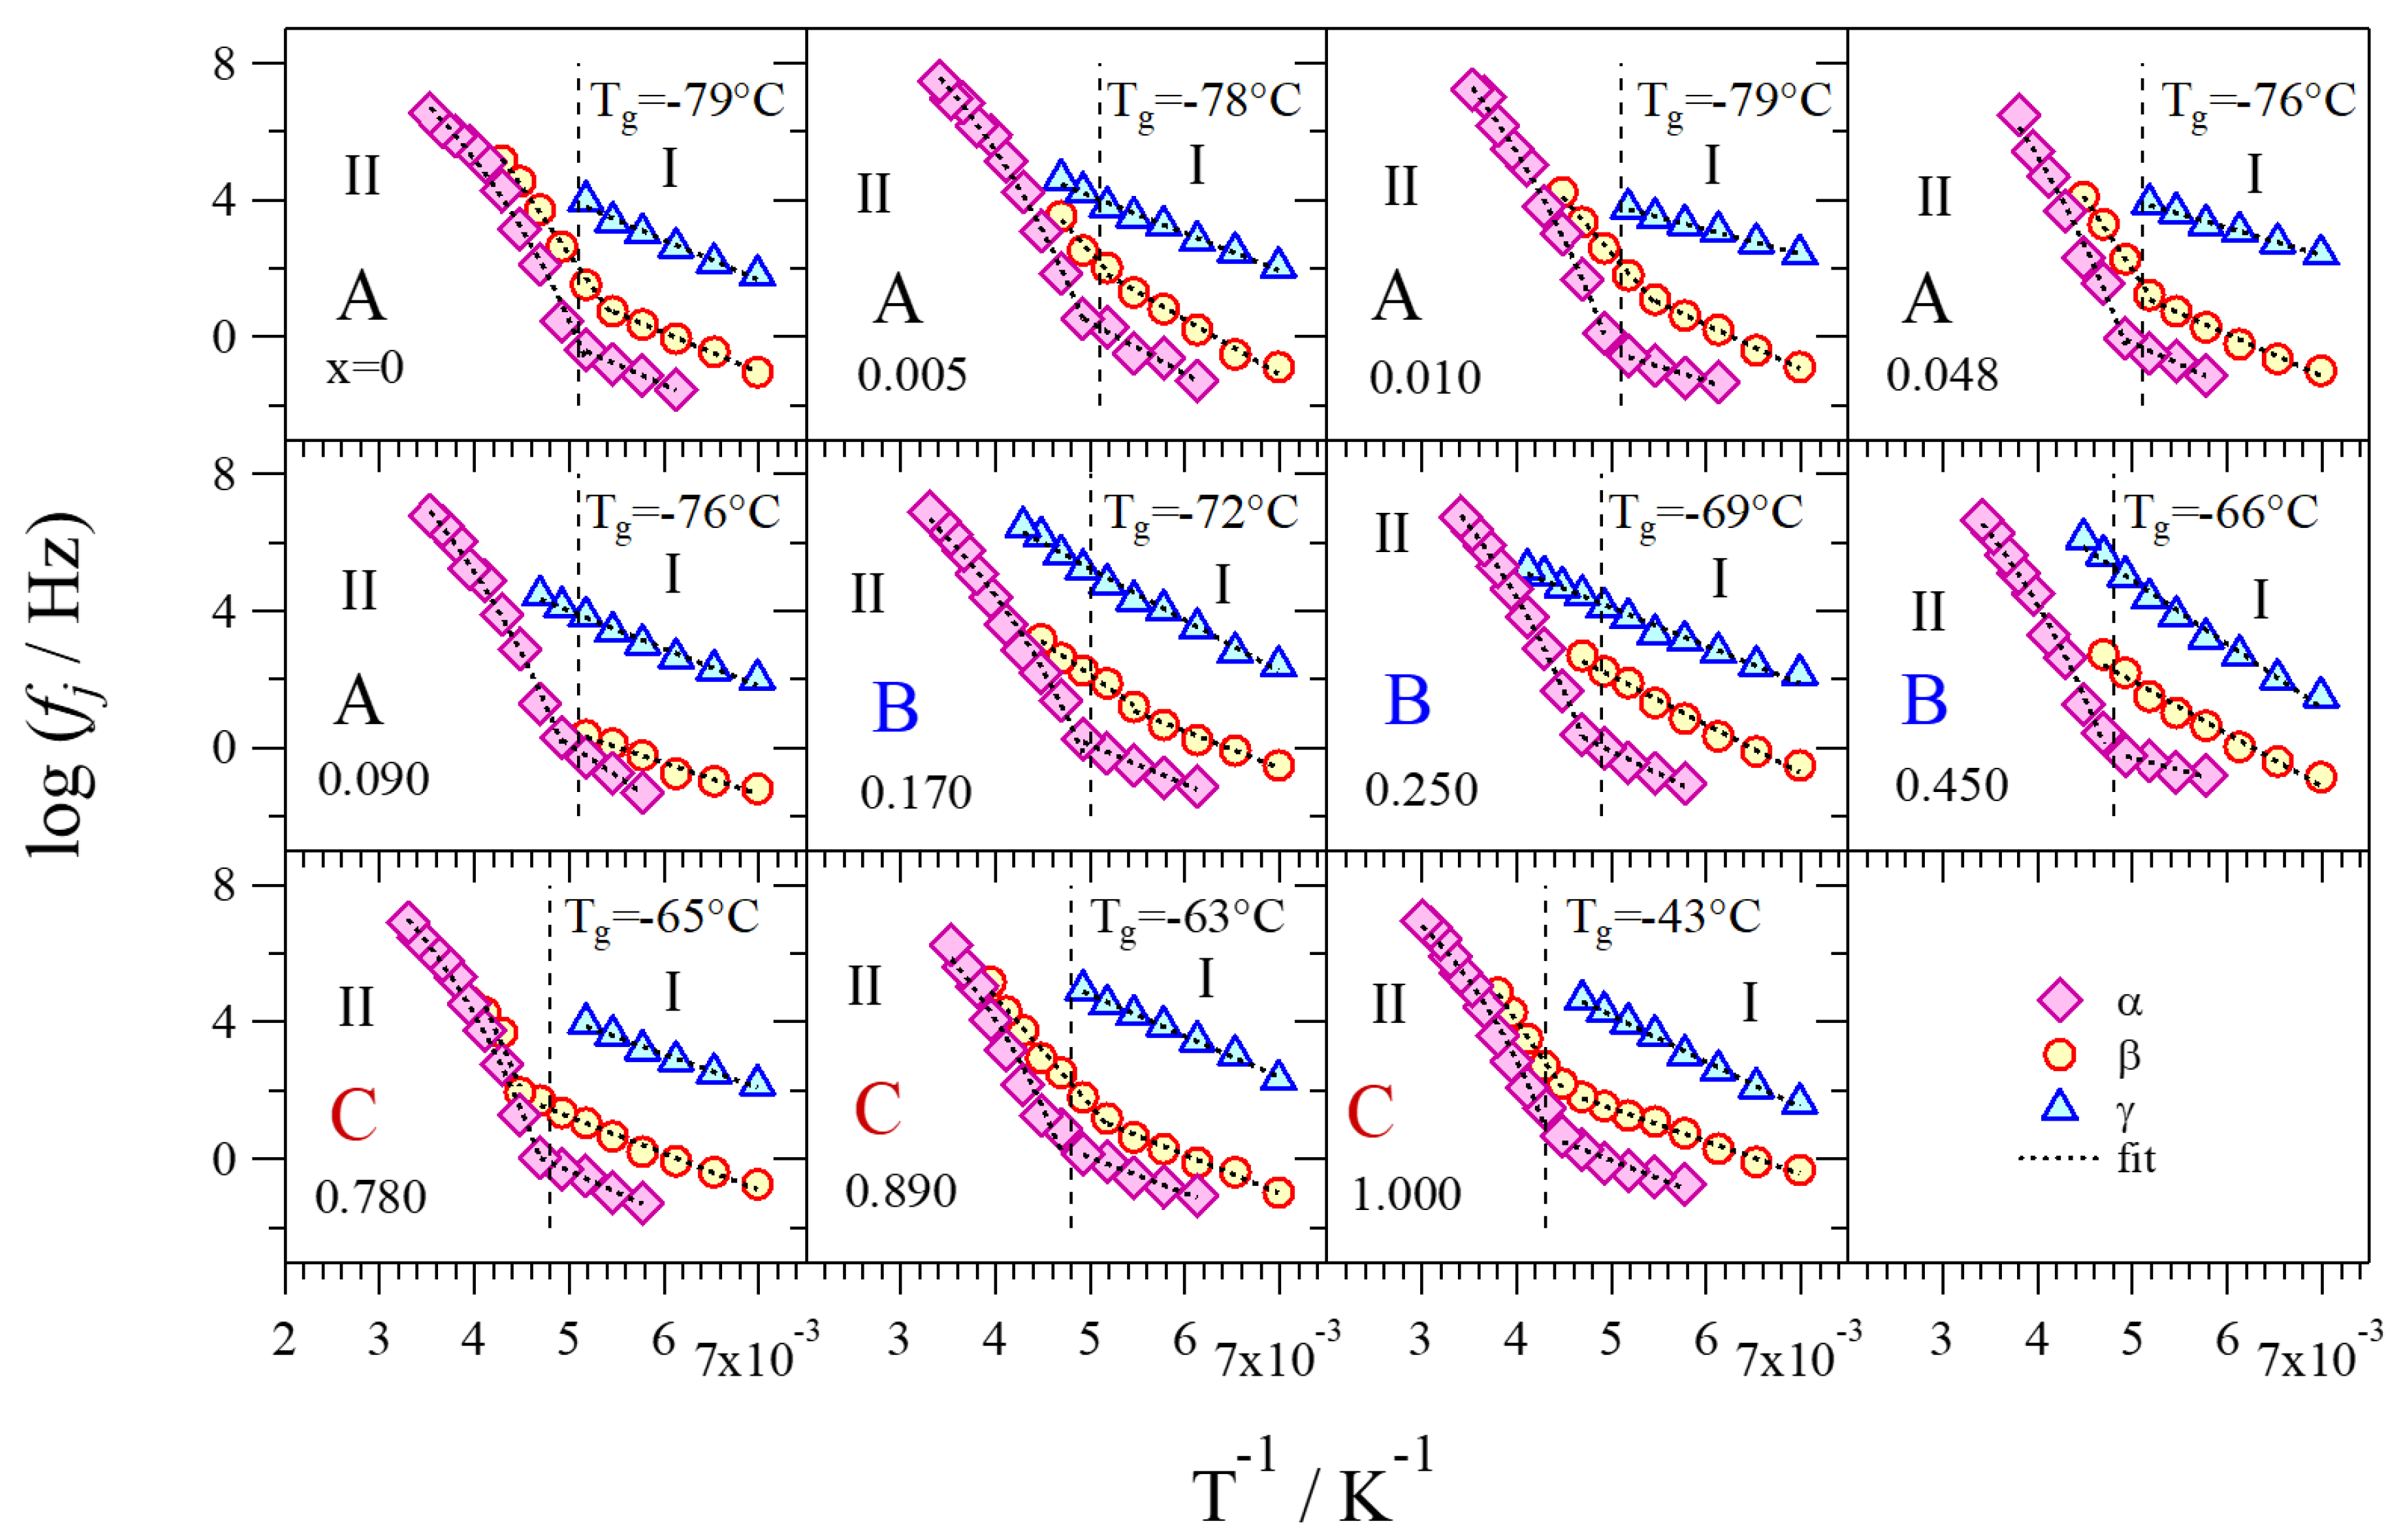
Figure 12.
Activation energies calculated for each polarization phenomenon and relaxation event of every sample. The plot is divided into a low-temperature region (Region I, T < Tg) and a high-temperature region (Region II, T > Tg).
Figure 12.
Activation energies calculated for each polarization phenomenon and relaxation event of every sample. The plot is divided into a low-temperature region (Region I, T < Tg) and a high-temperature region (Region II, T > Tg).

Figure 13.
Average migration distance as a function of the temperature for σEP, σIP,1, σIP,2, and σIP,3.
Figure 13.
Average migration distance as a function of the temperature for σEP, σIP,1, σIP,2, and σIP,3.

Figure 14.
Proposed conduction mechanism for (a) σIP,1, (b) σIP,2, and (c) σIP,3; (d) overall proposed conduction mechanism. The delocalization body (DB) is highlighted with a red dotted line.
Figure 14.
Proposed conduction mechanism for (a) σIP,1, (b) σIP,2, and (c) σIP,3; (d) overall proposed conduction mechanism. The delocalization body (DB) is highlighted with a red dotted line.

Table 1.
Composition of the obtained samples.
| Sample | Li/wt % | nLi/mol·kg−1 | nglycerol/mol·kg−1 | r = nLi/no | x = nLi/nglycerol | y = nGly/nGlyLi |
|---|---|---|---|---|---|---|
| 1 | 7.14 | 10.00 | 10.8 | 0.33 | 1.000 | 0 |
| 2 | 6.30 | 9.67 | 10.2 | 0.30 | 0.890 | 0.12 |
| 3 | 5.55 | 8.47 | 10.3 | 0.26 | 0.780 | 0.28 |
| 4 | 3.30 | 4.92 | 10.5 | 0.15 | 0.450 | 1.22 |
| 5 | 1.83 | 2.69 | 10.7 | 0.082 | 0.250 | 3.00 |
| 6 | 1.23 | 1.79 | 10.7 | 0.055 | 0.170 | 4.88 |
| 7 | 0.68 | 0.99 | 10.8 | 0.030 | 0.090 | 10.1 |
| 8 | 0.36 | 0.52 | 10.8 | 0.016 | 0.048 | 19.8 |
| 9 | 0.08 | 0.11 | 10.8 | 0.0033 | 0.010 | 99.0 |
| 10 | 0.04 | 0.06 | 10.8 | 0.0018 | 0.005 | 200 |
| 11 | 0 | 0 | 10.9 | 0 | 0 | ∞ |
Table 2.
FT-IR and Raman correlational assignments of glycerol (Gly) and lithium glycerolate (GlyLi) samples.
Table 2.
FT-IR and Raman correlational assignments of glycerol (Gly) and lithium glycerolate (GlyLi) samples.
| Glycerol, Gly (x = 0) | Lithium Glycerolate, GlyLi (x = 1.000) | ||||
|---|---|---|---|---|---|
| ωIR 1/cm−1 | ωRaman/cm−1 | ωIR/cm−1 | ωRaman/cm−1 | Assignment 2 | Ref. |
| 3422 (s) | − | 3386 (s) | − | νf(OH) | [19,23,24] |
| 3286 (vs) | 3350 (s) | 3267 (vs) | 3350 (s) | νHy(OH) | [19,23,24] |
| − | − | 3149 (m) | − | νg3Li(OH) | [this work] |
| − | − | 3071 (w) | − | νg2Li(OH) | [this work] |
| − | 2966 (wv) | − | 2967 (w) | νg2,a(CH) | [this work] |
| 2931 (m) | 2945 (vs) | 2929 (m) | 2945 (vs) | νg1,a(CH) | [19,23,24] |
| − | 2909 (w) | − | 2909 (s) | νg2,s(CH) | [this work] |
| − | 2885 (vs) | − | 2885 (vs) | νg1,s(CH) | [19,23,24] |
| 2879 (m) | 2874 (m) | 2878 (m) | 2876 (m) | νg3,a(CH) | [19,23,24] |
| − | − | 2867 (m) | − | νg3,a(CH) | [this work] |
| 2844 (m) | 2831 (s) | 2842 (w) | − | νg3,s(CH) | [this work] |
| 2800 (w) | − | − | − | νg3,s(CH) | [this work] |
| 2754 (vw) | 2741 (vw) | 2695 (vw) | 2736 (w) | νs(CH of C2) | [19,23,24] |
| 2727 (vw) | − | − | − | νs(CH of C2) | [this work] |
| − | − | 2504 (vw) | − | ν(CH) | [this work] |
| − | 1465 (s) | − | 1464 (s) | sr(CH2) | [19,23,24] |
| 1416 (s) | − | 1435 (s) | − | δip(OH),ω(CH2) | [19,23,24] |
| 1323 (m) | 1313 (vw) | 1336 (m) | 1313 (vw) | δip(OH),ω(CH) | [19,23,24] |
| 1210 (w) | 1253 (v) | 1225 (vs) | 1253 (v) | δip(OH),ω(CH) | [19,23,24] |
| 1108 (vs) | 1112 (s) | 1111 (m) | 1112 (s) | νg3,sec(C–C–O) | [19,23,24] |
| 1088 (w) | − | 1091 (w) | − | νg1,sec(C–C–O) | [this work] |
| 1075 (w) | − | 1073 (w) | − | νg2,sec(C–C–O) | [this work] |
| 1054 (m) | − | 1054 (m) | − | νg3,pri(C–C–O) | [this work] |
| 1029 (vs) | 1055 (s) | 1034 (vs) | 1055 (s) | νg1,pri(C–C–O) | [19,23,24] |
| 995 (s) | 975 (w) | 998 (sh) | 975 (w) | νa(CO),T | [19,23,24] |
| 977 (s) | − | 980 (s) | − | νs(CO),T | [this work] |
| 924 (m) | 922 (m) | 925 (m) | 922 (m) | νa(CO),G | [19,23,24] |
| 908 (vw) | − | 909 (vw) | − | νs(CO),G | [this work] |
| 866 (w) | − | 867 (w) | − | νa,pri(C–C–C) | [this work] |
| 849 (m) | 850 (s) | 850 (m) | 850 (s) | νs,pri(C–C–C) | [19,23,24] |
| 819 (vw) | 820 (m) | 820 (vw) | 820 (m) | νpri(C–C–C) | [19,23,24] |
| 639 (m, sh) | 673 (w) | 630 (m, sh) | 673 (w) | δ(C–C–O) | [19,23,24] |
| 550 (s) | 548 (w) | 563 (w) | 548 (w) | φ(C–C) | [19,25] |
| 488 (s) | 484 (m) | 493 (m) | 484 (m) | ρ(C–C–O) | [19,25] |
| 413 (m) | 413 (m) | ρ(C–C–O) | [19,25] | ||
| 327 (vw) | 327 (vw) | φ(C–C), δ(C–C–O) | [19] | ||
1 Relative intensities are shown in parentheses: vs: very strong; s: strong; m: medium; w: weak; vw: very weak; sh: shoulder. 2 ν: stretching; δ: bending; sr: scissoring; ω: wagging; φ: internal rotations; ρ: rocking a: antisymmetric mode; s: symmetric mode; f: free; Hy: involved in a hydrogen bonding; Li: coordinate to lithium; g1: g1 coordination geometry; g2: g2 coordination geometry; g3: g3 coordination geometry; ip: in-plane; pri: primary alcohol; sec: secondary alcohol; T: trans; G: gauche.
Table 3.
Coordination geometries and thermal results of Gly and GlyLix electrolytes.
| x | Group | Coordination Geometry 1 | Tdec. 2/°C | Tg 3/°C | ΔHer 4/J·g−1 |
|---|---|---|---|---|---|
| 0 | A | g1 | 195.09 | −78.51 | −2.476 |
| 0.005 | A | g1 | 195.03 | −78.22 | −2.267 |
| 0.010 | A | g1 | 190.38 | −78.53 | −2.521 |
| 0.048 | A | g1 | 190.19 | −76.18 | −1.877 |
| 0.090 | A | g1 | 188.95 | −76.17 | −2.057 |
| 0.170 | B | g2.1 and g.2.2 | 172.77 | −72.35 | −2.096 |
| 0.250 | B | g2.1 and g.2.2 | 174.79 | −69.07 | −2.077 |
| 0.450 | B | g2.1 and g.2.2 | 170.14 | −66.15 | −1.84 |
| 0.780 | C | g3 | 191.34 | −64.93 | −1.637 |
| 0.890 | C | g3 | 177.09 | −63.04 | −3.483 |
| 1.000 | C | g3 | 185.42 | −42.95 | −3.29 |
1 Results obtained from the fitting of FT-IR and micro-Raman spectra. 2 Decomposition temperature obtained from TGA measurements. 3 Glass transition temperatures are evaluated from modulated differential scanning calorimetry (MDSC) measurements. 4 Relaxation enthalpies are calculated from MDSC measurements.
© 2018 by the authors. Licensee MDPI, Basel, Switzerland. This article is an open access article distributed under the terms and conditions of the Creative Commons Attribution (CC BY) license (http://creativecommons.org/licenses/by/4.0/).
Share and Cite
MDPI and ACS Style
Pagot, G.; Tonello, S.; Vezzù, K.; Di Noto, V. A New Glass-Forming Electrolyte Based on Lithium Glycerolate. Batteries 2018, 4, 41. https://doi.org/10.3390/batteries4030041
AMA Style
Pagot G, Tonello S, Vezzù K, Di Noto V. A New Glass-Forming Electrolyte Based on Lithium Glycerolate. Batteries. 2018; 4(3):41. https://doi.org/10.3390/batteries4030041
Chicago/Turabian StylePagot, Gioele, Sara Tonello, Keti Vezzù, and Vito Di Noto. 2018. "A New Glass-Forming Electrolyte Based on Lithium Glycerolate" Batteries 4, no. 3: 41. https://doi.org/10.3390/batteries4030041
Note that from the first issue of 2016, this journal uses article numbers instead of page numbers. See further details here.