Article

Studies on MgNi-Based Metal Hydride Electrode with Aqueous Electrolytes Composed of Various Hydroxides

1
BASF/Battery Materials-Ovonic, 2983 Waterview Drive, Rochester Hills, MI 48309, USA
2
Department of Chemical Engineering and Materials Science, Wayne State University, Detroit, MI 48202, USA
*
Author to whom correspondence should be addressed.
Batteries 2016, 2(3), 27; https://doi.org/10.3390/batteries2030027
Submission received: 20 April 2016 / Revised: 19 July 2016 / Accepted: 10 August 2016 / Published: 19 August 2016
(This article belongs to the Special Issue Nickel Metal Hydride Batteries)

Abstract

:
Compositions of MgNi-based amorphous-monocrystalline thin films produced by radio frequency (RF) sputtering with a varying composition target have been optimized. The composition Mg52Ni39Co3Mn6 is identified to possess the highest initial discharge capacity of 640 mAh·g−1 with a 50 mA·g−1 discharge current density. Reproduction in bulk form of Mg52Ni39Co3Mn6 alloy composition was prepared through a combination of melt spinning (MS) and mechanical alloying (MA), shows a sponge-like microstructure with >95% amorphous content, and is chosen as the metal hydride (MH) alloy for a sequence of electrolyte experiments with various hydroxides including LiOH, NaOH, KOH, RbOH, CsOH, and (C2H5)4N(OH). The electrolyte conductivity is found to be closely related to cation size in the hydroxide compound used as 1 M additive to the 4 M KOH aqueous solution. The degradation performance of Mg52Ni39Co3Mn6 alloy through cycling demonstrates a strong correlation with the redox potential of the cation in the alkali hydroxide compound used as 1 M additive to the 5 M KOH aqueous solution. NaOH, CsOH, and (C2H5)4N(OH) additions are found to achieve a good balance between corrosion and conductivity performances.

Graphical Abstract

1. Introduction

Mg-based metal hydride (MH) alloys are very attractive for various hydrogen storage applications due to Mg’s abundance, low cost, light weight, and the availability of many intermetallic compounds. In particular, two groups of MgNi-based MH alloys have been proposed for use as the negative electrode active material in nickel/metal hydride (Ni/MH) battery: amorphous MgNi and crystalline Mg2Ni. The former has a higher initial discharge capacity but a much lower cycle stability due to its amorphous nature, which makes protection layer formation very difficult compared to that in the latter [1]. Research into these two alloy families were reviewed in 2013 [2]. More recently, additives such as B [3], Ti [4,5], Pt [4], Pd [4], Nd [6], Cr [7], AB5 [8], La [9], Co [10], nano-sized Ni [11], Li [12], and Cu [5,13] were added to the bulk or surface of Mg2Ni-based MH alloys to improve the capacity, cycle stability, and high-rate dischargeability (HRD). For MgNi-based MH alloys, TiO2 addition [14], Ni coating [15], Mn substitution [16], and Nb substitution [17] were experimented for electrochemical property enhancements. Alloy modifications including annealing, addition of anti-corrosion agents, and composition modification in both the surface and bulk, control of charge input, and alloy particle size selection have been previously proposed to improve the cycle stability of MgNi-based electrodes [18,19,20,21], but reducing the corrosive nature of electrolyte has never been investigated. Advantages of the current method that uses 30 wt% KOH aqueous solution as the electrolyte are low cost, high ionic conductivity, low toxicity, and low freezing point. However, KOH aqueous solution at such concentration rapidly reacts with amorphous MgNi MH alloy. Therefore, an adjustment in electrolyte composition is necessary to balance some of the high ionic conductivity with a reduction in corrosive nature of electrolyte. Salt additives in KOH aqueous solution were previously investigated as the modified electrolytes in our laboratory, and the results have been reported [22], leaving cations in various hydroxides as the main topic in this paper.
Many studies investigating the alkali cation species and electrolyte concentrations in Ni/MH battery were previously conducted and are summarized in Table 1. However, none of these studies focused on amorphous MgNi MH alloy, which has the highest capacity but is also the most susceptible to electrolyte oxidation. Furthermore, while there is only a limited number of soluble inorganic hydroxides, several organic hydroxides are available. The cations of organic hydroxides are much larger than those in inorganic hydroxides, and their effects on electrochemical performances as the electrolyte additives is a subject of acute interest. Therefore, a study of inorganic and organic hydroxides in electrolyte was launched in the U.S. Department of Energy (DOE)-sponsored Robust Affordable Next Generation EV-storage (RANGE) program [23], and the obtained results are summarized in this paper. We will discuss MgNi-based thin film composition optimization, bulk MgNi-based alloy powder process optimization, electrolyte conductivity, and, finally, MgNi-based electrode degradation in electrolytes composed of various hydroxides.

2. Experimental Setup

Thin film was prepared using the radio frequency (RF) sputtering technique with an MRC Model 8667 RF Sputtering System (Material Research Corporation, Gilbert, AZ, USA). Bulk powder was prepared by a combination of melt spinning (MS) and mechanical alloying (MA) processes, which were conducted using a homebuilt system with a 2 kg induction furnace and a 20″ diameter rotating copper wheel (rotation speed up to 100 rpm) and a SC-10 attritor (Union Process, Akron, OH, USA), respectively. Microstructure was examined via a Philips X’Pert Pro X-ray diffractometer (XRD, Philips, Amsterdam, The Netherlands) and a CM200/FEG transmission electron microscope (TEM, Philips). Electrochemical testing was performed with a CTE MCL2 Mini cell test system (Chen Tech Electric MFG. Co., Ltd., New Taipei, Taiwan). Approximately 70 mg of AR3 (Mg52Ni39Co3Mn6) alloy powder, made by MS + MA, was compacted onto an expanded nickel substrate using a 10 ton press to form the negative working electrode, which was approximately 0.2 mm in thickness, without any binder. Different concentrations of KOH aqueous solutions (up to 6 M) and various levels of X(OH)y (X = Li, Na, Rb, Cs, tetraethylammonium (tEA, (C2H5)4N), Mg, Ca, Sr, or Ba, y = 1 or 2) replacements/additions in KOH aqueous solutions (with the total concentration of OH up to 6.5 M) were prepared and used as the electrolyte. Two halves of a sintered Ni(OH)2-positive electrode, each 1 cm2 in area and 1.5 mm in thickness, were connected by a nickel tab strip and used as the counter electrode. A piece of grafted polypropylene/polyethylene separator was folded in half twice and used to sandwich the negative electrode, so that two layers of separator were on each side of the negative electrode. Next, the wrapped negative electrode was again sandwiched with the two halves of positive electrode. The electrode assembly was placed into a plastic sleeve, which was then slid into an acrylic cell holder. The sleeve was filled with the electrolyte using a pipette. After absorbing the electrolyte for five minutes, the sleeve was refilled with the electrolyte so that the half-cell is in a flooded cell configuration. For the discharge capacity measurement, the half-cell was first charged at a current density of 100 mA·g−1 for 5 h and then discharged at a current density of 100 mA·g−1 until a cut-off voltage of 0.9 V was reached. Then, the cell was discharged at a current density of 24 mA·g−1 until a cut-off voltage of 0.9 V was reached, and finally discharged at a current density of 8 mA·g−1 until a cut-off voltage of 0.9 V was reached. There were 10 cycles of the charge/discharge procedure performed for each half-cell. Full discharge capacity is the sum of capacities measured at 100, 24, and 8 mA·g−1 for each cycle. Electrolyte conductivity was measured with an YSI Model 3200 Conductivity Meter (YSI Incorporated, Yellow Springs, OH, USA).

3. Results

The current study begins with MgNi-based alloy composition optimization, which is performed with thin film deposition using RF sputtering technique. After identifying the compositions that demonstrated the highest electrochemical capacities in the thin film form, bulk powder process consisting of MS + MA was adopted to reproduce the optimized compositions. Once the electrochemical performances of alloys in the bulk form were confirmed, the most suitable alloy composition in the bulk form was then selected for the investigation on modified electrolytes composed of various hydroxides. The abovementioned developments are discussed in detail in the following sections.

3.1. MgNi-Based Thin Film Prepared by Radio Frequency Sputtering

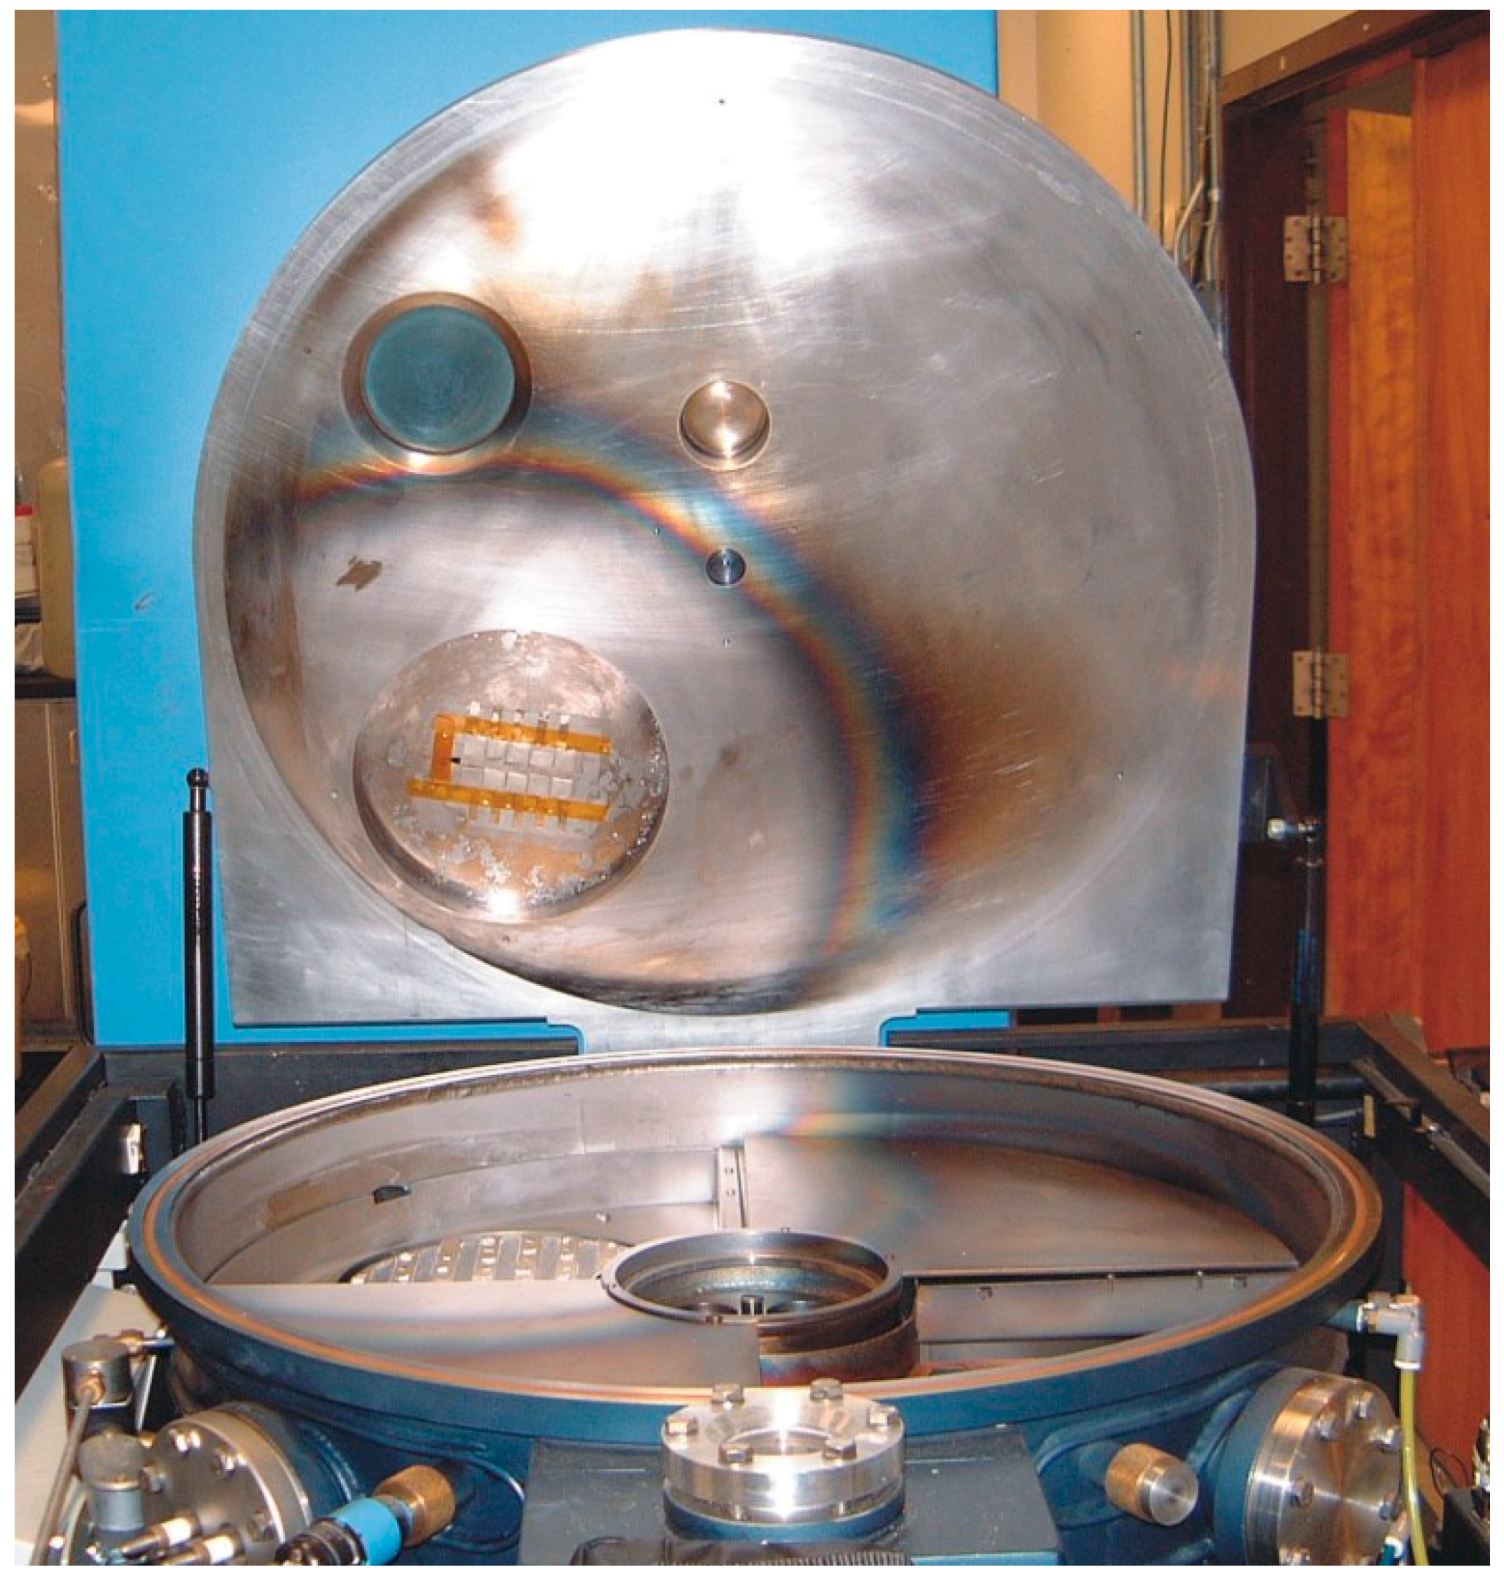
Thin film deposition was performed in a multi-target RF sputtering unit with a modified target and sample holder (Figure 1). The deposition rate was approximately 0.5 μm·h
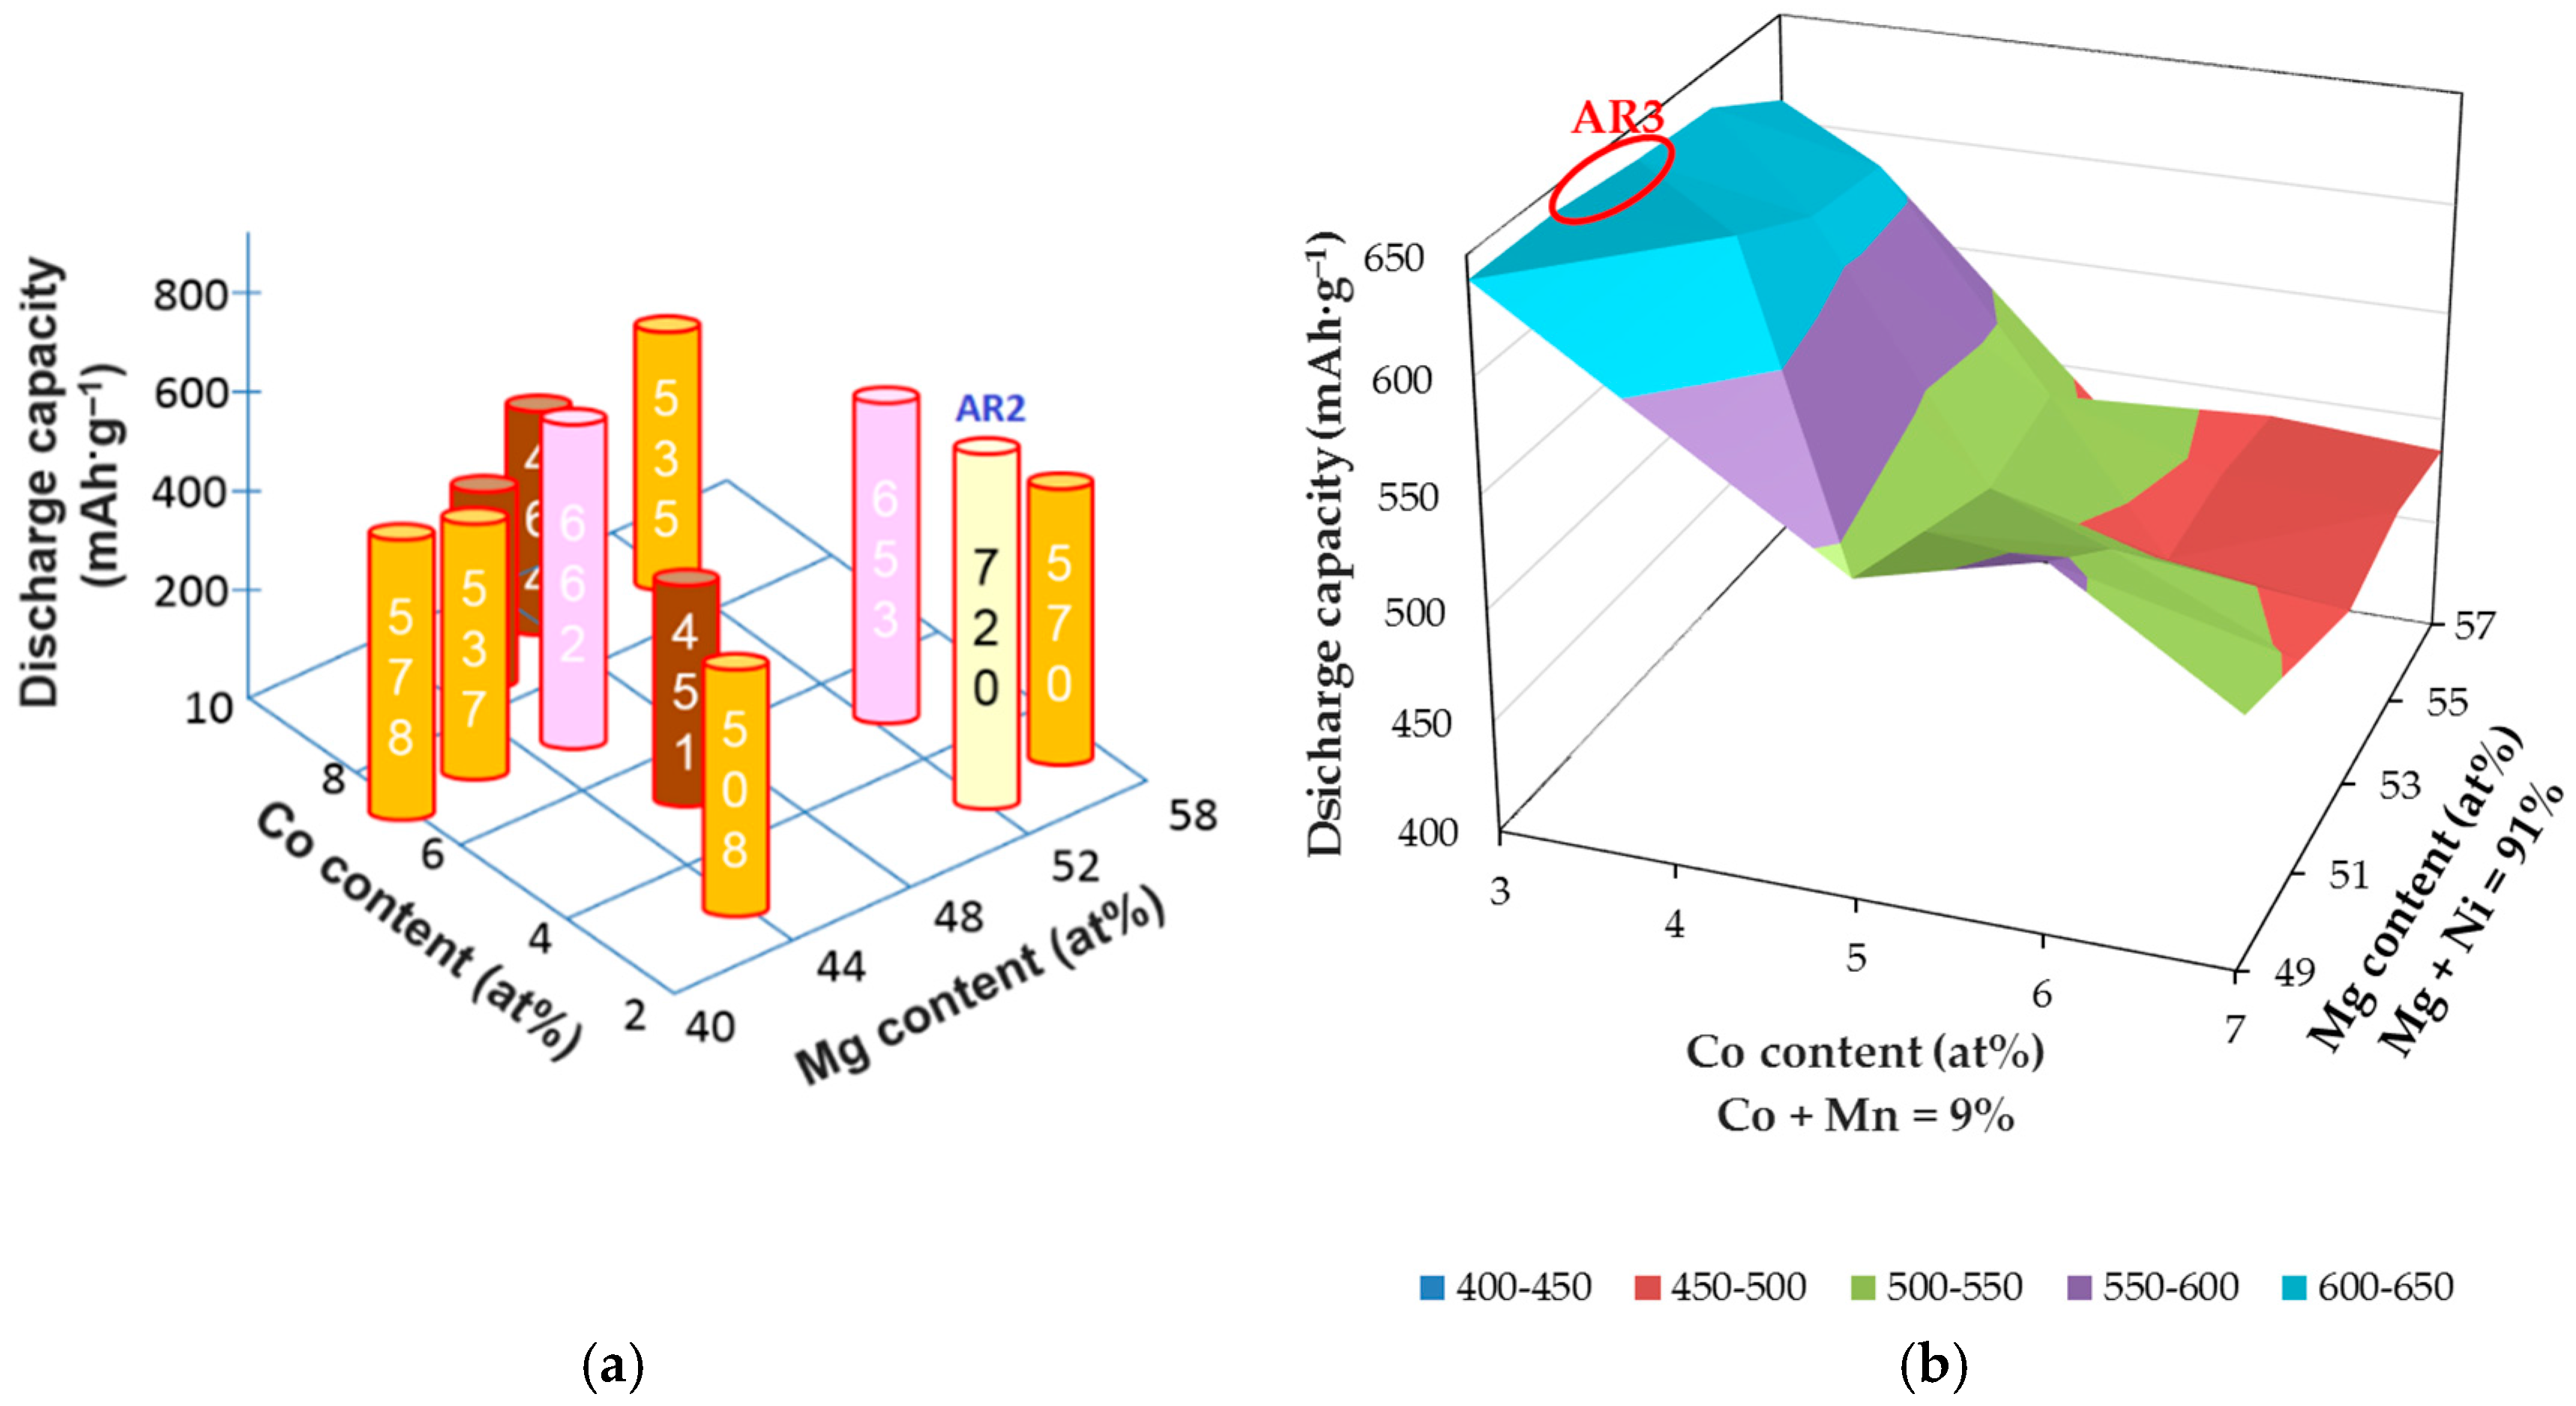
−1, and the resulting average film thickness was approximately 1 μm. In each run, 10–25 nickel substrates (1 cm × 1 cm) were deposited by thin films with different compositions, which were determined by energy-dispersive X-ray spectroscopy from the silicon witness samples placed among the nickel substrates. Results from the binary composition optimization are shown in Table 2. Discharge capacity maximizes at the composition Mg52Ni48 (AR1), which is used as the basis for ternary Mg-Ni-Co and then quaternary Mg-Ni-Co-Mn composition optimizations (Figure 2). Among all the compositions in the ternary and quaternary matrices, AR2 (Mg52.1Ni45.1Co2.8) and AR3 (Mg52Ni39Co3Mn6) demonstrate the highest discharge capacities, respectively (
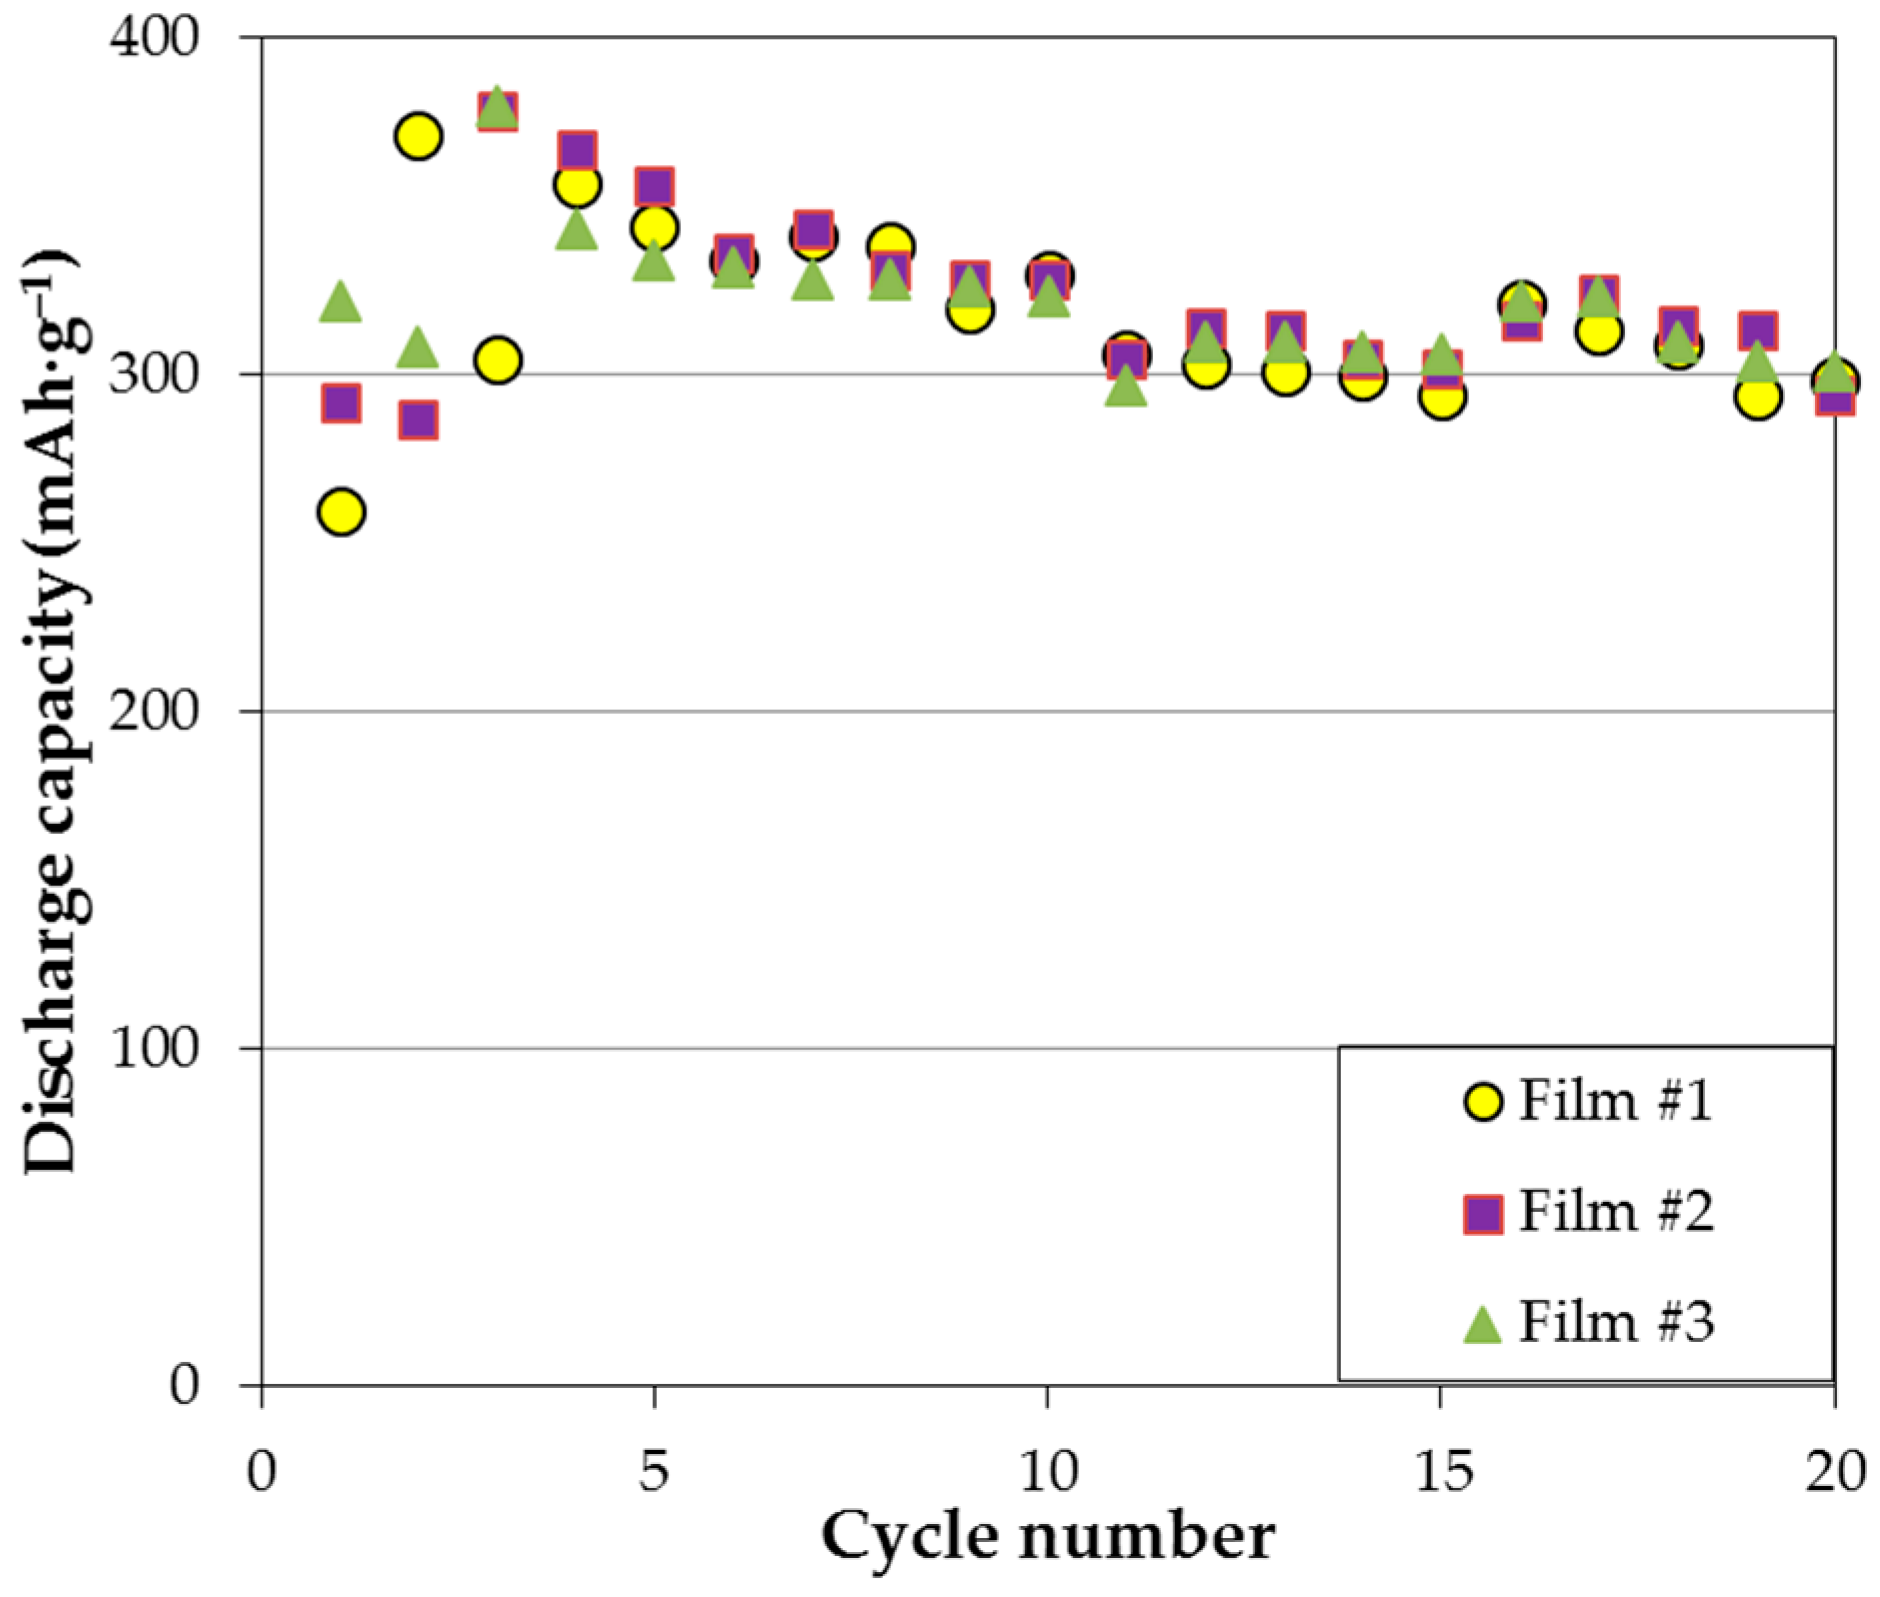
Table 3). Furthermore, the cycle stabilities of several RF-sputtered thin films are shown in Figure 3, where three films with different chemical positions show similar capacity degradation in the first 20 cycles. More specifically, two or three activation cycles are needed for the thin film electrodes; once the electrodes are fully activated, steady capacity degradation is observed until around cycle 10; capacity remains stable thereafter. According to the XRD analysis, formation of Mg(OH)2 on the surface impedes further electrochemical reaction and is the major source for capacity degradation (approximately 1.2% per cycle).

3.2. MgNi-Based Alloy Powder Prepared by Melt Spinning + Mechanical Alloying

According to the Mg-Ni binary phase diagram, AR2 and AR3 compositions cannot be reproduced by the conventional melt-and-cast method [
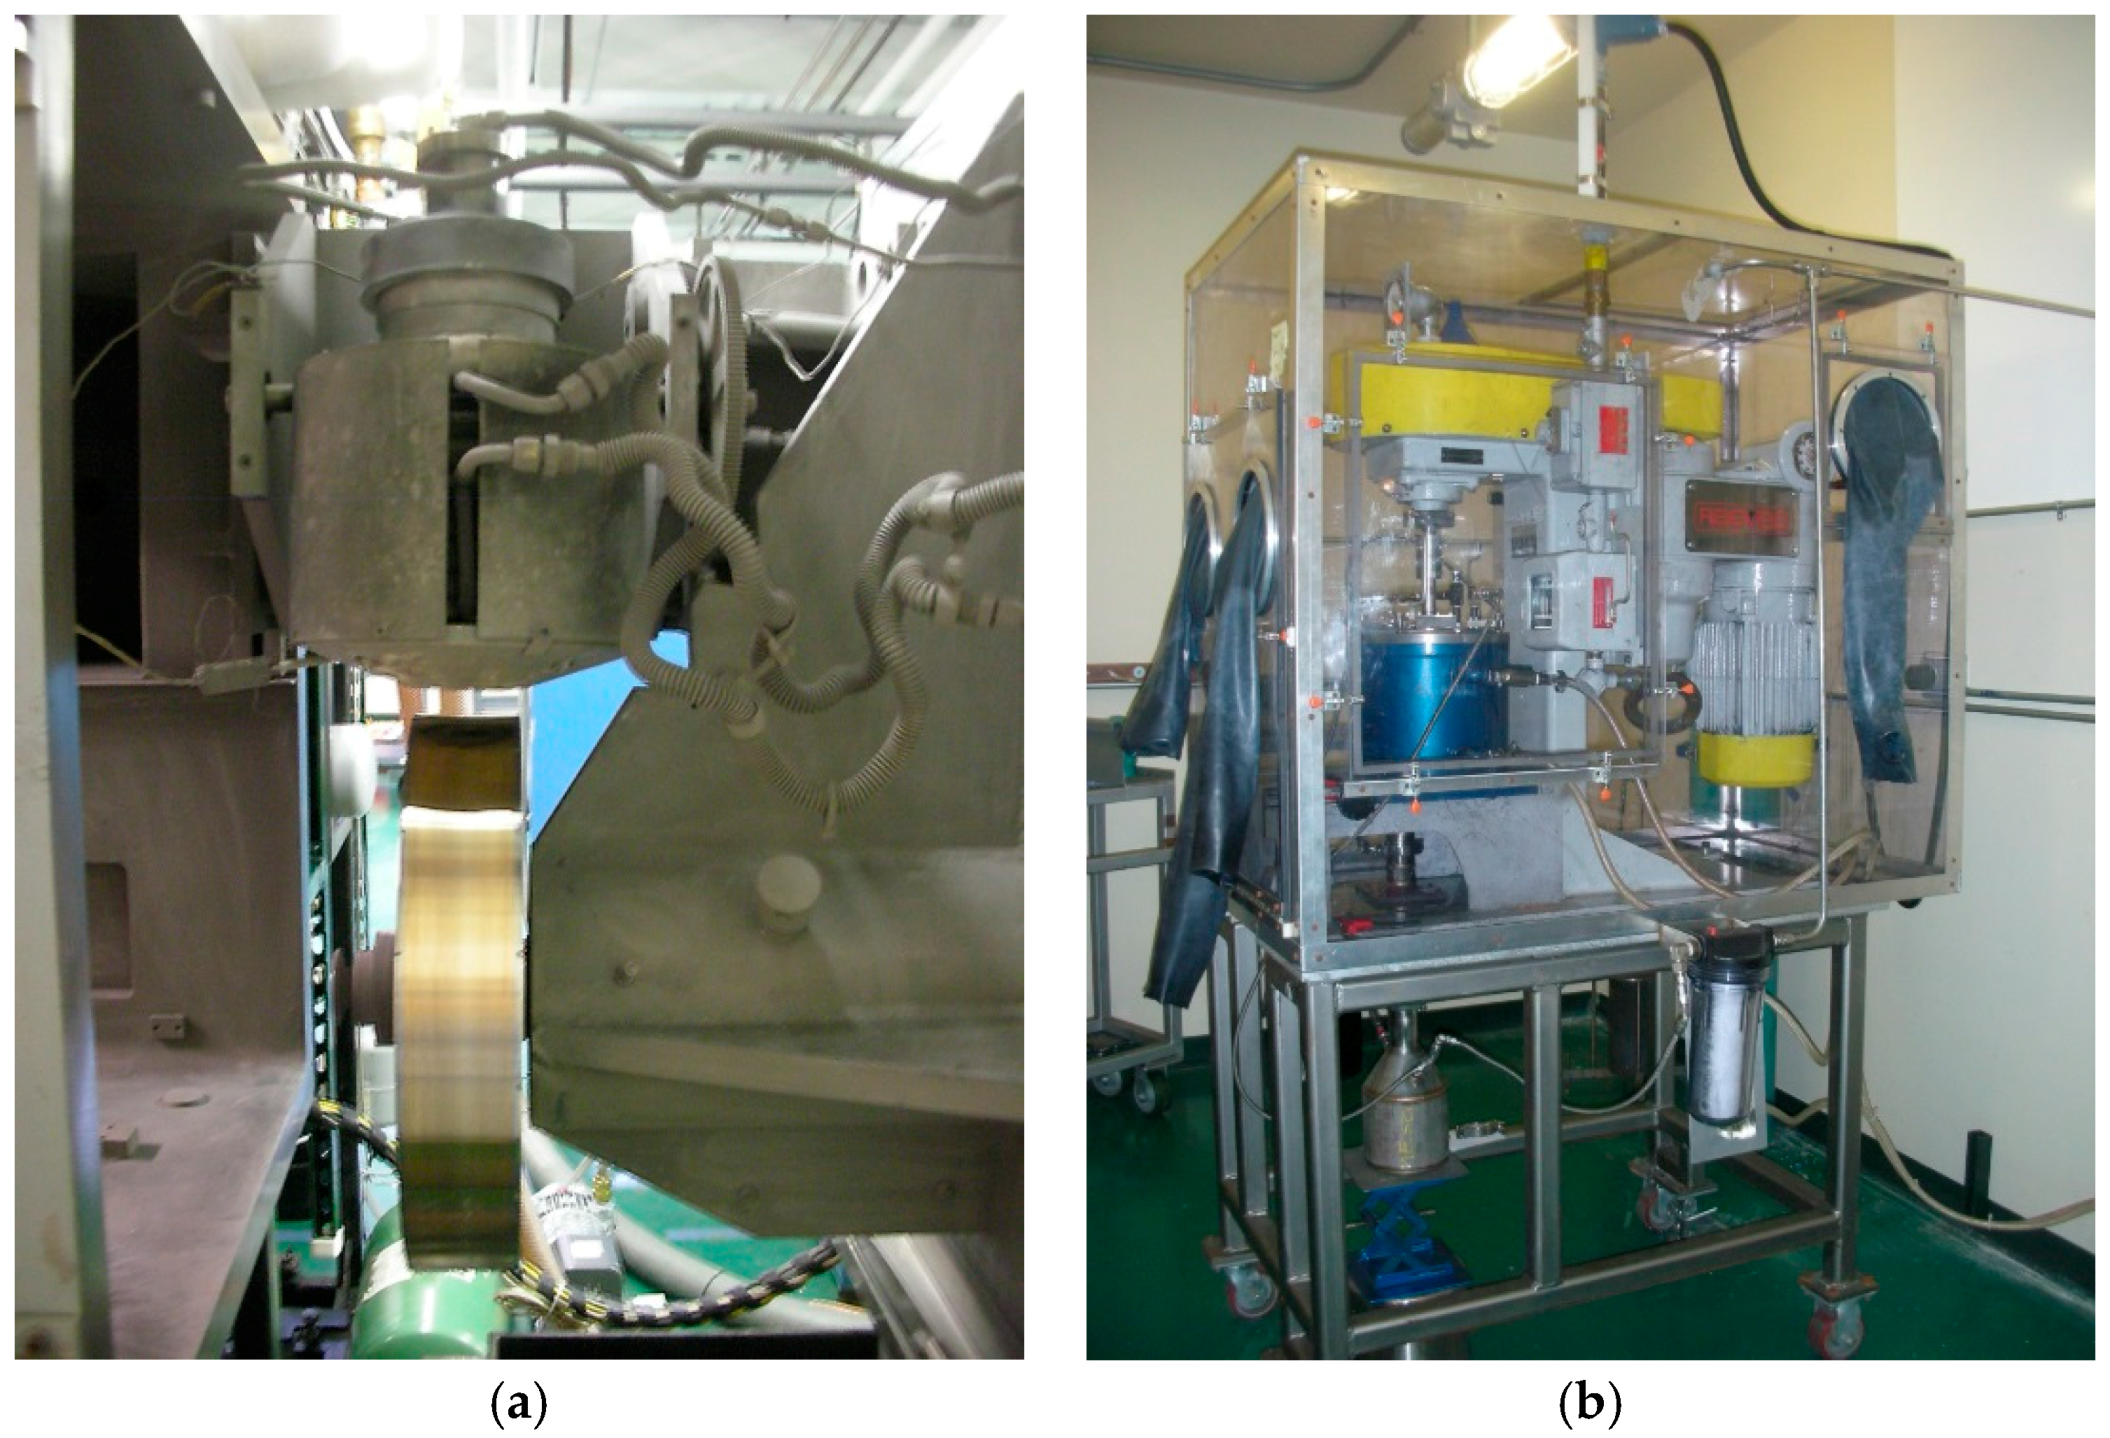
51]. Therefore, we used a powder fabrication method combining the MS and MA techniques. The former (see Figure 4a for the MS system) produces ribbons with closely packed polycrystalline Mg2Ni and MgNi
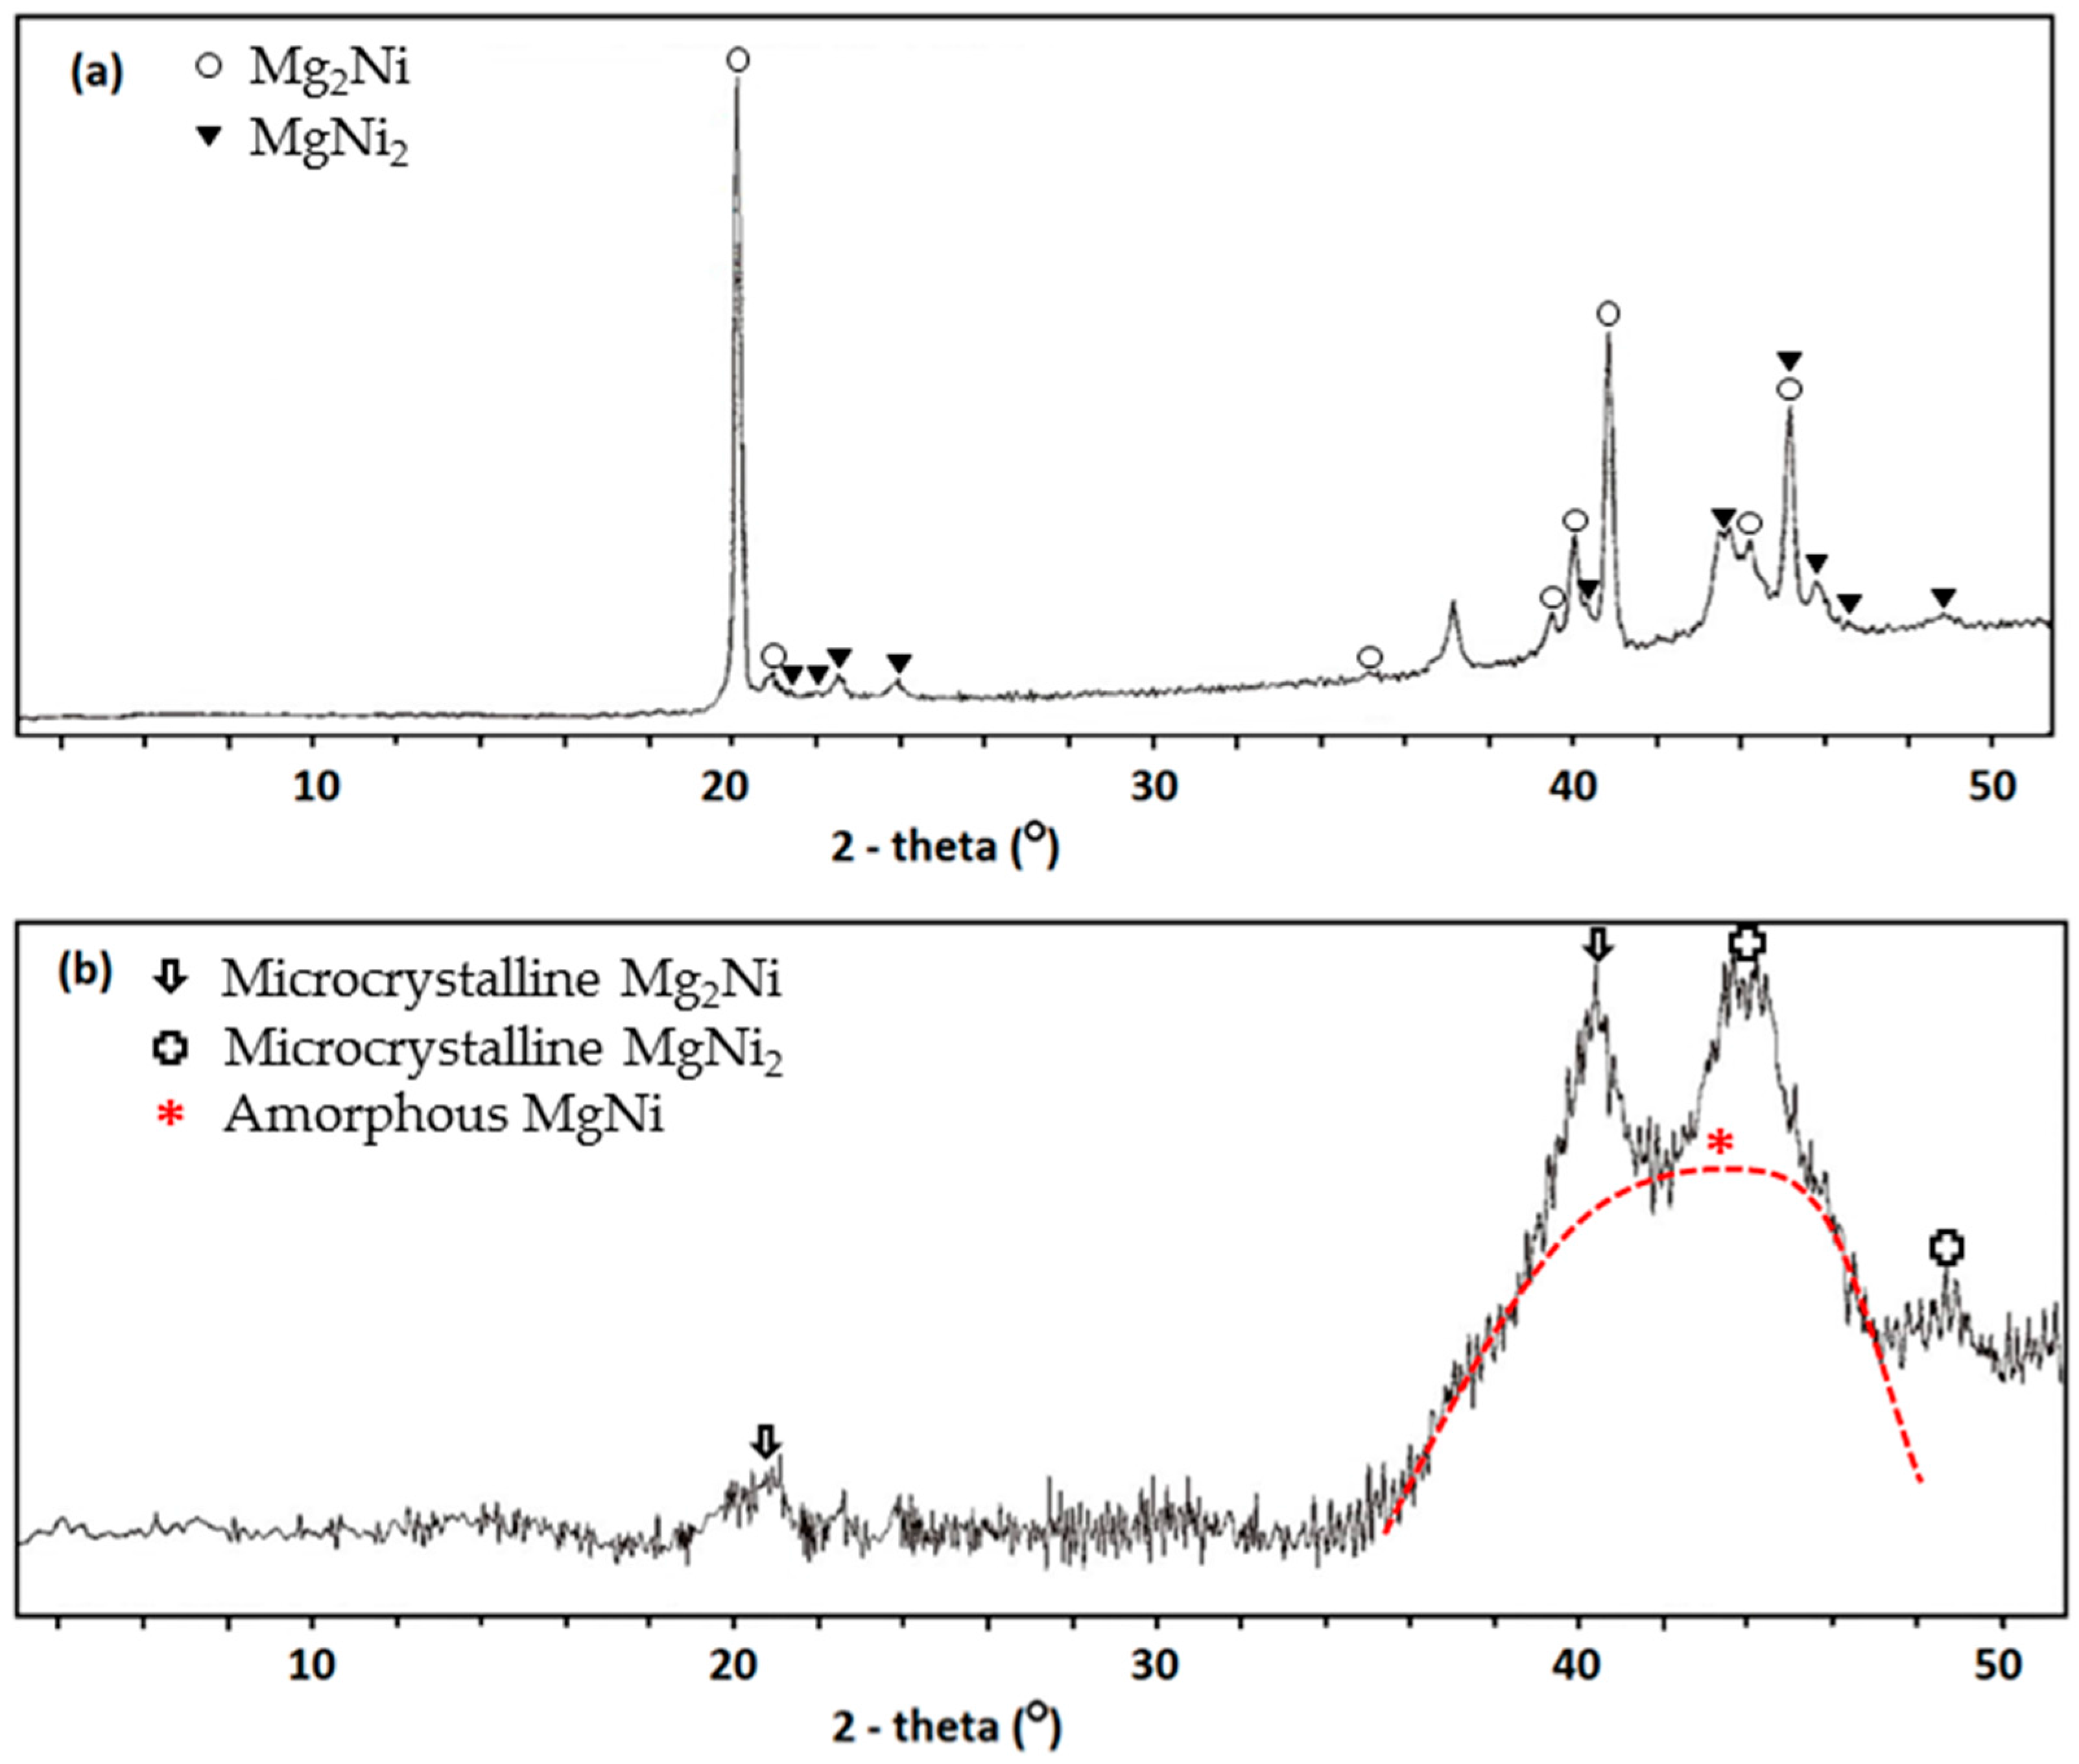
2 phases, and the latter (see Figure 4b for the MA attritor system) produces powder with an amorphous MgNi phase and therefore reproduces the microstructure and electrochemical capacity of the thin film work.
Compared to the method of using MA with raw material in elemental powder form alone, incorporation of MS in the alloy fabrication process can reduce the MA time from 72 h to 12 h and lower the material cost. The polycrystalline and amorphous natures of MS ribbon before and after the MA process, respectively, are revealed by XRD, as shown in 
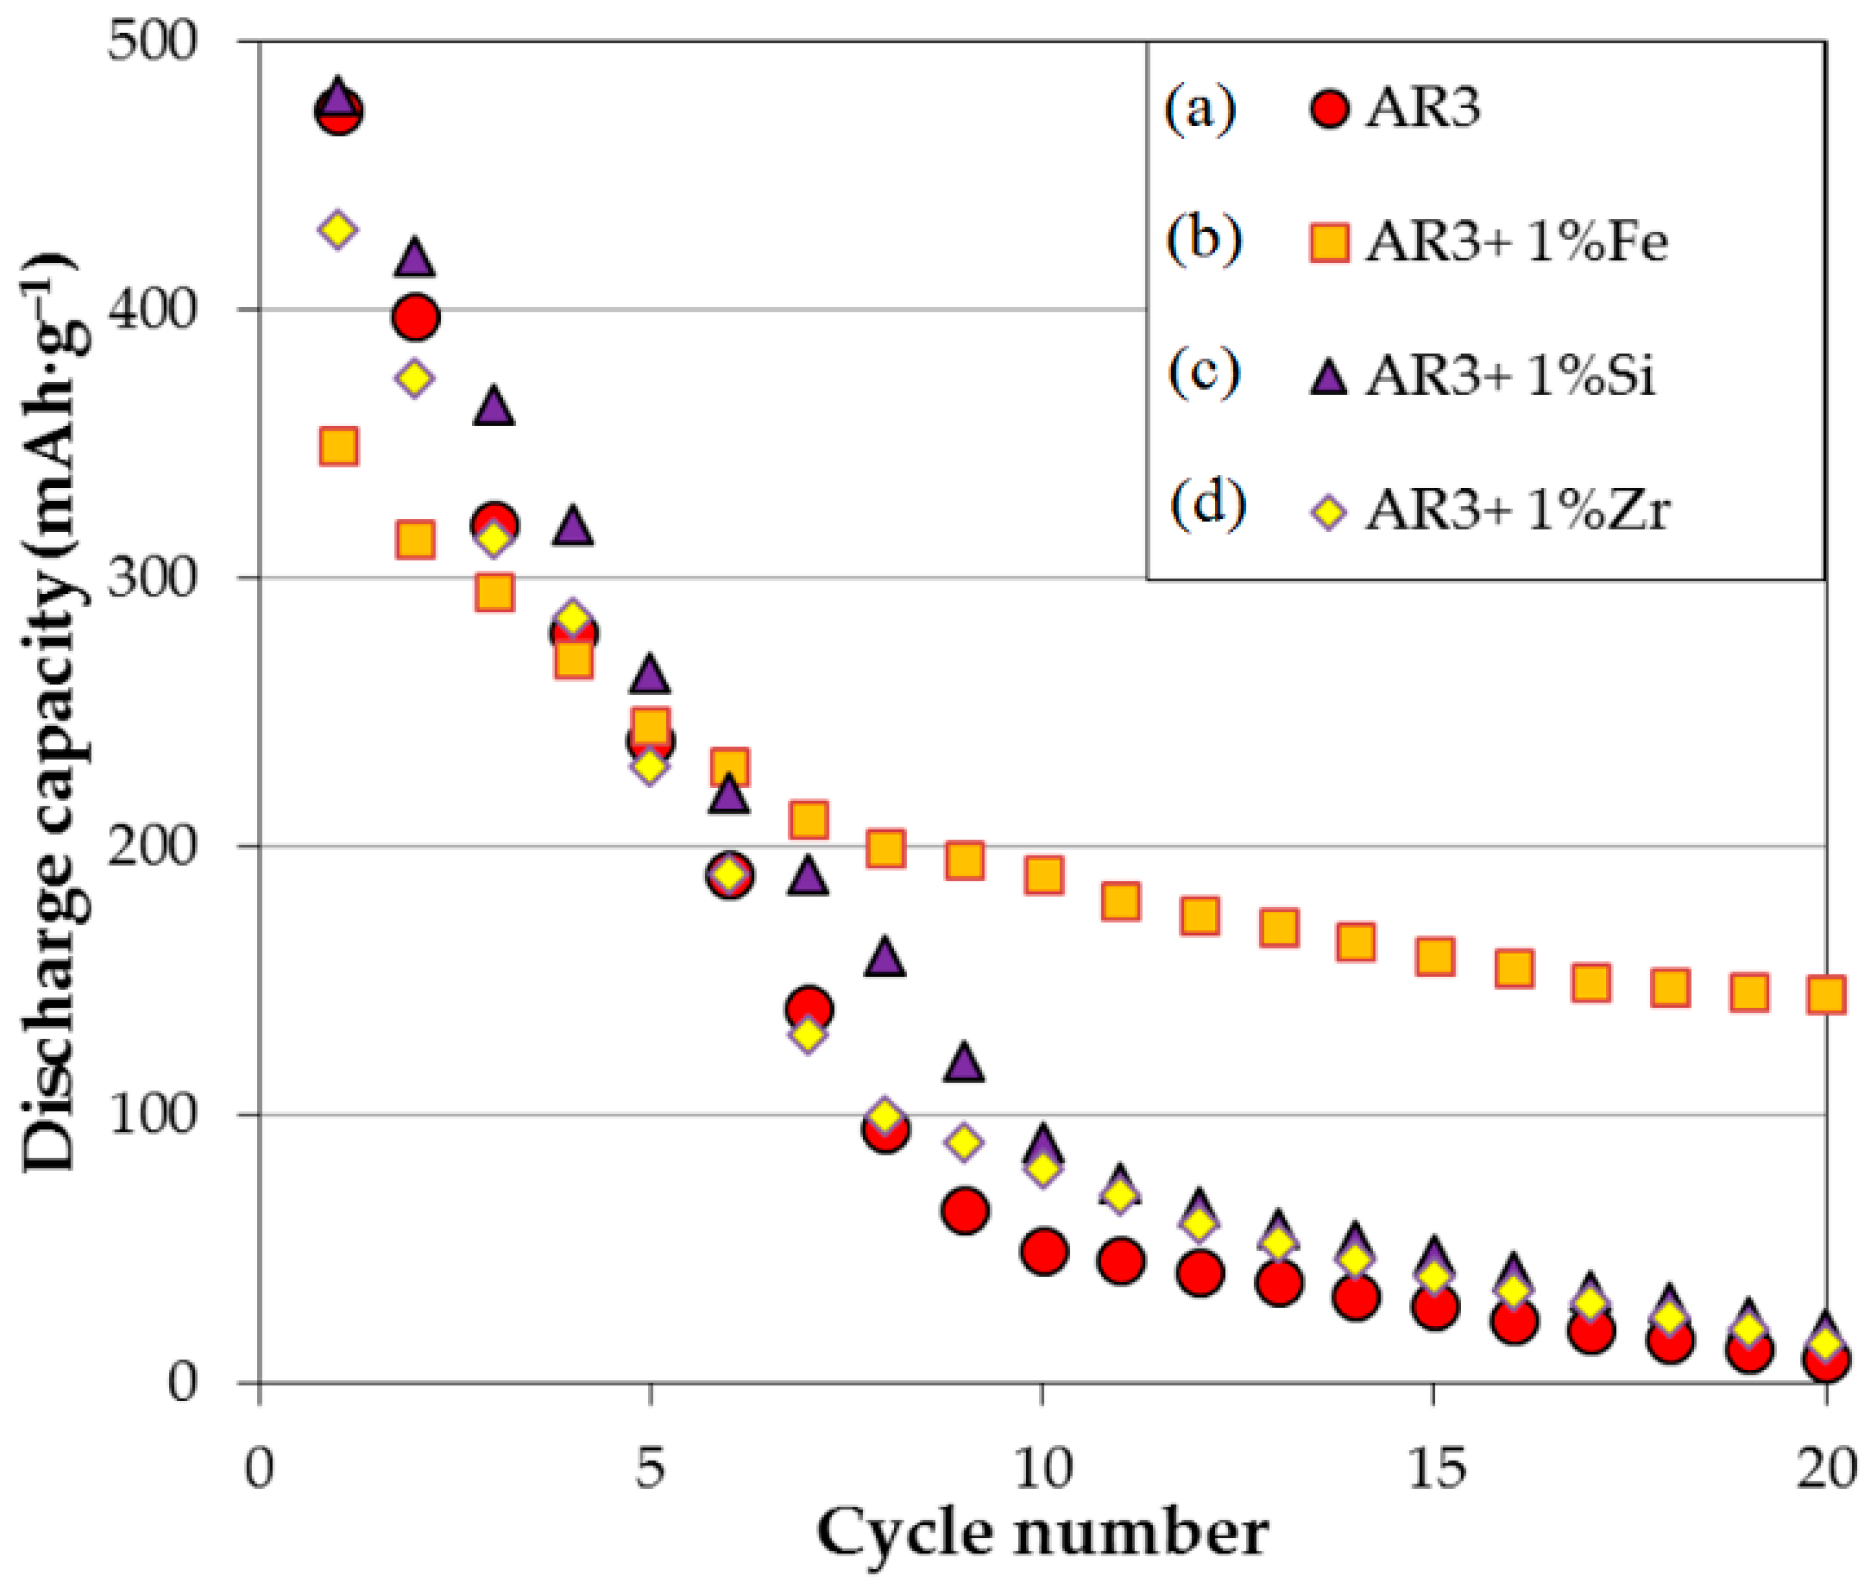
Figure 5. The cycle stability of the AR3 powder made by MS + MA, shown in Figure 6, is much more severe than that of its thin film counterpart. More specifically, degradation of the bulk AR3 powder occurs at approximately 10% per cycle in the first 10 cycles. While the addition of 1 wt% Si or Zr in the MA process does not affect the cycling performance, the addition of 1 wt% Fe reduces the capacity degradation to around 4% per cycle in the first 10 cycles. Furthermore, although the initial capacity is decreased with the addition of Fe to AR3 powder, the maintained capacity at higher cycle number is much higher than the original or modified AR3 powder with other additions. Addition of Fe also shows significant improvement in cycle stability in our thin film results.
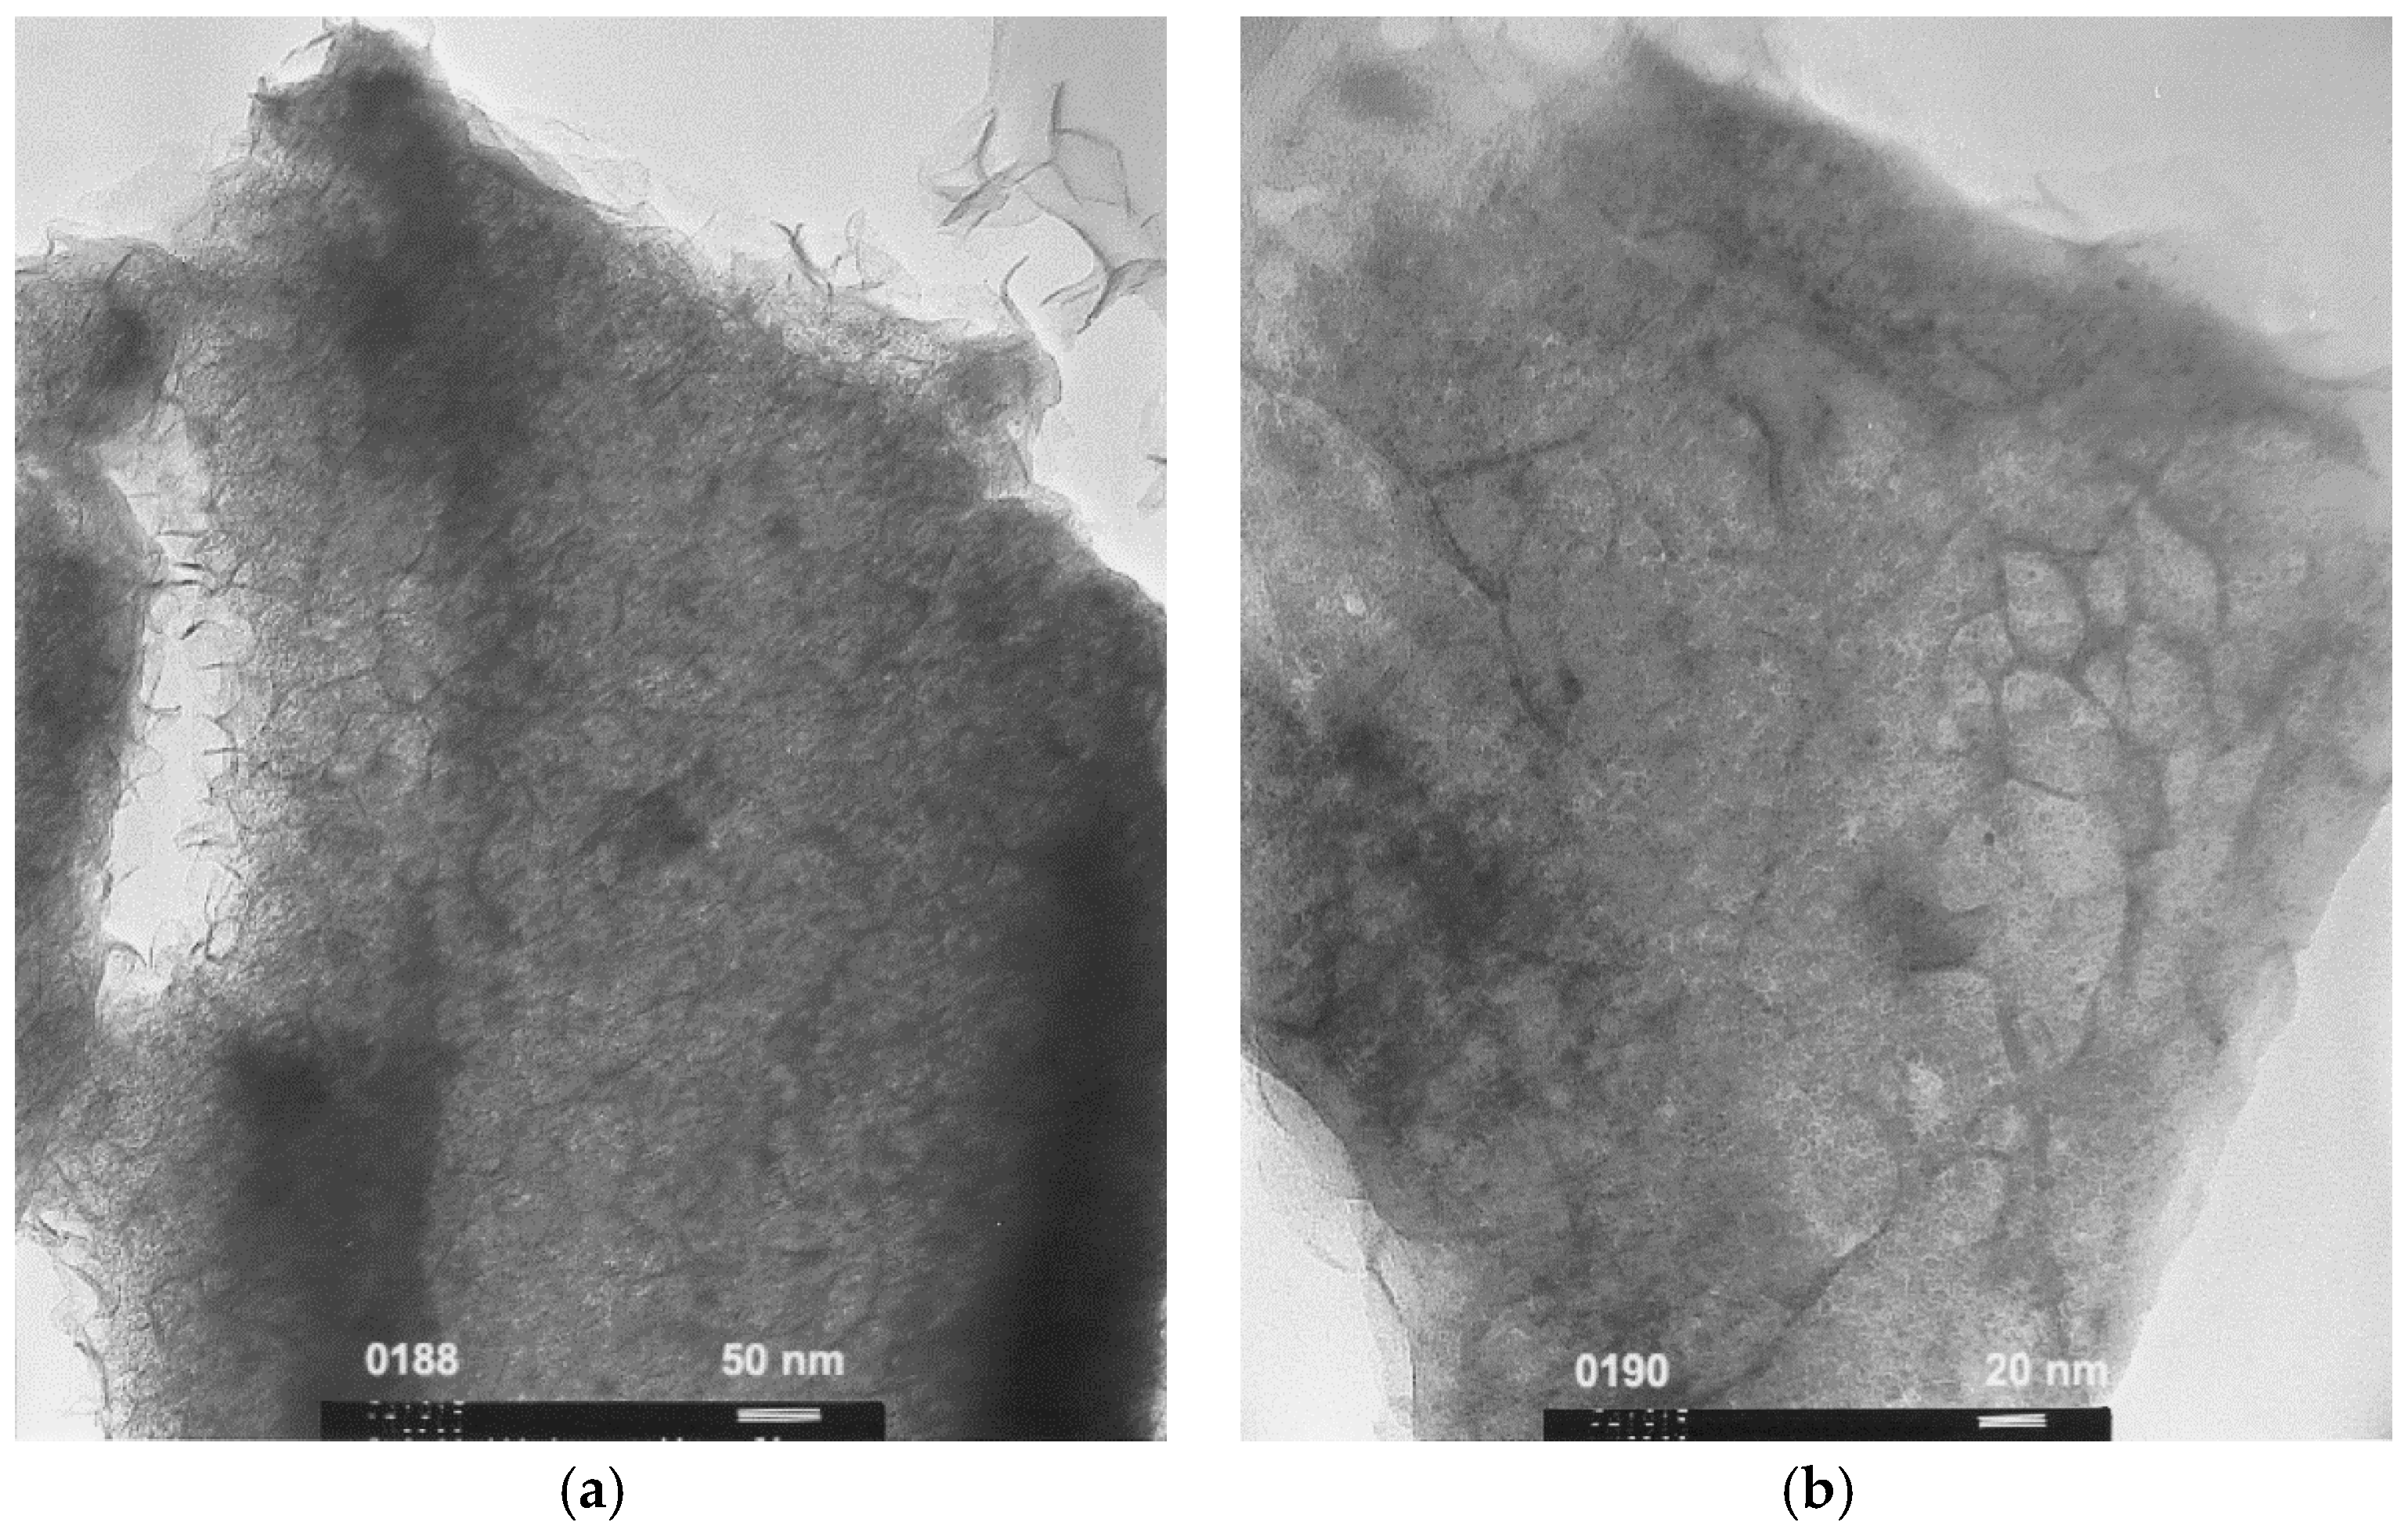
Figure 7 shows TEM micrographs of the AR3 powder sample made by MS + MA, and it reveals that the material density is not uniform. Large areas with lower density (brighter contrast) are found alongside the scroll-type denser regions (darker contrast). This type of microstructure cannot form the protective oxide layer that prevents further oxidation found in other MH alloys [52] and consequently causes the more severe degradation observed in the bulk form compared to that the thin film form. Therefore, in order to magnify the effect of electrolyte composition modification, the AR3 powder made by MS + MA is the perfect candidate for the current study on corrosion of MH alloy in electrolytes composed of various hydroxides, despite the fact that we have developed a series of new compositions based on the quaternary AR3 composition, new surface treatments, coatings, binder/surfactant additions, and other methods to improve the cycle stability of MgNi-based MH alloys.

3.3. Conductivities of Various Hydroxide Electrolytes

Room temperature conductivities of different concentrations of KOH and other hydroxide aqueous solutions were measured and then normalized to that of 6 M KOH aqueous solution, and the results are summarized in Table A1 in Appendix. Due to its low solubility, no effect on conductivity is observed with the addition of Mg(OH)2, Ca(OH)2, Sr(OH)2, or Ba(OH)
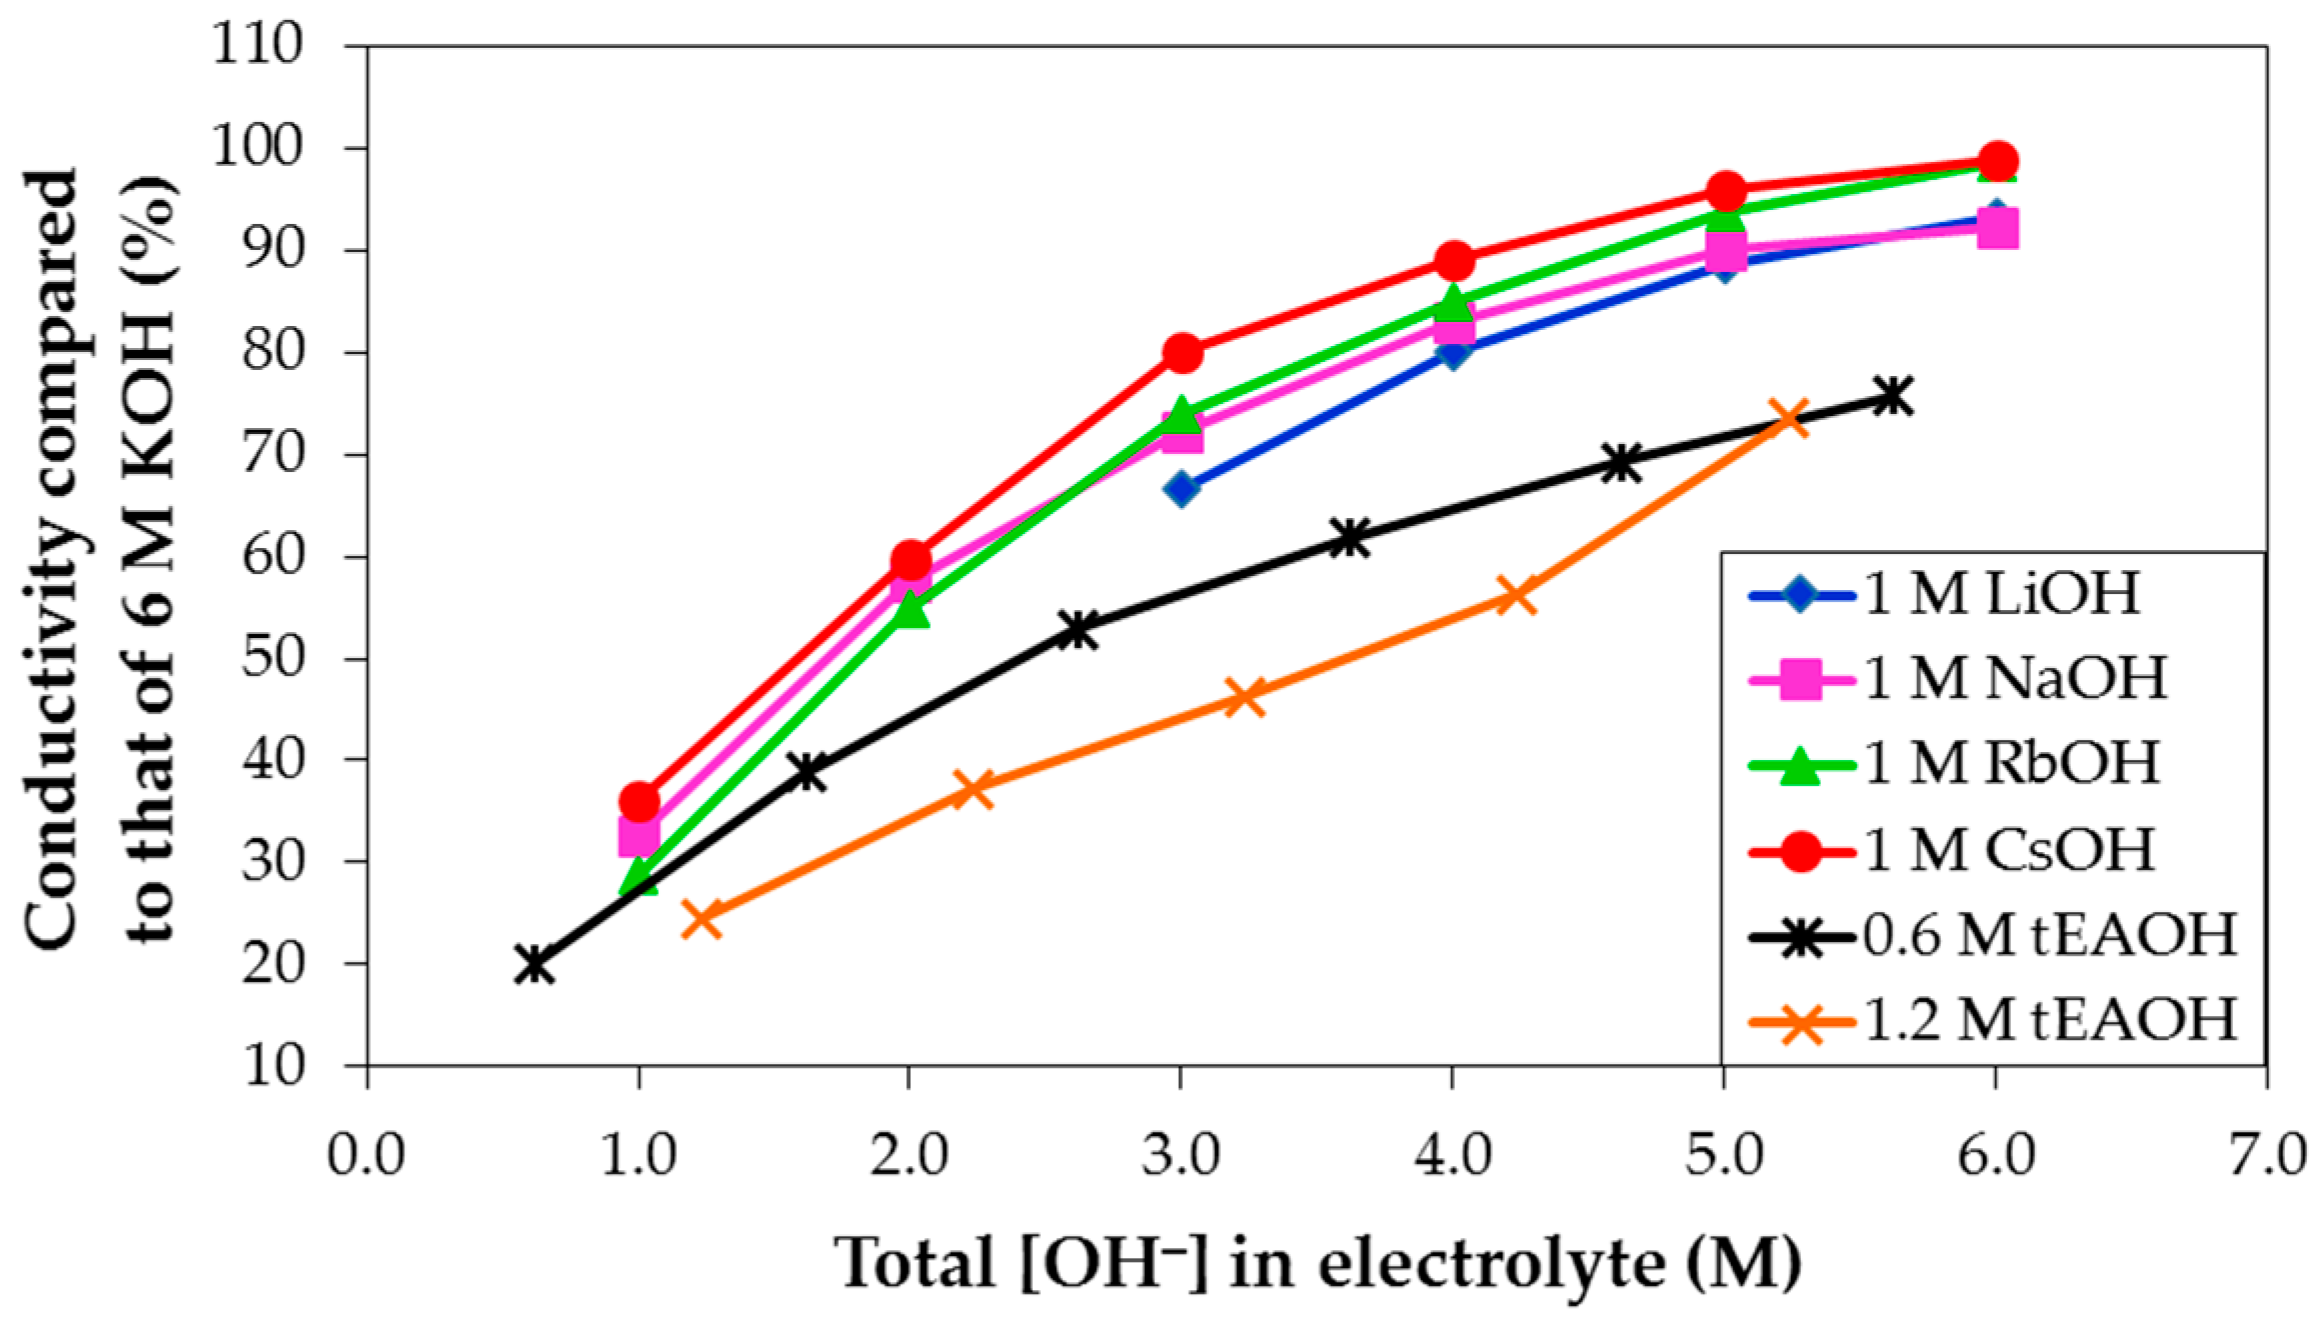
2 in 6 M KOH aqueous solution. Moreover, as a representative example, the electrolyte conductivities are plotted against the total OH concentration in solution for 1 M LiOH, NaOH, RbOH, and CsOH, and 0.6 M and 1.2 M tEAOH (tetraethylammonium hydroxide) in various concentrations of KOH aqueous solutions in Figure 8. As the total OH concentration increases, the electrolyte conductivity increases. Also, at any fixed KOH concentration, the electrolyte conductivity increases in agreement with the following trend: tEAOH < LiOH < NaOH < RbOH < CsOH addition. However, none of the conductivities of mixed hydroxide electrolytes exceeds that of pure KOH aqueous solution. According to Stokes’ Law, as the object size increases, it experiences more friction or drag when moving through fluid, as indicated in the equation for a spherical particle object:
ζ = 6 π η r
where ζ is the drag coefficient of object, η is the fluid viscosity, and r is the object radius. The drag coefficient also presents in the Einstein relation:
D = k B T ζ
where D is the diffusion coefficient, kB is the Boltzmann’s constant, and T is the absolute temperature. Thus, the diffusion coefficient can be directly related to the size of object moving in fluid by combining Equations (1) and (2), which gives the Stokes-Einstein-Sutherland equation:
D = k B T 6 π η r
Furthermore, molar conductivity of each ionic species in solution can be linked to the diffusion coefficient by the Nernst-Einstein equation:
Λ m , i 0 = ( F 2 R T ) z i 2 D i
where Λ m , i 0 is the limiting molar conductivity (molar conductivity at the limit of infinite dilution) of ionic species, F is the Faraday constant, R is the gas constant, zi is the charge number of ionic species, and Di is the diffusion coefficient of ionic species. In the case of hydroxide solution, electrolyte conductivity is determined by the combination of contributions from both the cation and anion species, which can be expressed by the Kohlrausch’s law of independent migration of ions:
Λ m 0 = ν + Λ m , + 0 + ν Λ m , 0
where Λ m 0 , Λ m , + 0 , and Λ m , 0 are the limiting molar conductivities of electrolyte, cation, and anion, respectively, and ν+ and ν are the stoichiometric coefficients of cation and anion, respectively. Since the anion species in the current study is unchanged, the observed differences in overall electrolyte conductivity are caused by the various cation species. As the cation size increases, the diffusion coefficient decreases, and the limiting molar conductivity consequently decreases. Among all the cation species in the current study, tEA
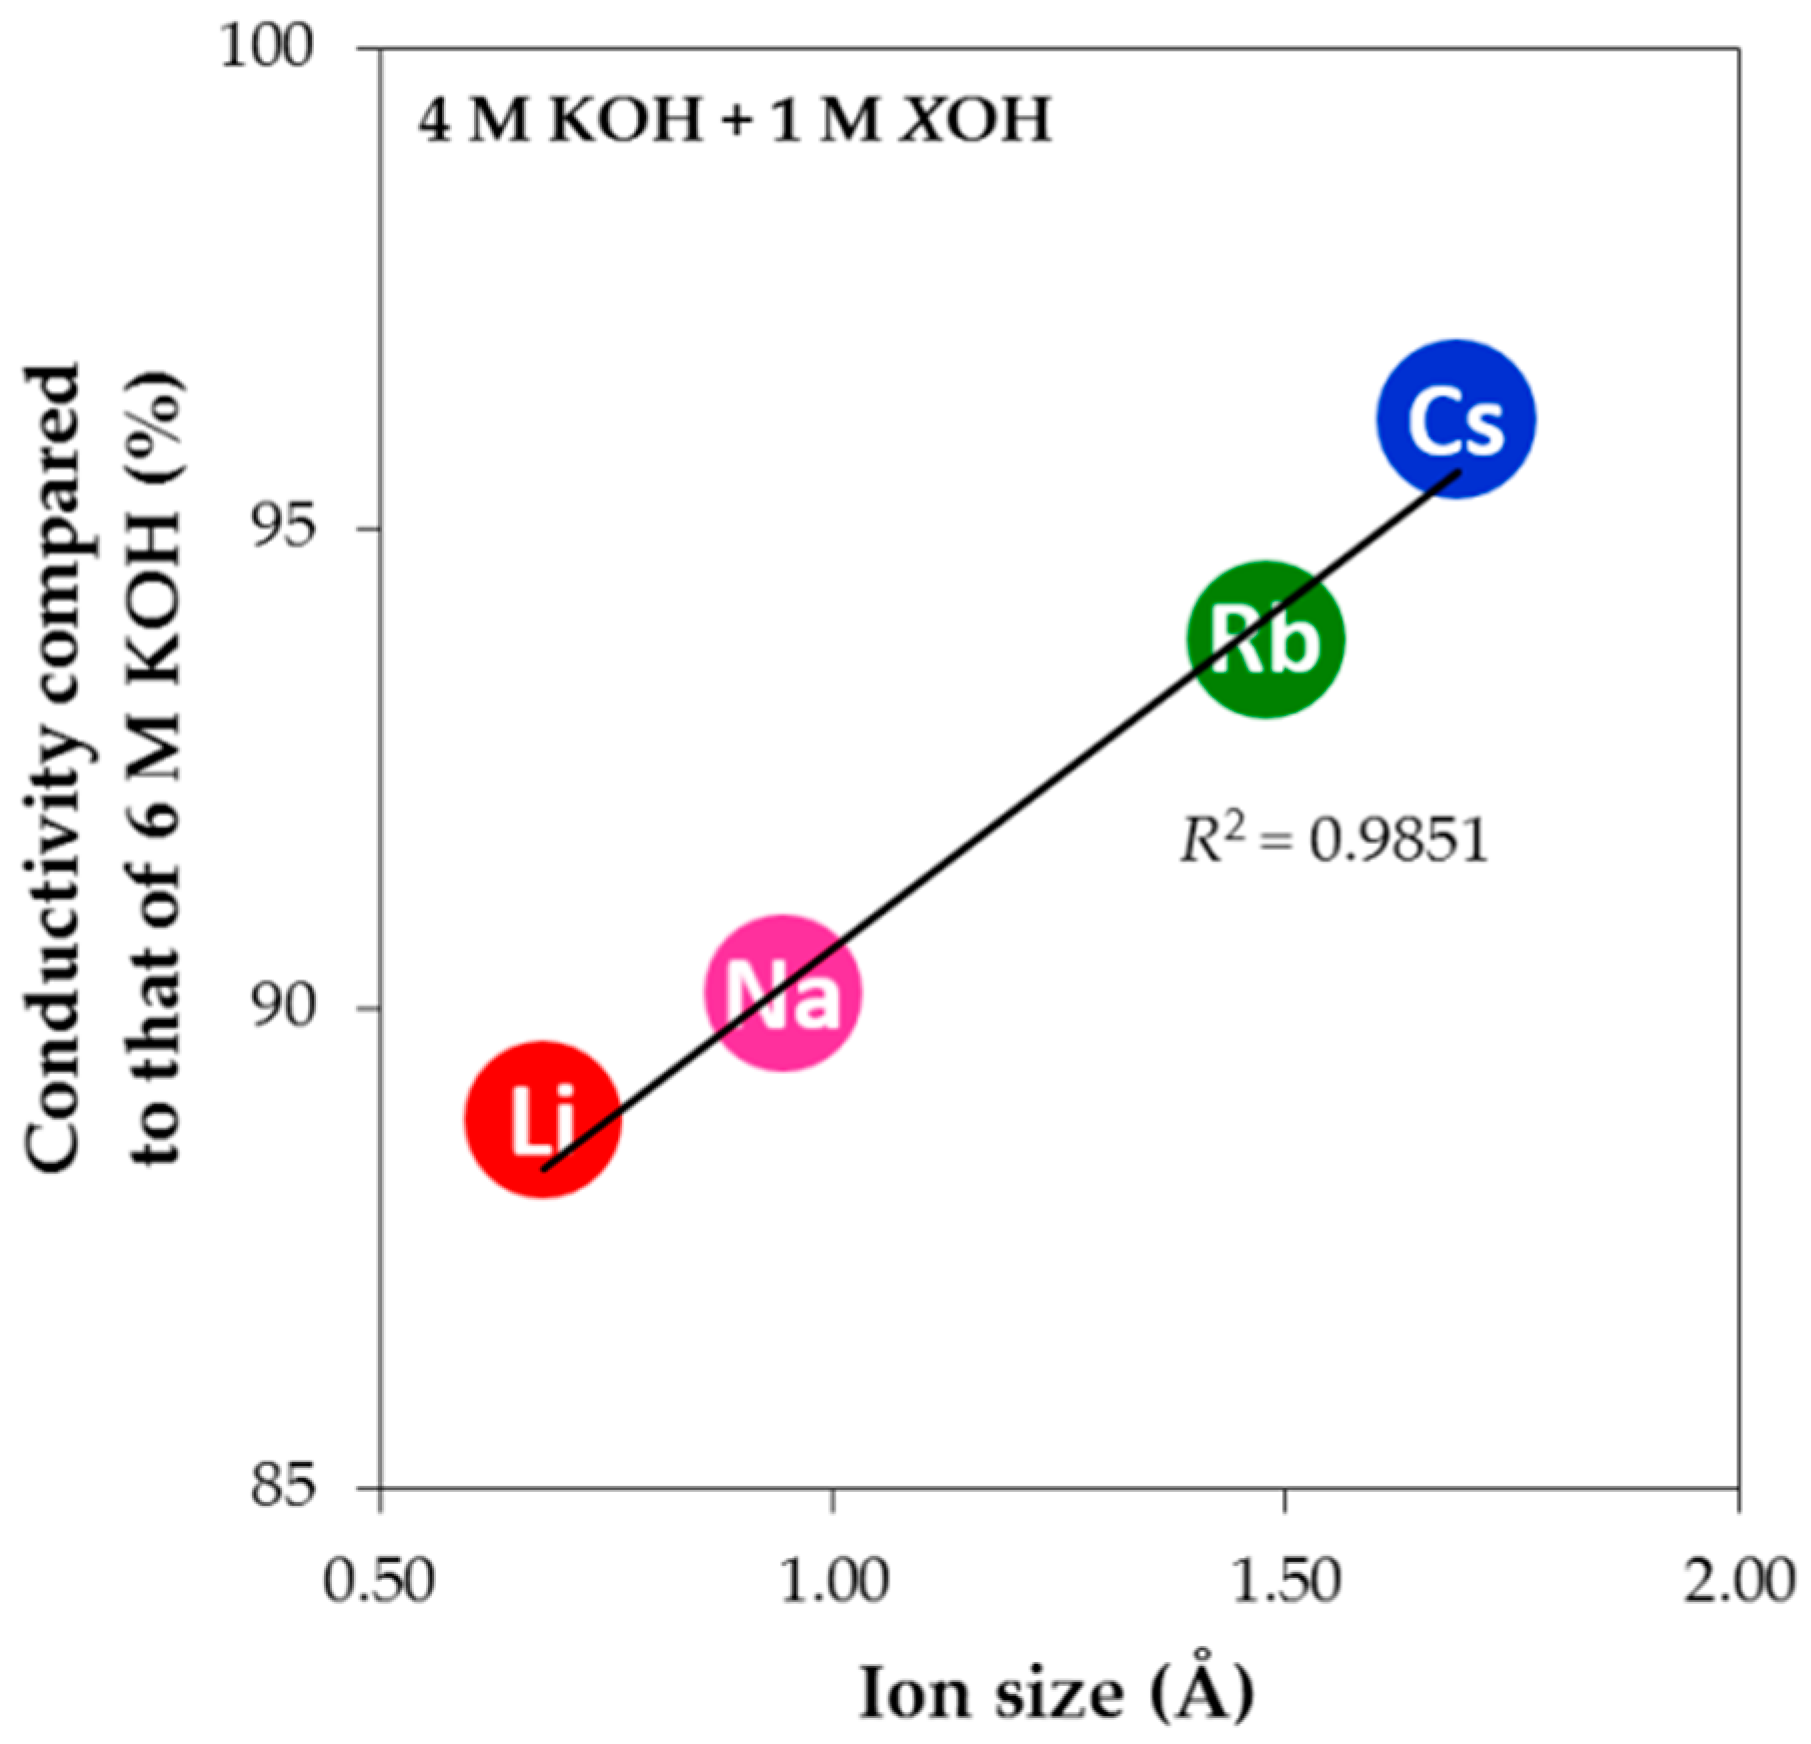
+ is the largest and results in the lowest conductivity upon tEAOH addition. However, this trend is not observed with the smaller alkali cations. When the cation size is very small, the cation has higher charge density and therefore shows a higher tendency to attract water molecules. In other words, a smaller cation has a larger amount of surrounding water, which makes its transport in solution more difficult (higher drag coefficient and lower diffusion constant) and contributes to the observed lower electrolyte conductivity. The normalized electrolyte conductivities of alkali hydroxides at the same level of addition in 4 M KOH aqueous solution are plotted against the cation radii in Figure 9, and a linear dependency with a very high correlation factor (R2) is clearly demonstrated. In addition, adding hydroxides with other alkali cations in KOH aqueous solution reduces the electrolyte conductivity slightly compared to pure KOH aqueous solution (5 M KOH aqueous solution has approximately the same conductivity as 6 M KOH aqueous solution at room temperature, which has the normalized conductivity value of 100%), indicating that a pure electrolyte system may have higher electrolyte conductivity than a heterogeneous electrolyte system at the same OH solution concentration. Such a phenomenon is interesting to observe and deserves further investigation of, for example, the effect of interaction between cations in a heterogeneous hydroxide electrolyte system on conductivity.

3.4. Corrosion Performances in Various Hydroxide Electrolytes

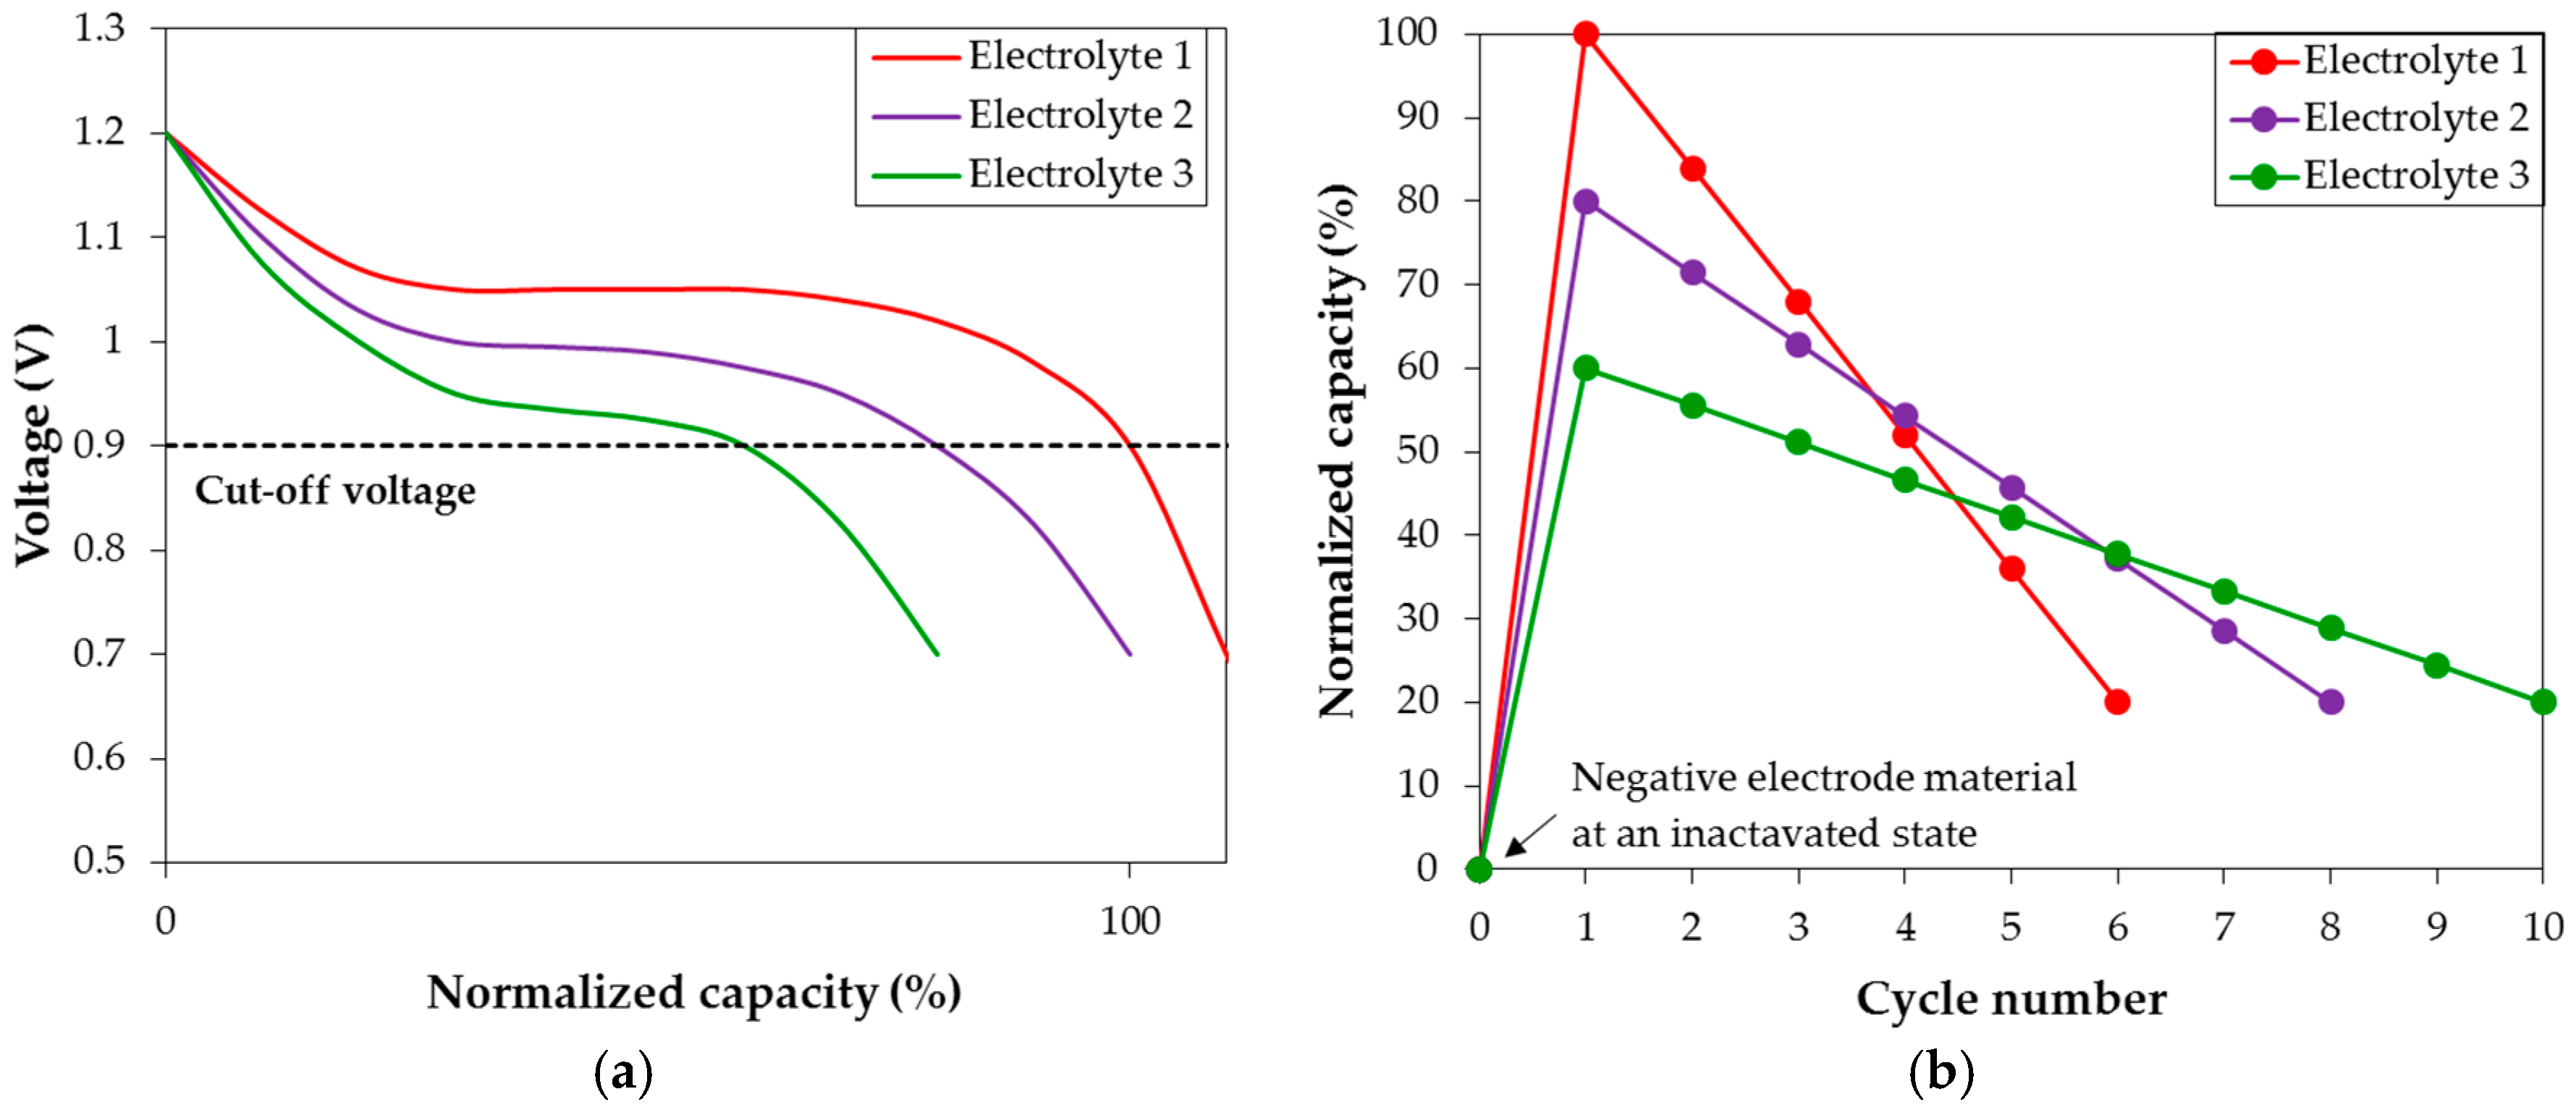
The AR3 powder made by MS + MA is used as the negative electrode material for the corrosion study in various hydroxide aqueous solutions. Before studying the relative corrosion strengths of different electrolytes, an evaluation of capacity degradation must be established. We use three hypothetic electrolytes (Electrolytes 1, 2, and 3) in Figure 10 as the representatives to explain and describe the differences in discharge characteristics in various hydroxide aqueous solutions observed in the current study. Looking closely at the first cycle discharge voltage profiles from half-cells with the three different electrolytes (Figure 10a), the largest initial discharge capacity is observed with Electrolyte 1. The difference in discharge voltage curve length indicates that Electrolyte 1 has the strongest activation power compared to Electrolytes 2 and 3. In other words, Electrolyte 1 activates the largest portion of MH alloy within the same initial charging period as in Electrolytes 2 and 3, which is the main reason for its superior initial capacity performance. However, higher activation power also corresponds to stronger corrosion strength, increasing in the order of Electrolyte 3 < Electrolyte 2 < Electrolyte 1. The discharge capacities are plotted against the cycle number in Figure 10b, and the degradation in Electrolyte 1 is worse (higher capacity loss per cycle) compared to that in Electrolyte 3. Therefore, in order to separate the contribution of activation to degradation, degradation calculation in this study is defined as:
D e g r a d a t i o n   i n   c a p a c i t y   l o s s   %   per cycle = C a p high C a p low ( n high n low ) C a p high × 100 %
where Caphigh and Caplow are the highest and lowest capacities throughout cycling (Caphigh is usually the initial capacity in the current study), respectively, and nhigh and nlow are the corresponding cycle numbers. It is worth noting that a positive correlation is found between the activation power and electrolyte conductivity in the current study, i.e., electrolyte conductivity increases in the order of Electrolyte 3 < Electrolyte 2 < Electrolyte 1. The highest conductivity of Electrolyte 1 (or the lowest internal resistance, as observed from its highest voltage plateau in Figure 10a) is also a contributing factor for its highest initial capacity, albeit minor compared to the influence of activation power. Therefore, the contribution of conductivity on capacity is neglected in the degradation calculation.
Room temperature degradation of different concentrations of KOH and/or other hydroxide aqueous solutions were measured, and the results are summarized in Table A2 in Appendix. Due to its low solubility, no effect on degradation is observed with the addition of Mg(OH)2, Ca(OH)2, Sr(OH)2, or Ba(OH)
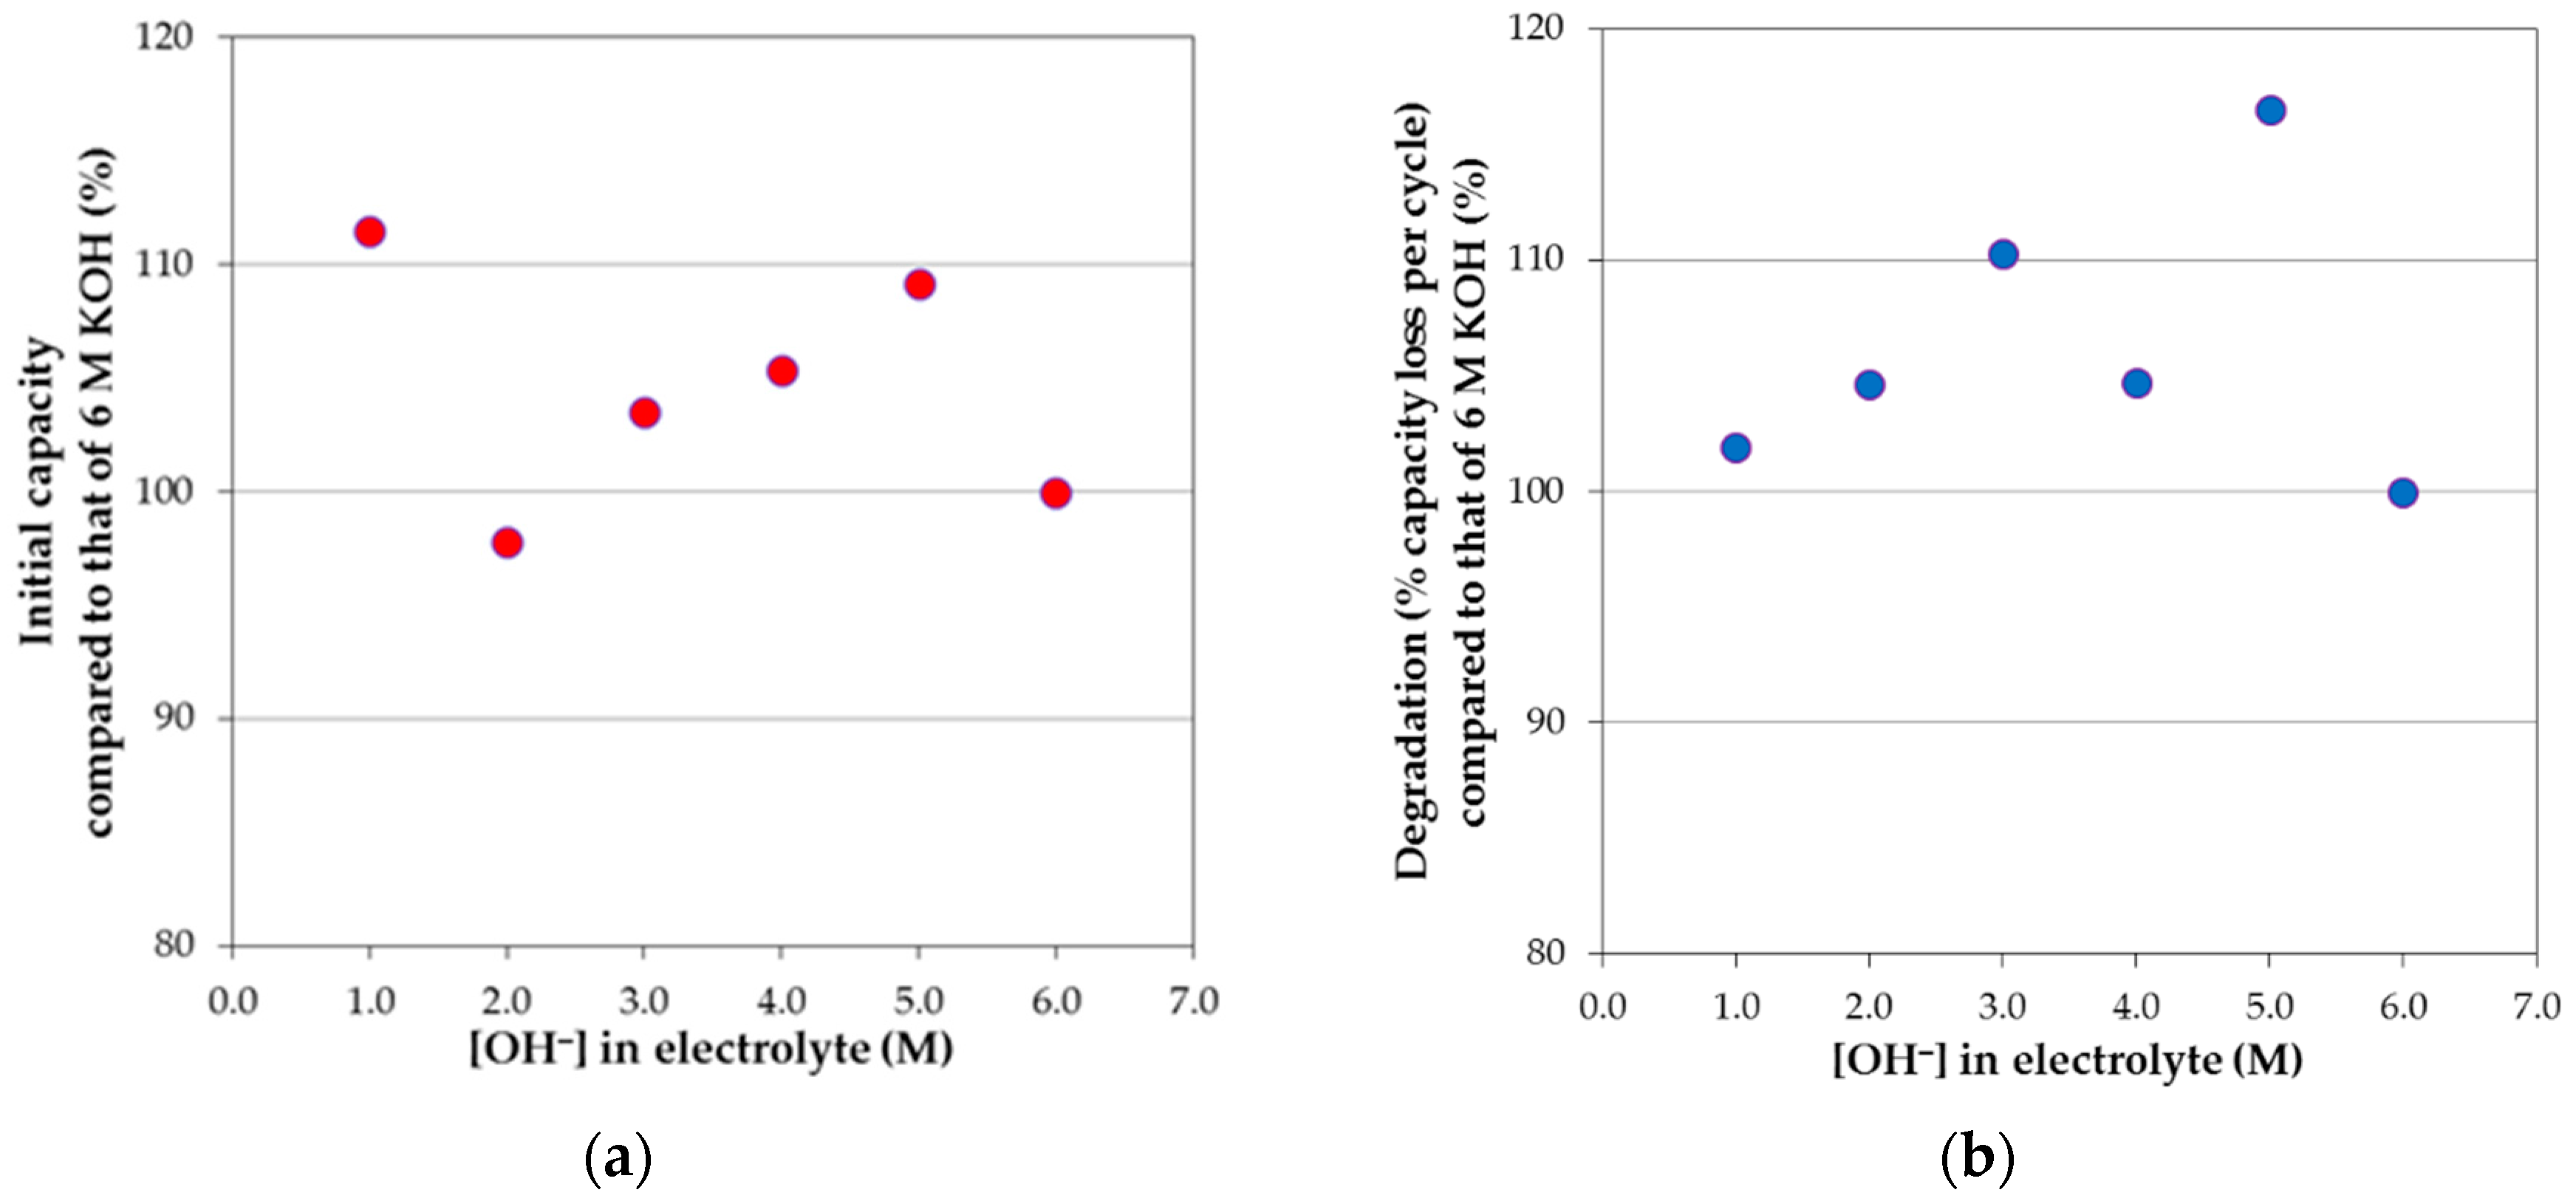
2 in 6 M KOH aqueous solution. For the pure KOH aqueous solution systems at various concentrations, the initial capacities and degradations normalized to those of 6 M KOH aqueous solution are plotted against the total OH concentration in solution in 
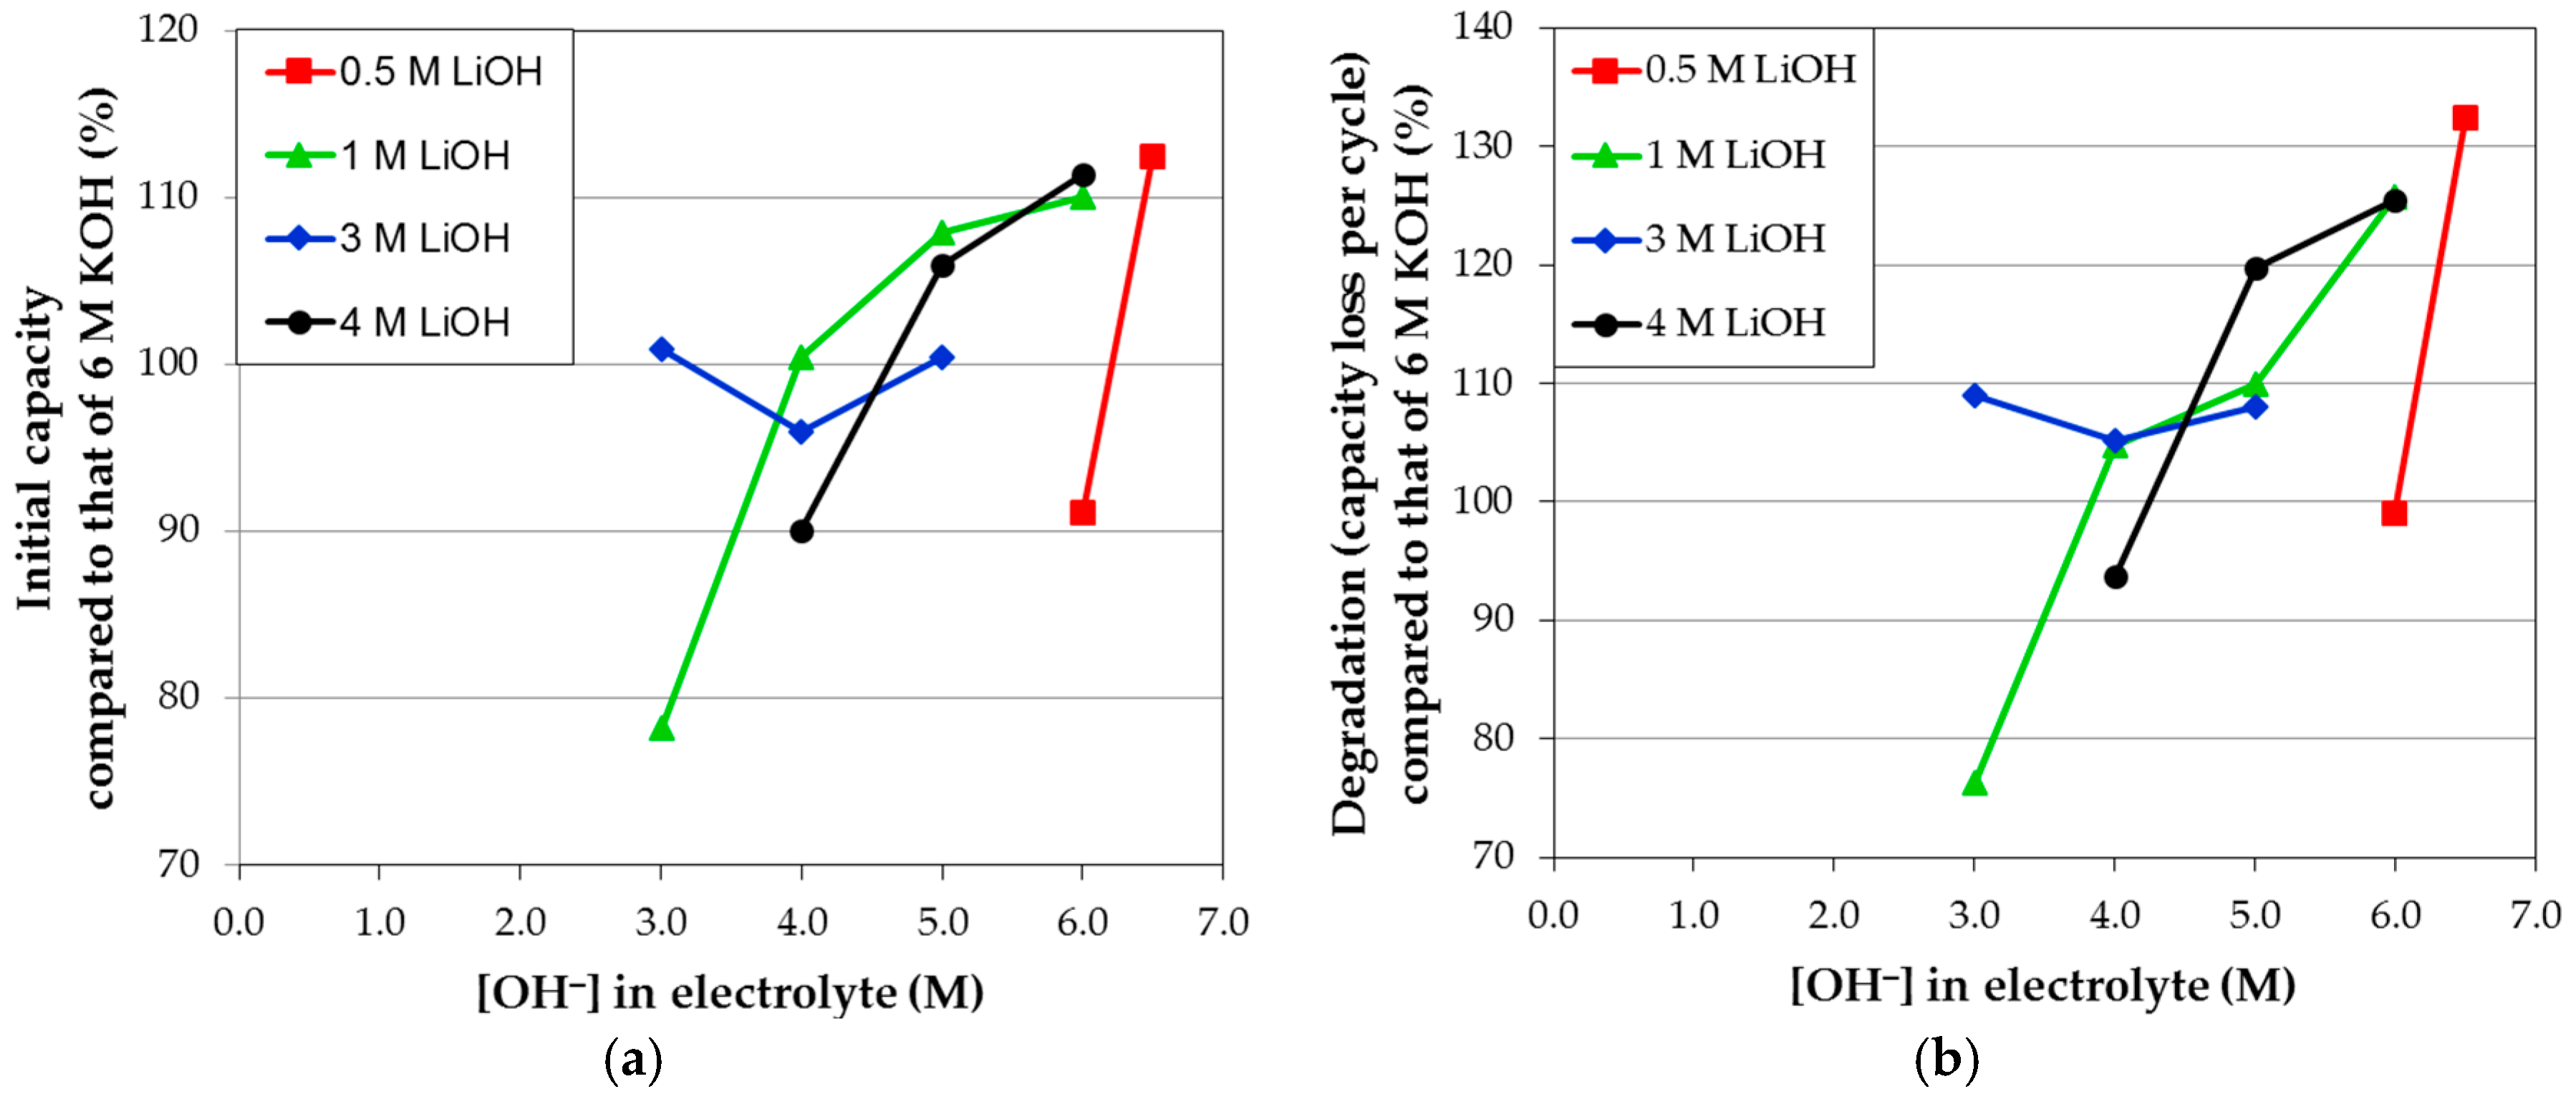
Figure 11a,b, respectively. Even after the attempt to eliminate the contribution of activation on degradation, a strong similarity between the initial capacity and degradation performances is still present, meaning that activation and corrosion are very closely related and cannot be completely separated by our calculation for KOH-based electrolytes. Such correlation can also be seen in mixed electrolytes. For example, a resemblance between the initial capacity (Figure 12a) and degradation (Figure 12b) performances in various electrolyte mixtures of KOH and LiOH can be observed. It is also interesting to find that higher OH concentrations in electrolytes do not necessarily correspond to higher corrosion.
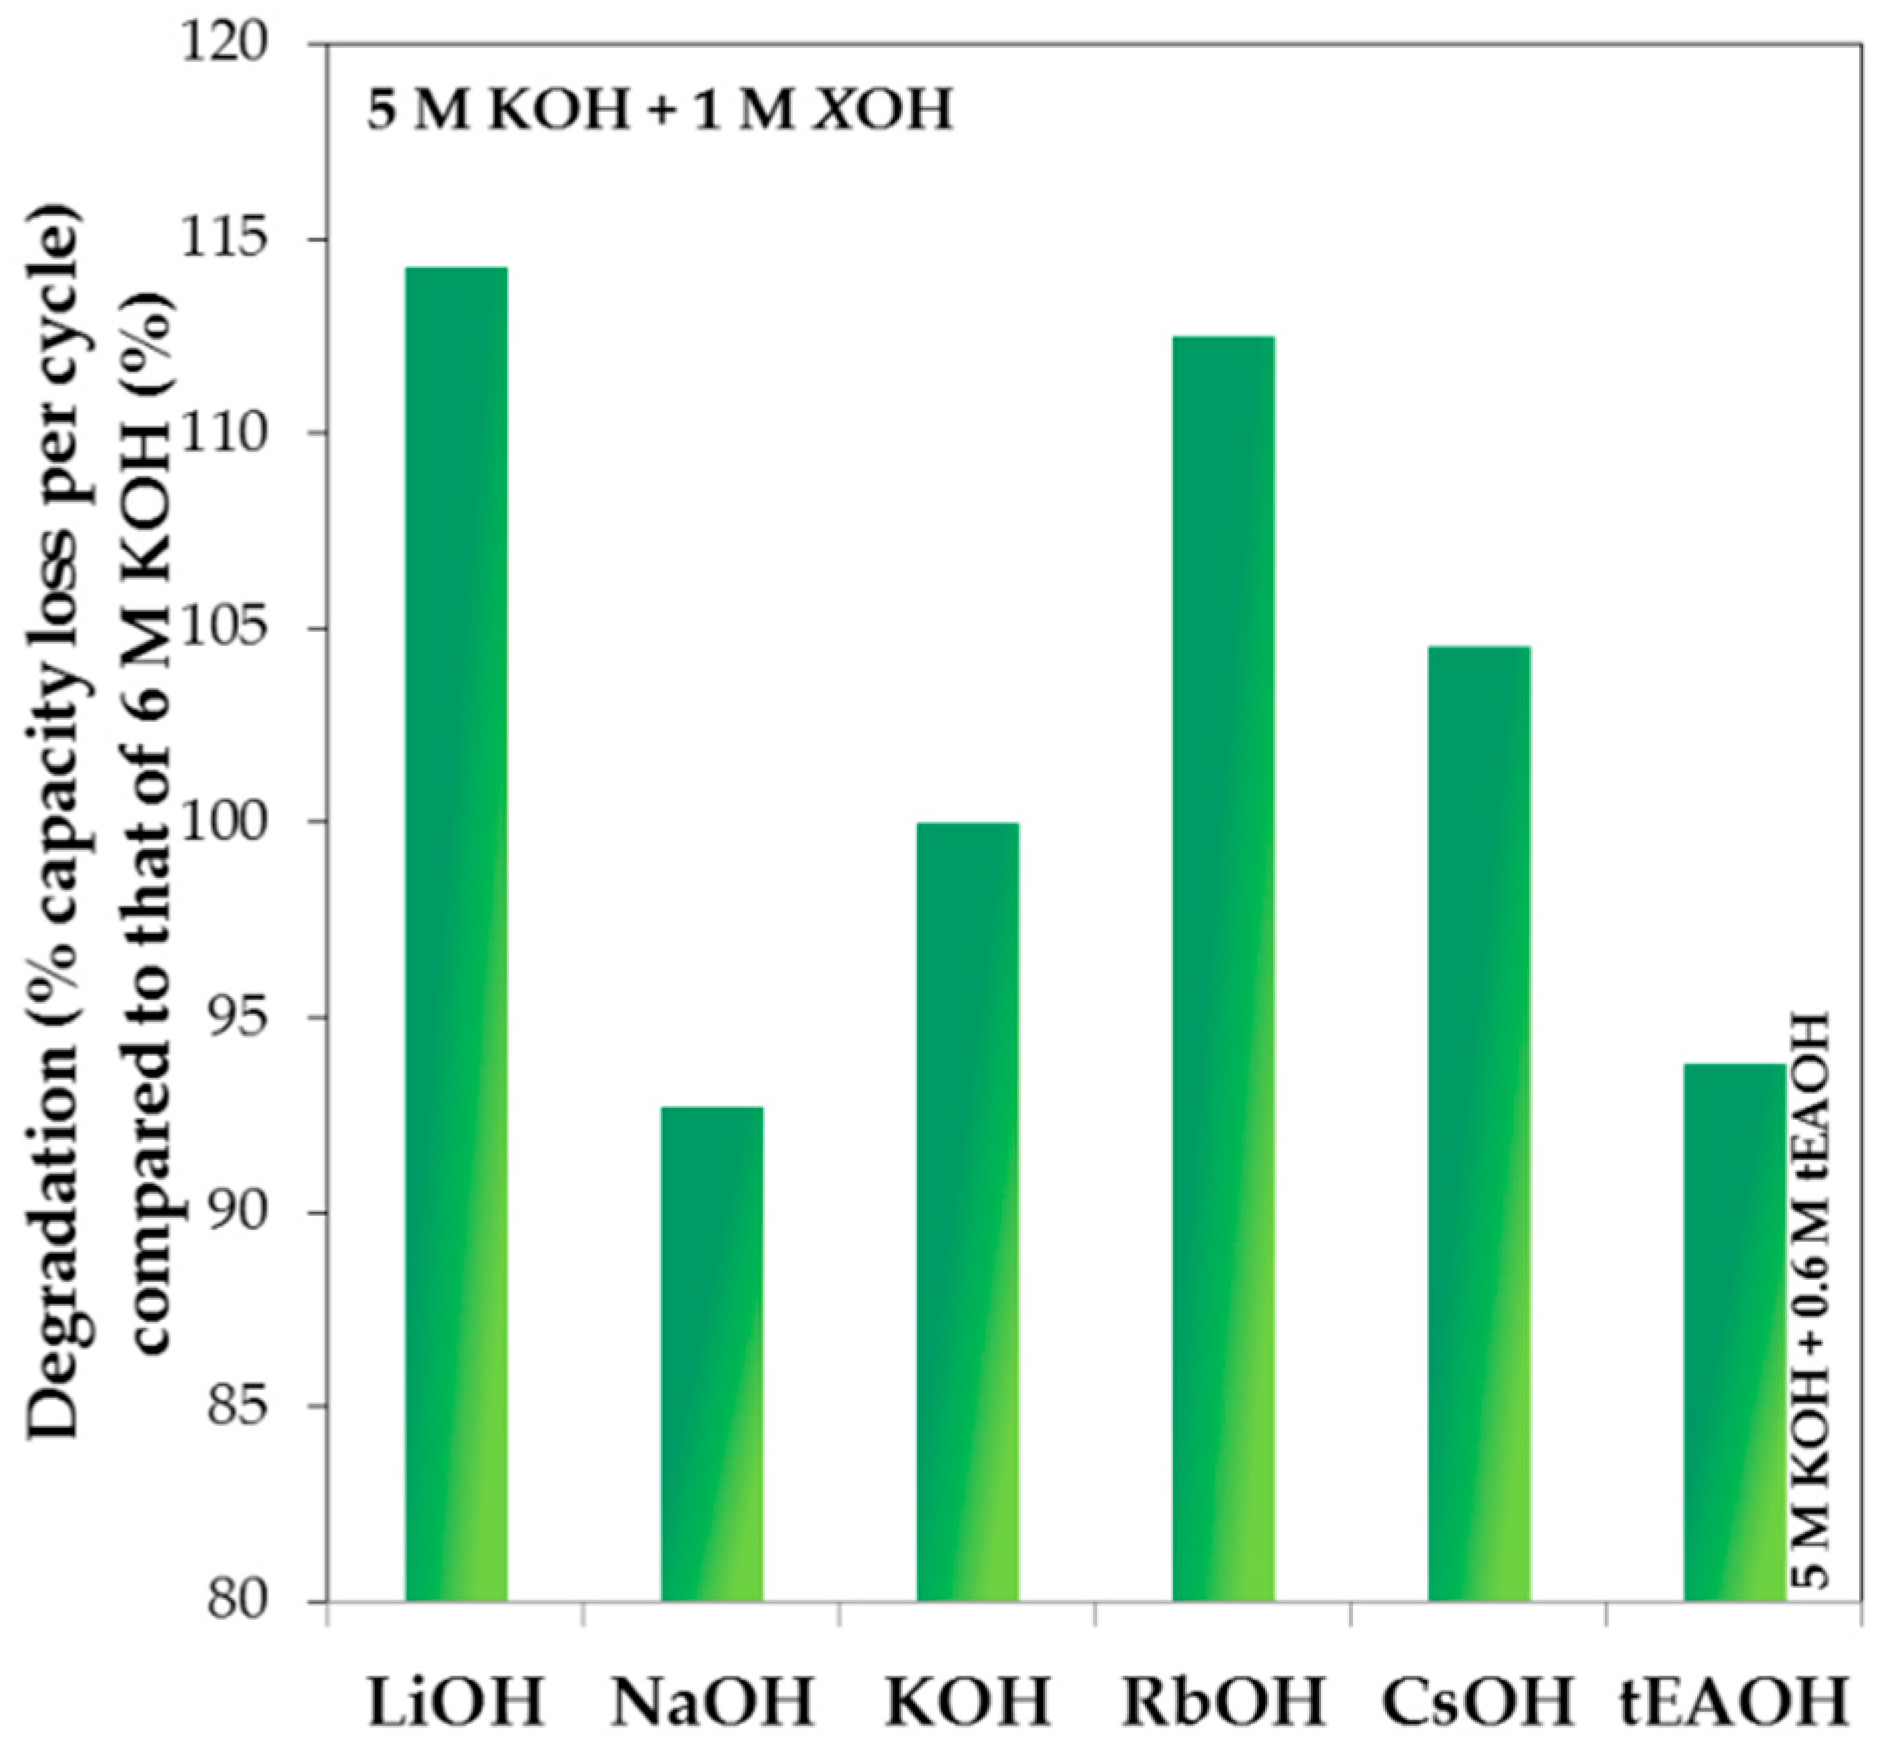
As a representative example, the degradation performances compared to that of 6 M KOH aqueous solution are plotted against the total OH concentration in solution for 1 M LiOH, NaOH, RbOH, and CsOH, and 0.6 M tEAOH in 5 M KOH aqueous solution in 
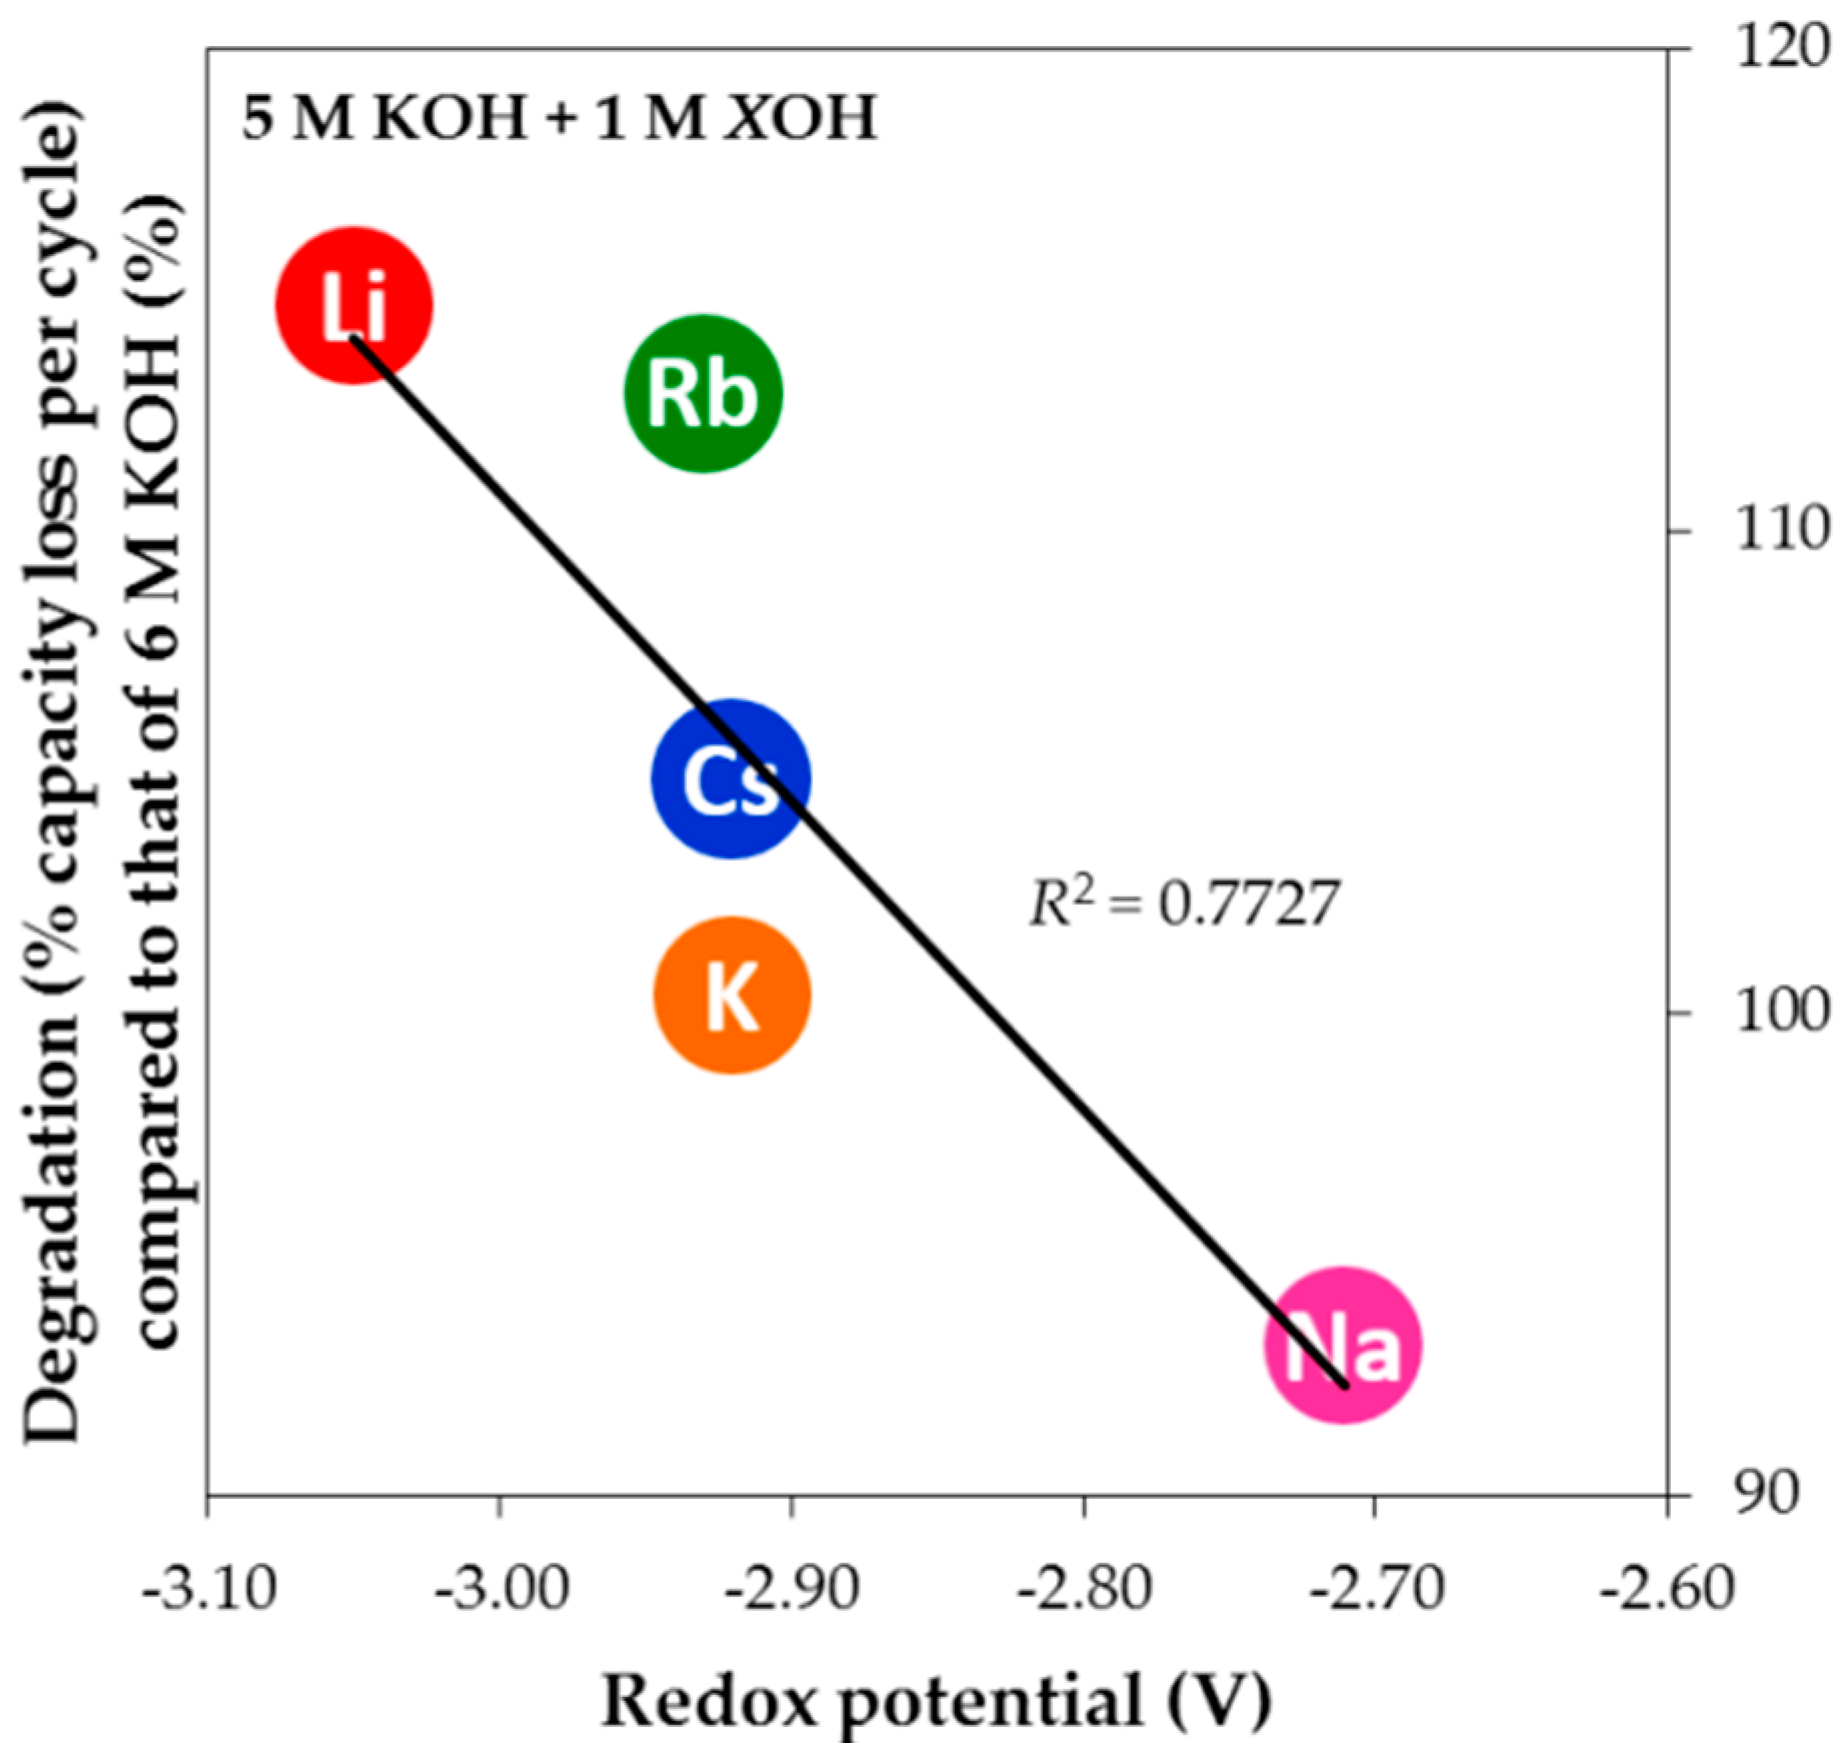
Figure 13. With regard to lowering the corrosion strength of pure KOH aqueous solution, both NaOH and tEAOH additions are beneficial while CsOH, RbOH, and LiOH additions worsen the degradation behavior. More specifically, the degradation performance improves in the trend of LiOH < RbOH < CsOH < KOH < tEAOH < NaOH addition. Since the anion species in the current study is unchanged, the differences in degradation are caused by the various cation species. The trend in reactivity series of alkali elements was considered to be responsible for the observed degradation trend, which increases in the order of Cs < Rb < K < Na < Li. Interestingly, it is clear that the two trends do not correlate very well. Determination of reactivity relies on the element characteristics alone, so the trend in reactivity series is similar to another qualitative measure: ionization energy. However, the element’s reaction partner also affects the reactivity of reaction. For example, for the reaction of an alkali element in water, the element’s characteristics and interaction with water, such as enthalpy of sublimation ( M ( s ) M ( g ) ), ionization energy ( M ( g ) M ( g ) + + e ), and enthalpy of dissolution ( M ( g ) + M ( aq ) + ), must be taken into consideration in predicting how reactive the reaction is. Therefore, the qualitative electrochemical series is used to correlate with the degradation trend. The degradation performances of alkali hydroxides at the same level of addition in 5 M KOH aqueous solution are plotted against the standard redox potential in Figure 14, resulting in a linear dependency with a high R2. Due to the lowest and highest redox potentials of Li and Na, respectively, the addition of LiOH appears to be the most corrosive while the addition of NaOH retards degradation. Consequently, NaOH is used as an electrolyte supplement for HT applications, where corrosion is much more aggressive, and LiOH is added in electrolyte to increase electrolyte activity for the LT discharge performance in Ni/MH battery [53].
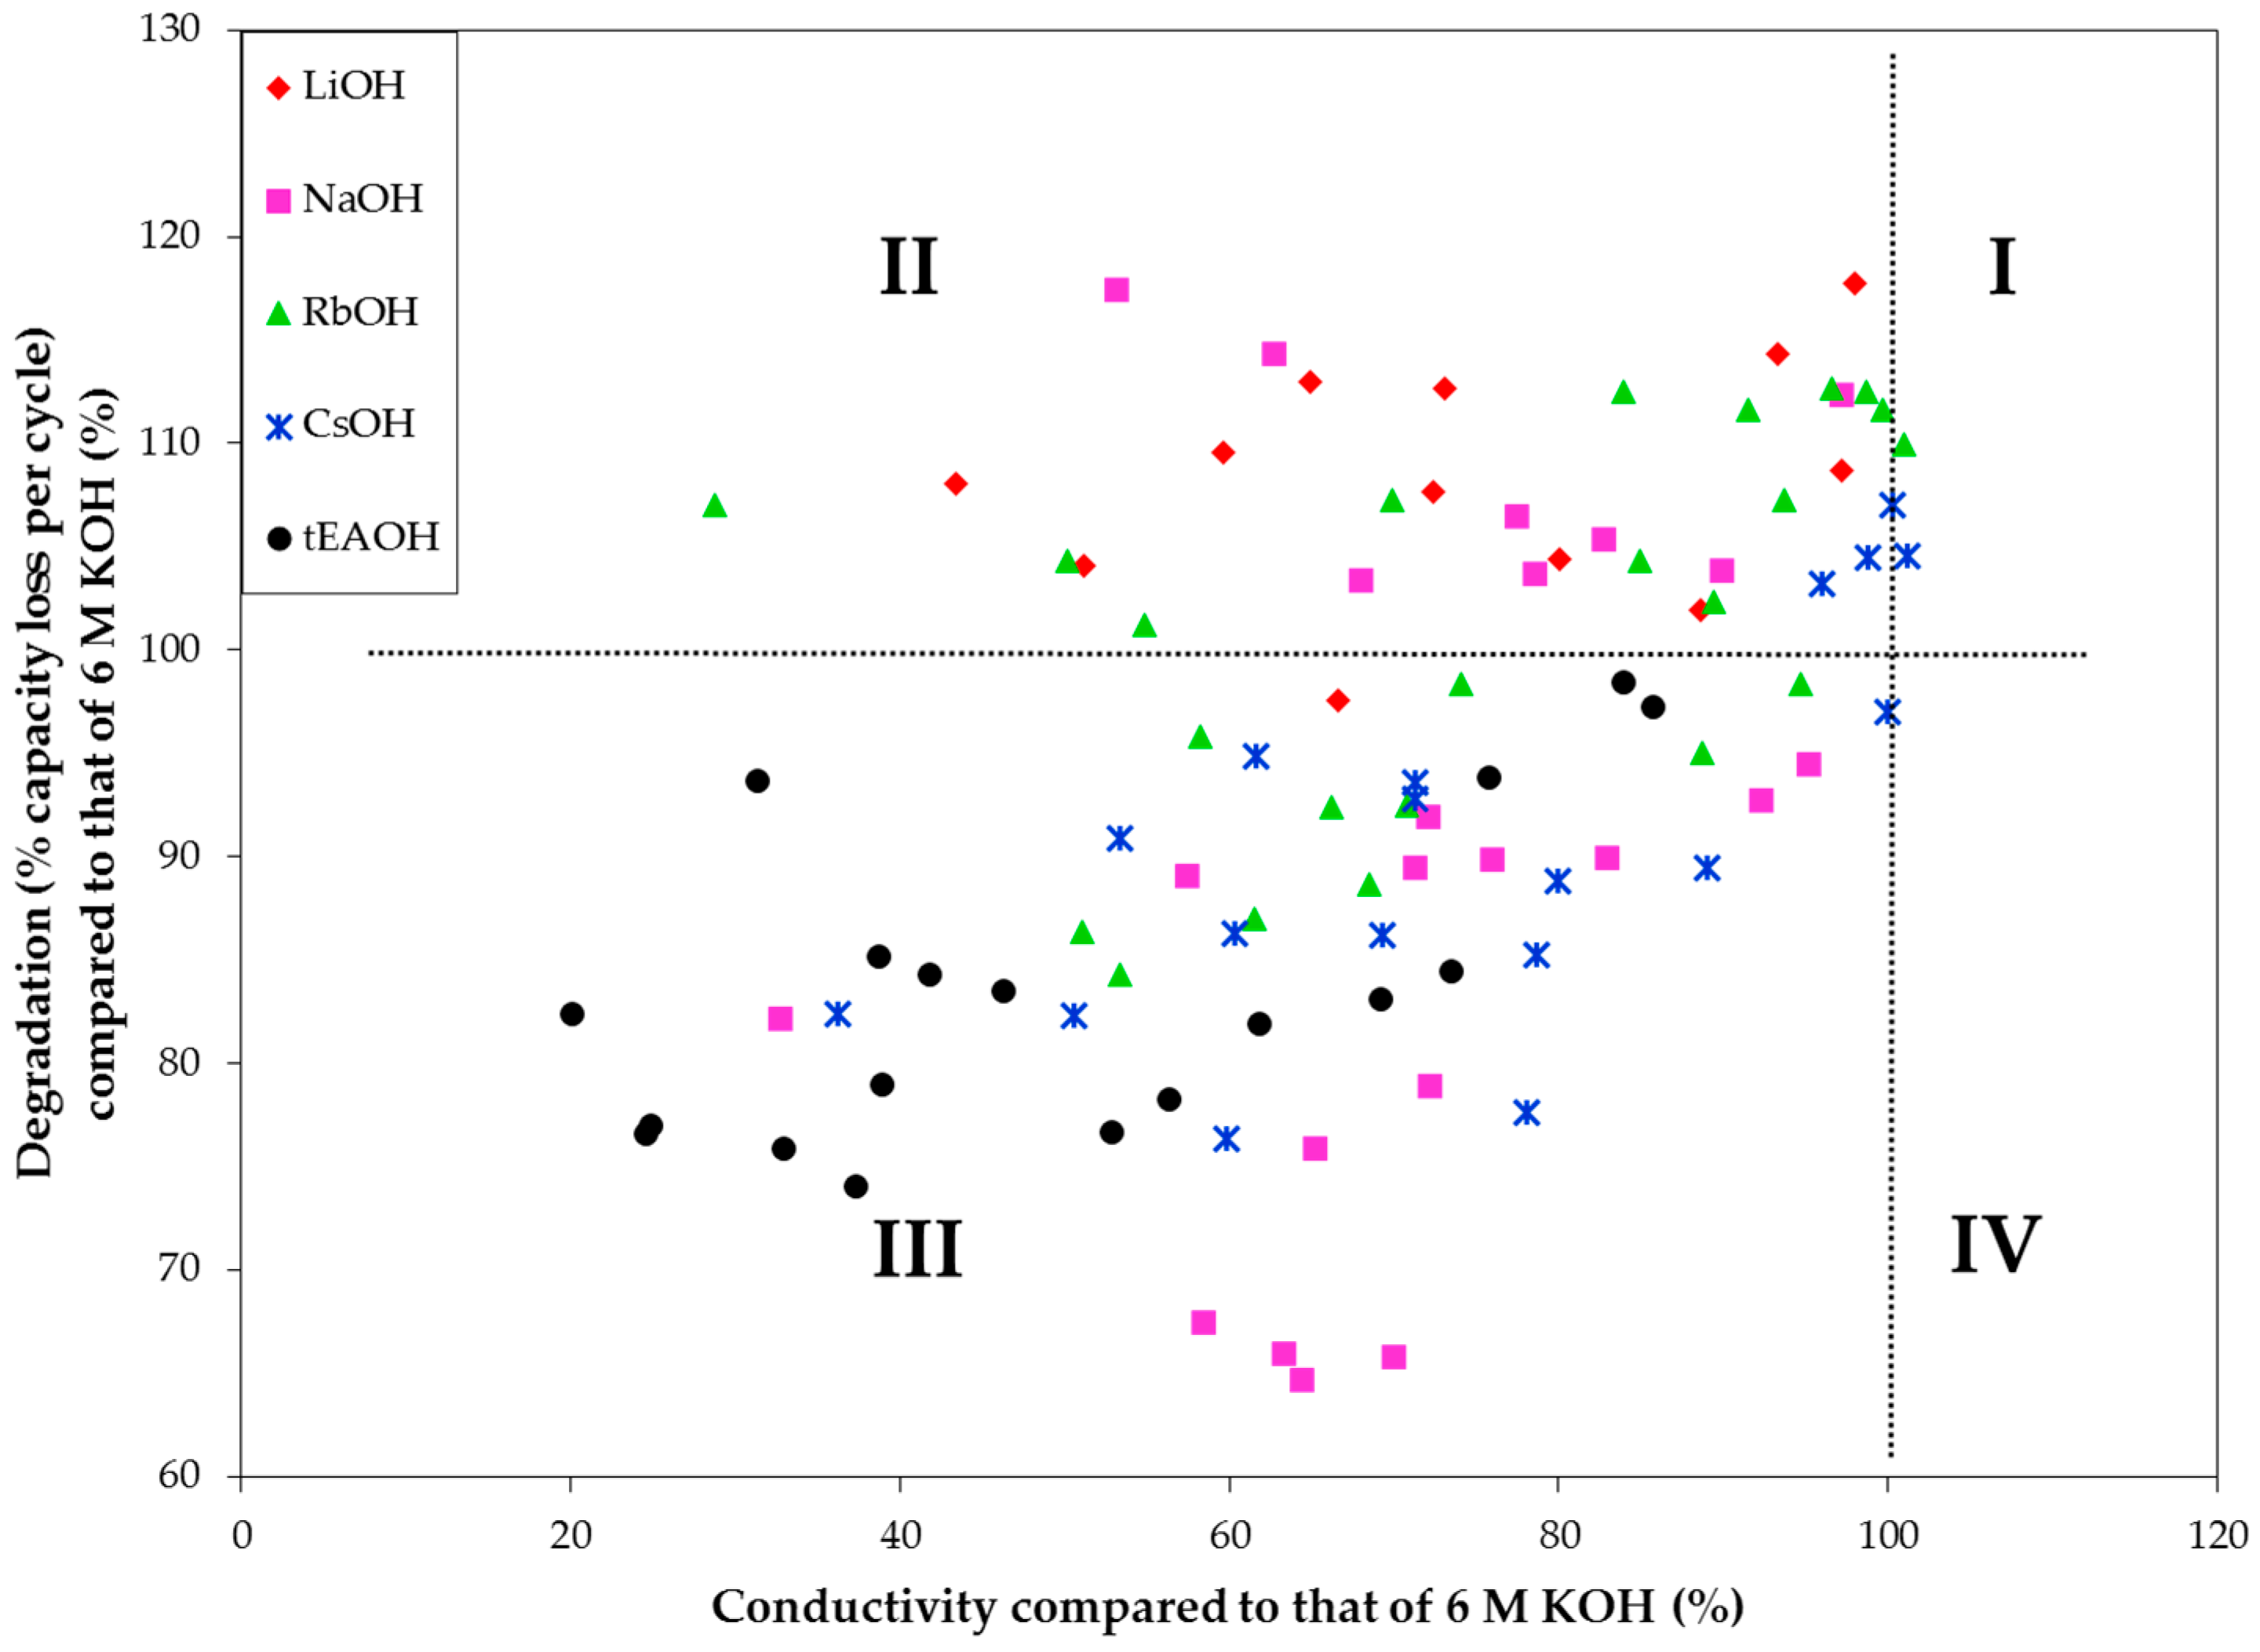
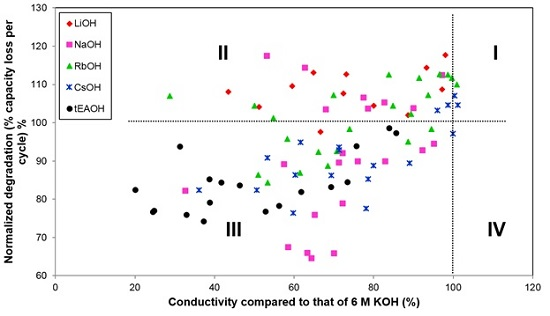
The entire data sets from Appendix are plotted in Figure 15. Most of the data plot to Quadrant III (with lower degradation but also lower conductivity). Those points in Quadrant II show lower conductivity and higher degradation and represent the most unsuitable electrolytes. From this chart, we also find that while NaOH and CsOH additions can reduce the corrosive nature of an electrolyte without sacrificing excessive amounts of conductivity, tEAOH is also a good candidate if electrolyte conductivity is not a major concern for the application (e.g., high energy Ni/MH battery without strict power requirements). We plan to continue this electrolyte study with additions of other organic hydroxides and amphoteric hydroxides/oxides, such as quaternary ammonium hydroxides, bis(ethylenediamine) copper(II) hydroxide, choline base solution, tetrabutylphosphonium hydroxide, hexamethonium hydroxide, and zinc oxide/hydroxide, in order to find possible candidates that fall in Quadrant IV.

4. Conclusions

Using a quaternary MgNiCoMn MH alloy powder prepared by MS followed by MA, we have shown a clear map of the balancing of conductivity for a reduction in corrosive nature of electrolyte and lower capacity degradation in KOH-based electrolytes. Among all modifying hydroxides, NaOH, CsOH, and (C2H5)4N(OH) show the best conductivity/degradation results. Combining the results from this study on various hydroxides with other methods of improving negative electrode cyclability, such as salt/surfactant additions, surface coatings/treatments, and composition optimizations, the use of high-capacity MgNi-based MH alloy in commercial Ni/MH battery is possible.

Acknowledgments

This work was financially supported by U.S. DOE ARPA-E under the RANGE program (DE-AR0000386). Authors thank colleagues from BASF-Ovonic: Jun In and Jonathan Tao for alloy preparation, Alan Chan, Ryan Blackenship and David Pawlik for analytic work, Taihei Ouchi, Baoquan Huang and Su Cronogue for technical assistance, and Benjamin Reichman and Benjamin Chao for fruitful discussions.

Author Contributions

Jean Nei designed the experiments and analyzed the data; Kwo-Hsiung Young prepared the manuscript and Damian Rotarov performed the experiments.

Conflicts of Interest

The authors declare no conflict of interest.

Abbreviations

MHMetal hydride
Ni/MHNickel/metal hydride
HRDHigh-rate dischargeability
LTLow temperature
RTRoom temperature
HTHigh temperature
DOEU.S. Department of Energy
RANGERobust affordable next generation EV-storage
RFRadio frequency
MSMelt spinning
MAMechanical alloying
XRDX-ray diffractometer
TEMTransmission electron microscope
tEAOHTetraethylammonium hydroxide
R2Correlation factor

Appendix

Table A1. Room temperature conductivities of electrolytes with various concentrations of KOH and other hydroxides normalized to that of 6 M KOH aqueous solution. Electrolyte with conductivity value higher than 100% implies that it is more conductive compared to the standard electrolyte (6 M KOH aqueous solution).
ContentKOH (M)X(OH)y (M)[OH] (M)Conductivity (%)ContentKOH (M)X(OH)y (M)[OH] (M)Conductivity (%)
X = Li, y = 10.003.003.0043.43X = Na, y = 10.001.001.0032.70
0.004.004.0051.150.002.002.0053.15
1.003.004.0059.610.003.003.0062.71
1.004.005.0064.960.004.004.0065.23
2.001.003.0066.640.005.005.0063.33
2.003.005.0072.410.006.006.0058.47
2.004.006.0073.061.001.002.0057.48
3.001.004.0080.021.002.003.0067.98
4.001.005.0088.651.003.004.0072.19
5.001.006.0093.291.004.005.0070.02
5.500.506.0097.231.005.006.0064.41
6.000.506.5098.032.001.003.0072.13
X = Rb, y = 10.001.001.0028.792.002.004.0077.44
0.002.002.0050.182.003.005.0075.93
0.003.003.0066.162.004.006.0071.31
0.004.004.0051.083.001.004.0082.89
0.005.005.0058.263.002.005.0082.71
0.006.006.0089.383.003.006.0078.60
1.001.002.0054.834.001.005.0089.96
1.002.003.0069.905.001.006.0092.27
1.003.004.0053.395.500.506.0095.16
1.004.005.0061.536.000.506.5097.21
1.005.006.0068.47X = Cs, y = 10.001.001.0036.18
2.001.003.0074.040.003.003.0078.65
2.002.004.0083.900.004.004.0078.10
2.003.005.0088.690.005.005.0053.39
2.004.006.0070.780.006.006.00100.31
3.001.004.0084.951.001.002.0059.81
3.002.005.0091.471.002.003.0050.59
3.003.006.0094.651.004.005.0061.59
4.001.005.0093.681.005.006.0071.33
4.002.006.0096.592.001.003.0079.92
5.001.006.0098.662.003.005.0060.30
5.500.506.0099.682.004.006.0071.26
6.000.506.50100.933.001.004.0088.99
X = tEA, y = 10.000.620.6220.133.003.006.0069.31
0.001.241.2424.554.001.005.0095.97
0.001.861.8624.835.001.006.0098.78
1.000.621.6238.875.500.506.0099.95
1.001.242.2437.296.000.506.50101.21
1.001.862.8632.94X = Mg, y = 26.000.01306.025999.58
2.000.622.6252.90
2.001.243.2446.27
2.001.863.8638.71
2.002.484.4831.31X = Ca, y = 26.000.01806.036098.81
3.000.623.6261.80
3.001.244.2456.29
3.001.864.8641.75X = Sr, y = 26.000.00046.000898.73
4.000.624.6269.22
4.001.245.2473.48
5.000.625.6275.74X = Ba, y = 26.000.00056.001198.74
5.500.315.8183.96
6.000.316.3185.68
Table A2. Room temperature degradation performances (defined as percentage capacity loss per cycle) of electrolytes with various concentrations of KOH and other hydroxides normalized to that of 6 M KOH aqueous solution. Electrolyte with degradation value higher than 100% implies that it is more corrosive compared to the standard electrolyte (6 M KOH aqueous solution).
ContentKOH (M)X(OH)y (M)[OH] (M)Degradation (%)ContentKOH (M)X(OH)y (M)[OH] (M)Degradation (%)
X = Li, y = 11.000.001.00101.92X = Na, y = 10.001.001.0082.11
2.000.002.00104.640.002.002.00117.41
3.000.003.00110.260.003.003.00114.34
4.000.004.00104.690.004.004.0075.89
5.000.005.00116.520.005.005.0065.91
5.500.005.5083.760.006.006.0067.41
6.000.006.00100.001.001.002.0089.07
0.003.003.00108.061.002.003.00103.36
0.004.004.00104.051.003.004.0078.91
1.003.004.00109.581.004.005.0065.76
1.004.005.00113.001.005.006.0064.64
2.001.003.0097.592.001.003.0091.91
2.003.005.00107.622.002.004.00106.48
2.004.006.00112.672.003.005.0089.88
3.001.004.00104.372.004.006.0089.46
4.001.005.00101.923.001.004.0089.90
5.001.006.00114.283.002.005.00105.34
5.500.506.00108.683.003.006.00103.66
6.000.506.50117.714.001.005.00103.81
X = Rb, y = 10.001.001.00107.005.001.006.0092.73
0.002.002.00104.295.500.506.0094.45
0.003.003.0092.366.000.506.50112.35
0.004.004.0086.38X = Cs, y = 10.001.001.0082.36
0.005.005.0095.830.002.002.0081.80
0.006.006.00102.330.003.003.0085.26
1.001.002.00101.220.004.004.0077.61
1.002.003.00107.250.005.005.0090.85
1.003.004.0084.300.006.006.00107.00
1.004.005.0086.971.001.002.0076.35
1.005.006.0088.661.002.003.0079.92
2.001.003.0098.371.003.004.0082.31
2.002.004.00112.521.004.005.0094.88
2.003.005.0095.001.005.006.0092.78
2.004.006.0092.462.001.003.0088.79
3.001.004.00104.292.002.004.0077.35
3.002.005.00111.652.003.005.0086.31
3.003.006.0098.372.004.006.0093.55
4.001.005.00107.253.001.004.0089.42
4.002.006.00112.633.002.005.0081.53
5.001.006.00112.523.003.006.0086.18
5.500.506.00111.654.001.005.00103.22
6.000.506.50109.974.002.006.0076.46
X = tEA, y = 10.000.620.6282.425.001.006.00104.51
0.001.241.2476.595.500.506.0097.03
0.001.861.8676.976.000.506.50104.57
0.002.482.4885.49X = Mg, y = 26.000.01306.025998.38
1.000.621.6278.96
1.001.242.2474.06
1.001.862.8675.89
1.002.483.4875.15
2.000.622.6276.65X = Ca, y = 26.000.01806.036098.29
2.001.243.2483.52
2.001.863.8685.17
2.002.484.4893.69
3.000.623.6281.94X = Sr, y = 26.000.00046.000896.13
3.001.244.2478.27
3.001.864.8684.33
4.000.624.6283.07
4.001.245.2484.43X = Ba, y = 26.000.00056.001197.90
5.000.625.6293.81
5.500.315.8198.44
6.000.316.3197.26

References

  1. Liu, D.; Zhu, Y.; Li, L. Effect of surface oxidation on the hydriding and dehydriding of Mg2Ni alloy produced by hydriding combustion synthesis. J. Mater. Sci. 2007, 42, 9725–9729. [Google Scholar] [CrossRef]
  2. Young, K.; Nei, J. The current status of hydrogen storage alloy development for electrochemical applications. Materials 2013, 6, 4574–4608. [Google Scholar] [CrossRef]
  3. Redzeb, M.; Zlatanova, Z.; Spassov, T. Influence of boron on the hydriding of nanocrystalline Mg2Ni. Intermetallics 2013, 34, 63–68. [Google Scholar] [CrossRef]
  4. Nikkuni, F.R.; Santos, S.F.; Ticianelli, E.A. Microstructures and electrochemical properties of Mg49Ti6Ni(45−x)Mx (M = Pd and Pt) alloy electrodes. Int. J. Energy Res. 2013, 37, 706–712. [Google Scholar] [CrossRef]
  5. Zhang, Z.; Elkedim, O.; Balcerzak, M.; Jurczyk, M. Structural and electrochemical hydrogen storage properties of MgTiNix (x = 0.1, 0.5, 1, 2) alloys prepared by ball milling. Int. J. Hydrog. Energy 2016, 41, 11761–11766. [Google Scholar] [CrossRef]
  6. Zhang, Y.; Li, C.; Cai, Y.; Hu, F.; Liu, Z.; Guo, S. Highly improved electrochemical hydrogen storage performances of the Nd-Cu-added Mg2Ni-type alloys by melt spinning. J. Alloys Compd. 2014, 584, 81–86. [Google Scholar] [CrossRef]
  7. Wang, Y.T.; Wan, C.B.; Wang, R.L.; Meng, X.H.; Huang, M.F.; Ju, X. Effect of Cr substitution by Ni on the cycling stability of Mg2Ni alloy using EXAFS. Int. J. Hydrog. Energy 2014, 39, 14858–14867. [Google Scholar] [CrossRef]
  8. Pu, Z.; Zhu, Y.; Zhu, J.; Yuan, J.; Zhang, J.; Chen, W.; Fang, J.; Li, L. Kinetics and electrochemical characteristics of Mg2NiH4−x wt.% MmNi3.8Co0.75Mn0.4Al0.2 (x = 5, 10, 20, 40) composites for Ni-MH battery. Int. J. Hydrog. Energy 2014, 39, 3887–3894. [Google Scholar] [CrossRef]
  9. Hou, X.; Hu, R.; Zhang, T.; Kou, H.; Song, W.; Li, J. Microstructure and electrochemical hydrogenation/dehydrogenation performance of melt-spun La-doped Mg2Ni alloys. Mater. Charact. 2015, 106, 163–174. [Google Scholar] [CrossRef]
  10. Verbovytskyy, Y.; Zhang, J.; Cuevas, F.; Paul-Boncour, V.; Zavaliy, I. Synthesis and properties of the Mg2Ni0.5Cu0.5H4.4 hydride. J. Alloys Compd. 2015, 645, S408–S411. [Google Scholar] [CrossRef]
  11. Li, M.; Zhu, Y.; Yang, C.; Zhang, J.; Chen, W. Enhanced electrochemical hydrogen storage properties of Mg2NiH4 by coating with nano-nickel. Int. J. Hydrog. Energy 2015, 40, 13949–13956. [Google Scholar] [CrossRef]
  12. Shang, J.; Ouyang, Z.; Liu, K.; Xing, C.; Liu, W.; Wang, L. Effect of Li atom infiltration by the way of electro-osmosis on electrochemical properties of amorphous Mg62Ni27La8 alloy used as negative electrode materials for the nickel-metal hydride secondary batteries. J. Non Cryst. Solids 2015, 415, 30–35. [Google Scholar] [CrossRef]
  13. Shao, H.; Li, X. Effect of nanostructure and partial substitution on gas absorption and electrochemical properties in Mg2Ni-based alloys. J. Alloys Compd. 2016, 667, 191–197. [Google Scholar] [CrossRef]
  14. Shahcheraghi, A.; Dehghani, F.; Raeissi, K.; Saatchi, A.; Enayati, M.H. Effects of TiO2 additive on electrochemical hydrogen storage properties of nanocrystalline/amorphous Mg2Ni intermetallic alloy. Iran. J. Mater. Sci. Eng. 2013, 10, 1–9. [Google Scholar]
  15. Ohara, R.; Lan, C.; Hwang, C. Electrochemical and structural characterization of electroless nickel coating on Mg2Ni hydrogen storage alloy. J. Alloys Compd. 2013, 580, S368–S372. [Google Scholar] [CrossRef]
  16. Haghighat-Shishavan, S.; Kashani-Bozorg, S.F. Nano-crystalline Mg(2−x)MnxNi compounds synthesized by mechanical alloys: Microstructure and electrochemistry. J. Ultrafine Grained Nanostruct. Mater. 2014, 47, 43–49. [Google Scholar]
  17. Venkateswari, A.; Nithya, C.; Kumaran, S. Electrochemical behaviour of Mg67Ni(33−x)Nbx (x = 0, 1, 2, and 4) alloy synthesized by high energy ball milling. Proc. Mater. Sci. 2014, 5, 679–687. [Google Scholar] [CrossRef]
  18. Rongeat, C.; Roué, L. On the cycle life improvement of amorphous MgNi-based alloy for Ni-MH batteries. J. Alloys Compd. 2005, 404–406, 679–681. [Google Scholar] [CrossRef]
  19. Rongeat, C.; Grosjean, M.-H.; Ruggeri, S.; Dehmas, M.; Bourlot, S.; Marcotte, S.; Roué, L. Evaluation of different approaches for improving the cycle life of MgNi-based electrodes for Ni-MH batteries. J. Power Sources 2006, 158, 747–753. [Google Scholar] [CrossRef]
  20. Wang, J.; Na, E.; Wu, F. Study on the improvement of cycle life of magnesium-based hydrogen storage alloy. J. Wuhan Univ. Technol. 2006, 28, 371–373. [Google Scholar]
  21. Kong, F.; Yan, H.; Xiong, W.; Li, B.; Li, J. Investigation on the cycling stability of Mg-based hydrogen storage electrode improved by anti-corrosion method. Chin. Rare Earths 2006, 27, 39–42. [Google Scholar]
  22. Yan, S.; Young, K.; Ng, K.Y.S. Effects of salt additives to the KOH electrolyte used in Ni/MH batteries. Batteries 2015, 1, 54–73. [Google Scholar] [CrossRef]
  23. Young, K.; Ng, K.Y.S.; Bendersky, L.A. A technical report of the robust affordable next generation energy storage system-BASF program. Batteries 2016, 2. [Google Scholar] [CrossRef]
  24. Rubin, E.J.; Baboian, R. A correlation of the solution properties and the electrochemical behavior of the nickel hydroxide electrode in binary aqueous alkali hydroxides. J. Electrochem. Soc. 1971, 118, 428–433. [Google Scholar] [CrossRef]
  25. Barnard, R.; Randell, C.F.; Tye, F.L. Studies concerning changes nickel hydroxide electrodes. IV. Reversible potentials in LiOH, NaOH, RbOH and CdOH. J. Appl. Electrochem. 1981, 11, 517–523. [Google Scholar] [CrossRef]
  26. Oliva, P.; Leonardi, J.; Laurent, J.F.; Delmas, C.; Braconnier, J.J.; Figlarz, M.; Fievet, F.; Guibert, A. Review of the structure and the electrochemistry of nickel hydroxides and oxy-hydroxides. J. Power Sources 1982, 8, 229–255. [Google Scholar] [CrossRef]
  27. See, D.M.; White, R.E. Temperature and concentration dependence of the specific conductivity of concentrated solutions of potassium hydroxide. J. Chem. Eng. Data 1997, 42, 1266–1268. [Google Scholar] [CrossRef]
  28. Leblanc, P.; Jordy, C.; Knosp, B.; Blanchard, P. Mechanism of alloy corrosion and consequences on sealed nickel—metal hydride battery performance. J. Electrochem. Soc. 1998, 145, 860–863. [Google Scholar] [CrossRef]
  29. Knosp, B.; Vallet, L.; Blamchard, P. Performance of an AB2 alloy in sealed Ni-MH batteries for electric vehicles: Qualification of corrosion rate and consequences on the battery performance. J. Alloys Compd. 1999, 293–295, 770–774. [Google Scholar] [CrossRef]
  30. Jeong, Y.H.; Kim, H.G.; Jung, Y.H.; Ruhmann, H. Effect of LiOH, NaOH and KOH on Corrosion and Oxide Microstructure of Zr-Based Alloys; International Atomic Energy Agency: Wien, Austria, 1999. [Google Scholar]
  31. Liu, J.; Wang, D.; Liu, S.; Feng, X. Improving high temperature performance of MH/Ni battery by orthogonal design. Battery Bimon. 2003, 33, 218–220. [Google Scholar]
  32. Hou, X.L.; Na, J.M.; Han, D.M.; Zhao, J.F. Preparation and performance of high-rated A-type MH-Ni batteries. Chin. J. Appl. Chem. 2004, 21, 1169–1173. (In Chinese) [Google Scholar]
  33. Lv, J.; Liu, X.; Zhang, J.; Fan, L.; Wang, L.; Zhang, Z. Studies on high-power nickel-metal hydride battery. Chin. J. Power Sources 2005, 29, 826–830. [Google Scholar]
  34. Li, X.; Dong, H.; Zhang, A.; Wei, Y. Electrochemical impedance and cyclic voltammetry characterization of a metal hydride electrode in alkaline electrolytes. J. Alloys Compd. 2006, 426, 93–96. [Google Scholar] [CrossRef]
  35. Park, C.; Shim, J.; Jang, M.; Park, C.; Choi, J. Influences of various electrolytes on the low-temperature characteristics of Ni-MH secondary battery. Trans. Korean Hydrog. New Energy Soc. 2007, 18, 284–291. [Google Scholar]
  36. Chen, R.; Li, L.; Wu, F.; Qiu, X.; Chen, S. Effects of low temperature on performance of hydrogen-storage alloys and electrolyte. Min. Metall. Eng. 2007, 27, 44–46. [Google Scholar]
  37. Yang, D.C.; Park, C.N.; Park, C.J.; Choi, J.; Sim, J.S.; Jang, M.H. Design of additives and electrolyte for optimization of electrode characteristics of Ni-MH secondary battery at room and low temperatures. Trans. Korean Hydrog. New Energy Soc. 2007, 18, 365–373. [Google Scholar]
  38. Zhang, X.; Chen, Y.; Tao, M.; Wu, C. Effect of electrolyte concentration on low-temperature electrochemical properties of LaNi5 alloy electrode at 233 K. J. Rare Earths 2008, 26, 402–405. [Google Scholar] [CrossRef]
  39. Zhang, X.; Chen, Y.; Tao, M.; Wu, C. Effect of electrolyte on the low-temperature electrochemical properties of LaNi5 alloy electrode at 253 K. Rare Metal. Mater. Eng. 2008, 37, 2012–2015. (In Chinese) [Google Scholar]
  40. Pei, L.; Yi, S.; He, Y.; Chen, Q. Effect of electrolyte formula on the self-discharge properties of nickel-metal hydride batteries. J. Guangdong Univ. Technol. 2008, 25, 10–12. [Google Scholar]
  41. Khaldi, C.; Mathlouthi, H.; Lamloumi, J. A comparative study of 1 M and 8 M KOH electrolyte concentrations used in Ni-MH batteries. J. Alloys Compd. 2009, 469, 464–471. [Google Scholar] [CrossRef]
  42. Guiose, B.; Cuevas, F.; Décamps, B.; Leroy, E.; Percheron-Guégan, A. Microstructural analysis of the aging of pseudo-binary (Ti,Zr)Ni intermetallic compounds as negative electrodes of Ni-MH batteries. Electrochim. Acta 2009, 54, 2781–2789. [Google Scholar] [CrossRef]
  43. Qiu, Z.; Wu, A. Study on wide temperature characteristics of Ni-MH battery. J. South China Norm. Univ. 2009, S1, 79–81. (In Chinese) [Google Scholar]
  44. Song, M.; Chen, Y.; Tao, M.; Wu, C.; Zhu, D.; Yang, H. Some factors affecting the electrochemical performances of LaCrO3 as negative electrodes for Ni/MH batteries. Electrochim. Acta 2010, 55, 3103–3108. [Google Scholar] [CrossRef]
  45. Ma, H.; Cheng, F.; Chen, J. Nickel-Metal Hydride (Ni-MH) Rechargeable Battery. In Electrochemical Technologies for Energy Storage and Conversion; Zhang, J., Zhang, L., Liu, H., Sun, A., Liu, R., Eds.; John Wiley & Sons, Inc.: New York, NY, USA, 2011; p. 204. [Google Scholar]
  46. Ruiz, F.C.; Martínez, P.S.; Castro, E.B.; Humana, R.; Peretti, H.A.; Visintin, A. Effect of electrolyte concentration on the electrochemical properties of an AB5-type alloy for Ni/MH batteries. Int. J. Hydrog. Energy 2013, 38, 240–245. [Google Scholar] [CrossRef]
  47. Martínez, P.S.; Ruiz, F.C.; Visintin, A. Influence of different electrolyte concentrations on the performance of an AB2-type alloy. J. Electrochem. Soc. 2014, 161, A326–A329. [Google Scholar] [CrossRef]
  48. Karwowska, M.; Jaron, T.; Fijalkowski, K.J.; Leszczynski, P.J.; Rogulski, Z.; Czerwinski, A. Influence of electrolyte composition and temperature on behavior of AB5 hydrogen storage alloy used as negative electrode in Ni-MH batteries. J. Power Sources 2014, 263, 304–309. [Google Scholar] [CrossRef]
  49. Giza, K. Influence of electrolyte on capacity and corrosion resistance of anode material used in Ni-MH cells. Ochr. Koroz. 2016, 59, 167–169. [Google Scholar] [CrossRef]
  50. Young, K. Stoichiometry in Inter-Metallic Compounds for Hydrogen Storage Applications. In Stoichiometry and Materials Science—When Numbers Matter; Innocenti, A., Kamarulzaman, N., Eds.; InTech: Rijeka, Croatia, 2012. [Google Scholar]
  51. Nayeb-Hashemi, A.A.; Clark, J.B. Mg-Ni (Magnesium-Nickel). In Binary Alloy Phase Diagram, 2nd ed.; Massalski, T.B., Okamoto, H., Subramanian, P.R., Kacprzak, L., Eds.; ASM International: Geauga County, OH, USA, 1990; Volume 3, pp. 2529–2530. [Google Scholar]
  52. Young, K.; Chao, B.; Liu, Y.; Nei, J. Microstructures of the oxides on the activated AB2 and AB5 metal hydride alloys surface. J. Alloys Compd. 2014, 606, 97–104. [Google Scholar] [CrossRef]
  53. Fetcenko, M.; Koch, J.; Zelinsky, M. Nickel-Metal Hydride Batteries and Nickel-Zinc Batteries for Hybrid Electric Vehicles and Battery Electric Vehicles. In Advances in Battery Technologies for Electric Vehicles; Scrosati, B., Garche, J., Tillmet, W., Eds.; Woodhead Publishing Ltd.: Cambridge, UK, 2015; pp. 107–108. [Google Scholar]
Figure 1. An radio frequency (RF)-sputtering unit with an 8″ nickel target decorated with different amounts of modifying elements (bottom) and an array of sandblasted nickel substrates with silicon witness substrates for composition measurements (top). The substrates are taped to a copper plate with circulating ice water or liquid nitrogen.
Batteries 02 00027 g001
Figure 2. Maximum discharge capacities of (a) Mg-Ni-Co ternary and (b) Mg-Ni-Co-Mn quaternary thin films deposited on liquid nitrogen-cooled nickel substrates with 50 mA·g−1 charge and discharge current densities. AR2 (Mg52.1Ni45.1Co2.8) and AR3 (Mg52Ni39Co3Mn6) are identified as compositions corresponding to the highest discharge capacities.
Batteries 02 00027 g002
Figure 3. Cycling performances of Mg-Ni-Co thin film: #1 (Mg41.9Ni50.9Co7.2 deposited on liquid nitrogen-cooled nickel substrate); #2 (Mg44.8Ni46.8Co8.4 deposited on liquid nitrogen-cooled nickel substrate); and #3 (Mg37.7Ni54.6Co7.7 deposited on ice water-cooled nickel substrate) with 100 mA·g−1 charge and discharge current densities. All films show similar cycling behavior. Two or three cycles are needed for activation, and once the electrodes are fully activated, steady capacity degradation is observed until around cycle 10. Capacity maintains stability from cycle 10 to 20.
Batteries 02 00027 g003
Figure 4. Photos of (a) a home-built MS system with a 2 kg induction furnace (top) and a rotating copper wheel (center) and (b) an attritor enclosed in a glovebox filled with argon gas. Powder is collected in a canister (bottom) that can be separated from the system by a butterfly valve.
Batteries 02 00027 g004
Figure 5. XRD patterns from MS AR3 ribbon samples (a) before and (b) after MA. With MA, the microstructure changes from polycrystalline Mg2Ni and MgNi2 phases to amorphous MgNi and microcrystalline Mg2Ni and MgNi2 phases.
Batteries 02 00027 g005
Figure 6. Cycling performances of MS + MA AR3 powders with (a) no additive; (b) 1 wt% Fe; (c) 1 wt% Si; and (d) 1 wt% Zr MA for 3 h with 100 mA·g−1 charge and discharge current densities. Cycle stability in the bulk form is much worse compared to that in the thin film form. While the addition of Si or Zr in the MA process does not affect the cycling performance, the addition of Fe reduces the capacity degradation. Although the initial capacity is decreased with the addition of Fe, the maintained capacity at higher cycle number is much higher than the original or modified AR3 powder with other additions.
Batteries 02 00027 g006
Figure 7. Transmission electron microscope (TEM) micrographs at (a) ×100,000 and (b) ×200,000 magnifications of the AR3 powder made by MS + MA at different magnifications. The cellular structures seen in the micrographs are from the cross-section of a sponge-scroll type of microstructure. Areas with darker contrast represent the scroll-type denser regions.
Batteries 02 00027 g007
Figure 8. Plot of conductivities normalized to that of 6 M KOH aqueous solution vs. the total OH concentration in solution for various hydroxide aqueous solutions. The KOH concentration is the difference between the total OH concentration and additive concentration. As the total OH concentration increases, the electrolyte conductivity increases. Also, at any fixed KOH concentration, the electrolyte conductivity increases in the order of tetraethylammonium hydroxide (tEAOH) < LiOH < NaOH < RbOH < CsOH addition.
Batteries 02 00027 g008
Figure 9. Plot of the conductivities of 4 M KOH + 1 M XOH aqueous solutions normalized to that of 6 M KOH aqueous solution vs. the cation sizes of alkali elements Xs.
Batteries 02 00027 g009
Figure 10. Schematics of (a) the first cycle discharge voltage profiles and (b) capacity cycle data from three hypothetical electrolytes with different activation powers (Electrolyte 3 < Electrolyte 2 < Electrolyte 1). Electrolyte 1 with the fastest activation shows the highest plateau voltage (lowest impedance) and consequently the highest initial capacity. However, activation power is strongly associated with corrosion strength, so Electrolyte 1 also exhibits the highest degradation rate.
Batteries 02 00027 g010
Figure 11. Plots of (a) the initial capacities and (b) degradation performances normalized to those of 6 M KOH aqueous solution vs. the total OH concentration in solution for several pure KOH aqueous solution systems.
Batteries 02 00027 g011
Figure 12. Plots of (a) the initial capacities and (b) degradation performances normalized to those of 6 M KOH aqueous solution vs. the total OH concentration in solution for various electrolyte mixtures of KOH and LiOH. The trends in activation power (indicated by the initial capacity) and degradation are similar: higher total OH concentration in solution corresponds to higher activation power and degradation. However, an exception is observed with the KOH-free solution with lower OH concentration (the leftmost data point of the 3 M LiOH series), which unexpectedly shows a higher activation power and a higher degradation compared to the mixed solutions in the same series. Such abnormality was found in many similar cases in this study (see data in Table A2 in Appendix).
Batteries 02 00027 g012
Figure 13. An example from the electrolyte degradation study. The KOH concentration is 5 M, and the concentrations of additions are 1 M for LiOH, NaOH, RbOH, and CsOH, and 0.6 M for tEAOH.
Batteries 02 00027 g013
Figure 14. Plot of the degradation performances of 5 M KOH + 1 M XOH aqueous solutions normalized to that of 6 M KOH aqueous solution vs. the standard redox potentials of alkali elements Xs.
Batteries 02 00027 g014
Figure 15. Plot of the degradation performances vs. the conductivities for various hydroxide aqueous solutions. Both quantities are normalized to those of 6 M KOH aqueous solution. Vertical and horizontal lines corresponding to the values from standard 6 M KOH aqueous solution divide the plot into Quadrants I, II, III, and IV. While the solutions in Quadrant II are less desirable (lower conductivity and higher degradation), those in Quadrant III represent a compromise between conductivity and degradation (lower conductivity and lower degradation). Future research will focus on finding solutions in Quadrant IV. Data originate from Appendix.
Batteries 02 00027 g015
Table 1. Summary of previous electrolyte studies on alkali cations in a chronological order. LT, RT, and HT denote low temperature (<0 °C), room temperature, and high temperature (>40 °C), respectively. A and B in the alloy formula represent misch metals (La, Ce, Pr, and/or Nd) and transition metals (Ni, Co, Mn, and/or Al), respectively. MH: metal hydride; and HRD: high-rate dischargeability.
Tested ElectrodeHydroxideMain FindingsReference
Ni(OH)2From LiOH to CsOH
  • LiOH increases HT charge acceptance.
  • RbOH and CsOH increase LT charge acceptance.
[24]
Ni(OH)2From LiOH to CsOH
  • CsOH and a low concentration of RbOH do not promote α-NiOOH.
[25]
Ni(OH)2From LiOH to CsOH
  • Highest capacities obtained from LiOH and NaOH at HT, KOH at RT, and RbOH and CsOH at LT.
[26]
Not specifiedKOH
  • Conductivities of KOH at various concentrations and temperatures were reported.
[27]
AB58.7 M KOH-0.5 M NaOH-0.7 M LiOH
  • Corrosion behavior was reported.
[28]
(Ti,Zr)B28.5 M mixture of LiOH, NaOH, KOH
  • Corrosion behavior was reported.
[29]
Zircaloy (ZrSn)From LiOH to CsOH
  • Relative corrosion rates: LiOH > NaOH > KOH > RbOH > CsOH.
[30]
Ni(OH)2LiOH additive
  • LiOH increases HT capacity and discharge voltage.
[31]
AB5Mixture of LiOH, NaOH, KOH
  • Best results observed with a mixture of 78% KOH, 20% NaOH, and 2% LiOH.
[32]
AB5Mixture of LiOH, NaOH, KOH
  • NaOH improves HT.
  • Best HT result observed with a mixture of 36% KOH, 43% NaOH, and 6% LiOH.
[33]
AB5KOH, NaOH
  • NaOH reduces the corrosion rate of AB5 MH alloy.
[34]
AB5From LiOH to CsOH
  • Best LT electrolyte is 6.2 M KOH + 1.2 M LiOH.
  • RbOH and CsOH help LT performance.
[35]
AB5Mixture of LiOH, NaOH, KOH
  • Suggestion of a ternary mixture to improve LT performance.
[36]
AB5Mixture of LiOH, NaOH, KOH
  • Highest capacity at −18 °C is obtained from mixture of 3.6 M KOH, 3.38 M NaOH, and 0.14 M LiOH.
[37]
LaNi5KOH, NaOH
  • KOH has better performance at LT compared to NaOH.
[38,39]
LaNi5KOH, NaOH
  • NaOH is good for HT but bad for LT.
[40]
LaB51 M KOH and 8 M KOH
  • 1 M KOH has higher capacity and lower corrosion.
[41]
(Ti,Zr)Ni6 M KOH and 8 M KOH
  • 8 M KOH has higher capacity and corrosion.
[42]
AB5KOH, NaOH
  • KOH is good for LT, and NaOH is good for HT.
[43]
LaCrO35.6–12.5 M KOH
  • Higher concentrations of KOH increase capacity.
[44]
AB5LiOH, KOH
  • 26% KOH has a much better cycle life than 31% KOH.
  • LiOH prevents Ni(OH)2 grain growth and increases charge efficiency in the positive electrode.
[45]
LaB52, 4, 6, 8 M KOH
  • 6 M KOH and 8 M KOH correspond to the highest capacity and HRD.
[46]
(Ti,Zr)B22, 4, 6, 8 M KOH
  • 4 M KOH corresponds to the best cycle stability.
  • 8 M KOH corresponds to the highest capacity.
[47]
AB5From LiOH to CsOH
  • KOH demonstrates the highest capacity.
  • Highest corrosion rates are found with RbOH.
[48]
AB5LiOH, KOH
  • KOH demonstrate better activation and lower corrosion.
[49]
Table 2. Maximum discharge capacities of Mg-Ni binary thin films deposited on ice water-cooled nickel substrates with 20 mA·g−1 charge and discharge current densities. Mg52Ni48 (AR1) is identified as the composition with the highest discharge capacity. Microstructures and phase abundances were obtained from the X-ray diffraction (XRD) patterns in reference [50].
Alloy CompositionDischarge Capacity (mAh·g−1)Microstructure
Mg48Ni5230230% microcrystalline + 70% amorphous
Mg52Ni4832720% microcrystalline + 80% amorphous
Mg57Ni4326010% polycrystalline + 90% amorphous
Mg61Ni397520% polycrystalline + 80% amorphous
Mg65Ni352030% polycrystalline + 70% amorphous
Table 3. Evolution of an MgNi-based MH alloy formula with increasing degree of disorder (number of constituent elements). Bulk powder was produced by melt spinning (MS) + mechanical alloying MA.
Formula NameCompositionThin Film Discharge Capacity (mAh·g−1)Bulk Powder Discharge Capacity (mAh·g−1)PowerCycle Life
AR1Mg52Ni48327-LowLow
AR2Mg52.1Ni45.1Co2.8662-LowLow
AR3Mg52Ni39Co3Mn6639791MediumLow
AR4Mg51.5Ni37Co6Mn4Fe1.5823472MediumImproved
AR5Mg50Ni40Co6Mn3Zr1592456GoodGood

