Local and Average Structural Changes in Zeolite A upon Ion Exchange


1
Department of Chemistry, University of Bath, Bath BA2 7AY, UK
2
Inorganic Chemistry Lab, South Parks Road, University of Oxford, Oxford OX1 3QR, UK
*
Author to whom correspondence should be addressed.
Magnetochemistry 2017, 3(4), 42; https://doi.org/10.3390/magnetochemistry3040042
Submission received: 21 August 2017
/
Revised: 6 December 2017
/
Accepted: 7 December 2017
/
Published: 12 December 2017
(This article belongs to the Special Issue Nuclear Magnetic Resonance Spectroscopy)
Abstract
:The infamous ‘structure–property relationship’ is a long-standing problem for the design, study and development of novel functional materials. Most conventional characterization methods, including diffraction and crystallography, give us a good description of long-range order within crystalline materials. In recent decades, methods such as Solid State NMR (SS NMR) are more widely used for characterization of crystalline solids, in order to reveal local structure, which could be different from long-range order and sometimes hidden from long-range order probes. In particular for zeolites, this opens a great avenue for characterization through studies of the local environments around Si and Al units within their crystalline frameworks. In this paper, we show that some structural modifications occur after partially exchanging the extraframework Na ions with monovalent, Li, K, Rb and NH and divalent, Ca cations. Solid state NMR is deployed to study the local structure of exchanged materials, while average stricture changes can be observed by powder diffraction (PXRD). To corroborate our findings, we also employ Fourier Transform Infrared spectroscopy (FT-IR), and further characterization of some samples was done using Scanning Electron Microscopy (SEM) and Energy-Dispersive X-ray spectroscopy (EDX).
1. Introduction
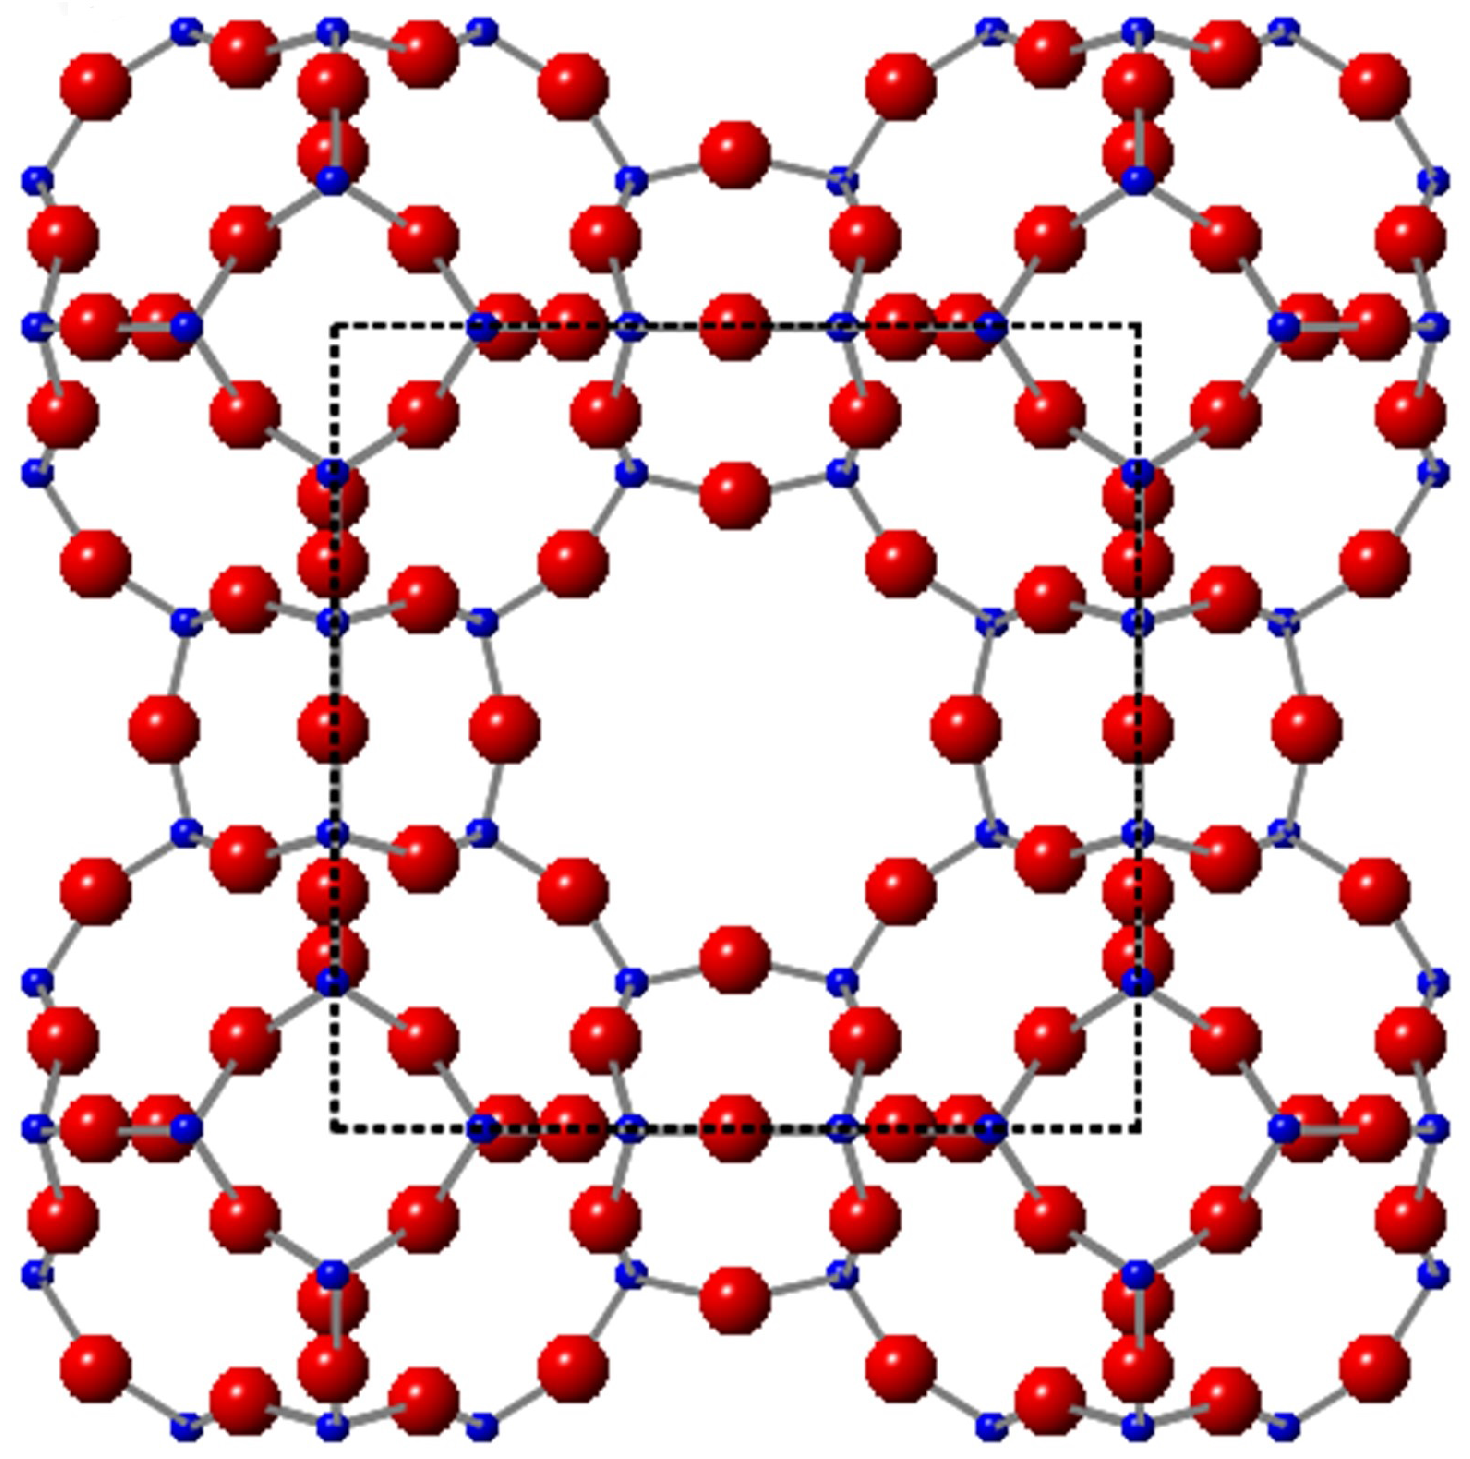
Zeolites are aluminosilicate porous minerals. Many zeolites occur in nature as aluminosilicate minerals. To date, we can make more than 200 synthetic zeolites in the laboratory [1,2]. They are classed as porous materials as they possess cages, channels and open void spaces within their highly crystalline frameworks. Each zeolite framework has a unique structure, and because there is such a variety of zeolite structures, there is also a very wide diversity of zeolite applications. Synthetic zeolites are used as green, re-usable catalysts in industrial processes as heterogeneous catalysts for processes that involve hydro-cracking, acrylation, oxidation and reforming. Most zeolite syntheses employ Organic Structure Directing Agents (OSDAs), such as TMA-OH (Tetramethylammonium Hydroxide) or crown-ether, which act as templates to guide the formation of particular types of zeolite pores and channels [3,4,5,6]. This reduces the chance of producing competing zeolite phases. However, due to the high manufacturing costs of producing these organic materials, which cannot be recovered after calcination, current research is becoming more concerned with optimising synthesis conditions in order to produce pure zeolites in the absence of OSDAs [3,7]. Here, we performed a low temperature synthesis of small zeolite A (Na-A) crystals without the use of OSDAs, and the corresponding LTA framework (Linde Type A) is shown in Figure 1.
Na-A is a commercially important zeolite used in industry for catalysis, adsorption and industrial gas separations [8]. More recently, its sustainability as a drug delivery system has been investigated [9]. One of its greatest applications, however, is ion exchange; in particular, rapid Na/Ca exchange. Consequently, Na-A is very effective in water softening, and one of its main functions is in washing powders as a detergent builder [10].
Ion exchange can also produce zeolites with different properties. For example, K-A is commonly used in the ethanol drying processes [11] and partially-exchanged K/Na-A is used to separate CO from CO/N dry mixtures [12]. Ca-A zeolites are important in industry, where they selectively adsorb linear alkanes from a mixture of branched alkanes [13], and Na/NH exchange is useful in minimising environmental pollution and eutrophication [14,15,16,17]. Li-A was proposed as a possible delivery material for pharmacological studies [18]. Li-exchanged zeolites are also used for the separation of nitrogen from air [19]. In this work, we carried out aqueous ion exchange of monovalent alkali metals: Li, K, Rb and NH and divalent Ca into zeolite A crystals produced from a low temperature and organic template-free synthesis and performed analysis using solid state NMR and other methods to determine the structural effects of the exchange. Previously, solid state NMR has been used to study other zeolites [20,21,22,23,24,25,26,27,28].
2. Results and Discussion
2.1. Na-A, Li-A, K-A and Rb-A
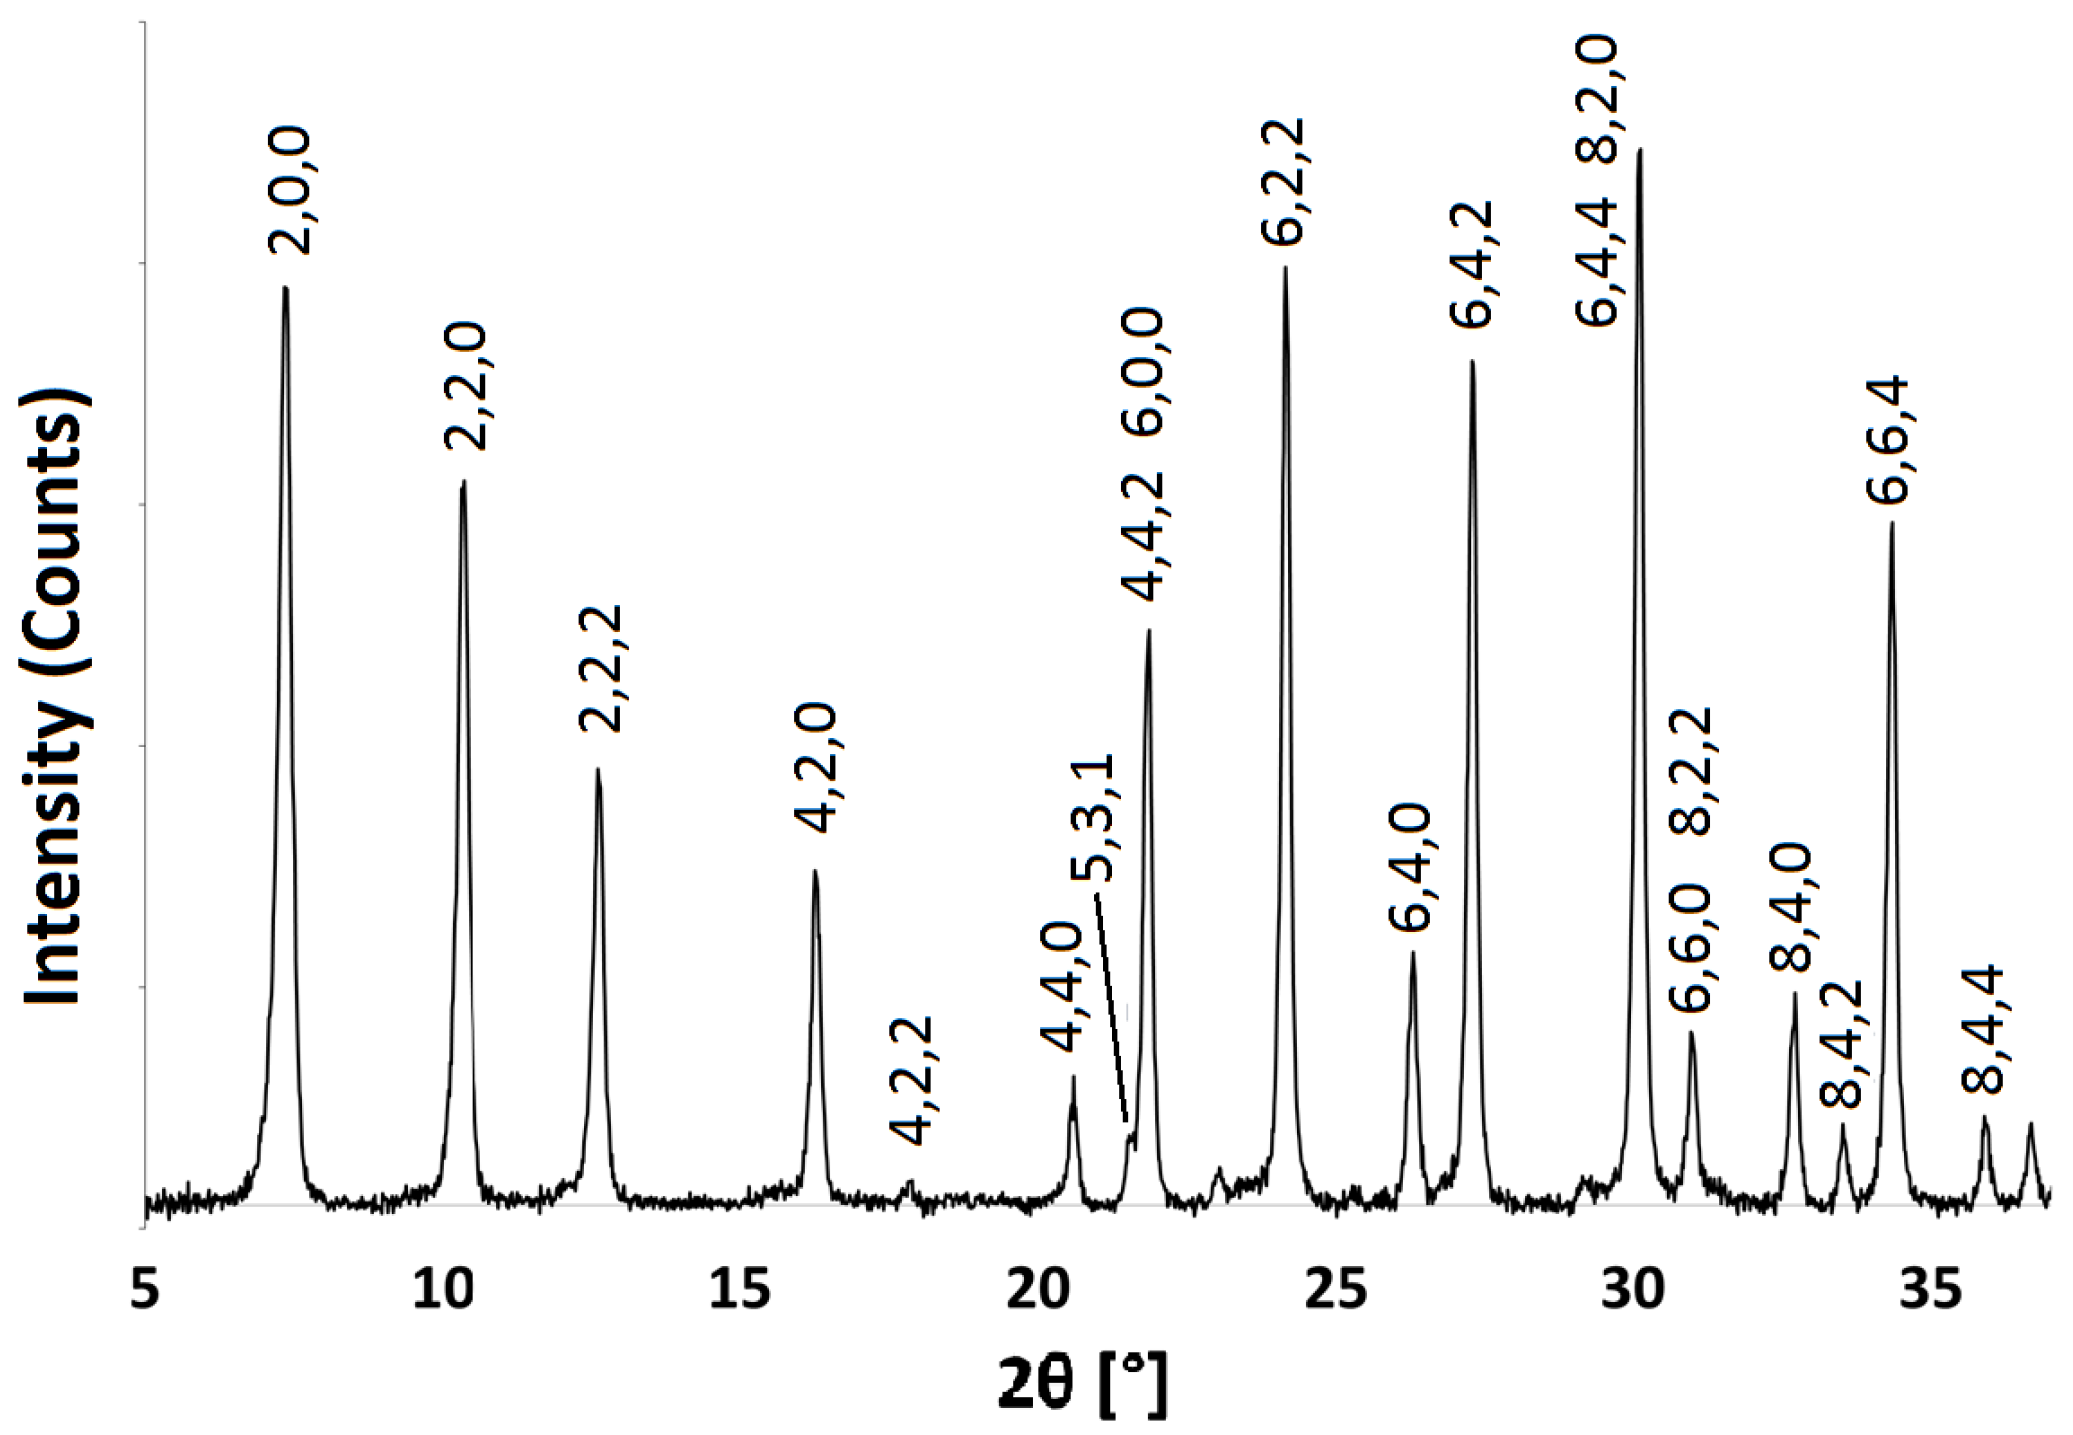
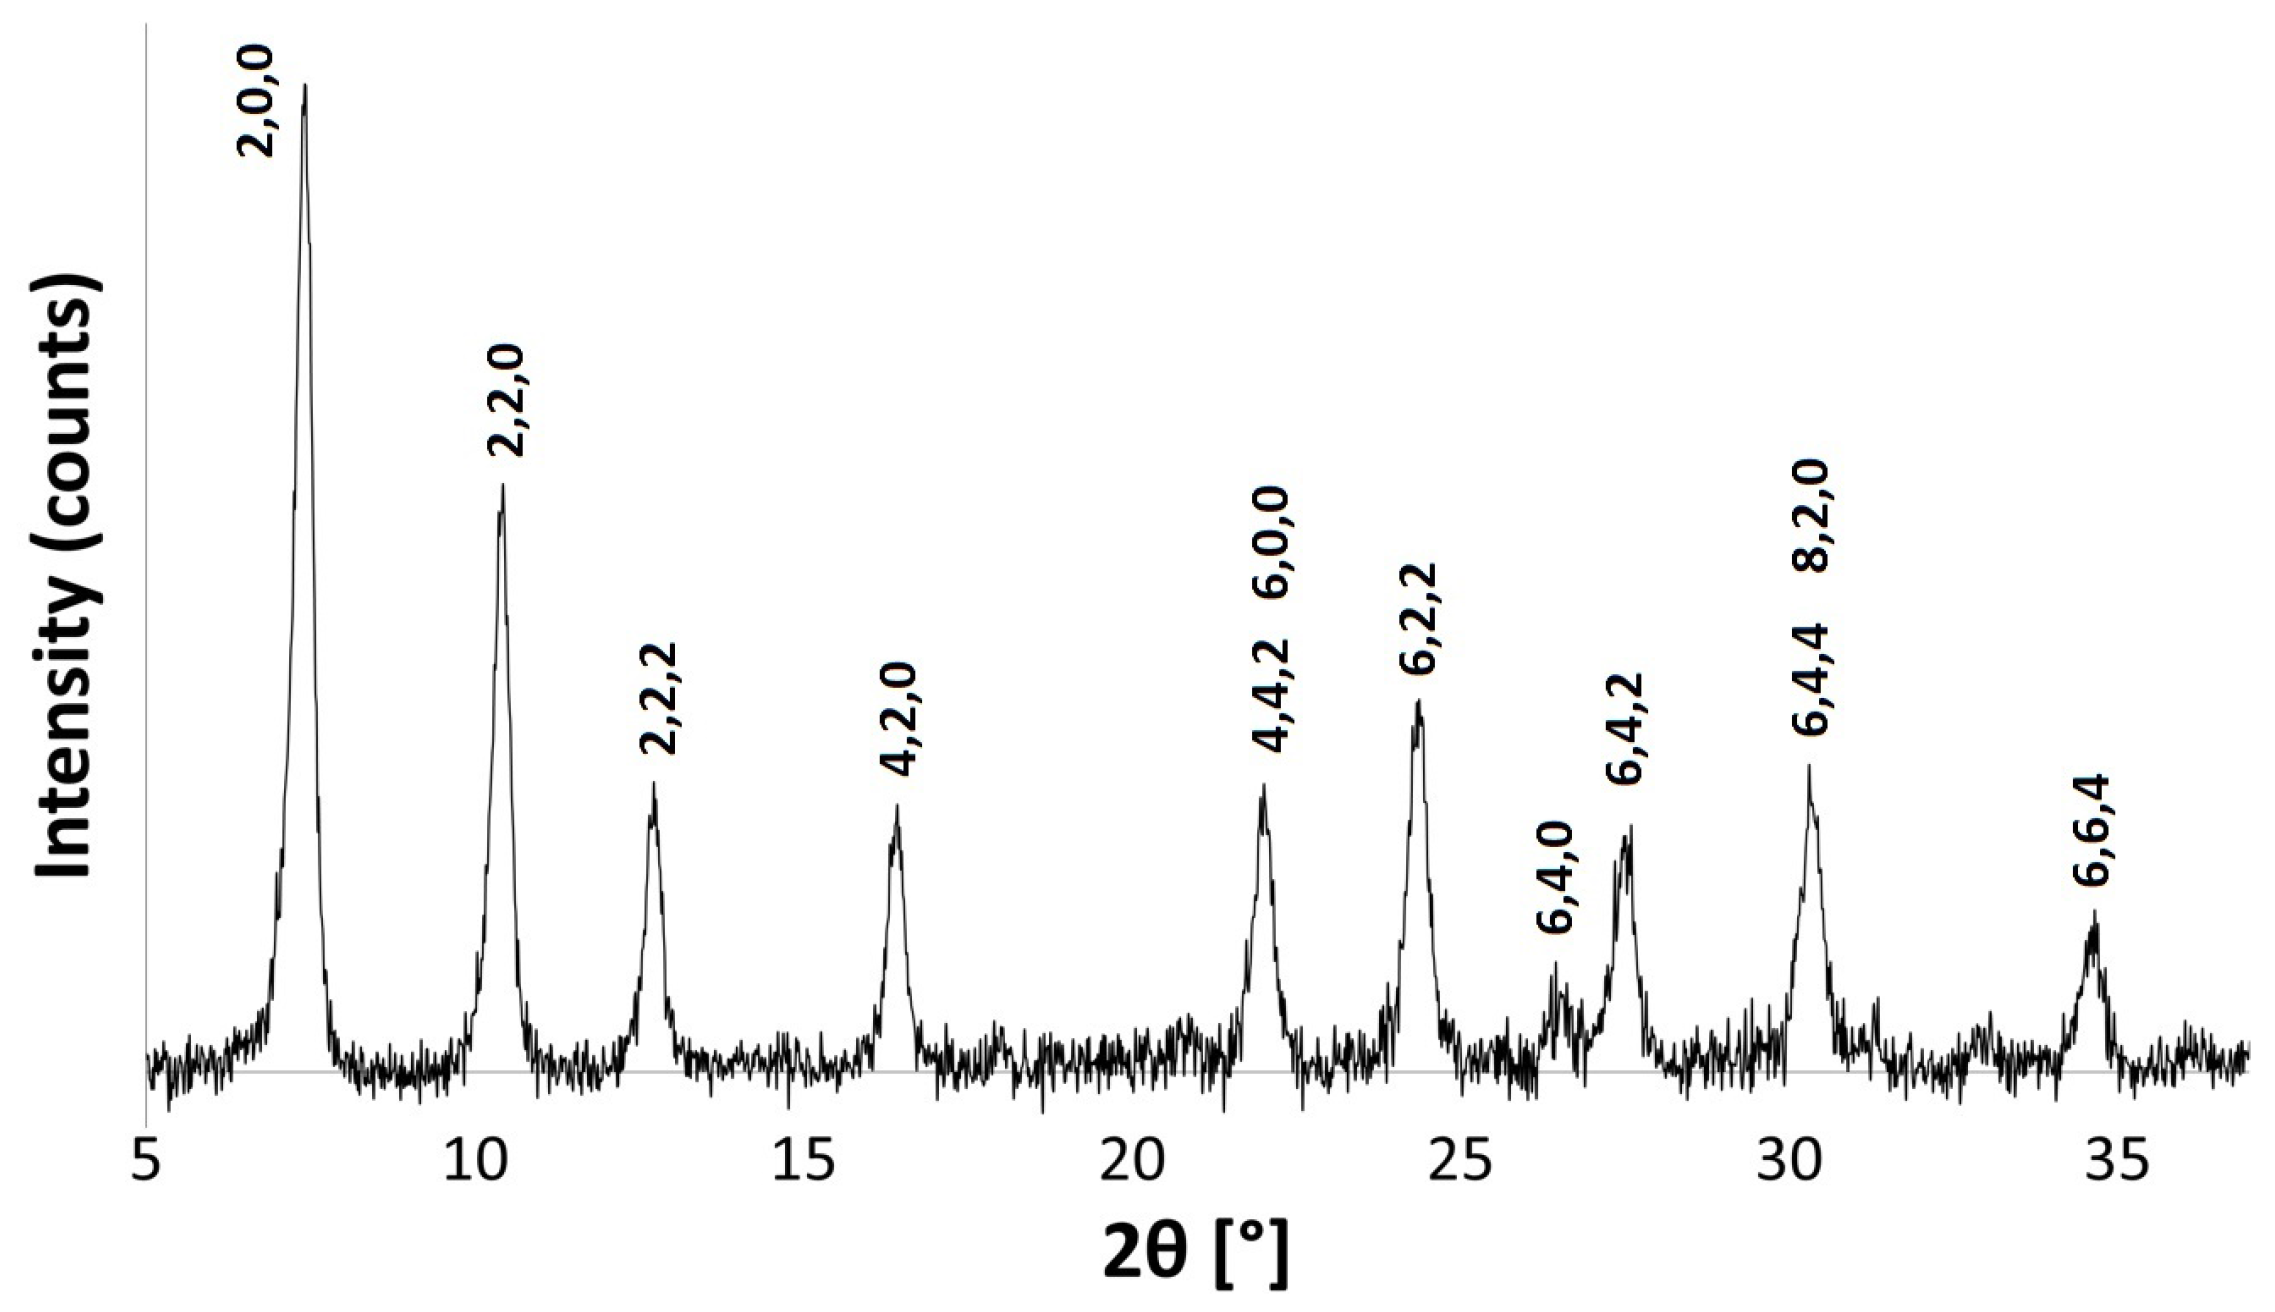
The powder patterns of the hydrated Na-A samples are consistent with those recorded in the literature for pure phase zeolite A crystals [29,30]. Figure 2 shows the indexed pattern for Na-A, synthesised at 40 C for 24 h. Reflection peaks corresponding to both Na-A and Faujasite (FAU) phases [30] were observed when the zeolites were synthesised at 50 C for 24 h and at 40 C for 48 h, as shown in Figure 3. It is evident that, if given enough time or if heated above a certain temperature, there is a tendency for the metastable LTA framework structure to subsequently transform into the FAU framework [7,31]. Careful control of the synthesis conditions is, therefore, necessary to avoid the formation of the unwanted polymorph, which is a ubiquitous problem in synthesising zeolites in the absence of OSDAs. The low temperature of 40 C limits the presence of these competing phases.
In this investigation, we decided to study all samples after one ion exchange only. The extent of exchange was quantified from the filtrates using a sodium ion selective electrode (ISE). For each sample, even after one exchange, we see good, although not complete, ion exchange. This is not surprising as sometimes as many as 8–10 steps are required for a complete exchange to occur [32]. Results show that the extent of exchange decreases with increasing cation size, Li K Rb. The steric restrictions of the zeolite pores make full exchange difficult to obtain, particularly for those ions with large ionic radii. Energy Dispersive X-ray (EDX) elemental analysis was also carried out. In all samples, it was evident that partial exchange had taken place, as residual Na ions were detected.
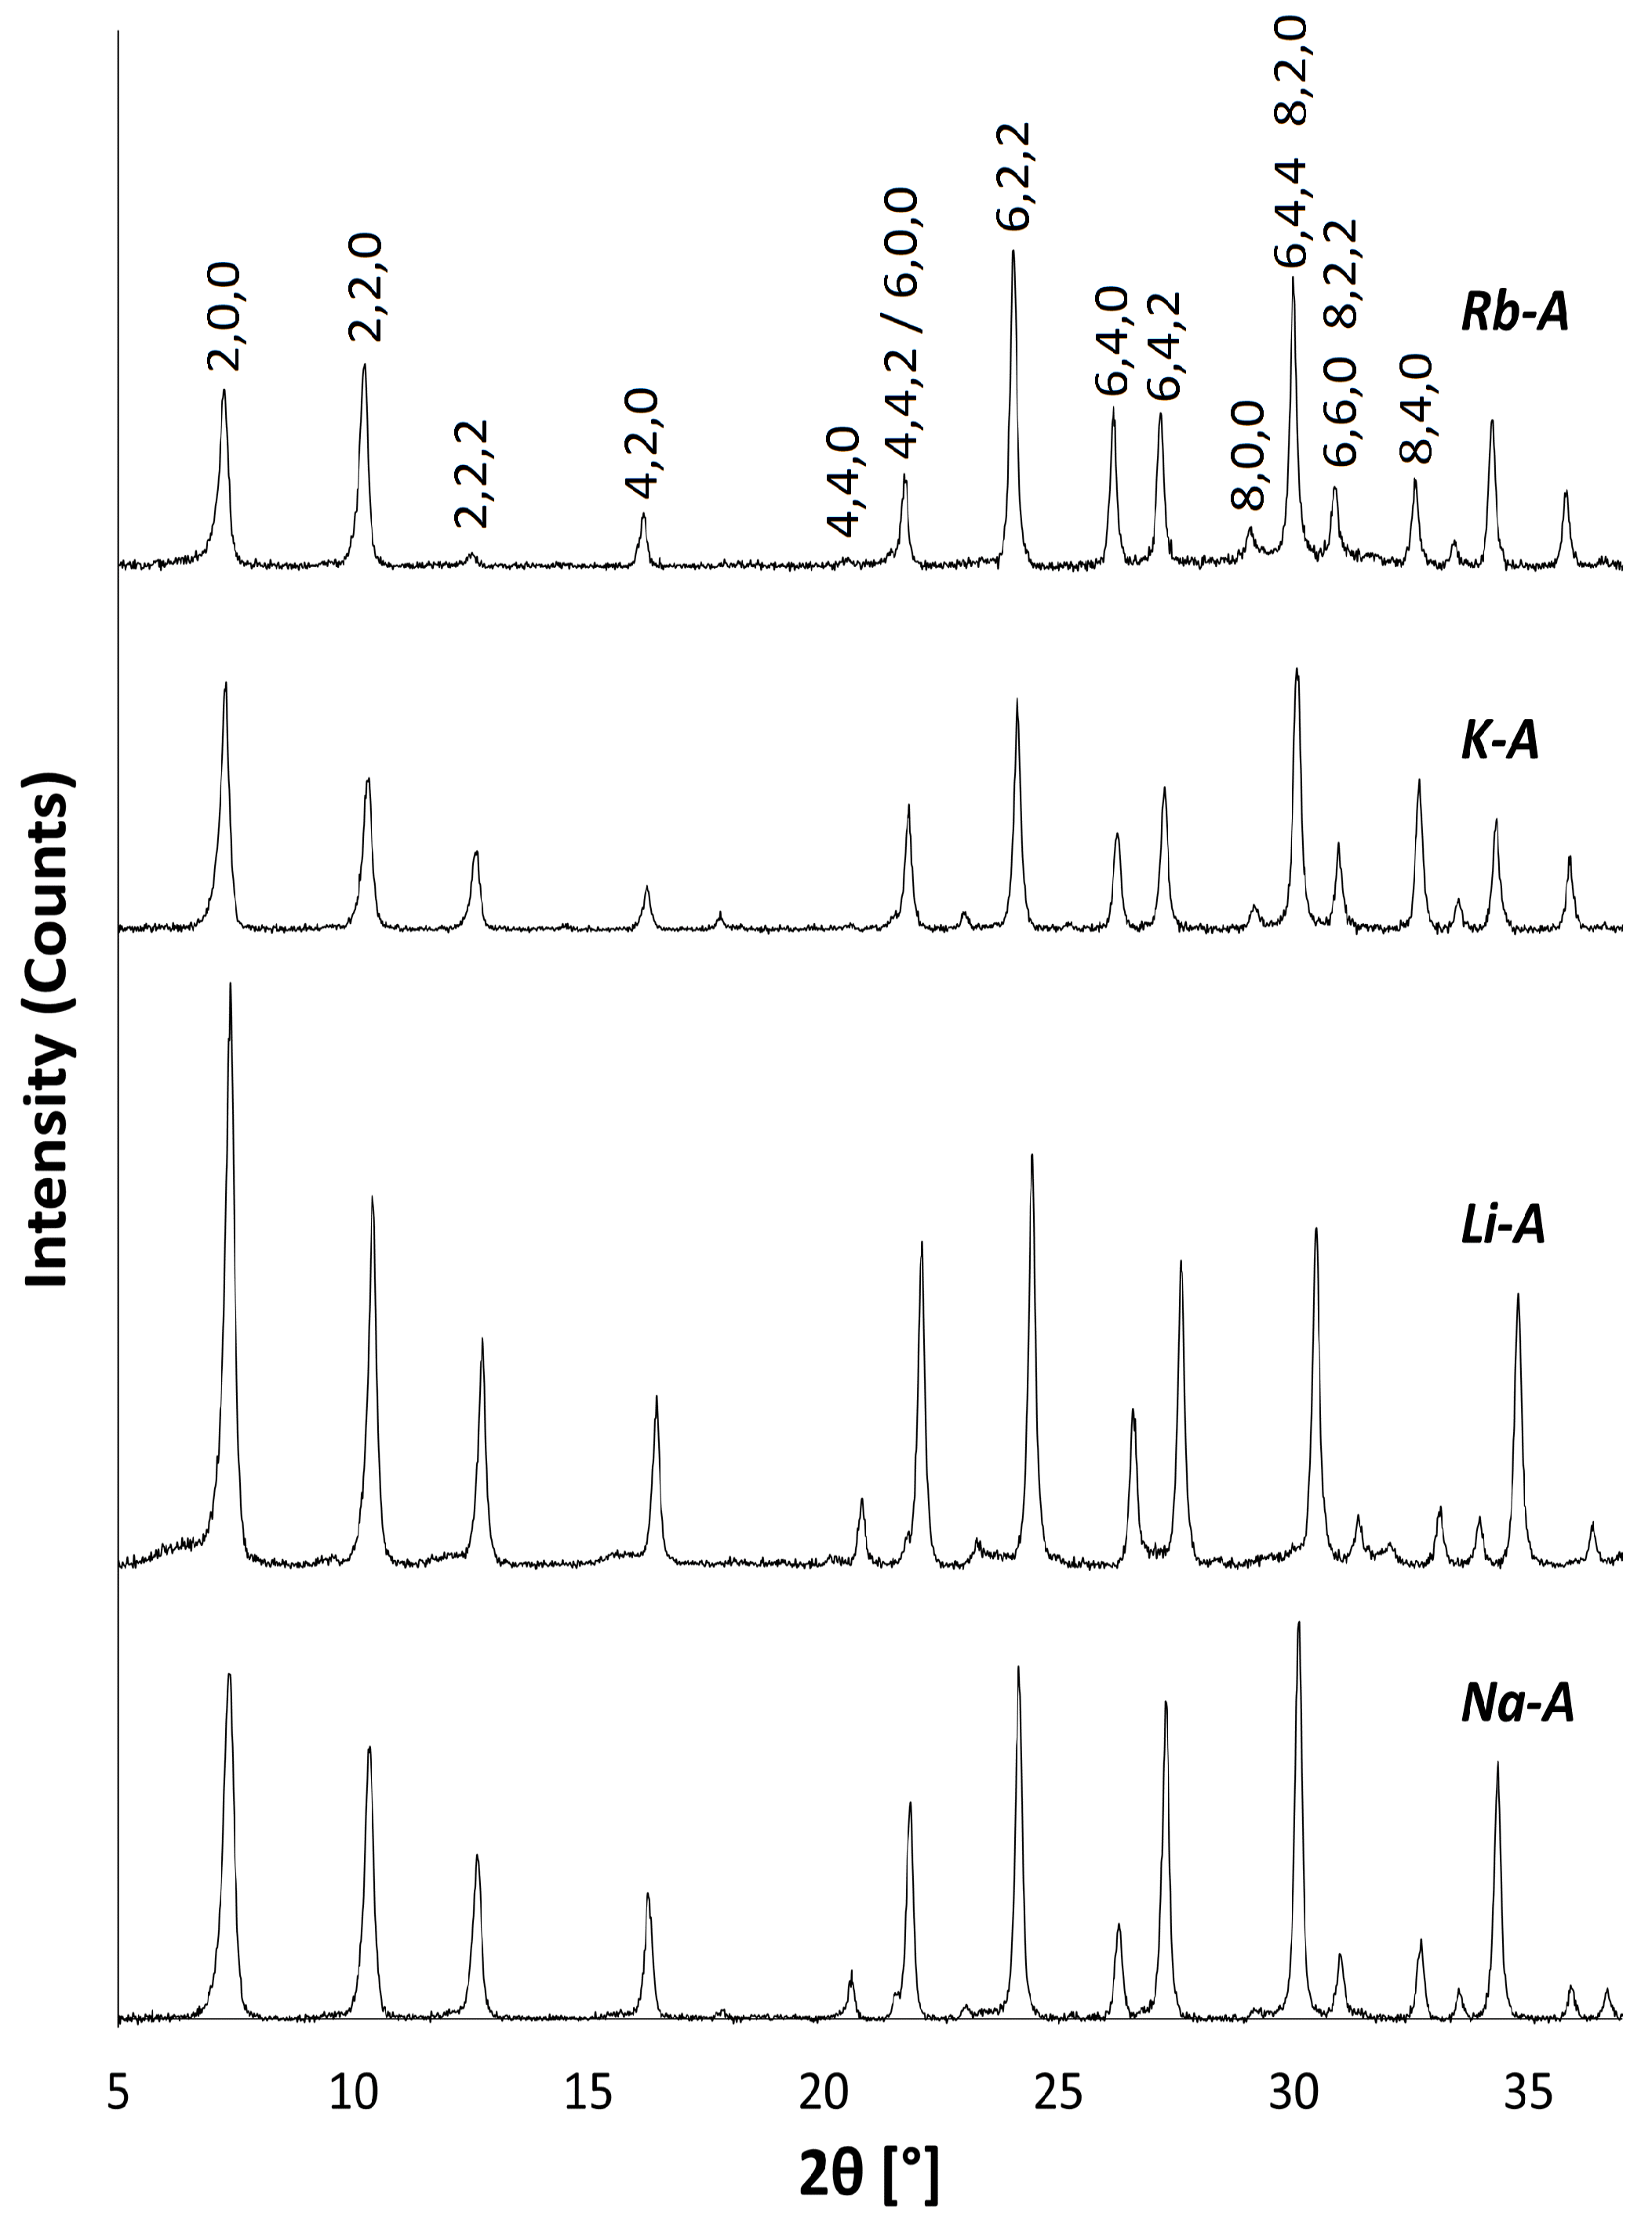
PXRD and FT-IR analyses show that there is no significant alteration to either the long-range crystal order or the local framework structure of Na-A after exchange with Li, K and Rb ions. These monovalent alkali cations vary in their ionic radii, and changes in the PXRD peak intensities are expected to occur as a result of these cations occupying slightly different sites in the pores. Figure 4 shows the PXRD patterns for the alkali metal exchanged zeolites. For K-A, the (4,4,0) reflection almost disappears, whereas the (4,2,2) and (8,0,0) peaks increase in intensity. These results are in agreement with those observed by Lührs et al., where complete exchange with K and Ca was studied using diffraction and structure refinement [33]. The PXRD pattern for Rb-A is also slightly different. The characteristic intensities of the first four Na-A reflections are altered; most noticeable is the increase in the intensity of the (2,2,0) reflection.
The unit cell parameters (a) for the exchanged zeolites were calculated from the PXRD peak positions and Miller indices using the program UnitCell [34] and are shown in Table 1. All samples have cubic symmetry, and it can be seen that the unit cell size decreases by about on exchanging larger Na (1.02 Å) for smaller Li (0.59 Å) ions and increases slightly on exchange with larger K (1.38 Å) and Rb (1.49 Å) ions [35]. Correspondingly, an increase in the lattice parameter is progressive from Li Na K Rb-A, in accordance with the increasing ionic radii of the monovalent cations.
The FT-IR spectra for Li-A, Na-A, K-A and Rb-A all display the fundamental zeolite framework vibration /cm at 959, 968, 972 and 969, respectively, corresponding to the asymmetric stretch, shown in Figure 5. In addition, the framework symmetric stretch occurs at /cm 684, 664, 663 and 666 for Li-A, Na-A, K-A and Rb-A, respectively. The broad peaks at 3350–3450 cm and the weaker peaks at 1650 cm observed in all spectra correspond to the stretching and bending vibrations of water molecules in the hydrated samples. The only noticeable differences in the spectra are that the framework asymmetric stretch shifts to slightly a higher wavenumber and the symmetric stretch shifts to slightly a lower wavenumber, with increasing cation size, Li Na K.
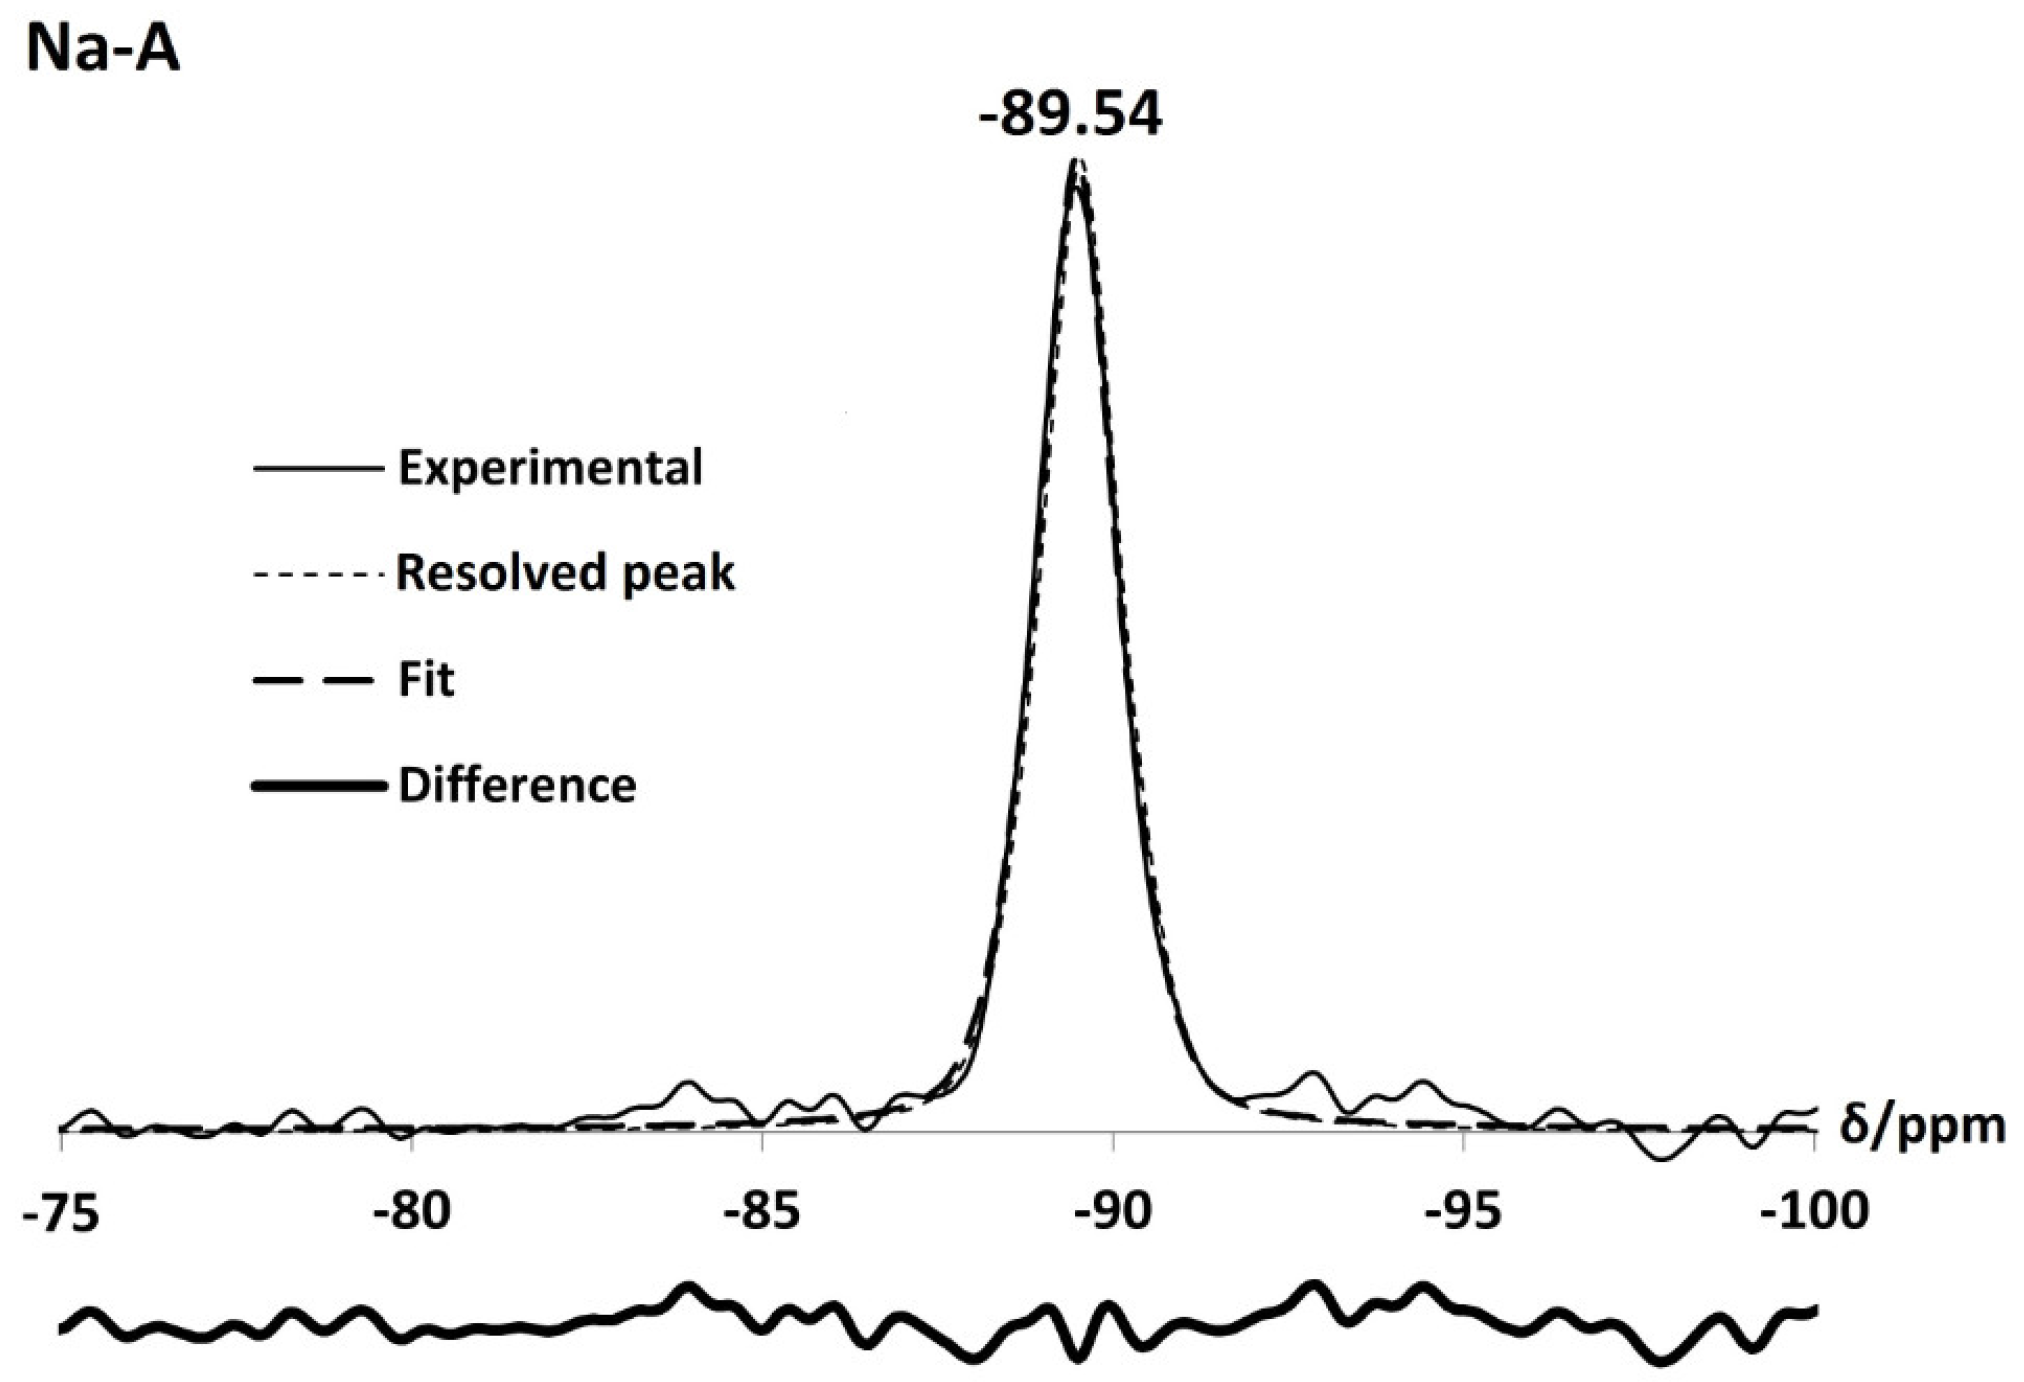
For the parent Na-A zeolites, Si and Al MASNMR spectra contain one peak at −89.54 ppm and 58.41 ppm, respectively, confirming that the Si/Al ratio of the framework is one. This is in agreement with data reported by Thomas et al. [24] for a single silicon, Si(OAl), and aluminium environment, Al(OSi), in Linde Type A zeolites. Al MAS NMR spectra for the exchanged zeolites also display one sharp peak between 57 ppm and 60 ppm, pertaining to Al(4Si) units. Likewise, Si spectra for Li-A, K-A and Rb-A are also dominated by a single sharp peak at −87.23 ppm, −89.83 ppm and −89.87 ppm, respectively. These peaks all lie within the chemical shift range for which Si(4Al) units can occur ( −80.0 ppm–−90.5 ppm from TMS) [28]. Some small, low intensity peaks at −84.02 ppm, −87.96 ppm and −85.03 ppm are observed in the Li, K and Rb-A samples, respectively. These are identified as silanol peaks. From deconvolution of the Li, K and Rb-A Si NMR spectra as shown in Figure 6, the Si/Al ratios were calculated to be one using Equation (1) [22,28]:
It is also interesting to note that the Si(4Al) peak for Li-A is significantly shifted to a lower field, centred at −87.23 ppm, in comparison to that of the parent Na-A peak, at −89.54 ppm. The linear relationship between the average Si-O-T framework bond angles, () and Si chemical shifts can offer an explanation for this difference. Table 2 shows the Si/Al ratios and average T-O-T bond angles that were calculated from the deconvoluted Si NMR spectra using Equation (2) [36].
Na-A zeolites, synthesised at 40 C for 24 h, are shown to have good cation exchange ability with Li, K and Rb ions. The only noticeable differences between these exchanged zeolites are the sizes of the unit cells and average framework T-O-T bond angles, which increase accordingly with increasing cation size Li < Na < K < Rb.
2.2. NH-A
Exchange with NH ions compromises some of the long-range order of the zeolite A crystals, inferred by the broad PXRD peaks and low signal to noise ratio, as seen in Figure 7. NMR and FT-IR spectra also indicate that the local framework environment is affected. Figure 8 shows a weak peak at /cm 1453 in the FT-IR spectrum, which confirms that exchange has taken place. The asymmetric stretch is, however, weaker and broader than that of the parent spectrum and is shifted toward a higher wavenumber, occurring at /cm 987 [37,38]. As Si-O bonds (1.64 Å) are shorter than Al-O bonds (1.73 Å) [35], the force constant is higher for the former. Therefore, the shift to higher frequencies indicates that a loss of some aluminium from the framework has occurred.
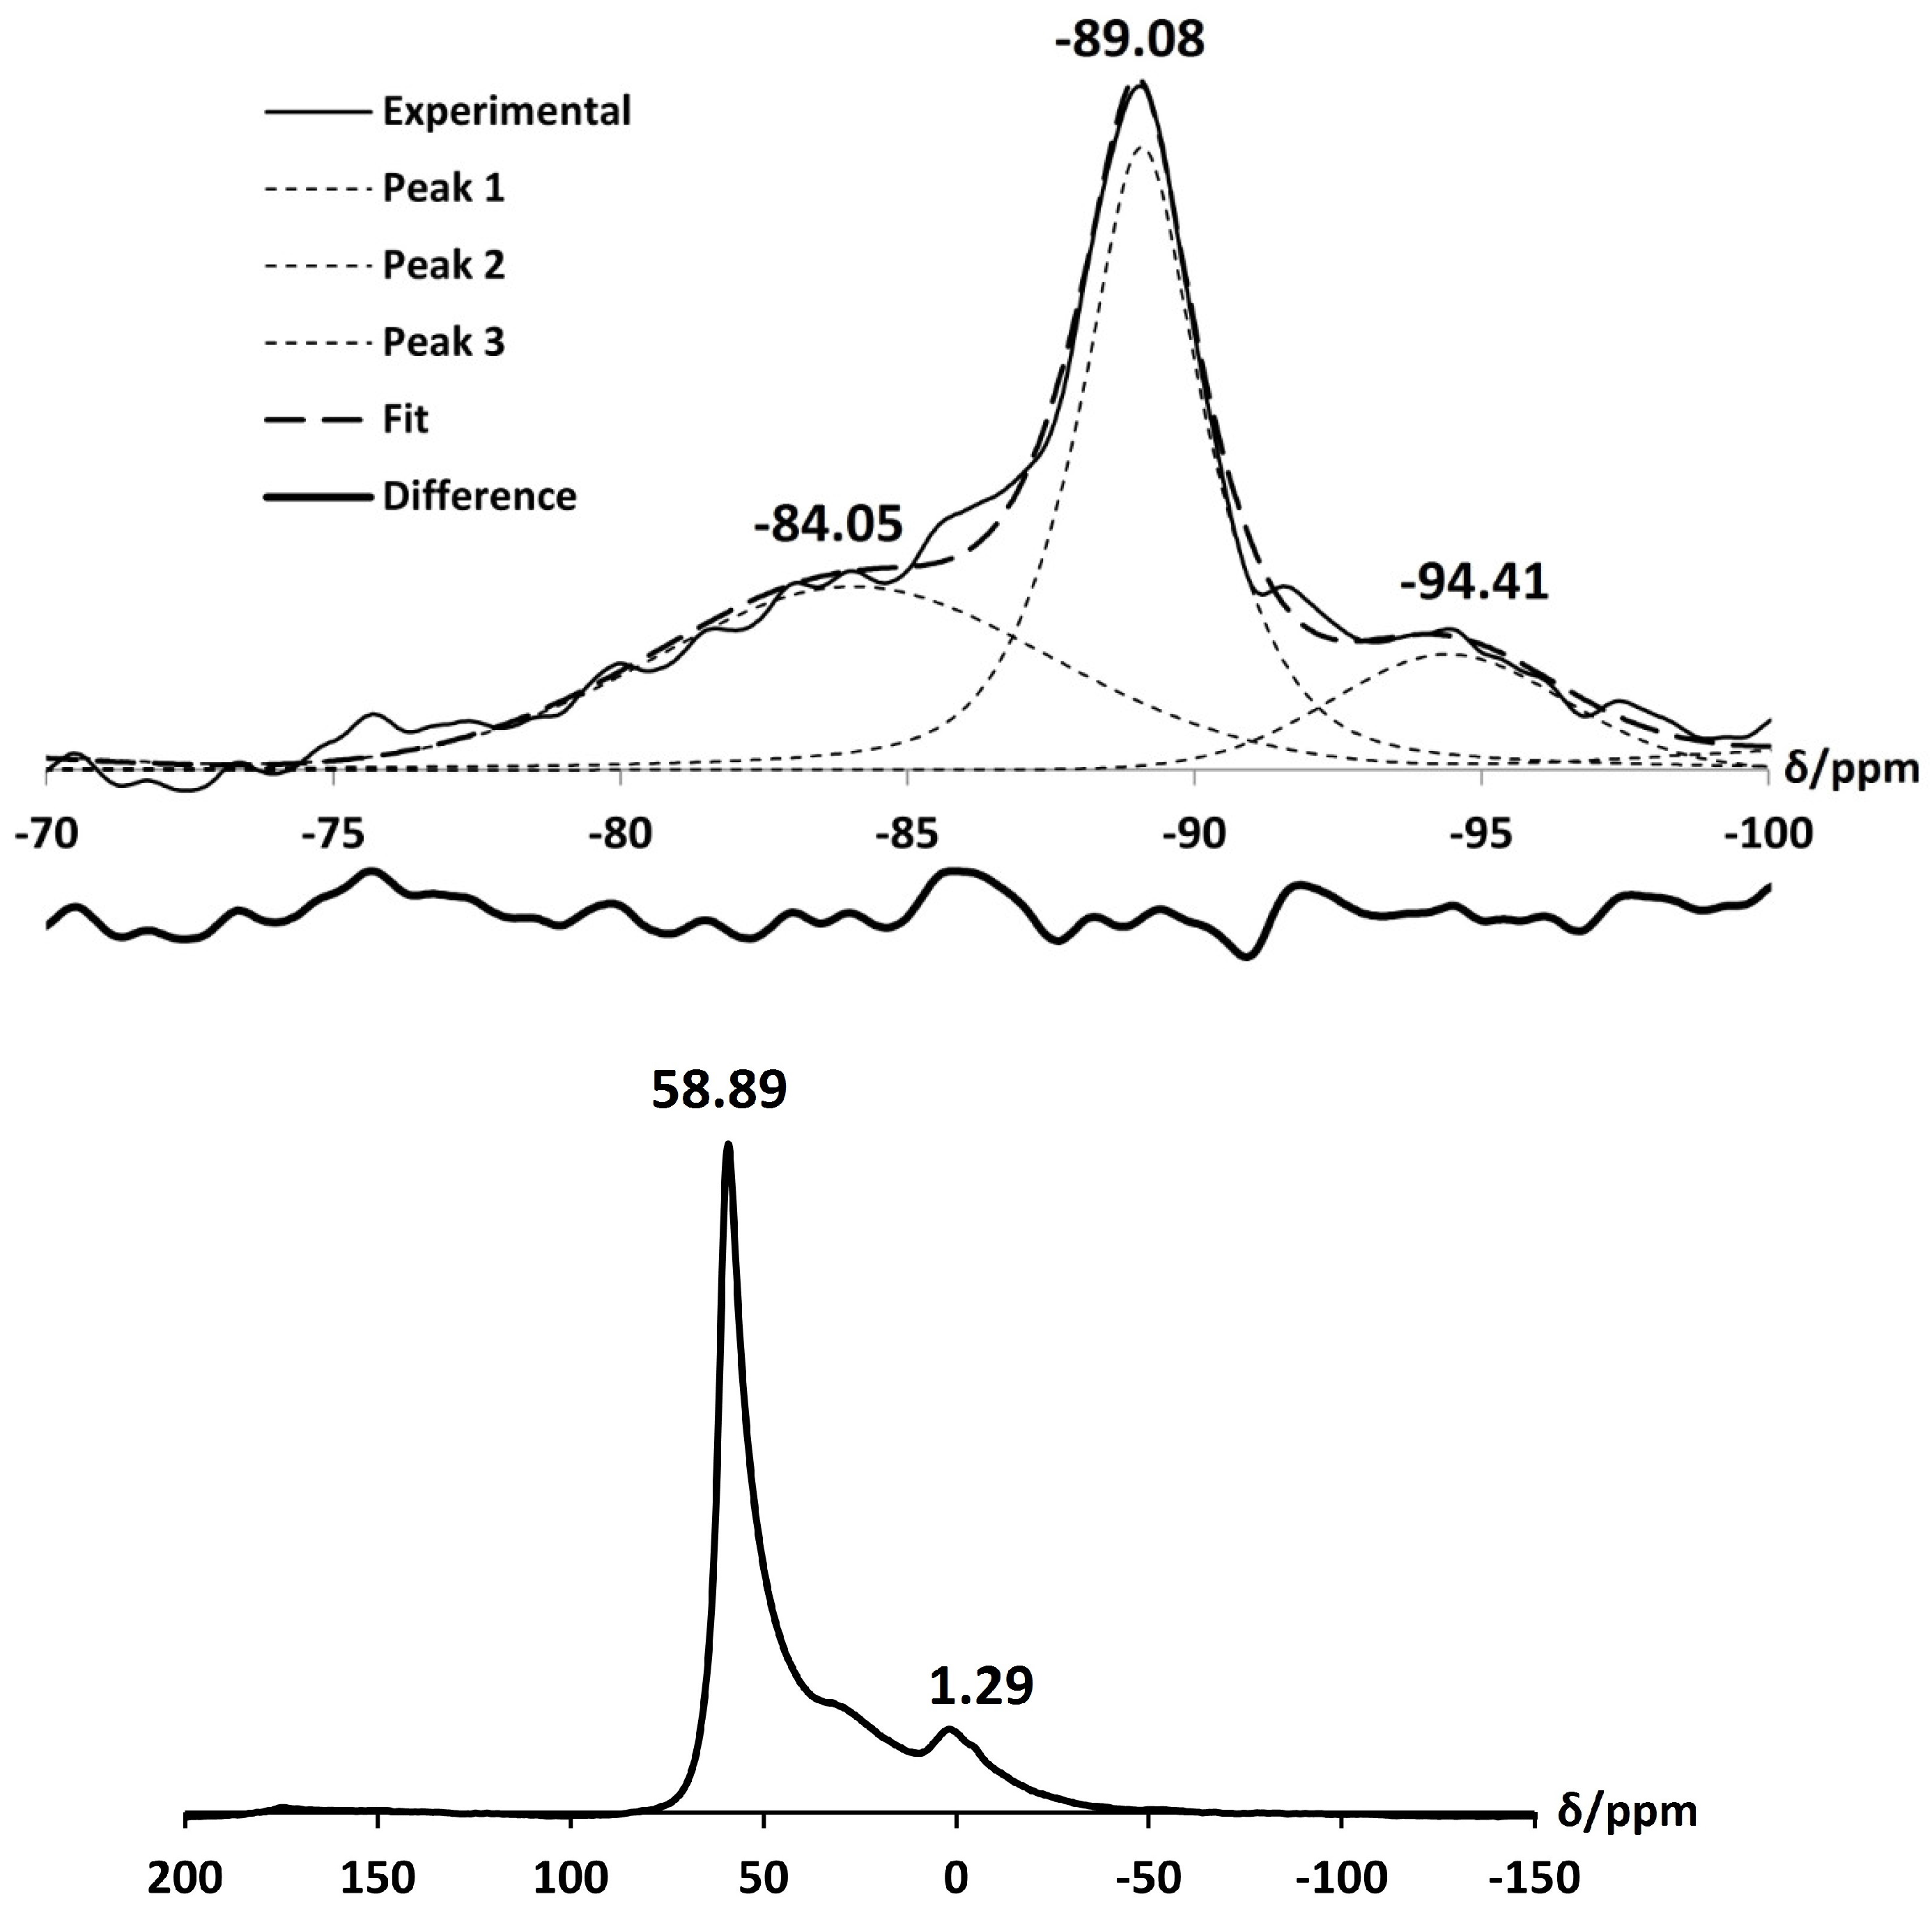
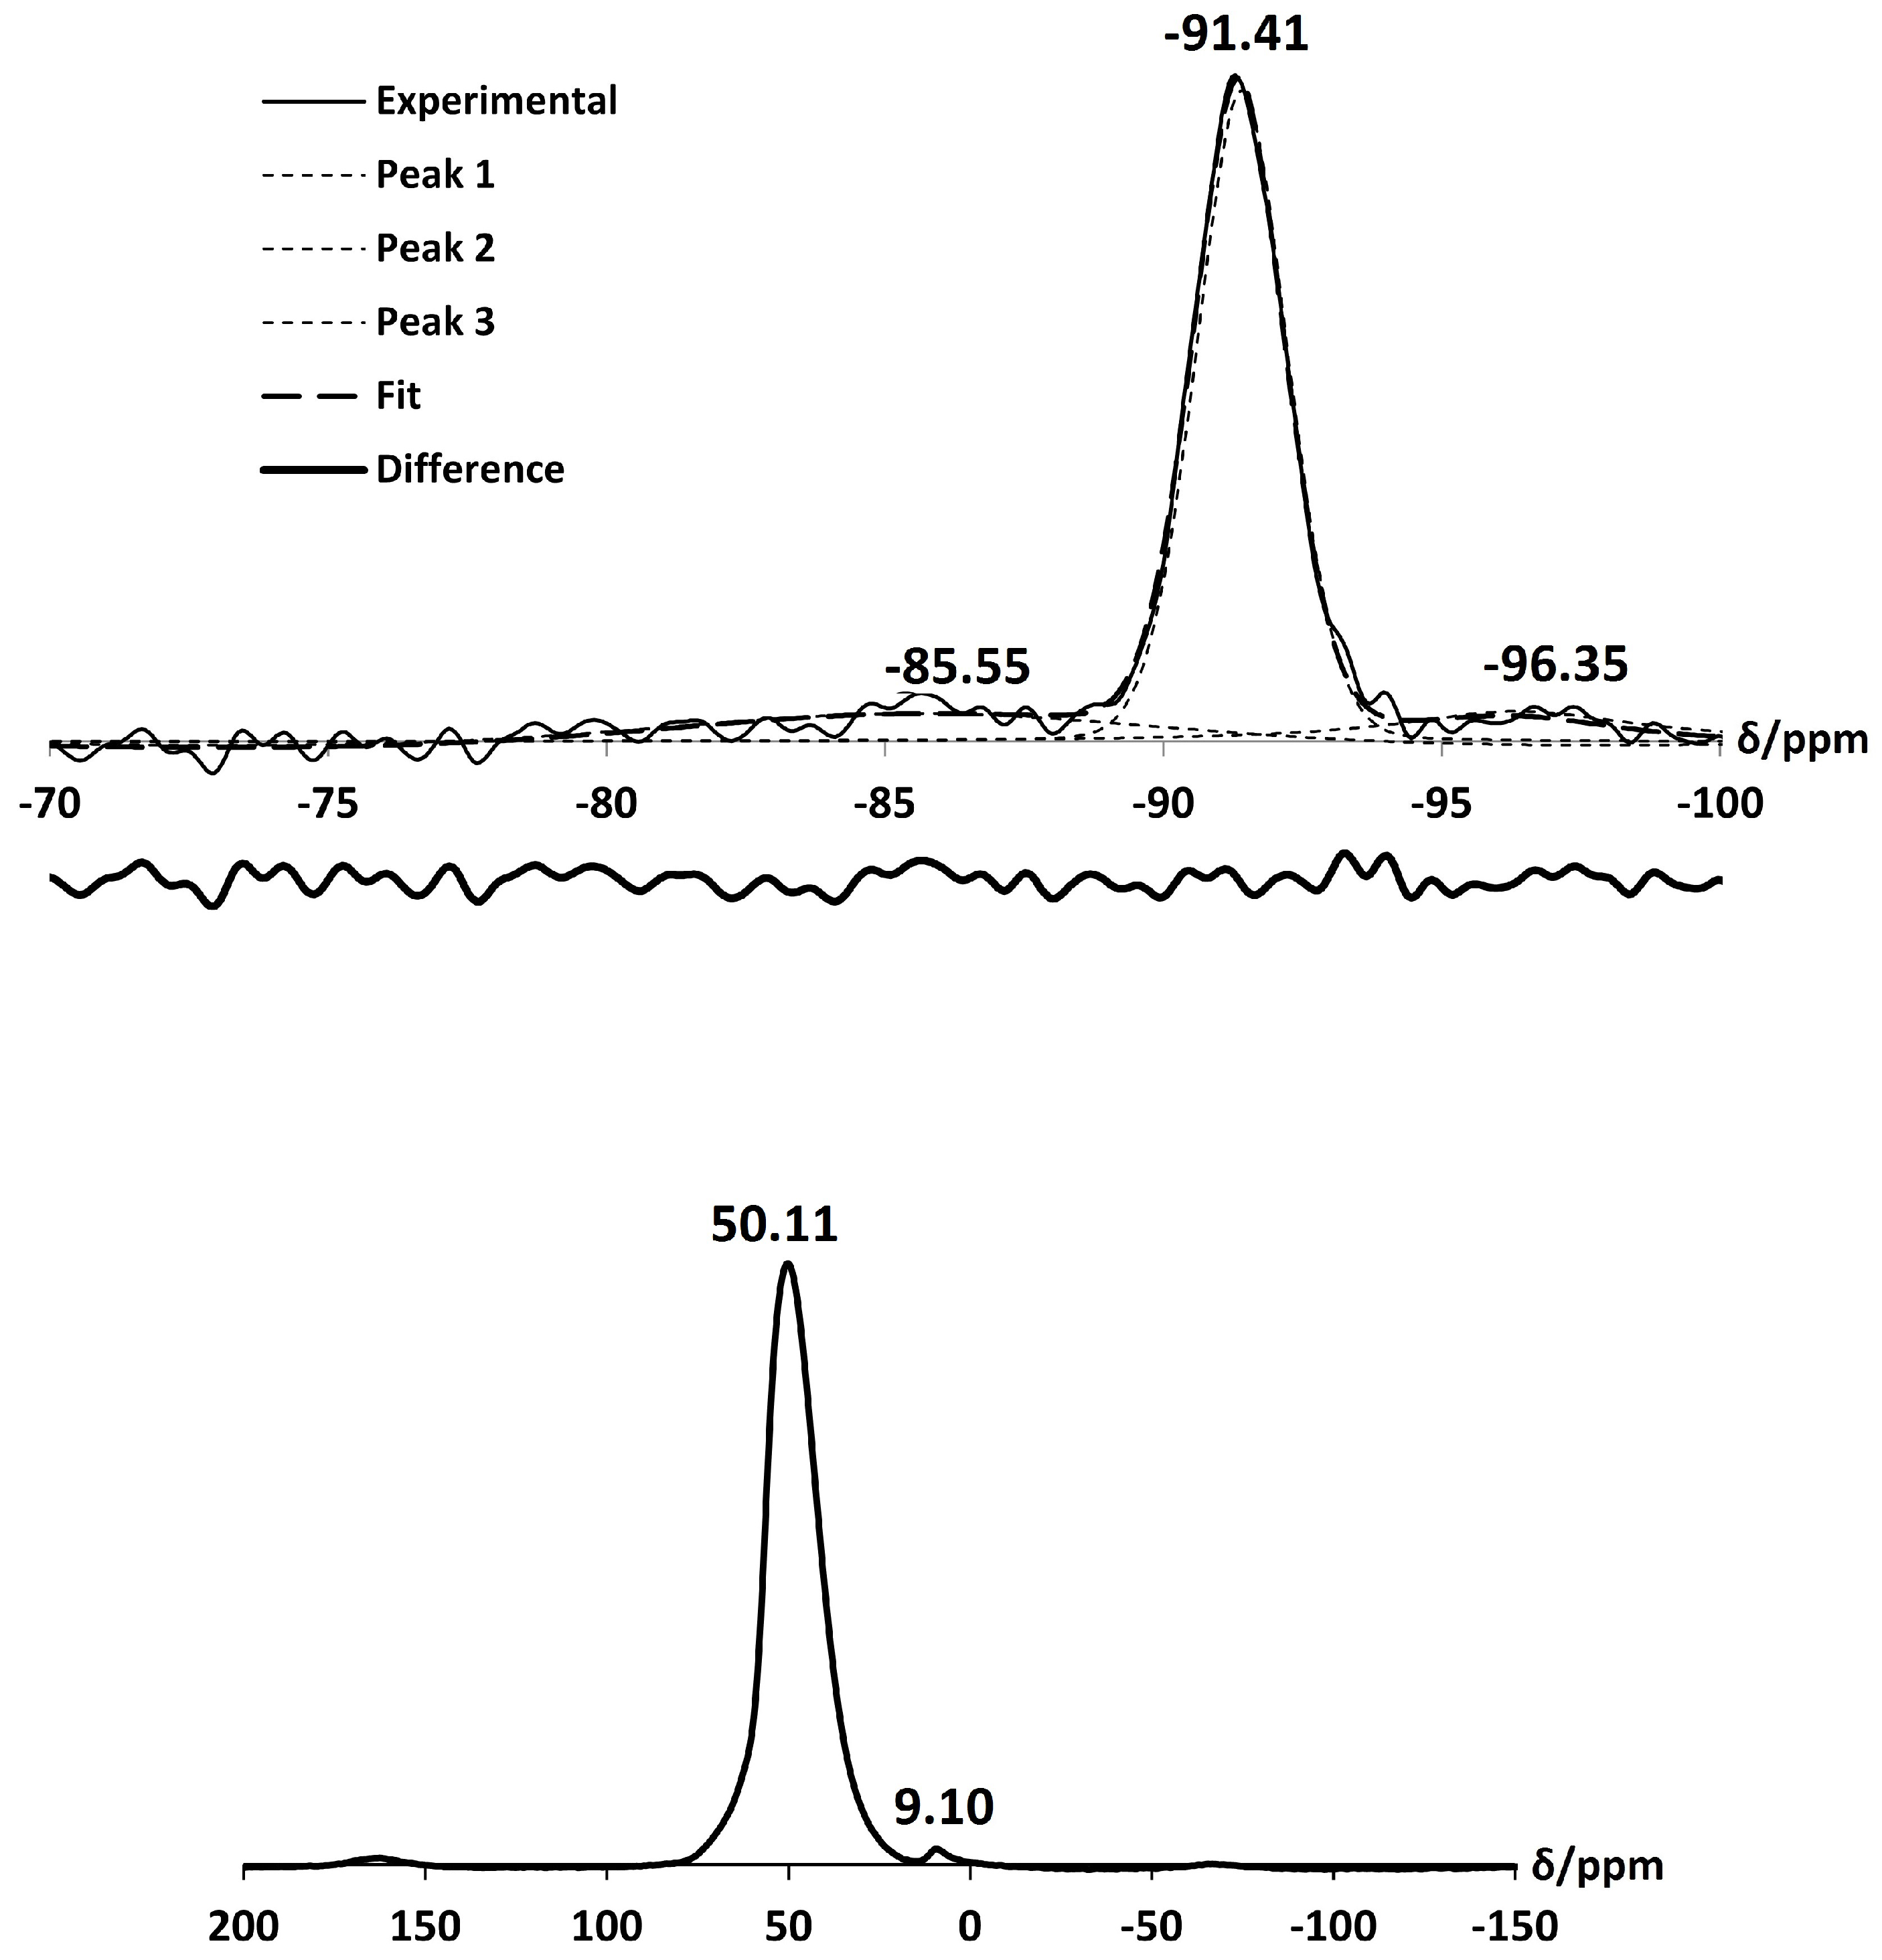
Furthermore, deconvolution of the Si MAS NMR, as shown in Figure 9, confirms the presence of both Si(3Al) and Si(4Al) environments in the framework, with peaks occurring at characteristic chemical shifts of −91.41 ppm and −89.08 ppm, respectively. Another peak at −85.04 ppm is present in the spectrum due to silanol species. This is in line with the appearance of the stretch at 868 cm in the FT-IR spectrum. Using Equation (1), the Si/Al ratio of NH-A was calculated to be 1.04. The loss of some aluminium from the framework is further confirmed in the Al MAS NMR spectrum, which displays a resonance signal at 1.29 ppm, attributed to extraframework octahedrally-coordinated aluminium [23,28]. This peak is broad and overlaps with the main signal at 58.89 ppm (for a tetrahedral Al coordination). The broadening and overlapping of these peaks can be attributed to severely distorted six coordinated and four coordinated aluminium environments. The presence of six coordinated extraframework Al species in NH-exchanged zeolite A has been previously reported by Klinowski et al. [22,24], Sartbaeva et al. [15] and M. Dyballa et al. [39]. It is evident that some dealumination of the zeolite A framework occurs upon exchange with NH ions.
2.3. Ca-A
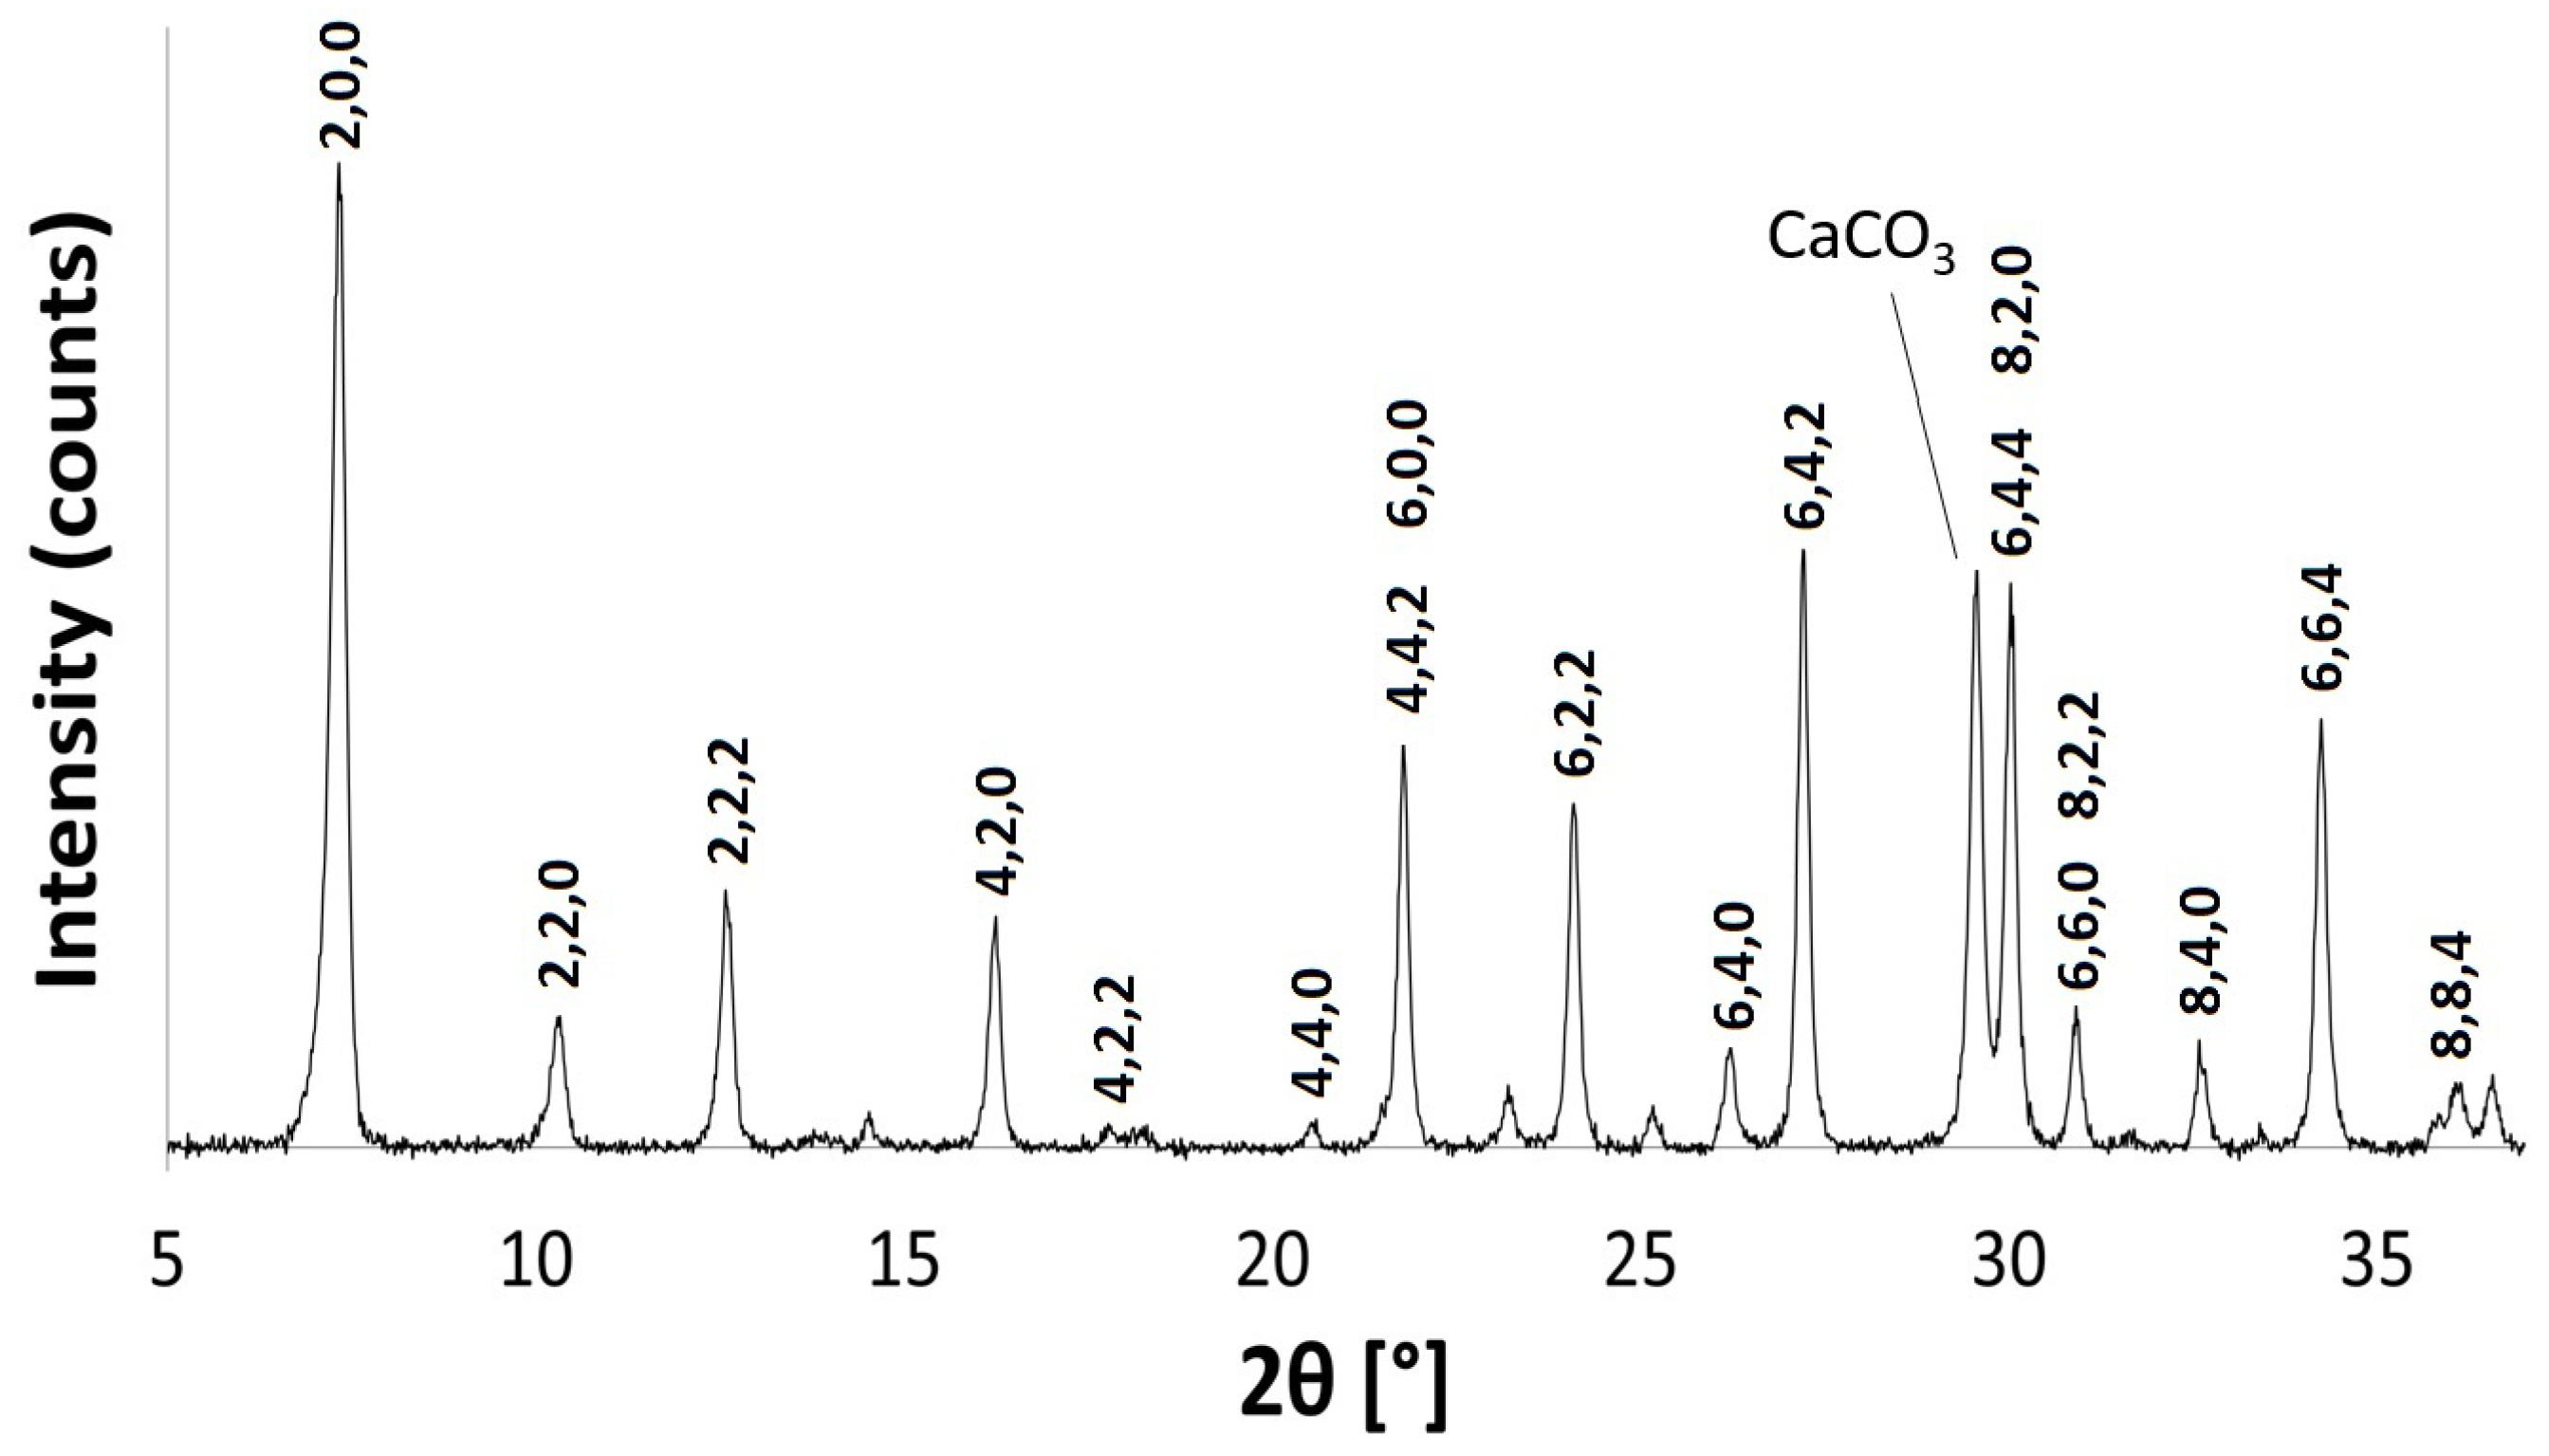
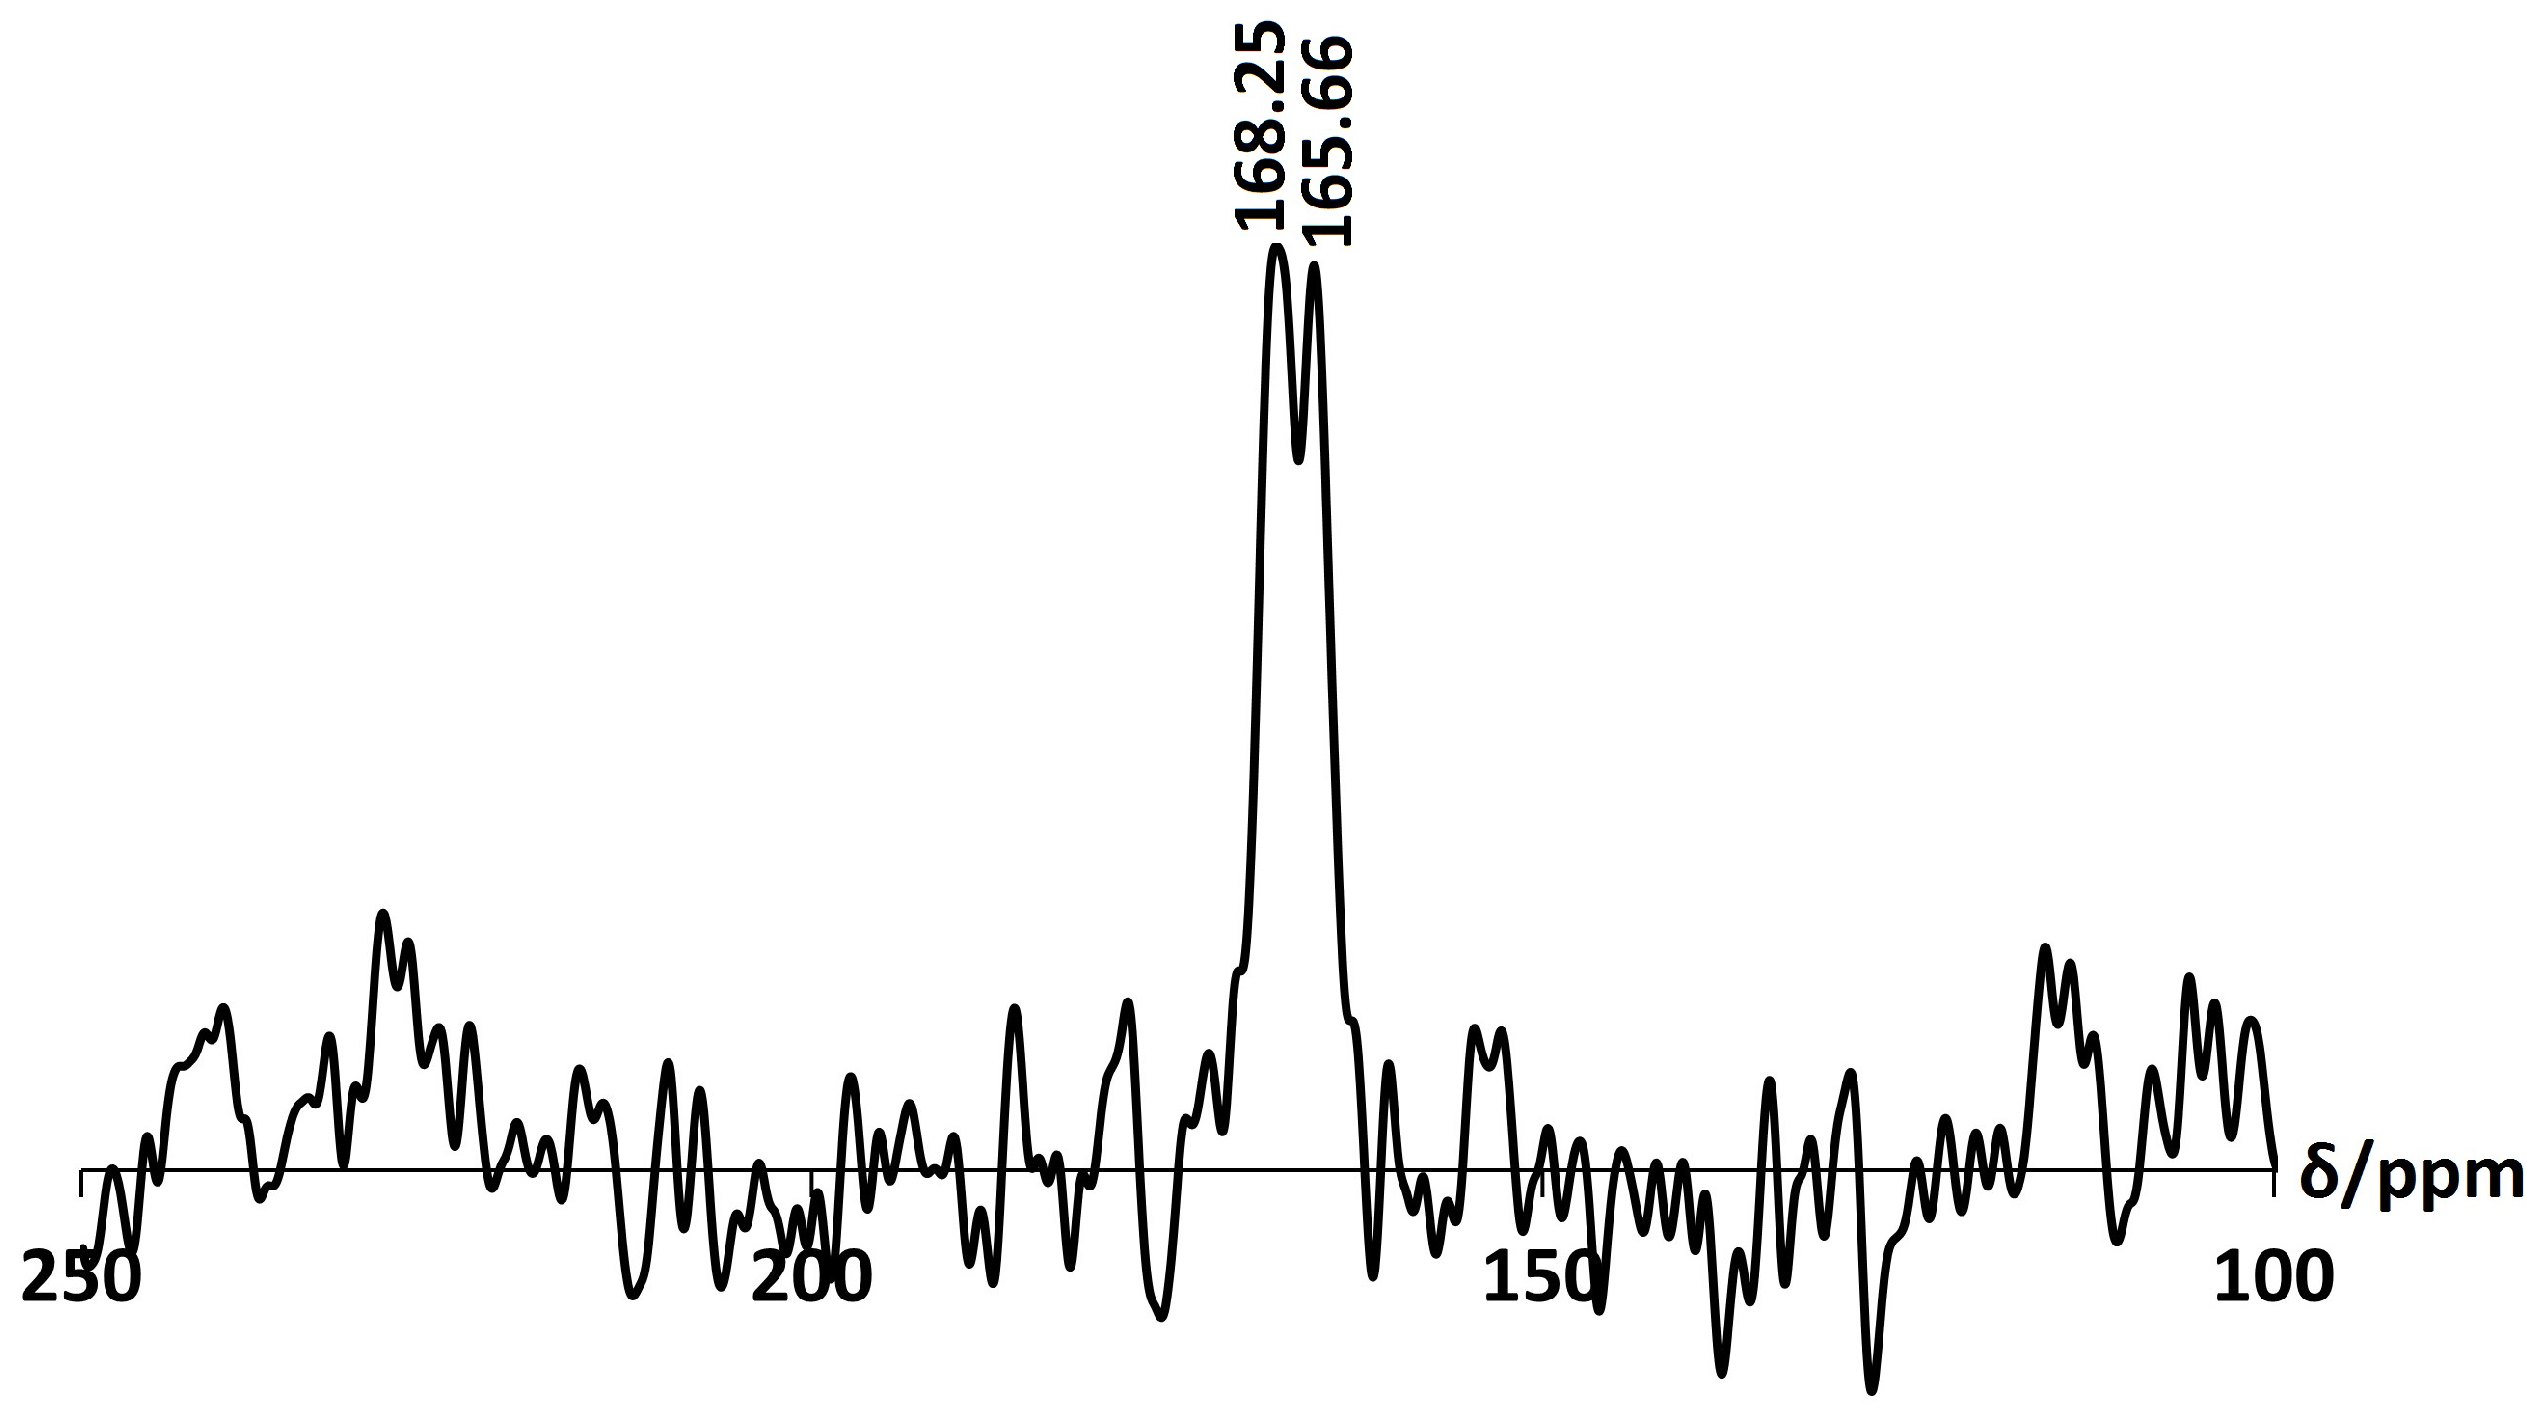
There is no considerable alteration to the long-range crystal order of zeolite A after exchange with Ca. The increase in intensity of the (4,0,0) reflection and the decrease of the (4,4,0) reflection is consistent with the results obtained by Lührs et al. [33]. The peak in the PXRD pattern at 2 29.57, as shown in Figure 10, is characteristic of calcite (CaCO), which must have formed from the Ca(OH) exchange solution. Further characterisation with C Cross-Polarisation (CP) NMR (Figure 11) shows a distinct peak centred at 168 ppm, which confirms the presence of CO [26]. Furthermore, the split bands in the FT-IR spectrum at 1413 cm and 1459 cm identify the carbonate as a monodentate species, as shown in Figure 12 [40].
Exchange with Ca has a small effect on the local framework environment of zeolite A. The asymmetric stretch in the FT-IR spectrum is less intense and is shifted toward a higher wavenumber, occurring at /cm 999 [37,38]. The Si MAS NMR spectrum, as shown in Figure 13, is dominated by an intense peak at −91.41 ppm, due to the expected Si(4Al) units of the framework. However, deconvolution of the spectrum also confirms the presence of Si(3Al), with a very small peak occurring at −96.35 ppm. Another peak at −85.55 ppm is also present due to some silanol species. Using Equation (1), the Si/Al ratio of Ca-A was calculated to be 1.01. Similar to the exchange with NH ions, it is evident that some dealumination of the zeolite A framework has occurred upon exchange with Ca ions. This loss of aluminium is confirmed in the Al NMR spectrum, which displays a broad peak centred at 50.11 ppm, characteristic of Al(4Si) units and also a slight peak centred at 9.10 ppm, which can be attributed to a distorted octahedral aluminium environment. The broadness of the peaks in the spectra can be attributed to quadrupolar interactions of Al nuclei in these distorted environments.
2.4. SEM
The surface morphologies of the zeolite crystals were observed using Field Emission Scanning Electron Microscopy (FESEM). Particle sizes were calculated from the scale bars on the FESEM micrographs, using the ImageJ processing and analysis program. The crystallite sizes were also calculated from the broadening of the most intense PXRD peaks, in this case the (6,2,2) and (6,4,4) reflections, using the Scherrer Equation (3), where L is the crystallite size, is the full width at half maximum for the major peak of the PXRD pattern subtracting the instrumental contribution to the broadening, K is the Scherrer constant, which is 0.9, is the wavelength of the X-rays in nm and is the Bragg angle of the incident X-rays [41].
Table 3 shows the average zeolite particle sizes. For Na-A and Ca-A zeolites, there is good consistency between the sizes calculated from the Scherrer equation and FESEM data.
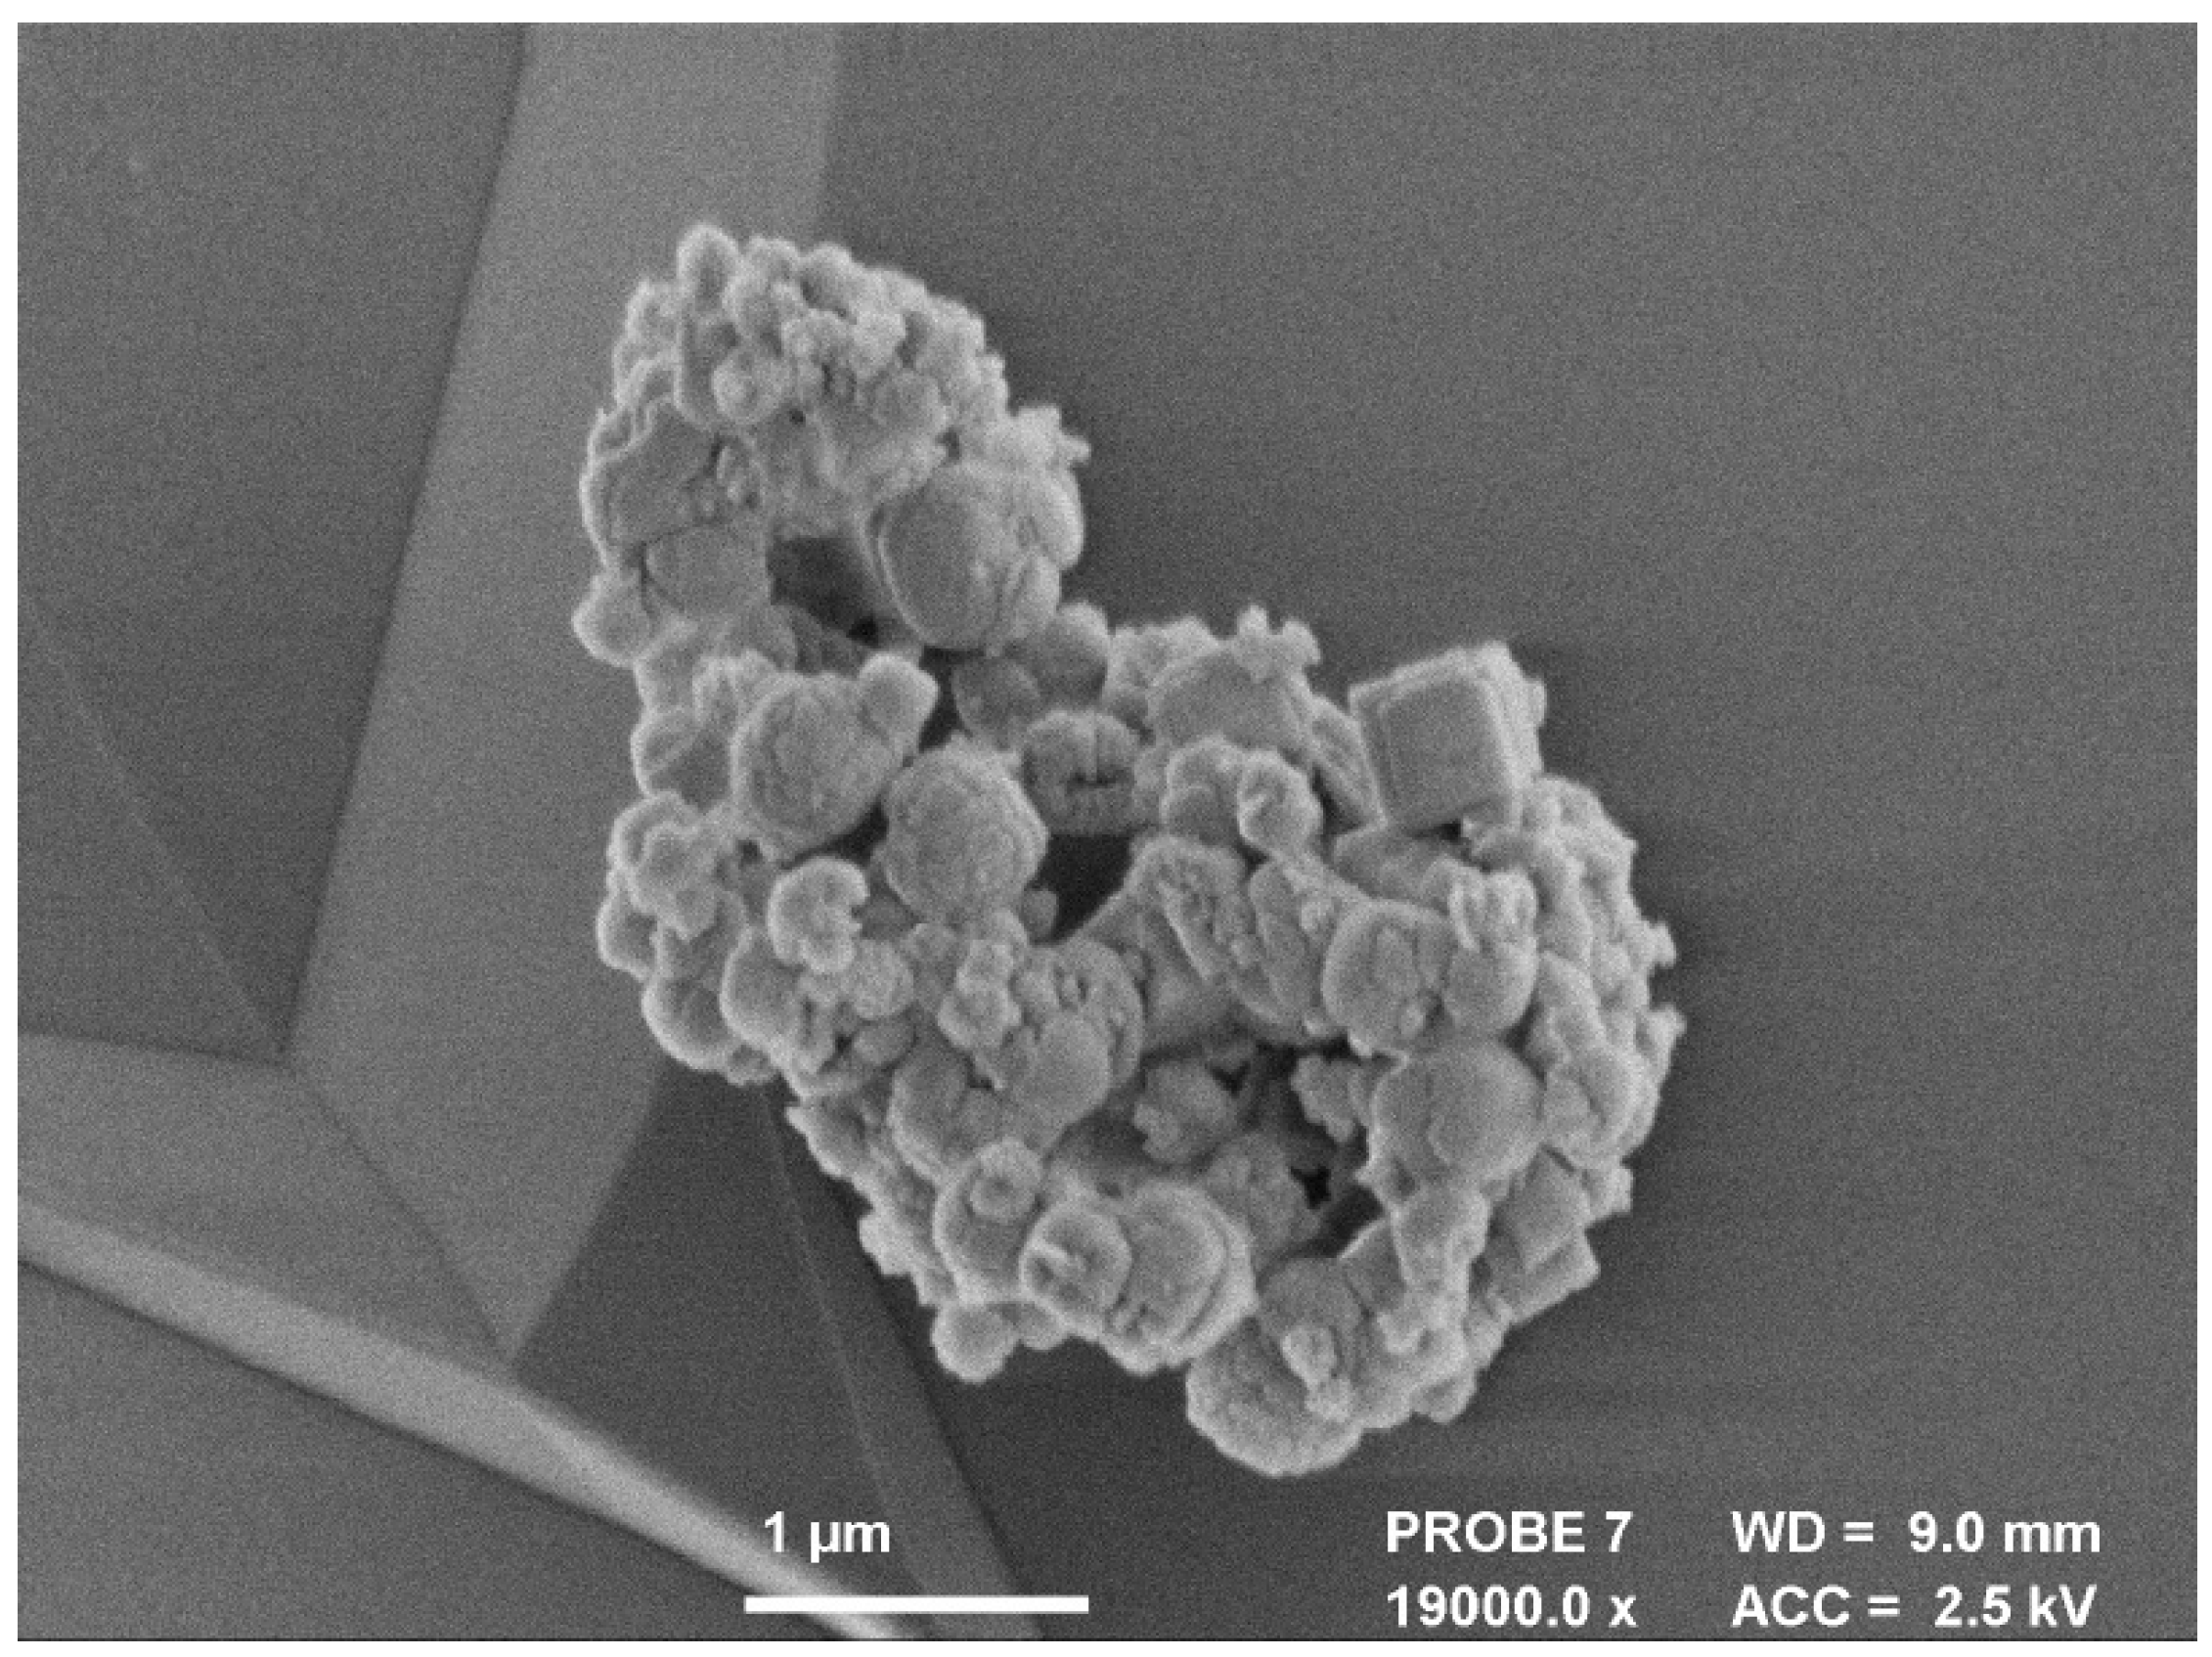
Figure 14 shows the FESEM micrograph for the parent Na-A zeolite. A variety of crystallite shapes and sizes can be observed, somewhere in between cubic and spherical and ranging from 122–354 nm. The visibly larger crystals with well-defined edges display the typical cubic morphology of LTA zeolites [42,43]. However, the low temperature conditions employed in this synthesis appear to slow down crystal growth, instead favouring nucleation in the initial stages [44]. Particles that are more rounded in shape and significantly smaller in diameter are evident in the FESEM images, indicating that some of the crystals have not had enough time to form completely. These results are in agreement with those reported by Dimitrov et al. [45] and Smaihi et al. [46]. The introduction of Ca into the zeolites is accompanied by noticeable changes in the surface morphology, as shown in Figure 15.
3. Materials and Methods
3.1. Synthesis of Na-A: Low Temperature and Organic Template-Free
Zeolite A, with chemical composition [Na[(AlO)(SiO)]·27HO, was prepared using a method described by Leung et al. [4]. The crystallisation process was carried out at 40 C in the absence of an organic template. Six-point-seven-five grams of NaOH pellets (100% NaOH, Fischer, Ried im Innkreis, Austria) were dissolved in 40 cm of deionised water, and the solution was divided into two equal volumes. Zero-point-nine-eight-eight grams of NaAlO (100% Al, Aldrich, St. Louis, MO, USA) were added into one bottle, and 2 cm of colloidal silica (Ludox HS-30, 30 wt % SiO, Aldrich, St. Louis, MO, USA) were added to the other. Both solutions were left to stir at room temperature for 90 min until clear. The silica solution was then poured slowly into the aluminium solution with gentle stirring. A thick gel with batch composition of 2SiO:AlO:15NaO:400HO formed, and this was shaken or stirred vigorously for 15 min, either by hand or with a magnetic stirrer, and was put in the oven at 40 C for 24 h. The zeolite crystals were filtered three times with deionized water, until the pH of the filtrate was 7. The product was then dried in an oven at 100 C for a further 24 h. In order to see the effect of temperature and time on the synthesis, the method above was varied slightly. For some samples the crystallisation temperature was increased to 50 C for 24 h, and for other samples, the crystallisation time was increased to 48 h at 40 C.
3.2. Ion Exchange
The cation sources used for ion exchange were LiOH, KCl, RbOH, Ca(OH) and NHBr. The mass of each cation source was calculated so that the exchange solutions contained a surplus of the exchanging cation that was twice the theoretical amount of Na in the pores of 1 g of Na-A. The appropriate cation source was dissolved in 50 cm of deionized water. One gram of the parent Na-A zeolite was added, and the solution was stirred for 6 h at 65 C. This was then filtered and washed with deionized water and the exchanged zeolite left in an oven to dry overnight at 100 C. The filtrates were kept in order to quantify the amounts of exchange that had taken place using the sodium ion selective electrode.
3.3. Product Characterisation
3.3.1. Powder X-ray Diffraction
PXRD patterns were recorded at room temperature using a BRUKER AXS D8 Advance diffractometer equipped with a Vantec-1 detector using Cu-K radiation ( = 1.54) in flat plate mode. The scan range was from 3 2 60 over 20 min. The unit cell parameters for the samples were calculated using the program UnitCell [34].
3.3.2. Solid State Nuclear Magnetic Resonance
Si, Al, Na and C NMR spectra were measured by a VARIAN VNMRS 400 spectrometer using the Direct Excitation (DE) method, with neat tetramethylsilane (TMS), 1 M aqueous Al(NO) and 1 M aqueous NaCl as references. C Cross-Polarisation (CP) MAS-NMR was used for Ca-A to enhance the signal. The spinning rates of Si and C NMR were 6.0 kHz and for Al and Na NMR were 12 kHz. The frequency of Si NMR was 79.438 MHz and for Al 104.199 MHz. The spectral width of Si NMR was 40,322.6 Hz and for Al 416.7 Hz. Solid-state NMR spectra were obtained at the EPSRC U.K. National Solid-state NMR Service at Durham.
3.3.3. Scanning Electron Microscopy and Energy Dispersive X-ray Spectroscopy
Low resolution micrographs were taken using a JEOL SEM6480LV scanning electron microscope. EDX data were acquired using an Oxford INCA X-ray analyser attached to the microscope with an acceleration voltage of 20 kV.
High resolution micrographs were taken using a JEOL FESEM6301F field emission scanning electron microscope (FESEM). The powder samples for FESEM were coated with 5 nm chromium to prevent surface charging after EDX data were collected.
3.3.4. Fourier Transform Infrared Spectroscopy
FT-IR spectra for the powder samples were recorded using a Perkin Elmer 100 FT-IR Spectrometer in the range of 4000–600 cm.
3.3.5. Sodium Ion Selective Electrode
The concentration of Na in the exchange filtrates was calculated using a Cole-Parmer double junction, combination sodium Ion Selective Electrode (ISE) filled with a reference solution of 0.1 M NHCl and connected to a pH/mV meter.
4. Conclusions
Solid state NMR revealed changes to the local structure of the LTA framework upon ion exchange with NH and Ca. Exchange with Li, K and Rb ions does not significantly affect the long-range crystal order. Exchange with NH ions compromises some of the long-range order of the zeolite A crystals due to the loss of some framework aluminium as can be seen from X-ray data. Exchange with divalent Ca ions introduces some monodentate carbonate species into the framework, but no alteration to the long-range crystal order is observed. This study confirms that using a local probe such as SS NMR alongside PXRD and other long-range methods to study zeolites can reveal an extra level of information about the structure of those useful minerals, which will further their use as potential catalysts and ion exchange materials.
Acknowledgments
A.S. would like to acknowledge the Royal Society for funding of URF. We thank John Mitchel and Ursula Potter for help with collecting SEM data and Fraser Markwell for collecting SS NMR data at the EPSRC-funded SS NMR facility at Durham University.
Author Contributions
A.S. conceived the study. K.M.L. designed experiments. L.P. and K.M.L. have collected data and performed data analysis. All authors contributed to writing and editing the manuscript.
Conflicts of Interest
The authors declare no conflict of interest.
References
- Baerlocher, C.; McCusker, L.B.; Olson, D.H. Atlas of Zeolite Framework Types; Elsevier: Amsterdam, The Netherlands, 2017. [Google Scholar]
- Sartbaeva, A.; Wells, S.A.; Treacy, M.M.J.; Thorpe, M.F. The flexibility window in zeolites. Nat. Mat. 2006, 5, 962–965. [Google Scholar] [CrossRef] [PubMed]
- Conato, M.T.; Oleksiak, M.D.; McGrail, B.P.; Motkuri, R.K.; Rimer, J.D. Framework Stabilization of Si-Rich LTA Zeolite Prepared in Organic-Free Media. Chem. Commun. 2014, 51, 269–272. [Google Scholar] [CrossRef] [PubMed]
- Leung, K.M.; Edwards, P.P.; Jones, E.; Sartbaeva, A. Microwave synthesis of LTN framework zeolite with no organic structure directing agents. RSC Adv. 2015, 5, 35580–35585. [Google Scholar] [CrossRef] [Green Version]
- Nearchou, A.; Raithby, P.; Sartbaeva, A. Systematic approaches towards template-free synthesis of EMT-type zeolites. Microporous Mesoporous Mater. 2018, 255, 261–270. [Google Scholar] [CrossRef]
- Nearchou, A.; Sartbaeva, A. Influence of alkali metal cations on the formation of zeolites under hydrothermal conditions with no organic structure directing agents. CrystEngComm 2008, 17, 2496–2503. [Google Scholar] [CrossRef] [Green Version]
- Maldonado, M.; Oleksiak, M.D.; Chinta, S.; Rimer, J.D. Controlling Crystal Polymorphism in Organic-Free Synthesis of Na-Zeolites. J. Am. Chem. Soc. 2012, 135, 2641–2652. [Google Scholar] [CrossRef] [PubMed]
- Nicholas, C.P. Zeolites in Industrial Separation and Catalysis; Wiley VCH: Weinheim, Germany, 2010; pp. 355–402. [Google Scholar]
- Amorim, R.; Vilaça, N.; Martinho, O.; Reis, R.M.; Sardo, M.; Rocha, J.; Fonseca, A.M.; Baltazar, F.; Neves, I.C. Zeolite Structures Loading with an Anticancer Compound As Drug Delivery Systems. J. Phys. Chem. C 2012, 116, 25642–25650. [Google Scholar] [CrossRef] [Green Version]
- Chaves, T.F.; Soares, F.; Cardoso, D.; Carneiro, R.L. Monitoring of the crystallization of Zeolite LTA using Raman and Chemometric tools. Analyst 2015, 140, 854–859. [Google Scholar] [CrossRef] [PubMed]
- Lalik, E.; Mirek, R.; Rakoczy, J.; Groszek, A. Microcalorimetric study of sorption of water and ethanol in zeolites 3A and 5A. Catal. Today 2006, 114, 242–247. [Google Scholar] [CrossRef]
- Liu, Q.; Mace, A.; Bacsik, Z.; Sun, J.; Laaksonen, A.; Hedin, N. NaKA sorbents with high CO2-over-N2 selectivity and high capacity to adsorb CO2. Chem. Comm. 2010, 46, 4502–4504. [Google Scholar] [CrossRef] [PubMed]
- Sun, H.; Wu, D.; Guo, X.; Shen, B.; Liu, J.; Navrotsky, A. Energetics of Confinement of n-Hexane in Ca-Na Ion Exchanged Zeolite A. J. Phys. Chem. C 2014, 118, 25590–25596. [Google Scholar] [CrossRef]
- Kwakye-Awuah, B.; Labik, L.K.; Nkrumah, I.; Williams, C. Removal of ammonium ions by laboratory synthesized zeolite linde type A adsorption from water samples affected by mining activities in Ghana. J. Water Health 2014, 12, 151–160. [Google Scholar] [CrossRef] [PubMed]
- Sartbaeva, A.; Rees, N.H.; Edwards, P.P.; Ramirez-Cuesta, A.J.; Barney, E. Local probes show that framework modification in zeolites occurs on ammonium exchange without calcination. J. Mater. Chem. A 2013, 1, 7415–7421. [Google Scholar] [CrossRef]
- Seel, A.G.; Sartbaeva, A.; Edwards, P.P.; Rammirez-Cuesta, A.J. Inelastic neutron scattering of Na-zeolite A with in situ ammoniation: An examination of initial coordination. Phys. Chem. Chem. Phys. 2010, 12, 9661–9666. [Google Scholar] [CrossRef] [PubMed]
- Watanabe, Y.; Yamada, H.; Tanaka, J.; Komatsu, Y.; Moriyoshi, Y. Ammonium Ion Exchange of Synthetic Zeolites: The Effect of Their Open Window Sizes, Pore Structures, and Cation Exchange Capacities. Sep. Sci. Technol. 2005, 39, 2091–2104. [Google Scholar] [CrossRef]
- Navarrete-Casas, R.; Navarrete-Guijosa, A.; Valenzuela-Calahorro, C.; López-González, J.D.; García-Rodríguez, A. Study of lithium ion exchange by two synthetic zeolites: Kinetics and equilibrium. J. Colloid Interface Sci. 2007, 306, 345–353. [Google Scholar] [CrossRef] [PubMed]
- Kim, H.S.; Choi, S.Y.; Lim, W.T. Complete Li+ exchange into zeolite X (FAU, Si\Al = 1.09) from undried methanol solution. J. Porous Mater. 2013, 20, 1449–1456. [Google Scholar] [CrossRef]
- Bignami, G.P.; Dawson, D.M.; Seymour, V.R.; Wheatley, P.S.; Morris, R.E.; Ashbrook, S.E. Synthesis, Isotopic Enrichment, and Solid-State NMR Characterization of Zeolites Derived from the Assembly, Disassembly, Organization, Reassembly Process. J. Am. Chem. Soc. 2017, 139, 5140–5148. [Google Scholar] [CrossRef] [PubMed]
- Brouwer, D.H.; Darton, R.J.; Morris, R.E.; Levitt, M.H. A solid-state NMR method for solution of zeolite crystal structures. J. Am. Chem. Soc. 2005, 127, 10365–10370. [Google Scholar] [CrossRef] [PubMed]
- Fyfe, C.A.; Feng, Y.; Grondey, H.; Kokotailo, G.T.; Gies, H. One- and two-dimensional high-resolution solid-state NMR studies of zeolite lattice structures. Chem. Rev. 1991, 91, 1525–1543. [Google Scholar] [CrossRef]
- Fyfe, C.A.; Gobbi, G.C.; Hartman, J.S.; Klinowski, J.; Thomas, J.M. Solid-state magic-angle spinning. Aluminum-27 nuclear magnetic resonance studies of zeolites using a 400-MHz high-resolution spectrometer. J. Phys. Chem. 1982, 86, 1247–1250. [Google Scholar] [CrossRef]
- Fyfe, C.A.; Thomas, J.M.; Klinowski, J.; Gobbi, G.C. Magic-Angle-Spinning NMR (MAS-NMR) Spectroscopy and the Structure of Zeolites. Angew. Chem. Int. Ed. Engl. 1983, 22, 259–275. [Google Scholar] [CrossRef]
- Lippmaa, A.; Maedi, M.; Samoson, A.; Tarmak, M.; Engelhardt, G. Investigation of the structure of zeolites by solid-state high-resolution silicon-29 NMR spectroscopy. J. Am. Chem. Soc. 1981, 103, 4992–4996. [Google Scholar] [CrossRef]
- Nebel, H.; Neumann, M.; Mayer, C.; Epple, M. On the Structure of Amorphous Calcium Carbonate–A Detailed Study by Solid-State NMR Spectroscopy. Inorg. Chem. 2008, 47, 7874–7879. [Google Scholar] [CrossRef] [PubMed]
- Park, M.B.; Vicente, A.; Fernandez, C.; Hong, S.H. Solid-state NMR study of various mono- and divalent cation forms of the natural zeolite natrolite. Phys. Chem. Chem. Phys. 2013, 15, 7604–7612. [Google Scholar] [CrossRef] [PubMed]
- Thomas, J.M.; Klinowsky, J.; Ramadas, S.; Anderson, M.W.; Fyfe, C.A.; Gobbi, G.C. New Approaches to the Structural Characterization of Zeolites: Magic-Angle Spinning NMR (MASNMR). In Intrazeolite Chemistry; Galen, D.S., Francis, G.D., Eds.; ACS Publications: Washington, DC, USA, 1983; pp. 159–180. ISBN 9780841207745. [Google Scholar]
- Gramlich, V.; Meier, W.M. The crystal structure of hydrated NaA: A detailed refinement of a pseudosymmetric zeolite structure. Z. Krist. 1971, 10, 134–149. [Google Scholar] [CrossRef]
- Treacy, M.M.J.; Higgins, J.B. Collection of Simulated XRD Powder Patterns for Zeolites; Elsevier: Amsterdam, The Netherlands, 2007; pp. 252–253. [Google Scholar]
- Alfaro, S.; Rodriguez, C.; Valenzuela, M.A.; Bosch, P. Aging time effect on the synthesis of small crystal LTA zeolites in the absence of organic template. Mater. Lett. 2007, 61, 4655–4658. [Google Scholar] [CrossRef]
- Carey, T.; Tang, C.C.; Hriljac, J.A.; Anderson, P.A. Chemical Control of Thermal Expansion in Cation-Exchanged Zeolite A. Chem. Mater. 2014, 26, 1561–1566. [Google Scholar] [CrossRef]
- Lührs, H.; Derr, J.; Fischer, R.X. K and Ca exchange behavior of zeolite A. Microporous Mesoporous Mater. 2012, 151, 457–465. [Google Scholar] [CrossRef]
- Holland, T.J.B.; Redfern, S.A.T. Unit cell refinement from powder diffraction data–the use of regression diagnostics. Miner. Mag. 1997, 61, 65–77. [Google Scholar] [CrossRef]
- O’Keeffe, M.; Navrotsky, A. Some Aspects of the Ionic Model of Crystals. In Structure and Bonding in Crystals; O’Keeffe, M., Ed.; Academic Press: Cambridge, MA, USA, 1981; pp. 299–322. [Google Scholar]
- Ramdas, S.; Klinowski, J. A simple correlation between isotropic 29Si-NMR chemical shifts and T-O-T angles in zeolite frameworks. Nature 1984, 308, 521–523. [Google Scholar] [CrossRef]
- Edith, M.F.; Hassan, K.; Herman, A.S. Infrared Structural Studies of Zeolite Frameworks. In Molecular Sieve Zeolites-I; Edith, M.F., Leonard, B.S., Eds.; ACS Publications: Washington, DC, USA, 1974; pp. 201–229. ISBN 9780841201149. [Google Scholar]
- Milkey, R.G. Infrared Spectra of some Tectosilicates. Am. Minerol. 1960, 45, 990–1007. [Google Scholar]
- Dyballa, M.; Obenaus, U.; Lang, S.; Gehring, B.; Traa, Y.; Koller, H.; Hunger, M. Brønsted sites and structural stabilization effect of acidic low-silica zeolite A prepared by partial ammonium exchange. Microporous Mesoporous Mater. 2015, 212, 110–116. [Google Scholar] [CrossRef]
- Ucun, F. An Infrared Study of the CaA Zeolite Reacted with CO2. Z. Naturforsch. 2002, 57, 283. [Google Scholar] [CrossRef]
- Holzwarth, U.; Gibson, N. The Scherrer equation versus the ‘Debye-Scherrer equation’. Nat. Nano 2011, 6, 534. [Google Scholar] [CrossRef] [PubMed]
- Cubillas, P.; Gebbie, J.T.; Stevens, S.M.; Blake, N.; Umemura, A.; Terasaki, O.; Anderson, M.W. Atomic Force Microscopy and High Resolution Scanning Electron Microscopy Investigation of Zeolite A Crystal Growth. Part 2: In Presence of Organic Additives. J. Phys. Chem. C 2014, 118, 23092–23099. [Google Scholar] [CrossRef] [Green Version]
- Kliewer, C.E. Electron Microscopy and Imaging. In Zeolite Characterization and Catalysis; Chester, A.W., Derouane, E.G., Eds.; Springer: Dordrecht, The Netherlands, 2009; pp. 169–196. [Google Scholar]
- Mintova, S.; Olson, N.H.; Valtchev, V.; Bein, T. Mechanism of Zeolite A Nanocrystal Growth from Colloids at Room Temperature. Science 1999, 283, 958–960. [Google Scholar] [CrossRef] [PubMed]
- Dimitrov, L.; Valtchev, V.; Nihtianova, D.; Kalvachev, Y. Submicrometer Zeolite A Crystals Formation: Low-Temperature Crystallization Versus Vapor Phase Gel Transformation. Cryst. Growth Des. 2011, 11, 4958–4962. [Google Scholar] [CrossRef]
- Smaihi, M.; Barida, O.; Valtchev, V. Investigation of the Crystallization Stages of LTA-Type Zeolite by Complementary Characterization Techniques. Eur. J. Inorg. Chem. 2003, 2003, 4370–4377. [Google Scholar] [CrossRef]
Figure 1.
Linde Type A (LTA) framework with the cage as the unit cell in the middle (black square). Red spheres: oxygens; blue: Si/Al atoms.
Figure 1.
Linde Type A (LTA) framework with the cage as the unit cell in the middle (black square). Red spheres: oxygens; blue: Si/Al atoms.

Figure 2.
PXRD pattern for Na-A synthesised at 40 C for 24 h, indexed as the LTA framework.

Figure 3.
PXRD pattern for Na-A synthesised at 40 C for 48 h. Characteristic Faujasite (FAU) framework peaks are indexed with black dots.
Figure 3.
PXRD pattern for Na-A synthesised at 40 C for 48 h. Characteristic Faujasite (FAU) framework peaks are indexed with black dots.
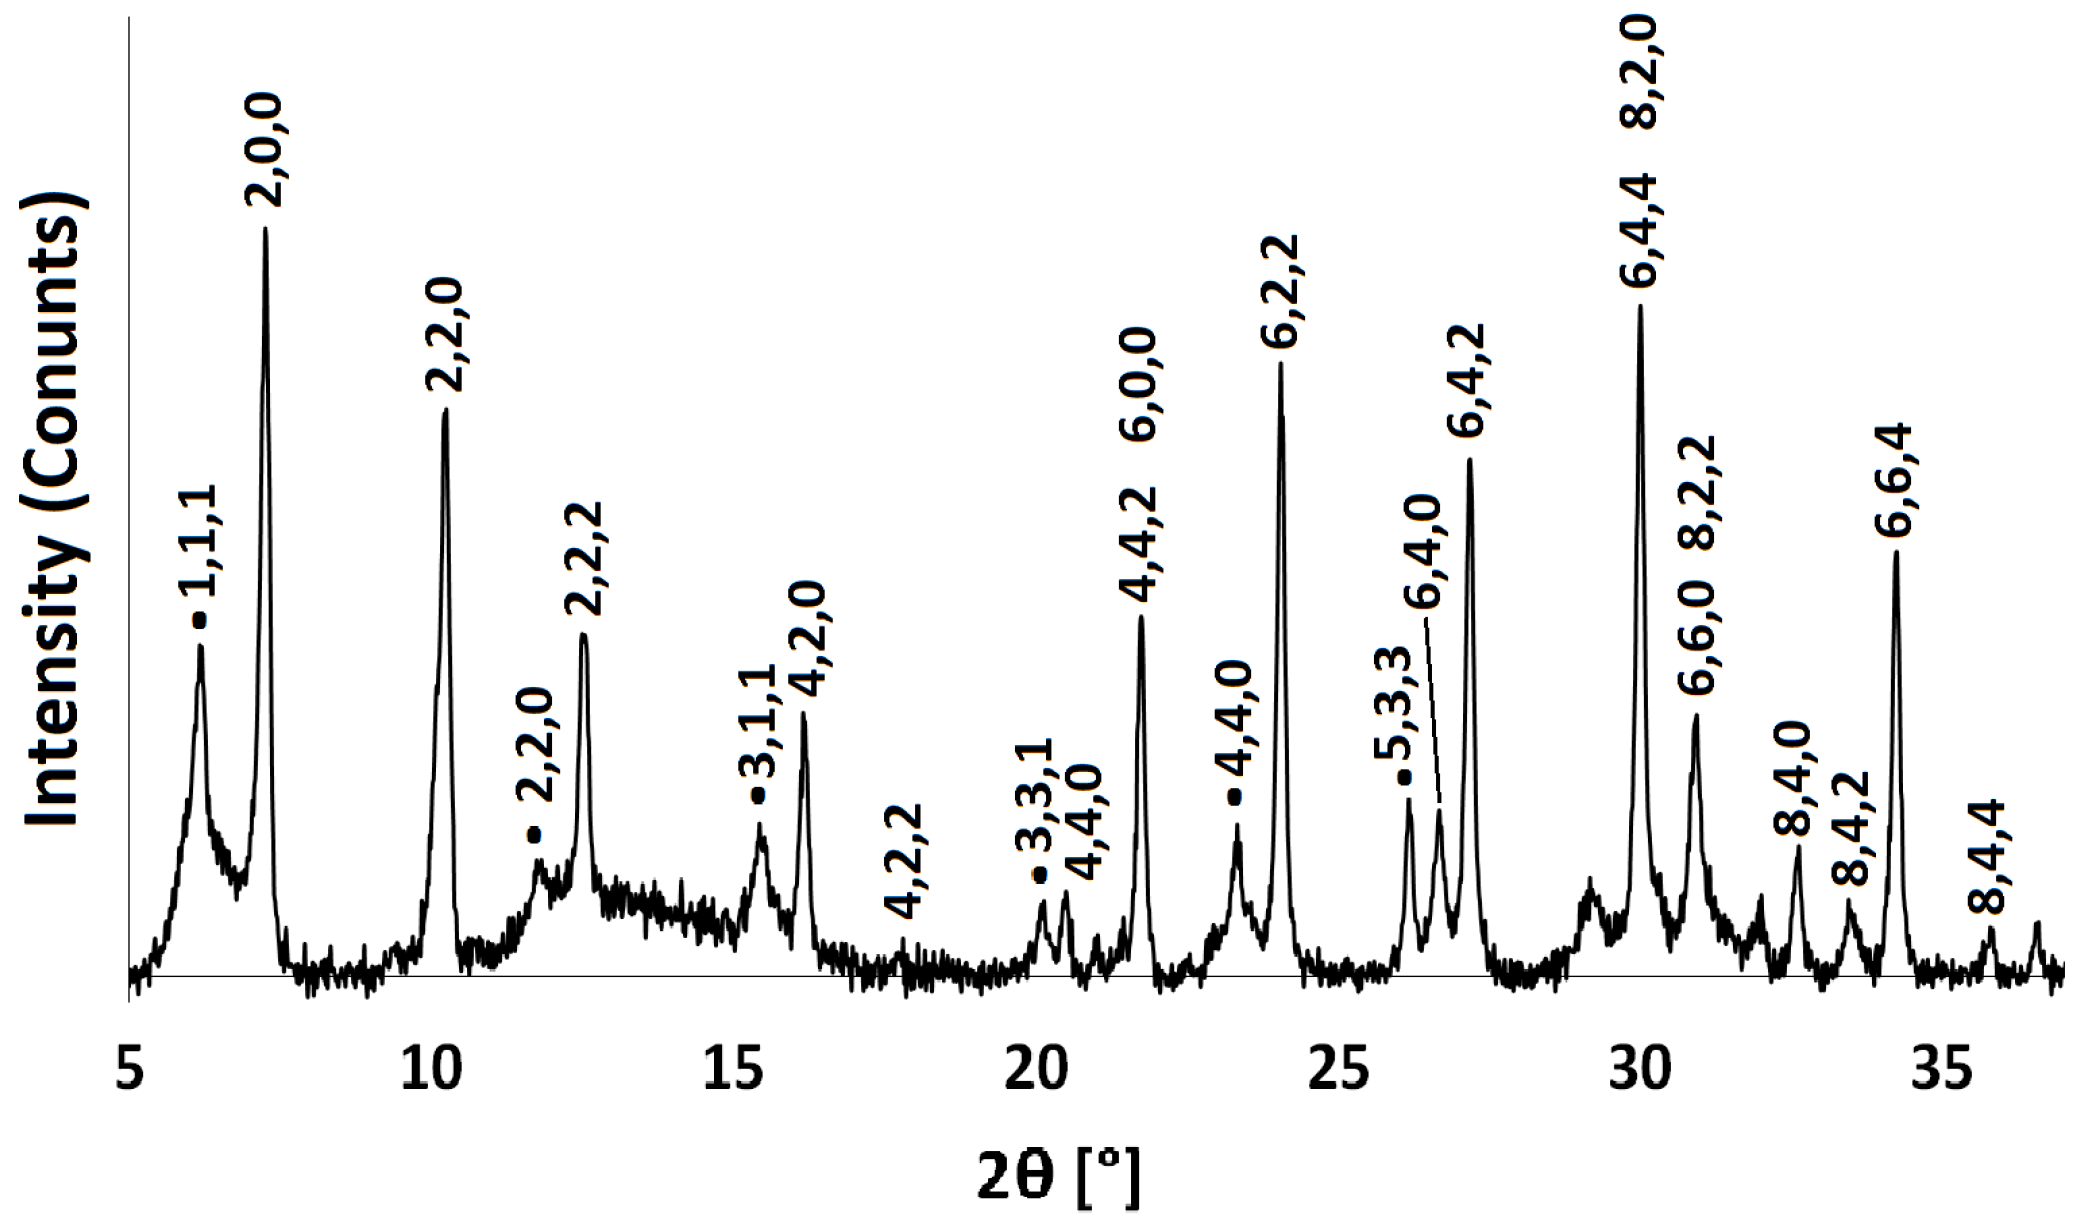
Figure 4.
PXRD patterns for Na-A, Li-A, K-A and Rb-A.

Figure 5.
FT-IR spectra for Na-A (blue line) and cation-exchanged Li-A (orange line); K-A (grey line) and Rb-A (green line).
Figure 5.
FT-IR spectra for Na-A (blue line) and cation-exchanged Li-A (orange line); K-A (grey line) and Rb-A (green line).
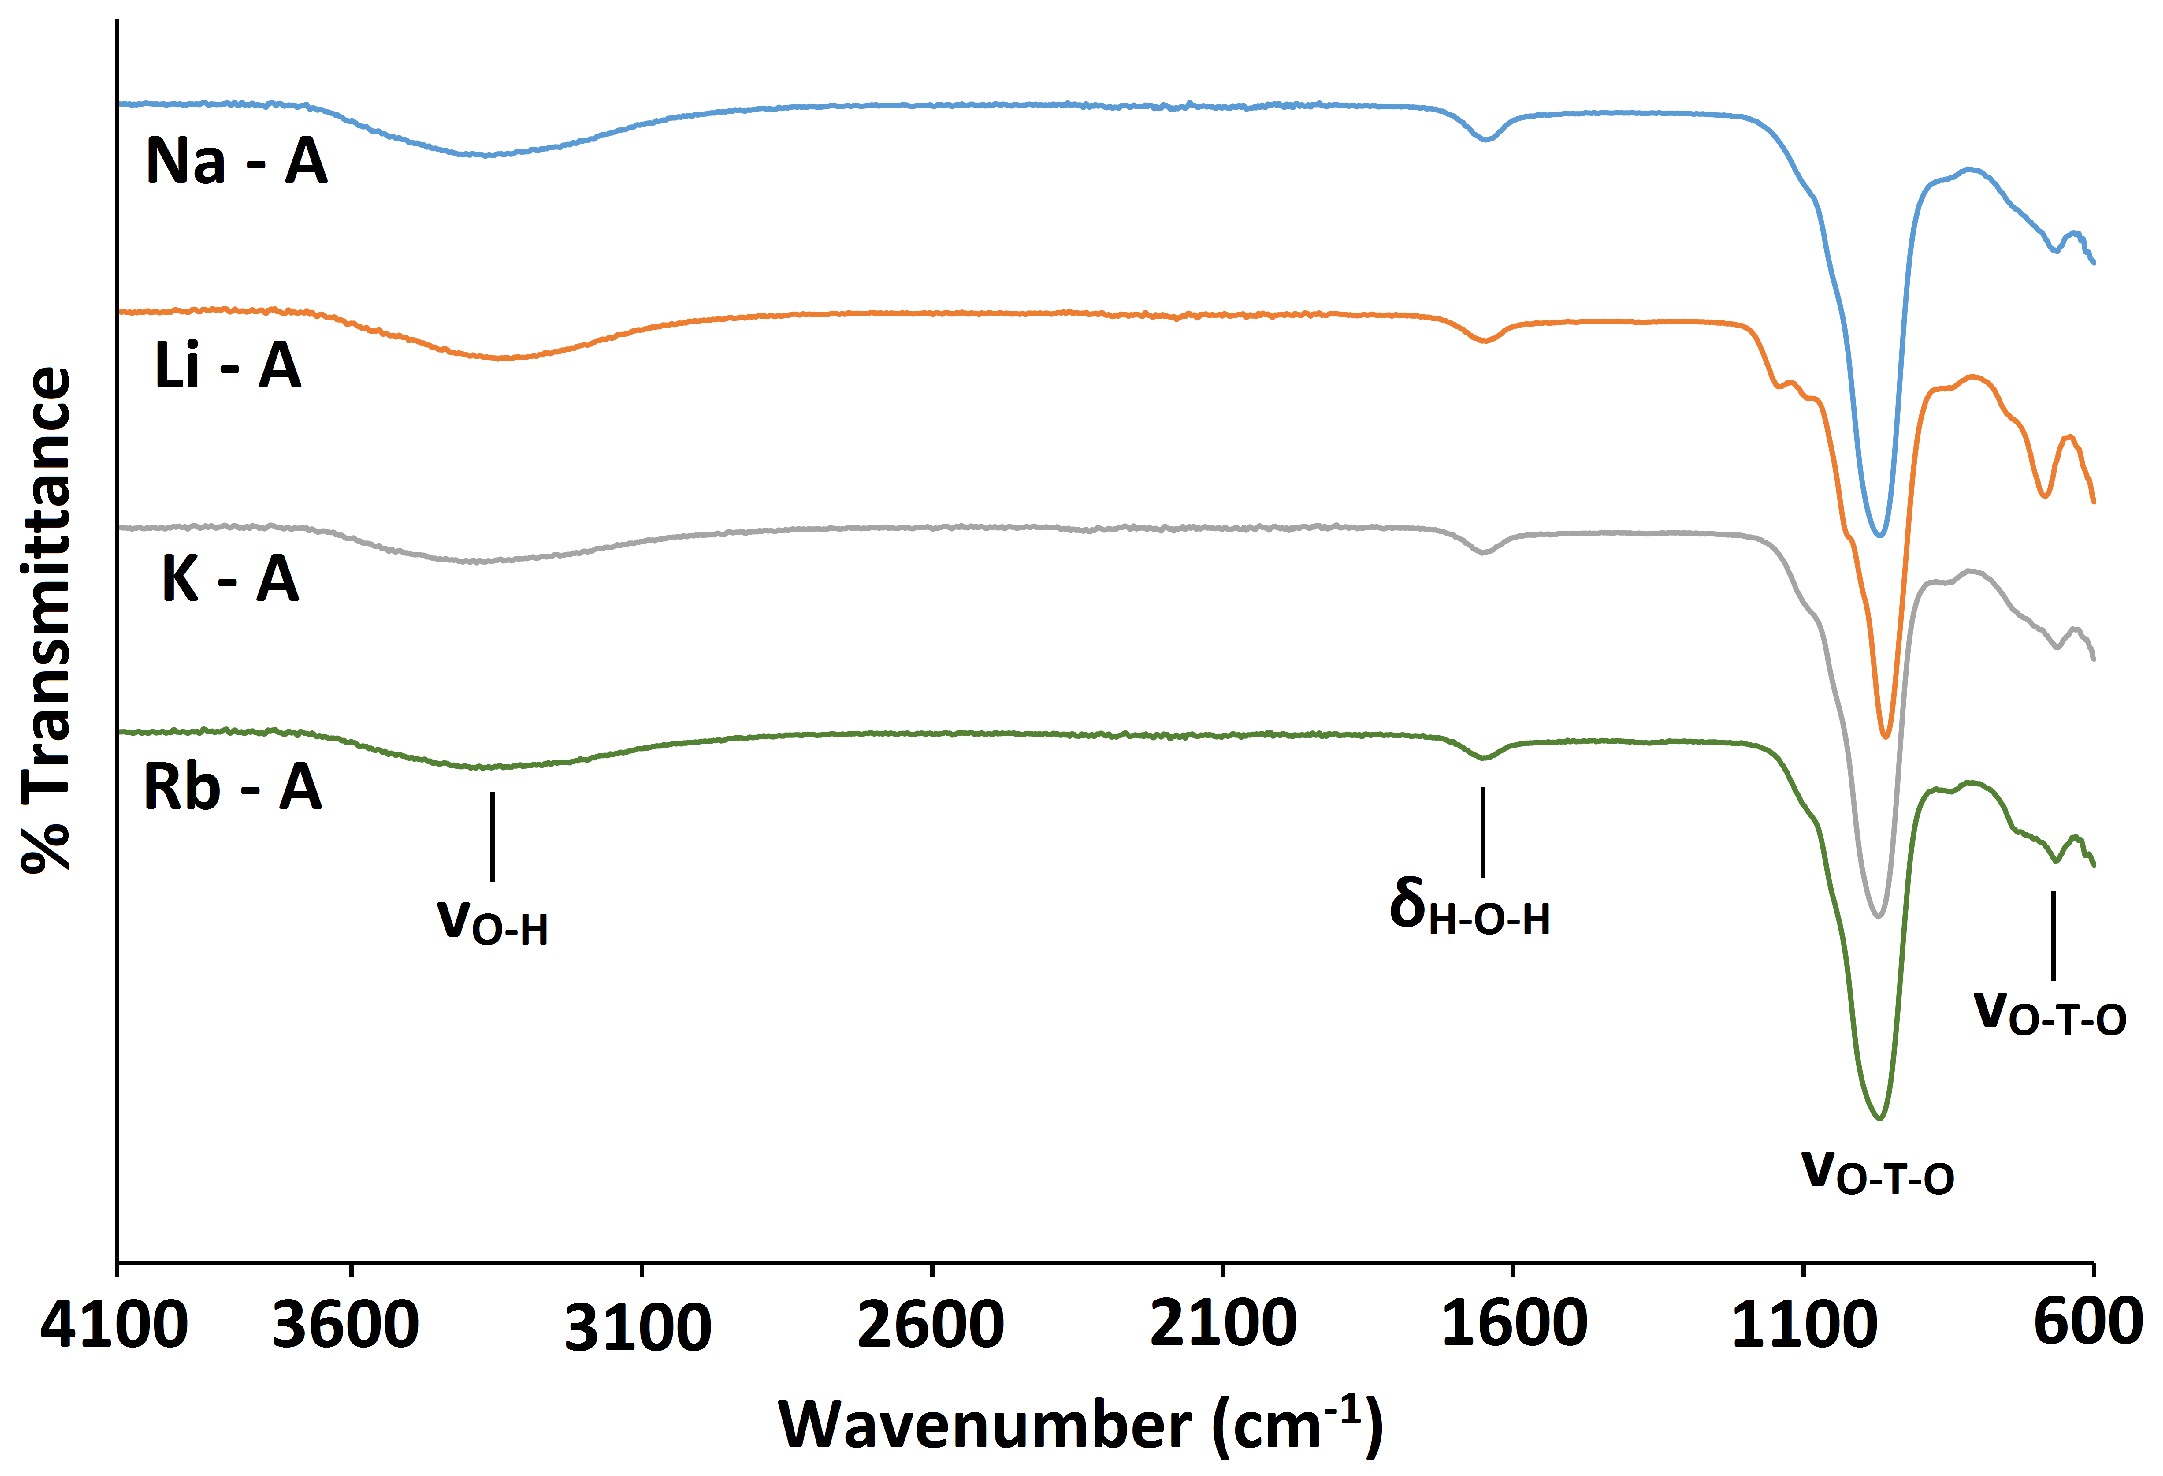
Figure 6.
Si NMR spectrum of the as-synthesised Na-A and monovalent cation-exchanged Li-A, K-A and Rb-A.
Figure 6.
Si NMR spectrum of the as-synthesised Na-A and monovalent cation-exchanged Li-A, K-A and Rb-A.

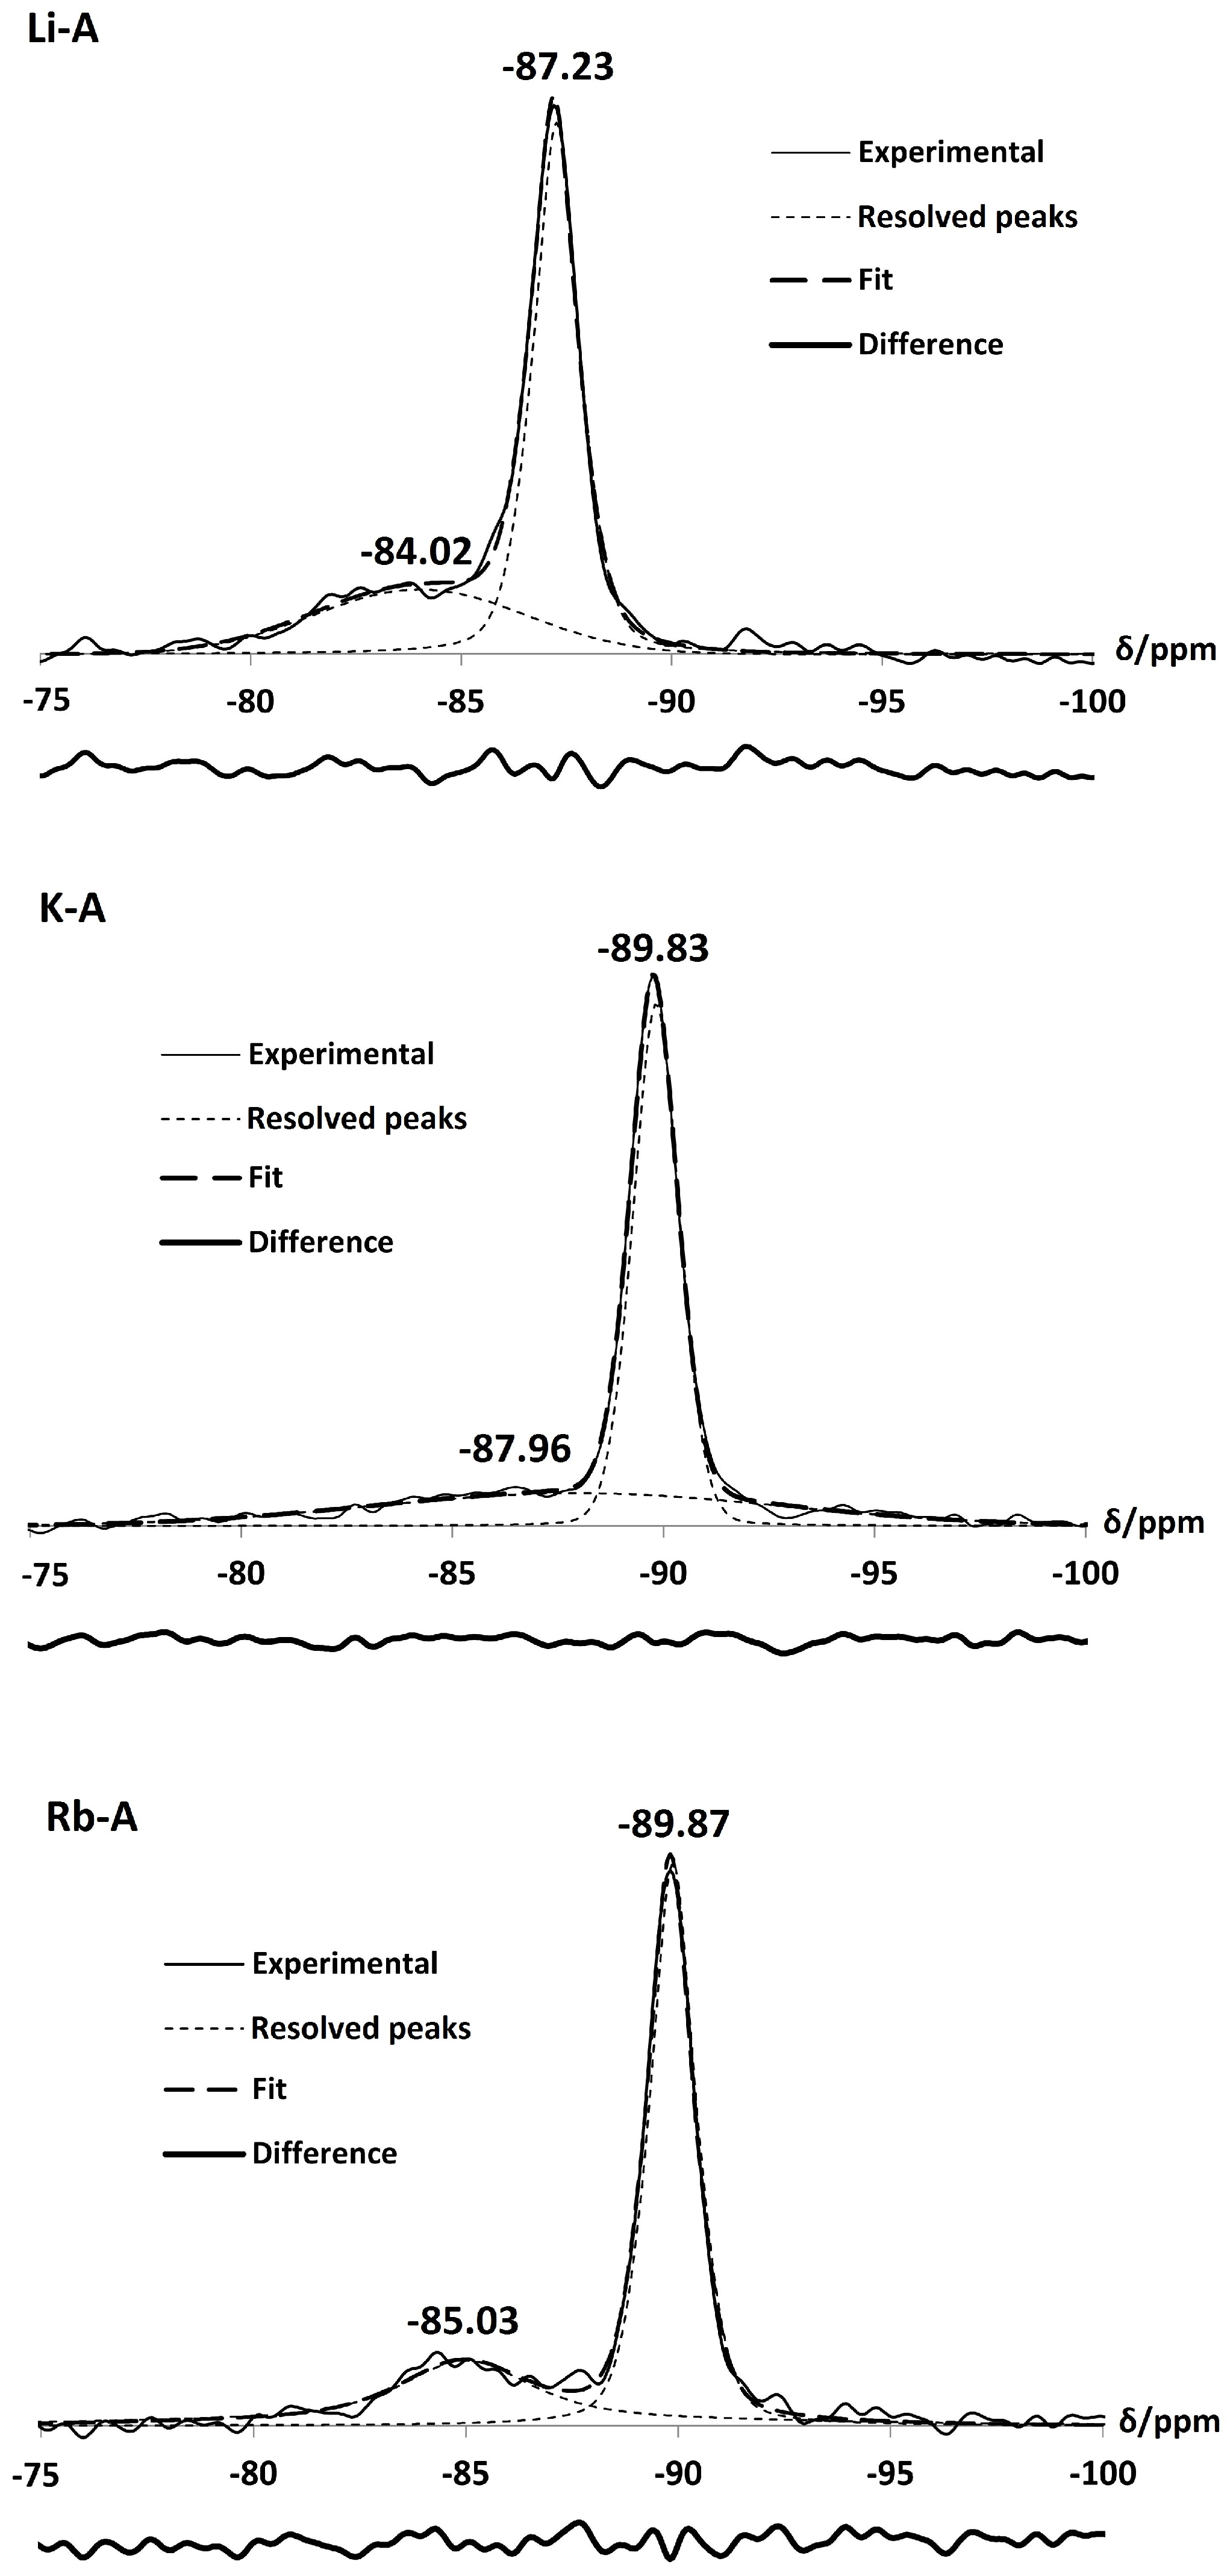
Figure 7.
PXRD pattern for NH-A.

Figure 8.
FT-IR spectra for the parent Na-A zeolite (orange line) and NH-A (blue line).
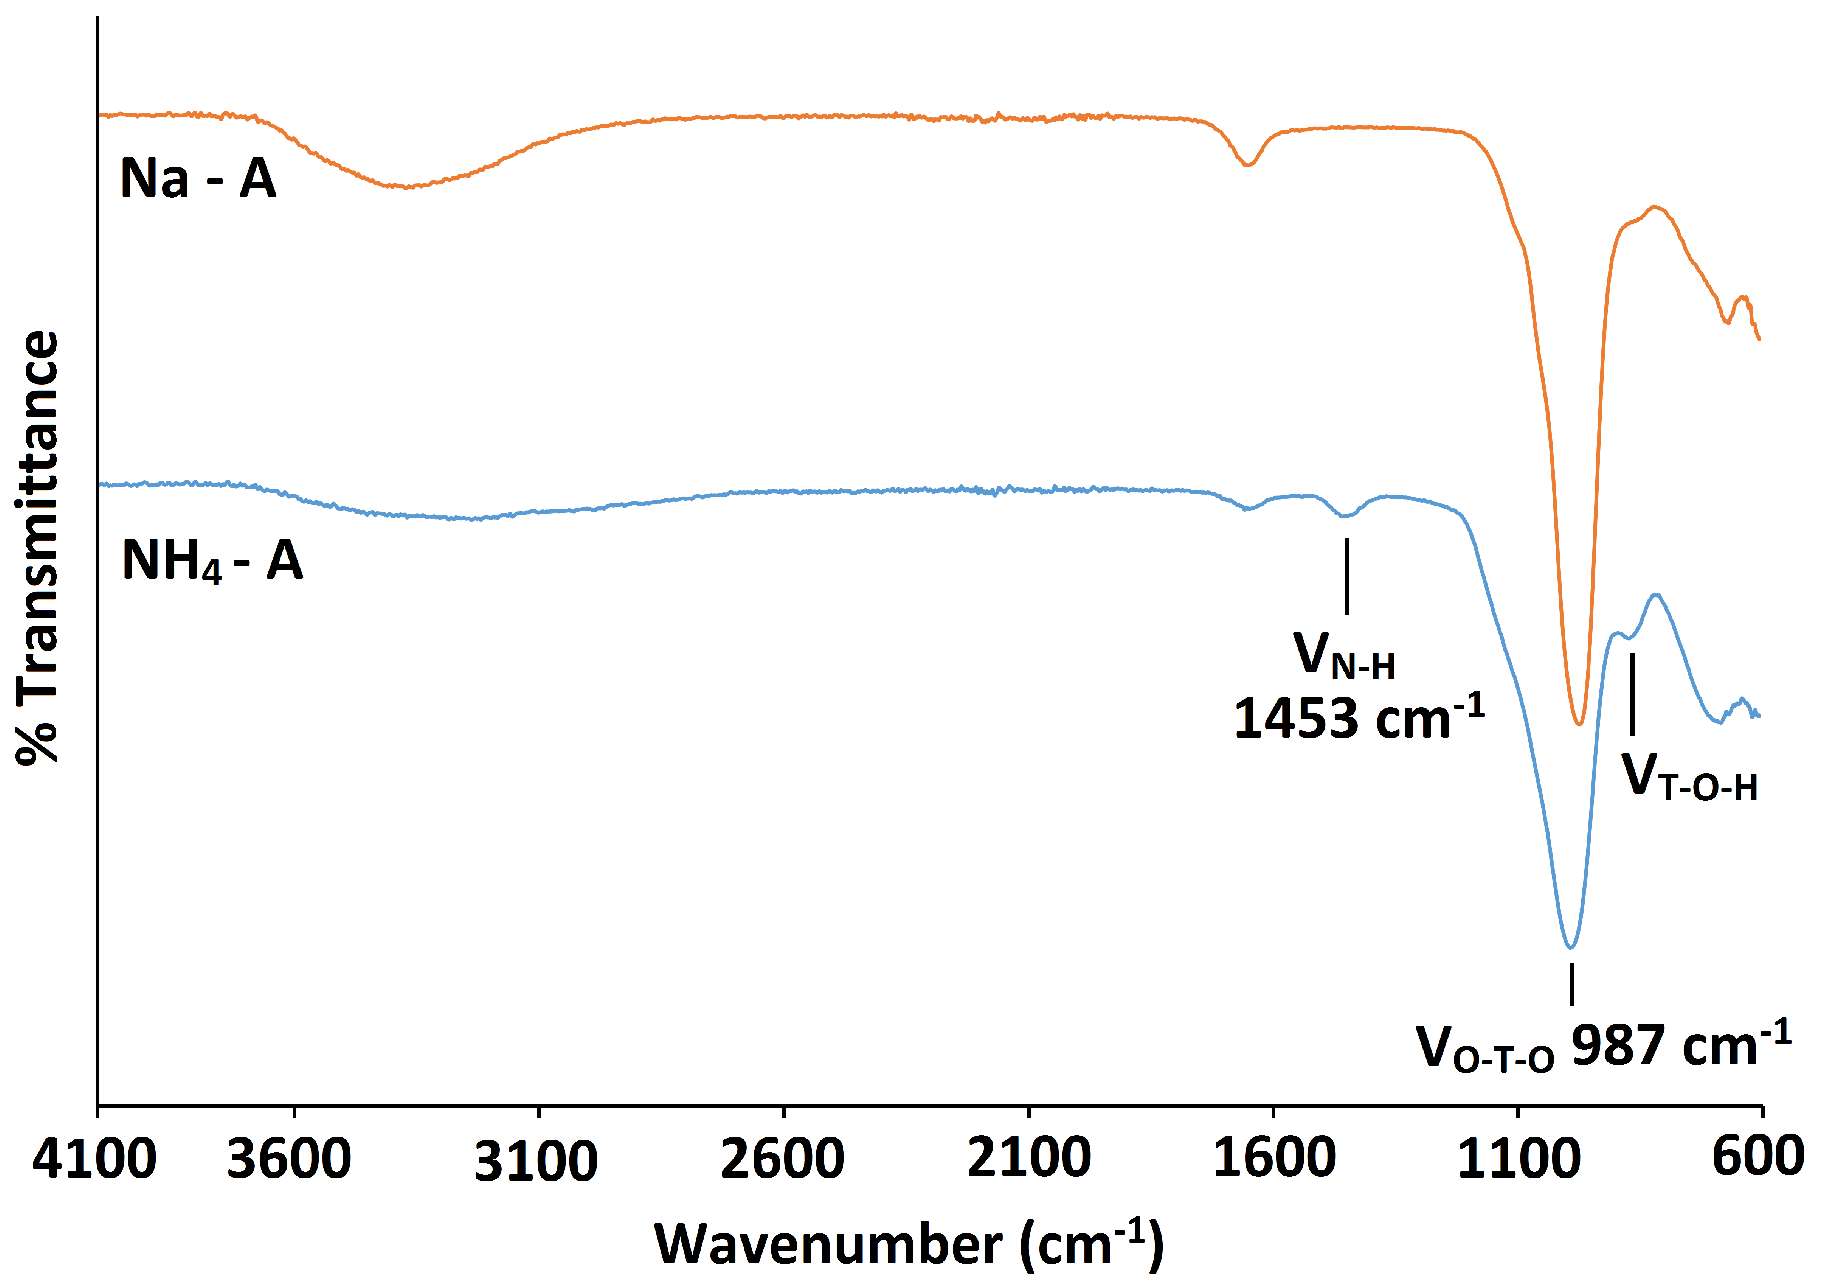
Figure 9.
Si (top) and Al (bottom) NMR spectrum of the monovalent cation-exchanged NH-A.

Figure 10.
PXRD pattern for Ca-A. The characteristic calcite peak is identified.

Figure 11.
C CPNMR of Ca-A.

Figure 12.
FT-IR spectra for the parent Na-A zeolite (orange) and Ca-A (blue).
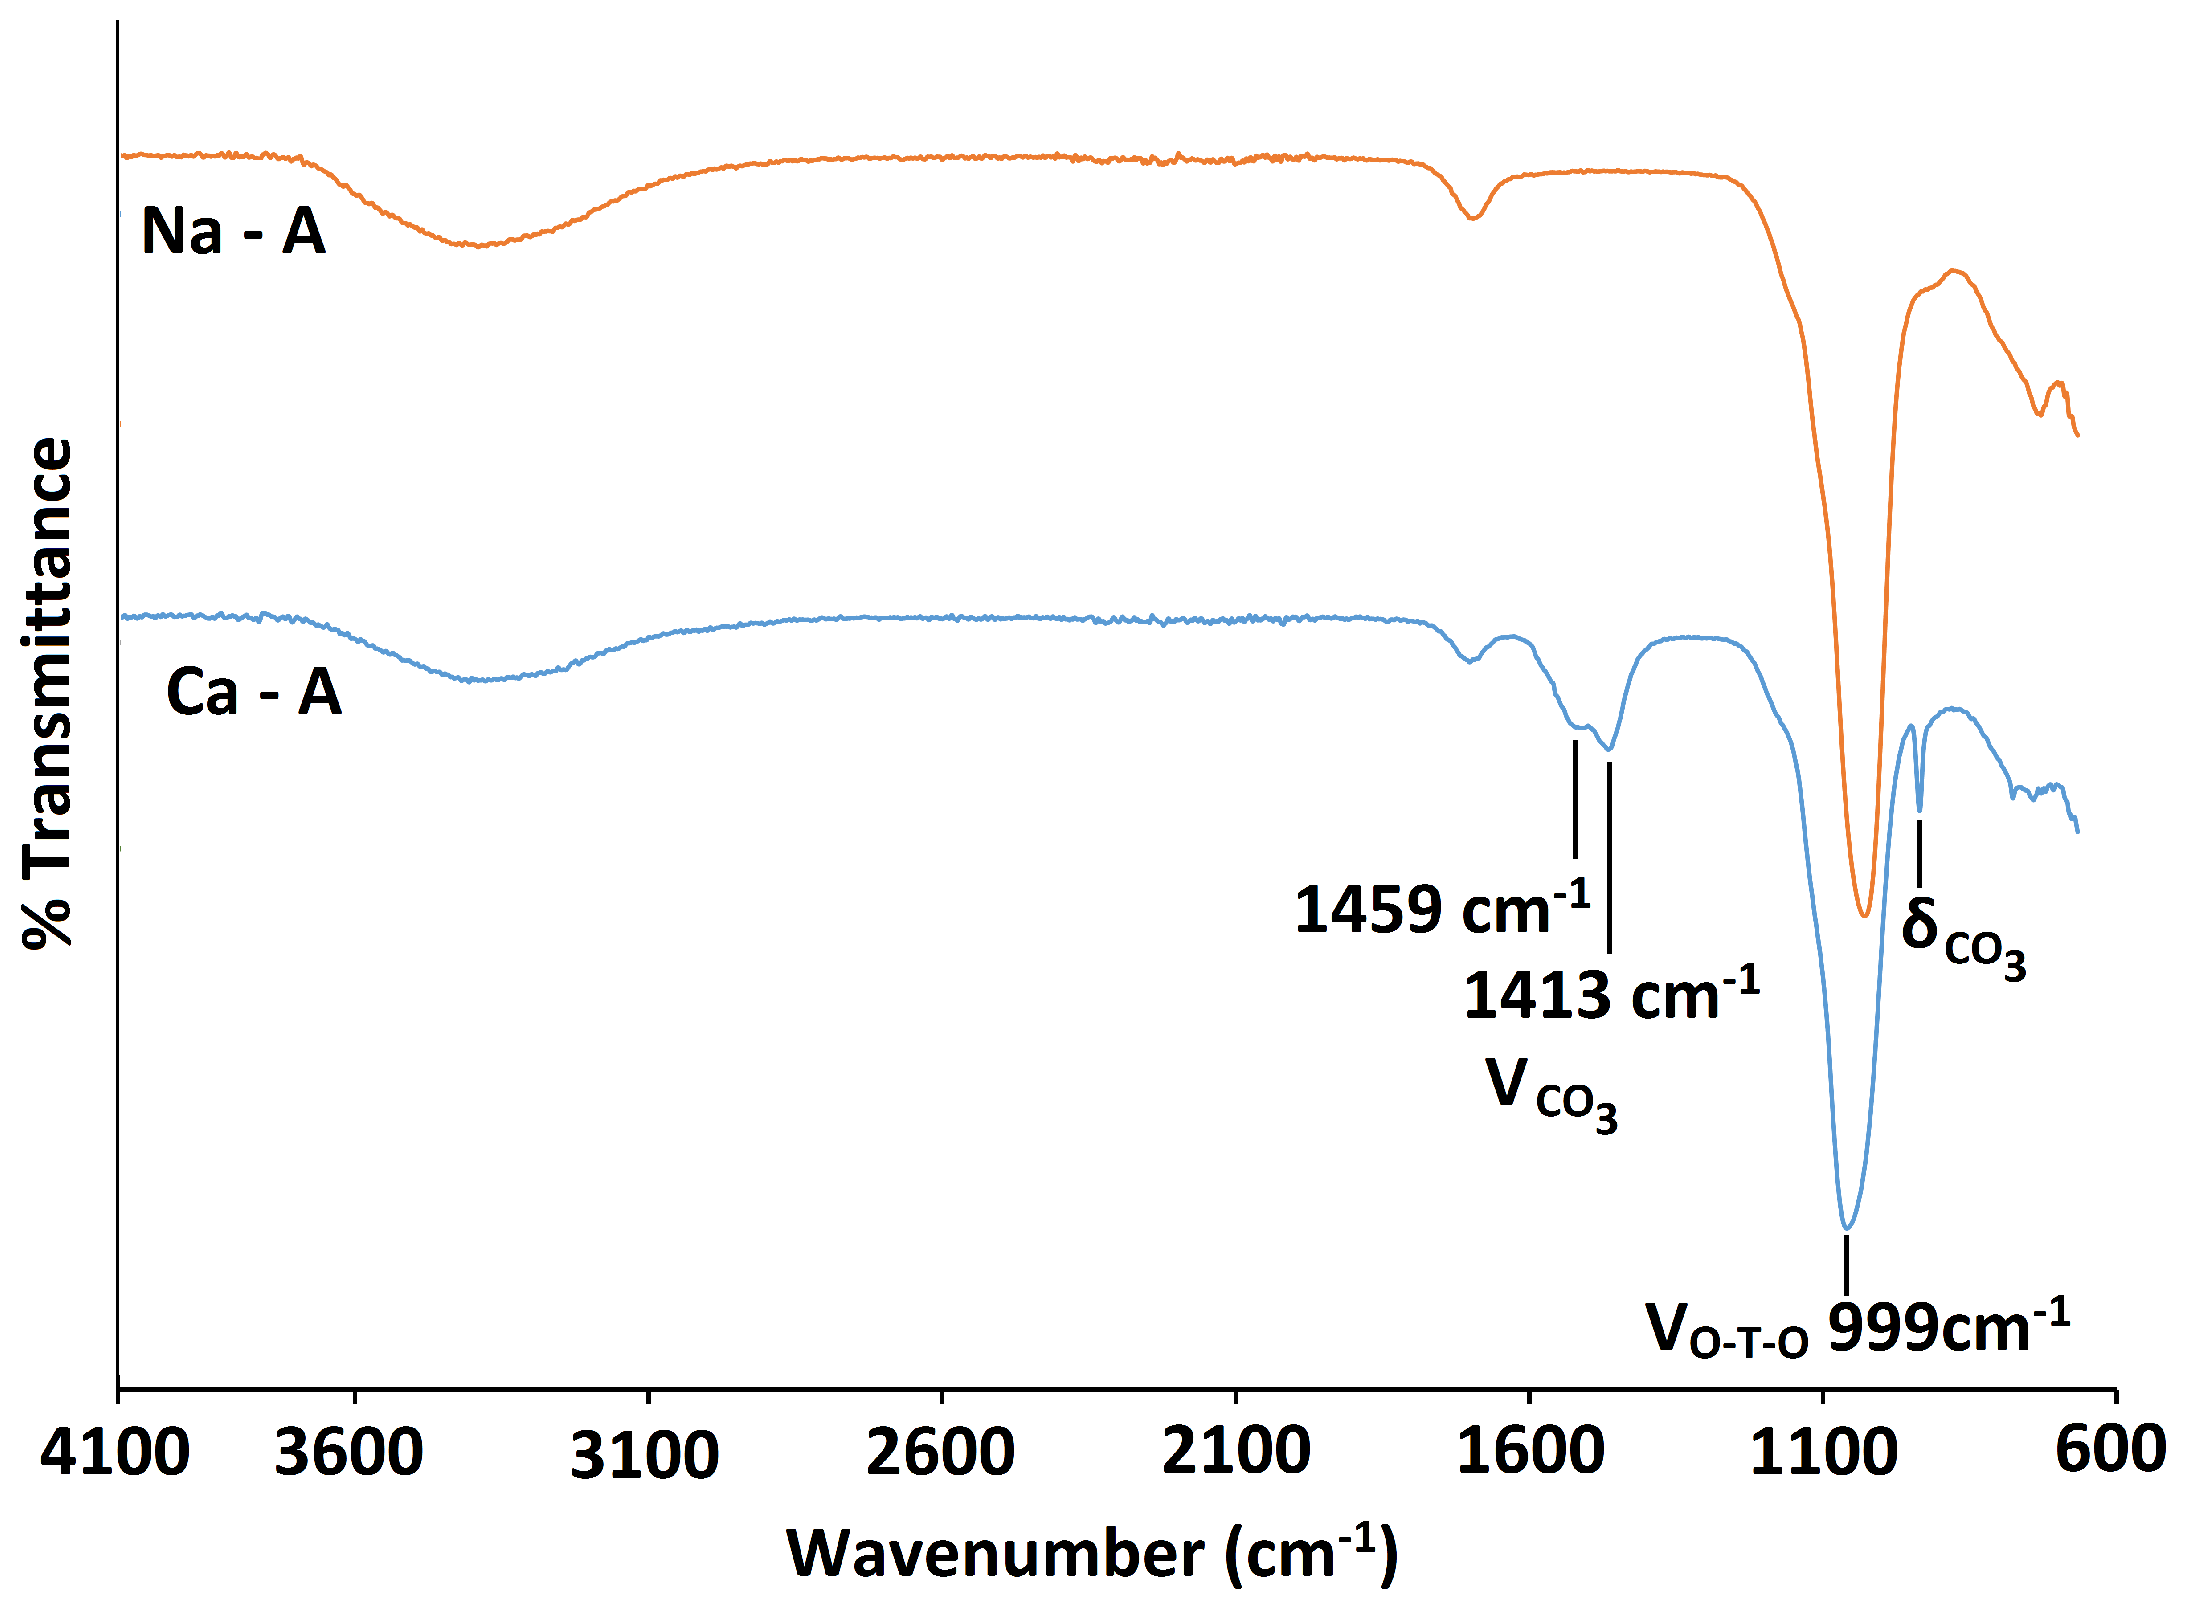
Figure 13.
Si (top) and Al (bottom) NMR spectrum of the divalent cation-exchanged Ca-A.

Figure 14.
FESEM Na-A.

Figure 15.
FESEM Ca-A.


Table 1.
Unit cell parameters for the exchanged zeolites.
| Li-A | Na-A | K-A | Rb-A | |
|---|---|---|---|---|
| Unit cell parameter, a (Å) | 24.151 (2) | 24.435 (2) | 24.454 (2) | 24.486 (3) |
Table 2.
Si NMR data: Si/Al ratios and average T-O-T bond angles for Li, Na, K and Rb-A. The angular values are estimated based on NMR data using the regression relationship from [36], and we estimate the accuracy on angles up to ±2 degrees.
Table 2.
Si NMR data: Si/Al ratios and average T-O-T bond angles for Li, Na, K and Rb-A. The angular values are estimated based on NMR data using the regression relationship from [36], and we estimate the accuracy on angles up to ±2 degrees.
| Li-A | Na-A | K-A | Rb-A | |
|---|---|---|---|---|
| Si/Al | 1 | 1 | 1 | 1 |
| ∠T-O-T [ ()] | 143.9 | 147.9 | 148.6 | 148.4 |
Table 3.
Crystallite sizes (nm) calculated from FESEM data using Equation (3) compared to crystal size observed by FESEM. Statistical analysis shows a large spread of values from the Scherrer equation up to ±28 nm; for FESEM data, the standard deviation is up to ±14 nm.
Table 3.
Crystallite sizes (nm) calculated from FESEM data using Equation (3) compared to crystal size observed by FESEM. Statistical analysis shows a large spread of values from the Scherrer equation up to ±28 nm; for FESEM data, the standard deviation is up to ±14 nm.
| Na-A | Ca-A | |
|---|---|---|
| Scherrer Equation (nm) | 242 | 270 |
| FESEM (nm) | 241 | 290 |
© 2017 by the authors. Licensee MDPI, Basel, Switzerland. This article is an open access article distributed under the terms and conditions of the Creative Commons Attribution (CC BY) license (http://creativecommons.org/licenses/by/4.0/).
Share and Cite
MDPI and ACS Style
Price, L.; Leung, K.M.; Sartbaeva, A. Local and Average Structural Changes in Zeolite A upon Ion Exchange. Magnetochemistry 2017, 3, 42. https://doi.org/10.3390/magnetochemistry3040042
AMA Style
Price L, Leung KM, Sartbaeva A. Local and Average Structural Changes in Zeolite A upon Ion Exchange. Magnetochemistry. 2017; 3(4):42. https://doi.org/10.3390/magnetochemistry3040042
Chicago/Turabian StylePrice, Lisa, Ka Ming Leung, and Asel Sartbaeva. 2017. "Local and Average Structural Changes in Zeolite A upon Ion Exchange" Magnetochemistry 3, no. 4: 42. https://doi.org/10.3390/magnetochemistry3040042
Note that from the first issue of 2016, this journal uses article numbers instead of page numbers. See further details here.