1. Introduction
Ferrofluids are colloidal systems of single-domain magnetic nanoparticles, having a distribution of sizes between (3–15) nm being dispersed in a carrier liquid and coated with a surfactant to prevent their agglomeration [
1]. Each particle can be in a state of uniform magnetization with the magnetic moment,
m =
MSVm, where
MS is the spontaneous magnetization of the bulk material from which the particles come, and
Vm is the magnetic volume of the particle.
It is known that, due to anisotropy, single-domain particles can have more than one axis of anisotropy, but the particle presents a minimum energy along a preferential axis called the principal axis. As a result, in the theoretical investigations of the magnetic properties of ferrofluids, it is assumed that the single-domain particles in a ferrofluid have uniaxial anisotropy [
1] and the effective anisotropy constant,
Keff, is the result of the combination of magnetocrystalline, shape or surface anisotropy [
2,
3]. For the single-domain particle with uniaxial anisotropy, the anisotropy field,
HA is given by the relation [
2,
4]:
where
μ0 is the magnetic permeability of free space.
Measurements of the complex magnetic permeability,
μ(
f,
H) in the microwave range and in presence of a polarizing magnetic field
H, allow the determination of the real
μ′(
f,
H) and imaginary
μ″(
f,
H) components [
5,
6,
7], which are very useful both for highlighting the phenomenon of ferromagnetic resonance and for evaluating the anisotropy field
HA, and other magnetic parameters of nanoparticles in ferrofluids. Starting from the Landau–Lifshitz equation [
4], which describes the movement of the magnetic moment
m of the particle, in a magnetic field
H, for a strong polarizing magnetic field (
H >>
HA), the resonance condition is written in the form [
8]:
This equation shows a linear dependence between the resonant frequency,
fres and
H, whose slope is
γ, (called the gyromagnetic ratio of the particle), and is given by the following relation:
In Equation (3),
g is the spectroscopic splitting factor;
γe = 8.791 × 10
10 s
−1·T
−1 is the electronic gyromagnetic ratio and
αL is the damping parameter of the Landau–Lifshitz equation [
4]. In the ferromagnetic resonance range, knowing these parameters of the nanoparticles in the ferrofluid is very important in some microwave applications [
9]. Among the practical applications based on microwaves, we can mention the wireless connection, through radio waves, global positioning system (GPS), radar and mobile telephony, and with the progress made in these applications, the problem of electromagnetic interference appears, thus requiring the finding of materials with electromagnetic absorbing properties [
10], which are very necessary in the field of electromagnetic shielding [
11]. At the same time, the increased use of electronic devices leads to significant pollution with electromagnetic waves, so that the study of electromagnetic wave absorbers (EMAs) is appropriate [
12,
13,
14]. Recently, studies were conducted on microwave absorbers (MAs), based on metamaterials [
15], which play an important role in reducing the size and thickness of MAs as a function of operating frequency. These absorbers (MAs) are required in applications to reduce electromagnetic wave interference (EMI), to improve electromagnetic shielding or potential military applications. Magnetic nanomaterials can be of interest for microwave absorbers [
16], due to high magnetic saturation and low coercivity. Among the magnetic nanomaterials used in recent years, can be mentioned magnetic metals [
17]; magnetic alloys [
18] or magnetic oxides [
19]. The design of potential microwave absorbers based on magnetic nanomaterials presents high reflection losses (R
L), thin thickness and wide bandwidth, which leads to improved efficiency in electromagnetic absorption (EM) [
16]. In paper [
20], a flexible absorber for microwaves based on a nanocomposite of nickel ferrite in a natural rubber matrix was analyzed, using the complex dielectric permittivity and magnetic permeability measurements in S-band (2–4) GHz and X-band (8–12) GHz. The reflection loss was estimated using the model of single layer absorber deposited on a perfect conductor. Also, the results reported in [
21] clearly show that composite materials are effective in reducing electromagnetic interference (EMI) pollution, with special attention being paid to the development of new nanocomposite materials with high electromagnetic absorbing properties.
Ferrofluids are considered to be nanocomposite systems and may show special electromagnetic properties which differ from the typical properties of the individual constituent components [
22]. To design devices with specific microwave properties, such as the electromagnetic absorbers [
21,
23], it is necessary to undertake an analysis regarding the propagation of the electromagnetic waves in ferrofluids and the determination of propagation parameters correlated with possible absorbing properties of the ferrofluid in the microwave field.
It is known that in the case of plane wave propagation [
24] through an electromagnetic medium along the
Oz axis, the complex temporal expressions of the electric (
) and magnetic (
) components of the electromagnetic field are given by the relations:
where,
and
are unit vectors on the
Ox and
Oy axes and
; (
ωt −
βz) represents the phase of the electromagnetic wave,
β being the phase constant and
ω the angular frequency. Also,
E0e−αz and (
E0/
Zm)
e−αz are the amplitudes of the electric and magnetic components of the electromagnetic wave, where
α and
Zm represent the attenuation constant and the intrinsic impedance of the propagation medium, respectively, which are given by the relations [
25]:
In these relations,
f is the frequency of electromagnetic wave;
c = 3 × 10
8 m/s is the speed of electromagnetic waves in free space and
Z0 =
(μ0/
ε0)1/2 = 377 Ω is the intrinsic impedance of free space (
ε0 being the dielectric permittivity of free space). Considering the complex form of the relative magnetic permeability,
as well of the relative dielectric permittivity,
, the following expression for calculating the intrinsic impedance of the medium is obtained from Equation (7):
Let us assume that an electromagnetic wave comes from medium 1 and is reflected on the surface of medium 2 (
Figure 1).
It is known that the modulus of the reflection coefficient
R, on the reflection surface, is defined as the ratio between the complex amplitude of the reflected wave and the complex amplitude of the incident wave [
21,
26], and in the case of the field perpendicular to the plane of incidence, the reflection coefficient,
R, is given by the relation [
26]:
Considering the definition of the intrinsic impedance of a medium (Equation (7)),
R can be written as:
where
Zm1 and
Zm2 are the intrinsic impedances of the medium 1 and medium 2, respectively.
The absorbing properties of the propagation medium can be highlighted both by the attenuation constant, α and by the reflection coefficient R. As a result, the aim of the work presented here, was to investigate the microwave absorption properties of a ferrofluid sample, by determining the parameters α, and R, at different H values and sample thicknesses d. For this, we performed measurements of μ(f,H) and ε(f,H), in the microwave range (0.4–7) GHz and at different values H, (0–135) kA/m, for a ferrofluid sample. At the same time we proposed a theoretical model for computing the overall reflection coefficient, Rw(f,H) of a plane wave absorber with a single layer supported by a perfect conductor, following multiple internal reflections, at the normal incidence of the wave, valid for any material/composite system that has absorbing properties in microwave range, applied to the investigated ferrofluid sample. The proposed theoretical model assumes that the ferrofluid is homogeneous in its thickness and local structure when subjected to external magnetic fields.
2. Theoretical Model of the Overall Reflection Coefficient
Another important parameter relating to electromagnetic absorbers is the overall reflection coefficient,
Rw, of a material with thickness
d, through which an electromagnetic wave propagates. To define
Rw, consider a thin layer of an absorbent material (having the attenuation constant
α and reflection coefficient
R), deposited on a metal support (total reflective support) (
Figure 2). In the case of the electromagnetic field perpendicular to the plane of incidence, we consider that the incident wave (
Ei) comes from medium 1 (air) and on the air-material interface, at point A, is reflected (
R1 wave) and simultaneously, is transmitted (
Et wave) in the material (medium 2).
The absorption of the wave is performed during its passage through medium 2, both before and after total reflection on the reflective support, at point B. By returning to the interface air–material, at point C, both reflection in material (medium 2) and transmission in air (medium 1) of the wave (see
Figure 2) occurs. Similarly, at point C, there will be several internal reflections of the wave in the absorbing medium, followed by its return to medium 1. All reflected waves and re-reflections at the interface air-absorbing material, which reach medium 1 (air) (see
Figure 2), will thus determine the overall reflection coefficient,
Rw, of the absorbing material.
It is known that the modulus of the transmission coefficient,
T, in absorbent material, is defined as the ratio between the complex amplitude of the transmitted wave and the complex amplitude of the incident wave [
21,
26]. At the same time, the reflection (
R) and transmission (
T) coefficients at the air-material interface are related by the relation,
T +
R = 1 [
21]. Keeping these definitions in mind, both the wave reflected and transmitted through the material at point A can be written mathematically with the relations:
where, with
ER1(A) and
Et(A), are the reflected and transmitted wave, respectively, at point A (see
Figure 2).
The
Et(A) wave travels through the absorbent material and will arrive, attenuated at point B on the total reflective metallic support, and is then reflected. As a result,
Due to the total reflection on the reflective metallic support, the reflected wave,
Er2(B) =
Ei2(B), will then travel through the absorbing material (medium 2) and will arrive attenuated at point C (
Ei3(C) wave), on the air-absorbing material incident surface (see
Figure 2);
Ei3(C) being expressed by the relation:
where Equation (13) was considered.
At point C, the incident wave
Ei3(C) will be reflected in medium 2 and at the same time will be transmitted in medium 1 (air) (
Figure 2). On incident surface at the point C, the transmission coefficient T, will be the same as at point A, so that the following relation can be written for the transmitted wave
Et3(C):
Considering relation (14), Equation (15) becomes:
Following the same reasoning, we determined the expressions of the re-reflected waves in medium 1 (air), T5, T7, T9,…… (see
Figure 2). Result:
As a result, on the incident surface (air-absorbent material), after the repeated passes of the wave through the material and returning to medium 1 (air), the following relation can be written:
where,
represents the sum of all reflected waves and re-reflections from medium 1, after the electromagnetic wave has been totally reflected an infinite number of times, on the metal support by passing through the absorbing medium. Considering relations (12), (14), (17)–(21), the overall reflection coefficient
Rw, at normal incidence is given by the following equation:
Unlike other papers [
27,
28], relation (22) represents an equation that allows a much more precise determination of the overall reflection coefficient
Rw, at the normal incidence, which takes into account the multiple total reflections of the electromagnetic wave on the reflective metal support, when the wave passes through absorbent material, being valid for any material/composite system that has electromagnetic wave absorption properties.
4. Results and Discussion
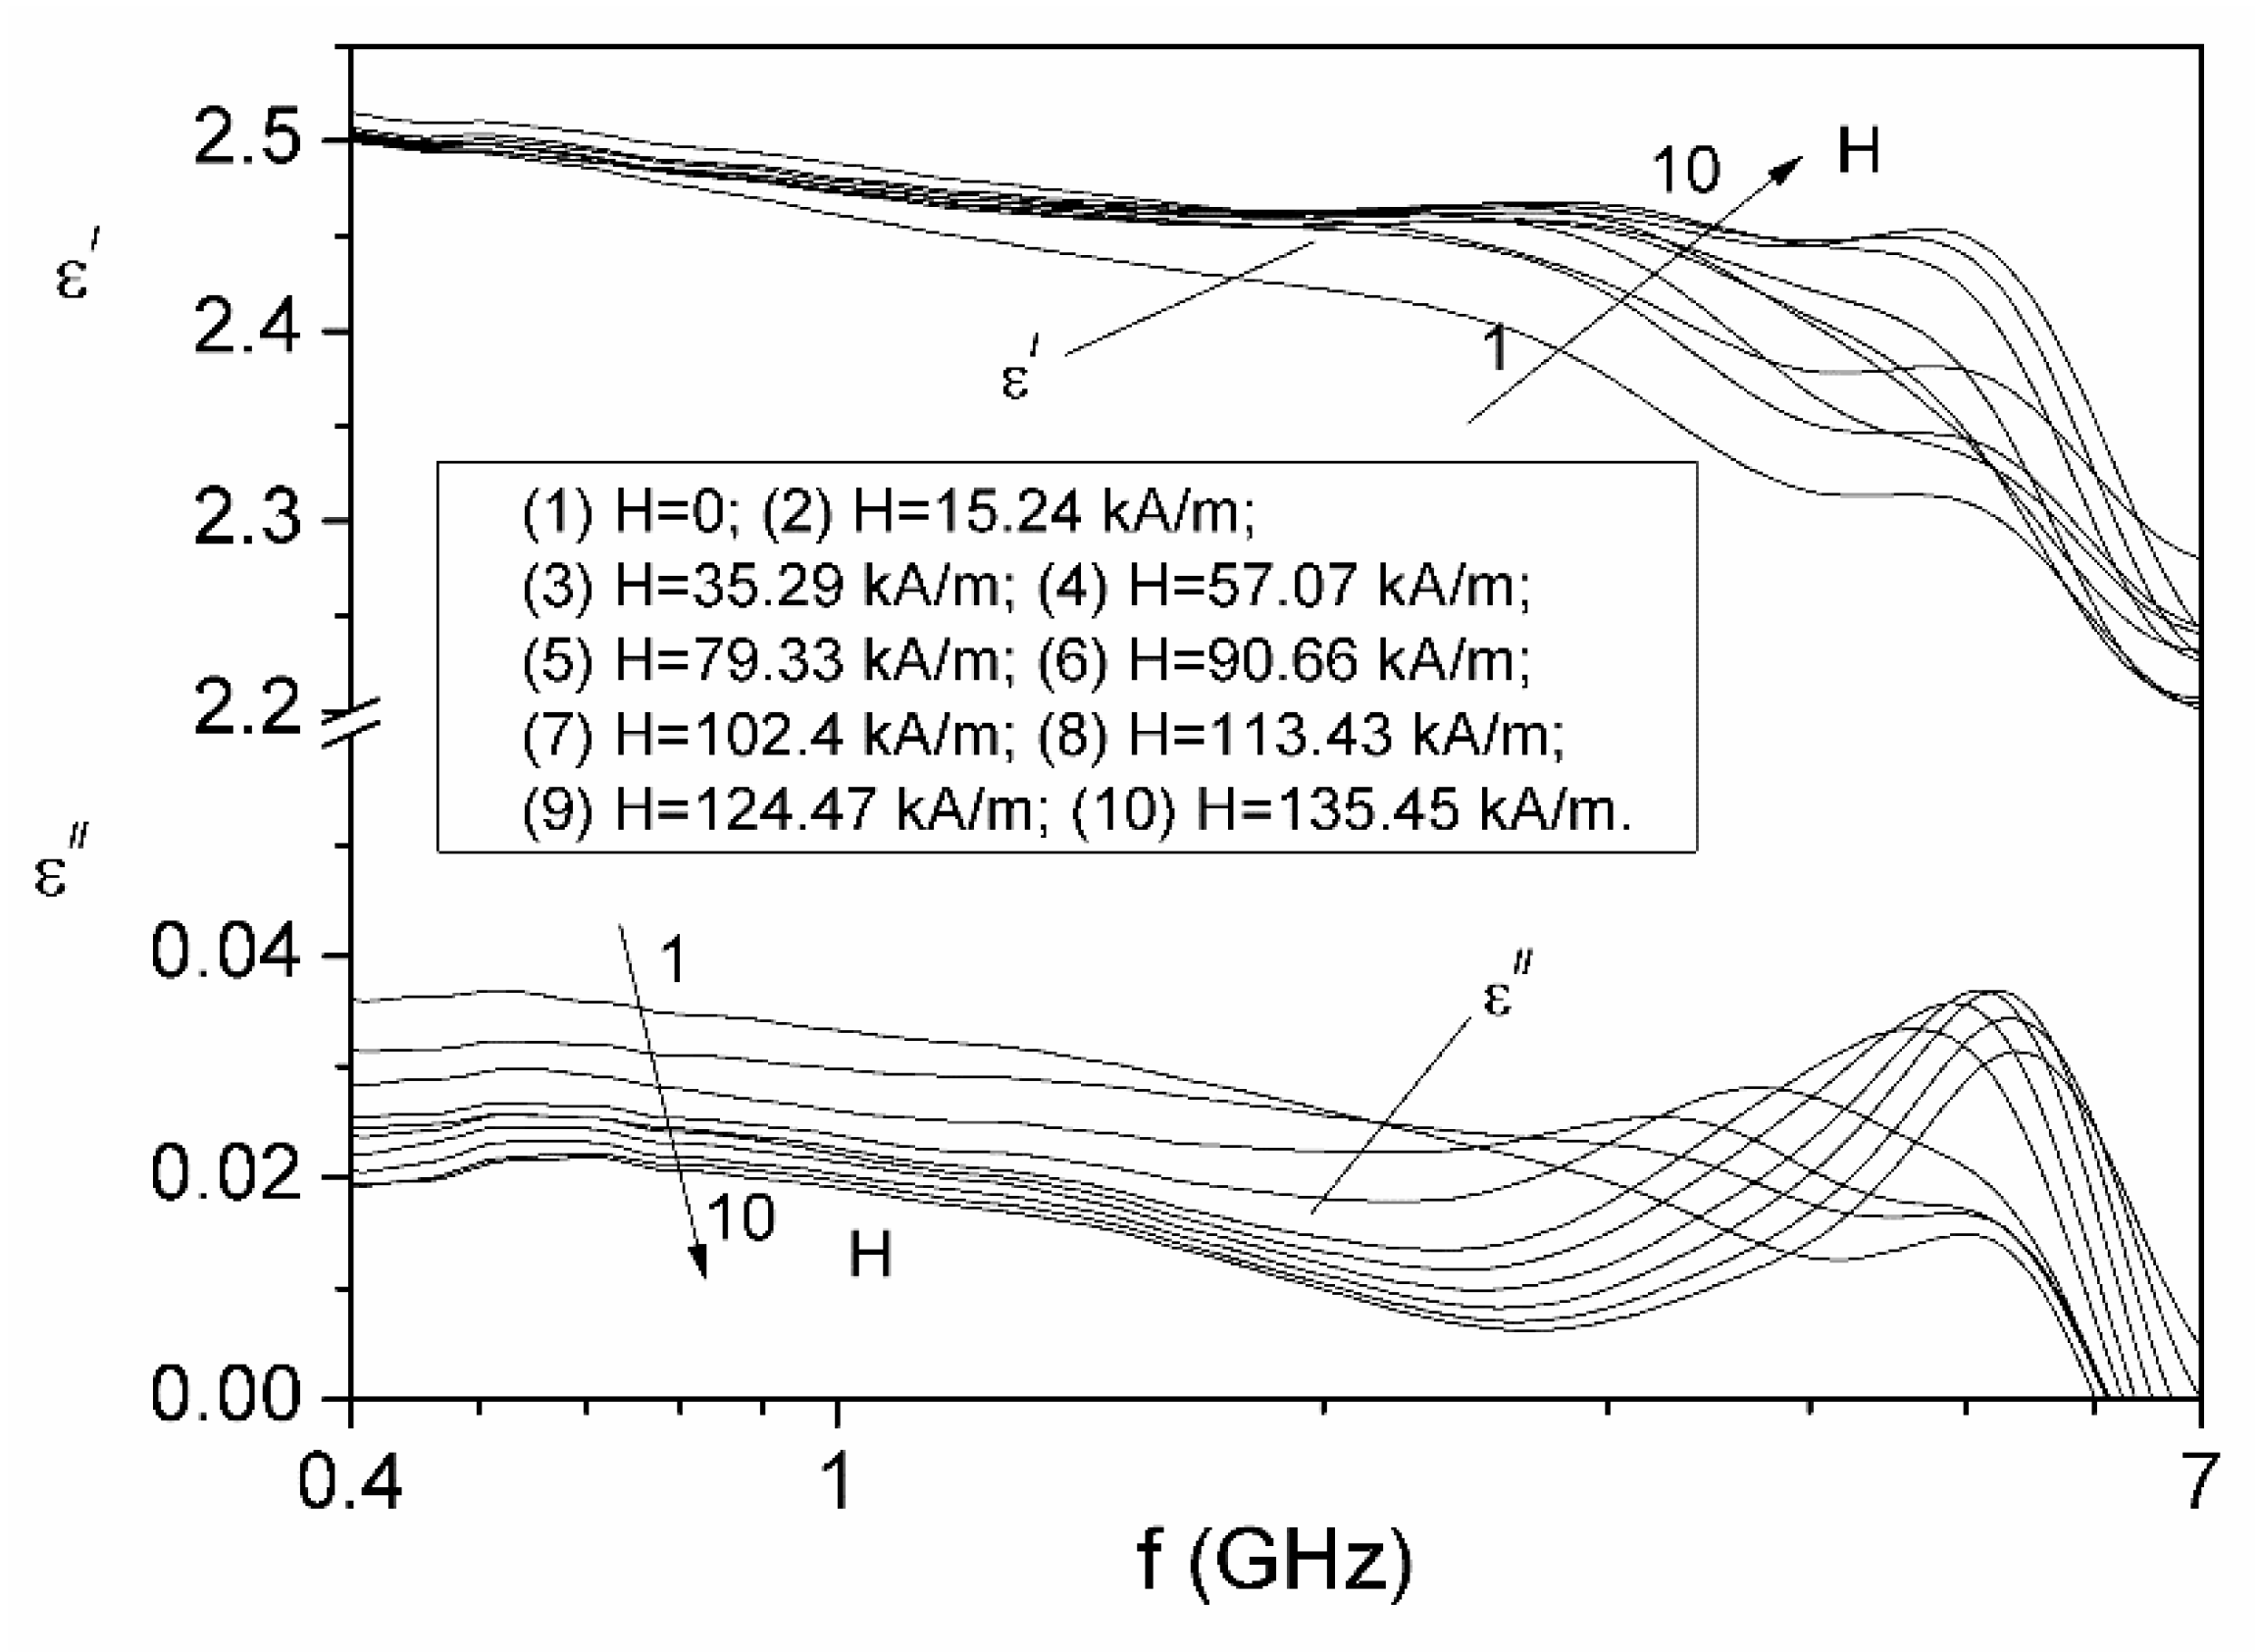
Figure 4 shows the dependence on frequency
f, and magnetic field
H, of the components
ε′(
f,
H) and
ε″(
f,
H) of the complex dielectric permittivity and
Figure 5 shows the dependence on frequency
f and magnetic field
H of the components of
μ′(
f,
H) and
μ″(
f,
H) of the complex magnetic permeability of the investigated ferrofluid sample.
As can be seen from
Figure 4, for a constant frequency
f, the real component
ε′(
f) increases between (2.2–2.5) with increasing
H, and the imaginary component
ε″(
f) decreases with the increase in
H. At the same time,
ε″(
f) displays a maximum in the frequency range between (3–5) GHz, for each
H value of the magnetic polarizing field, which indicates a relaxation process attributed to the interfacial polarization mechanism [
34]. Also, the maximum amplitude of the imaginary component
ε″(
f), of the complex dielectric permittivity increases with the magnetic field for the first seven values of
H, and then, for the next 3 values, it decreases with
H, this behavior being characteristic of the formation of the particle agglomerations in the ferrofluid sample [
35].
From
Figure 5, it is observed that the investigated ferrofluid sample presents the ferromagnetic resonance phenomenon, highlighted by the transition of the real part of the complex magnetic permeability,
μ′(
f), from a superaunit value to a subunit value at the resonant frequency,
fres [
8,
33]. By increasing the polarizing magnetic field
H, the
fres frequency moves to higher values from 1.245 GHz (for
H = 0) to 6.170 GHz (at
H = 135.45 kA/m). At the same time, from
Figure 5 it is observed that the imaginary component,
μ″(
f), has a maximum at the frequency
fmax, very close to the
fres frequency, named the maximum absorption frequency, which moves to higher values with increasing
H, from 0.942 GHz (for
H = 0) to 6.048 GHz (for
H = 135.45 kA/m).
Knowing the values of the
fres, corresponding to each
H value, from
Figure 5, we were able to obtain the dependence of
fres on
H, which is linear, as can be seen in
Figure 6, being in accordance with Equation (2).
By fitting with a straight line, the experimental dependence
fres(
H) from
Figure 6, and using Equation (2), we were able to determine the anisotropy field
HA and the gyromagnetic ratio of the particle
γ; the values obtained being:
HA = 38.75 kA/m and
γ = 2.25 × 10
5 s
−1A
−1m. From Equation (1), we determine that the effective anisotropy constant,
Keff = 1.16 × 10
4 J/m
3, which agrees with the values obtained in the literature [
36,
37] for magnetite particles. Taking into account both the value obtained for
γ, and the relation (3) valid for high values of the magnetic field
H >
HA, we were able to determine the damping parameter of the Landau–Lifshitz equation
αL, and using the value
g = 2, specific to a kerosene-based ferrofluid with magnetite particles [
5,
8,
33], we obtained the value,
αL = 0.194. As shown in the paper [
38], high values obtained for the
αL parameter (
αL > 0.1) can be due either to the polydispersity of the nanoparticle systems [
39], or to the interactions between the particles [
40], in presence of a high polarizing magnetic field.
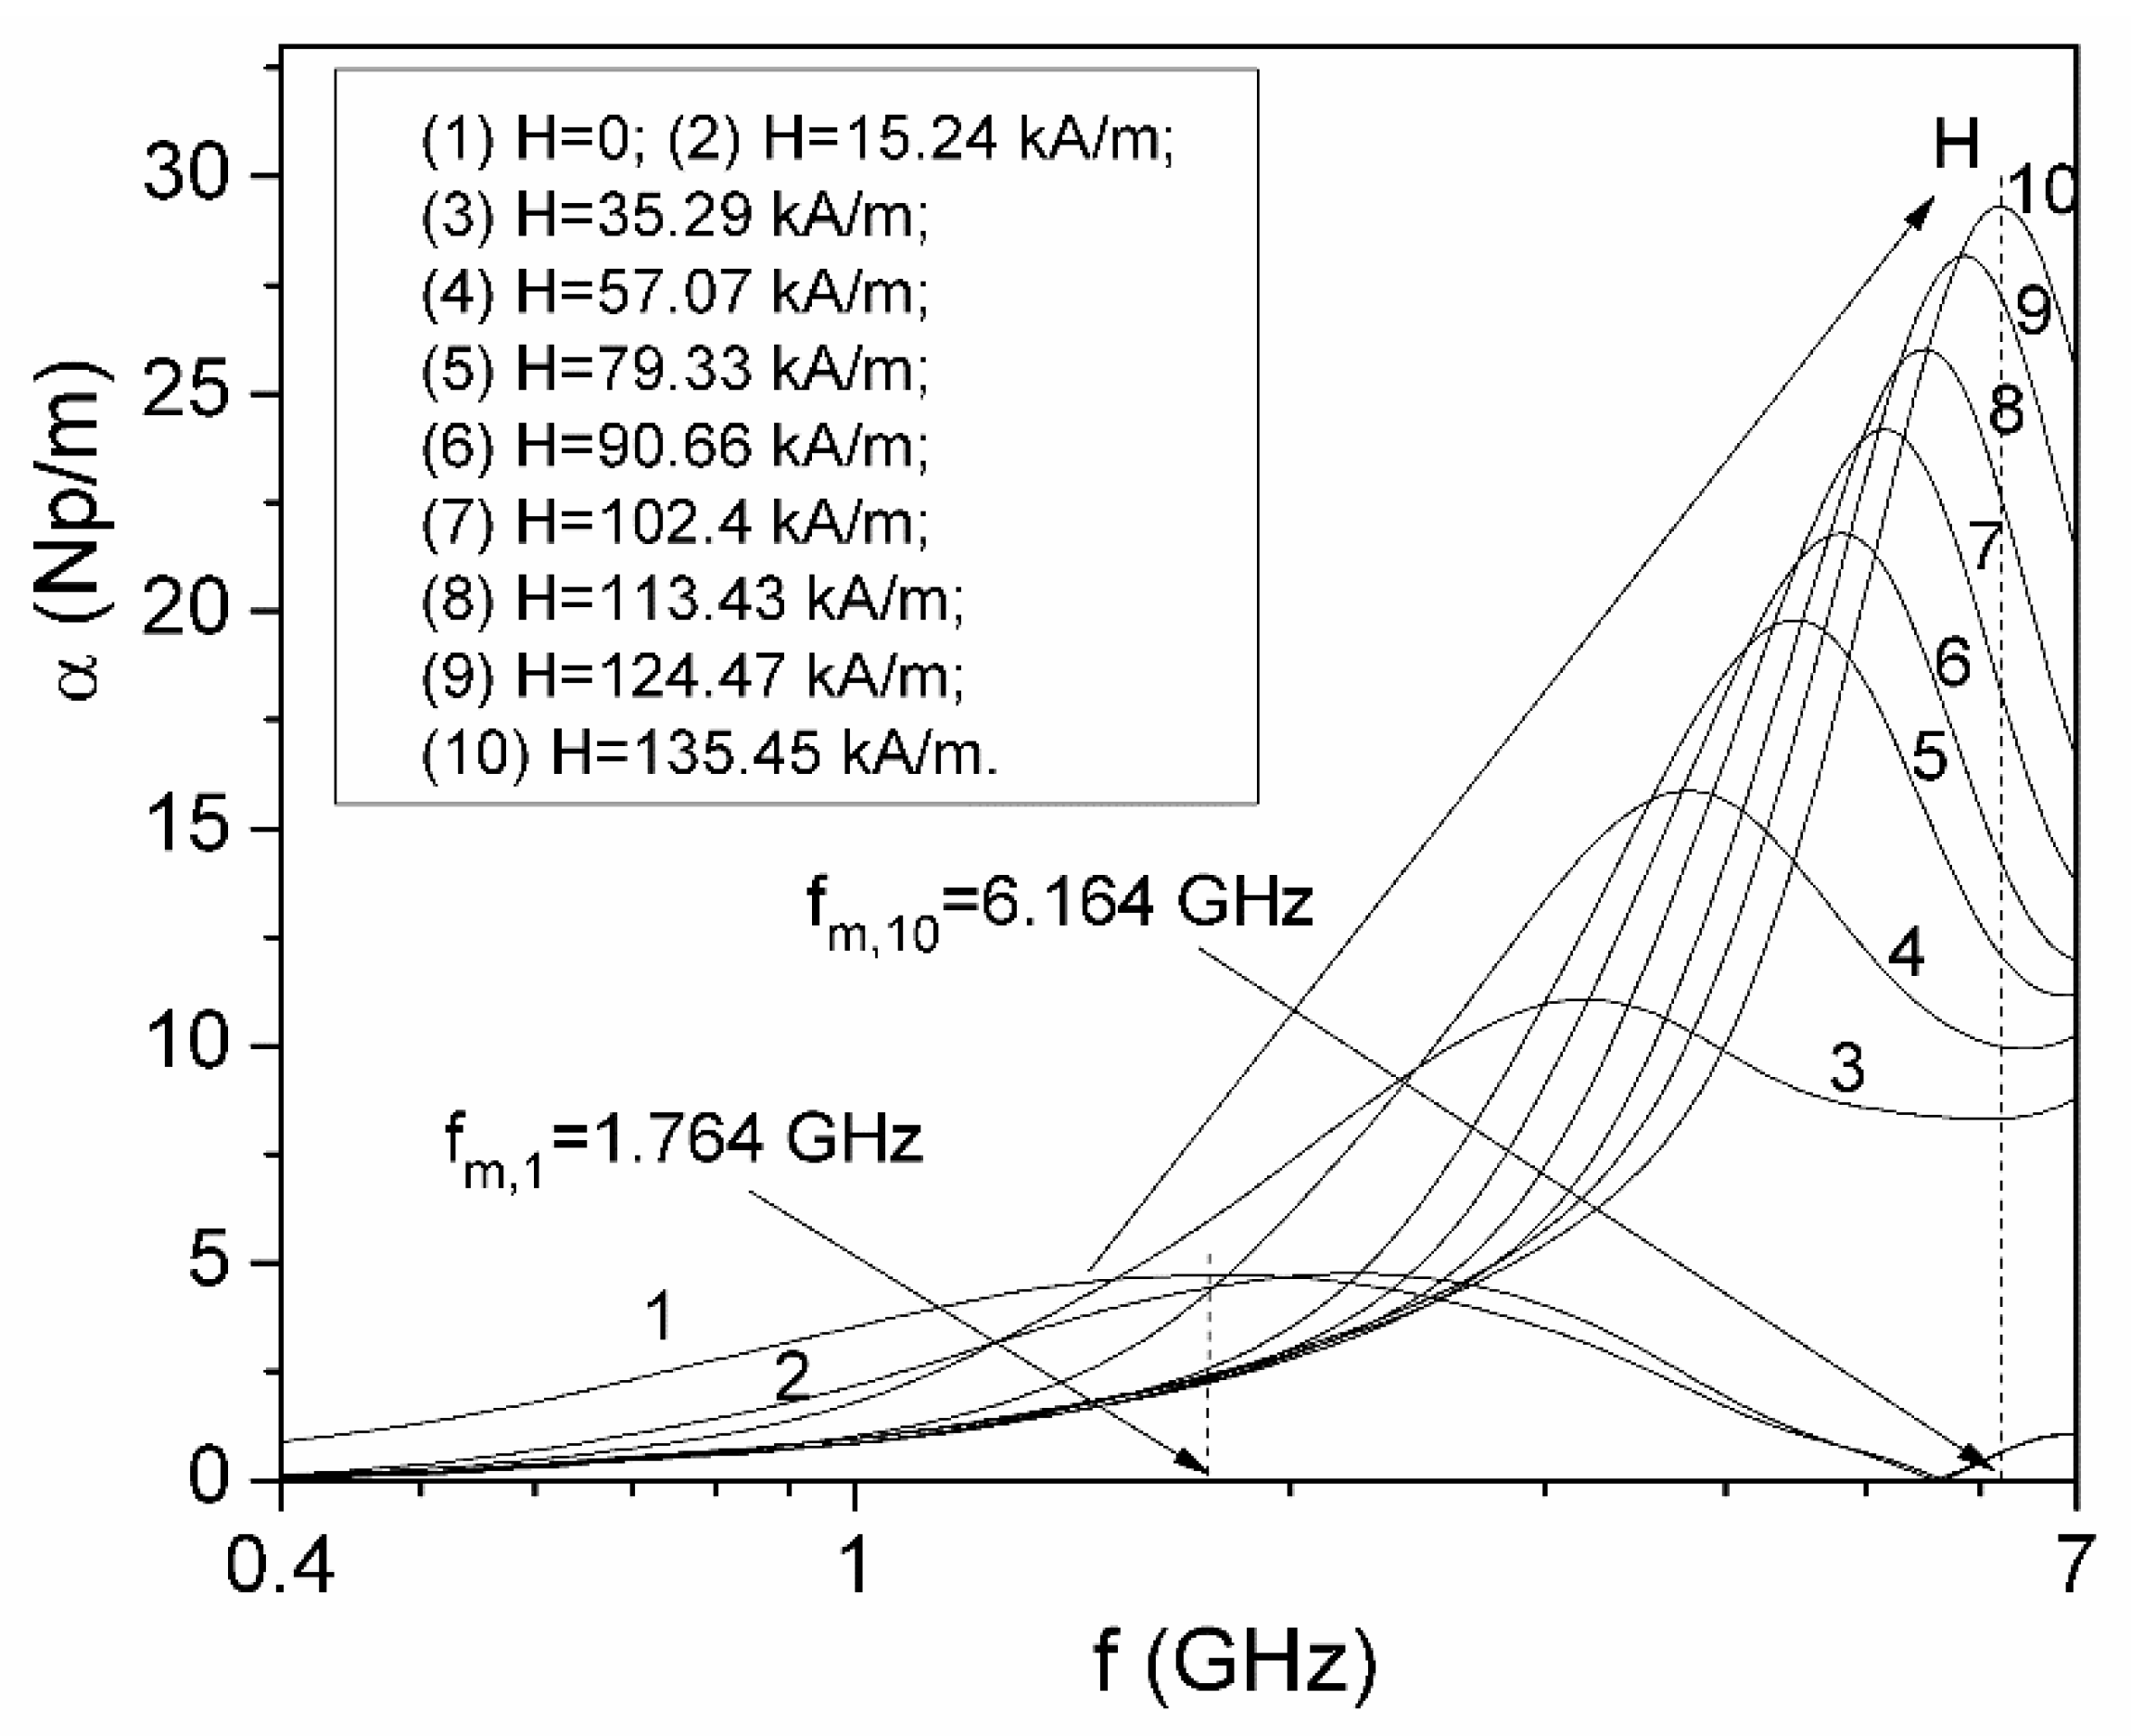
Based on the experimental values obtained for
ε′(
f,
H) and
ε″(
f,
H) (
Figure 4) and components
μ′(
f,
H) and
μ″(
f,
H) (
Figure 5), the frequency dependence of the attenuation constant of the electromagnetic wave,
α(
f) at different values of magnetic field
H, was computed using Equation (6). The results are presented in
Figure 7.
From
Figure 7 it is observed that the attenuation constant
α, at microwave frequencies in a ferrofluid sample, has a maximum at a frequency
fm,1, …,
fm,10, for each value of
H, which shifts from 1.764 GHz (for
H = 0) to 6.164 GHz (for
H = 135.45 kA/m). For frequencies less than 1.764 GHz, the attenuation constant
α decreases with increasing
H. For values of the magnetic field
H between 0 and 135.45 kA/m, for a frequency greater than 6 GHz,
α increases with increasing
H. For other
H values of the magnetic field, another frequency range can be established, for which α increases with increasing
H.
Figure 8 shows the dependence of
α, on
H, at four frequencies,
f, of the electromagnetic field, in the range (1–6) GHz. From
Figure 8 it is observed that α presents a maximum at a value of
Hmax, which moves to higher values from 40 kA/m (at
f = 2 GHz) to 109 kA/m (at
f = 5 GHz), over the frequency range of (1.764–6) GHz. Also, for
H >
Hmax,
α decreases with increasing
H (
Figure 8). This result is very useful in magnetically controlled electromagnetic absorbers applications because it provides information on the maximum limit of the magnetic field applied for control of
α, at different frequencies.
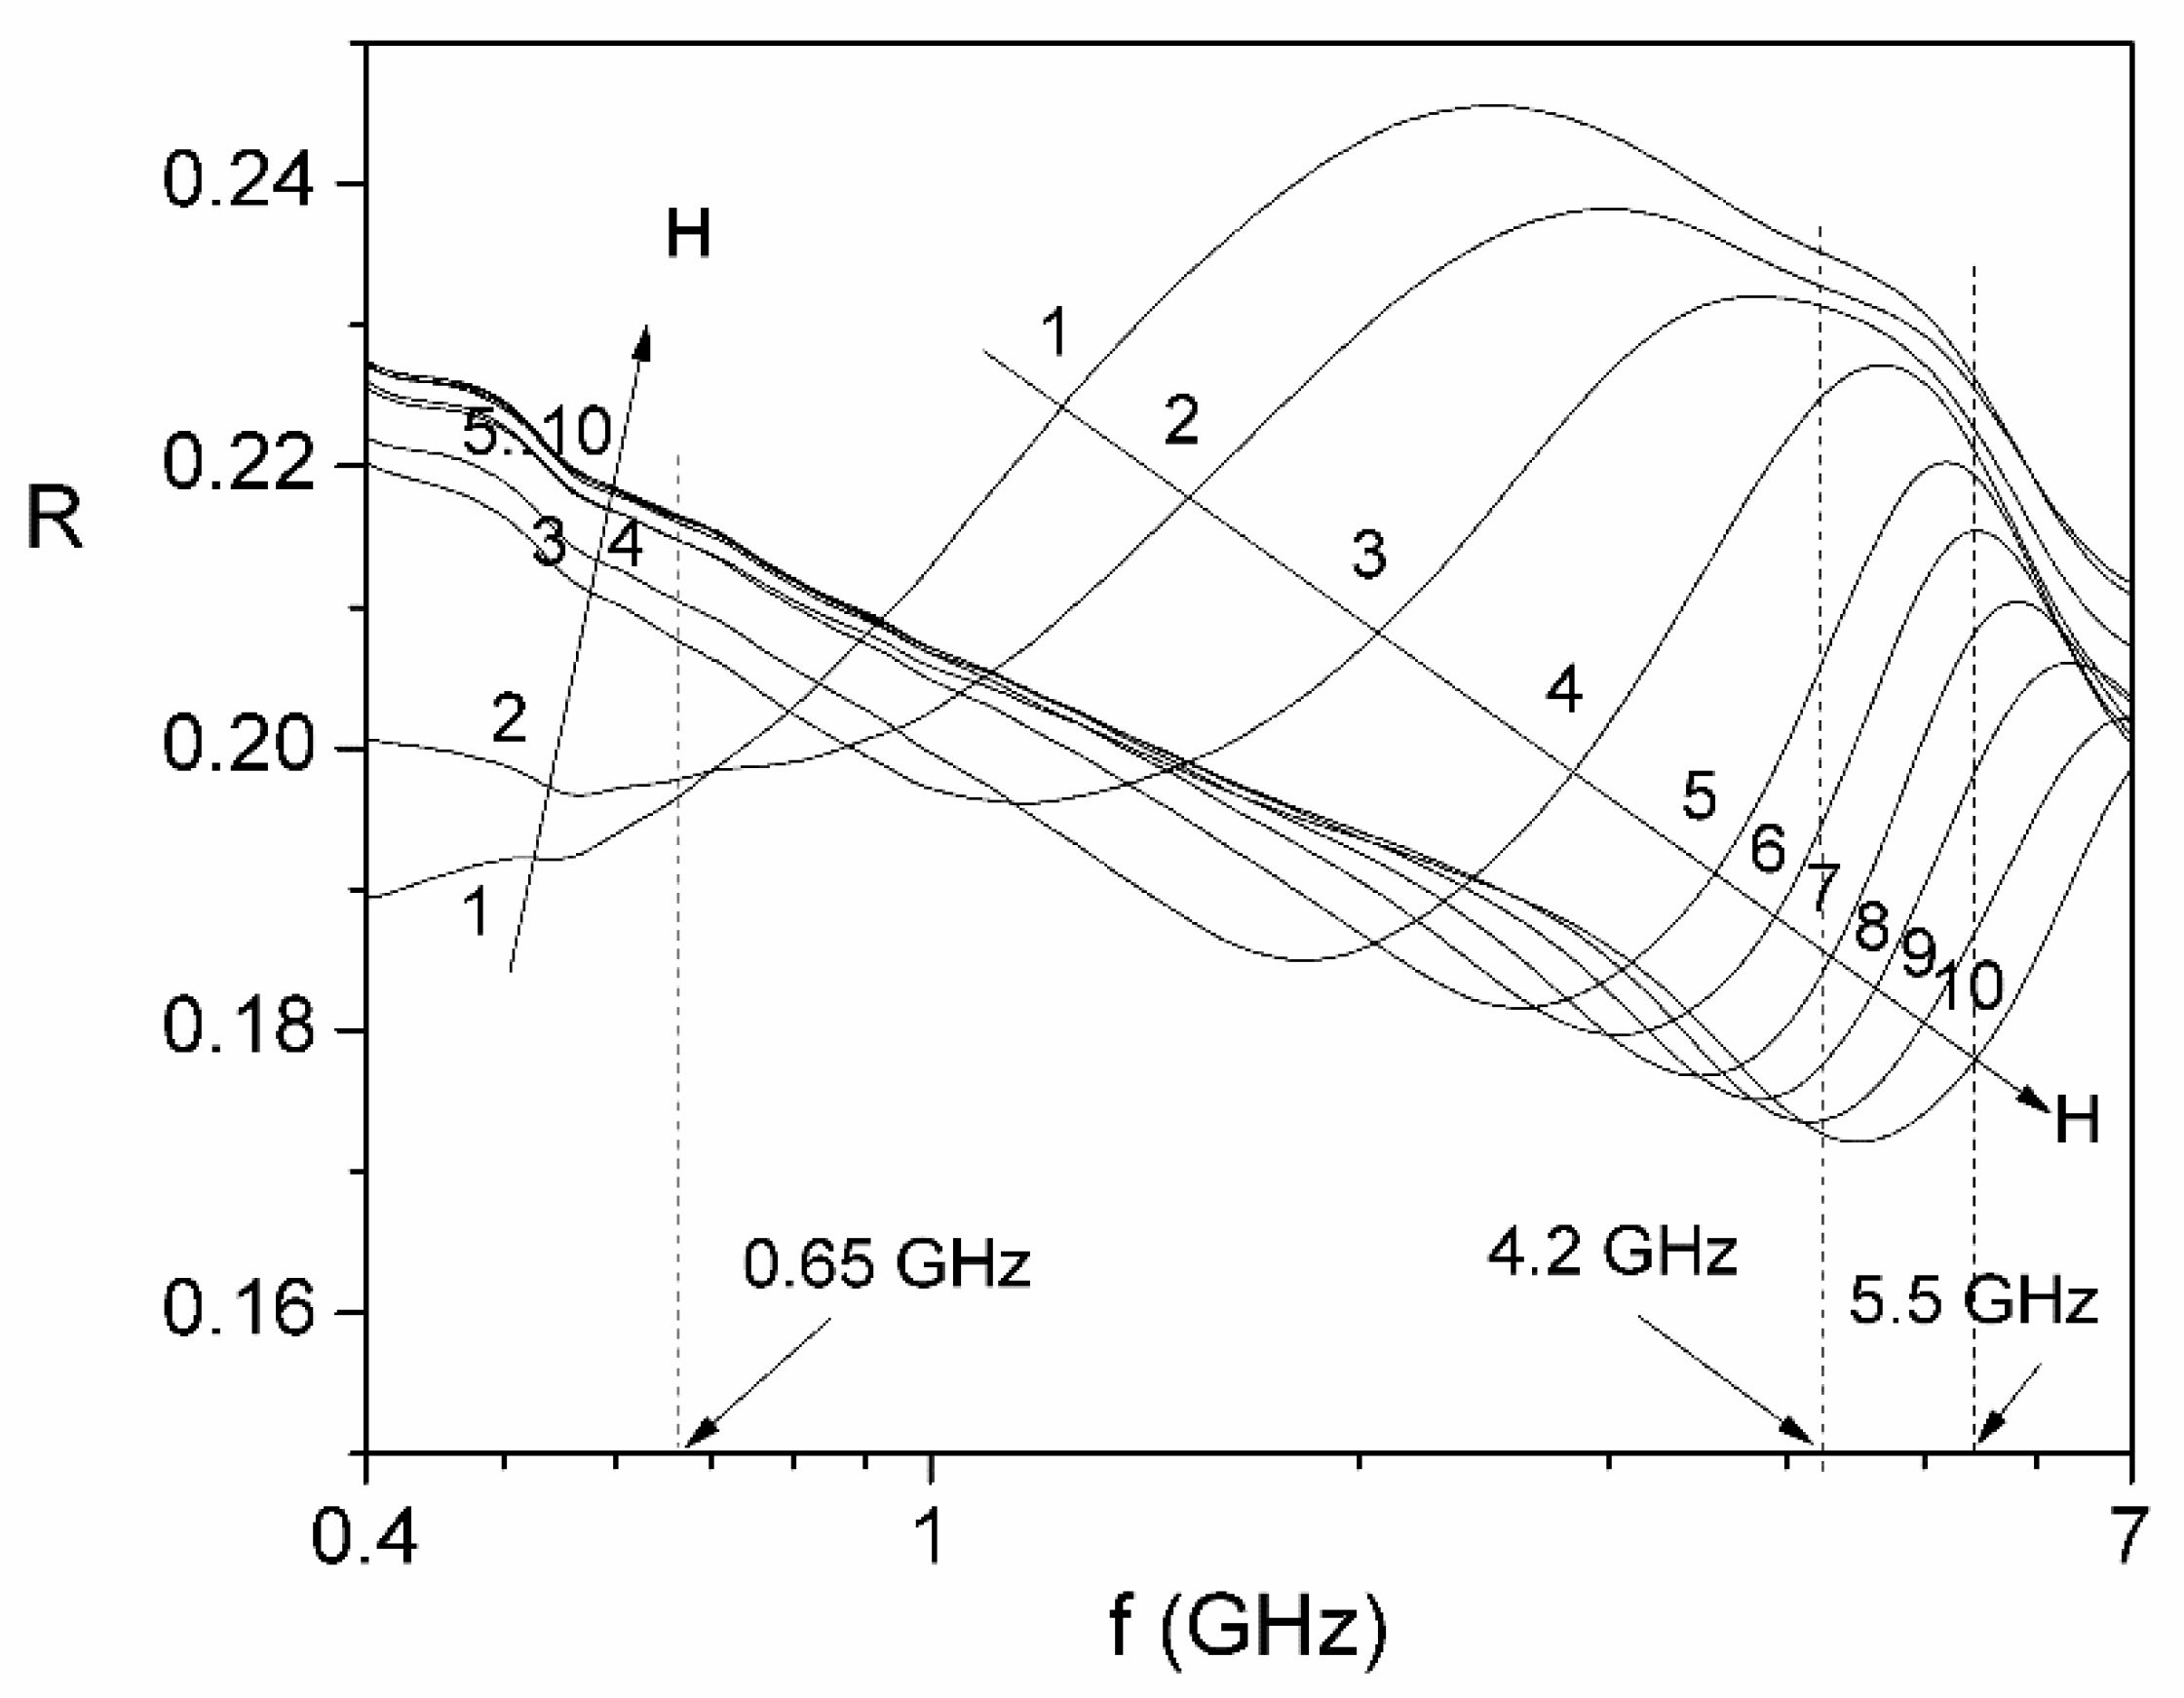
Using Equations (8) and (10) and experimental values of the components
ε′(
f,
H) and
ε″(
f,
H) of (
Figure 4) and components
μ′(
f,
H) and
μ″(
f,
H) of (
Figure 5), the frequency dependence of the reflection coefficient at the interface air-ferrofluid,
R, at different values of magnetic field
H, was computed and the results are presented in
Figure 9.
As can be seen from
Figure 9, for the reflection coefficient at the interface air–ferrofluid for normal incidence
R(
f,
H), two regions of interest for applications are distinguished: the first region corresponding to frequencies lower than 0.65 GHz when
R(
f,
H) increases with the increase in the
H field and the second region in the domain of ferromagnetic resonance (4.2–5.5 GHz), in which
R(
f,
H) decreases with the increase in
H. Knowing the values of
R(
f,
H) at the interface air–ferrofluid for normal incidence (
Figure 9) and the attenuation constant
α(
f,
H) at microwaves in ferrofluid sample (
Figure 7), based on Equation (22) we calculated the overall reflection coefficient
Rw(
f,
H) for 3 values of the thickness
d of the ferrofluid sample: 2 mm, 5 mm and 10 mm. For the third term in Equation (22), in
Reff’s calculation, we considered only the terms corresponding to
k = 1 and
k = 2, because for
, the calculated values decrease very quickly, tending towards zero, being thus negligible. The calculation relations for the third term in Equation (22) corresponding to the values
k = 1, 2, 3, 4 are as follows:
In
Table 1, the values computed with relations (23)–(26), for
k = 1, 2, 3, 4 corresponding to the frequencies of 2 GHz, 4 GHz and 5 GHz, both in zero field (
H = 0) and in the presence of the magnetic field (
H = 135.45 kA/m), are listed, for the three considered thicknesses
d of the sample.
From
Table 1 it can be seen that the terms
T3(3) and
T3(4), corresponding to
k = 3 and
k = 4, respectively, are much smaller than the terms
T3(1) and
T3(2), corresponding to
k = 1 and, respectively
k = 2, for all frequencies
f and all thicknesses
d considered, of the sample, both in the zero field and in the presence of the
H field. At the same time, as the thickness of the sample
d increases, the value of the terms
T3(3) and
T3(4), becomes very small close to zero, so that the contribution to the calculation of the
Reff parameter, with Equation (22) of all terms starting with
k ≥ 3, was neglected.
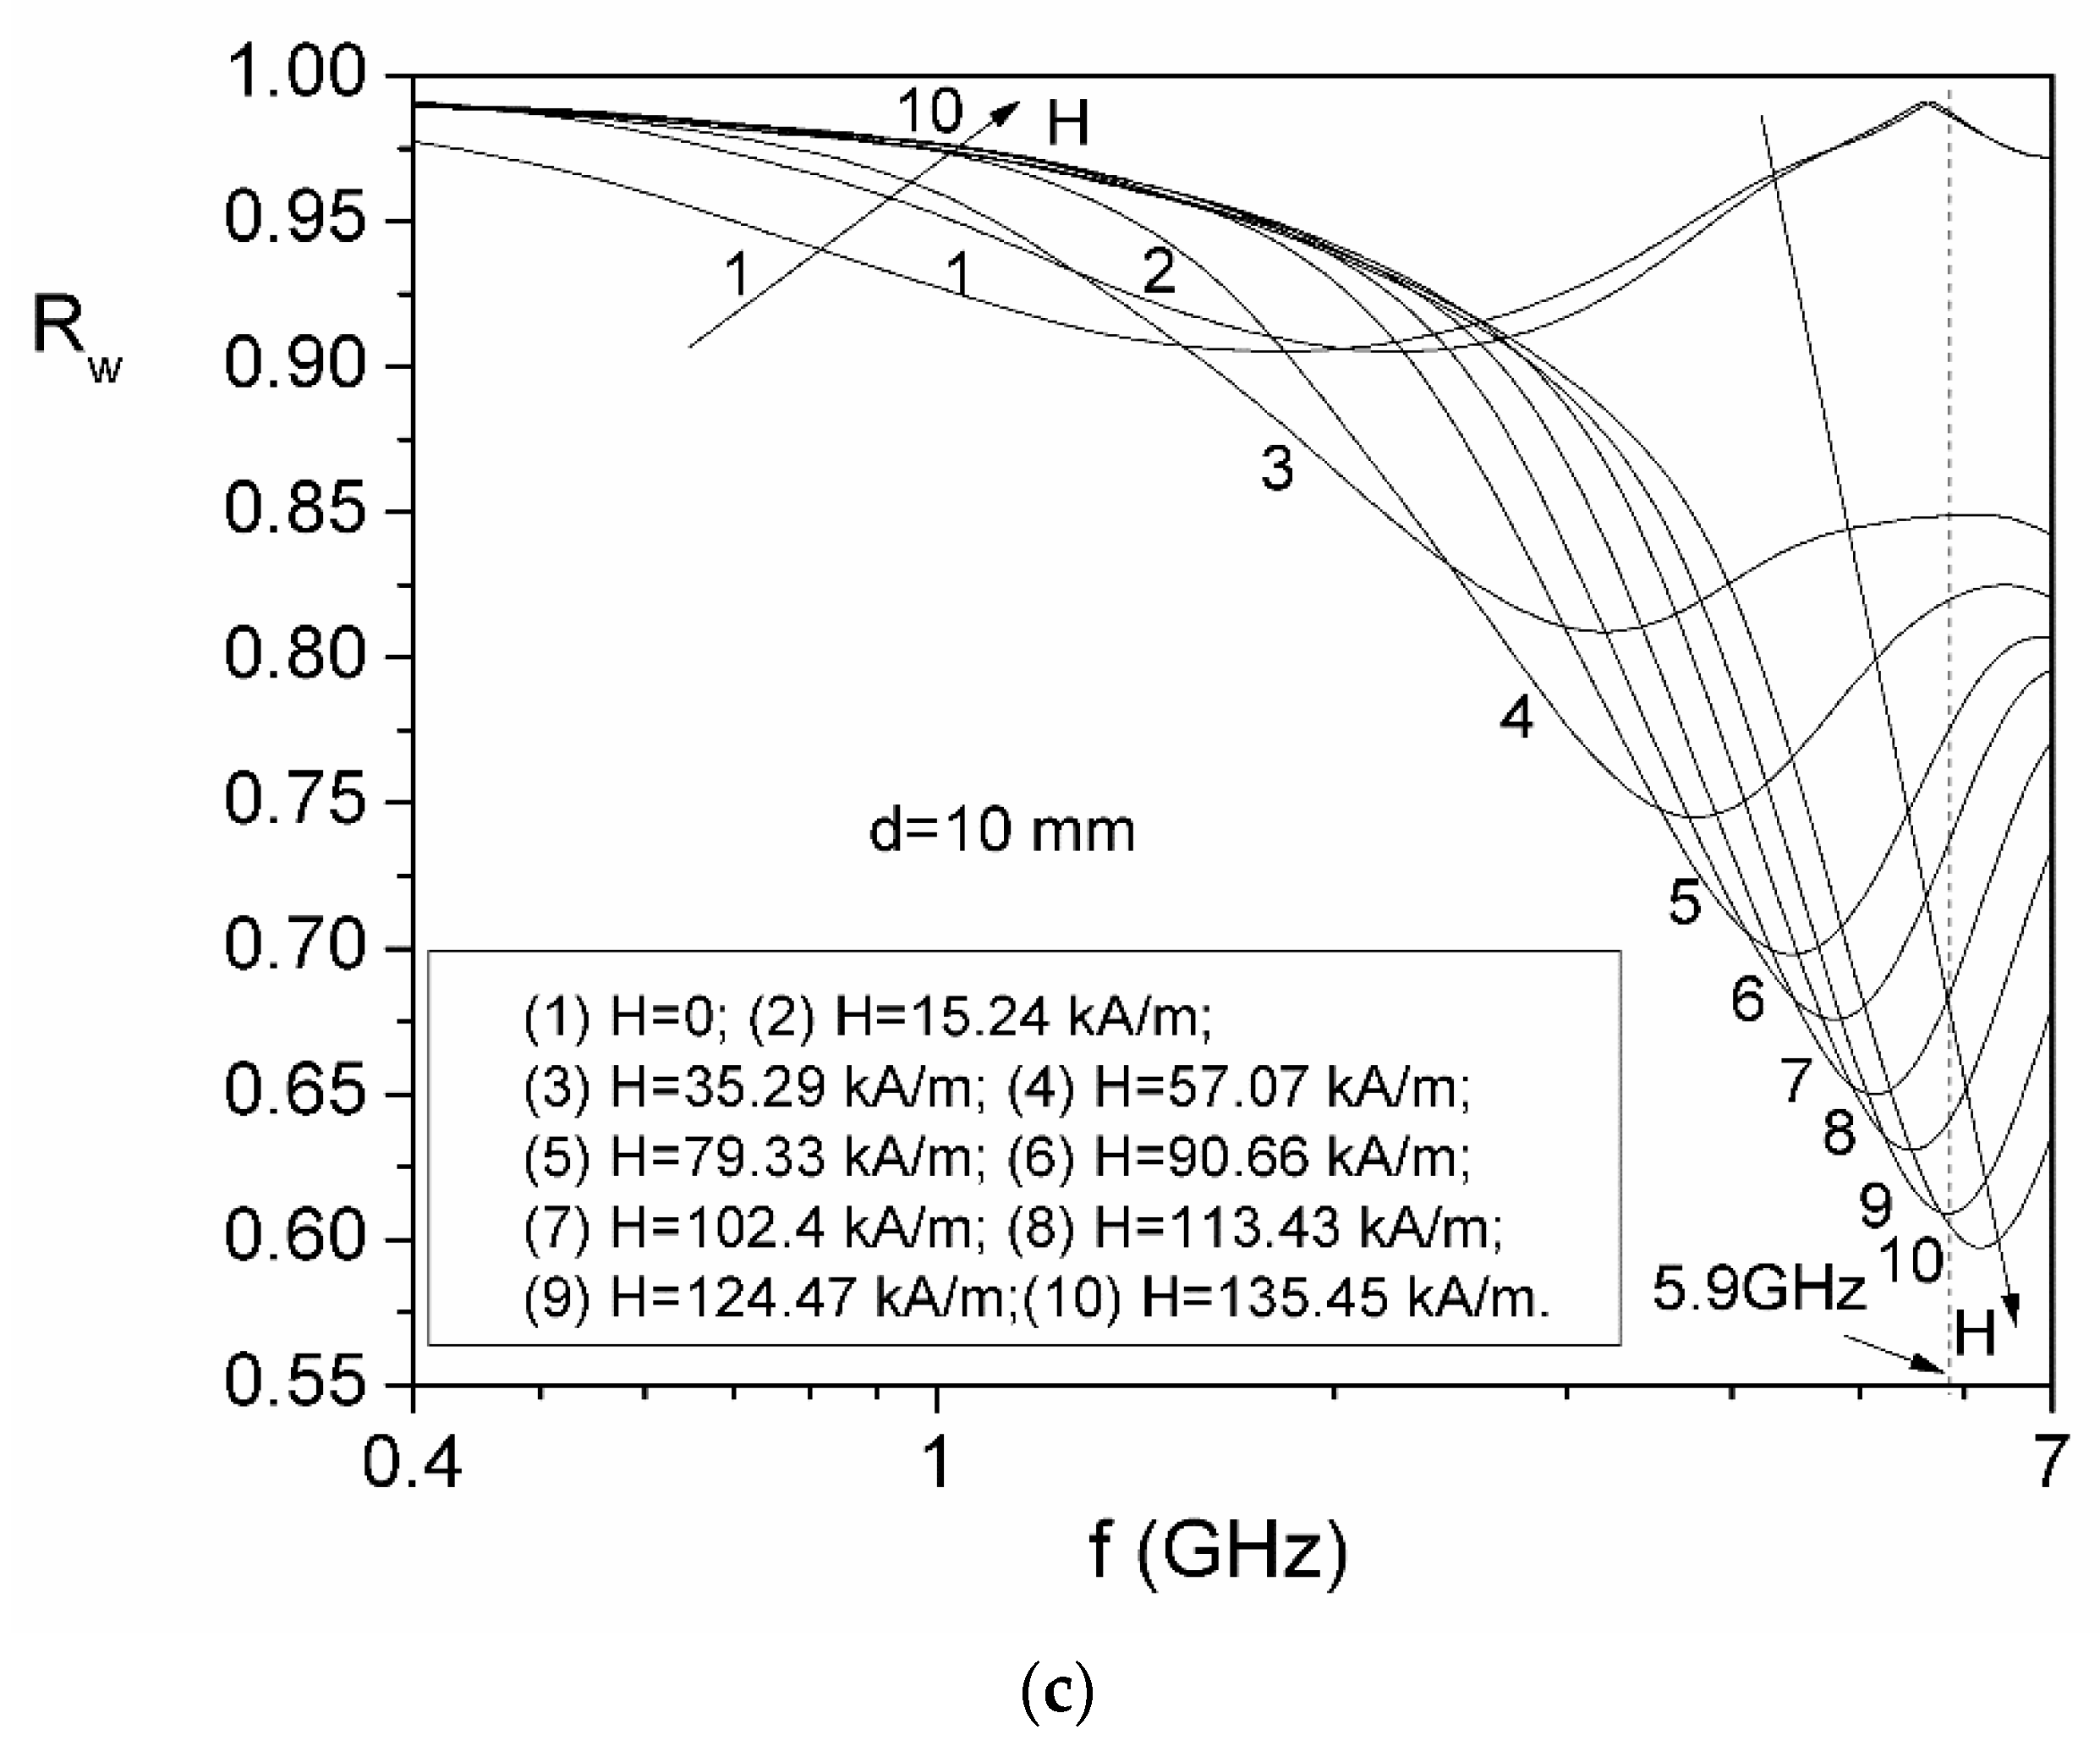
Based on the computations, the overall reflection coefficient
Rw, for 3 values of the thickness
d of the ferrofluid sample, 2 mm, 5 mm and 10 mm, the frequency and magnetic field dependencies of the overall reflection coefficient,
Rw(
f,
H), of the ferrofluid deposited on a totally reflective support, for normal incidence, are presented in
Figure 10a–c.
From
Figure 10, it can be observed that for all three thicknesses
d of the investigated ferrofluid sample, the coefficient
Rw(
f,
H) decreases with the increase in the magnetic field at frequencies higher than 5.9 GHz, while at frequencies below approximately 1 GHz, the overall reflection coefficient,
Rw(
f,
H) increases with increasing
H.
Figure 11 shows the dependence of the overall reflection coefficient
Rw, on the magnetic field
H, at three frequencies,
f, of the electromagnetic field, in the range (1–6) GHz, for the three considered thicknesses
d of the ferrofluid sample deposited on a totally reflective support, for normal incidence.
For each frequency
f, of the electromagnetic field (2 GHz, 4 GHz and 5 GHz), from
Figure 11 it can be observed that with increasing magnetic field,
H, the overall reflection coefficient
Rw presents a minimum that is accentuated by increasing the thickness
d, of the ferrofluid sample. Thus, at
f = 2 GHz, the minimum of
Rw appears at the same value of the polarizing magnetic field,
Hmin(2GHz) = 40 kA/m, decreasing from the value 0.93 (for
d = 2 mm) to 0.87 (for
d = 10 mm), while at
f = 5 GHz the minimum of
Rw appears at the constant value of the field,
Hmin(5GHz) = 109 kA/m, decreasing from the value 0.90 (for
d = 2 mm) to 0.64 (for
d = 10 mm) (see
Figure 11). At the same time, for
H >
Hmin, but very close to
Hmin, R
w increases with increasing
H (
Figure 11)), for any value
d of the sample thickness. As a result, obtaining a value as low as possible for the overall reflection coefficient
Rw, indicates that the investigated material is a good absorber of the electromagnetic wave. The obtained result is useful in the study of some materials/composite systems with possible absorbing properties in microwaves, by determination of the overall reflection coefficient
Rw(
f,
H) controlled both by the thickness
d of the absorber and by the external field
H applied, at different frequencies from the range (1–6) GHz.
5. Conclusions
Based on the complex magnetic permeability and complex dielectric permittivity measurements in the microwave frequency range (0.4–7) GHz and in presence of a polarizing magnetic field, H of (0–135) kA/m, for a kerosene-based ferrofluid with magnetite nanoparticles, the ferromagnetic resonance phenomenon was highlighted and the most important propagation parameters of the electromagnetic wave through ferrofluid, were determined: namely the attenuation constant, α(f,H) and the reflection coefficient, R(f,H) at the air-material interface. The dependence α(H) at different frequencies, f, in the range (1–6) GHz shows that the parameter α, presents a maximum at a value of polarizing magnetic field, Hmax, which moves to higher values from 40 kA/m (at f = 2 GHz) to 109 kA/m (at f = 5 GHz), while for H > Hmax, α decreases with increasing H. The obtained result is very important in applications of electromagnetic absorbers because it provides information on the maximum limit of the magnetic field H, for control of attenuation constant α, at different frequencies. Also, in this paper, we defined another parameter, namely the overall reflection coefficient, Rw, of a ferrofluid with thickness d and the attenuation constant α, through which the electromagnetic wave propagates, perpendicular to the incidence plane. For this, we proposed a theoretical model for computing the overall reflection coefficient, Rw(f,H) of a plane wave absorber with a single layer deposited on a perfect conductor, following multiple internal reflections, at the normal incidence of the wave, valid for any material/composite system that has absorbing properties in the microwave range. Using this model, we established for the first time an equation for the computation of Rw(f,H) for 3 values of the thickness d of the ferrofluid sample: 2 mm, 5 mm and 10 mm, which takes into account, the multiple total reflections of the electromagnetic wave on the reflective metal support, when the wave passes through the ferrofluid. The dependence of Rw(H) at different frequencies, f, in the range (1–6) GHz shows that the parameter Rw presents a minimum at a value of polarizing magnetic field, Hmin, which moves to higher values from 40 kA/m (at f = 2 GHz) to 113 kA/m (at f = 5 GHz), for all values d of thickness of sample, while for H > Hmin, Rw increases with increasing H. On the other hand, at a fixed frequency, such as f = 5 GHz, the minimum of Rw decreases from 0.90 (for d = 2 mm) to 0.64 (for d = 10 mm) which shows an increase in the absorption of the electromagnetic wave in the ferrofluid. The obtained results could be applied to any system of superparamagnetic particles located in a solid dielectric matrix, not only to the ferrofluid, being very useful in the use of these materials as electromagnetic absorbers in the microwave range.


