1. Introduction
Hydroponics is a method of growing plants using mineral nutrient liquid solution without soil. The method of application of the nutrient solution to the roots varies widely [
1]. Aquaponics is a method of growing plants hydroponically using nutrients provided from an aquaculture system. Aquaponics makes multiple uses of resources such as water and nutrients [
2,
3]. Hydroponics is an increasingly important field as the demand increases for more food and sustainably produced products [
4]. With urban agriculture on the rise [
5], greenhouses are growing food on rooftops and in decaying buildings and abandoned warehouses [
4]. Hydroponics uses inorganic nutrient fertilizers, while aquaponic treatments rely on fish waste, which has the potential to be at less or more than ideal concentrations for plants. Aquaponics uses fish recirculating waters or mineralized waste discharge to generate the nutrients needed by plants, meaning the nutrient composition is not formulated to exact concentrations and can be less stable [
6]. Growing plants aquaponically uses nutrients that would otherwise be lost from a fish system, which has an added value in marketing to a certain class of consumers. The plants also help filter the fish water and help to reduce nitrate which can be toxic to some fish salmonid species at elevated levels, e.g., greater than 40 mg/L [
3].
The objective of this study was to compare aquaponic and hydroponic spinach yield, and look for differences in leaf surface area and elemental composition between treatments. Two hydroponic treatments were chosen, pH 5.8 and pH 7.0, and one aquaponic treatment was used at pH 7.0, a lower practical limit for fish production. The aquaponic treatment received nutrients from fish recirculating water, with the exception of chelated iron. Fish waste has no available iron in it for plants, since the iron would be in the ferric form. As a result, chelated iron is commonly added to the water of an aquaponic system; the amount of iron being absorbed by the fish directly from the water is considered small and non-harmful [
2].
The solution formula employed for the hydroponic spinach was a formula derived for lettuce by Sonneveld and Straver [
7]. In earlier research, the lettuce formula was as effective at half the concentration recommended by Sonneveld and Straver as at full concentration [
8]. Half strength Sonneveld and Straver solution has an electroconductivity of 1300 microsiemens/cm. Moderately low pH, around 5.8, keeps most ions available in solution while higher pH, around 6.5 and higher, can cause nutrient deprivation because of nutrient precipitation [
9]. The Sonneveld and Straver solution used in this research was originally designed for use with a pH around 5.8, and both Both et al. [
8] and Bugbee [
9] used this pH for lettuce to maximize nutrient availability.
An added constraint in this research was that our aquaponic treatment needed to be kept at the same low root zone temperature as the two hydroponic treatments to combat Pythium
(Pythium aphanadermatum) root disease, which is a major hazard in spinach production. De Villiers et al. [
10] have discussed growing methods and strategies to address this disease, which we employed in our experiment, e.g., low root zone temperature, harvesting after 13 days in channel water, and spraying 70% ethanol on all potentially contaminated surfaces during planting and solution sampling.
A major difference of aquaponics compared to hydroponics is its potential for non-uniformity in water nutrient conditions; the system does not have a fixed nutrient composition, and is reliant upon the fish water to provide all nutrients at all times with the exception of chelated iron. This non-uniformity is possibly one of the reasons that aquaponics sometimes has had lower yields than hydroponics [
11]. Nutrient levels are highly dependent on the fish activity, fish number, and fish species [
12,
13]. Even if the fish waste provides adequate nutrients to successfully grow high yielding plants, the hydrodynamics of the aquaponics system flow can be detrimental to the plant side of the system. For example, the flow rate and rate of recirculation in the system can reduce yield if they are too slow or too fast which causes root stress [
14]. The overall objective of this study was to compare yields in an aquaponics system (A7) to yields obtained from a conventional hydroponics system at pH 5.8 (H5). A hydroponic condition of pH 7 (H7) was also included for comparison to other research and possibly help explain any differences detected between H5 and A7.
2. Materials and Methods
Seeds were germinated at high humidity in a temperature controlled growth chamber for three days (additional details of growth chamber provided below). After germination, flats of spinach were grown for 13 additional days using deep-flow troughs/channels housed in a conventional glass greenhouse under three different treatments which consisted of three different nutrient solution conditions. Two treatments received hydroponic nutrient inputs, with one treatment at pH 5.8 (referred to as H5) and the other at pH 7.0 (referred to as H7). Reverse osmosis (RO) water was used to make up the nutrient solutions. Growing conditions mimicked conventional deep-flow grow ponds and plants were grown using a modified Sonneveld nutrient solution designed for lettuce (see
2.8. Nutrients). The third treatment was aquaponic (referred to as A7), receiving its nutrients from the aquaculture recirculating water that contained nutrients excreted directly by the fish (nitrogenous waste as ammonia, nitrite or nitrate) or as nutrients being released from the mineralization of waste solids captured by the system bead filter. The only extraneous nutrient added was chelated iron, which was used to raise the initial Fe concentration to 3 mg/L). The aquaponic source water was tap water that was initially high in alkalinity. This carbon filtered water had average macro-elemental contents of 50 mg/L Ca, 13 mg/L Mg, 5.5 mg/L S, and an EC of 450 µS/cm. The concentrations of the makeup water for Ca, Mg and S varied slightly seasonally. Adjustments in pH were initially made to achieve target values and then made daily by adding 1 M K
2CO
3 to the aquaponic system or 1 M KOH to the hydroponic systems. Prior to the experiment, initial pH adjustments were made using HNO
3 or the treatment's respective base as just mentioned. Initial and final water elemental values for the nutrient growing conditions are given in
Table 7 for all three treatments.
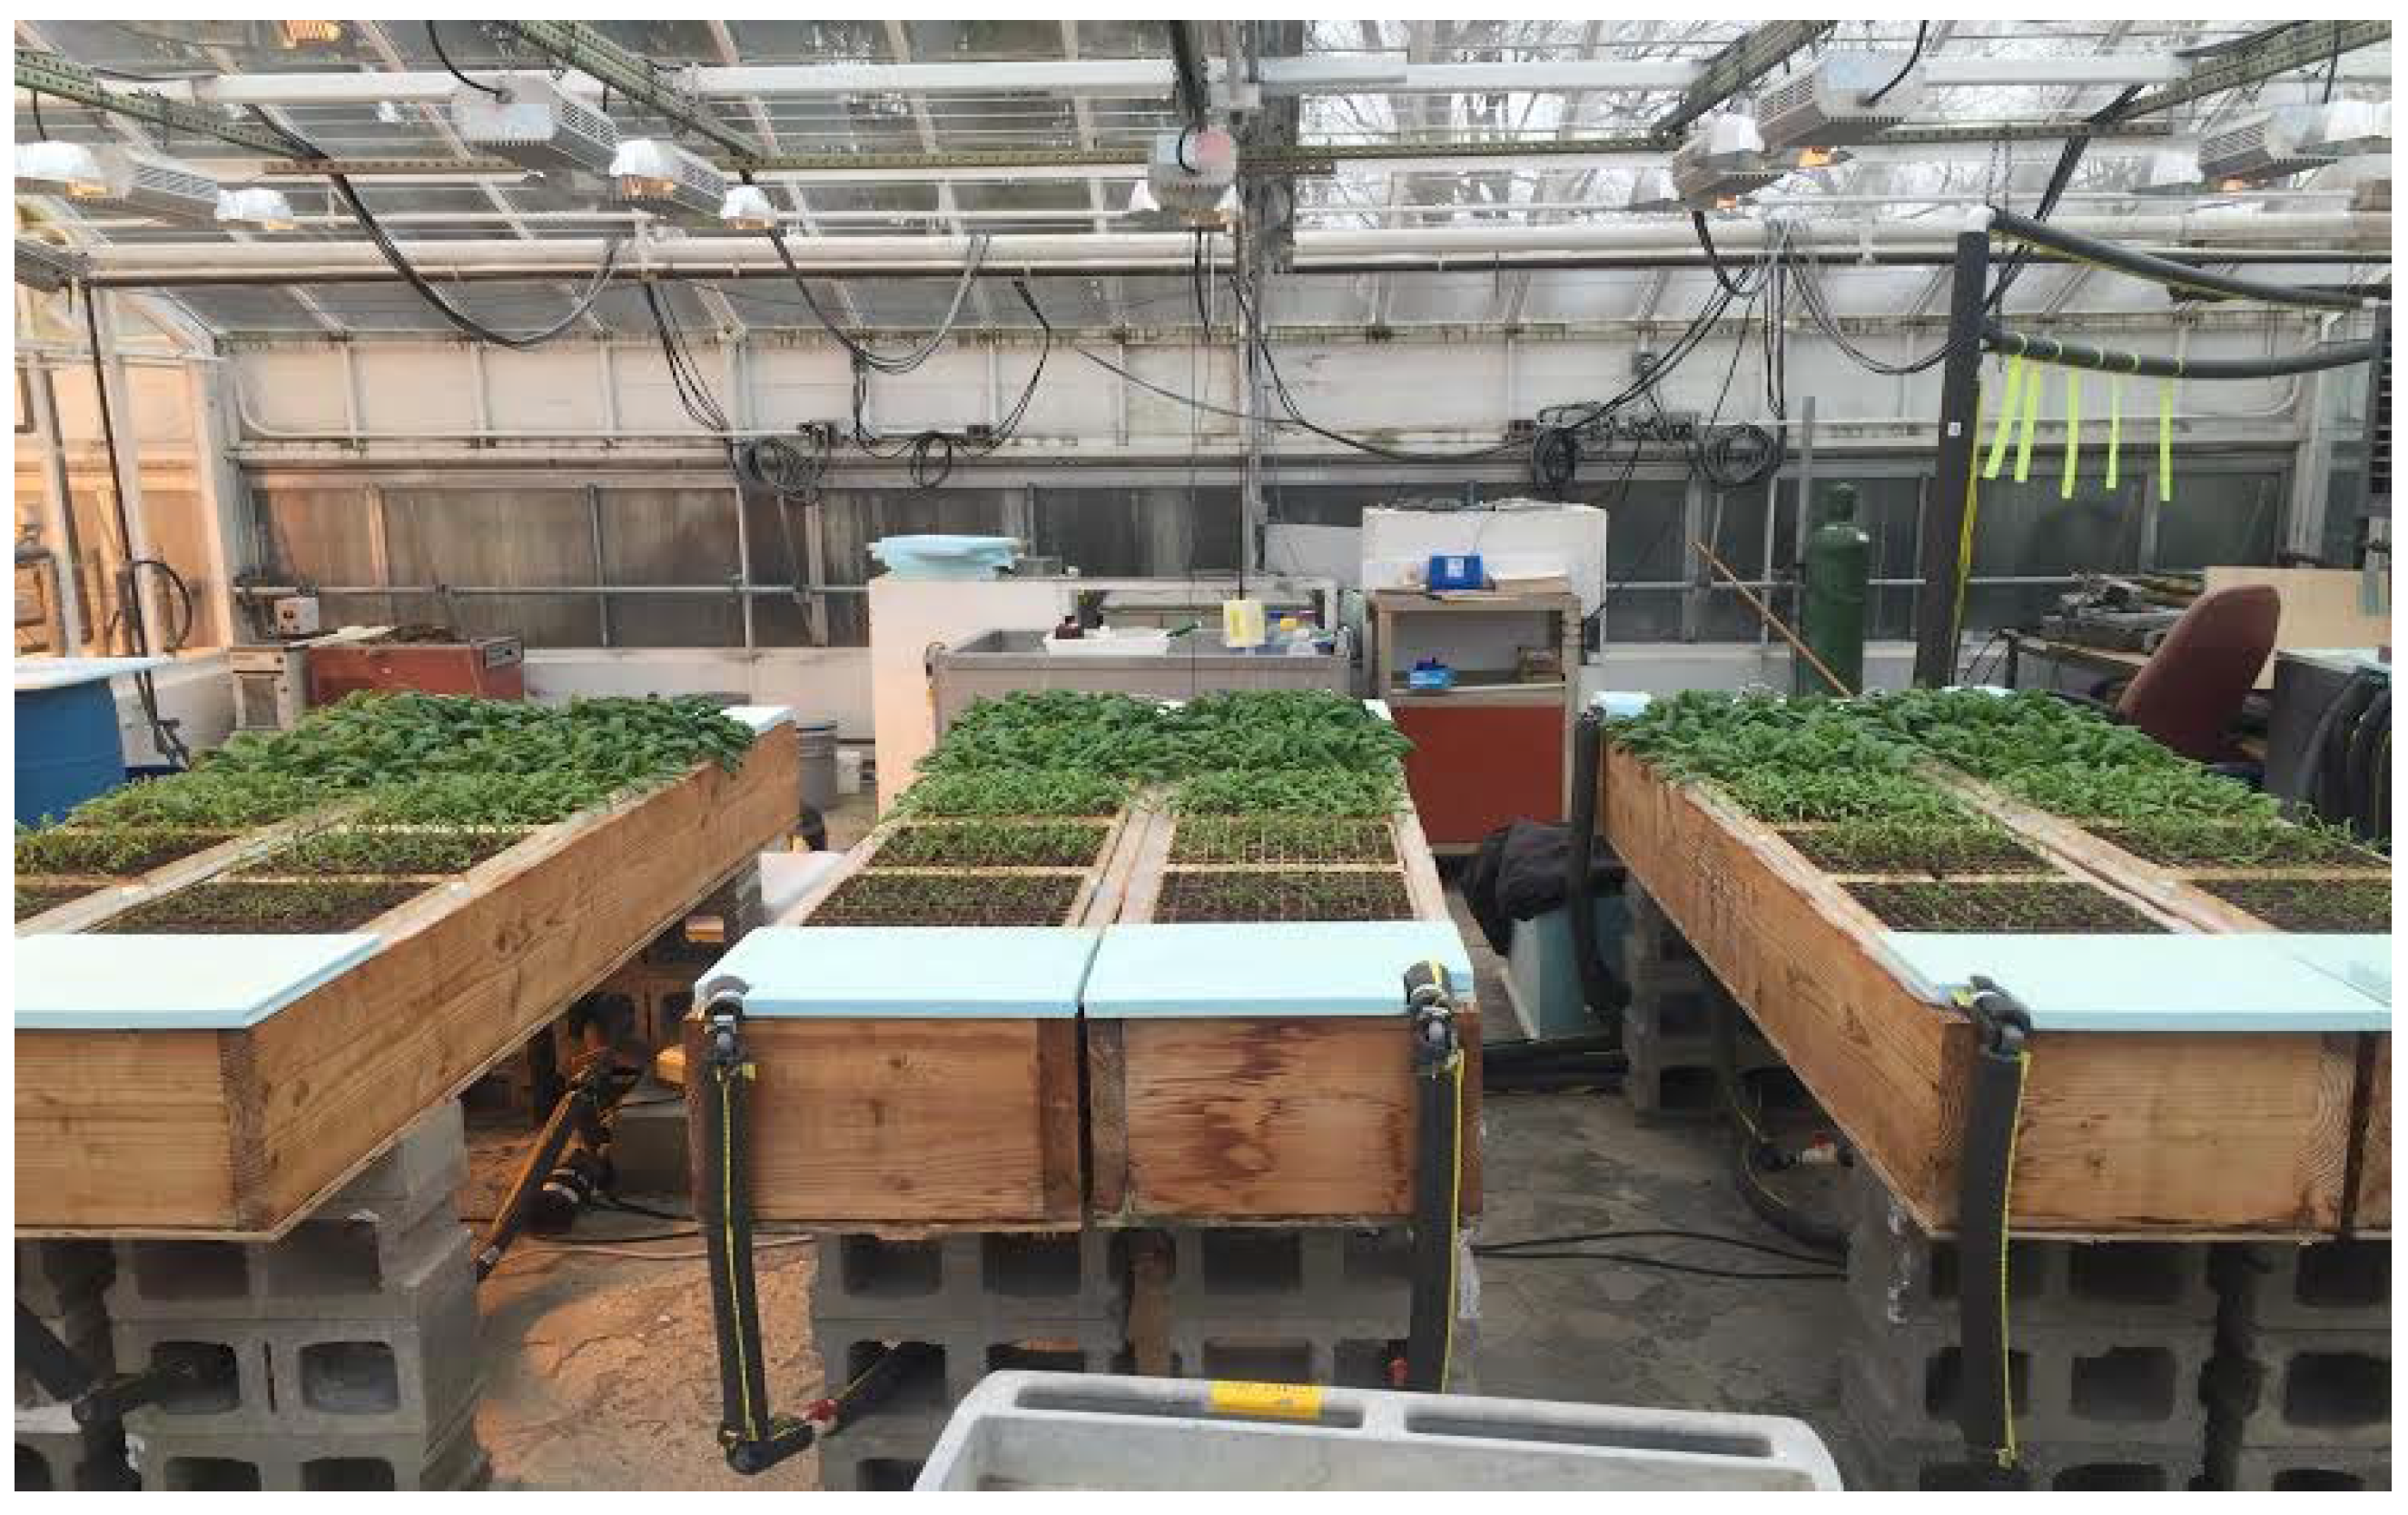
The spinach crops in all treatments were grown in the same greenhouse and aerial space under the same lighting and temperature conditions, with periodic harvest of old and insertion of new trials into hydroponic growing channels (described further below, see
Figure 1 for a general overview). Six trials were conducted from January 17 to February 19, 2016, with a preliminary trial conducted to validate procedures. Root zone temperature was matched across all treatments at 18 °C. All treatments were grown for 13 days once a flat was floated in its respective channel. Each of the three treatments was applied in a duplicate growing system, resulting in six growing systems. The two hydroponic treatments had four completely independent recirculating systems including their source waters, while the water from the fish tank for the two aquaponic systems was continuously being mixed. An individual trial ended with the harvest of all six flats of spinach from each growing system. Each trial was offset by three days; additional harvest details are provided below. Styrofoam floats covered all water surfaces to reduce algae growth, minimize evaporation, and block solar radiation, which would have destroyed the iron chelator.
2.1. The Greenhouse
The spinach was grown in the middle section of a multi-sectioned glass greenhouse built in 1953, with dimensions 9 m × 11 m × 7 m high to the ridge, oriented east west (
Figure 1). An Argus monitoring and control system (Surrey, BC, Canada V3S 7A4) logged CO
2, humidity, aerial temperature, and light level, and also controlled aerial temperature and daily light integral (DLI). There was no carbon dioxide supplementation. Two identical water-to-air heat exchangers on opposite sides of the greenhouse rated at 115,000 kJ/h used fans to move air through radiators then across the greenhouse, providing air mixing and rapid adjustment of air temperatures to target values.
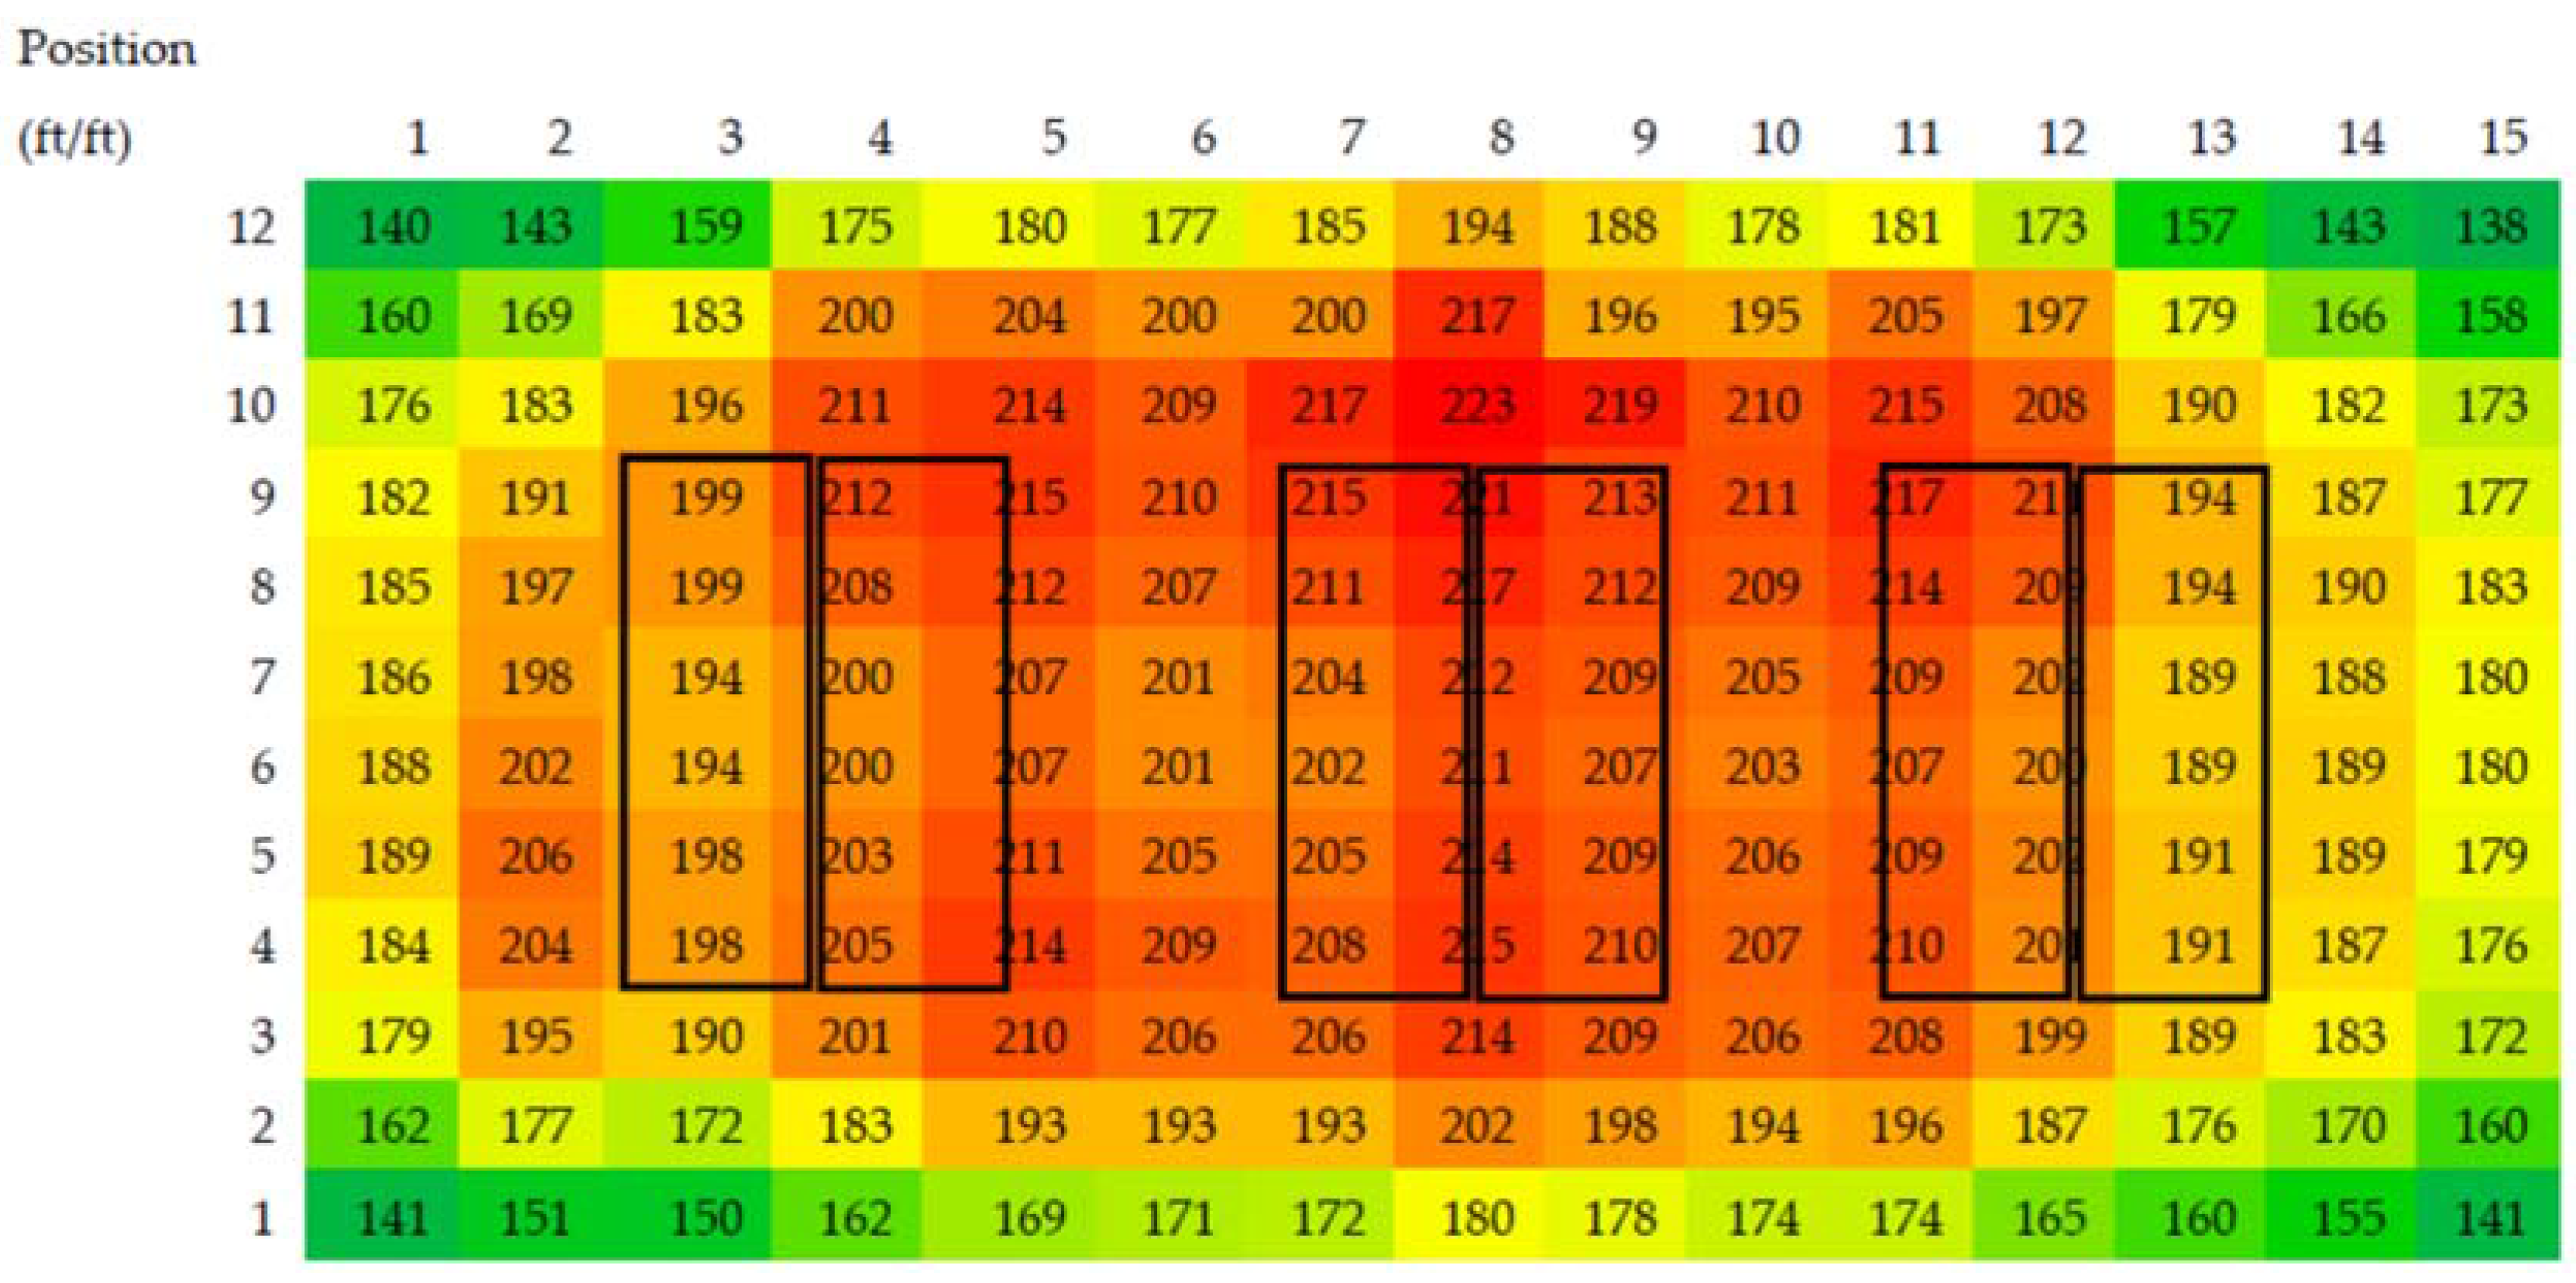
A target DLI of 17 mol/m2/day was used for all trials. The DLI is the quantity of photosynthetically active radiation (PAR, in units of moles/m2/day) achieved by controlled use of a lighting array to supplement natural light. The environmental parameters were sampled approximately every two seconds and data queues averaged and logged every 2 min. DLI was controlled to its target value by supplementing natural light using an array of 20 high pressure sodium (HPS) lights (GE, 400 watt clear S51/O, Mogul Base rated ED18 HSP, LU 400/H/ECO; General Electric, Cleveland, OH, USA). The DLI was reset daily at 6:00 am. The greenhouse had a heating set point of 24°C, and a cooling set point of 25°C. The quantity of both natural and supplemental lighting received at plant level was recorded using a LiCor quantum sensor (Li-Cor, Lincoln, NE, USA). The average DLI for trials was consistently between 17.0 and 17.1 mol/m2/day for all trials. The average natural light integrals were 4.0, 4.1, 4.7, 4.6, 5.4, and 5.4 mol/m2/day for trials 1–6 respectively. The average supplementary light integrals were 13.0, 12.9, 12.3, 12.4, 11.6, and 11.6 mol/m2/day for trials 1–6 respectively.
2.2. The Channels
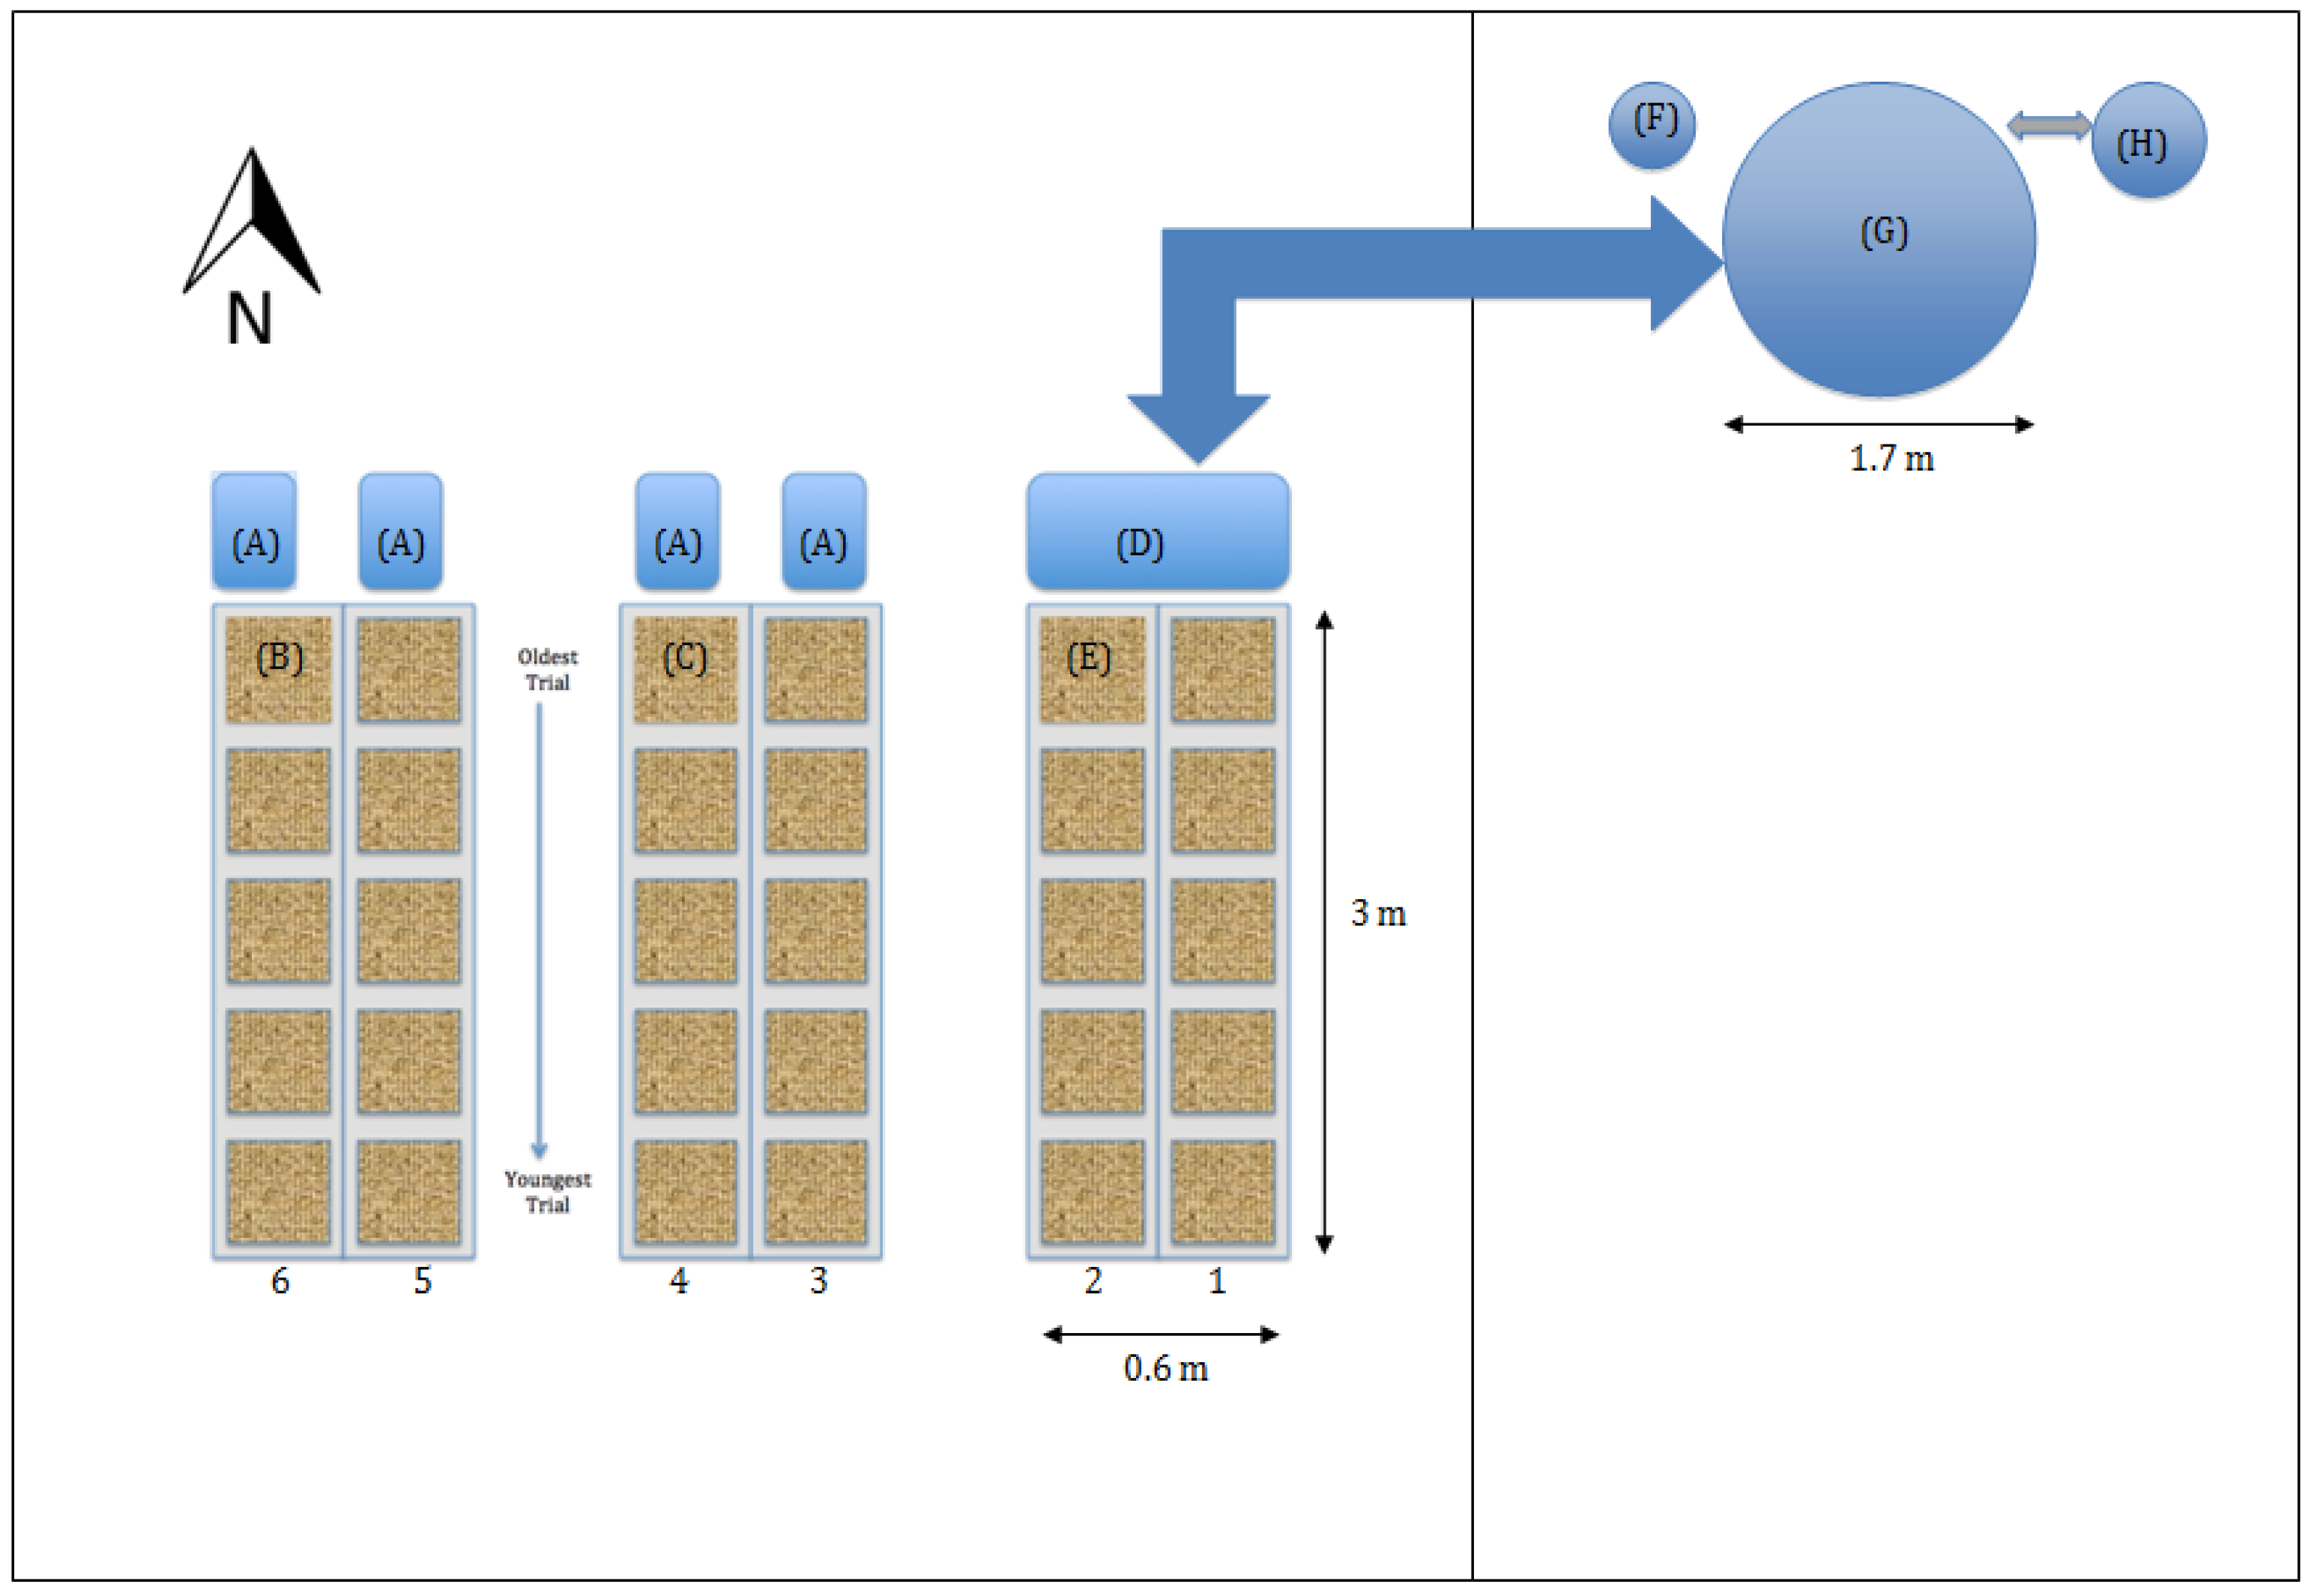
Flats of spinach were floated in six channels raised 1.27 m above the floor. The channels were made of 2 × 12 lumber, which provided insulation on the sides and ends. They were also insulated at the bottom with 25 mm polystyrene and 12 mm of plywood, and carefully lined with 0.006 mil plastic to make a functioning pond. The outside dimensions of the channels were 29 cm high × 42.5 cm wide × 244 cm long. Internal dimensions were 26 cm deep × 35 cm wide × 236 cm long. Each channel was accompanied by a reservoir at floor level (volume 50 L). Nutrient solution was cooled in the reservoir, pumped up to the far end of the channel, then drained back to the reservoir by gravity with depth controlled by a standpipe at the downstream end of the channel. The channels were filled to roughly 24 cm with 2 cm of freeboard, which provided a total volume of 200 L per channel plus reservoir volume. The tops of the floating flats were 1.27 m above the floor and 1.30 m below the light fixtures to maximize light uniformity (natural and supplemental) among all channels. At the water level heights maintained, the top of the floats cleared the channel sides. The channels were labeled 1 through 6 and were grouped into three blocks: channels 1 and 2 were block 1 (A7 treatment), channels 3 and 4 were block 2 (H7 treatment), and channels 5 and 6 were block 3 (H5 treatment) (see
Figure 1 and
Figure 2).
2.3. Seeding and Floating
The seeding protocol involved hand-seeding spinach (Spinacia oleracea, cv. Carmel) seeds into each cell of each flat. During trials 1 and 2, seeds were double seeded in each cell, but due to somewhat low germination in the flats, trials 3 to 6 were triple seeded. After germination, stands were thinned to only one plant per cell prior to floating the plants in the channels (see Stand correction below for more details).
We have found the notorious and historical difficulty in germinating spinach largely disappears if seeding is into pre-moistened medium and the moisture content of the medium is controlled. Potting media used was LM-1 germination mix (blend of fine-fibered Canadian sphagnum peat moss along with fine vermiculite and perlite), by Lambert (Quebec, Canada). Pre-moistened medium was created by adding 1 L of reverse osmosis water for every 1 kg of LM-1 potting media, to achieve a moisture content of roughly 3 parts water to one part dry matter (the potting media is roughly half water as received). Potting media was screened through a 6 mm sieve into multi-cell Styrofoam flats. Depth of seeding was controlled by a wooden dibbler that compacted the medium to a set depth. We improved our germination success by discarding any seeds that looked unhealthy, e.g., misshapen, discolored, or oddly sized. The goal of seed selection was to create the most uniform plant stand possible.
After seeding, the trays were sealed in 15 L white plastic bags, to control humidity to near saturation, and germinated in a growth chamber shielded from light, for eighty hours. The germination chambers were maintained at 24 °C. We determined that eighty hours was the best time to float the flats, as that was the time when most plants had recently emerged but minimal growth or stretching had occurred. The flats were 6.3 cm thick by 34.5 cm wide × 31 cm length and comprised 132 cells in an 11 by 12 matrix. Only plants from the central 56 doubly-guarded cells were harvested (the outer two rows were not used, which leaves a 7 × 8 row matrix), where the cell density was 1300 cells per m2, a density used by commercial growers.
After floating, the plants were grown in the channels for an additional 14 days under full lighting. The seeding, floating, and growing procedures were the same for all trials and treatments except the increased seeding as previously described. Trials overlapped with each other in their channels, since flats were added every 3 days as a new trial, so it took five successive trial placements (trials) before the first trial was harvested; thus trial 1 and 6 were completely independent in all ways, including their water environments.
2.4. Stand Correction
An attempt was made to control for the variation in germination among flats. The procedure entailed adjusting plant stands to a set number of healthy, equivalent, plants in the interior of each of the flats for each particular trial. The number was determined by the worst germination of the six flats in a given trial after having removed any deformed or very late emerging plants. From the remaining plants, additional healthy plants were removed so that each trial had the same number of plants per flat. Once the number of plants to remove from each flat was determined, these plants were randomly selected and removed blindly to avoid bias.
Even though trials were stand corrected to be the same within trial, there were small differences between trials since each trial had a different number of healthy plants at the time of floating. The number of plants varied from 44 to 51 out of the 56 potential guarded cells that were to be harvested for data analysis.
2.5. The Hydroponic Systems
The hydroponic channels were closed-loop recirculating water systems, with each channel independent and unconnected to others. Identical circulating pumps (24 L/min) were used in all six channels and mixed the water in the channels at a rate equal to a hydraulic retention time (HRT) of 8 min. This flow rate maintained good mixing in the channels and roots appeared to be kept under gentle movement, which we did to avoid possible problems of root stress previously mentioned by Shete et al. [
14]. A crucial part of the hydroponic channels was the nutrient solution reservoir (made with modifications to a cooler chest). Each channel’s flow went through its reservoir, in which temperature was computer-controlled by activation of cooling coils in which water cooled to 7 °C was passed when necessary. Two hundred liters of nutrient solution were added to each channel to begin the experiment. Nutrient solution was added on an as-needed basis to replace water loss by evaporation or transpiration. For each given trial, one flat was floated in each channel at the same time to commence that particular trial.
2.6. The Aquaponic System
The aquaponic system contained koi (
Cyprinus carpio) separately housed in an adjacent section of the climate-controlled greenhouse range, as shown in
Figure 1. Koi were chosen as the fish because the common carp is a hardy fish and can tolerate a wide range of water temperature, and koi retain that resilience. The fish tank was 1000 L and had been in continuous operation for two years. The system continually recirculated water with minimal water discharge and used a bead filter to capture and mineralize solids. The return flow from the fish sump was split to go to the bead filter or the A7 reservoir (designated as H in
Figure 1) for the aquaponic channels. A separate sump pump in the A7 reservoir returned water directly to the fish tank. The bead filter flow was returned to the fish tank via an external spray bar to provide aeration. The bead filter was back-flushed once per week with a net loss of water of 100 L to remove retained solids, which allowed significant time for solids mineralization. The flow to the aquaponics channels was the same 24 L/min per channel as the hydroponic channels.
The pH of the system was regulated daily to a pH of 7.0 by adding 1M K
2CO
3. Due to fish nitrification and fish respiration, the pH was stable, so there was no need for pH lowering chemicals such as acid. Fish were fed a synthetic manufactured Koi feed (Blackwater Creek’s Max Growth Koi Food “Premium Koi and Goldfish Food”). The fish were hand fed twice daily to apparent satiation on weekdays (total of 90 g), and 60 g on weekends (once daily), which was approximately 1.5% body weight per day on weekdays. The koi were approximately 200–400 g in size (tank density of ~7 kg/m
3) and their body condition factor was considered typical and indicative of appropriate feeding levels. The lower feeding level on weekends was to reduce work requirements and reduce potential system problems during low-staff periods on the weekend. See
Table 2 for the elemental analysis of the fish feed used as determined by the Cornell Nutrient Analysis Lab (CNAL). The feed used was a standard commercial diet provided by a reputable feed dealer for ornamental koi.
The aquaponic treatment channels were not independent water systems from one another. Water from both systems came from and was returned to the fish tank, and the systems shared a reservoir which was cooled in the same way as the hydroponic channels. The fish tank was separated from the spinach channels by a glass greenhouse partition wall, which had the advantage of allowing the fish tank to be kept at a colder air temperature. Since spinach root zone temperatures needed to be kept at 18 °C, we maintained the fish water near 20 °C and the rest of the chilling was accomplished by the chiller previously described.
2.7. Measurements
Alkalinity was measured by titrating to an endpoint of pH 4.5 using 0.01 M (0.02 N) sulfuric acid. The resulting equilibrium alkalinities were approximately 20 mg/L CaCO3 for the H5 treatments and 40 mg/L CaCO3 for both the H7 treatment and the aquaponic treatment. The alkalinity measurement had an accuracy of ±4 mg/L as CaCO3.
Electroconductivity (EC) was measured between 1200 to 1500 µS/cm. EC was not controlled in the treatments, but due to the differences among treatments, slightly different EC ranges resulted. In the aquaponic treatment, the average EC was 1400–1500 µS/cm. In the H5 and H7 treatments, the average EC was 1200–1300 µS/cm and 1300–1400 µS/cm, respectively. Typically, there was very low variability in the nutrient solution EC in the H5 treatment. The additional ions in the A7 treatment from the tapwater resulted in the EC stabilizing at the highest values. The adjustment of the pH upward in the H7 treatment from its natural starting point of pH 5.8 resulted in the H7 treatment having higher EC values than the H5 treatment.
2.8. Nutrients
The hydroponic treatments received a custom-made inorganic hydroponic fertilizer. To set up the hydroponic experiment, each of the four hydroponic channels was filled with 200 L of the modified Sonneveld and Straver lettuce solution [
7]. To create 200 L, one liter each of two concentrates, known as Stock A and Stock B by common practioners, were mixed in successively. The nutrients contained in each Stock solution are shown in
Table 3 (see
Table 7 for resulting initial concentrations).
The tubs were first filled with water, then Stock A and B concentrates were added on a 1:1 ratio sequentially while vigorously stirring between additions. Additional modified Sonneveld and Straver solutions were created in 200 L quantities in barrels at the two different pH’s, using RO water and then used for replenishment of lost tub water over the course of each trial.
To set up the aquaponic experiment, each of the two aquaponic channels was filled with 200 L of fish water, during a time when the fish tank was routinely replenished with tap water (to replace water lost during solids filter cleaning). The aquaponic channels required the addition of iron, since iron is a required element for plants so we added chelated iron to the aquaponic system in the form of Fe-DTPA (Sprint-330). The chelated iron was in a form which is not taken up by fish but is available to the spinach.
Upon completion of the experiment, tissue data analyses were performed by the Cornell Nutrient Analysis Laboratory using hot plate acid digestion plus ICP-AES metal analysis and combustion ash analysis for carbon and nitrogen. Nutrient solution analysis was done immediately before and after the entire experiment. One sample was taken immediately prior to the addition of the first plants , and the other sample was taken after trial 6 was harvested. The nutrient solution analysis was also run by the Cornell Nutrient Analysis Laboratory. Elemental analysis results are shown in
Table 5 and
Table 6.
2.9. Harvest
Plants were harvested after 14 days of grow-out in the channels, at a typical marketable size for baby-leaf spinach. During harvest, flats of plants were removed from the channels one at a time and taken out of the greenhouse. Plants were harvested at night because they are growing very fast in the day, so night harvesting minimized any advantage a particular flat could have received by its order of harvest. If harvested during the day, flats harvested later would have a relative yield advantage.
Each flat had 132 cells for possible plants, but the two outer perimeter rows of plants were able to spread out beyond their flat and therefore not considered typical (would receive more light) and were thus discarded. After removing the two perimeter rows, each flat had the plants from interior/guarded cells for analysis. During harvest, plants were snipped where the stem emerged from the medium, i.e., through the hypocotyl, and the number of plants per row were counted. All plants within the same row were grouped, and stems and leaves were separated in each row. Finally, total stems and leaves per row were weighed with an accuracy of 0.01 grams. These data was used to calculate both total flat mass and average mass per plant.
After separation, stems and leaves were placed in labeled brown paper bags and dried in ovens maintained at 70 °C for three days. We consider dry weight to be a pure representation of biomass yield, since water concentration can make interpretation difficult. We also present fresh weight data as being equally important because fresh weight is marketable weight.
2.10. Leaf Surface Area
In order to determine and calculate surface area, leaves were cut after weighing and pressed flat for measurement with a clear scratch-resistant acrylic polycarbonate plexiglass. Each row would all fit underneath a 25 cm × 50 cm piece of the plexiglass. Images of the pressed leaves were then used to determine total leaf surface area.
Surface area was measured using the computer software called ImageJ. ImageJ is an open-source image processing program, with the intent of being used for scientific multidimensional images. To use the software, a picture was loaded, and the brightness and hue threshold of the image was changed to the point where only green color was recognized. Surface areas were extracted using a reference length within the picture.
2.11. Statistical Analysis
Three treatment conditions (H5, H7, and A7) were evaluated based primarily upon fresh and dry matter responses. We collected data for six trials from January 13 to February 19, 2016, corresponding to a total daylength increase of 84 min (9 h 19 min to 10 h 43 min, or a 15% increase in natural daylength). We first evaluated if there was a trial effect on biomass response across all trials by grouping the three treatments for each trial, since response may have been impacted by changing daylength. We also evaluated trial effect on individual plant response since our stand correction procedure gave us the same number of plants for each flat but resulted in a different number of plants per flat by trial and the natural daylenth increased for each trial. After evaluating for both possible sources of a trial effect, data was combined among trials to provide increased degrees of freedom for statistical analysis of treatment effects (
n = 84, from 6 trials, 2 channels per treatment, and 7 rows per flat per treatment). After combining data by treatment across trials and paired across replicated channels, treatments were compared using paired
t-tests. For flat responses (
Table 4c), there are 6 flats or responses per treatment and two replicated channels, so
n = 12.
4. Discussion
This study brought to light the idea that non-optimal nutrient conditions for spinach growth using nutrient rich water from a fish RAS (recirculating aquaculture system) can still produce the quality and quantity of product that a carefully controlled inorganic hydroponic nutrient solution produces. While we detected no difference between aquaponic (A7) and hydroponic (H5) spinach crops in this experiment, these results may not apply to other crops or greenhouse and aquaculture environments. The hydroponic solution used in this experiment has served well for many leafy greens commercially and in research, but was formulated by Sonneveld and Straver specifically for lettuce. In some crops nutrient solution components and ratios make a difference to growth; an important question one must ask is what would have happened if we had used a nutrient formulation tailored specifically for spinach.
This study does not go into the sustainability of one treatment over the other, nor does it consider the economics of either. Economically, aquaponics has potential for reducing the initial capital investment, since part of the RAS filtration and waste removal components can be eliminated or reduced in size. A substantial part of a RAS capital investment is for the biological filter, generally using some type of inert media to provide surface area for nitrifying bacteria and then a water distribution and supply system to move ammonia laden water through the bio-media. The media over time often becomes overburdened with heterotrophic growth and collection of bio-solids rendering the biodmedia ineffective requiring replacement or labor intensive cleaning processes. Serious losses of nitrification capacity can result. Conversely, designing a plant root system to provide all or a substantial part of the nitrification system for the RAS can reduce capital cost and may prove to be more stable since the plant root system is constantly being removed and replaced with successive plant stockings and harvestings and therein creating ‘new’ surface area for robust nitrification.
Generally, hydroponic production requires meticulous care and management of the macro and micro nutrient environment to successfully raise the selected crop. While expert management has shown itself well capable of this management requirement, it still subjects itself to error and to the requirement for expert management. Conversely, aquaponic management appears to be simpler in complexity than what is required in a hydroponic system, since the aquaponic system only requires supplementation of iron, with the rest of the nutrients being adequately supplied from the fish operation. The aquaponic system seems to be almost ‘foolproof’ at least in terms of nutrient management, a welcomed relief, particularly to new growers.


