
Impact of Mechanical Stirring and Percolate Recirculation on the Performances of Dry Anaerobic Digestion
by
Zhikai Zhang
1,2,3,4, 
Shengqiang Chang
2,3,
Shengyong Zhao
5,
Peng Liu
1,
Yanan Qian
6,* and
Wangliang Li
2,3,* 1
School of Water Resources and Environment, Hebei GEO University, Shijiazhuang 050031, China
2
The Key Laboratory of Green Process and Engineering, Institute of Process Engineering, Chinese Academy of Sciences, Beijing 100190, China
3
University of Chinese Academy of Sciences, Beijing 100049, China
4
Hebei Province Key Laboratory of Sustained Utilization & Development of Water Recourse, Hebei Center for Ecological and Environmental Geology Research, Hebei Province Collaborative Innovation Center for Sustainable Utilization of Water Resources and Optimization of Industrial Structure, Shijiazhuang 050031, China
5
Henan Chemical Industry Research Institute Co., Ltd., Zhengzhou 450052, China
6
State Key Laboratory of Chemical Safety, SINOPEC Research Institute of Safety Engineering Co., Ltd., Qingdao 266071, China
*
Authors to whom correspondence should be addressed.
Fermentation 2023, 9(9), 848; https://doi.org/10.3390/fermentation9090848
Submission received: 20 July 2023
/
Revised: 7 September 2023
/
Accepted: 11 September 2023
/
Published: 15 September 2023
(This article belongs to the Special Issue Anaerobic Digestion: Waste to Energy)
Abstract
:Dry anaerobic digestion (DAD) is an attractive method for simultaneous organic waste disposal and bioenergy recovery. DAD has the problems of low methane yields, low reaction rates, and easy inhibition due to its limited mass transfer and heat transfer. In this work, two methods of mechanical stirring and percolate recirculation were compared regarding their capacities of improving the mass transfer and enhancing the performances of DAD in batch experiments with sorghum stalks as a substrate. The cumulative biogas yield and system stability were investigated when the stirring linear velocity was 0 cm/s, 22 cm/s, 44 cm/s, 66 cm/s, and 88 cm/s. When the stirring linear velocity was 88 cm/s, the cumulative biogas yield and methane content were highest. The computational fluid dynamics (CFD) simulation indicated that the shearing force near the stirring shaft was largest. When the linear velocity of the stirring paddle was 88 cm/s, the shearing force at a radial distance close to center was about −140 N/m2. When the ratio of the material stacking height to the reactor diameter (H/D) was 3:2, the AD showed the best performance. A higher material stacking height promoted the contact between the microorganisms and the substrate and enhanced the biogas production. By combining percolate recirculation and mechanical stirring, the cumulative biogas yield increased by 28% compared with the static DAD process because of the promotion of mass transfer in the DAD.
1. Introduction
The development of human society is dependent on fossil energy, which leads to resource shortages, carbon dioxide (CO2) emission, and environmental pollution. The demand for renewable energy is booming. Meanwhile, rapid urbanization and population expansion lead to the increasing generation of municipal solid waste (MSW) to the levels of significant economic and environmental consequences [1,2,3]. One of the methods to solve the problem of energy shortage and organic waste disposal is anaerobic digestion (AD), a biochemical process decomposing and converting organic matter into biogas (a mixture of methane (CH4), carbon dioxide (CO2), and other gasses such as hydrogen sulfide (H2S) and ammonia depending on the types of waste) [4,5,6,7]. Based on the content of total solids (TS), AD can be divided into wet (<15% TS) and dry (≥15% TS) processes. Compared with wet AD process, dry anaerobic digestion (DAD) shows obvious advantages in the aspects of smaller reactor volume, simple post-treatment of residue, less water consumption, and lower operation cost, which makes it particularly attractive for disposing of the organic fraction of industrial wastes, municipal solid wastes, and agricultural wastes [8,9]. However, a huge technical challenge remains regarding the limited mass transfer and heat transfer inside a DAD reactor due to the high content of solid waste, which limits the industrial applications of the technology [10].
Homogeneous mixing could make substrates much more accessible to microorganisms, ensure substrate consistency, and enhance process kinetics and methane yields, which can be realized mainly by three methods: mechanical agitation, recirculation of liquids, and gas sparging [11]. Mechanical agitation can mix the substrate materials by using a stirring paddle or baffle, which is considered as the most energy-efficient way [12,13]. Most studies have focused on the effects of mixing techniques, mixing intensity, and continuous or periodic mixing on AD and biogas production [14]. It was shown that compared with a non-stirring process, mixing at the velocity of 100 rpm enhanced the start-up process, the digester’s capacity, the process stability, and the treatment efficiency [15]. Meanwhile, a clear negative impact of the agitation rate was also observed on the organic acid consumption as shown by a slower increase in the pH and a lower CH4 content at the agitation rates of 50 and 90 rpm than at 10 rpm [16]. Intermittent stirring (mixing for 2 h and halted for 10 h) had a higher biogas production and COD removal rate than continuous stirring and could reduce the energy consumption of the DAD process [17]. Lindmark et al. [18] also suggested that intermittent mixing could be a better method than continuous mixing. It is obvious that adequate intensity of mixing is necessary for a stable and efficient operation of an anaerobic digester, while the optimal mixing intensity varies depending on different substrates and digesters [19,20]. However, the effects of mixing on AD have been mostly studied regarding wet digestion [21,22], whose reaction conditions are much different from those of DAD.
Computational fluid dynamics (CFD) is an efficient and powerful tool to study the flow field of gas, liquid, and solid particles by predicting fluid flow, calculating power consumption, displaying the field of shear stress, etc. [23]. Wu [24] used CFD simulation to evaluate six turbulence models for the mechanical agitation of non-Newtonian fluids in a lab-scale wet AD tank with a pitched blade turbine (PBT) impeller. Cao et al. [25] comprehensively compared experimental results with CFD simulation results and identified the optimal mixing velocity to be 180 rpm based on the principle of energy saving and high efficiency. However, most of the results were based on wet AD, while the CFD simulating DAD was relatively less. In this study, a CFD simulation was used to investigate the mixing state of the materials and the effect of mixing on the DAD.
In addition to mechanical agitation, percolate recirculation was also reported to be an efficient way to enhance the AD process by increasing the moisture inside the reactor, making the microbes contact the nutrients and maintaining the homogeneity of the digester [26]. Wang et al. [27] studied the effect of co-digestion and digestate recirculation on bio-hydrogen and bio-methane production and found that digestate recirculation could promote the hydrogen production rate (HPR) and methane production rate (MPR). Ibrahimi et al. investigated the effects of the flow rate of liquid recirculation in a mesophilic digester and found that gentle mixing (11 L/min) achieved a higher specific methane yield and less heat loss compared with intense mixing (24 L/min) [28]. Pezzolla et al. [29] reported that frequent percolate recirculation in DAD decreased the inhibition and increased the methane yield. Karim et al. [30] compared the impacts of mechanical agitation, sludge circulation, and biogas recirculation and found that the effect of biogas recirculation under high solid content was not very satisfactory, and the gas pipeline was easily blocked. Therefore, the gas recirculation is not recommended for DAD processes. Considering that biogas reflux requires high compression and release technology, and it has high equipment costs, this study focused on the impacts of mechanical stirring and percolate recirculation on the performances of DAD. The reflux ratio, flow rate, and frequency of percolate recirculation have been studied by many researchers [27,28,29], while few have studied the influence of the material stacking height on DAD. Therefore, this study investigated the effect of material stacking height and reactor diameter on DAD.
Specifically, the effects of the stirring intensity and the optimal height to diameter ratio on dry anaerobic digestion were explored. The CFD simulation was used to reveal the impact and mechanisms of mechanical stirring. The aim was to obtain a suitable mass transfer enhancement method based on the comprehensive comparison of the experimental results of mechanical stirring and percolate recirculation.
2. Materials and Methods
2.1. Feedstock and Inoculum
Sorghum stalks, a typical representative of lignocellulose waste, were used as the experimental substrate. Sorghum stalks were provided by the Sichuan Sorghum Planting Base of Luzhou Laojiao Group Co., Ltd. (Luzhou, China). Before fermentation, the sorghum stalks were naturally air-dried and crushed to 2–5 mm. The inoculum was selected from the Beijing Haidian Sewage Treatment Plant and then domesticated and cultivated. The physical properties of the substrate are shown in Table 1. The TS were based on a wet basis (%, w.b.), and the remaining parameters such as volatile solids (VS) were based on a dry basis (%, d.b.).
2.2. Experimental Setup and Procedures
The influences of mixing intensity and the state of stacking material on the dry digestion process were studied. Accordingly, the experiment was divided into two sections.
- (1)
- The influence of mixing intensity on the DAD process
The experimental setup is shown in Figure 1. The fermentation tank was a double-layer glass reactor, heated by a water bath. The inner diameter of the reactor was 200 mm. Its height was 400 mm, and the effective volume was 10 L. The top cover had a feed inlet, a nitrogen inlet, a biogas outlet, and a temperature detection port. There was a discharge valve at the bottom of the reaction tank, and the material was discharged by gravity. There were PTFE double-layer stirring paddles in the reaction tank. The size of the stirring paddle was 140 mm in length, 40 mm in width, and 5 mm in thickness. The diameter of the stirring shaft was 15 mm. The biogas outlet was connected with a wet gas flow meter, which can directly measure the volume of biogas.
The experiment was batch fermentation at medium temperature. At start-up, the crushed sorghum stalks (300 g) and inoculum (3000 mL) were added to the reactor and mixed well. The initial TS was about 18.8%. Meanwhile, the reactor was purged using nitrogen. The pH value of the digester, the concentration of ammonia nitrogen, and the COD value were measured.
The stirring velocities were set to be 0 r/min, 30 r/min, 60 r/min, 90 r/min, and 120 r/min. Because the diameter of the stirring blade was 14 cm, the corresponding outermost linear velocities were 0 cm/s, 22 cm/s, 44 cm/s, 66 cm/s, and 88 cm/s. This study adopted intermittent stirring once every 12 h. Due to the high solid content of the substrate, the mixing time was set to be 10 min to ensure that the materials could be uniformly mixed.
- (2)
- The effect of height-to-diameter ratio (H/D) on the DAD process.
This experiment mainly investigated the performance of DAD at different material stacking heights. The experimental device is shown in Figure 2. The reaction device consisted of a digestion reactor and a leachate tank and was equipped with a water bath circulating heating system and a percolate circulation system. There were nitrogen pipelines supplying purging nitrogen into the digester to remove air out of the device.
A baffle was laid at the bottom of the digester. Above the baffle, Raschig rings and nylon filter cloth formed a percolation layer so that the liquid could naturally permeate into the leachate tank, while the material remained in the digester. The leachate tank was equipped with a stirring device to prevent the leachate from sedimentation and stratification. The leachate was circulated once a day, and the reflux ratio was 100%.
The ratios of the material stacking height to the reactor diameter were set to be 3:2, 1.5:2, and 1:2. At the beginning of the experiment, 450 g, 225 g, and 150 g of sorghum stalks were added to three reactors, and 4500 mL, 2250 mL, and 1500 mL of inoculated sludge were added to each reactor. In the first three days, 1500 mL, 750 mL, and 500 mL deionized water was added to the leachate tank of the reaction system with H/D ratios of 3:2, 1.5:2, and 1:2, respectively, because there was no obvious leachate in the lower part of the reactor. In the initial stage, it was the deionized water that was used for circulation. Afterward, leachate was gradually formed. At this time, the leachate in the digester was used for circulating spraying.
2.3. Analytical Methods
The TS and VS contents of the inoculum and sorghum stalks were measured according to the standard methods [31,32]. The elemental compositions of sorghum stalks were analyzed with an element analyzer (VarioEl III). The contents of lignin, cellulose, and hemicellulose of the substrate were determined according to the Van Soest method [31]. The pH value was detected by a pH meter (Mettler Toledo, Zurich, Switzerland). The chemical oxygen demands (CODs) of the samples were determined by using a fast COD test kit, and the ammonia nitrogen (AN) was analyzed by using an AN test device according to the manufacturer’s instructions. The anaerobic microbial morphology was observed by using a confocal laser scanning microscope (Thermo Fisher, Waltham, MA, USA). The compositions of biogas were determined using Agilent gas chromatography (Agilent, Palo Alto, CA, USA), equipped with a thermal conductivity detector. The temperatures of the detector, injector, and oven were set to 150 °C, 100 °C, and 120 °C, respectively.
2.4. CFD Simulation
To investigate the mixing state of the materials in the reactor at different velocities, the software Fluent 14.0 was used to simulate the velocity field distribution in a 10 L digester. Although the substrate was mainly solid biomass, the moisture content of DAD was usually 65–85%. At the same time, due to the degradation of microorganisms, the substrate was very viscous and possessed the characteristics of a continuous medium. In order to simplify the model and facilitate calculations, the material inside the anaerobic digester was assumed to be a constant-density incompressible single-phase liquid. The density and viscosity were set to 980 kg/m3 and 1500 mPa·s, respectively, based on the measured values. The numerical model was calculated using the momentum conservation equation and the standard k-ε equation. The basic governing equations mainly included the mass conservation equation, the momentum conservation equation, the kinetic energy k equation, and the dissipation rate ε equation. The simulation did not consider the temperature changes, so there was no energy conservation equation.
Mass conservation equation
Momentum conservation equation
Kinetic energy k equation
Dissipation rate ε
In the above equations, t is the time (s), p is the corrected pressure (Pa), x is the coordinate component, u is the velocity vector (m/s), ρ is the density (kg/m3), μ is the molecular viscosity coefficient, and μt is the turbulence viscosity coefficient.
The diameter of the reactor was 200 mm, and the material filling height was 300 mm. The blade of the stirring paddle was 140 mm long, 40 mm wide, and 5 mm thick, and the diameter of the stirring shaft was 15 mm. The geometry was established according to the actual size of the reactor and imported into Gambit for meshing, as shown in Figure 3. A hexahedral grid was adopted for the outer area of the stirring blade, and a mixed grid was adopted for the area of the stirring blade. Five different total grid numbers (115,041, 139,056, 278,600, 420,895, 791,786) were tested, and the average velocity of the reactor was used as a reference for the mesh sensitivity analysis. The simulation results showed that the grid-independent condition was achieved when the number of grids was 278,600, where the smallest grid volume was about 8.214 × 10⁻¹¹ m3, the largest grid volume was about 1.295 × 10⁻⁷ m3, the smallest surface area was 3.007 × 10⁻⁷ m2, and the maximum surface area was 3.35 × 10⁻⁵ m2. The minimum and average values of the orthogonal quality of the grids were 0.2794 and 0.8314.
MRF was used for the simulations of rotating paddles with the rotation axis direction of z. The upper boundary of the reactor was set as a velocity inlet, and the agitator and agitator shaft were set as a moving wall, which rotated at absolute speed relative to the z axis. The convergence criteria for the continuity, velocity, k, and epsilon equations were 10−6. The scheme of SIMPLE was set for the pressure–velocity coupling. The spatial discretization schemes of the gradient were least squares cell based. The spatial discretization of pressure was set as standard. And the second-order upwind was set for momentum, turbulent kinetic energy, and turbulent dissipation rate. The simulation scheme was steady state. And the standard initialization was set for the solution, computing from all zones with default initial values.
3. Results
3.1. The Effect of Mechanical Stirring Velocity on DAD
Sorghum stalks were used as the raw material, and the effect of mechanical mixing on DAD was studied by changing the linear velocities as 0 cm/s, 22 cm/s, 44 cm/s, 66 cm/s, and 88 cm/s. Figure 4 shows the cumulative biogas production and cumulative methane production of sorghum stalks at the termination of DAD. It can be seen that the cumulative biogas production gradually increased with the increase in the stirring velocity. When the linear stirring velocity was 88 cm/s, the cumulative biogas production was 391 mL/g VS, which was 18% higher than the case of linear stirring velocity of 0 cm/s. The highest methane production (195 mL/g VS) was achieved at a stirring linear velocity of 88 cm/s.
Some researchers examined the stability and efficiency of thermophilic anaerobic digesters treating food waste under various mixing velocities (50–160 rpm). High velocities (120 and 160 rpm) were harmful to the digestion process with an 18–30% reduction in methane generation compared with mild mixing (50 and 80 rpm). The best efficiency and stability were achieved under mild mixing (50 and 80 rpm). The 50 rpm stirring velocity resulted in the highest methane generation (573 mL/g VS) [33]. Additionally, it was believed that high-intensity agitation would destroy the structure of microbial flocs and disturb the distribution of mutually beneficial and symbiotic flora in AD. The mixing intensity at 150 rpm resulted in lower production than 25 rpm throughout the wet AD of MSW [18]. In the AD of cow manure, a stirring velocity of 80 rpm led to optimum performance and achieved the highest energy efficiency and net energy gain in comparison with 40 rpm and 120 rpm [14]. In this research the results showed that the stirring velocity in the DAD of sorghum stalks was slightly higher than that in the wet process, and the highest biogas production was achieved when the stirring velocity was 88 cm/s at the rotation rate of 120 rpm. This may be due to the low moisture content of DAD and difficulty in mass transfer. When the mixing intensity was weak, the mixing of substrates and inoculum was not effective. Only by a high-intensity stirring could a good mass transfer be achieved in the DAD process.
Figure 5 shows the variations of methane content in biogas at different stirring linear velocities. It can be seen that the methane content increased gradually, reaching about 55% on the 10th day, and then fluctuated around 64%, which reflected the extent of the methanogenesis stage in the AD process. When the methanogenic reaction was dominant, the methane content was usually equal to or higher than 50% [34]. It was shown that on the 10th day, all the experimental groups smoothly transitioned from the acidogenesis stage to the methanogenesis stage. This may be due to the slow growth and reproduction of methanogens, which were more sensitive to environmental changes such as the pH and the content of volatile fatty acids (VFAs) compared with hydrolytic bacteria and acid-producing bacteria [35]. It has been reported that intense mixing during start-up can have negative effects as high shear forces break microbial flocs and the syntrophic relationships between methanogens and bacteria, leading to the acidification of the system due to VFA accumulation [10]. Therefore, the high stirring intensity during the start-up stage was unfavorable for biogas production. As the methanogens gradually adapted to the new environment, the stirring in the DAD process promoted the mass transfer and provided abundant VFAs for methanogens.
According to the “reaction front” theory proposed by Martin [36,37], the degradation of the substrate in the DAD process gradually extends from the surface of the sludge particles to the internal region of the particles. The surface of the sludge particles contacts the substrate and hydrolyzes the substrate to produce small molecular matter, and the small molecular organic matter gradually diffuses into the sludge particles and then passes through the acidogenesis area and the buffer zone into the methanogenesis area. Notably, stirring can only promote the hydrolysis reaction occurring on the surface of the sludge particles, while the acidogenic and methanogenic reactions inside the particles rely on molecular diffusion and follow Fick’s law. Therefore, stirring affects the AD process by increasing the reaction rate in the hydrolysis stage. If the rates of hydrolysis reactions are faster than that of the methanogenic stage, the AD process will suffer from the negative effect of stirring and show a low methane production. Only when the hydrolytic rate matches with the methanogenic rate can the DAD be promoted.
In the DAD process, the pH, COD, and ammonia nitrogen (AN) concentration are important indicators and control parameters for the stability of the reaction system. The pH value not only affects the enzyme activity of microorganisms but also changes the ionization state of weak acids and weak bases, therefore affecting the metabolism of microorganisms. The suitable pH value for methanogens was reported to be 6.6–7.8. When the pH value exceeds 8.3, it will have a strong inhibition on methanogens [38]. It can be seen from Table 2 that at different stirring velocities, the pH remained stable between 7.6 and 8.0. The COD value reflects the level of intermediate products in the AD process. Once the methane production process is inhibited or the hydrolysis process is too fast, the COD value will increase significantly. Table 2 shows that the COD values in each group were similar, between 8000 and 11,000 mg/L at different stirring velocities, indicating that there was no accumulation of intermediate products. In the AD process, the concentration of ammonia nitrogen has a great influence on methanogens. When the AN concentration is 3000 mg/L, the process will be inhibited [38]. For the stirring linear velocity of 88 cm/s, 66 cm/s, 44 cm/s, 22 cm/s, and 0 cm/s, the AN concentrations were 771 mg/L, 682 mg/L, 759 mg/L, 654 mg/L, and 855 mg/L, respectively. The AN concentration in each digester was kept at a low level. Therefore, the DAD system operated stably without AN inhibition. In summary, the DAD system was stable, and no toxicity inhibition occurred, as mechanical stirring at liner velocities of 88 cm/s, 66 cm/s, 44 cm/s, and 22 cm/s promoted the mass transfer.
3.2. CFD Simulation
The flow field in the digester at different stirring velocities was studied using CFD methods. The velocity cloud diagram of the reactor in the x radial direction (x = 0) at different stirring velocities in the uniform stirring process was obtained through numerical simulation (Figure 6). When the linear rotation velocity was 22 cm/s, the overall velocity of biomass materials was low, and the velocity was high only around the stirring blade. When the linear velocity of stirring increased gradually from 22 cm/s to 88 cm/s, in turn, the velocity of the material around the stirring paddle increased from 0.06 m/s to 0.30 m/s, and the velocity near the reactor wall rose from 0.01 m/s to 0.05 m/s. The mixing intensity of materials in the reactor was gradually strengthened. A high velocity increases the overall flow velocity in the reactor and promotes mass transfer, which was consistent with the results of Wang et al. [39]. In addition, the comparison of the stirring velocities of 22 cm/s and 88 cm/s showed that the difference in the velocity radial distribution was reduced at higher velocity, and the velocity of the substrate tended to be more consistent. The results showed that the high stirring velocity was conducive to uniform mixing of materials. When the peripheral stirring linear velocity was 88 cm/s, the materials were in full contact with the microorganisms, and the organic acid produced in the acidogenesis stage can be effectively used by methanogens in time, avoiding the inhibition caused by the accumulation of local VFAs; therefore, the DAD process achieved a higher biogas yield.
Figure 6 shows that the maximum velocity in the digestion reactor occurred near the stirring blade, while the velocity in the middle of the two layers of blades varied slightly. The two graphs of the velocity profile regarding the diameter of the reactor (Figure 7) were obtained by calculating the velocity on the cross sections of the center of the low blade (Z = 70 mm) and the middle position of the reactor (Z = 150 mm). Figure 7 displays the inverted U-shaped and U-shaped velocity curves due to the different directions on both sides of the stirring blade. It can be seen that at different stirring velocities, the velocities reached the maximum at a distance of ±0.05 m from the stirring shaft at both the bottom (Z = 70 mm) and middle (Z = 150 mm) of the reactor. When the linear velocity of stirring was 88 cm/s, the maximum velocity of the material movement at the bottom of the reactor was 0.30 m/s, and the maximum velocity of the material movement in the middle of the reactor was approximately 0.16 m/s. The mixing intensity in the middle of the reactor was weaker compared with the mixing intensity near the low stirring blade.
The shearing force is an important mixing parameter and could influence the homogeneity of the DAD process. Figure 8 shows the shearing force vector varying with the diameter of the reactor during uniform stirring at the low blade of the reactor (Z = 70 mm) and the middle position of the reactor (Z = 150 mm). It can be seen that near the low blade in the radial distance from −0.1 m to 0.02 m, the absolute value of shearing force gradually decreased from 15 N/m2 to 0 N/m2 and then increased to 20 N/m2. When the position was close to the center, the shearing force varied sharply and dropped quickly to about −140 N/m2. It showed that the shearing force varied and fluctuated greatly near the low stirring blade, and the absolute value of the shearing force near the stirring shaft was the largest. In Figure 7, the rate of velocity change was relatively slow when the radial distance of the reactor was at a distance of ±0.05 m from the stirring shaft. Since the shearing force was positively correlated with the rate of velocity change, the shearing force approached 0.0 N/m2 at a distance of ±0.05 m from the stirring shaft as shown in Figure 8. When it was near the stirring shaft, the rate of velocity change was the highest, so the shearing force at the radial distance close to the center was the largest. In addition, when the linear velocity of the stirring paddle was 88 cm/s, the shearing force at a radial distance of ±0.1 m was about +15 N/m2, and the shearing force at a radial distance close to the center was about −140 N/m2, while the shearing force with a linear stirring velocity of 22 cm/s was between ±5 N/m2. The shearing force of the linear stirring velocity of 88 cm/s was much higher than that of the linear stirring velocity of 22 cm/s, which indicated that the higher linear stirring velocity led to the higher shearing force. It can be concluded that the shearing force in the middle of the reactor varied less than that in the position of the low stirring blade. When it was near the stirring shaft, the shearing force was only 20 N/m2.
The level of the shearing force is also linked to the growth and reproduction of microorganisms [40]. Shearing has a noticeable effect on the microbial population, by improving the diversity and evenness at intermediate shearing. However, it was also reported that a high level of shearing decreased the microbial diversity in the digester [16]. The high activity of sludge particles is a necessary condition to ensure the progress of AD. The sludge particles deformed into a flat oval shape under strong stirring, and this deformation was caused by abrasion instead of extrusion [41]. Therefore, the final effect of stirring on the AD performance is determined by two opposite factors: mass transfer and microbial community. Considering that increasing stirring can promote the hydrolysis process and increase the VFA concentration in the system, the stirring intensity needs to be reduced, such as 22 cm/s or even no stirring in the DAD process, especially during the start-up stage. Thus, the methanogens can digest the intermediate products and avoid the accumulation of VFAs, which may cause system instability [42]. After DAD starts normally, the stirring intensity can be appropriately increased, such as 88 cm/s, and the intermittent stirring must be slowly increased and decelerated to minimize the impact of the shearing force on microorganisms.
3.3. The Influence of Different Height to Diameter Ratios on Dry Digestion
In addition to mechanical stirring, percolate recirculation is another way to enhance AD. To increase the capacity of reactor with a fixed diameter, a high reactor is favorable for treating a larger amount of MSW. In this study, the impacts of different stacking heights of substrate on DAD were investigated when the leachate was refluxed. The ratios of the material stacking height to the reactor diameter were chosen as 3:2, 1.5:2, and 1:2. The cumulative biogas production, cumulative methane production, and pH values were compared when AD was conducted at different height-to-diameter ratios (H/D).
Figure 9 shows the cumulative biogas and methane production at different height-to-diameter ratios. It can be seen that the biogas yield varied greatly with different H/D ratios. When the H/D was 3:2, the cumulative biogas yield and methane yield were 407 mL/g VS and 247 mL/g VS, 25% and 44% higher than the case of H/D of 1:2. Li et al. [43] studied the performance of AD with different H/D ratios and found that the increase in the H/D was beneficial to the formation of aerobic granular sludge and increased the size of granular sludge. It indicated that the high degree of material stacking was beneficial to increase the processing capacity of the reactor and enhance the biogas production with hydraulic stirring or mechanical stirring to promote mass transfer.
Figure 10 shows the variation of the methane content with the digestion time at different H/D ratios. The methane content gradually increased to 65% on the 10th day and then fluctuated around 70%. The methane content in the biogas of each experimental group exhibited a similar growth pattern at different H/D ratios. The differences in the methane content could be neglected with H/D ratios of 3:2, 1.5:2, and 1:2, indicating the material stacking height had a minor effect on the methane content in the process of leachate reflux to promote mass transfer.
Table 3 shows the pH value, COD, and ammonia nitrogen concentration. When H/D was 3:2, the COD value was 12,824 mg/L, which was much higher than those in the DAD system with H/D ratios of 1.5:2 and 1:2. The ammonia nitrogen concentration and pH values were the highest among the three experimental groups because microorganisms continued to contact the low layer materials as the leachate percolated in the reactor with an H/D of 3:2 and promoted the hydrolysis of the substrate and the acidogenic stage. Hence, the intermediate product accumulated in the reaction system and led to the increase in COD. With the deep hydrolysis of substrate, more ammonia nitrogen was released; therefore, the AN in the system with an H/D of 3:2 was higher than that in other groups. When the material stacking degree was high, the substrate was continuously hydrolyzed to provide raw materials for the methanogenic process, and finally, a higher cumulative biogas output was obtained, which indicated that a certain height of material stacking was necessary for the DAD process, for example, at an H/D of 3:2.
The DAD process with H/D = 3:2 achieved higher biogas and methane production, as well as higher COD and AN concentrations, than that with H/D ratios of 1.5:2 and 1:2, probably due to the sedimentation path of the leachate in the material layers at different heights as shown in Figure 11.
When the H/D was 1:2 (Figure 11a), due to the low stacking height of the biomass materials, a gas passage was formed in the biomass layer upon the escape of the generated biogas, which provided a short passage for the leachate. After the leachate was sprayed on the upper surface of the substrate, it gradually gathered, sank, and finally went down to the bottom of the reactor directly along the gas path. The short passage in the material layer, which caused the leachate to directly flow away through the gap between the particles, resulted in an inhomogeneous mixing of microbials with intermediate products and solid materials. Therefore, the hydrolysis, acidogenesis, and methanogenesis processes were all affected. As a result, the incomplete hydrolysis of the substrate produced very little intermediate products. As VFAs in the leachate were low, the concentration of AN was correspondingly reduced, reducing the methane output. When the H/D was 3:2, the relatively high material stacking height extended the sinking path of the leachate, which increased the contact time between the leachate and biomass material. On the other hand, Figure 11b shows the accumulation of biogas at the bottom of the digester and densely packed due to the influence of gravity, and the newly generated biogas was trapped in the packed material due to the insufficient pressure. When the gas in the gray area increased to produce a certain pressure, it broke through the resistance of the material and escaped upward. At the same time, the material was vibrated. Due to the gravity of the material, even if a new gas passage was generated upon the escape of biogas, it would be compressed, squeezed, and even completely blocked by the sinking material. This avoided the leachate forming a short passage in the material layer. A long residence time was required for the leachate to settle to the bottom of the reactor, which promoted the contact between the microorganisms and the substrate and improved the hydrolysis and methane production in DAD.
Methanogens can be affected by various environmental factors such as VFAs, pH values, ammonia nitrogen, etc., and the activity of methanogens directly affects the biogas production and methane content. Therefore, to reveal the relationship between the microbial community and system functions, it is of great significance to investigate the activity of methanogenic bacteria under different operation conditions. It is obvious from Figure 12a,c that the number of methanogenic bacteria colonies in the leachate was higher than that in the biomass material layer. The fluorescence intensity of methanogens in the leachate was high, bright, and clear. The image of the methanogens in the material layer was relatively dim. Since the fluorescence observation utilized the coenzyme F420 in methanogens that can emit fluorescence under a laser with a wavelength of 420 nm, this indicated that the activity of methanogens in the leachate was higher than that in the biomass material layer. Through the recirculation of leachate, the microorganisms and the substrate were effectively mixed. The residence time of the leachate in the reactor with an H/D of 3:2 was long. Compared with the reactor with a low material stacking height, the higher stacked material enriched the methanogenic bacteria community in the biomass layer and improved the activity of methanogens. Therefore, the reactor with an H/D ratio of 3:2 obtained a high cumulative biogas production. Further amplifying to observe the methanogenic bacteria in the leachate and the material layer, it can be seen from Figure 12b,d that there were a large number of rod-shaped bacteria in the biomass layer, and the leachate was mainly globular bacteria. Methanobacterium were usually hydrogen-trophic, and hydrogen was often produced during the process of substrate hydrolysis and acid production. Therefore, the material layer was more conducive to the growth of Methanobacterium. Zhu et al. [44] detected Triceratops methanogens in an AD reactor and observed similar cocci in the FISH (Fluorescence in situ Hybridization) graph as shown in Figure 12d. Mixing two different types of methanogens through the recirculation of leachate can increase the abundance and diversity of the bacterial flora in the substrate. The two types of bacteria consumed the hydrolysate together, which was beneficial to the rapid and stable operation of the methanogenesis stage.
3.4. Comparison and Combination of Mechanical Mixing and Percolate Recirculation
According to the results shown above, when the mechanical stirring linear velocity was 88 cm/s, the cumulative biogas production was 391 mL/g VS. With an H/D of 3:2, the cumulative biogas production was 407 mL/g VS with percolate recirculation. The biogas gas yield with percolate recirculation to enhancing mass transfer in DAD was higher than that of mechanically agitated AD. Comparing Figure 5 and Figure 10, it can be seen that the methane content in the biogas was about 65% during mechanical stirring, while in the percolate recirculation experiment, the methane content in the biogas was about 70%. This revealed that the recirculation of leachate was beneficial to the production of methane. The low methane content in mechanically agitated AD was probably because the shearing force formed by mechanical stirring inevitably had a negative impact on the microbial community [10]. By destructing the micro-environment surrounding the methanogens, the methanogenesis performance was reduced in the mechanically stirred reactor. The reflux of leachate could promote the contact of microorganisms with the substrate, and the mild operation helped to maintain the activity of methanogens. Therefore, the methane content in the reactor with the reflux of leachate was relatively high. However, the mass transfer method of percolate recirculation presents several technical issues in engineering applications. For example, the pipelines were extremely easy to block, and the amount of leachate was small in DAD. The leachate dripping onto the surface of solid materials cannot form a uniform spray. These all needed to be considered toward practical applications.
A DAD process was conducted combining the percolate recirculation and mechanical stirring. The leachate was circulated once every 24 h. And the reactor was stirred once between the circulation (i.e., at the 12th hour in the middle); each stirring lasting for 10 min, with the liner velocity at 88 cm/s. The enhanced mixing strategy was compared with the static reactor to investigate its effect on the performances of DAD. The cumulative biogas yield and methane content are shown in Figure 13. The combination of mechanical stirring and percolate recirculation significantly increased the cumulative biogas yield to 425 mL/g VS, 28% higher than the static DAD process. This suggested that the combination of the two mixing methods played a significant role in mass transfer. However, the methane content in the static reactor was relatively higher than the other during the initial 20 days of digestion. This may be because the mechanical stirring reduced the activity of methanogens, resulting in a slight decrease in the performance of the reactor, which had recirculated the leachate and stirred the material in the initial stage. From the 20th day to the 50th day, the methane content in the static reactor had little difference compared with the reactor (mixing and percolate recirculation), indicating that when the DAD entered the stable stage of gas production, the side effects of stirring on methanogens were offset by the reflux of leachate, so the methane content remained at a relatively high level.
4. Conclusions
The impacts of mechanical stirring and percolate recirculation on the performances of the DAD were investigated on the performances of the DAD with sorghum stalks as the substrate in the batch process. When the stirring linear velocity was 88 cm/s, the cumulative biogas yield and methane yield were the highest. During the start-up stage of DAD, excessive stirring intensity affected the activity of methanogens, and the methane content in the biogas decreased. While in the stable stage, a high intensity of stirring promoted the biomass hydrolysis and increased the biogas production. The results of percolate recirculation exhibited that higher cumulative biogas yield and methane yield were obtained when the H/D ratio was 3:2, compared with H/D ratios of 1.5:2 and 1:2. By combining the percolate recirculation with mechanical stirring, the cumulative biogas yield was 28% higher than the static process. The combination of percolate recirculation and mechanical stirring can not only solve the mass transfer problem but can also lead to high biogas production, high reactor utilization, low wastewater output, and low post-treatment costs, suggesting the great potential of DAD for biomass waste treatment.
Author Contributions
Conceptualization, Z.Z. and W.L.; methodology, Y.Q.; software, Y.Q.; validation, Z.Z., Y.Q. and W.L.; formal analysis, Y.Q.; investigation, Z.Z.; resources, Z.Z.; data curation, S.C.; writing—original draft preparation, Z.Z.; writing—review and editing, S.Z., P.L. and W.L.; visualization, Z.Z. and Y.Q. All authors have read and agreed to the published version of the manuscript.
Funding
This research was funded by [National Natural Science Foundation of China] grant number [No. 21878313]; [Science and Technology Program of Guiyang City] grant number [[2020]-18-8]; [Science and Technology Program of Guanshanhu District] grant number [03]; [Key Research and Development Program of Hebei Province] grant number [21373303D]; [Science and Technology Support Project of Guizhou Province] grant number [[2019]2839]; [Distinguished Professor of Henan Province] grant number [220508001]; [funding projects that guide local scientific and technological development of the Hebei Provincial Department of Science and Technology] grant number [236Z4504G] and [Science and Technology Project of Hebei Education Department] grant number [ZD2022053].
Data Availability Statement
Data is contained within the article.
Conflicts of Interest
The authors declared no conflicts of interest.
References
- Zhang, L.; Kuroki, A.; Loh, K.-C.; Seok, J.K.; Dai, Y.; Tong, Y.W. Highly efficient anaerobic co-digestion of food waste and horticultural waste using a three-stage thermophilic bioreactor: Performance evaluation, microbial community analysis, and energy balance assessment. Energy Convers. Manag. 2020, 223, 113290. [Google Scholar] [CrossRef]
- El Ibrahimi, M.; Khay, I.; El Maakoul, A.; Bakhouya, M. Techno-economic and environmental assessment of anaerobic co-digestion plants under different energy scenarios: A case study in Morocco. Energy Convers. Manag. 2021, 245, 114553. [Google Scholar] [CrossRef]
- Sun, J.; Kosaki, Y.; Kawamura, K.; Watanabe, N. Operational load enhancement for an anaerobic membrane bioreactor through ethanol fermentation pretreatment of food waste. Energy Convers. Manag. 2021, 249, 114840. [Google Scholar] [CrossRef]
- Zhang, Z.; Zhang, G.; Li, W.; Li, C.; Xu, G. Enhanced biogas production from sorghum stem by co-digestion with cow manure. Int. J. Hydrog. Energy 2016, 41, 9153–9158. [Google Scholar] [CrossRef]
- Li, W.; Xu, G. Enhancement of anaerobic digestion of grass by pretreatment with imidazolium-based ionic liquids. Environ. Technol. 2016, 38, 1843–1851. [Google Scholar] [CrossRef]
- Li, W.; Loh, K.-C.; Zhang, J.; Tong, Y.W.; Dai, Y. Two-stage anaerobic digestion of food waste and horticultural waste in high-solid system. Appl. Energy 2018, 209, 400–408. [Google Scholar] [CrossRef]
- Mavridis, S.; Voudrias, E.A. Using biogas from municipal solid waste for energy production: Comparison between anaerobic digestion and sanitary landfilling. Energy Convers. Manag. 2021, 247, 114613. [Google Scholar] [CrossRef]
- Guendouz, J.; Buffière, P.; Cacho, J.; Carrère, M.; Delgenes, J.-P. Dry anaerobic digestion in batch mode: Design and operation of a laboratory-scale, completely mixed reactor. Waste Manag. 2010, 30, 1768–1771. [Google Scholar] [CrossRef]
- Li, W.; Lu, C.; An, G.; Chang, S. Comparison of Alkali-Buffering Effects and Co-digestion on High-Solid Anaerobic Digestion of Horticultural Waste. Energy Fuels 2017, 31, 10990–10997. [Google Scholar] [CrossRef]
- Singh, B.; Szamosi, Z.; Siménfalvi, Z. State of the art on mixing in an anaerobic digester: A review. Renew. Energy 2019, 141, 922–936. [Google Scholar] [CrossRef]
- Zhai, X.; Kariyama, I.D.; Wu, B. Investigation of the effect of intermittent minimal mixing intensity on methane production during anaerobic digestion of dairy manure. Comput. Electron. Agric. 2018, 155, 121–129. [Google Scholar] [CrossRef]
- Wu, B. CFD simulation of gas and non-Newtonian fluid two-phase flow in anaerobic digesters. Water Res. 2010, 44, 3861–3874. [Google Scholar] [CrossRef]
- Wu, B. CFD Prediction of Mixing Time in Anaerobic Digesters. Trans. ASABE 2010, 53, 553–563. [Google Scholar] [CrossRef]
- Mohammadrezaei, R.; Zareei, S.; Khazaei, N.B. Optimum mixing rate in biogas reactors: Energy balance calculations and computational fluid dynamics simulation. Energy 2018, 159, 54–60. [Google Scholar] [CrossRef]
- Ghanimeh, S.; El Fadel, M.; Saikaly, P. Mixing effect on thermophilic anaerobic digestion of source-sorted organic fraction of municipal solid waste. Bioresour. Technol. 2012, 117, 63–71. [Google Scholar] [CrossRef] [PubMed]
- Lebranchu, A.; Delaunay, S.; Marchal, P.; Blanchard, F.; Pacaud, S.; Fick, M.; Olmos, E. Impact of shear stress and impeller design on the production of biogas in anaerobic digesters. Bioresour. Technol. 2017, 245, 1139–1147. [Google Scholar] [CrossRef]
- Zhang, W.; Zhao, Q.; Hu, K. Influence of mixing time on the performance of anaerobic digestion of sewage sludge. J. Nat. Sci. Heilongjiang Univ. 2011, 28, 383–387. [Google Scholar]
- Lindmark, J.; Eriksson, P.; Thorin, E. The effects of different mixing intensities during anaerobic digestion of the organic fraction of municipal solid waste. Waste Manag. 2014, 34, 1391–1397. [Google Scholar] [CrossRef]
- Lindmark, J.; Thorin, E.; Bel Fdhila, R.; Dahlquist, E. Effects of mixing on the result of anaerobic digestion: Review. Renew. Sustain. Energy Rev. 2014, 40, 1030–1047. [Google Scholar] [CrossRef]
- Li, L.-L.; Tong, Z.-H.; Fang, C.-Y.; Chu, J.; Yu, H.-Q. Response of anaerobic granular sludge to single-wall carbon nanotube exposure. Water Res. 2015, 70, 1–8. [Google Scholar] [CrossRef]
- Azargoshasb, H.; Mousavi, S.; Amani, T.; Jafari, A.; Nosrati, M. Three-phase CFD simulation coupled with population balance equations of anaerobic syntrophic acidogenesis and methanogenesis reactions in a continuous stirred bioreactor. J. Ind. Eng. Chem. 2015, 27, 207–217. [Google Scholar] [CrossRef]
- Huang, Y.; Dehkordy, F.M.; Li, Y.; Emadi, S.; Bagtzoglou, A.; Li, B. Enhancing anaerobic fermentation performance through eccentrically stirred mixing: Experimental and modeling methodology. Chem. Eng. J. 2018, 334, 1383–1391. [Google Scholar] [CrossRef]
- Inglès, X.; Pallares, J.; Larre, M.T.; Méndez, L.; Grau, F.X. Experimental and numerical study of turbulent mixing in a model of a polymerization reactor. J. Ind. Eng. Chem. 2012, 19, 1251–1256. [Google Scholar] [CrossRef]
- Wu, B. CFD investigation of turbulence models for mechanical agitation of non-Newtonian fluids in anaerobic digesters. Water Res. 2011, 45, 2082–2094. [Google Scholar] [CrossRef] [PubMed]
- Cao, X.; Li, C.; Yang, P.; Wang, Y.; Wang, L. Optimal analysis on the mixing condition of sludge in the process of anaerobic digestion. Environ. Sci. Technol. 2015, 38, 100–105. [Google Scholar]
- Rocamora, I.; Wagland, S.T.; Villa, R.; Simpson, E.W.; Fernández, O.; Bajón-Fernández, Y. Dry anaerobic digestion of organic waste: A review of operational parameters and their impact on process performance. Bioresour. Technol. 2020, 299, 122681. [Google Scholar] [CrossRef]
- Wang, Y.; Wang, Z.; Zhang, Q.; Li, G.; Xia, C. Comparison of bio-hydrogen and bio-methane production performance in continuous two-phase anaerobic fermentation system between co-digestion and digestate recirculation. Bioresour. Technol. 2020, 318, 124269. [Google Scholar] [CrossRef]
- El Ibrahimi, M.; Khay, I.; El Maakoul, A.; Bakhouya, M. Food waste treatment through anaerobic co-digestion: Effects of mixing intensity on the thermohydraulic performance and methane production of a liquid recirculation digester. Process Saf. Environ. Prot. 2021, 147, 1171–1184. [Google Scholar] [CrossRef]
- Pezzolla, D.; Di Maria, F.; Zadra, C.; Massaccesi, L.; Sordi, A.; Gigliotti, G. Optimization of solid-state anaerobic digestion through the percolate recirculation. Biomass Bioenergy 2017, 96, 112–118. [Google Scholar] [CrossRef]
- Karim, K.; Hoffmann, R.; Klasson, K.T.; Al-Dahhan, M. Anaerobic digestion of animal waste: Effect of mode of mixing. Water Res. 2005, 39, 3597–3606. [Google Scholar] [CrossRef]
- Zhang, Z.; Li, W.; Zhang, G.; Xu, G. Impact of pretreatment on solid state anaerobic digestion of yard waste for biogas production. World J. Microbiol. Biotechnol. 2013, 30, 547–554. [Google Scholar] [CrossRef] [PubMed]
- Association, A.P.H. Standard Methods for the Examination of Water and Wastewater; American Public Health Association: Washington, DC, USA, 2005; pp. 387–388. [Google Scholar]
- Ghanimeh, S.A.; Al-Sanioura, D.N.; Saikaly, P.E.; El-Fadel, M. Correlation between system performance and bacterial composition under varied mixing intensity in thermophilic anaerobic digestion of food waste. J. Environ. Manag. 2018, 206, 472–481. [Google Scholar] [CrossRef] [PubMed]
- Li, P.; Liu, Y.; Li, X. Biogasification per formance of anaerobic co- digestion of kitchen residues and cattle manure. Renew. Energy Resour. 2008, 26, 64–68. [Google Scholar]
- Misiukiewicz, A.; Gao, M.; Filipiak, W.; Cieslak, A.; Patra, A.; Szumacher-Strabel, M. Review: Methanogens and methane production in the digestive systems of nonruminant farm animals. Animal 2020, 15, 100060. [Google Scholar] [CrossRef]
- Martin, D.; Potts, L.; Heslop, V. Reaction Mechanisms in Solid-State Anaerobic Digestion. Process Saf. Environ. Prot. 2003, 81, 171–179. [Google Scholar] [CrossRef]
- Martin, D.J. The Site of Reaction in Solid-State Digestion: A New Hypothesis. Process Saf. Environ. Prot. 2001, 79, 29–37. [Google Scholar] [CrossRef]
- Zhang, G.; Zhang, Z.; Li, C. Improvement of Solid-State Anaerobic Digestion of Yard Waste by Co-digestion and pH Adjustment. Waste Biomass Valorization 2017, 9, 211–221. [Google Scholar] [CrossRef]
- Wang, F.; Zhang, C.; Huo, S. Influence of fluid dynamics on anaerobic digestion of food waste for biogas production. Environ. Technol. 2016, 38, 1160–1168. [Google Scholar] [CrossRef]
- Kariyama, I.D.; Zhai, X.; Wu, B. Influence of mixing on anaerobic digestion efficiency in stirred tank digesters: A review. Water Res. 2018, 143, 503–517. [Google Scholar] [CrossRef]
- Jiang, J.; Wu, J.; Poncin, S.; Li, H.Z. Effect of hydrodynamic shear on biogas production and granule characteristics in a continuous stirred tank reactor. Process Biochem. 2016, 51, 345–351. [Google Scholar] [CrossRef]
- Nguyen, D.; Wu, Z.; Shrestha, S.; Lee, P.-H.; Raskin, L.; Khanal, S.K. Intermittent micro-aeration: New strategy to control volatile fatty acid accumulation in high organic loading anaerobic digestion. Water Res. 2019, 166, 115080. [Google Scholar] [CrossRef] [PubMed]
- Li, D.; Wang, Y.; Zhang, J. The impact of height/diameter ratio on aerobic granular sludge(AGS) system in domestic sewage. China Environ. Sci. 2019, 39, 141–148. [Google Scholar]
- Zhu, J.; Han, M.; Zhang, G.; Yang, L. Co-digestion of spent mushroom substrate and corn stover for methane production via sol-id-state anaerobic digestion. J. Renew. Sustain. Energy 2015, 7, 023135. [Google Scholar] [CrossRef]
Figure 1.
Setup for the mechanical agitating experiment: (a) schematic diagram and (b) device picture.
Figure 1.
Setup for the mechanical agitating experiment: (a) schematic diagram and (b) device picture.
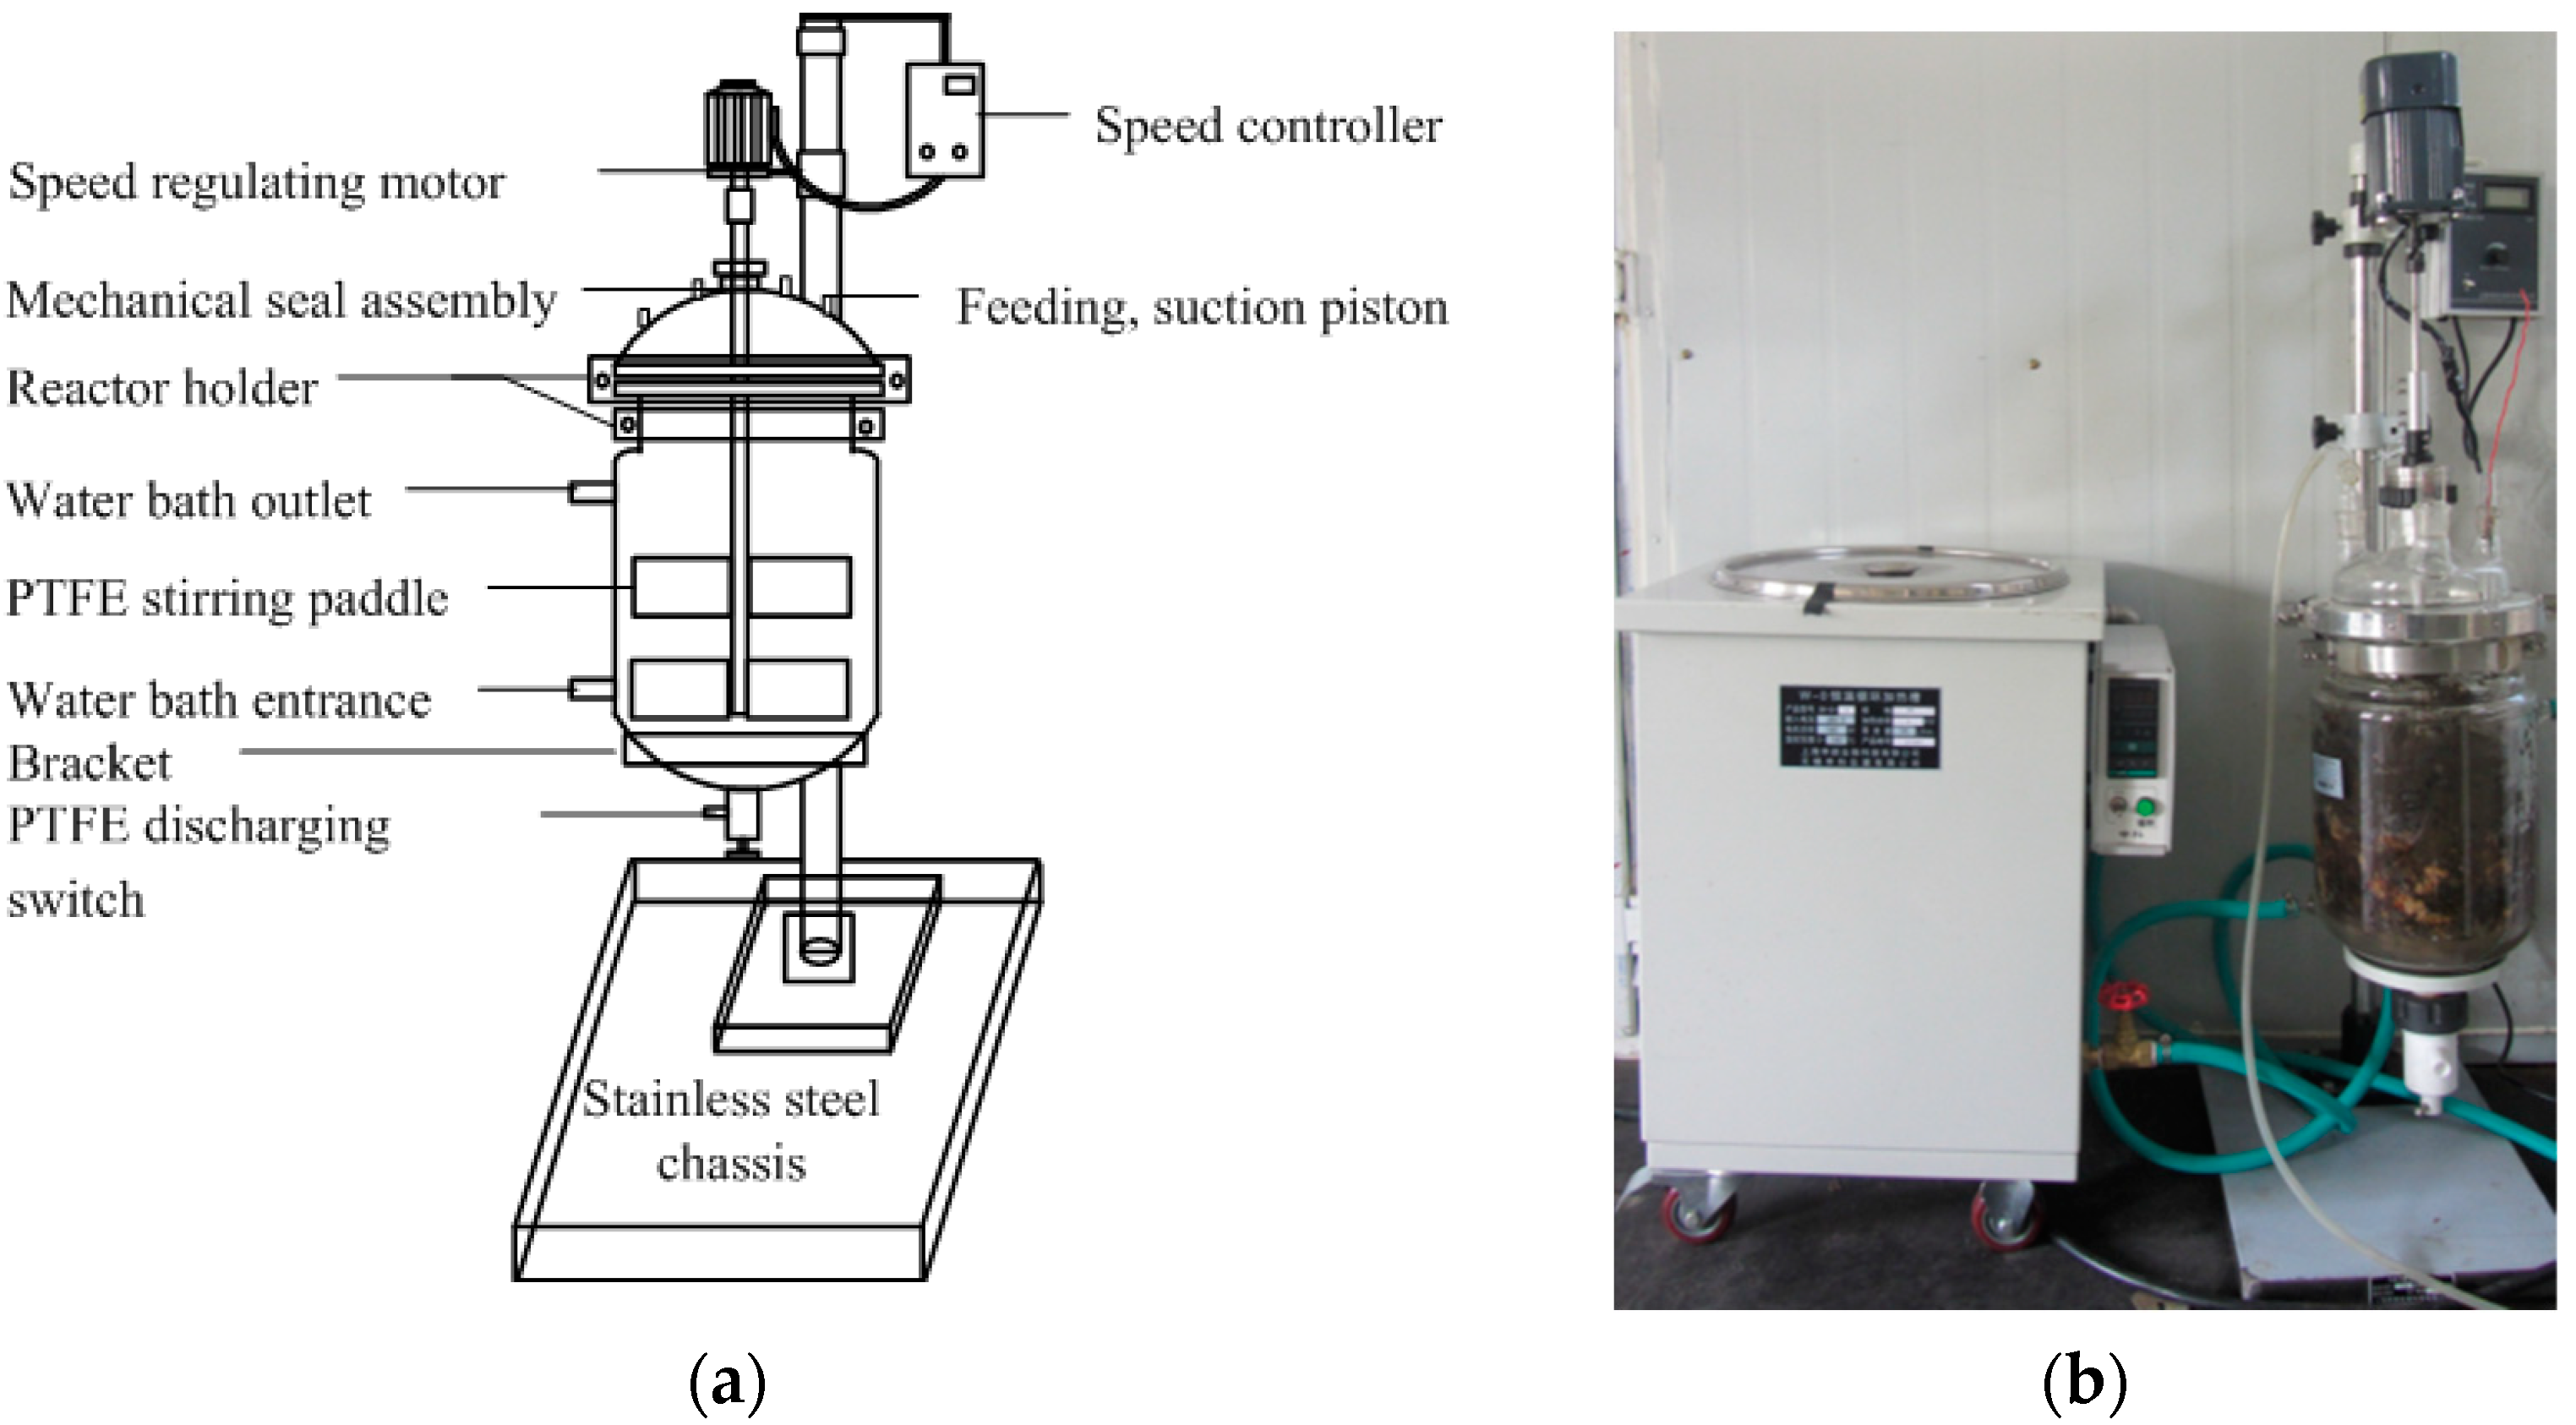
Figure 2.
Schematic diagram of the setup for the leachate recirculating experiment (1. anaerobic digester; 2. leachate container; 3. water bath system; 4. feed inlet; 5. spray; 6. pH meter; 7. temperature detector; 8. nitrogen gas pipe; 9. valve; 10. baffle; 11. pump; 12. biogas outlet; 13. sampling outlet).

Figure 3.
Grid diagram of digester.
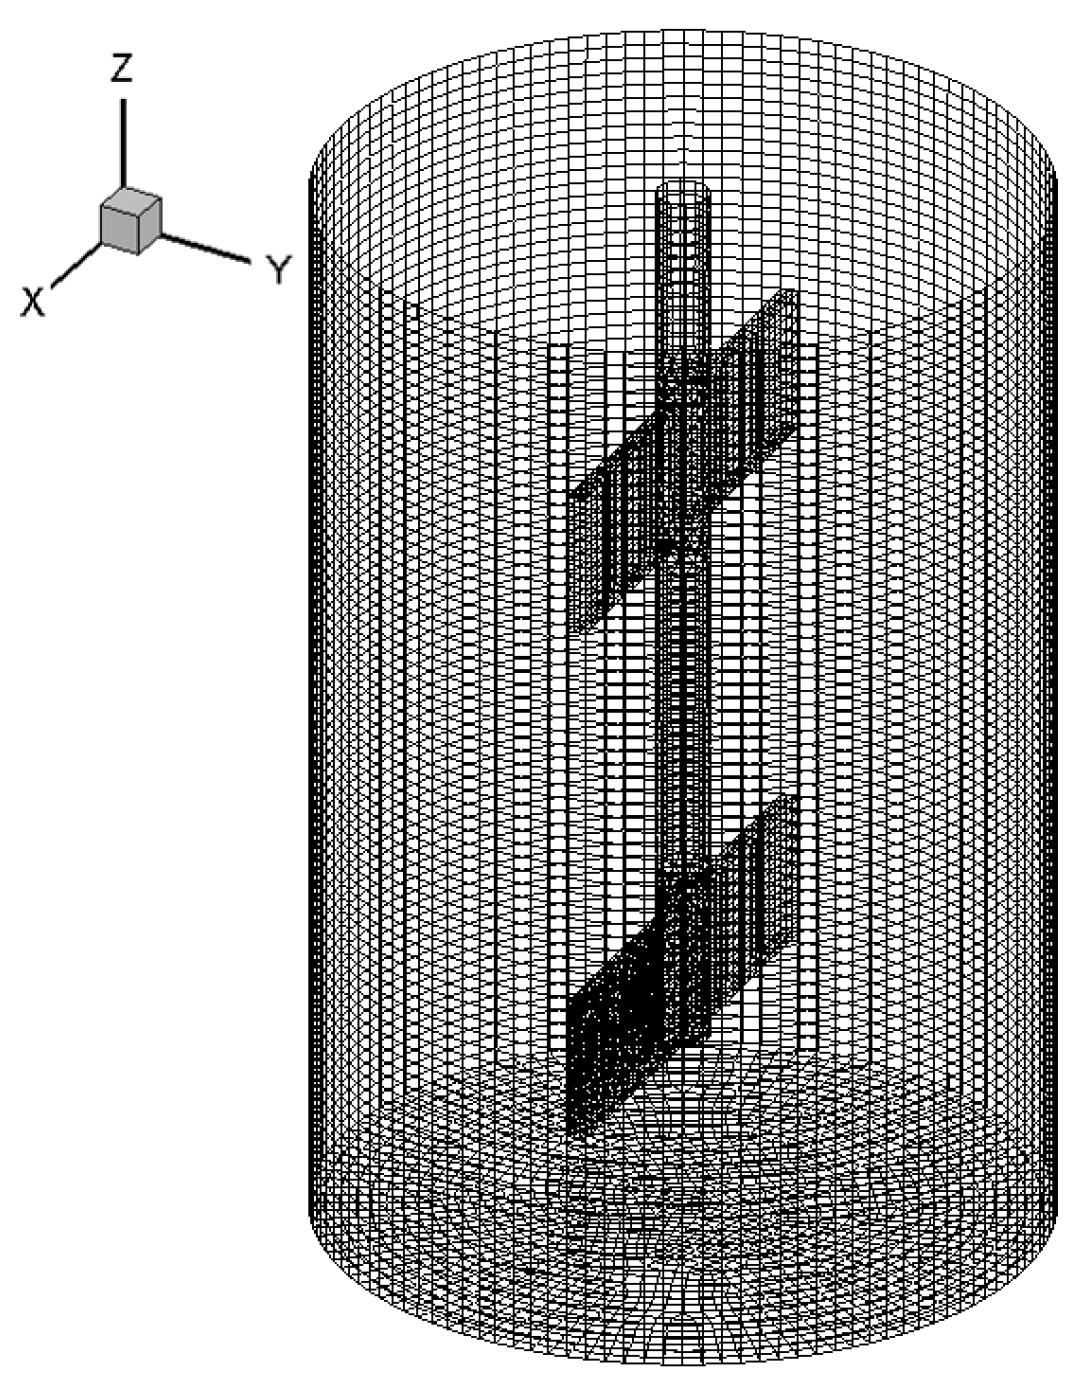
Figure 4.
Cumulative biogas and methane yield at different agitating velocities.

Figure 5.
Variation of methane content in biogas at different agitating velocities.
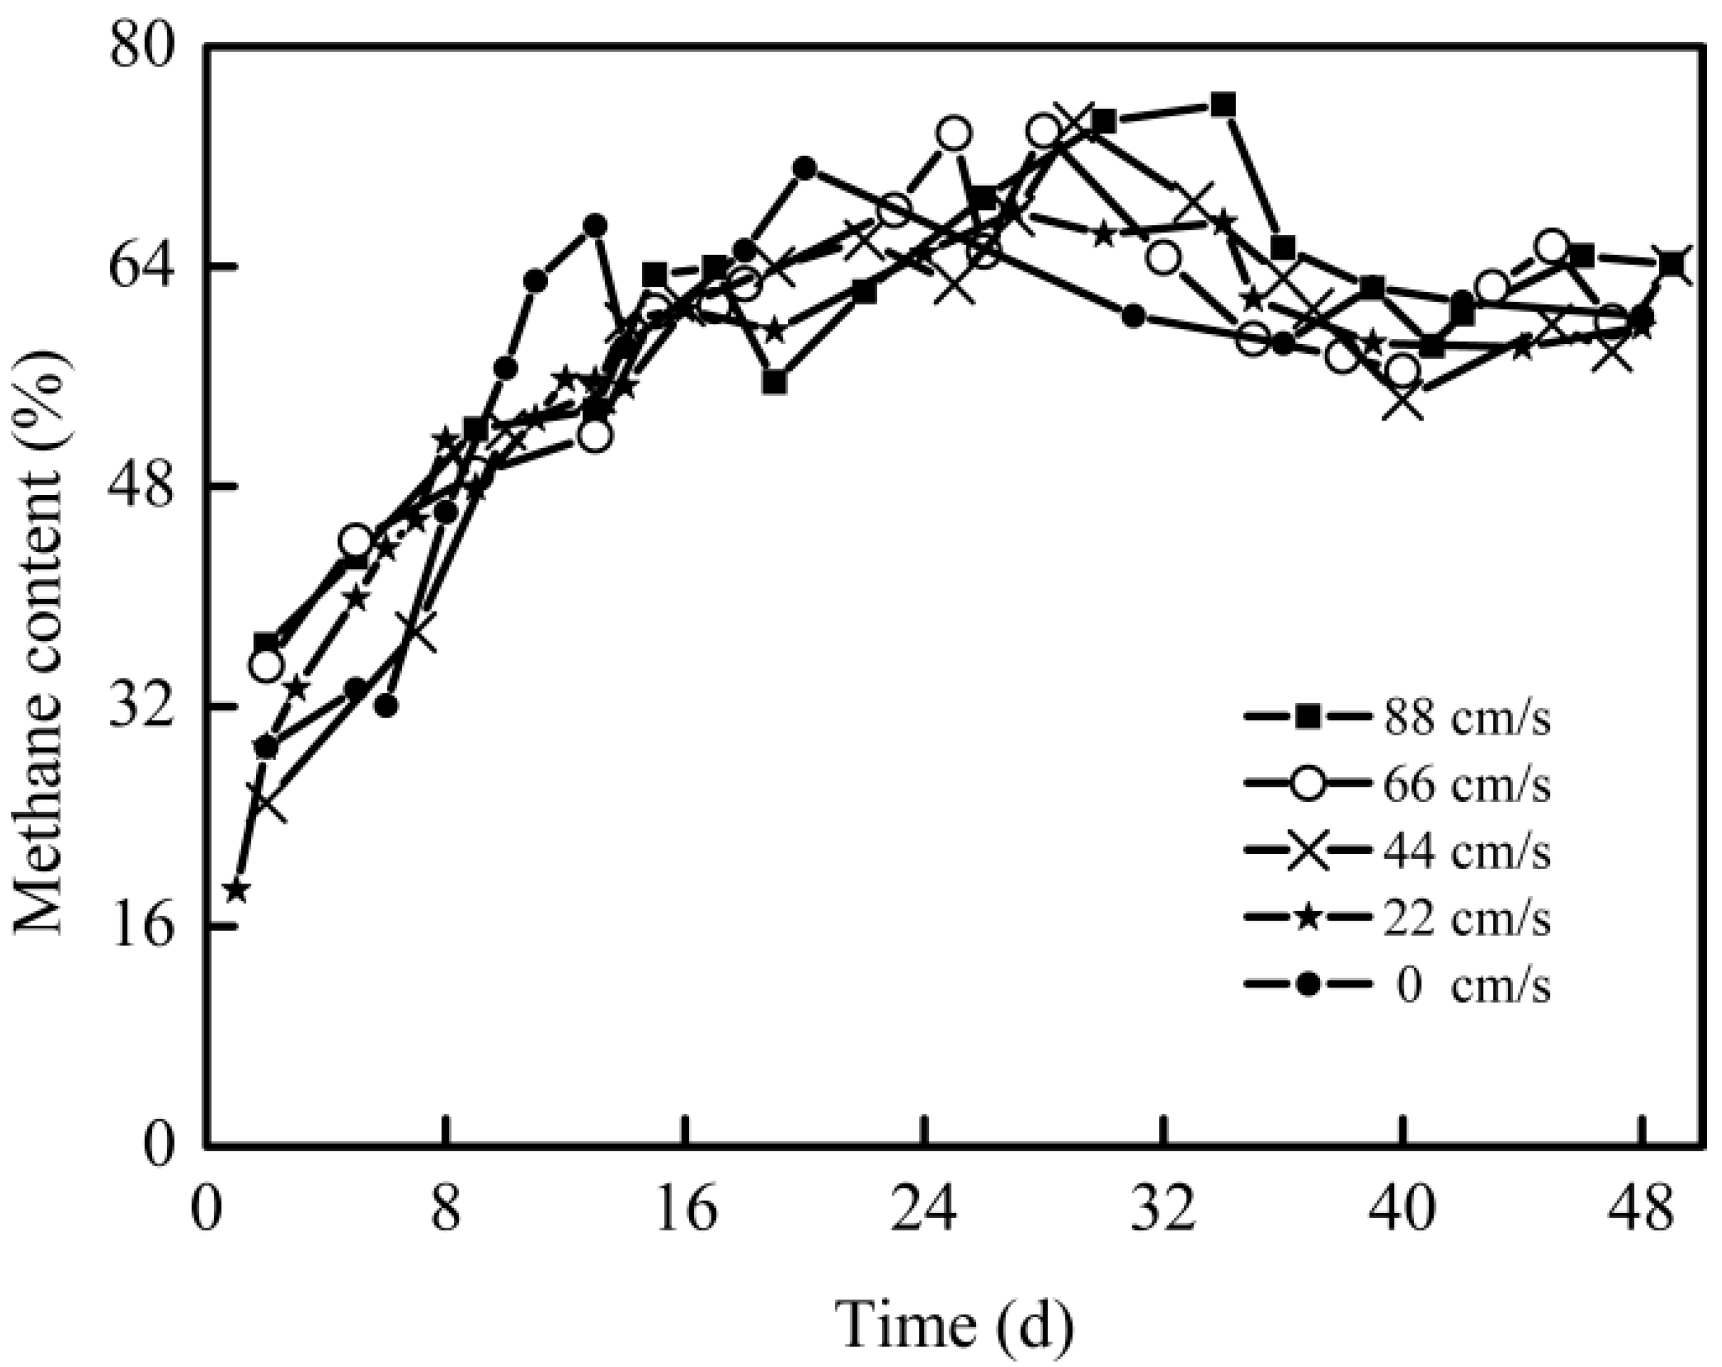
Figure 6.
Velocity contour graphs at different agitating velocities (a) 22 cm/s, (b) 44 cm/s, (c) 66 cm/s, and (d) 88 cm/s.
Figure 6.
Velocity contour graphs at different agitating velocities (a) 22 cm/s, (b) 44 cm/s, (c) 66 cm/s, and (d) 88 cm/s.
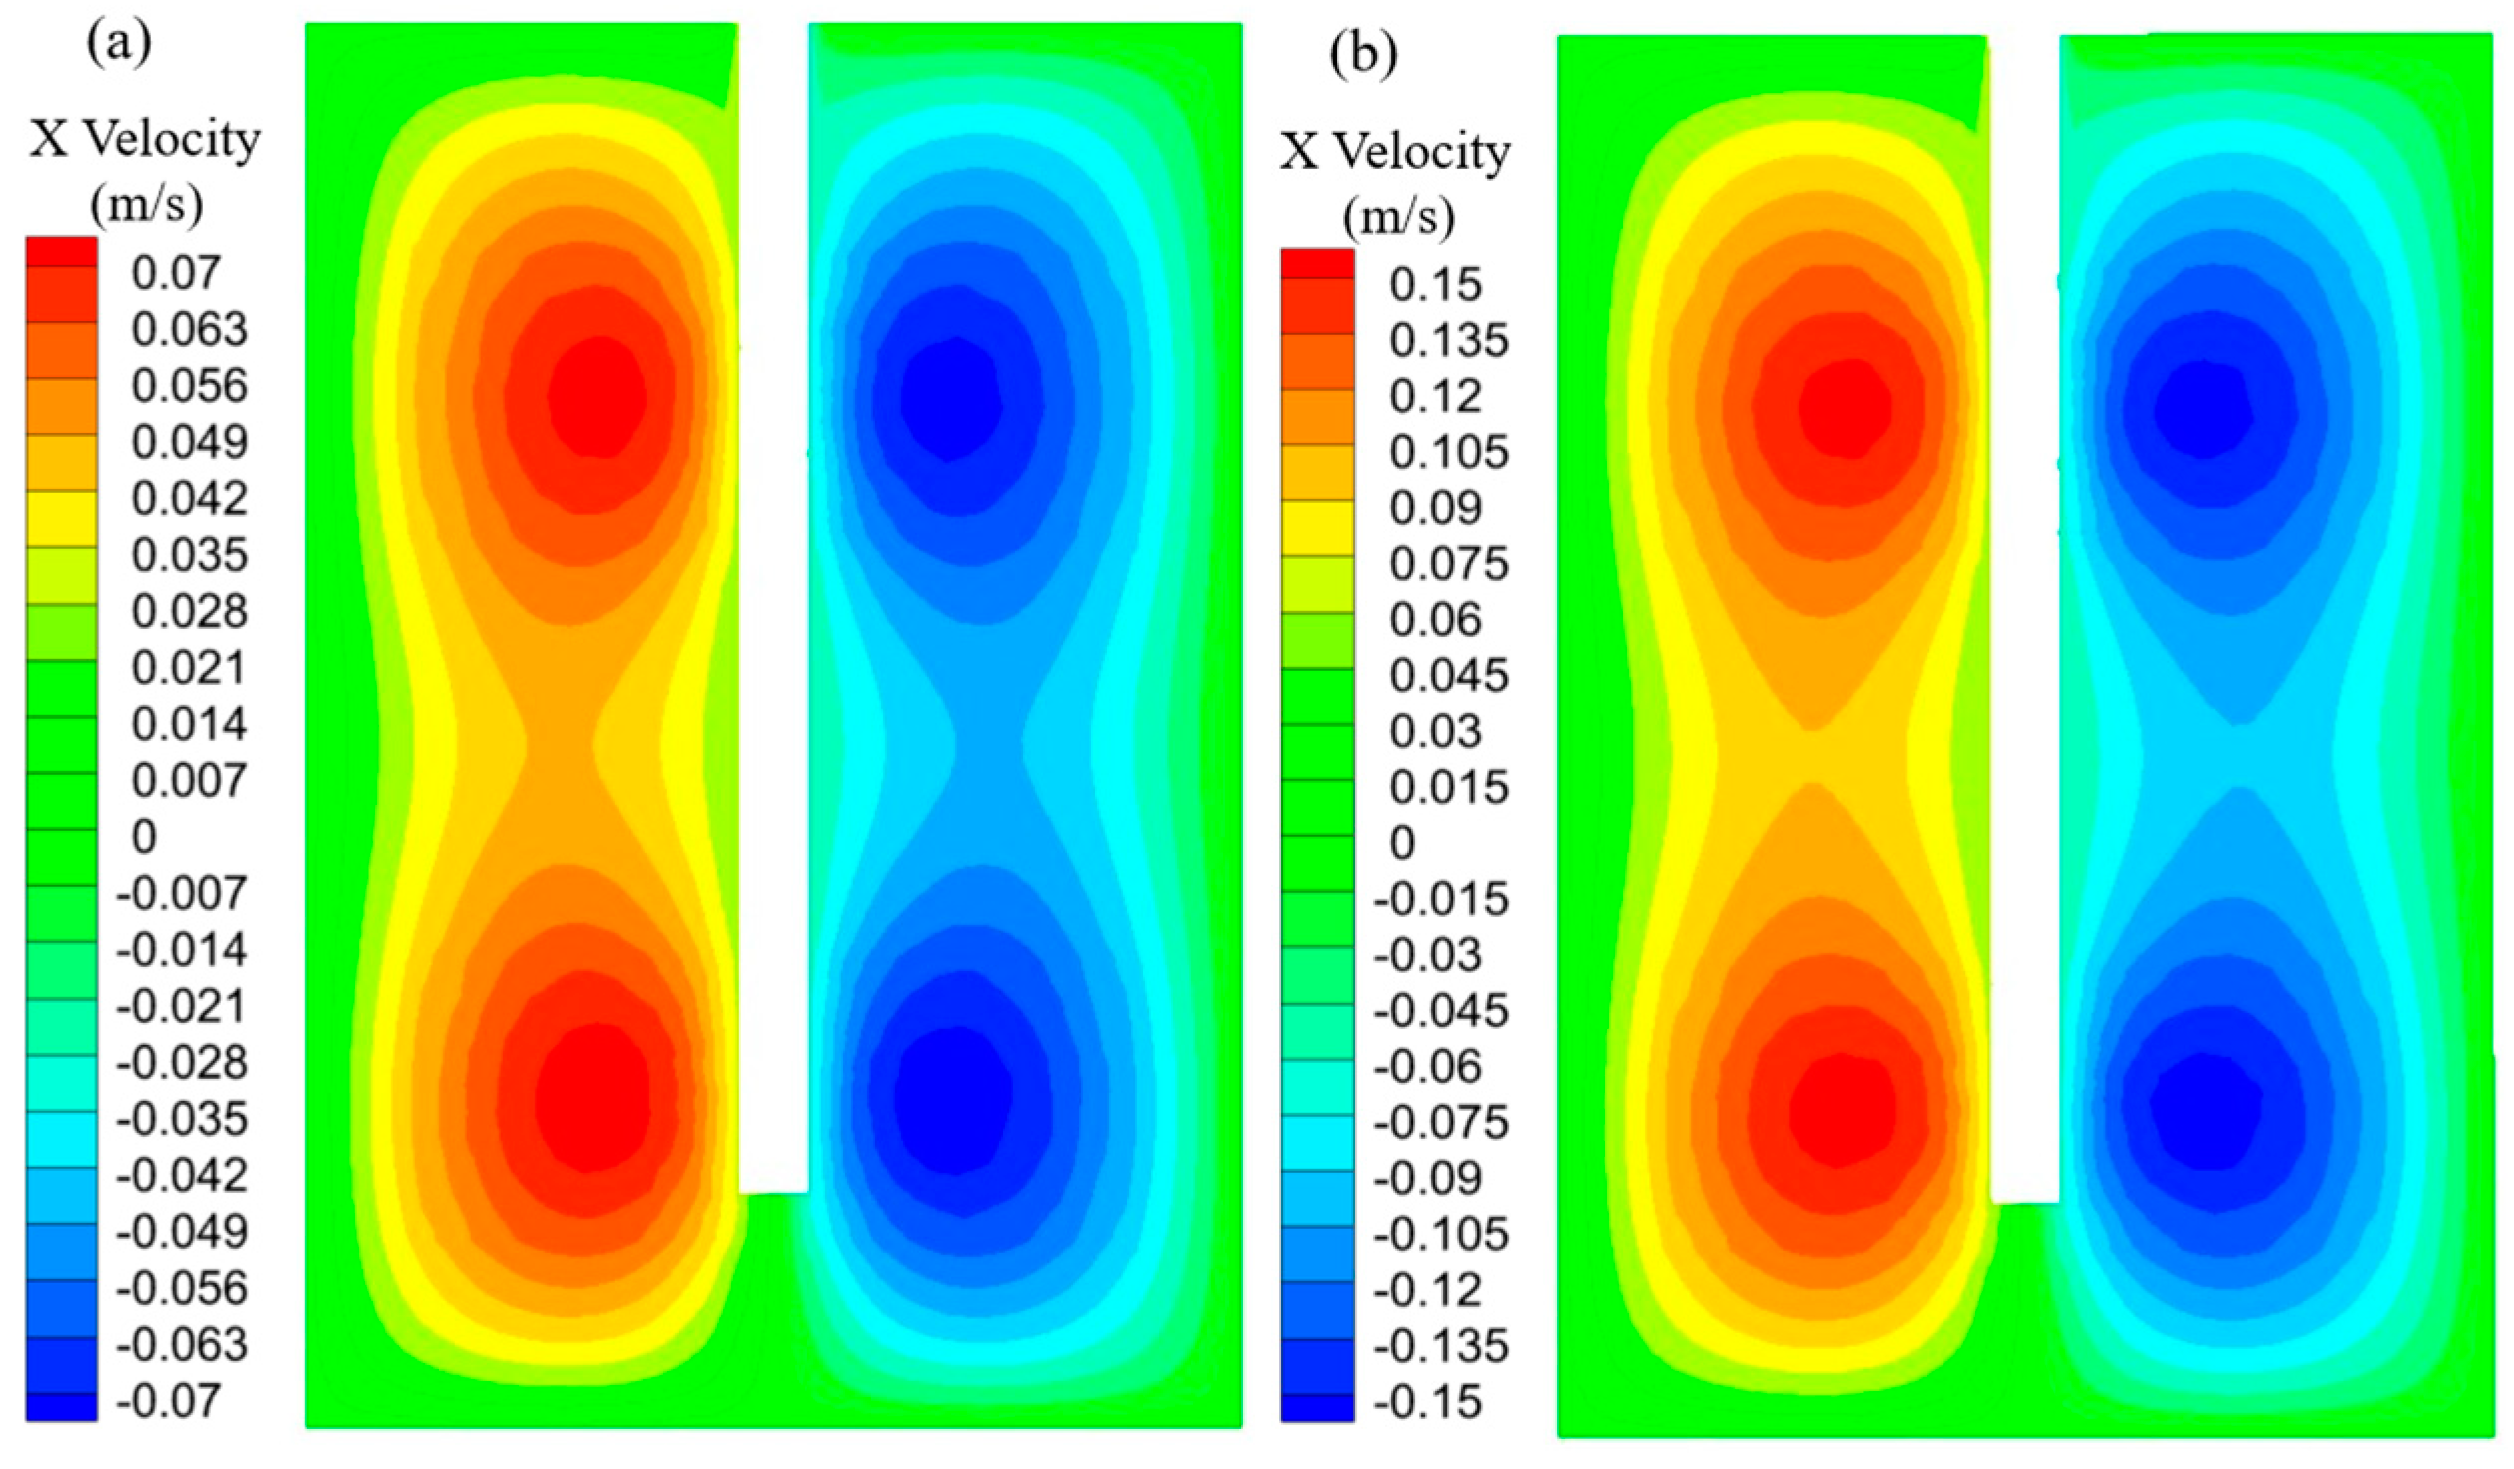

Figure 7.
Radial velocity at different heights of reactor: (a) Z = 70 mm and (b) Z = 150 mm.

Figure 8.
Radial shear stress at the low blade position ((a) Z = 70 mm) and in the middle of the digester ((b) Z = 150 mm).
Figure 8.
Radial shear stress at the low blade position ((a) Z = 70 mm) and in the middle of the digester ((b) Z = 150 mm).
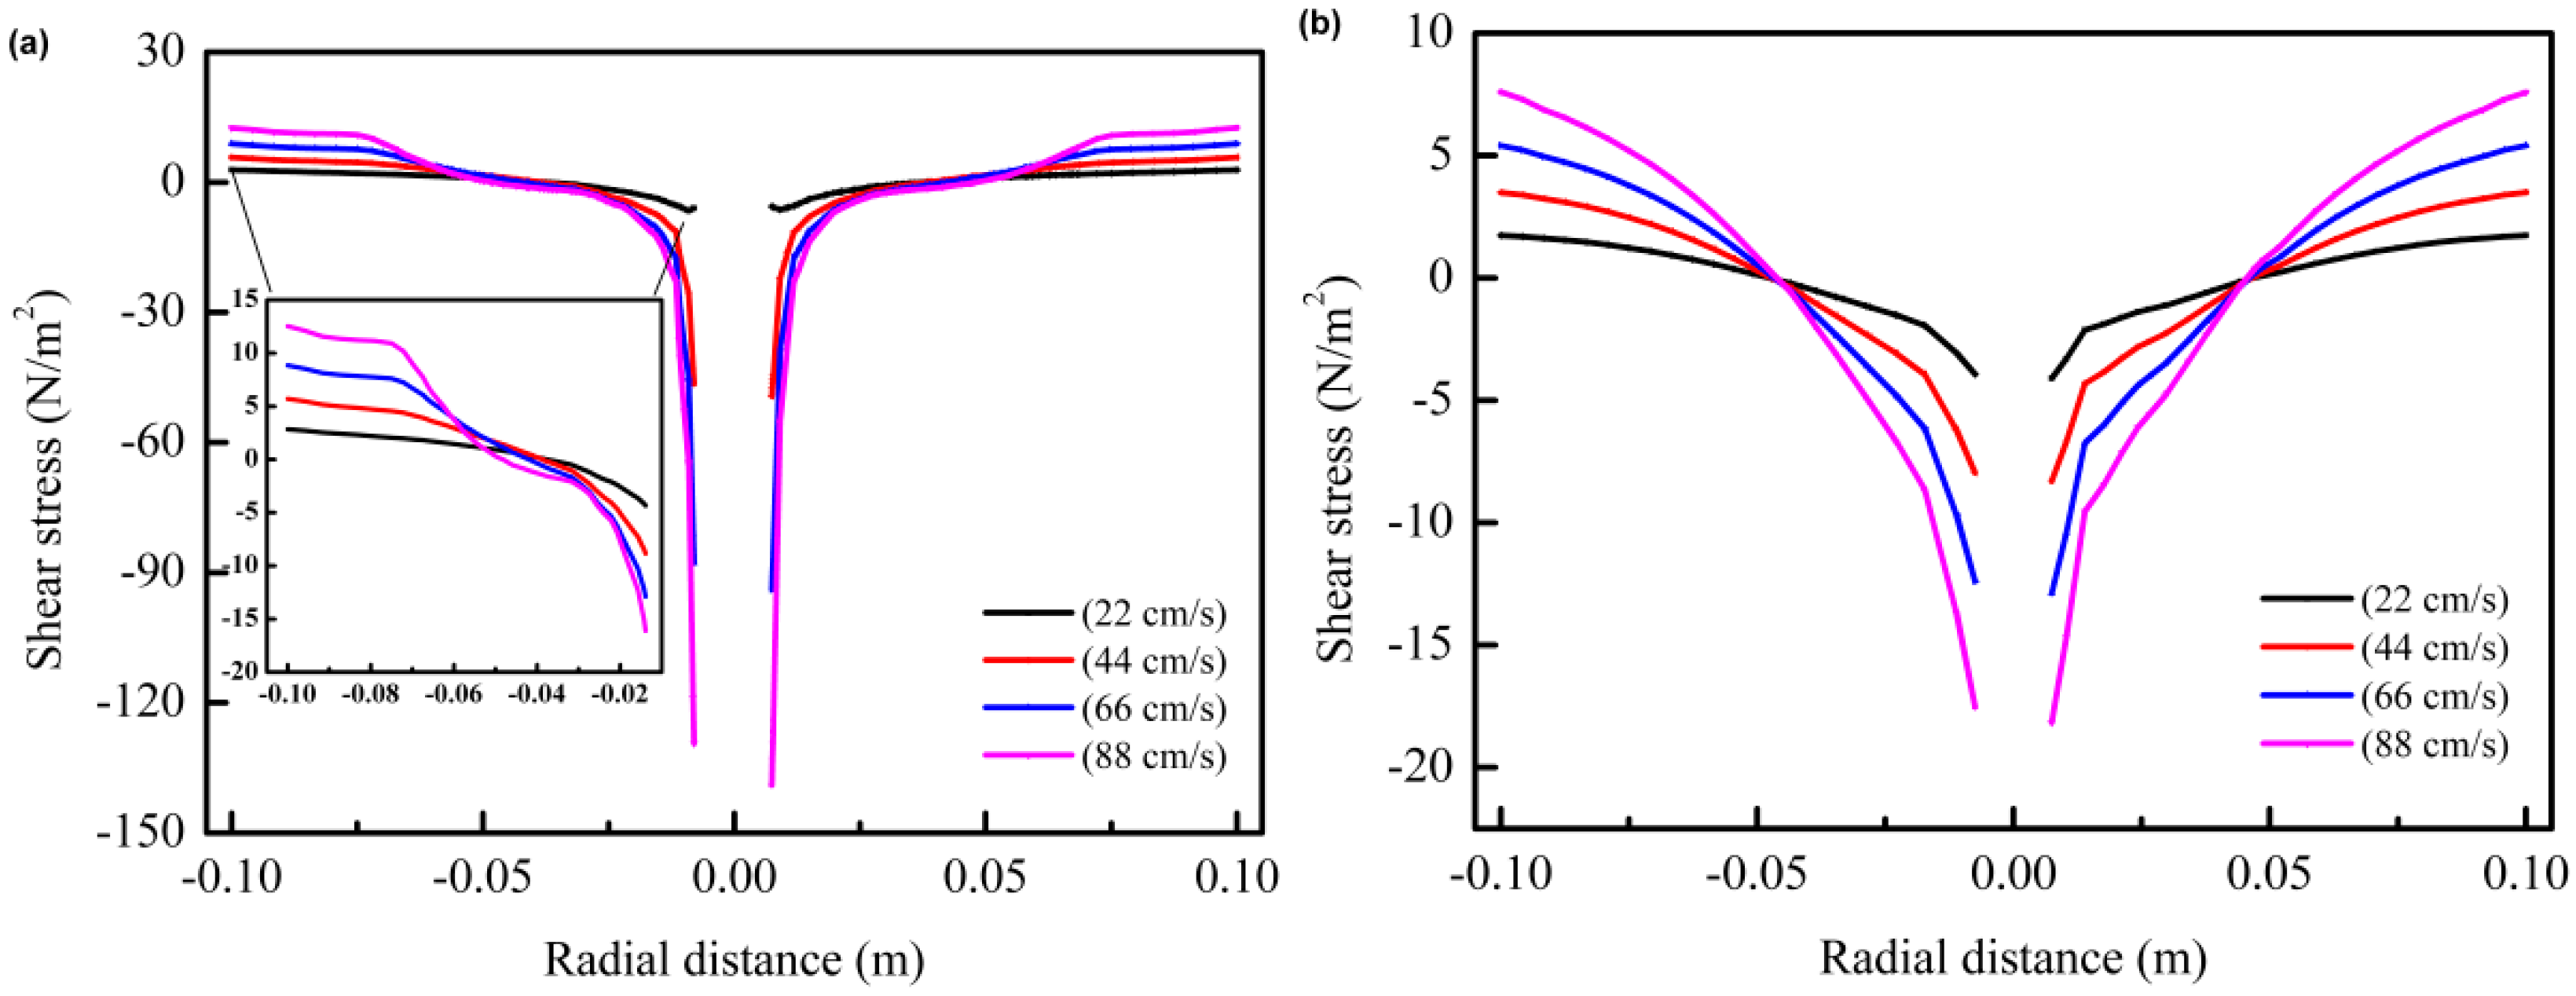
Figure 9.
Cumulative biogas and methane yield at different height to diameter ratios.

Figure 10.
Variation of methane content in biogas at different height to diameter ratios.

Figure 11.
Schematic diagram of the pathway of leachate in the digester at different H/D ratios: (a) H/D 1/2 and (b) H/D 3:2.
Figure 11.
Schematic diagram of the pathway of leachate in the digester at different H/D ratios: (a) H/D 1/2 and (b) H/D 3:2.
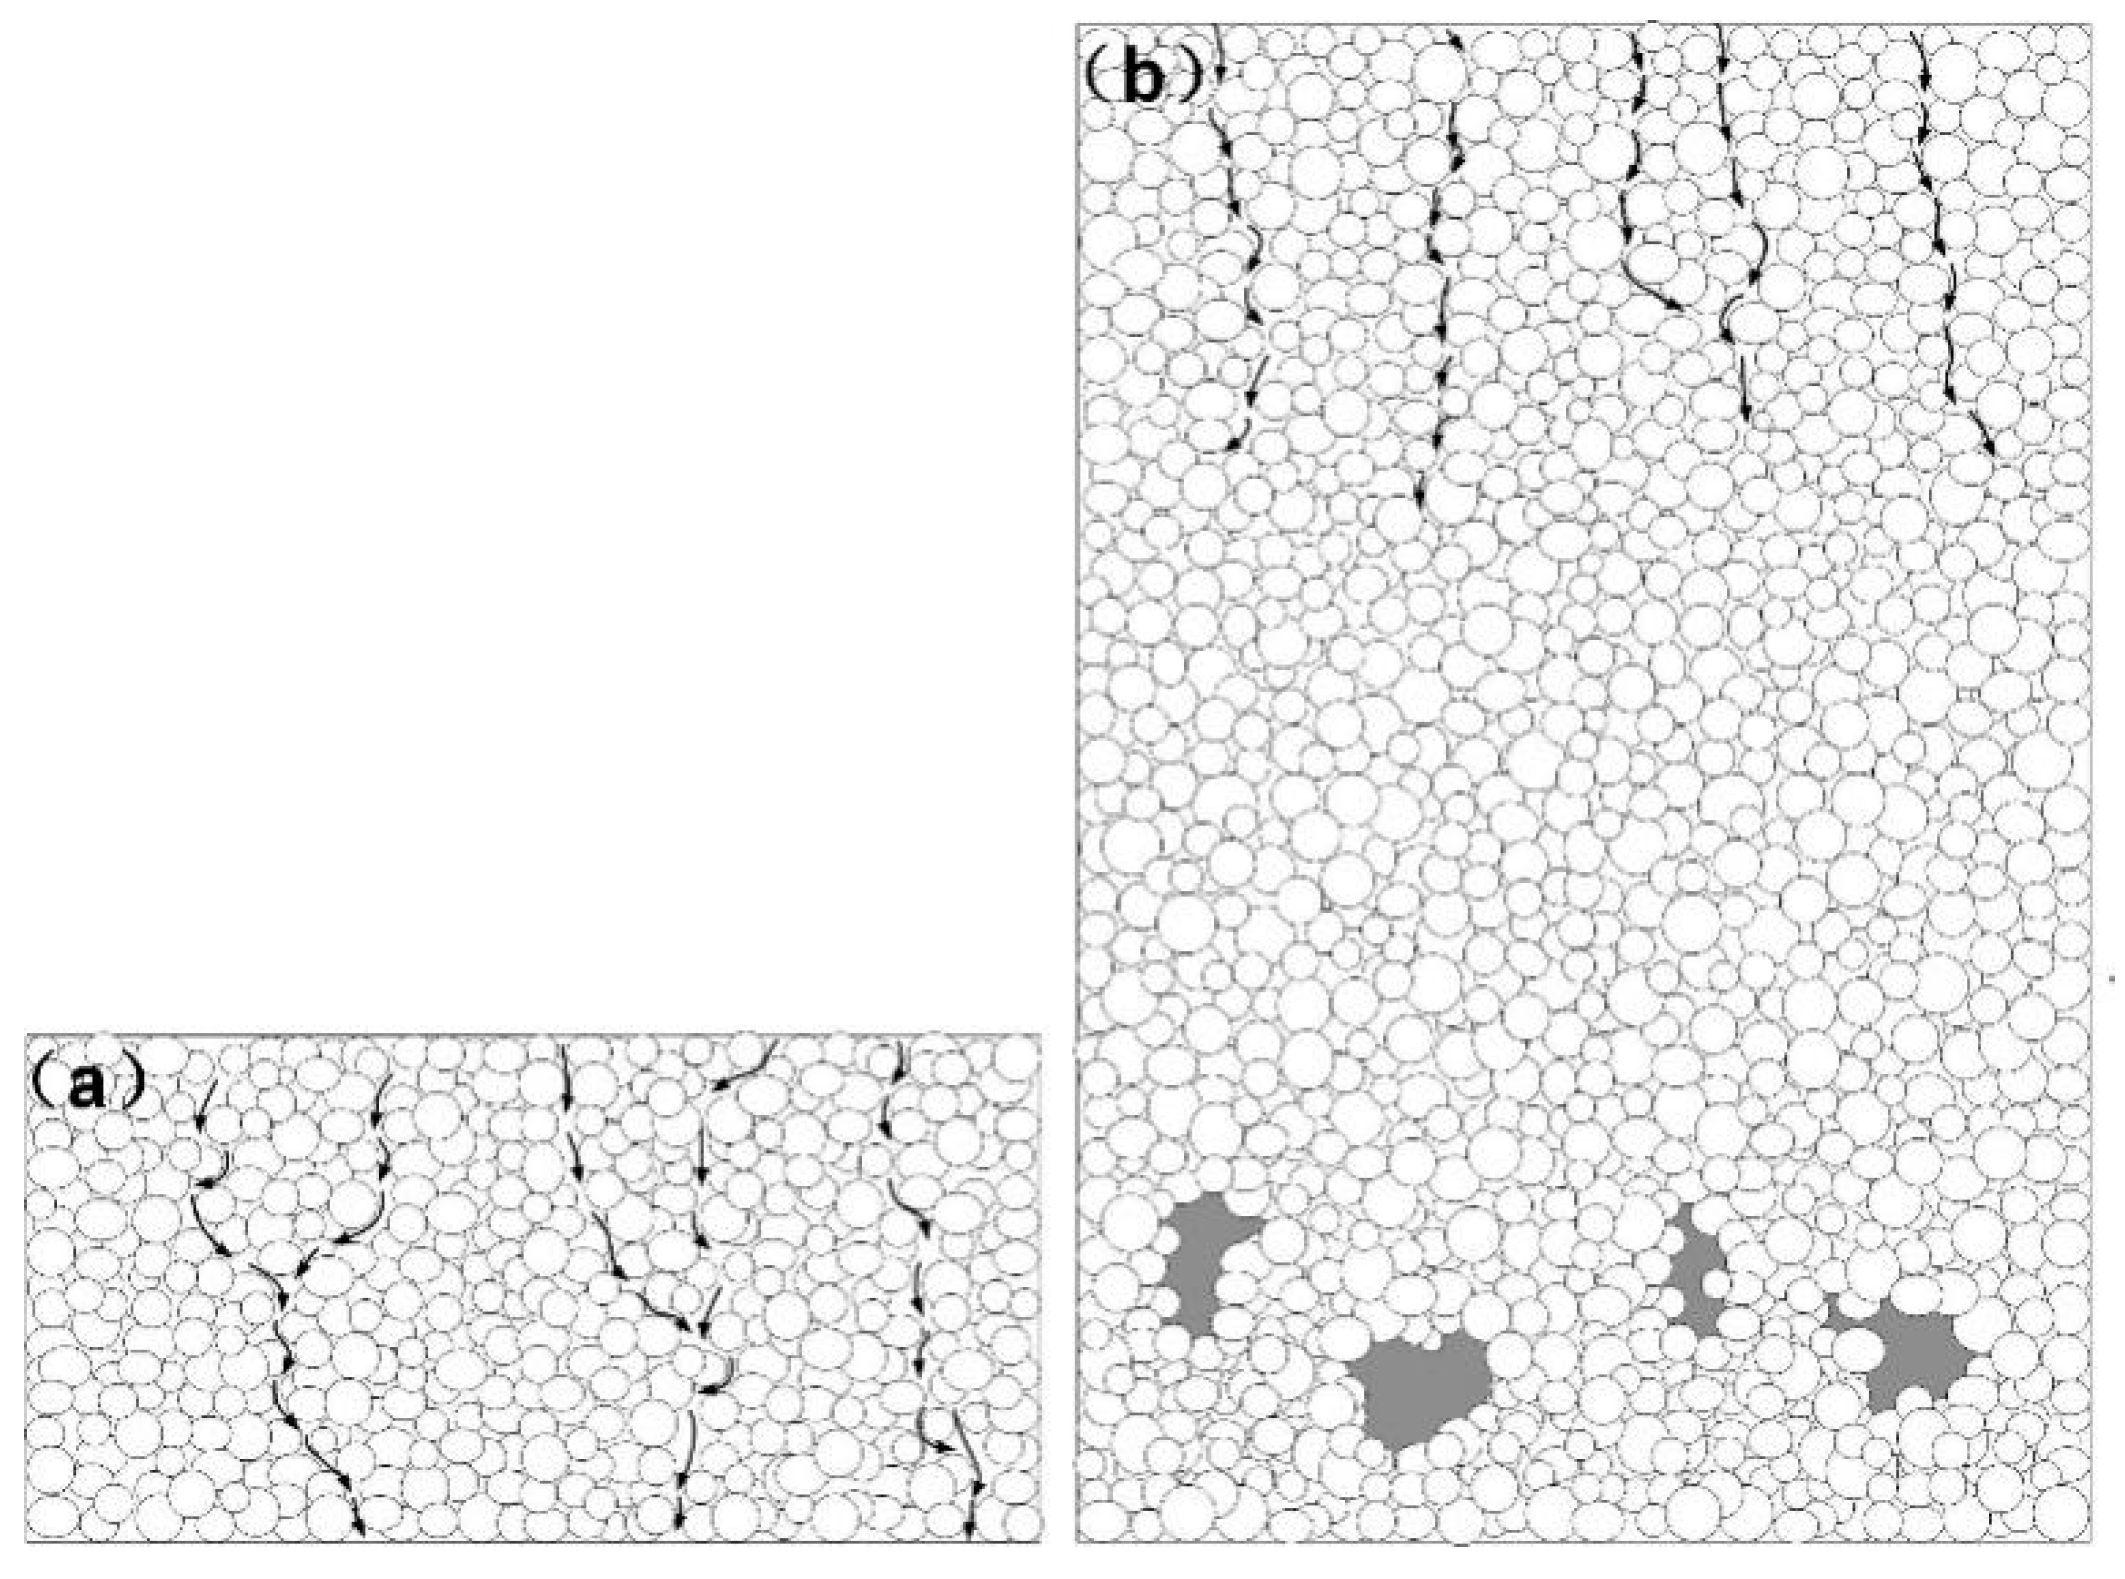
Figure 12.
Fluorescence microscope results of the digestate and leachate at the end of digestion. (a,b) Methanogens in the solid state and (c,d) methanogens in the leachate.
Figure 12.
Fluorescence microscope results of the digestate and leachate at the end of digestion. (a,b) Methanogens in the solid state and (c,d) methanogens in the leachate.
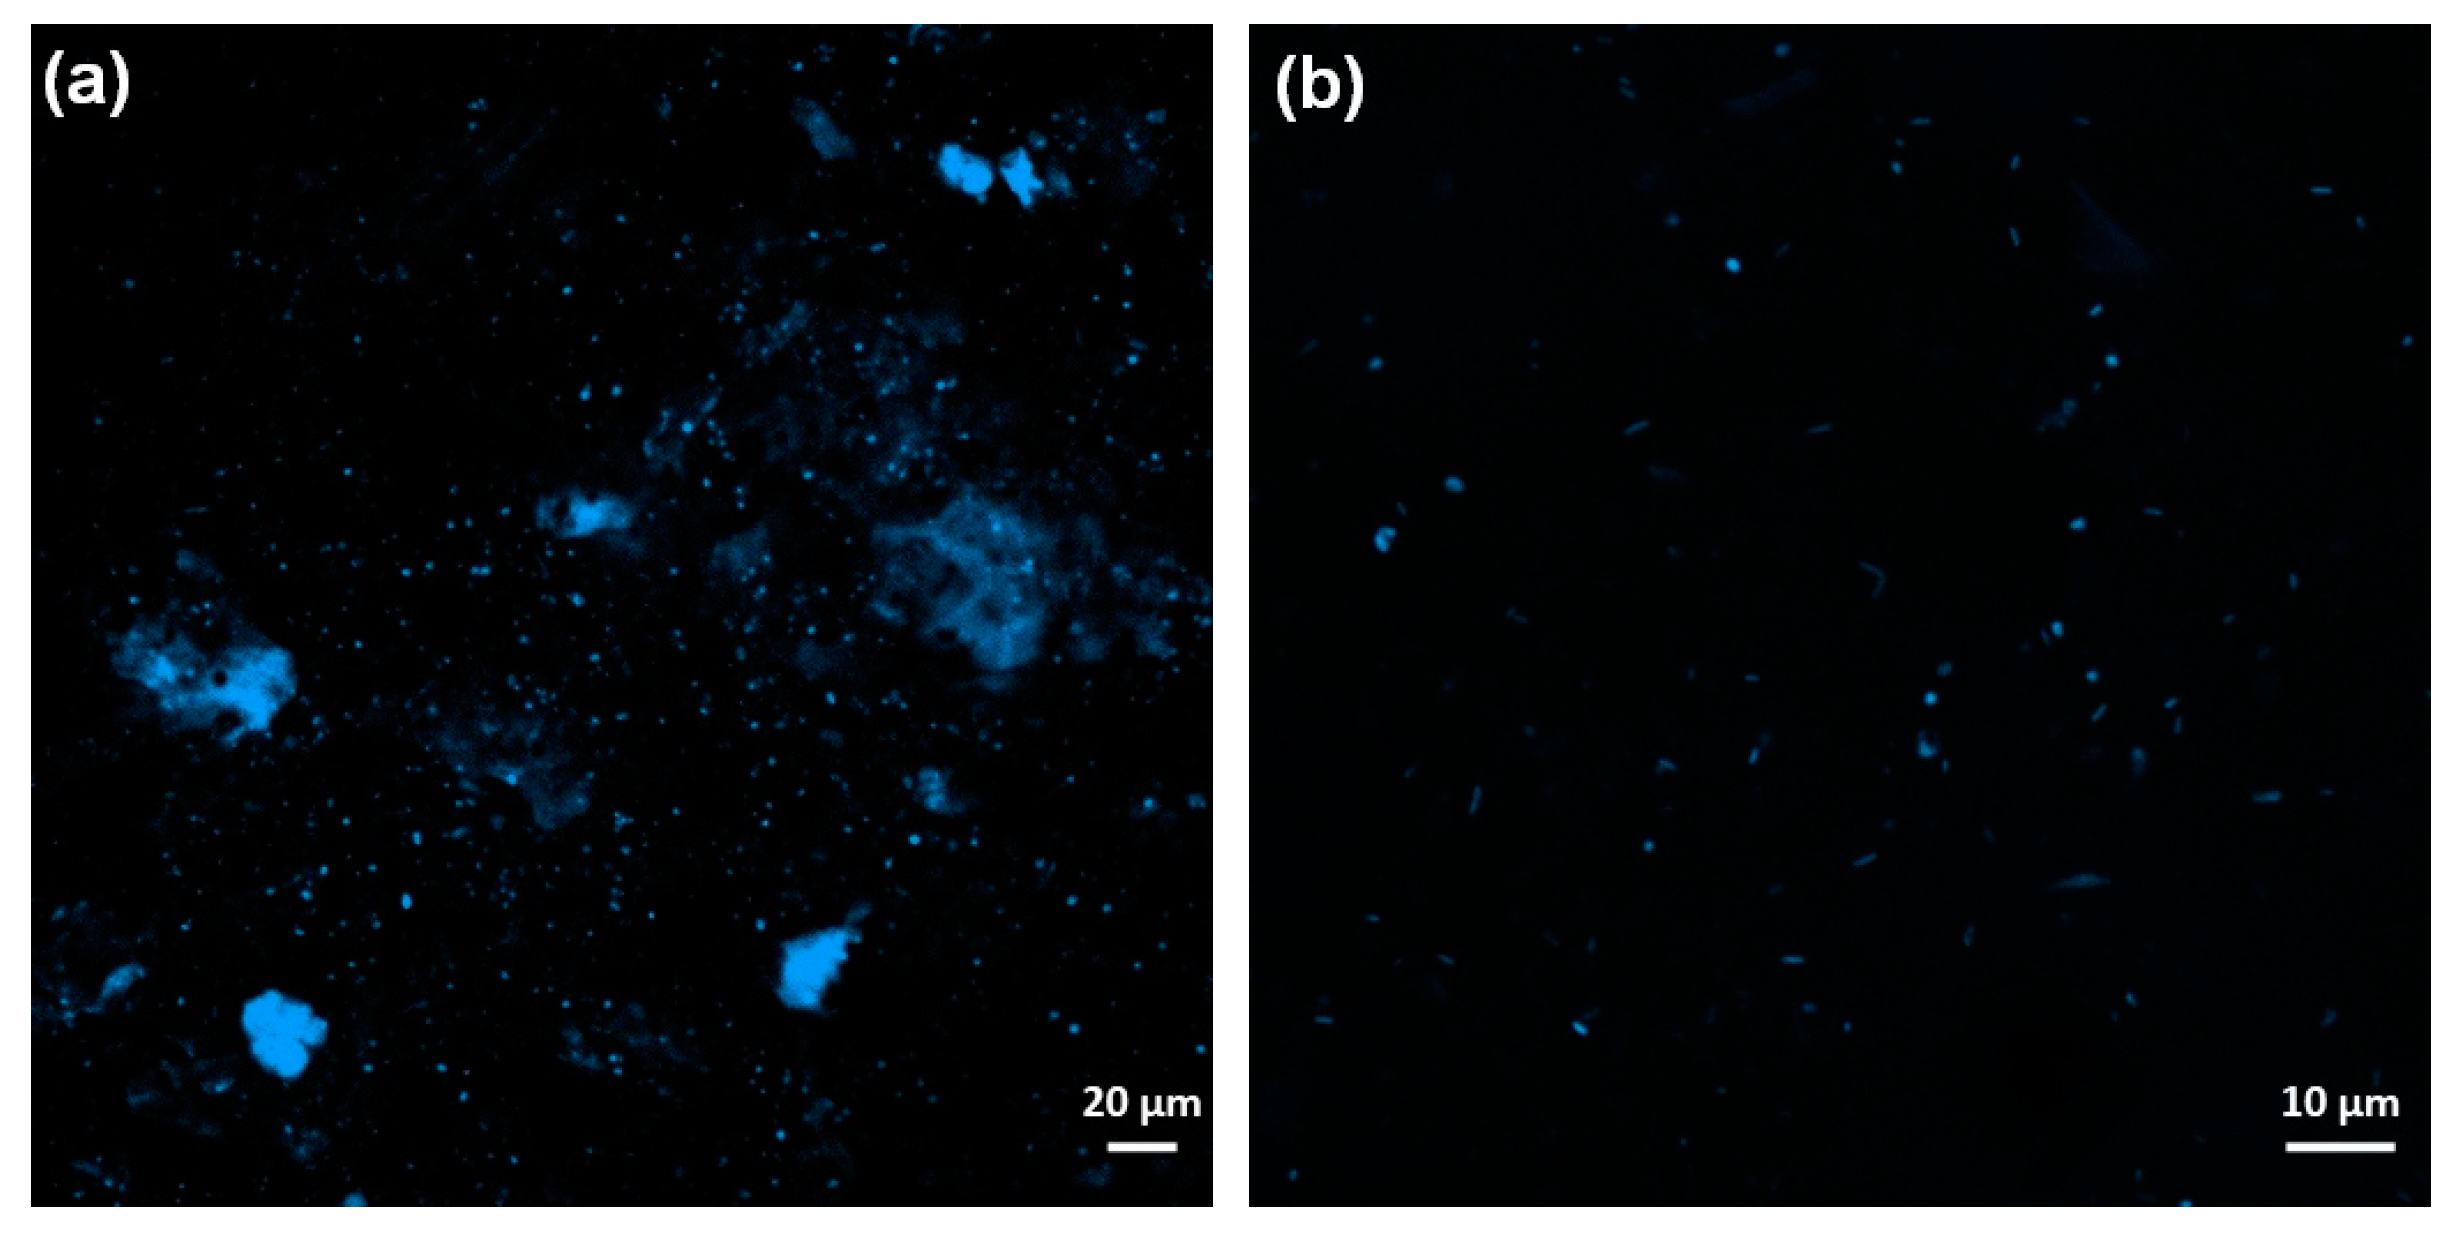
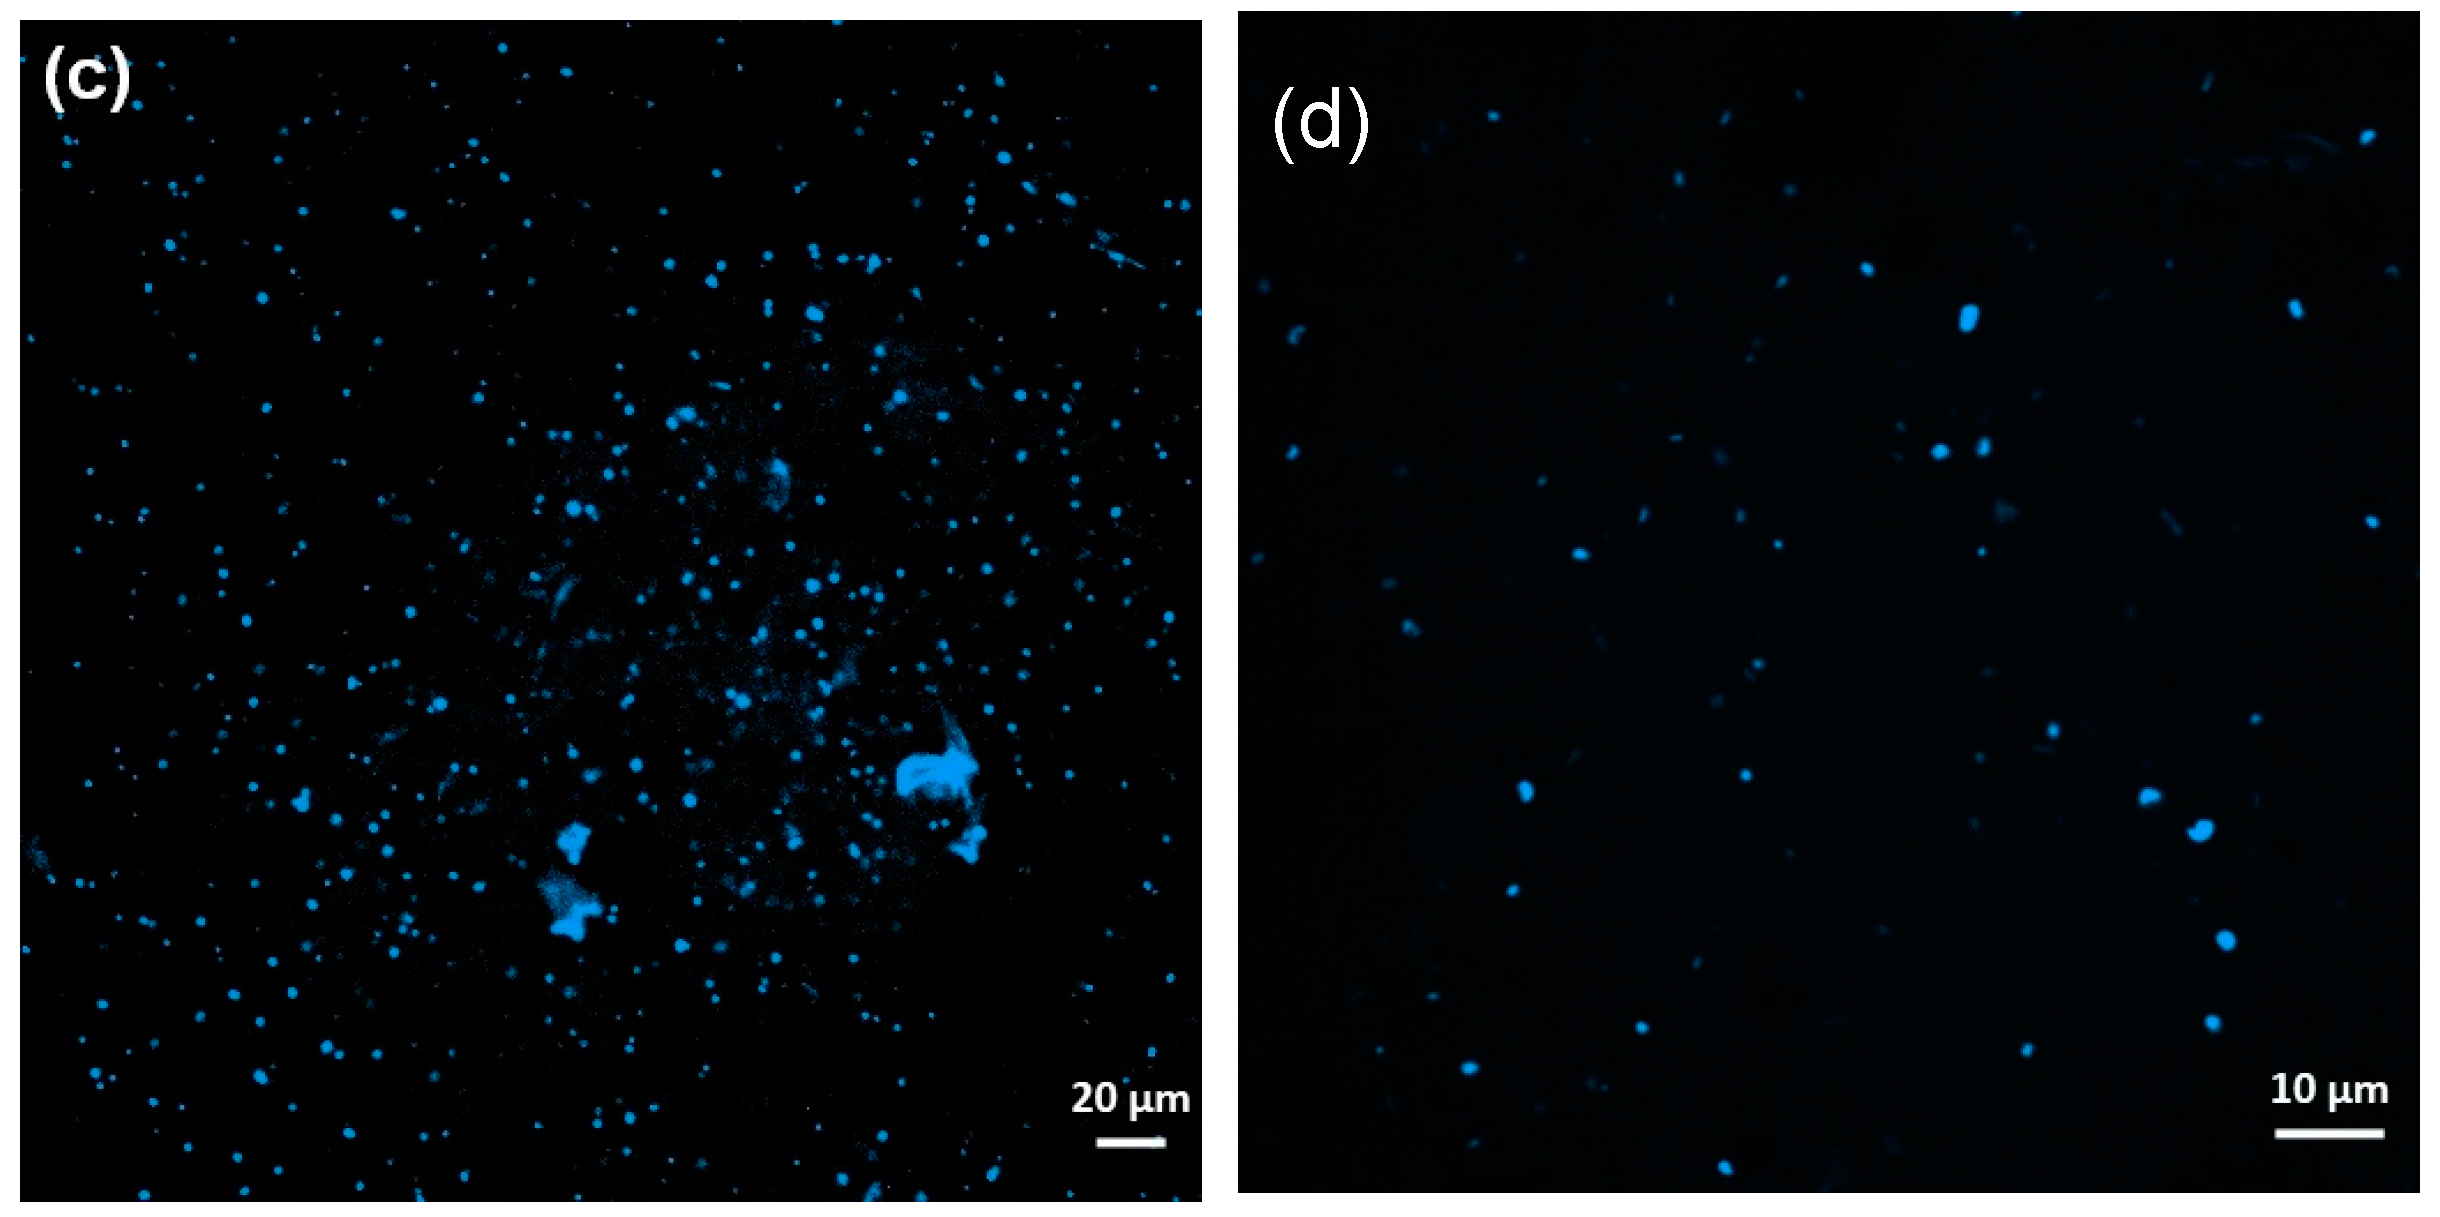
Figure 13.
Cumulative biogas yield (a) and methane content (b) of DAD with/without mixing and percolate recirculation.
Figure 13.
Cumulative biogas yield (a) and methane content (b) of DAD with/without mixing and percolate recirculation.


Table 1.
Physical properties of substrate.
| Parameters | Sorghum Stalks | Inoculum |
|---|---|---|
| Total solids (%, w.b.) | 94.14 ± 0.06 | 11.30 ± 0.05 |
| Volatile solids (%, d.b.) | 92.06 ± 0.18 | 56.02 ± 0.07 |
| Total carbon (%, d.b.) | 43.37 ± 0.25 | |
| Total nitrogen (%, d.b.) | 1.03 ± 0.03 | |
| C/N ratio | 42.27 | |
| Hydrogen (%, d.b.) | 5.90 ± 0.02 | |
| Sulfur (%, d.b.) | 0.22 ± 0.43 | |
| Hemicellulose (%, d.b.) | 40.21 ± 1.10 | |
| Cellulose (%, d.b.) | 35.45 ± 1.53 | |
| Lignin (%, d.b.) | 2.32 ± 2.15 |
Note: w.b. (wet basis), d.b. (dry basis).
Table 2.
Parameters reflecting system stability of DADunder different mixing intensity.
| Velocity (cm/s) | Cumulative Biogas Yield (mL/g VS) | COD (mg/L) | Ammonia Nitrogen (mg/L) | pH |
|---|---|---|---|---|
| 88 | 391 ± 14 | 9358 ± 106 | 771 ± 38 | 7.67 ± 0.20 |
| 66 | 380 ± 13 | 8920 ± 61 | 682 ± 26 | 7.61 ± 0.13 |
| 44 | 353 ± 16 | 9299 ± 87 | 759 ± 8 | 7.69 ± 0.08 |
| 22 | 341 ± 5 | 10,907 ± 92 | 654 ± 21 | 7.96 ± 0.16 |
| 0 | 331 ± 11 | 8033 ± 32 | 855 ± 7 | 7.89 ± 0.00 |
Table 3.
Parameters reflecting system stability of DAD at different H/D.
| H/D | Cumulative Biogas Yield (mL/g VS) | COD (mg/L) | Ammonia Nitrogen (mg/L) | pH |
|---|---|---|---|---|
| 3:2 | 407 ± 9 | 12,824 ± 107 | 733 ± 28 | 8.09 ± 0.08 |
| 1.5:2 | 371 ± 6 | 7615 ± 82 | 487 ± 5 | 7.92 ± 0.18 |
| 1:2 | 326 ± 18 | 8957 ± 64 | 592 ± 23 | 7.96 ± 0.11 |
Disclaimer/Publisher’s Note: The statements, opinions and data contained in all publications are solely those of the individual author(s) and contributor(s) and not of MDPI and/or the editor(s). MDPI and/or the editor(s) disclaim responsibility for any injury to people or property resulting from any ideas, methods, instructions or products referred to in the content. |
© 2023 by the authors. Licensee MDPI, Basel, Switzerland. This article is an open access article distributed under the terms and conditions of the Creative Commons Attribution (CC BY) license (https://creativecommons.org/licenses/by/4.0/).
Share and Cite
MDPI and ACS Style
Zhang, Z.; Chang, S.; Zhao, S.; Liu, P.; Qian, Y.; Li, W. Impact of Mechanical Stirring and Percolate Recirculation on the Performances of Dry Anaerobic Digestion. Fermentation 2023, 9, 848. https://doi.org/10.3390/fermentation9090848
AMA Style
Zhang Z, Chang S, Zhao S, Liu P, Qian Y, Li W. Impact of Mechanical Stirring and Percolate Recirculation on the Performances of Dry Anaerobic Digestion. Fermentation. 2023; 9(9):848. https://doi.org/10.3390/fermentation9090848
Chicago/Turabian StyleZhang, Zhikai, Shengqiang Chang, Shengyong Zhao, Peng Liu, Yanan Qian, and Wangliang Li. 2023. "Impact of Mechanical Stirring and Percolate Recirculation on the Performances of Dry Anaerobic Digestion" Fermentation 9, no. 9: 848. https://doi.org/10.3390/fermentation9090848
Note that from the first issue of 2016, this journal uses article numbers instead of page numbers. See further details here.