1. Introduction
Continuous carbon fiber reinforced plastics (CFRPs) are characterized by high strength and stiffness at a low weight. This is true, however, for the fiber directions, while the transversal direction is governed by a low-stiffness and low-strength polymer matrix and fiber/matrix interface. Thus, this is the weakest link in the composite structures, and improvements in the transversal properties, especially in strength, would extend the applicability of CFRPs.
To reach this goal, many efforts have been put into improving the fiber-matrix interface by chemical and other treatments of the micro-fibers, their sizing, or “whiskerization”. Meso-scale methods like z-pinning or structural stitching have also been studied [
1].
During the last few years, different types of nanoparticles, especially carbon nanotubes (CNTs) and nanofibers (CNFs) have been recognized as another, potentially promising, way to improve transversal properties. The nano-level modification is expected to improve the fiber-matrix interface and crack bridging. Consequently, the damage resistance of the composite (which is, in this case, often called “hierarchical” or “multifunctional”) can also be improved.
There are two main approaches of introducing CNTs/CNFs into a CFRP. Usually they are simply mixed with the resin or (rarely) integrated into films, which are further dissolved. This is used in most of the known studies and, in general, can be applied to any sort of nanoparticles. Sometimes electrical fields or natural resin flow is used to align CNTs/CNFs in the matrix.
The second, and less frequently reported, approach is to grow CNTs/CNFs directly on a fabric, e.g., by the catalytic decomposition of a hydrocarbon gas over metal particles, or (rarely) to attach them onto fibers by electrophoresis. Several studies deal with CNTs/CNFs employed as the fiber sizing (a thin viscous coating used mainly to protect them during processing).
The primary reinforcing phase is represented almost equally by glass or carbon fibers. A few studies deal with other fibers: aramid, silicon carbide, or alumina fabrics are also applied. More detailed reviews can be obtained in, for example, [
2,
3,
4,
5,
6].
Both approaches—mixing in a resin or in situ growing—have their advantages and disadvantages, e.g., significantly higher viscosity of a nano-modified resin or migration of the in situ grown CNFs into air (that is potentially detrimental to health).
The present study focuses on the latter approach. This is because, as already mentioned, by now the most of published studies deal with nano-modified matrices, while the in situ grown CNFs or CNTs (especially grown on the carbon-fiber fabrics) have received much less attention. Meanwhile, it could be more beneficial, because the in situ grown distribution of a nano-reinforcement is more controllable and can even be applied locally, at a part of the fabric only. Additionally, this nano-reinforcement acts directly on the fiber-matrix interface, not in the total volume of the matrix, which is interesting in a mechanical sense.
Thus far, the scientific community was stronger focused to CNTs, rather than to
in situ grown CNFs [
7,
8,
9,
10,
11,
12,
13,
14], though that they can probably bring a large benefit. Additionally, growth of CNTs usually requires higher temperatures (and, therefore, more expensive equipment, though moderate temperature CNT synthesis has also been reported [
15]) and well-defined process conditions (which are hardly realizable in a mass production of CNT-grafted textiles). Last, but not least, in almost all known studies, the Chemical Vapor Deposition (CVD) technique is performed in quartz tubes (thus producing narrow specimens), and the use of larger reactors (suitable to grow CNFs on the component level) can apply some specifics.
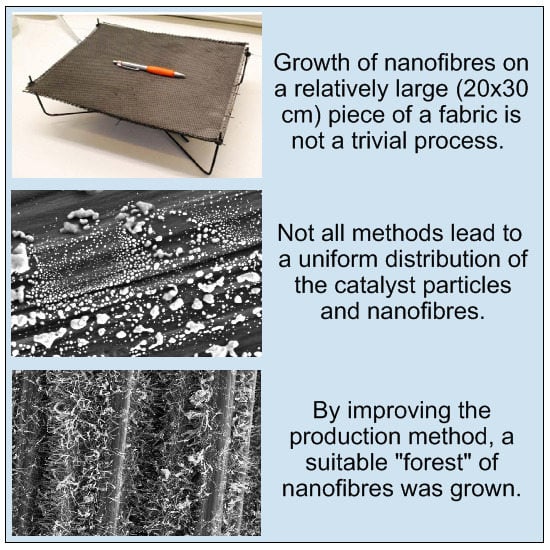
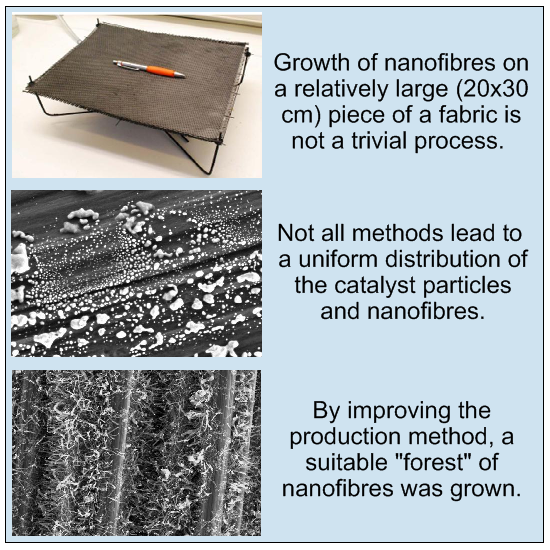
Thus, this study aims at preparation and optimization of the synthesis of CNFs on graphite fabrics. The goal is to develop a CVD procedure applicable for the production of relatively large nano-modified graphite cloths, for their future use in polymer-matrix composite materials.
2. Equipment and Substrate
There are different techniques to grow CNTs or CNFs: pyrolysis, laser vaporization, etc., all using the catalytic decomposition of a hydrocarbon gas over metal particles. In the present study, the Chemical Vapor Deposition (CVD) technique is used due to its high yields at relatively low temperatures. This is important in order to limit a possible temperature degradation of the carbon fabric.
CVD employs nano-scale metal catalyst particles (either pre-shaped or formed
in situ). The particles cause decomposition of a hot hydrocarbon chemical vapor:
Carbon diffuses then into the particles and segregates again from them at specific surface orientations, to form CNFs. Depending on adhesion between the catalyst particles and the substrate, the particles can either remain at the substrate or can stay at the CNF tips [
16].
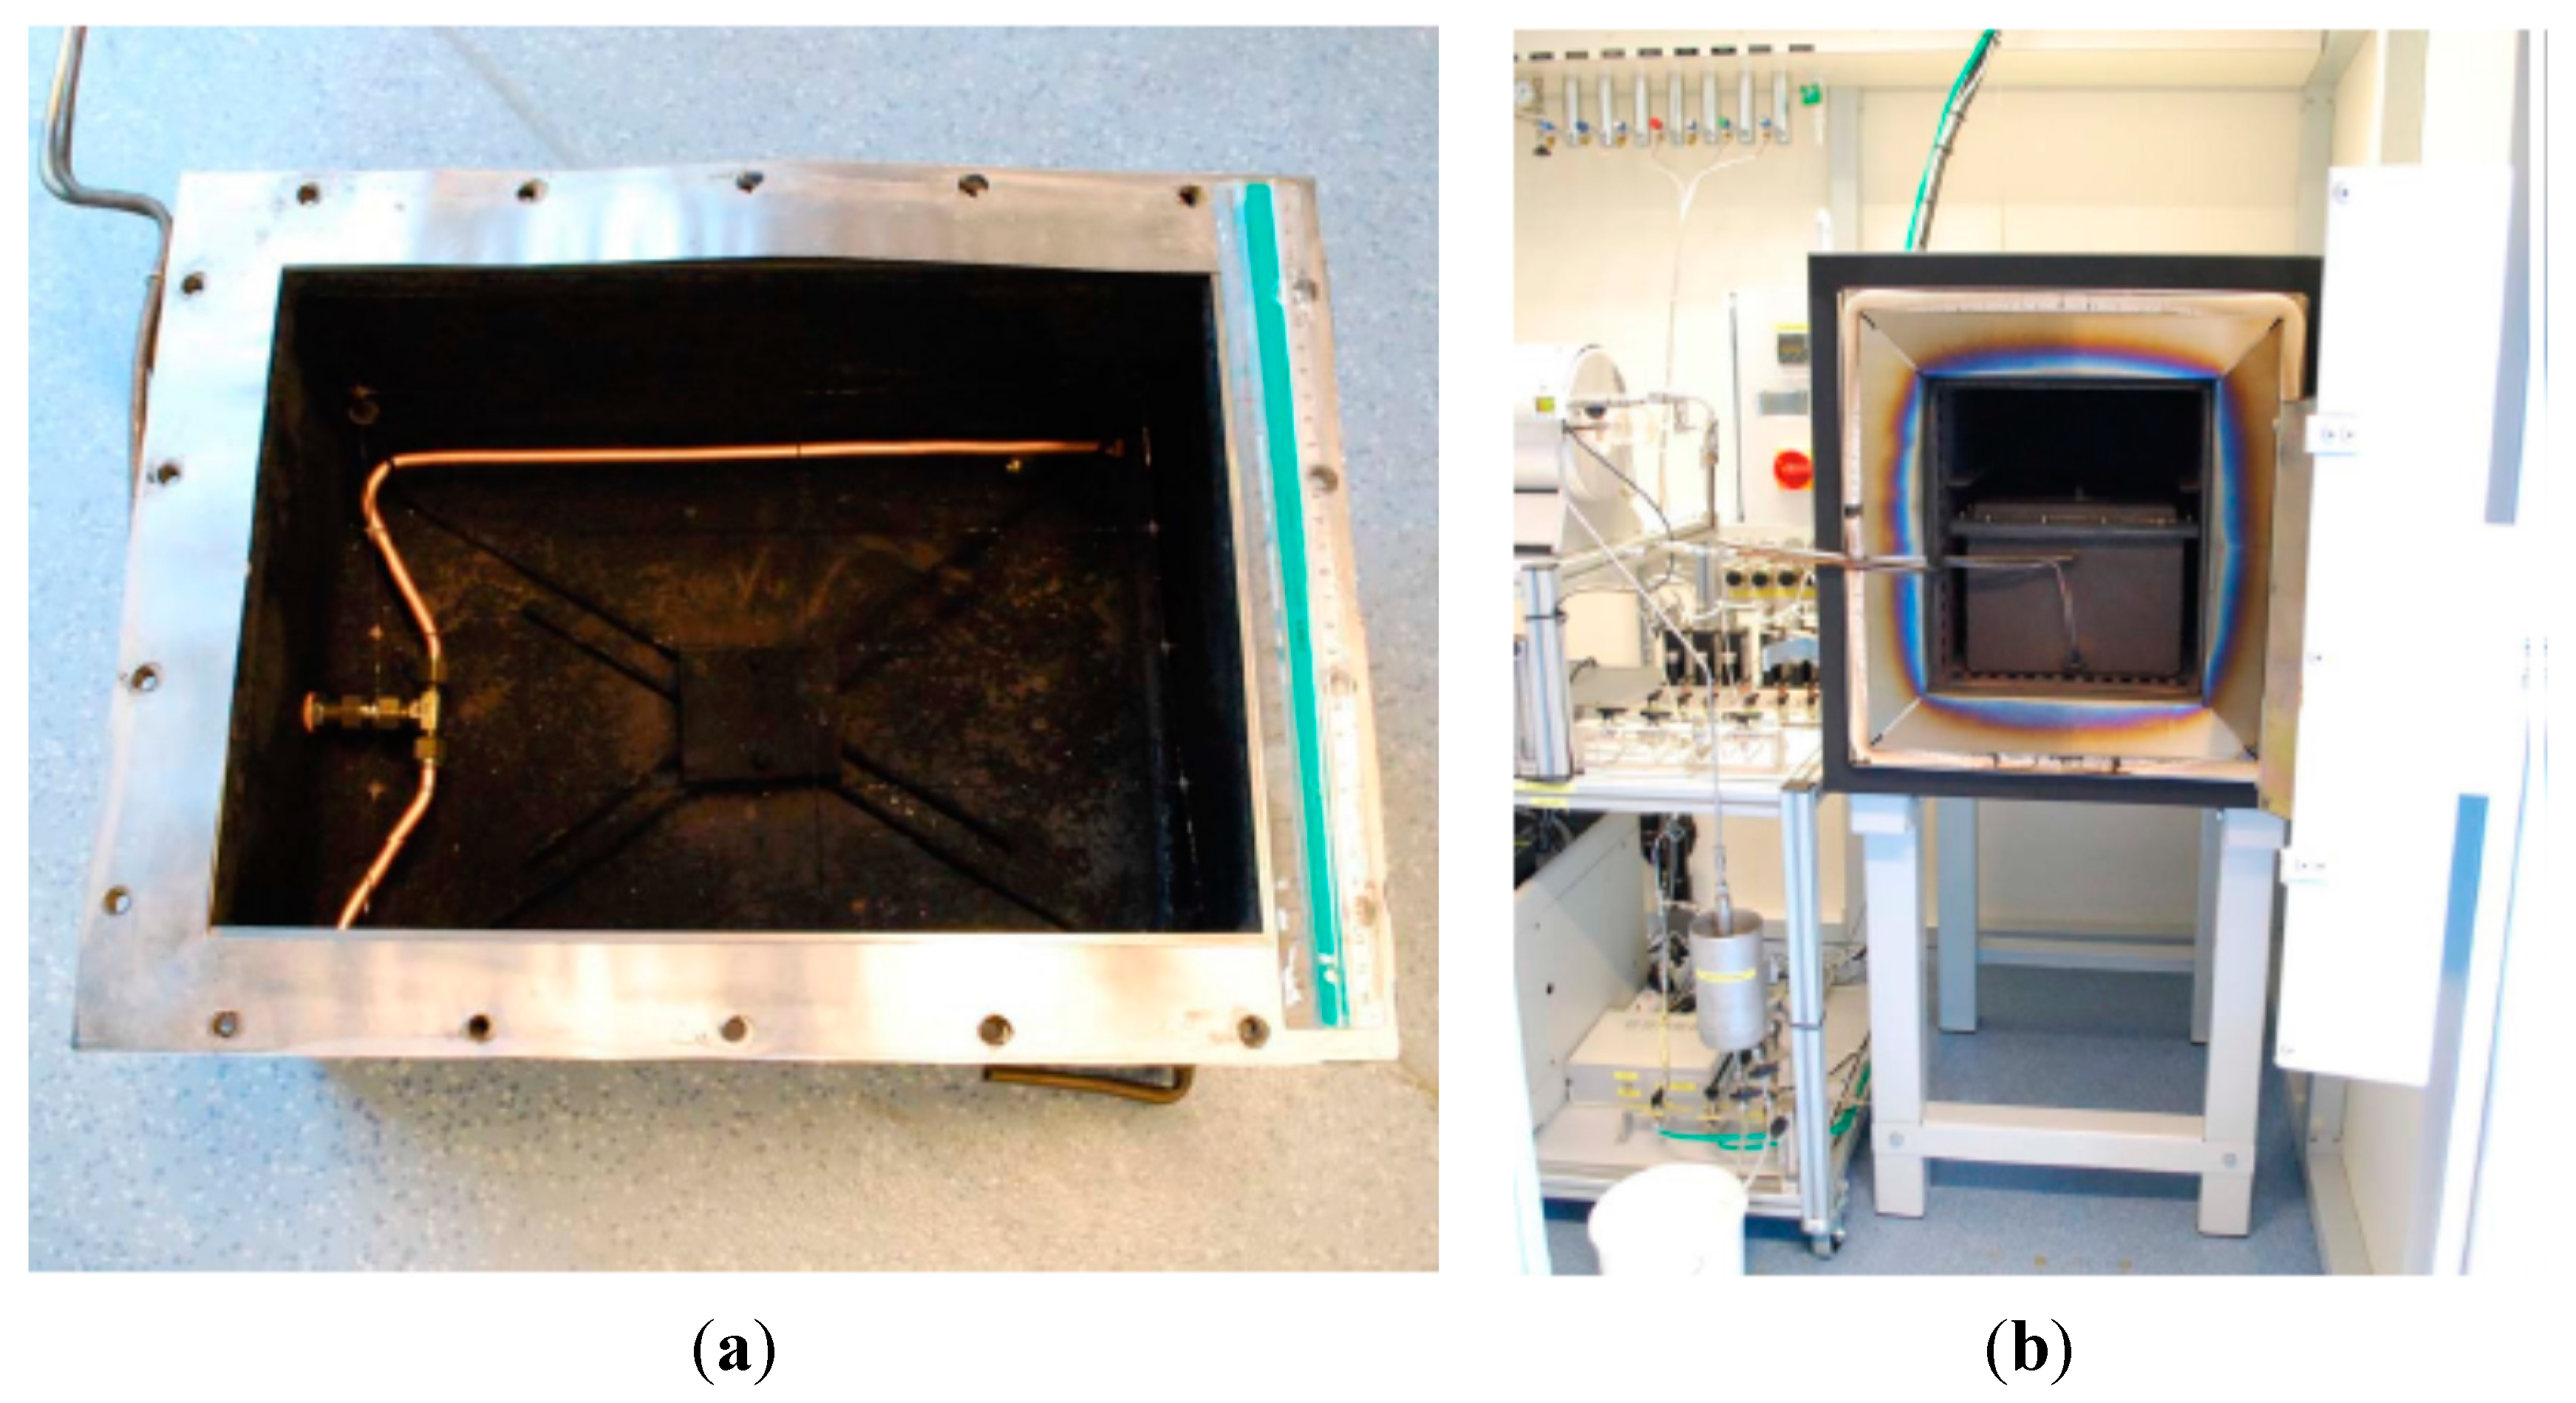
These processes were performed in a reactor,
Figure 1a, having 29.0 × 39.5 × 22.5 cm
3 internal dimensions (width × length × height) and suitable to grow CNFs at the component level (about 26 × 31 cm
2 textiles). Due to this relatively large size, it was essential to provide a uniform carbon gas flow, since it is known that local differences in the gas concentration within the reactor can easily induce inhomogeneity of the growth. A special pipe system was designed to meet this demand, by distributing the gas flow through several holes in two tubes positioned along the larger sides of the reactor, closer to its bottom,
Figure 1a.
The reactor itself was made of steel and needed periodical surface cleaning of parasitic grown CNFs, while the pipes were copper with brass fittings (to avoid CNF growth inside them),
Figure 1a. The substrate—a rectangular piece of the fabric—was positioned into the oven at about a half of its height, being supported with a thin-wire net having a 5 × 5 cm mesh. The wires were steel but the parasitic CNF growth was not a vital problem here.
Heating the reactor up to 600 °C was performed in an oven,
Figure 1b. Before this, the reactor was closed with a lid and fixed with screws. A graphitic sealing was used to prevent leakage of ethylene, potentially forming an explosive gas in the oven.
Figure 1.
Reactor (a) and oven with the reactor placed inside (b).
Figure 1.
Reactor (a) and oven with the reactor placed inside (b).
The setup was equipped with mass flow controllers, for precise flow regulation of ethylene, hydrogen and nitrogen. The rate of CNF production was in situ monitored by measuring the H2 signal, based on reaction Equation (1), where the contribution of C formation on the reactor wall was corrected for by running a blank test (i.e., without the substrate) until the H2 signal decreased to a negligible level.
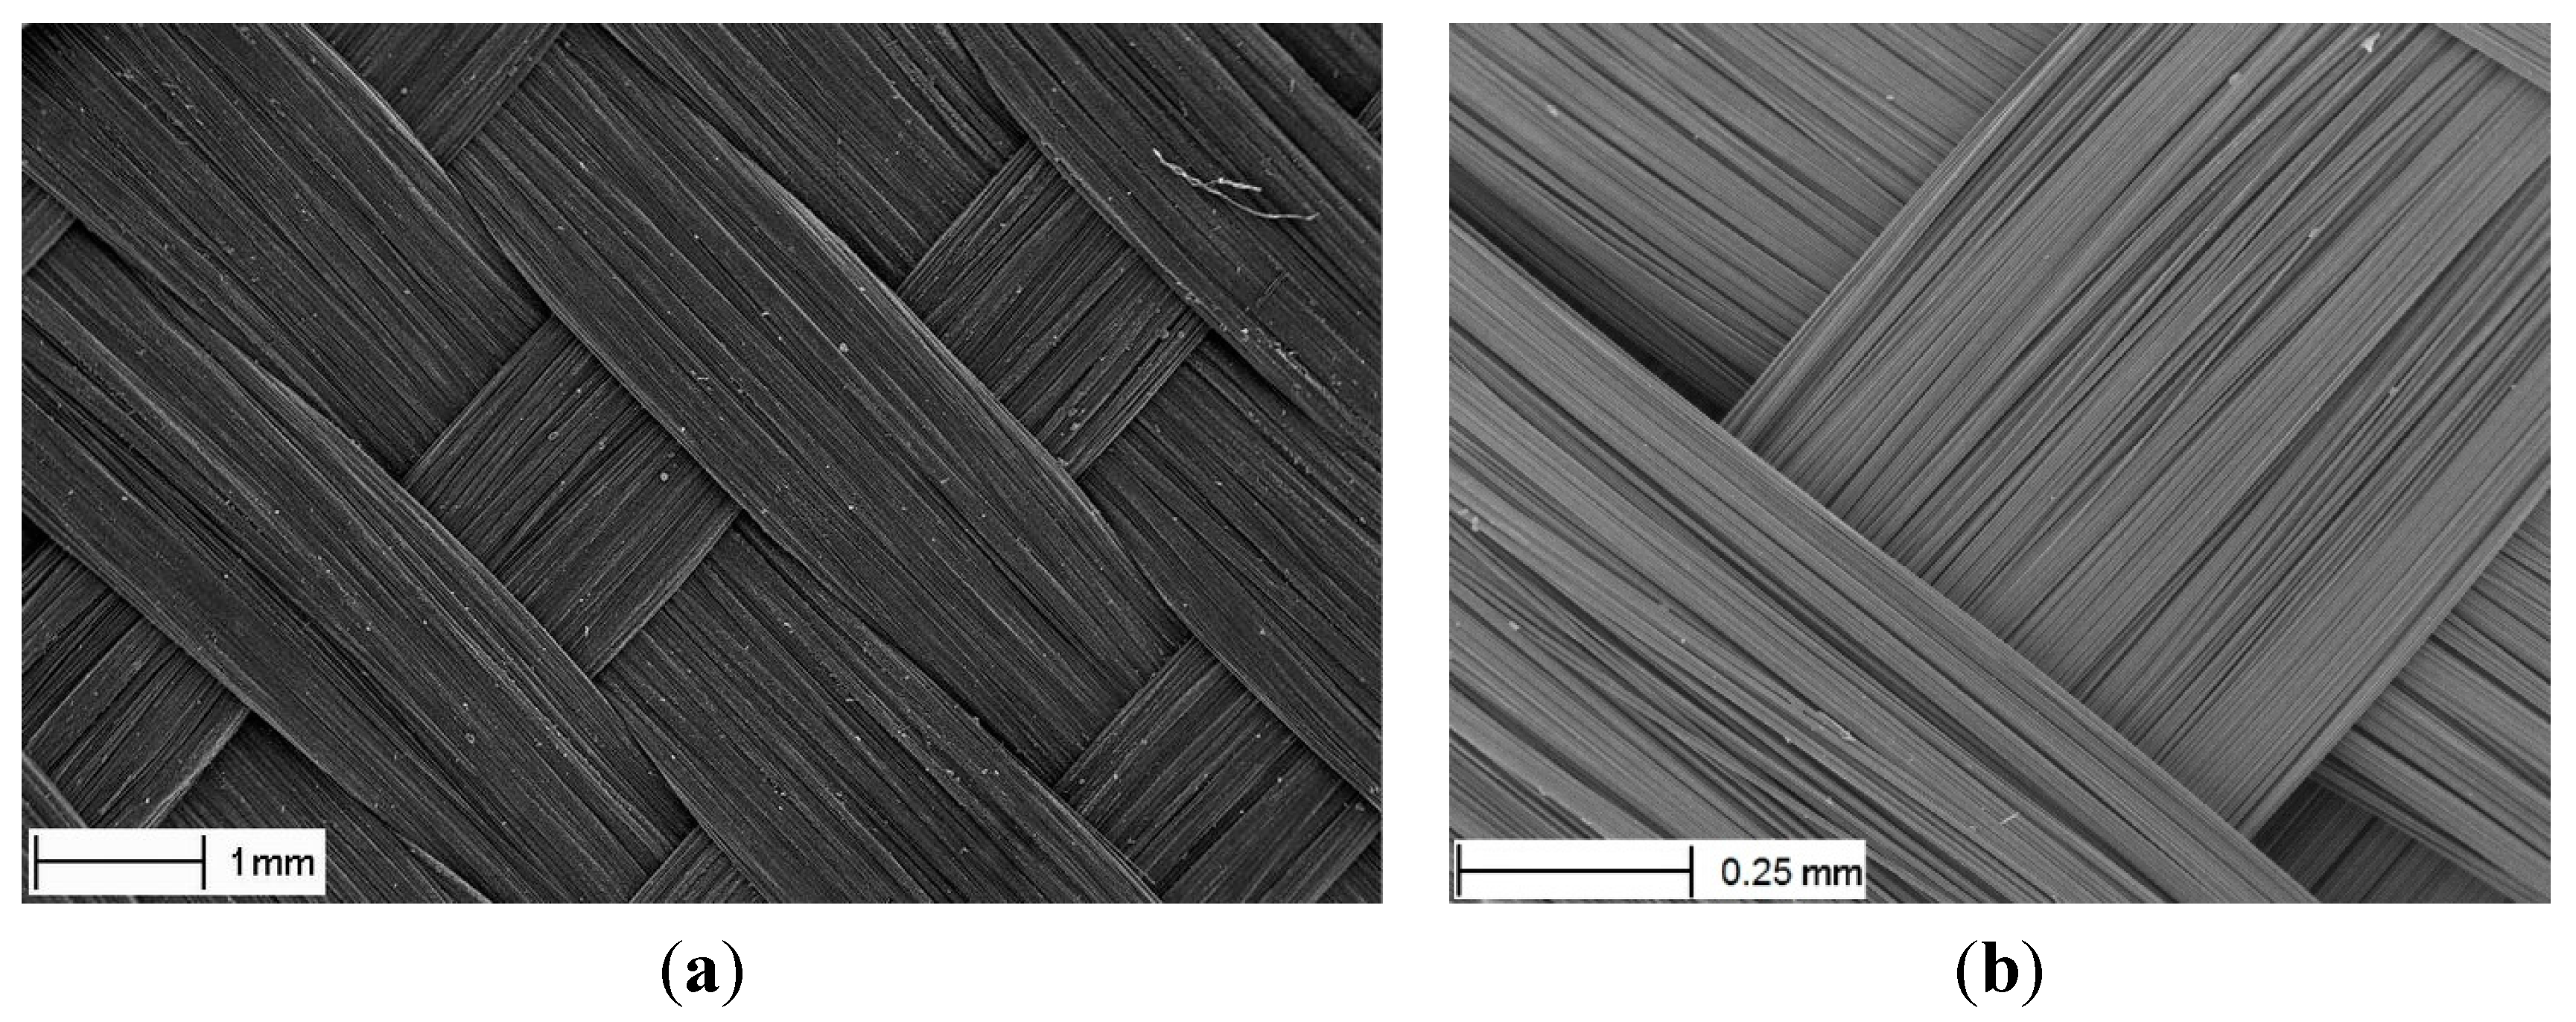
A typical woven carbon reinforcement (CD 0286 supplied by Ten Cate AC) is used as the base material. This 5-harness satin weave,
Figure 2, is made of 3K non-twisted tows of Torayca T300J 7 μm diameter fibers. The areal weight is 285 g/m
2. The fabric is “de-sized” by the manufacturer, for better compatibility with the PPS matrix, using a special heat treatment [
17].
Figure 2.
Unit-cell structure of the fabric (a) and its closer view (b).
Figure 2.
Unit-cell structure of the fabric (a) and its closer view (b).
3. CNF Growth
To grow CNFs, the fabric with deposited Ni nitrate (this deposition is discussed in the next section) is placed in the reactor, where Ni(NO
3)
2 is reduced into elementary Ni. Subsequently, CNFs are grown at the same temperature in a hydrocarbon gas mixture. In more detail, there are three main steps:
reduction with H2 (60 min, N2:H2 = 70:30). For several fabric specimens only this first step was performed, in order to obtain Ni particles without any CNF growth;
CNF nucleation and growth (30–45 min, N2:C2H4:H2 = 75:20:5), where the growth itself takes 5–10 min in the end only. A possible reason for this “delay” is that the Ni particles are first fragmentized and only then the CNF growth starts. This fragmentation is a complex process and is beyond the scope of this study. Normally a 2%–3% growth (by weight) takes about 5 min. Keeping the same temperature regime and gas composition, there are two options to control the amount of grown CNFs: either varying the time on stream, while keeping the catalyst loading constant, or varying the catalyst loading, while keeping the time on stream constant. In this study, the first option is used.
ethylene and hydrogen flow is switched off, and N2 is switched on at a 2 L/min flow rate, to remove the other gases as fast as possible. The oven and reactor cool down during about 10 h, since no forced cooling is implemented in the current design.
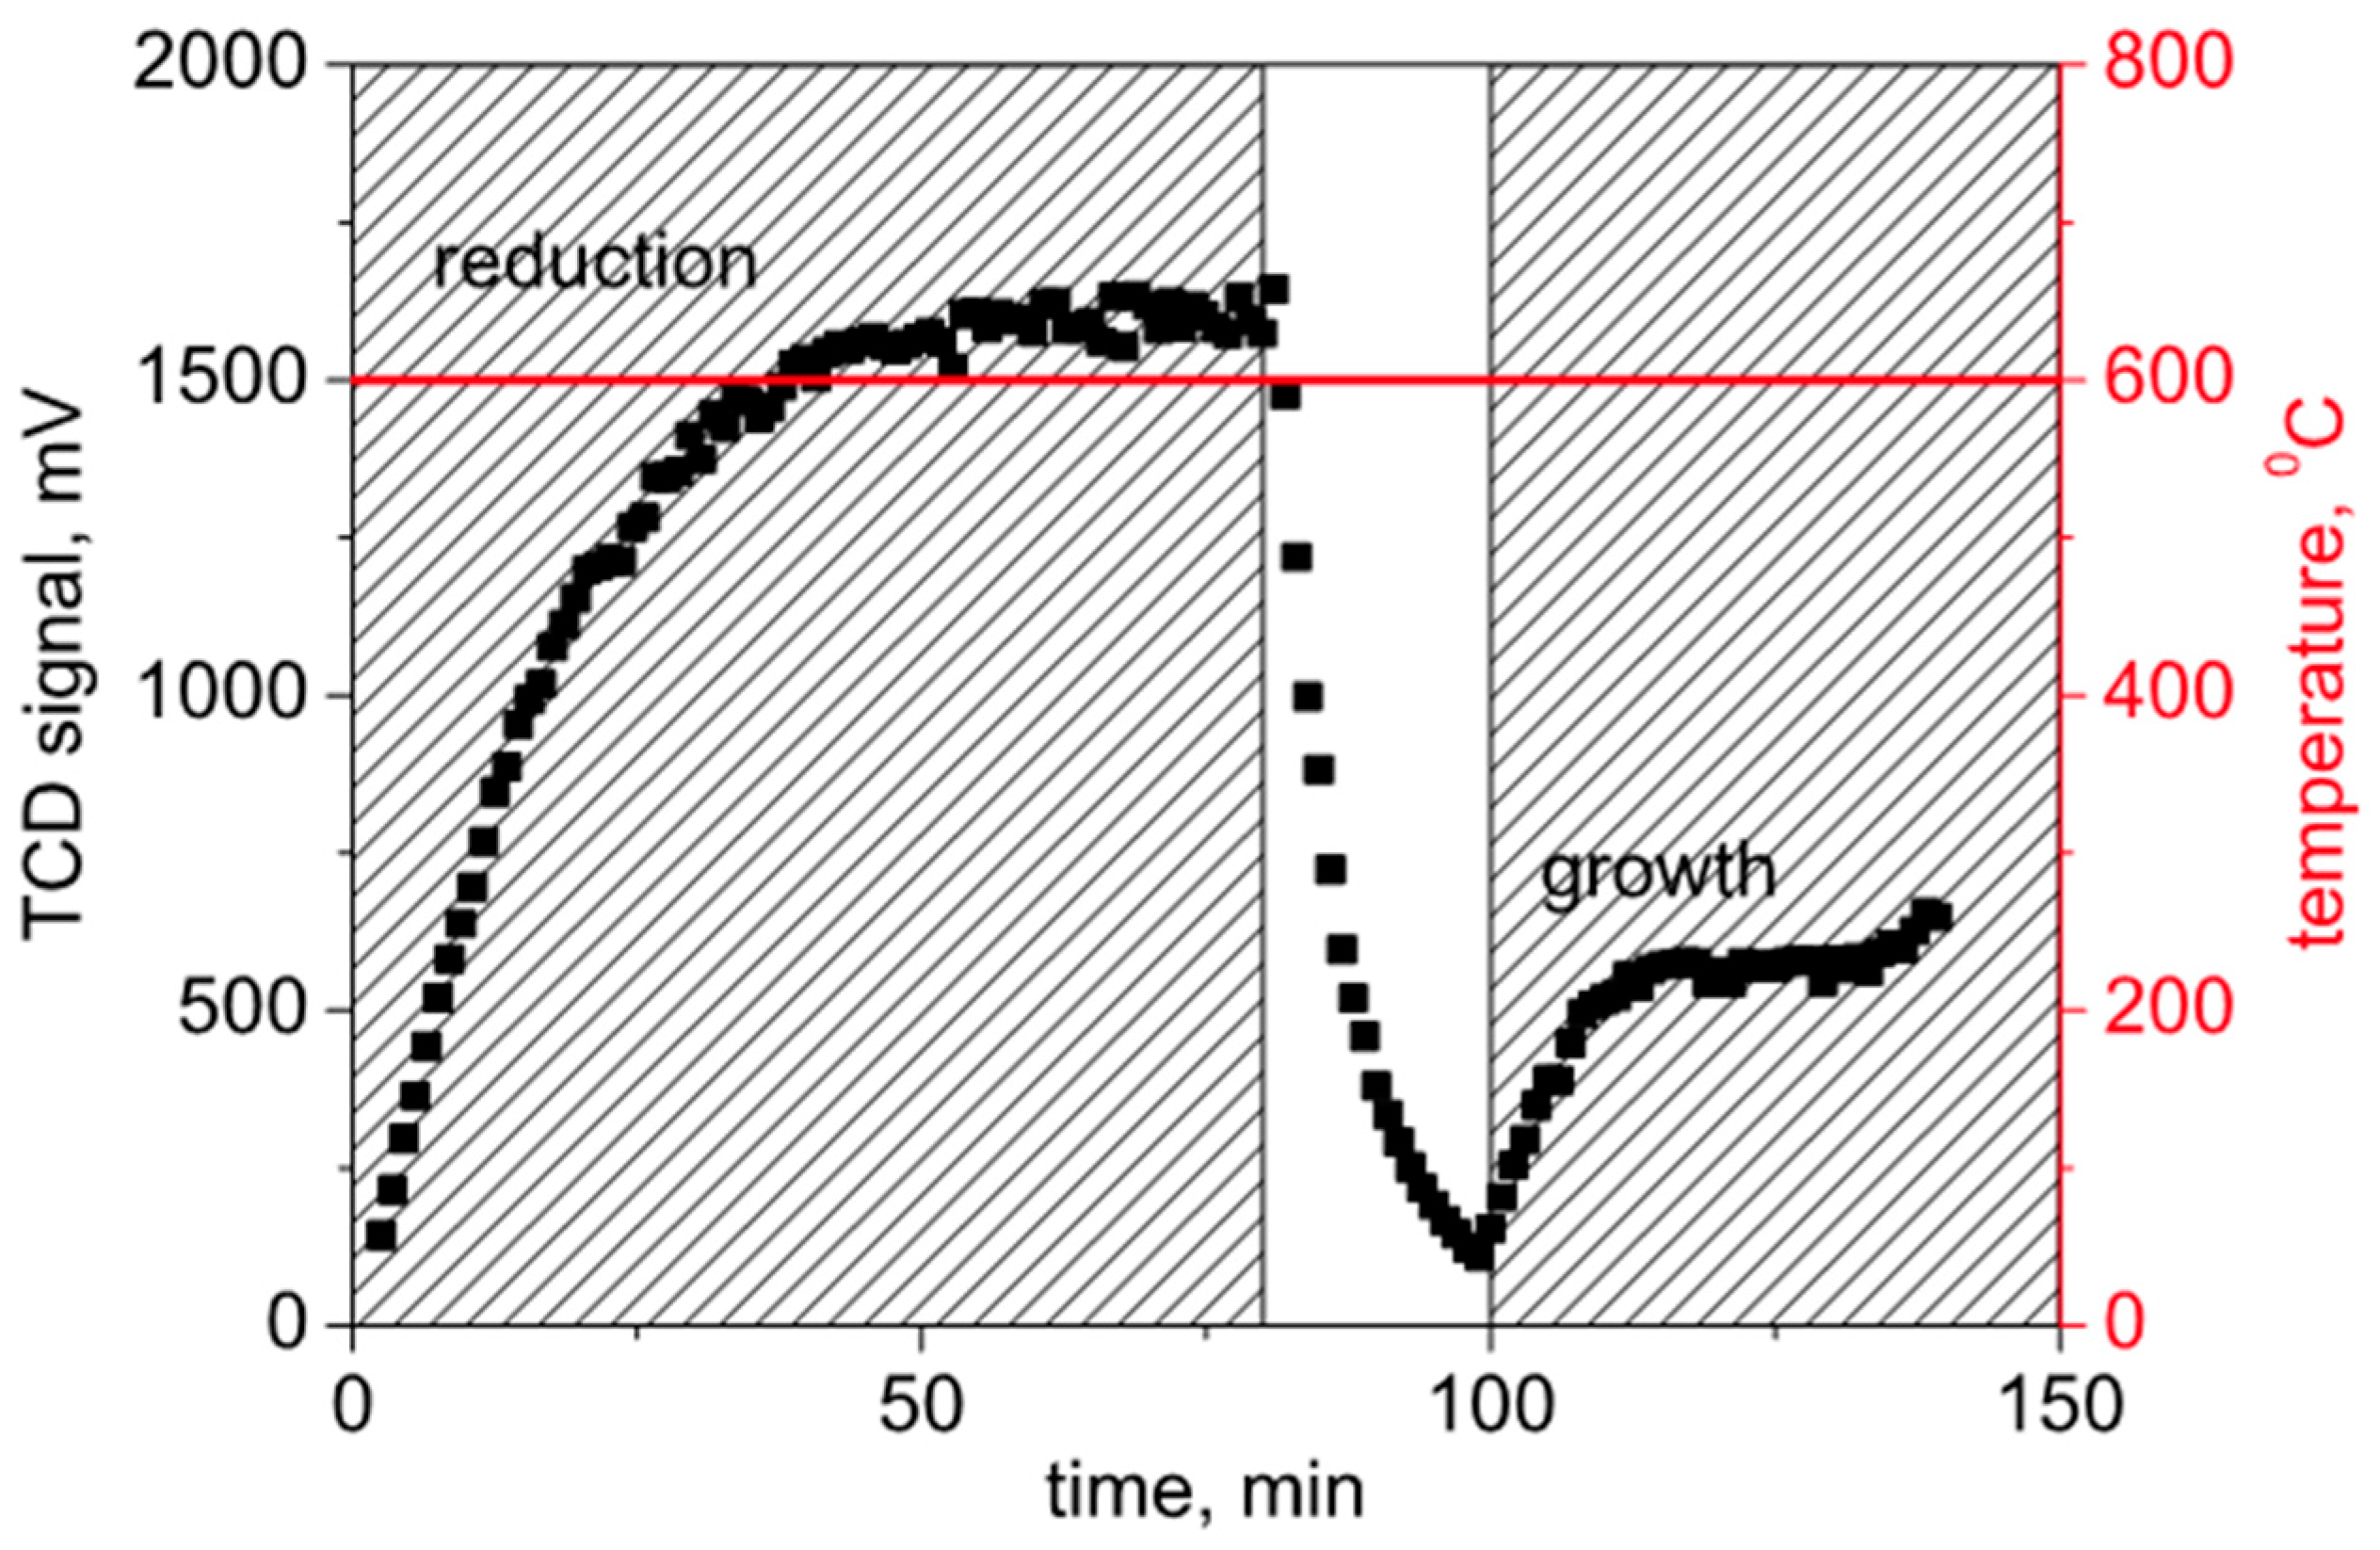
A typical response of the H
2 concentration signal is presented in
Figure 3, showing hydrogen consumption due to reduction metallic Ni and subsequent hydrogen generation during CNF growth seen in the end of the curve. In this test, the hydrogen/nitrogen mixture was fed after the reactor was heated up to 600 °C. After about 70 min, the reactor was flushed with nitrogen and then switched to a reactive mixture of nitrogen/ethylene/hydrogen.
In more detail, the reduction was done with N2:H2 = 70:30 = 466 mL/min:200 mL/min, and the growth with N2:C2H4:H2 = 70:20:10 = 1.4 L/min:400 mL/min:200 mL/min. The characteristic H2 levels are seen in the horizontal paths of the response curve (~60–75 min for the reduction and ~120–135 min for the growth phases); the corresponding levels are ~1630 or ~550 mV.
Figure 3.
Insitu GC analysis of CNF growth (H2 signal), heating in inert atmosphere (N2/H2).
Figure 3.
Insitu GC analysis of CNF growth (H2 signal), heating in inert atmosphere (N2/H2).
4. Ni Catalyst Deposition
The final growth depends to a large extent on the choice of catalyst: Ni, Fe, Co, alloys like NiCu,
etc. It is known that Ni results mostly in fishbone CNFs, whereas Fe and Co can result in CNTs, depending on the exact conditions [
18,
19,
20]. For this study, since growing CNFs was planned, the Ni catalyst was chosen.
Another important issue is the method used to deposit the catalyst onto the substrate, since this determines the particle sizes and distribution over the substrate. Several methods are tested here: (a) homogeneous precipitation deposition (HPD); (b) two types of modified homogeneous precipitation deposition (m-HPD); and (c) spraying. These methods are described in more detail in the following subsections.
The solvent can also play a role, and a broad selection is available: water, ethanol, acetone, CCl
4, benzene, ethyl ether,
etc. From the literature review [
7,
21], it appears that better results (in terms of catalyst deposition) are achieved using non-aqueous systems. On the other hand, a surface modification of the carbon fibers by soft oxidation with H
2O
2 might improve their bonding with a polymer matrix.
After some trial tests, acetone and water were chosen for this study as the base solvents. Their properties are listed in
Table 1. In the last line, the relative evaporation (the property important for the production speed) is defined as how fast/slow the liquid evaporates in comparison to n-butyl acetate, which is taken as the standard (evaporation rate 1.0). The rates were estimated according to ASTM D3539-11.
Table 1.
Solvent properties.
Table 1.
Solvent properties.
| Property | Acetone | Water |
|---|
| dipole moment, D | 2.91 | 1.85 |
| density, g/cm3 | 0.79 | 1 |
| viscosity, cP | 0.31 | 1 |
| relative evaporation (in comparison with n-butyl acetate) | 5.6 | 0.3 |
4.1. HPD
Homogeneous precipitation deposition (HPD) was performed by immersing the fabric in a cold (room temperature) water solution of Ni nitrate and urea (proportion used for a 2 cm2 piece of the fabric: 0.25 g Ni(NO3)2 and 1.25 g urea in 50 mL H2O). The prepared fabric was subsequently heated to ~90 °C at which decomposition of urea, formation of ammonia, and rise of pH led to in situ formation of Ni(OH)2 everywhere in the solution and also on the carbon fibers.
It was expected that simultaneous heating of the fabric and the solution would ensure a homogeneous concentration of Ni through the solution, and thus the Ni hydroxide would be formed everywhere at the same time and at the same concentration. However in practice, the resulting specimen was covered with a gel-alike substance (and also the entire fabric becomes loose and difficult to handle in one piece). This directly suggested that this gel would not cover the fibers uniformly after drying.
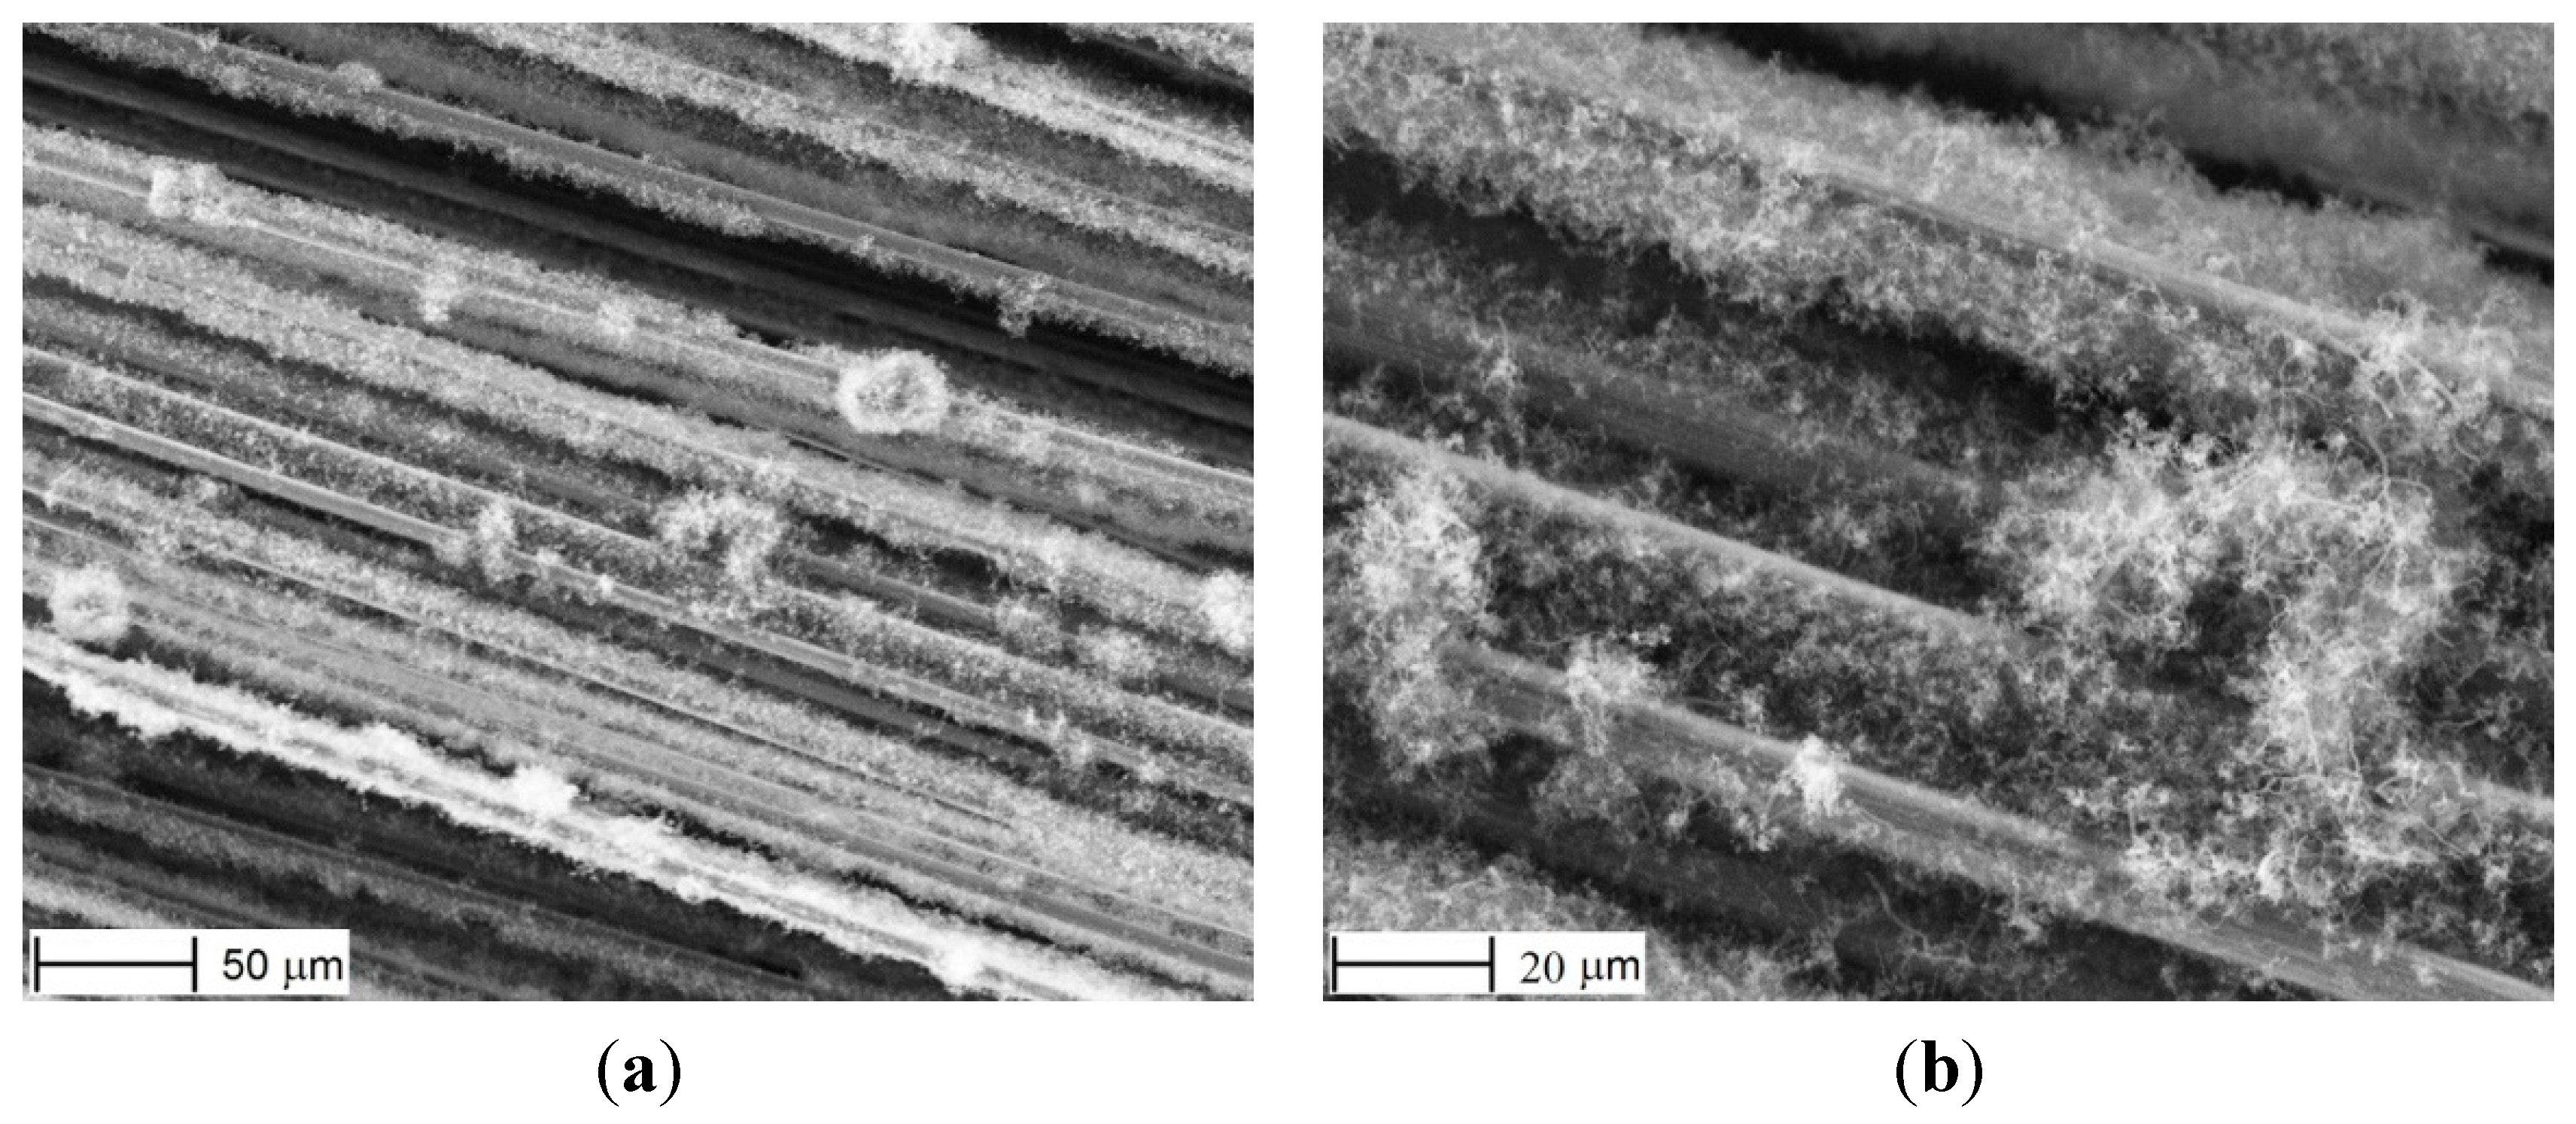
Indeed, when the fabric was dried in air at 100 °C for about 15 min, then placed into the reactor where it was oxidized in air at 300 °C for 60 min, and then heated at 600 °C in H2 atmosphere to reduce NiO into Ni, and finally the CNFs were grown, this resulted in a non-uniform distribution of Ni particles and in a non-uniform CNF growth. This is revealed in
Figure 4, which suggests that agglomerates of Ni(OH)
2 were formed at some places and no Ni(OH)
2 at other places (here and below, SEM images were taken at several spots over the specimens). If the fabric was “washed” in water before drying (to remove the gel), then most of Ni was removed as well, and the distribution was non-uniform again.
Figure 4.
CNFs after HPD method. Uneven distribution of the growth under smaller (a) and larger (b) magnification.
Figure 4.
CNFs after HPD method. Uneven distribution of the growth under smaller (a) and larger (b) magnification.
4.2. m-HPD-I
To improve homogeneity of the CNF growth, two modifications of the previous method were implemented. In the first one (m-HPD-I) the fabric was immersed in the same cold solution of urea and Ni(NO
3)
2 in water but was not heated to 90°. This prevented Ni(OH)
2 formation while the fabric was in the solution, and thus the negative effect of disintegration of the yarns (mentioned in the previous subsection) was eliminated. In this case, Ni(OH)
2 particles appeared during the drying process in air (the same 15 min at 100 °C and then 60 min at 300 °C). The subsequent procedures were the same as in the HPD described in
Section 4.1.
As seen in
Figure 5, this improved in some extent the uniformity of Ni distribution. However, the fibers were severely damaged (as seen in
Figure 5a), probably due to oxidation.
Figure 5.
Nickel particles (a) and CNFs (b), after modified HPD-I.
Figure 5.
Nickel particles (a) and CNFs (b), after modified HPD-I.
4.3. m-HPD-II
The second modification was the same as m-HPD-I but without oxidation in air at 300 °C. This significantly improved the final state of the fibers,
Figure 6; they are not damaged anymore but have smooth surfaces.
Figure 6.
Nickel particles (a) and CNFs (b), after modified HPD-II, no oxidation.
Figure 6.
Nickel particles (a) and CNFs (b), after modified HPD-II, no oxidation.
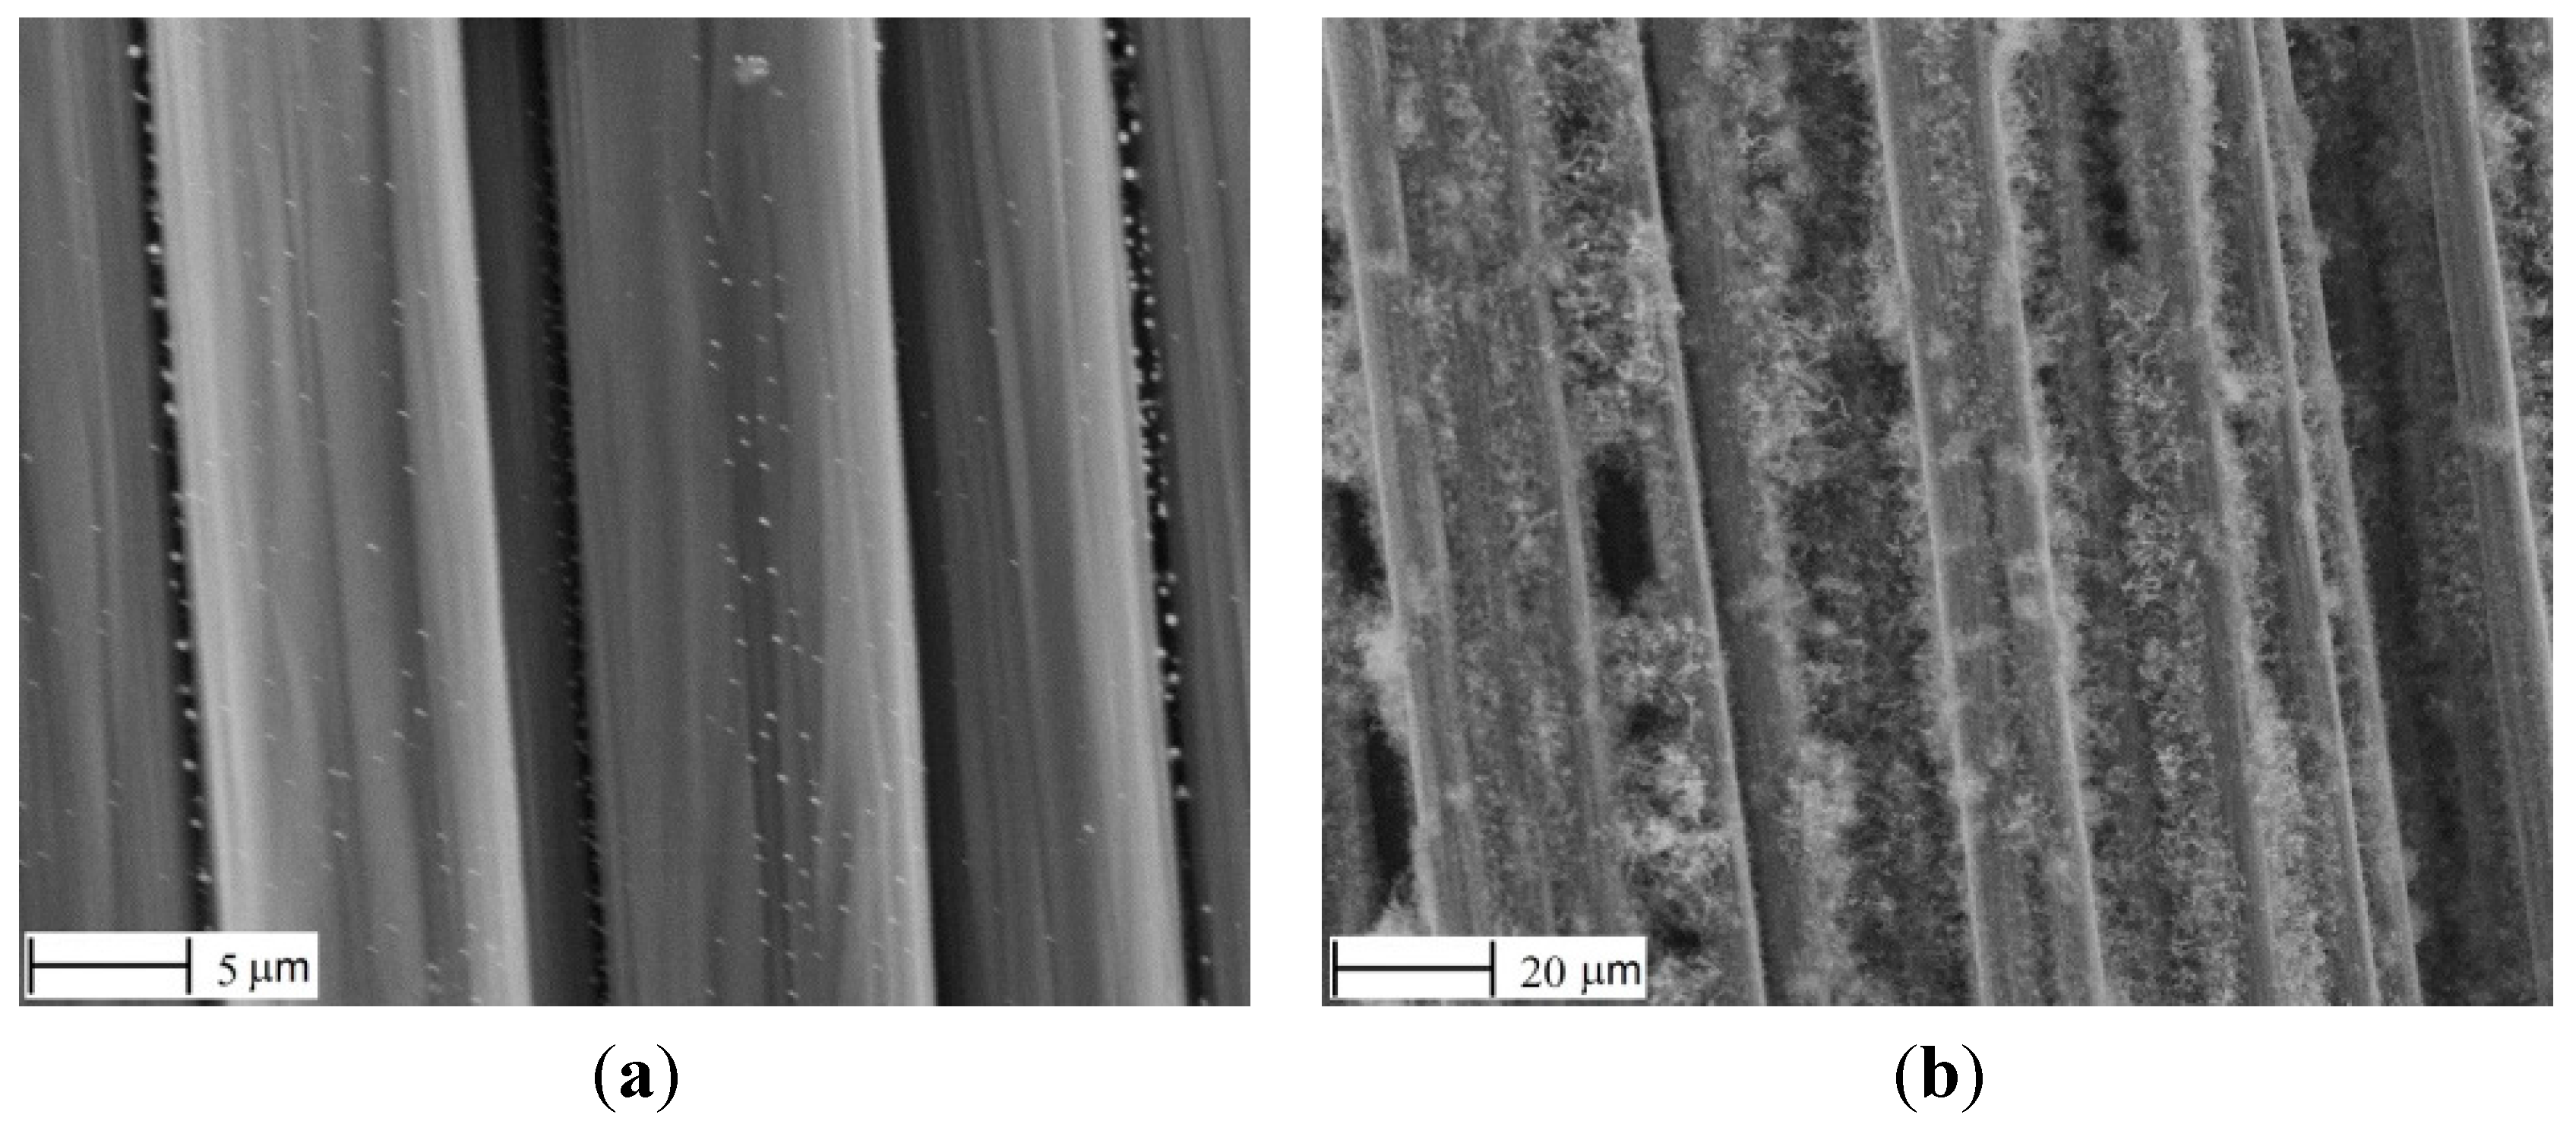
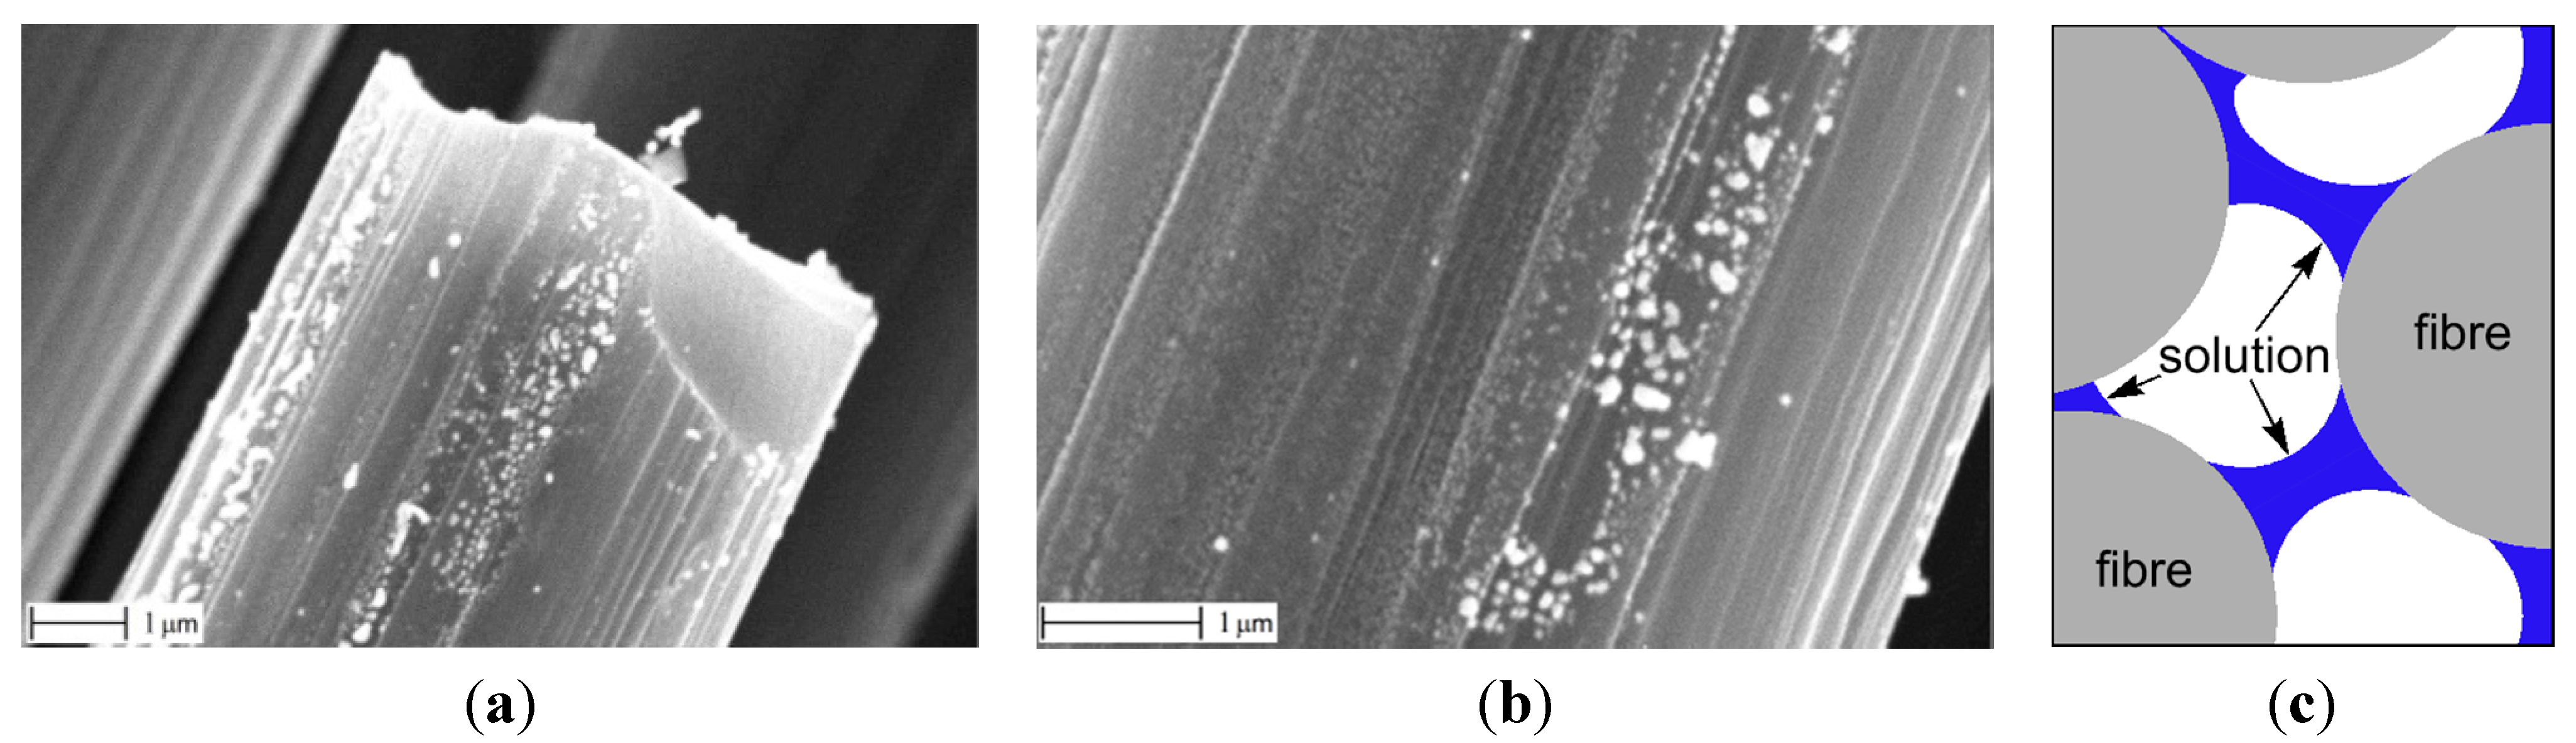
However, the Ni particles are mainly located in the spaces between adjacent fibers, rather than uniformly distributed on the fiber surfaces.
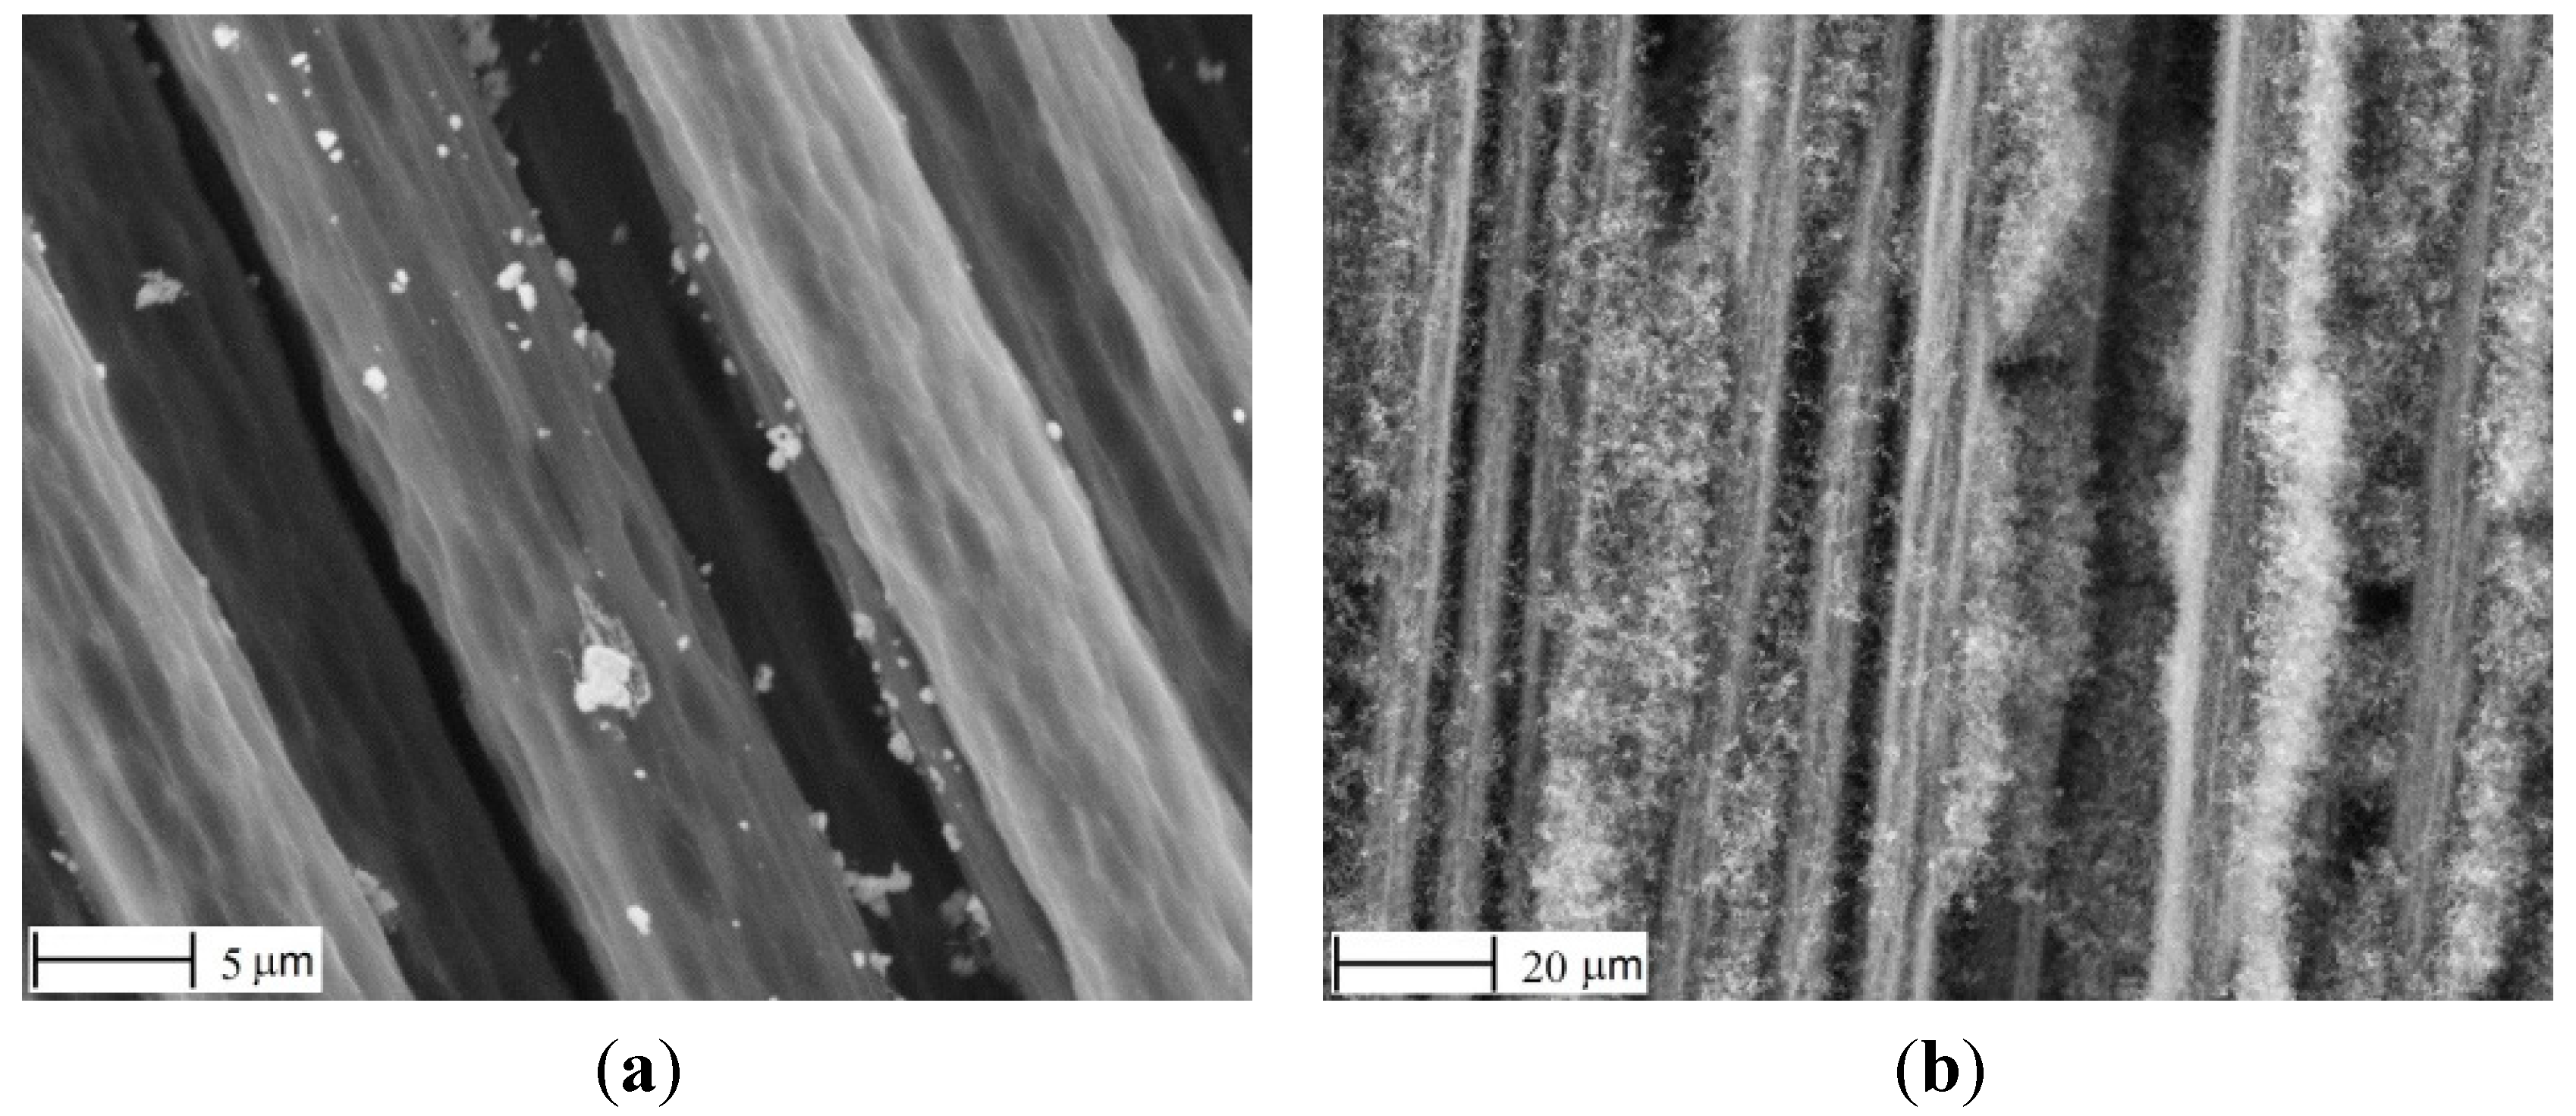
Figure 7a,b presents larger-magnification pictures of a typical Ni distribution on the fibers, showing distinct traces along them. This behavior is possibly related to the surface tension, viscosity, and volatility of the solvent (water), resulting in a non-uniform wetting and drying of the fibers, as illustrated in
Figure 7c.
Therefore, a different solvent should be used. As an alternative for water in the role of solvent, acetone was a good candidate. This is because it dissolves Ni nitrate, due to its polarity, while its volatility and viscosity significantly differ from the values for water (see
Table 1). Implementation of the acetone solution is discussed in the following subsection.
Figure 7.
SEM images of Ni loaded fibers (a,b). Schematic of hypothetical non-uniform wetting on the micro-level (c).
Figure 7.
SEM images of Ni loaded fibers (a,b). Schematic of hypothetical non-uniform wetting on the micro-level (c).
4.4. Spraying
Immersion techniques used above can be a good choice for continuous production, where an “infinite” fabric would be pulled from a roll through a bath and then led further to an oven. In the present “handmade” case, however, evacuation of the fabric from a bath with Ni(NO3)2 solution, due to capillary forces and gravitation, always results in an inhomogeneous distribution and unknown level of catalyst deposition.
To avoid this drawback, the fabric was laid on a flat surface and sprayed with a water or acetone solution of Ni(NO3)2. The concentration of Ni in the solution was chosen to be 0.25% (a higher percentage would cause much less uniform CNF growth). Typically, a 26 × 31 cm2 piece of fabric needed about 1 g of Ni(NO3)2 · 6H2O dissolved in 25 mL of water or acetone. From this solution, about 20 mL was used for the specimen. Therefore, about 0.16 g of elementary Ni was introduced in the fabric, i.e., about 0.7 wt%.
The fabric was then dried at room temperature for about 60 min, without moving it from the surface at which it was sprayed. Finally, it was placed into the reactor, where the steps listed in
Section 3 were performed.
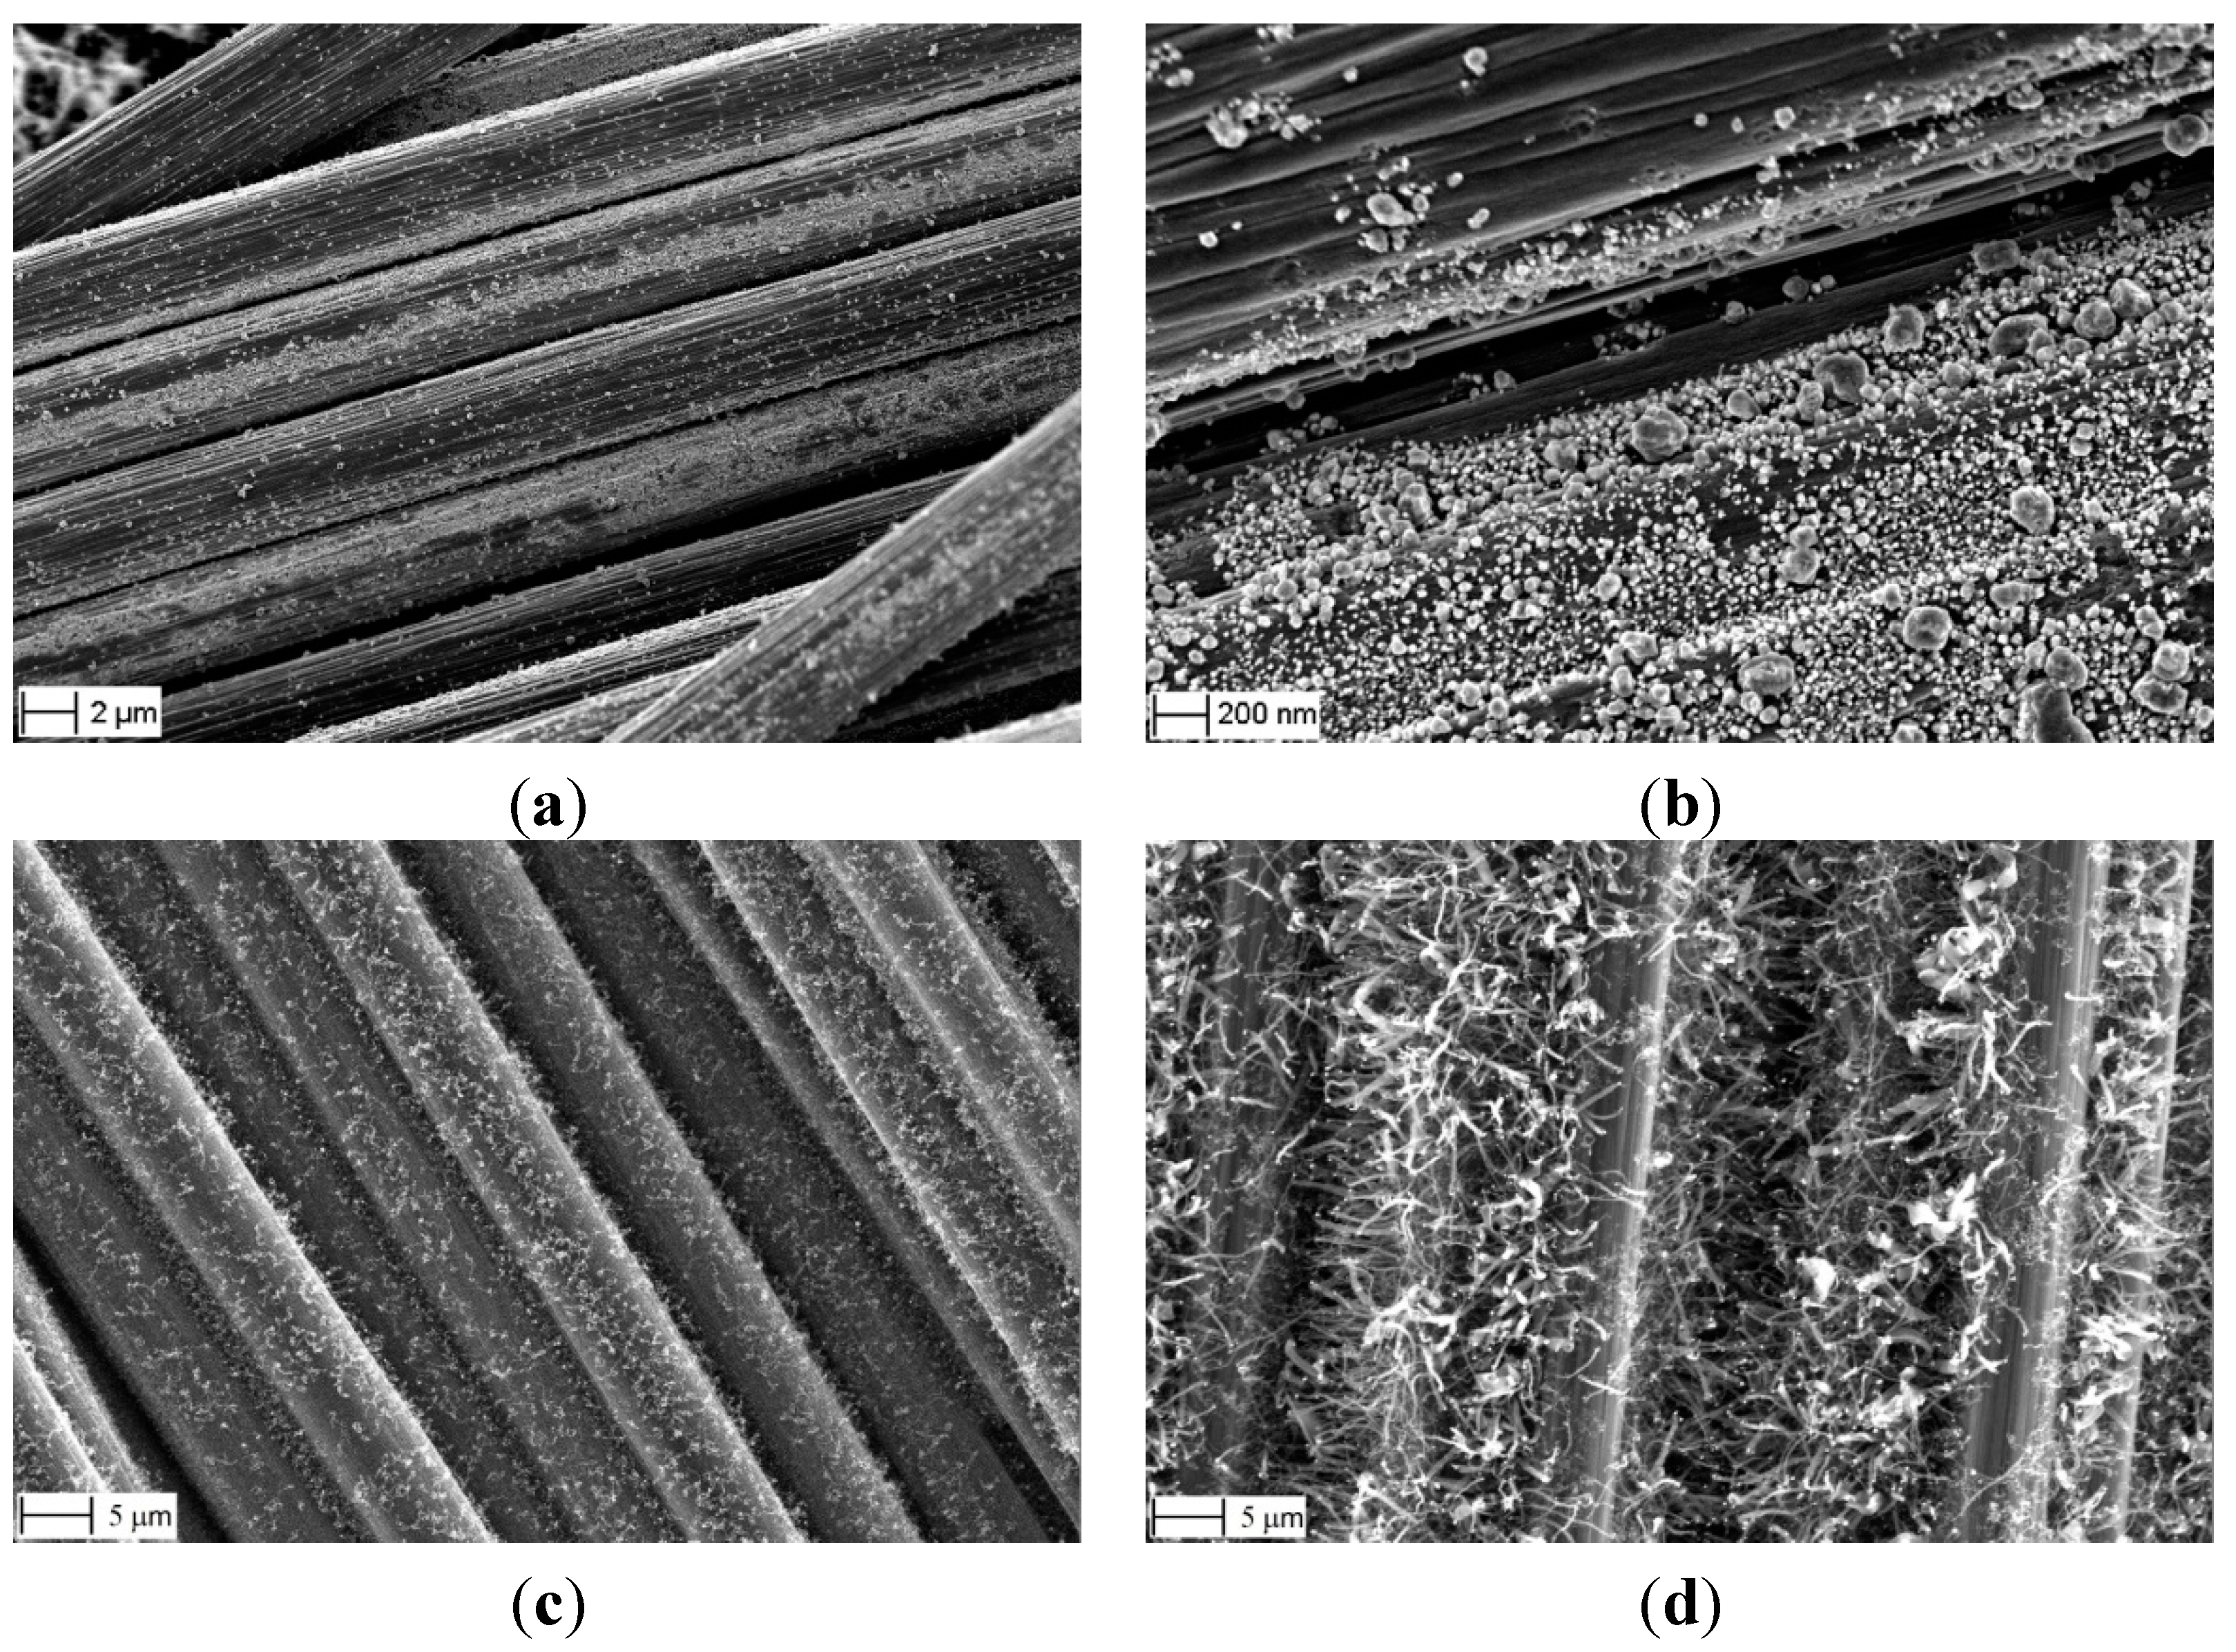
Typical SEM images of Ni(NO
3)
2-loaded fibers are shown in
Figure 8. It is seen that Ni salt covers the fibers, not uniformly, and in the form of small pieces or even larger (5–15 micron long) agglomerates.
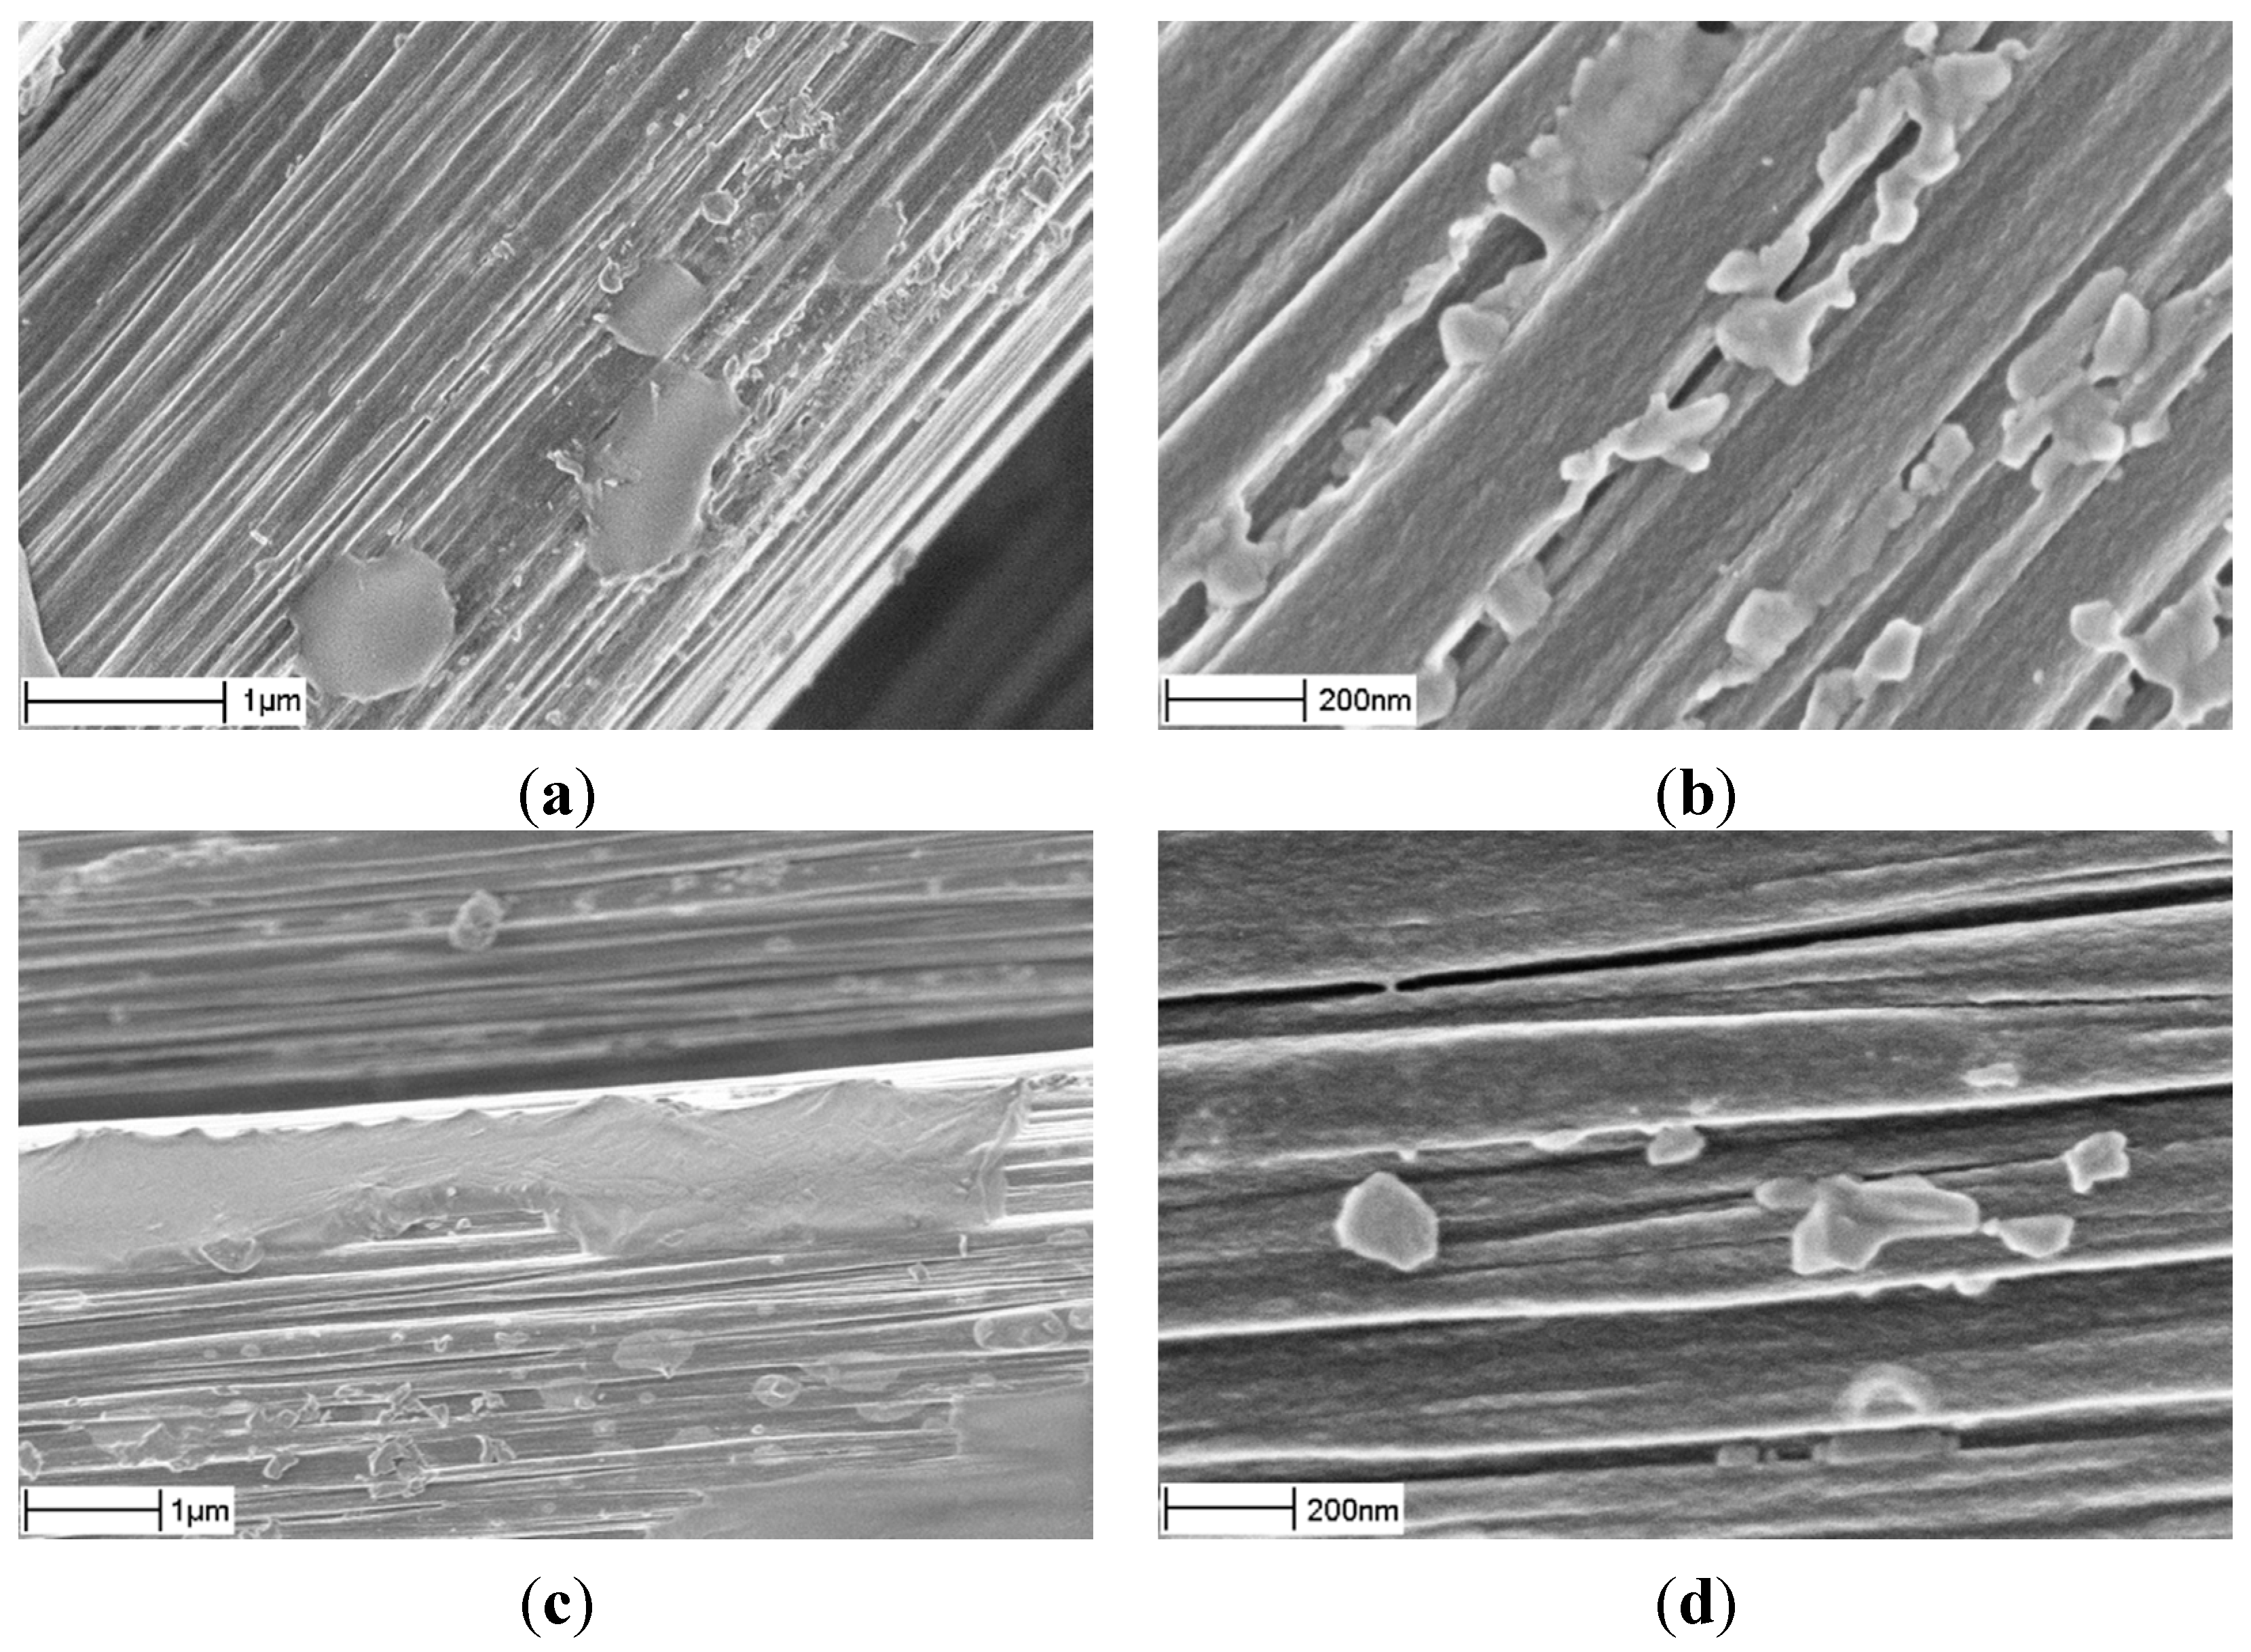
However, after the reduction into elementary Ni particles they show significantly better distributions, see
Figure 9a,b. The particles still form long agglomerates on the fiber surfaces but now these traces are wider, and the spaces between them are filled with a certain amount of particles,
cf. Figure 7. After the growth, the resulting CNF distribution is also more uniform, see
Figure 9c,d.
Figure 8.
Ni(NO3)2 loaded fibers, after spraying with water (a,b) or acetone (c,d) solution.
Figure 8.
Ni(NO3)2 loaded fibers, after spraying with water (a,b) or acetone (c,d) solution.
Figure 9.
Ni particles (a,b) and CNFs (c,d) after spraying with acetone solution.
Figure 9.
Ni particles (a,b) and CNFs (c,d) after spraying with acetone solution.
Even for this method, the acetone solution, in comparison with the water solution, appears to result in better-dispersed CNFs. Obviously, this is because different surface tension, polarity and high evaporation rate combined lead to a better distribution of Ni(NO3)2 on/in the fabric.
Evaporation rate and low surface tension also (presumably) has an influence on Ni particle size; it is observed that the particles are larger and their size distribution is wider after the water solution. Low surface tension is probably a very important effect because it prevents the formation of large droplets, which would have a detrimental effect on the distribution of the precipitated Ni salt.
Higher magnification SEM and TEM images [
22] show that the growth consists of entangled, randomly shaped and sized CNF, presumably with cup-type morphology. There are large (diameter about 100 nm, maybe caused by large Ni particles), as well as thin (5–20 nm diameter), CNFs. They are organized in a spaghetti-like structure, covering the carbon fibers. For a reasonable wt% of growth (e.g., 5% by mass), thickness of this structure can be 1–2 microns. The Ni particles are positioned mostly at the ends of CNFs. However, they can appear in other positions along CNFs, where a single Ni particle fragmentizes into several particles, resulting in several CNFs of similar diameters.
One specimen was treated in an ultrasonic bath, following [
23,
24], to check attachment of CNFs. This showed that less than 5% of CNFs were detached from the microfibers.
Last, but not least, is to mention that this method did not result in degradation of the fiber surface, in comparison with HPD-I, see
Figure 5a. The mechanical performance was evaluated by tension of dry yarns; this revealed that their stiffness and strength were not influenced, as shown below.
5. Post-CVD Strength and Stiffness of Yarns
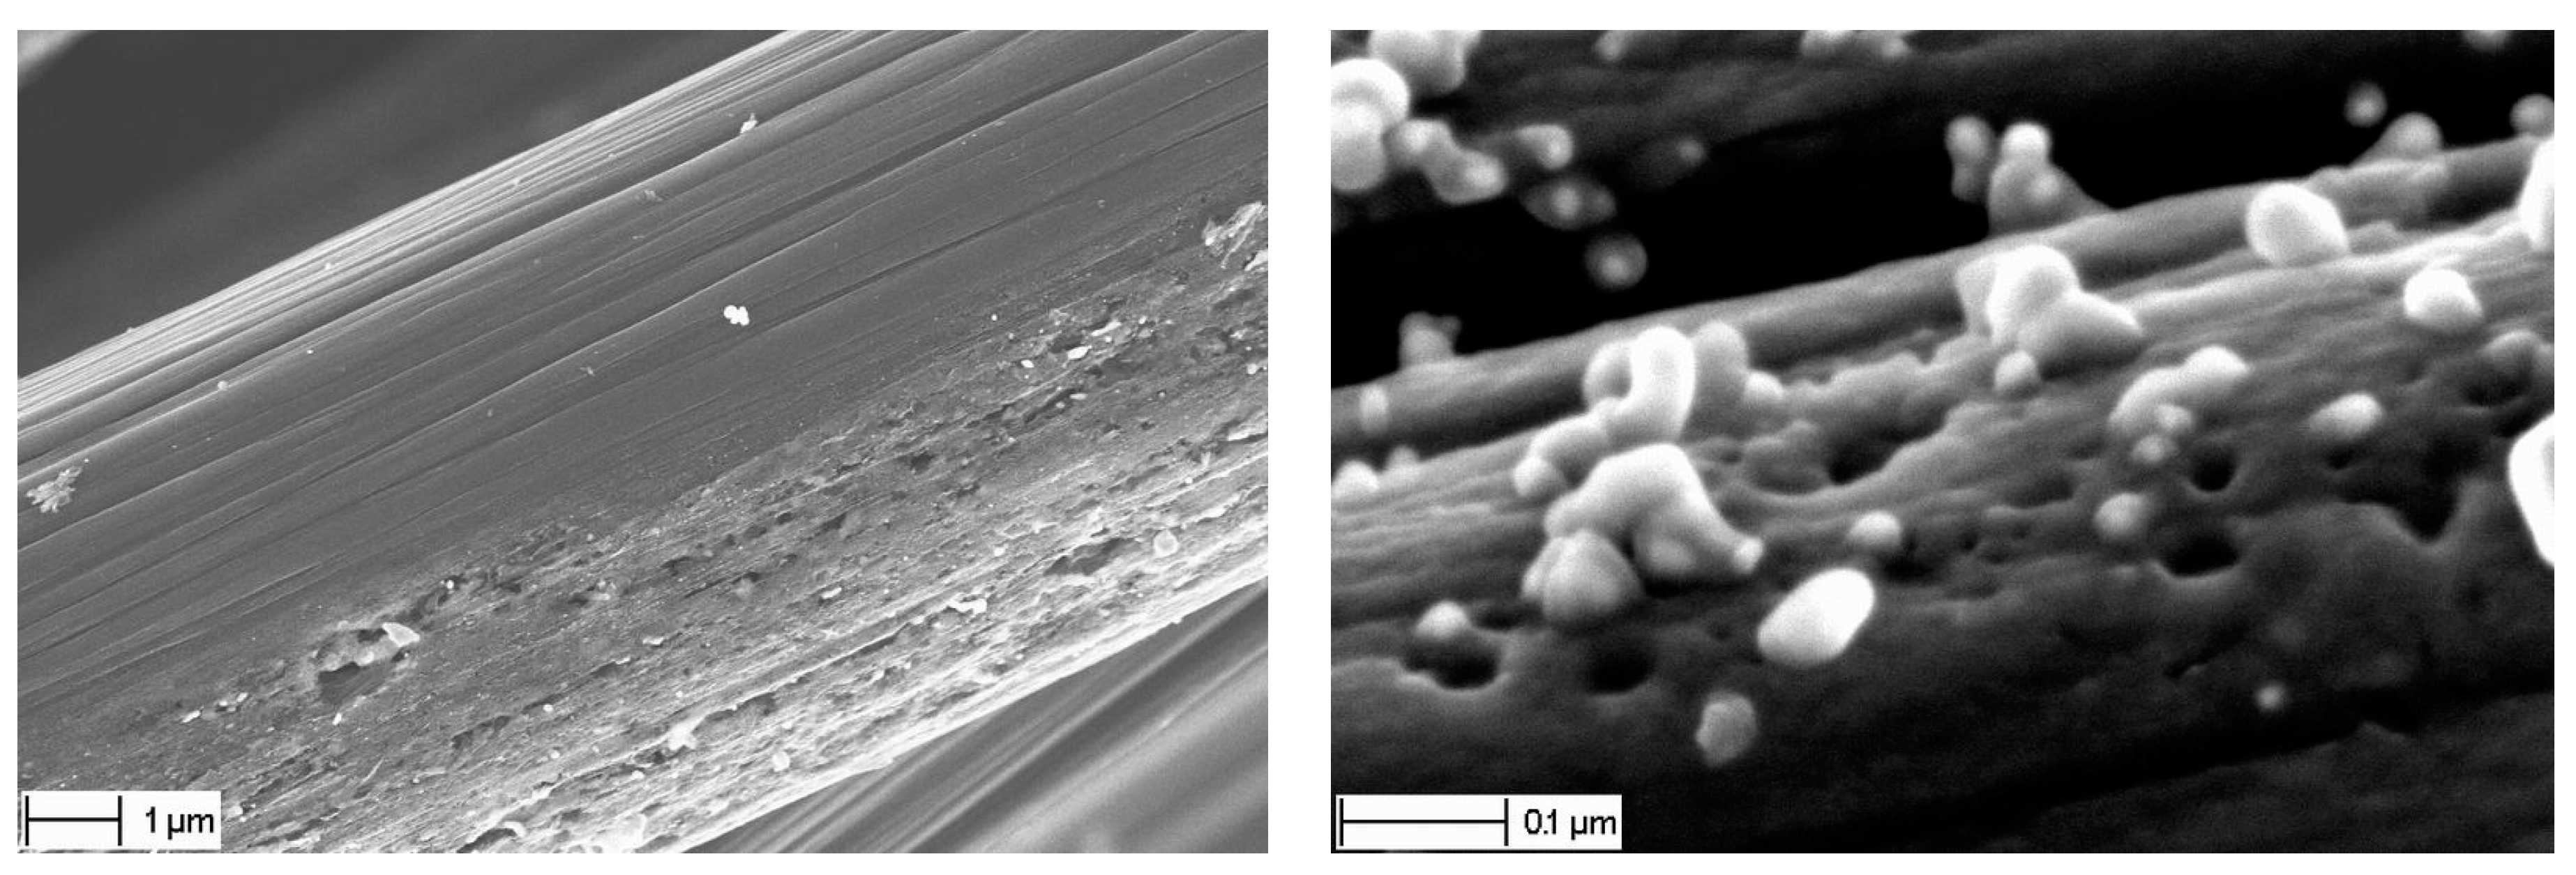
Although this method did not result in gross degradation of the fiber surface, in comparison with HPD-I (
cf. Figure 5a and
Figure 9a), some local “erosion” of the fibers was sometimes observed after transformation of Ni nitrate into pure Ni and CNF growth,
Figure 10. Therefore, residual mechanical performance was evaluated, by tension of dry yarns. As references, “base” (pre-CVD) de-sized and sized yarns were also tested. The latter had the original Torayca standard sizing by about 1% of the fabric, by weight [
25].
Figure 10.
Typical erosion of carbon fiber surface, after “spraying” method.
Figure 10.
Typical erosion of carbon fiber surface, after “spraying” method.
About 25-cm-long strings of yarn were picked out of the fabrics, avoiding any distortion. This was easy for highly grafted yarns, since their fibers were bonded together by CNFs, while the “base” yarns needed more careful handling. About 5-cm-long ends of the yarns were “tabbed” by impregnating these areas with epoxy, thus fixing the filament positions inside the yarns and avoiding slipping of the fibers during tension. These tabs were used to clamp the specimens in screw-tightened grips.
Tensile tests were performed using a universal testing machine, with a 1 kN load cell and a 2 mm/min crosshead speed. About 15 specimens were tested in every series; weft and warp yarns were tested in separate series. The displacements were accurately measured with a Multisens
® extensometer at about 10-cm gauge length, as shown in
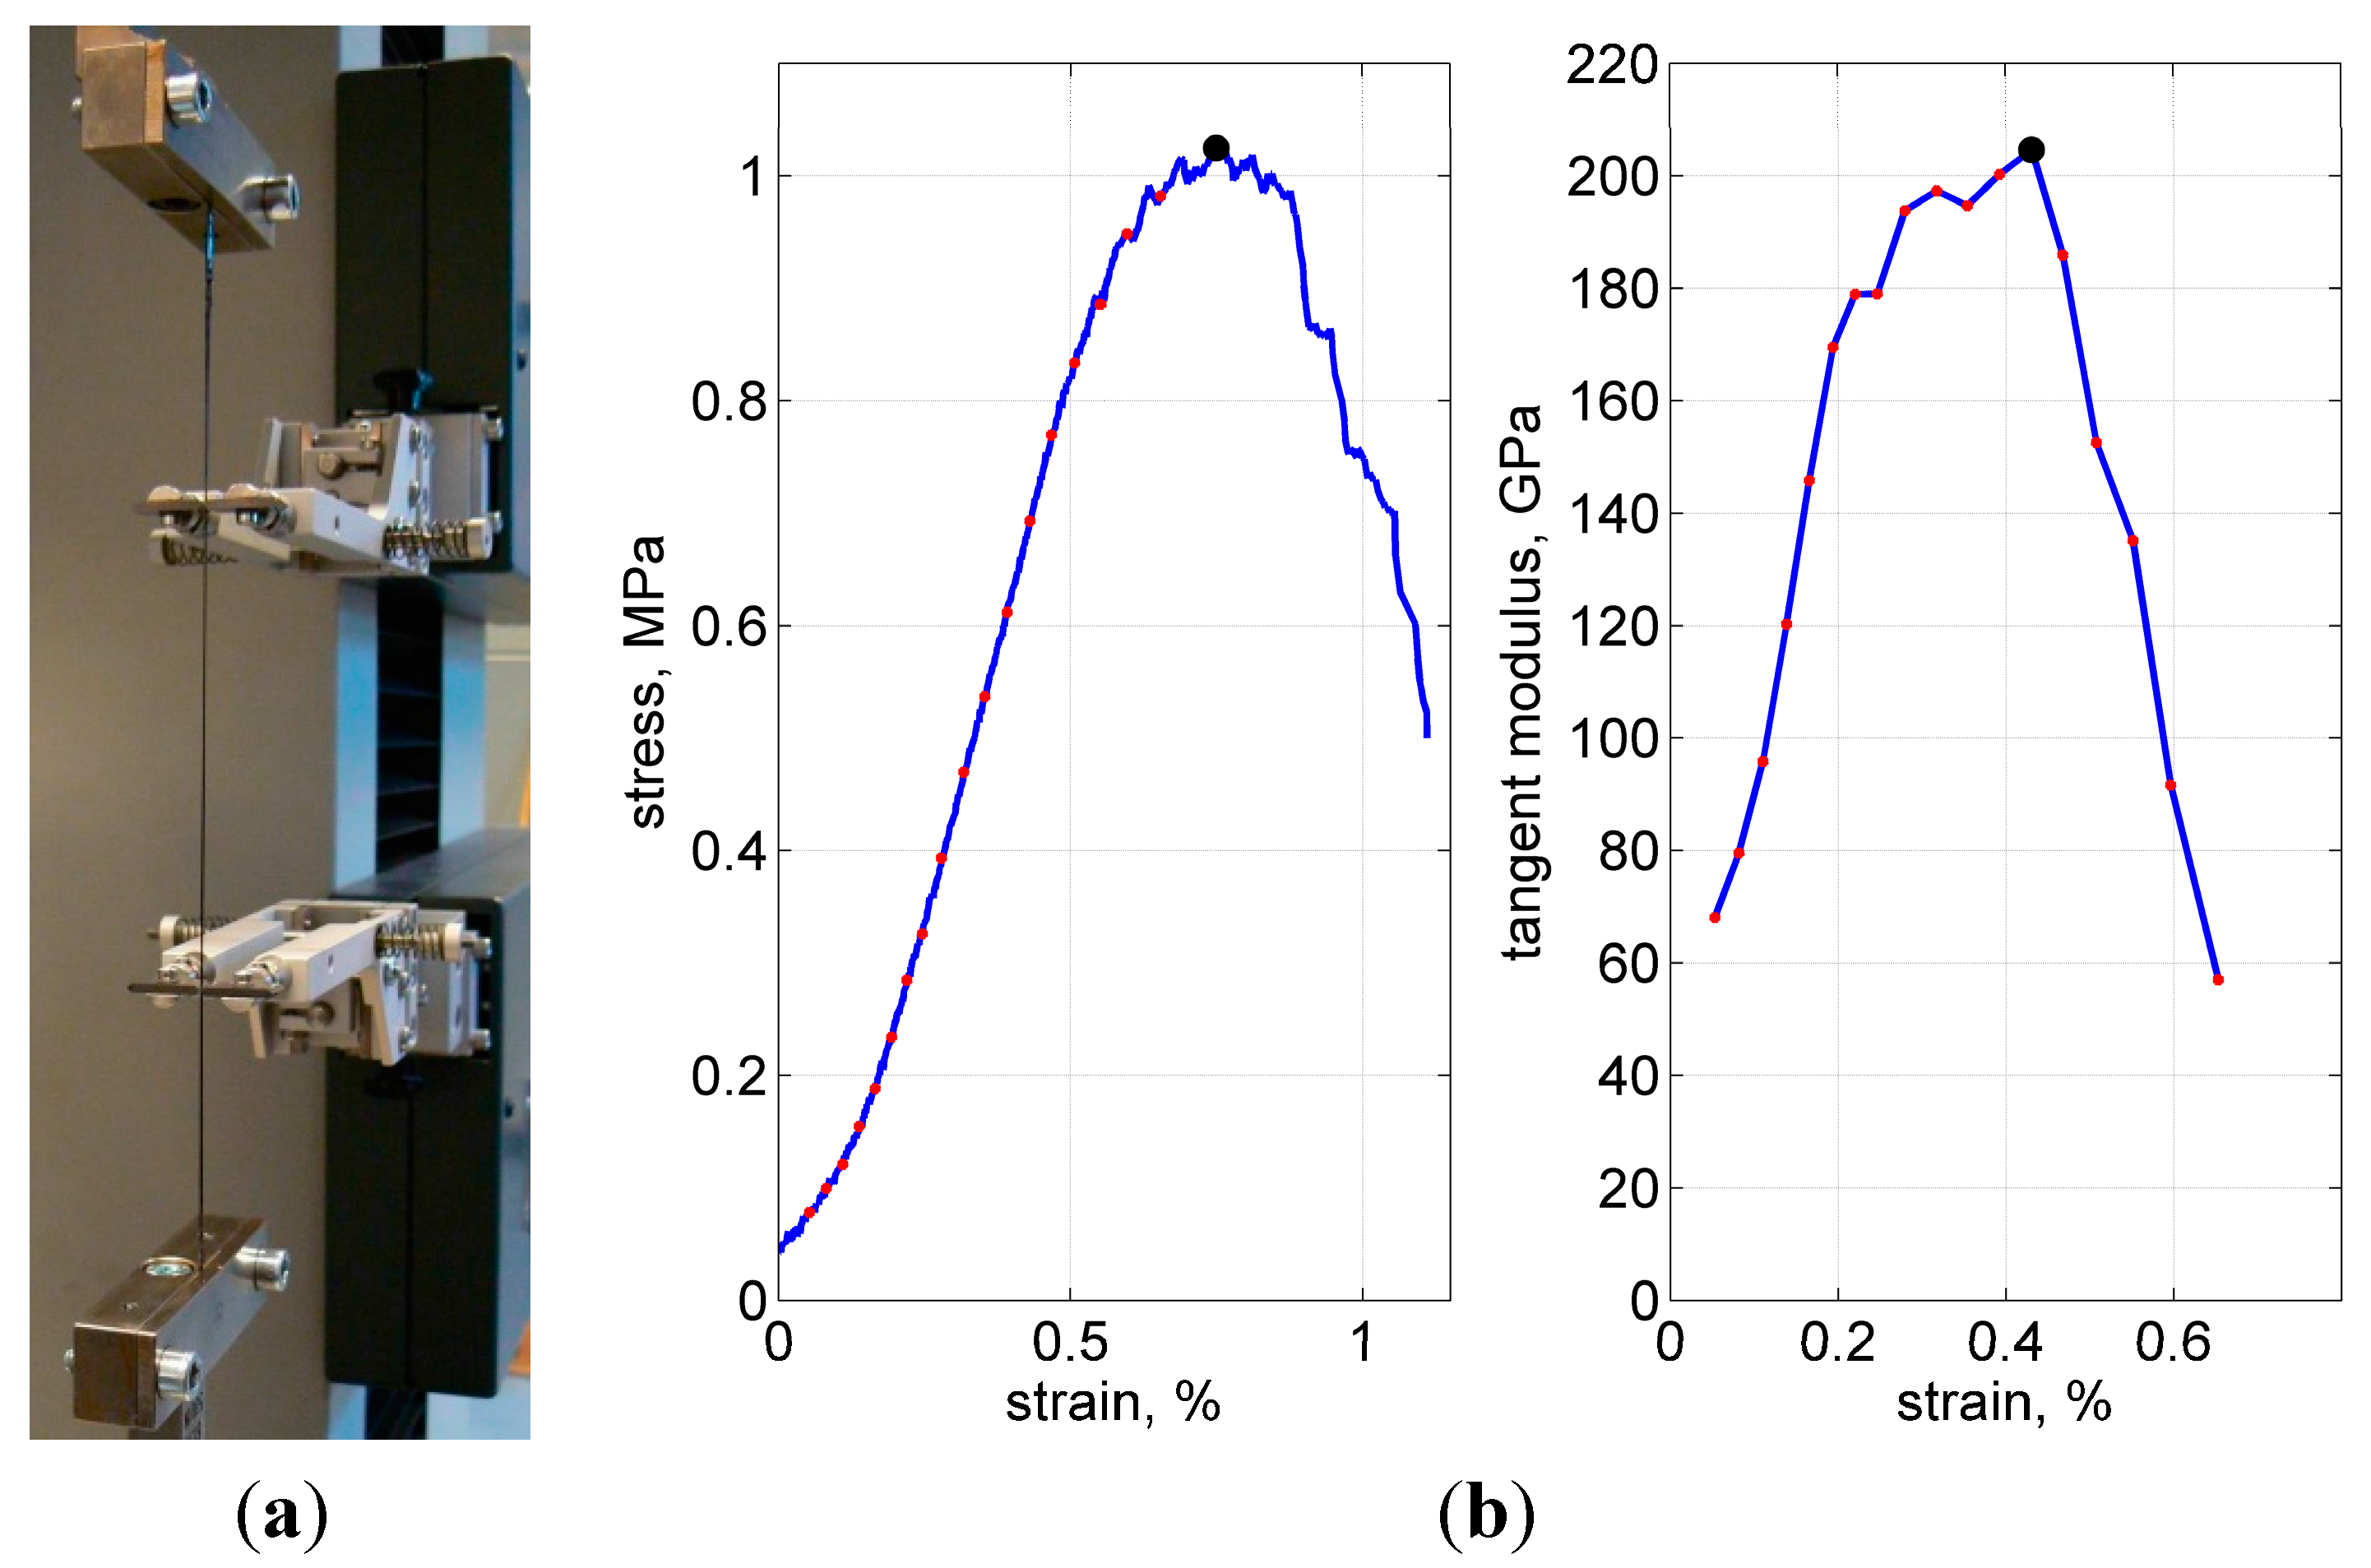
Figure 11a.
Figure 11.
Test fixture (a), typical load curve and calculation of the tangent modulus (b). Ultimate stress, strain and modulus are shown with the solid dot at the peak of each curve.
Figure 11.
Test fixture (a), typical load curve and calculation of the tangent modulus (b). Ultimate stress, strain and modulus are shown with the solid dot at the peak of each curve.
Figure 11b shows a representative stress-strain curve. Closer to the load peak, some—the weakest or the most stretched—fibers started to break, resulting in popping sounds and a gradual decrease in stiffness. After the number of broken fibers increased progressively, the load started to decrease. The tests were stopped after the force dropped below about 50% of the maximal value.
As the measure of stiffness, the maximal tangent modulus was used. To calculate this property, first, the total cross-sectional area was assumed to be 0.115 mm
2 (3000 filaments in a yarn, 7 µm diameter each). Second, the stress-strain curves were processed, when their increasing paths were divided into 10 N steps, to calculate the tangent for every step and to choose the maximal tangent after all steps were finished, as illustrated in
Figure 10b.
The average results—tangent modulus, strength, and failure strain—are summarized in
Table 2, as well as their statistical scattering. It is seen that the fiber surface erosion,
Figure 10, does not influence the fiber stiffness. This is the expected conclusion, since the eroded “grooves” are not very deep and occupy only a small portion of the fiber cross-section.
With respect to the strength, it may be suggested that its dependency on the fiber erosion is also small enough. Moreover, this effect seems to be overcome by a slight strengthening of fibers at 600 °C, as seen in
Table 2. This corresponds to studies [
26,
27,
28] where similar improvements after CNT grafting were observed for single filaments.
Table 2.
Yarn tension results (warp/weft).
Table 2.
Yarn tension results (warp/weft).
| Property | Sized | De-Sized | 5.6 wt% | 15.9 wt% | 19.1 wt% |
|---|
| modulus, GPa | 268 ± 8/222 ± 33 | 246 ± 11/200 ± 33 | 202 ± 11/229 ± 34 | 203 ± 18/206 ± 29 | 259 ± 10/257 ± 12 |
| ult. stress, GPa | 1.17 ± 0.13/1.12 ± 0.08 | 1.07 ± 0.22/1.10 ± 0.17 | 1.03 ± 0.20/1.14 ± 0.16 | 1.18 ± 0.16/1.03 ± 0.20 | 1.37 ± 0.14/1.32 ± 0.21 |
| ult. strain, % | 0.51 ± 0.06/0.59 ± 0.07 | 0.60 ± 0.06/0.73 ± 0.09 | 0.75 ± 0.13/0.77 ± 0.10 | 0.76 ± 0.09/0.73 ± 0.14 | 0.69 ± 0.06/71 ± 0.04 |
It is interesting to note that the present test data for the “base” yarns approach closely the nominal Young’s modulus for T300J yarns (230 GPa) [
25], and sometimes even exceed this value. This indicates that most fibers are aligned well in the tested yarns. The measured ultimate stress and strain are of course much lower than the nominal values (4.2 GPa and 1.8%, respectively), since the filaments are not bonded with a matrix.


