1. Introduction
The steady increase of global CO
2 emissions from fossil energy, cement and metal productions reached for a new record in 2013 with 35.3 billion tonnes (Gt) of CO
2 emitted in the atmosphere [
1]. The three largest global CO
2 emitters were China (10.3 Gt), the United States (5.3 Gt), and the European Union (3.7 Gt), accounting for more than half of total global CO
2 emissions [
1]. The concentration of CO
2 in the atmosphere has now reached values beyond 400 ppm, increasing from 280 ppm in pre-industrial times [
2]. With a concerted political, financial, and technological response to global emissions, the CO
2 levels could be stabilized at 450 ppm, a value beyond which it is believed that the resulting temperature increase would further alter precipitation patterns, melt glaciers, rise sea levels, and intensify weather extremes as never experienced before [
3].
Anthropogenic CO
2 emissions are mainly due to coal-, oil- or natural gas-fired power plants. A strong signal of the scale and severity of the problem comes with the new Clean Power Plan announced by US President Barack Obama to fight climate change, aiming to reduce the CO
2 emissions in the United States by 32% in 2030 from the 2005 baseline [
4,
5,
6]. The new rule would be applied to the nation’s power plants, the largest source of CO
2 pollution in the US. This new initiative could result in the decommissioning of large number of coal-fired power plants, encouraging the market to invest in low-carbon energy solutions.
Carbon capture and storage (CCS) technologies represent a concrete solution to CO
2 mitigation. In particular, in the United Kingdom these technologies are gathering momentum with large financial investments in the development of commercial scale CCS. In 2014, the White Rose CCS project was awarded a 300 million Euro funding from the European NER 300 programme, the largest in the world for innovative low-carbon energy demonstration projects [
7,
8]. Currently in a phase of consultation, the White Rose project plans to develop a state-of-the-art oxyfuel coal-fired power plant integrating full carbon capture and storage technology [
9]. With about 450 MW electric gross output and 90% of CO
2 emissions captured, the plant would provide enough low-carbon electricity for over 630,000 households [
9]. The captured CO
2 would be pipelined for permanent undersea storage in the North Sea [
9]. The Peterhead CCS project is another approach for the production of low-carbon electricity in the UK. The post-combustion retrofit of CO
2 capture at one of the existing Peterhead Power Station combined gas cycle turbines, would allow to store more than 90% of emitted CO
2 in offshore Shell-operated depleted gas reservoirs [
10].
Solvents, solid sorbents, and membranes represent the three main types of CO
2 capture and separation materials available at present [
11]. The CO
2 capture mechanism is dependent on the chemistry of the capture materials. For example, among well-established technologies, the monoethanolamine (MEA) scrubbing approach is based on the reaction of CO
2 with amines to form carbamates or bicarbonates with water. Aqueous solutions of alkali metal salts, sterically hindered amines, amino acids, or ionic liquid, are other patented solvent-based technologies [
11]. Solid sorbents, such as alkali metal oxides, soda-lime, carbonates, zeolites, molecular sieve, silica gel, alumina, active carbon, amine solid sorbents, metal organic frameworks, are also all represented in the patented literature [
11]. In contrast, a smaller number of materials have been considered as CO
2 capture membranes, such as polyimides, zeolites, and fluoropolymers [
11].
Solid amine-based sorbents are being extensively investigated since they can combine the high selectivity and capture capacity of amines whilst overcoming the problems of corrosion, high regeneration energy, and environmental impact of liquid systems [
12]. Within this research effort, our group has focused its attention on the development of new materials made from the immobilization of amine compounds on different types of carbon nanomaterials. Building upon the work of Barron
et al., on the covalent functionalisation of nanocarbons with amines [
12,
13], we have developed fullerene-cross-linked polyethyleneimine (PEI)-based sorbents and characterized their CO
2 capture performance [
14,
15,
16,
17,
18]. In particular, PEI-C
60 achieved very high CO
2 capture selectivity and a maximum sorption capacity of 200 mg/g (mg CO
2/g sorbent) [
14]. We recently demonstrated that this high performance originates from a non-affinity hydrophobic-hydrophilic “repulsive” effect between C
60 and amino groups that forces them to be actively exposed to CO
2 [
18]. On the other hand, PEI-C
60 is a compact material and the CO
2 capture rate at room temperature is slow because of diffusion limitations, for this reason the best CO
2 performance is achieved at higher temperatures, e.g., 90 °C [
16]. In the attempt to overcome this limitation, we present herein the preparation and characterization of pentaethylenehexamine (PEHA)-C
60 sorbents with improved CO
2 capture performance at room temperature. We introduce PEHA-C
60 as a new temperature consistent CO
2 sorbent, since its CO
2 capture capacity is less affected (more consistent) by the temperature when compared to PEI-C
60, with corresponding reduced energy demand for CO
2 sorption/desorption process.
2. Results and Discussion
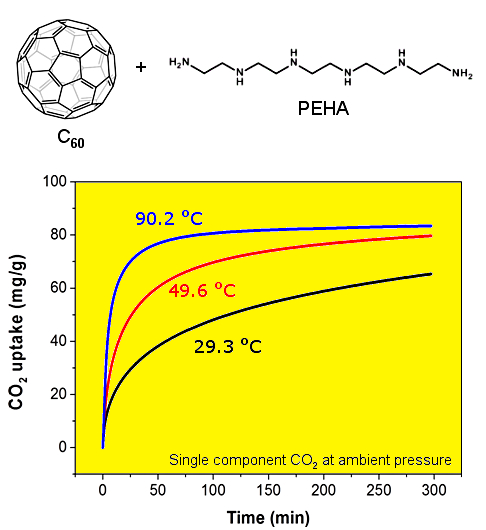
PEHA-C
60 was synthesized from the reactive dissolution of fullerene grains directly in pure amine in the absence of any solvent. In particular, C
60 was put to vigorously stir in plain PEHA for about 24 h at a temperature of 100–120 °C. A dark almost black liquid mixture was obtained. The PEHA-C
60 adduct was precipitated in toluene where the excess reactants were both soluble. The isolated dry product was a compact brown cake easily reduced to fine powder when rubbed between fingers. These product and synthetic procedure are notably different to those of PEI-C
60 [
14], since the thick molasses-like consistence of PEI requires the use of solvents to allow for an intimate dispersion and contact of fullerene and amine, and the resulting PEI-C
60 has a characteristic rubber consistence not evident in the case of PEHA-C
60.
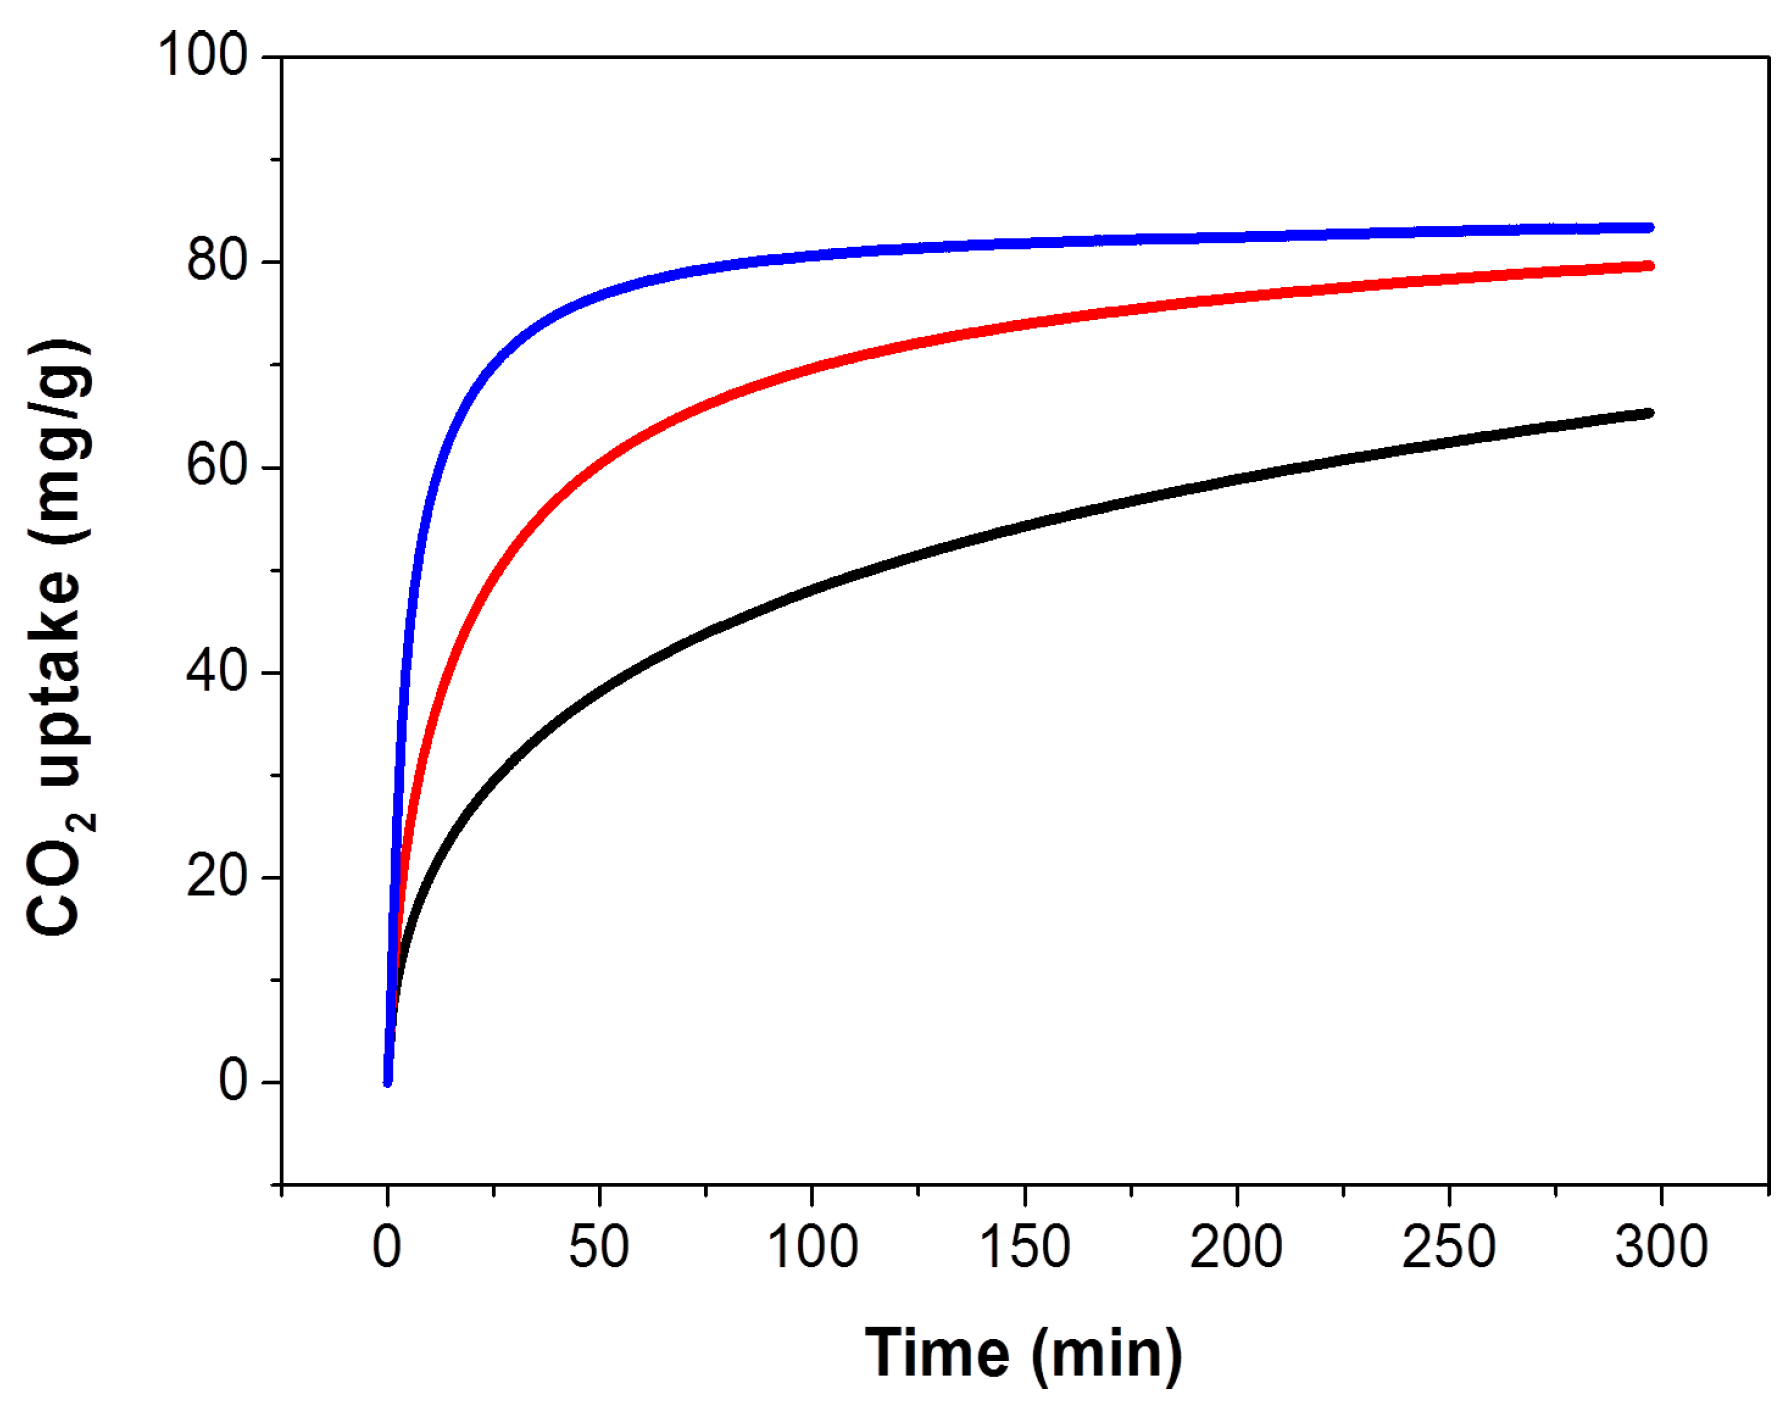
The CO
2 capture performance of the thus obtained PEHA-C
60 powder was characterized using a thermogravimetric analyser (TGA), the resulting CO
2 sorption curves are presented in
Figure 1. In all cases, the sorbent material was preconditioned in Ar at about 90 °C for 60 min prior to the exposure to CO
2. It is immediately evident that the rate of CO
2 sorption and the resulting CO
2 capture capacity after about 5-h exposure are higher at increased temperature. This type of temperature dependence is common in sorbent materials where the kinetics of sorption is limited by slow CO
2 mass transport in the bulk of the absorbent, as previously seen and discussed for PEI-C
60 [
14]. This result is somewhat surprising for PEHA-C
60 since linear PEHA is about one hundred times smaller than branched PEI (232.37 g/mol and 25,000 g/mol, respectively), and PEHA has only 2 ending primary amino groups per molecule compared to about 140 for PEI (assuming a primary:secondary:tertiary amino groups ratio of 1:2:1). It appears that two possible factors might be affecting the temperature dependence of CO
2 capture of polyaziridine materials like PEHA and PEI: (1) each terminal primary amino group of PEHA can react with a different C
60 molecule to form a bridge and then consequently a cross-linked network, as already found for PEI [
14], and (2) there might be an activation energy barrier to the successful sorption of CO
2, a barrier that is easier to overcome at higher temperature, although purely speculative since we provide no direct evidence for this consideration. In any case, a CO
2 sorption plateau is achieved only for the sorption at 90.2 °C in about 5 h (
Figure 1), at lower temperature more time is needed.
Figure 1.
CO2 uptake of PEHA-C60 in single component CO2 at atmospheric pressure and various temperatures: 29.3 °C (black curve), 49.6 °C (red curve), and 90.2 °C (blue curve).
Figure 1.
CO2 uptake of PEHA-C60 in single component CO2 at atmospheric pressure and various temperatures: 29.3 °C (black curve), 49.6 °C (red curve), and 90.2 °C (blue curve).
It is relevant to comment shortly on the prevalence of chemical/physical adsorption (surface sorption) and absorption (bulk sorption) of CO2 in PEHA-C60. It is reasonable to say that PEHA-C60 is both a surface and bulk CO2 chemical sorbent. This statement is based on the well-known chemistry of fullerene C60 and CO2 with amines. C60 can undergo multiple amine addition to its double bonds. It is then realistic that one C60 molecule reacts with more than one PEHA molecule, especially because in the present reaction conditions the C60:PEHA molar ratio is about 1:300 (0.05 g C60 in 4.75 g of PEHA). Covalently PEHA-decorated C60 molecules are then the molecular components of PEHA-C60. These components form a solid either through amine-amine hydrogen bonding, or through the cross-linking of C60 molecules each reacted with one of the terminal amino groups of PEHA. Based on this rationale, it is then reasonable to say that CO2 can be adsorbed on the surface of the material, but also absorbed in its bulk since amine functionalities are entertained inside the bulk of PEHA-C60. Additionally, CO2 reacts chemically with amines to form carbamate and bicarbonate species, so PEHA-C60 is certainly a chemical sorbent, as later elucidated in the infrared analysis of the sorbent materials conditioned in Ar and CO2.
The CO
2 sorption capacities of PEHA-C
60 are 65.3, 79.7, and 83.4 mg/g (corresponding to 1.48, 1.81, and 1.90 mmol/g) at 29.3, 49.6, and 90.2 °C, respectively. However, as just noticed, it is important to underline that these are kinetically limited CO
2 sorption capacities, meaning that equilibrium conditions are only attained at 90.2 °C within the timeframe of sorption, hence larger equilibrium capacities are expected for longer CO
2 exposure times. In comparison, PEI-C
60 can achieve a much higher CO
2 sorption capacity of 180 mg/g at 90.3 °C, but this high capacity rapidly plunges to just 40 and 10 mg/g at 49.8 and 29.5 °C, respectively [
16]. These drops are equivalent to CO
2 uptake performance losses of up to 95% when the sorption temperature is reduced from 90 °C to room temperature. This is clearly not the case for PEHA-C
60. In fact, PEHA-C
60 maintains more than 78% of its CO
2 capture performance in going from a sorption temperature of 90 to 30 °C. For this reason, C
60-PEHA has a temperature consistent carbon capture performance,
i.e., the CO
2 uptake is reliable over a wider range of temperatures opposite to what seen for PEI-C
60. PEHA-C
60 represents a good trade in CO
2 capture properties where in exchange of a decrease in sorption capacity one gets a more robust performance across a significant range of temperatures. Furthermore, the CO
2 uptake capacity of C
60-PEHA is in the range of PEHA-impregnated mesoporous silica sorbents such as MCM-41-PEHA-50 (50 wt% PEHA) with a capacity of 59 mg/g at 25 °C in modeled flue gas (20% CO
2 in N
2) [
19], and SBA-15-PEHA-50 (50 wt% PEHA) with a capacity of 104.4 mg/g at 25 °C in simulated flue gas (12% CO
2 in N
2) [
20] or of PEHA-impregnated metal-organic framework PEHA-MIL-101 with a capacity of 57.2 mg/g at about 25 °C in single component CO
2 at 10 bar [
21].
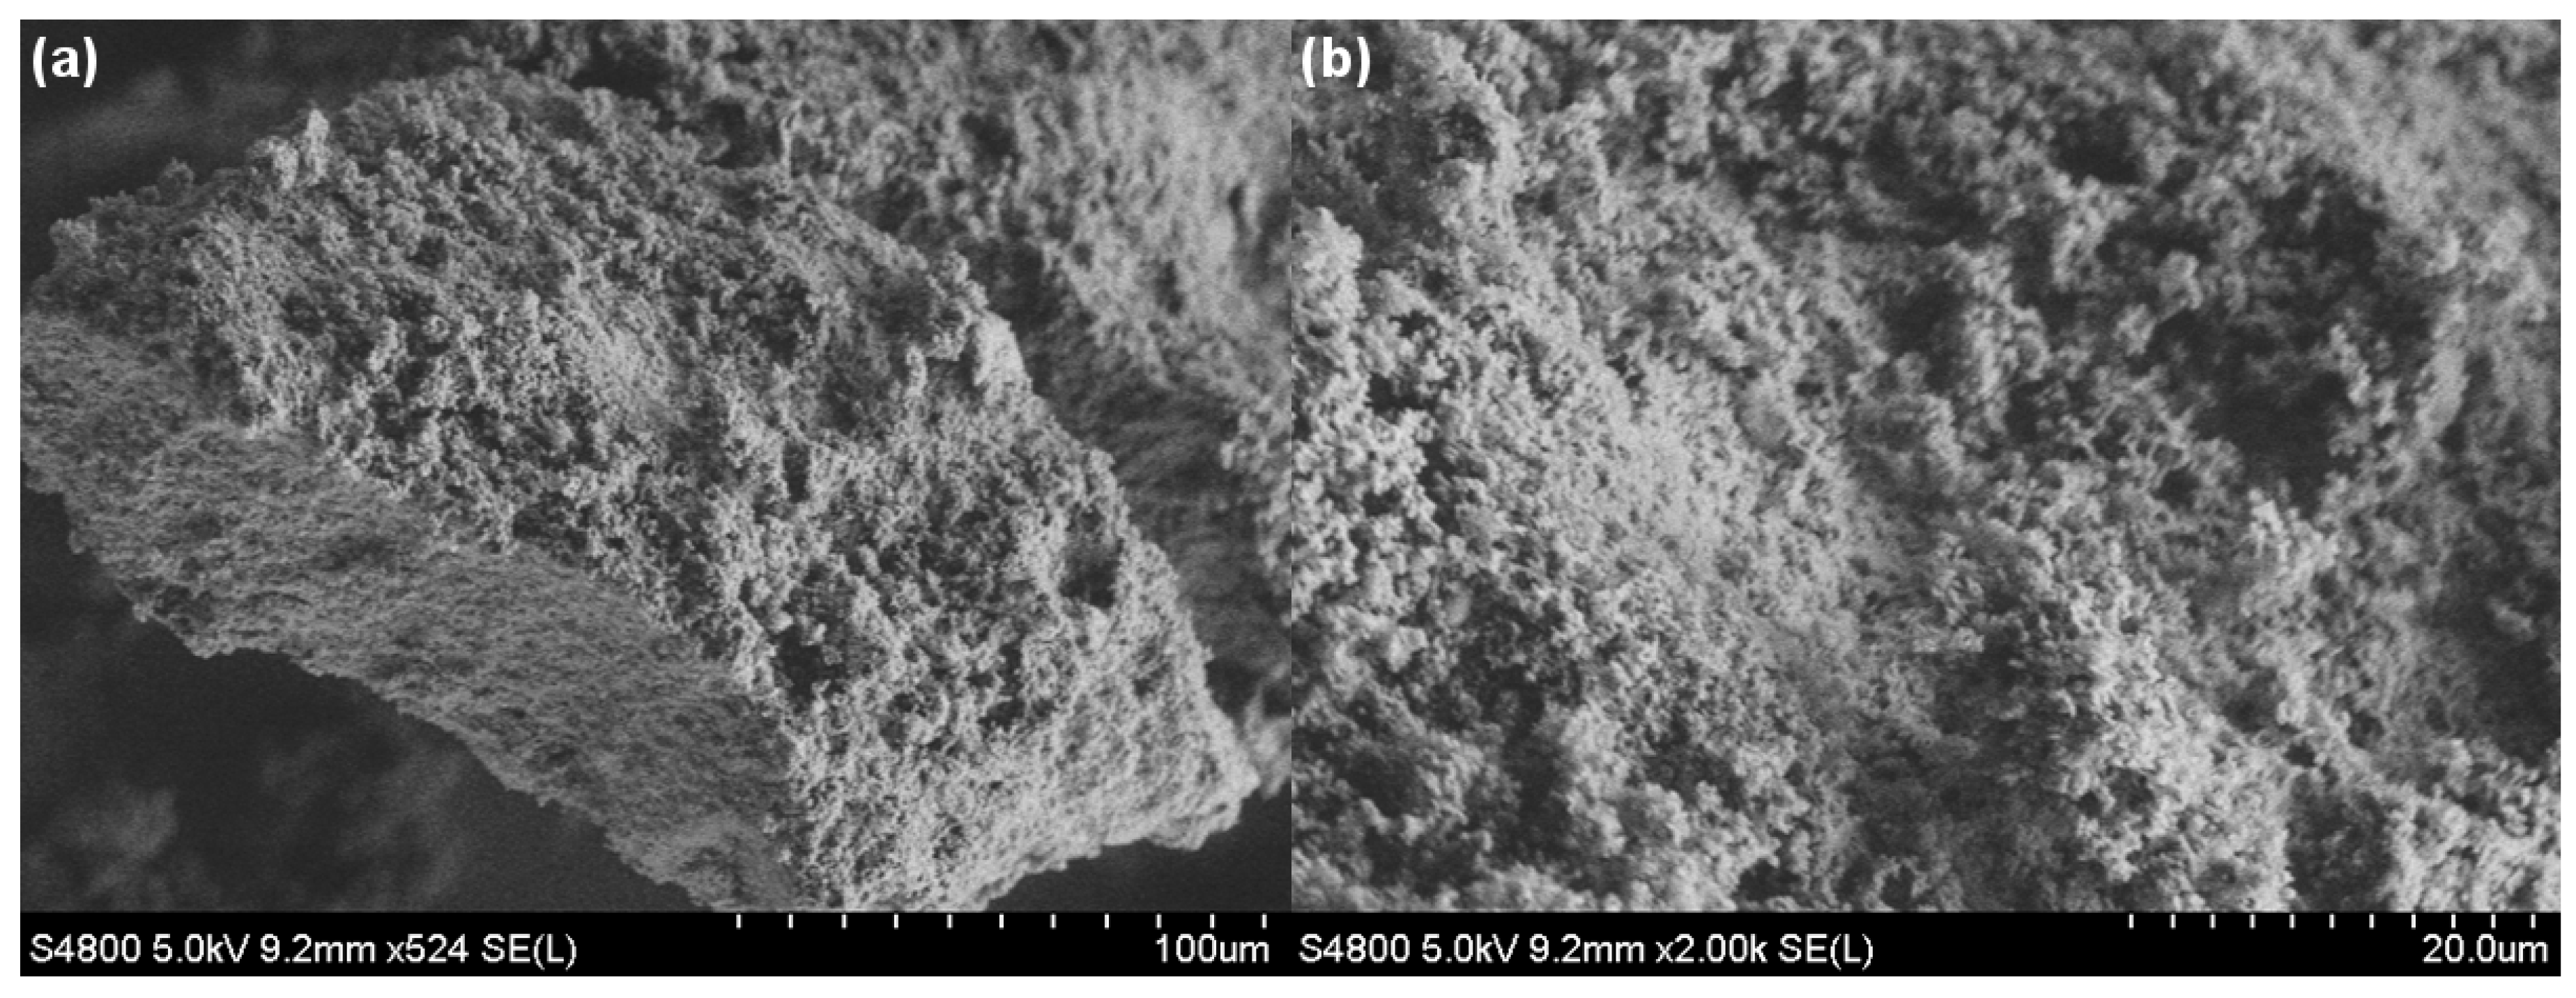
The scanning electron microscopy (SEM) images of PEHA-C
60 are given in
Figure 2. The sorbent material appears to be made of short fibrous particles gathered to form porous chunks. In comparison, PEI-C
60 consists of large coalesced lumps with a broad diameter distribution, some of them approximately 2 to 10 μm in size [
14]. Evidently, PEHA-C
60 consists of much smaller particles in agreement with the limited ability of small and linear PEHA to react with C
60 to generate fewer cross-linking points compared to the larger and much primary amine richer branched PEI. Hence, the particle size in PEHA-C
60 is smaller than in PEI-C
60, and consequently the void volume in PEHA-C
60 is greater than in PEI-C
60. The greater porosity and smaller particle size of PEHA-C
60 is reasonably one of the key reason of the better CO
2 capture performance of PEHA-C
60 at ambient temperature.
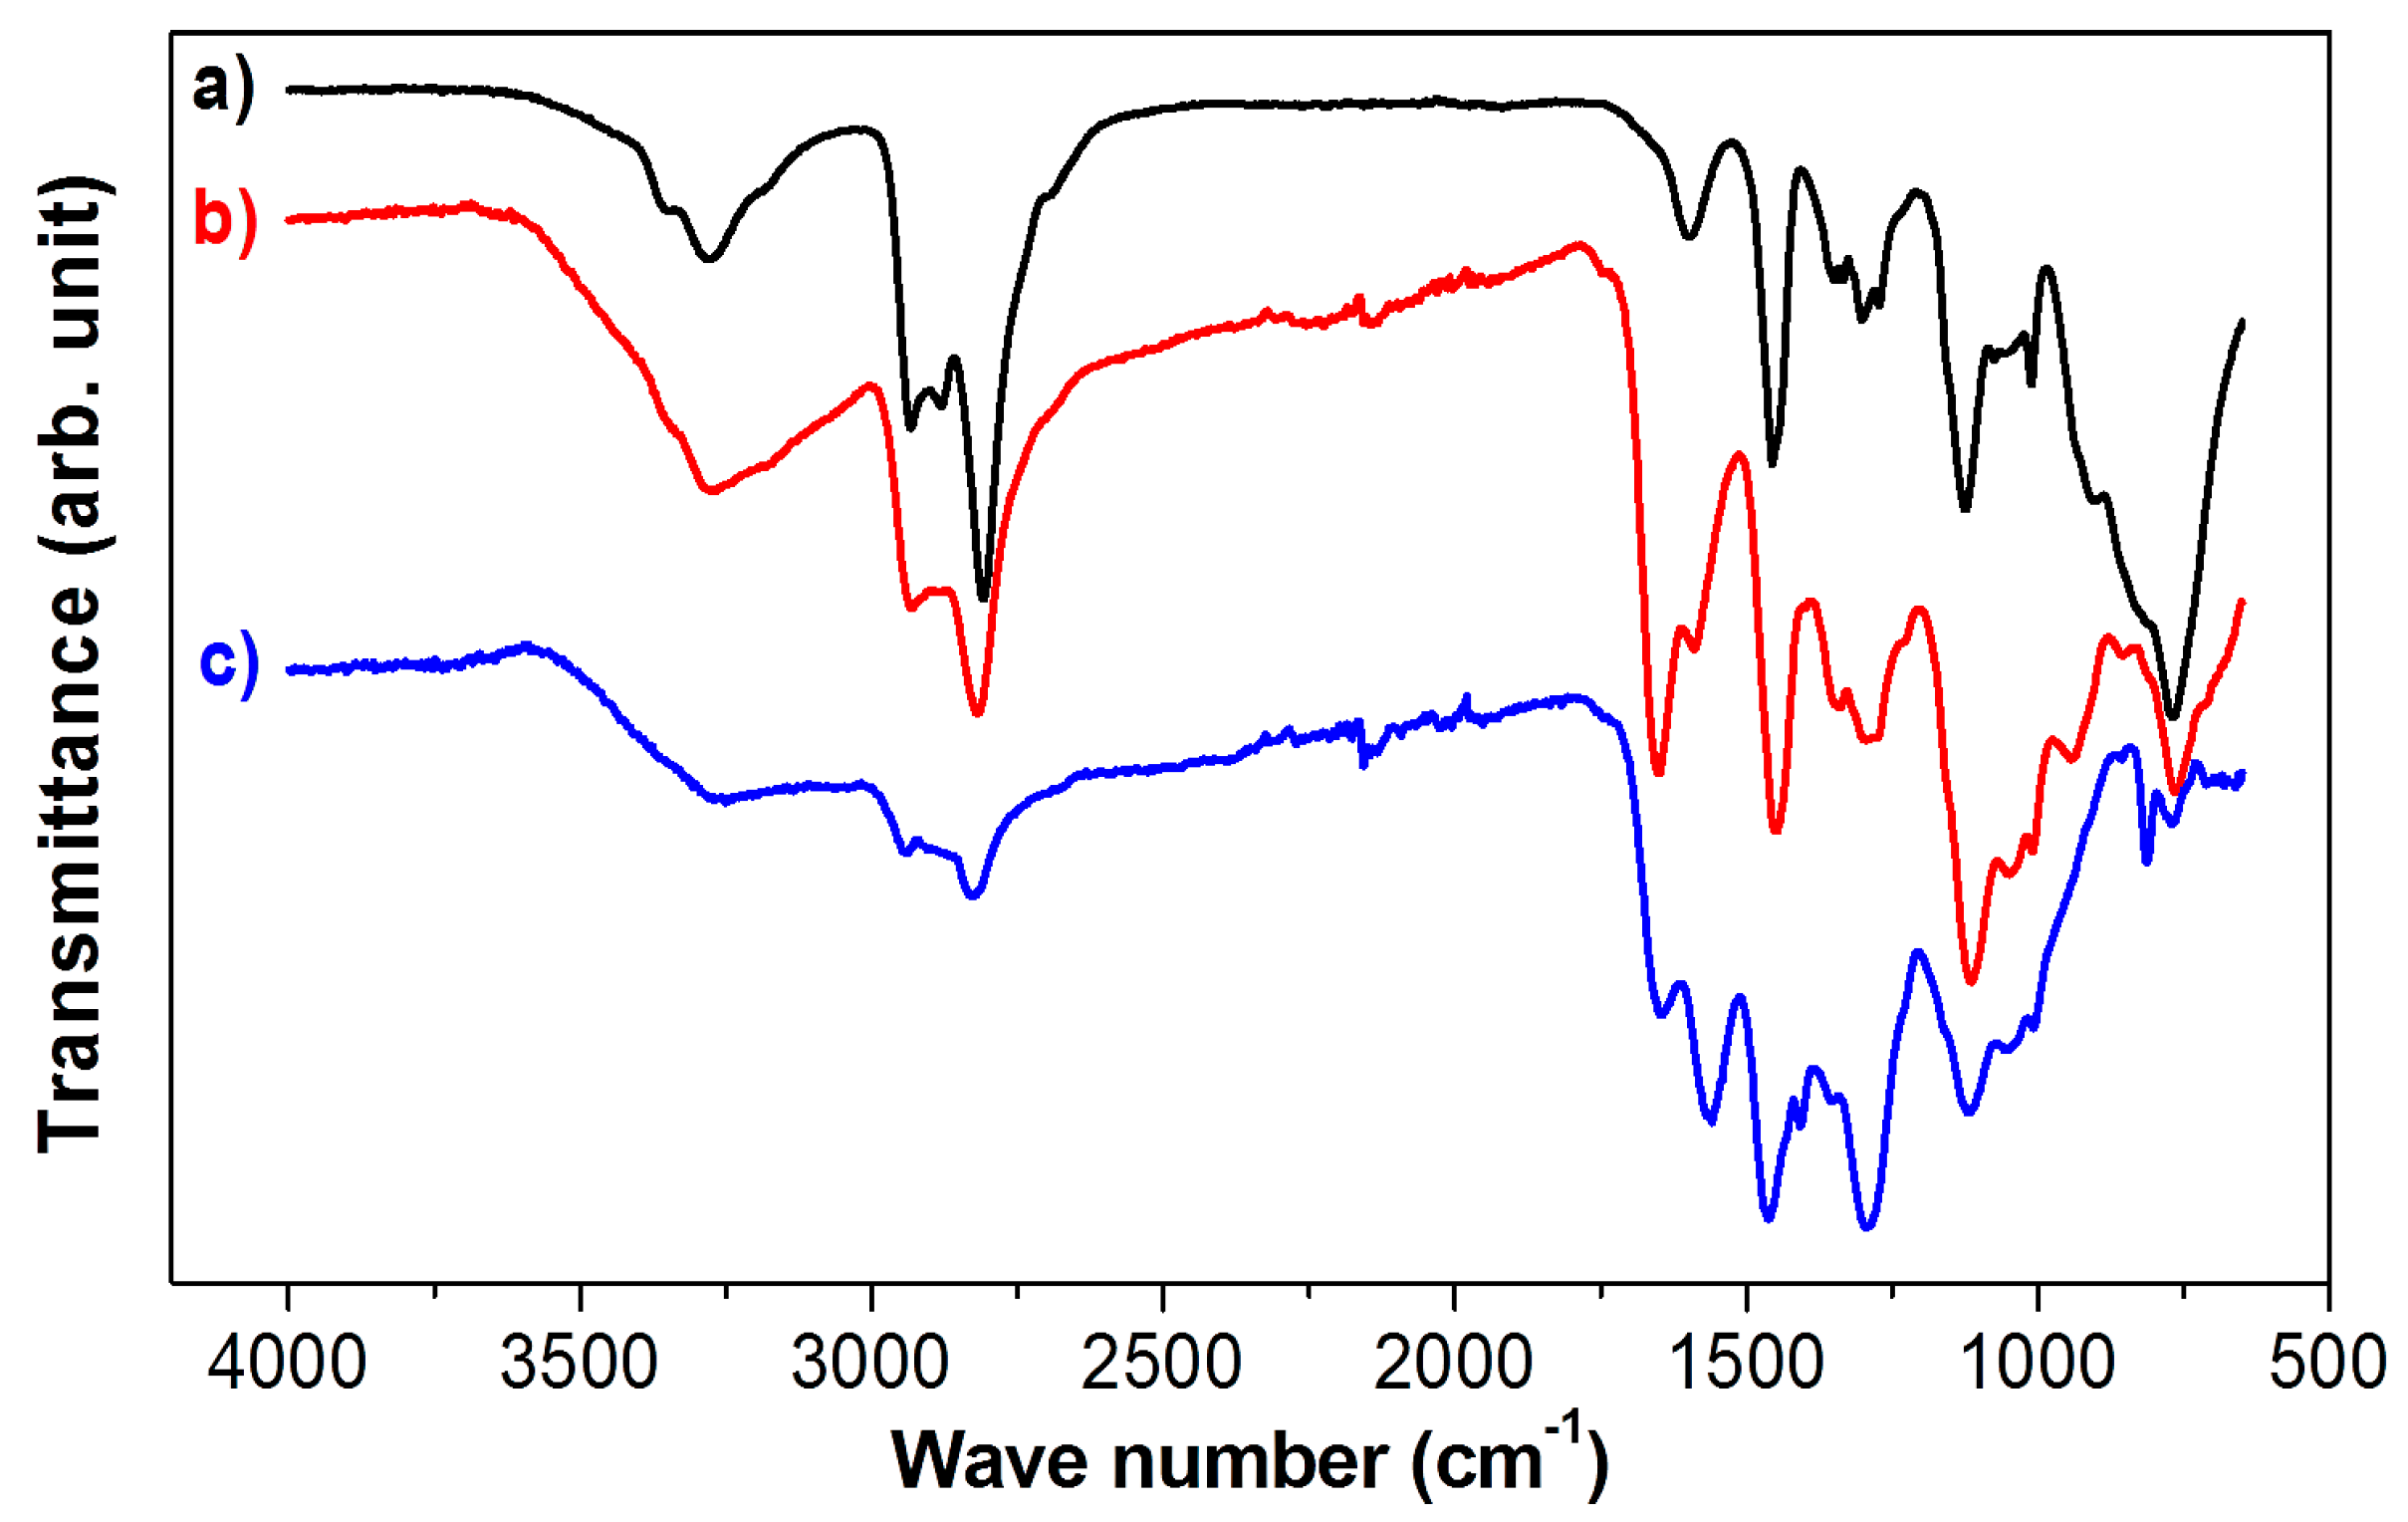
Fourier transform infrared spectroscopy (FTIR) was employed to identify the functional groups of PEHA-C
60, ensuring that C
60 was functionalized with the amine, and to establish the formation of carbamates and bicarbonates, groups related to the sorption of CO
2. The FTIR spectra of PEHA-C
60 conditioned in Ar and CO
2 are compared to the spectrum of as-received PEHA in
Figure 3. Preconditioning in Ar at 90 °C was carried out to remove unbounded H
2O and other adsorbed gases (including CO
2) that could be present in the material. PEHA-C
60 was analyzed immediately after Ar preconditioning, and also after additional CO
2 sorption at 90 °C for at least 1 h. A direct comparison of spectra (a) and (b) in
Figure 3, confirms the presence of the characteristic amine groups of PEHA in PEHA-C
60. In the fingerprint region, five bands can be assigned to the out of plane deformation of N-H at 764 cm
−1, C-N stretching at 1009 and 1114 cm
−1, C-H scissoring at 1449 cm
−1, and the in plane deformation of N-H responsible for the peak at 1589 cm
−1 [
22,
23]. At high wavenumber values, three distinctive bands are assigned to the C-H stretching of the methylene groups of PEHA at 2818 and 2931 cm
−1 (symmetric and asymmetric stretching, respectively), and to the N-H stretching at 3274 cm
−1 [
22,
23]. There is also one new peak at 1650 cm
−1 that could be related to N-H deformation. Tentatively, this might be related to changes in the IR activity of the amines functions of PEHA caused by the presence of C
60, similarly to what observed previously with polypropylenimine dendrimers [
18].
Figure 2.
SEM images of PEHA-C60 at different magnifications (a) ×524; and (b) ×2000 showing the porous morphology of the sorbent material.
Figure 2.
SEM images of PEHA-C60 at different magnifications (a) ×524; and (b) ×2000 showing the porous morphology of the sorbent material.
Figure 3.
IR spectra of (a) PEHA; and (b) PEHA-C60 conditioned in Ar; and of (c) PEHA-C60 conditioned in CO2. The spectra have been scaled for ease of comparison.
Figure 3.
IR spectra of (a) PEHA; and (b) PEHA-C60 conditioned in Ar; and of (c) PEHA-C60 conditioned in CO2. The spectra have been scaled for ease of comparison.
PEHA-C
60 was also conditioned in CO
2 and the corresponding FTIR spectrum (c) is given in
Figure 3. Upon CO
2 sorption, no notable changes were recorded in the high frequency section of the spectrum. On the other hand, new peaks appeared in the fingerprint region. The peak at 1559 cm
−1 might be associated to the asymmetric stretch of the carboxylic portion of carbamate, although it could be also related to ammonium carbonate species [
24]. The peak at 1293 cm
−1 could be due to the formation of bicarbonate or to the symmetric stretching of carbamate [
24]. Ammonium carbamate, bicarbonate and carbonate species have often overlapping vibrational bands [
24]. For this reason, PEHA-C
60 can capture CO
2 with the likely formation of two main chemical species (1) ammonium carbamates (-NH-COO
− +H
2N<) which are formed when pure CO
2 is absorbed, like in the present case; and (2) ammonium bicarbonates (>NH
2+ −HCO
3), which are formed in the presence of water, in this case there could be some residual water molecules bounded to PEHA-C
60 that cannot be removed during Ar condition [
14,
18].
The kinetics of CO
2 capture of PEHA-C
60 is also presented. The kinetic analyses were performed using previously reported models and selection criteria [
16]. It is found that among the different kinetic models the CO
2 capture data of PEHA-C
60 are better described by three models: pseudo-1st-order, pseudo-2nd-order, and modified Avrami. A detailed description of these three kinetic models, with their respective meaning, is reported elsewhere [
16]. Shortly, the pseudo-1st-order and pseudo-2nd-order models are referred as “pseudo” because the driving force of reaction is expressed in terms of sorption capacity of the solid, herein represented with
w∞ (
Table 1), instead of the concentration of the species (CO
2 and amine). The difference between pseudo-1st-order and pseudo-2nd-order is that the time needed to reach half of the maximum absorption,
τ for which
w(
τ) =
w∞/2, is
τ = 0.693/
k1 for a pseudo-1st-order kinetics and
τ = 1/(
k2w∞) for the pseudo-2nd-order model. This means that the time required for the reaction to proceed is dependent on sorption capacity
w∞, only in the pseudo-2nd-order model. This implies that only sorbents with pseudo-2nd-order kinetics have faster CO
2 sorption rates (shorter
τ) at improved CO
2 capture capacity (higher
w∞). Hence, a pseudo-2nd-order could be associated to a more effective CO
2 sorbent material. With regard to the modified Avrami model, we found in our previous work that the introduction of the factor
mtm−1 (
Table 1) might allow correcting for mass transport limitation due to the diffusion of CO
2 in the bulk of the sorbent [
16].
Table 1.
Kinetics fitting results of CO2 sorption of PEHA-C60.
Table 1.
Kinetics fitting results of CO2 sorption of PEHA-C60.
| Kinetic Models * | Parameters | Temperature of CO2 Capture |
|---|
| 29.3 °C | 49.6 °C | 90.2 °C |
|---|
| Pseudo-1st-order | k1 | 0.01868 | 0.03755 | 0.10578 |
| w∞ | 0.06080 | 0.07541 | 0.08123 |
| R2 | 0.921 | 0.915 | 0.921 |
| Pseudo-2nd-order | k2 | 0.32882 | 0.70773 | 2.33693 |
| w∞ | 0.07149 | 0.08280 | 0.08466 |
| R2 | 0.971 | 0.990 | 0.999 |
| Modified Avrami | ka | 0.00571 | 0.03400 | 0.11425 |
| w∞ | 0.08994 | 0.08131 | 0.08257 |
| m | 0.47768 | 0.55216 | 0.58556 |
| R2 | 1.000 | 0.999 | 0.990 |
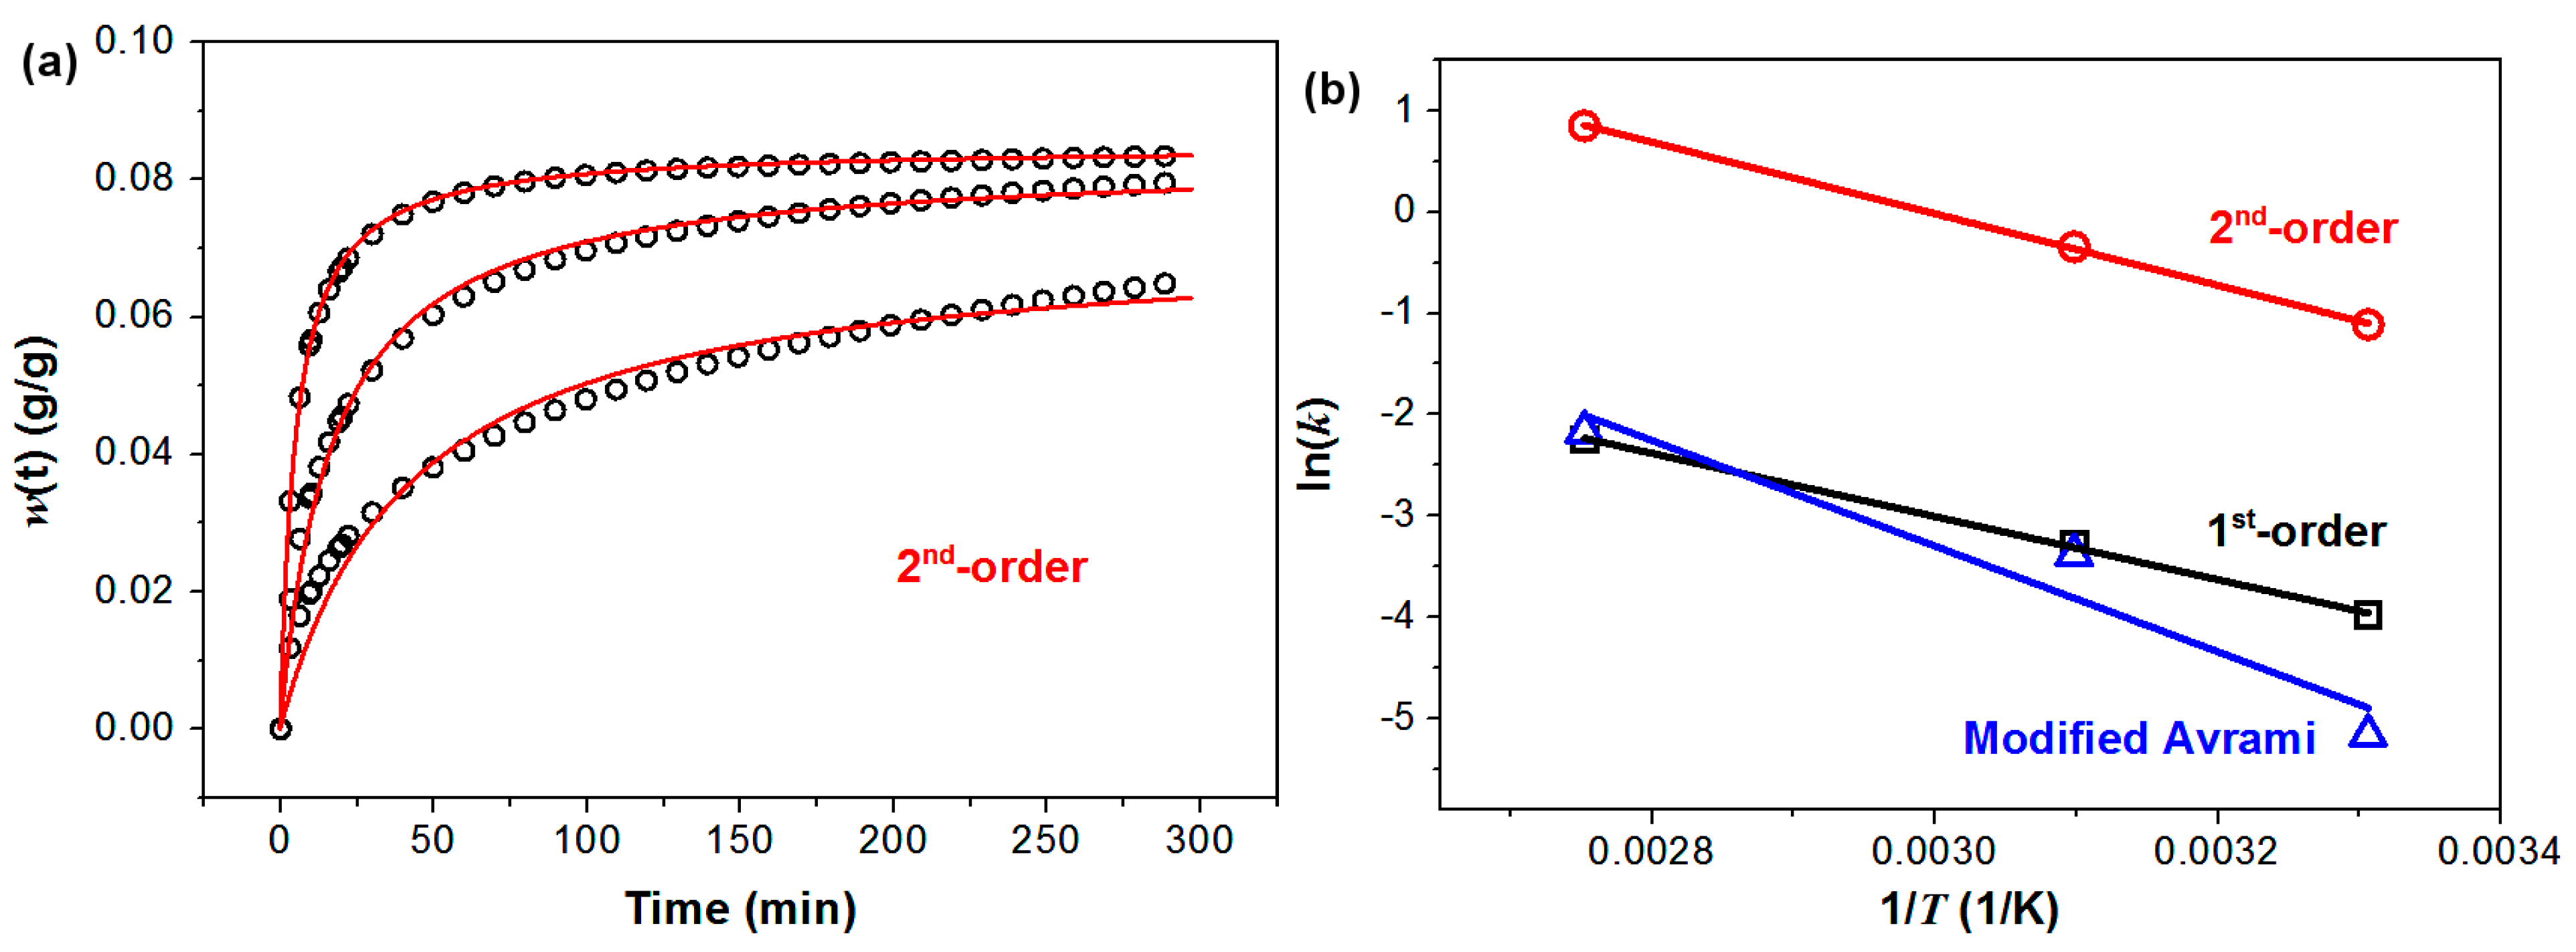
Among the three models, the best overall fittings were obtained using the pseudo-2nd-order kinetic model, as summarized in
Table 1 and
Figure 4. The pseudo-2nd-order model gives the best combination in terms of coefficient of correlation (R
2) for the fittings of the CO
2 sorption data (
Table 1) and the corresponding Arrhenius plot (
Figure 4). According to the description of the pseudo-2nd-order model given before, it appears that C
60 can convert PEHA in an improved CO
2 sorbent because of the hydrophobic-hydrophilic incompatibility of the two molecules, an effect that we have previously observed and described [
17].
Figure 4.
Kinetics of CO2 capture of PEHA-C60. (a) CO2 capture data (open black circles) and corresponding pseudo-2nd-order fitting curves (red line); (b) Arrhenius plots for the temperature dependence of the kinetic constants obtained from the fitting of the CO2 capture data using models pseudo-1st-order (in black, R2 = 0.999), pseudo-2nd-order (in red, R2 = 1.000), and modified Avrami (in blue, 0.937).
The activation energy of CO
2 sorption of PEHA-C
60 can be calculated from the slope of the Arrhenius plot (ln(
k) = −
Ea/
R × 1/
T + ln(
A)) to give
Ea = 29.3 kJ/mol. This value of activation energy is higher than those previously reported for PEI-modified single-walled carbon nanotubes (13.3 kJ/mol) and graphite oxide (22.6 kJ/mol) [
16]. It appears then that the energy barrier for CO
2 sorption is dependent on both the carbon substrate and type of amine. In fact, we previously showed that using nanocarbons of higher curvature should lower the energy barrier of CO
2 capture, but this observation does not hold between different amines since the activation energy of the curved PEHA-modified C
60 is higher than that of the flatter PEI-modified graphite oxide.
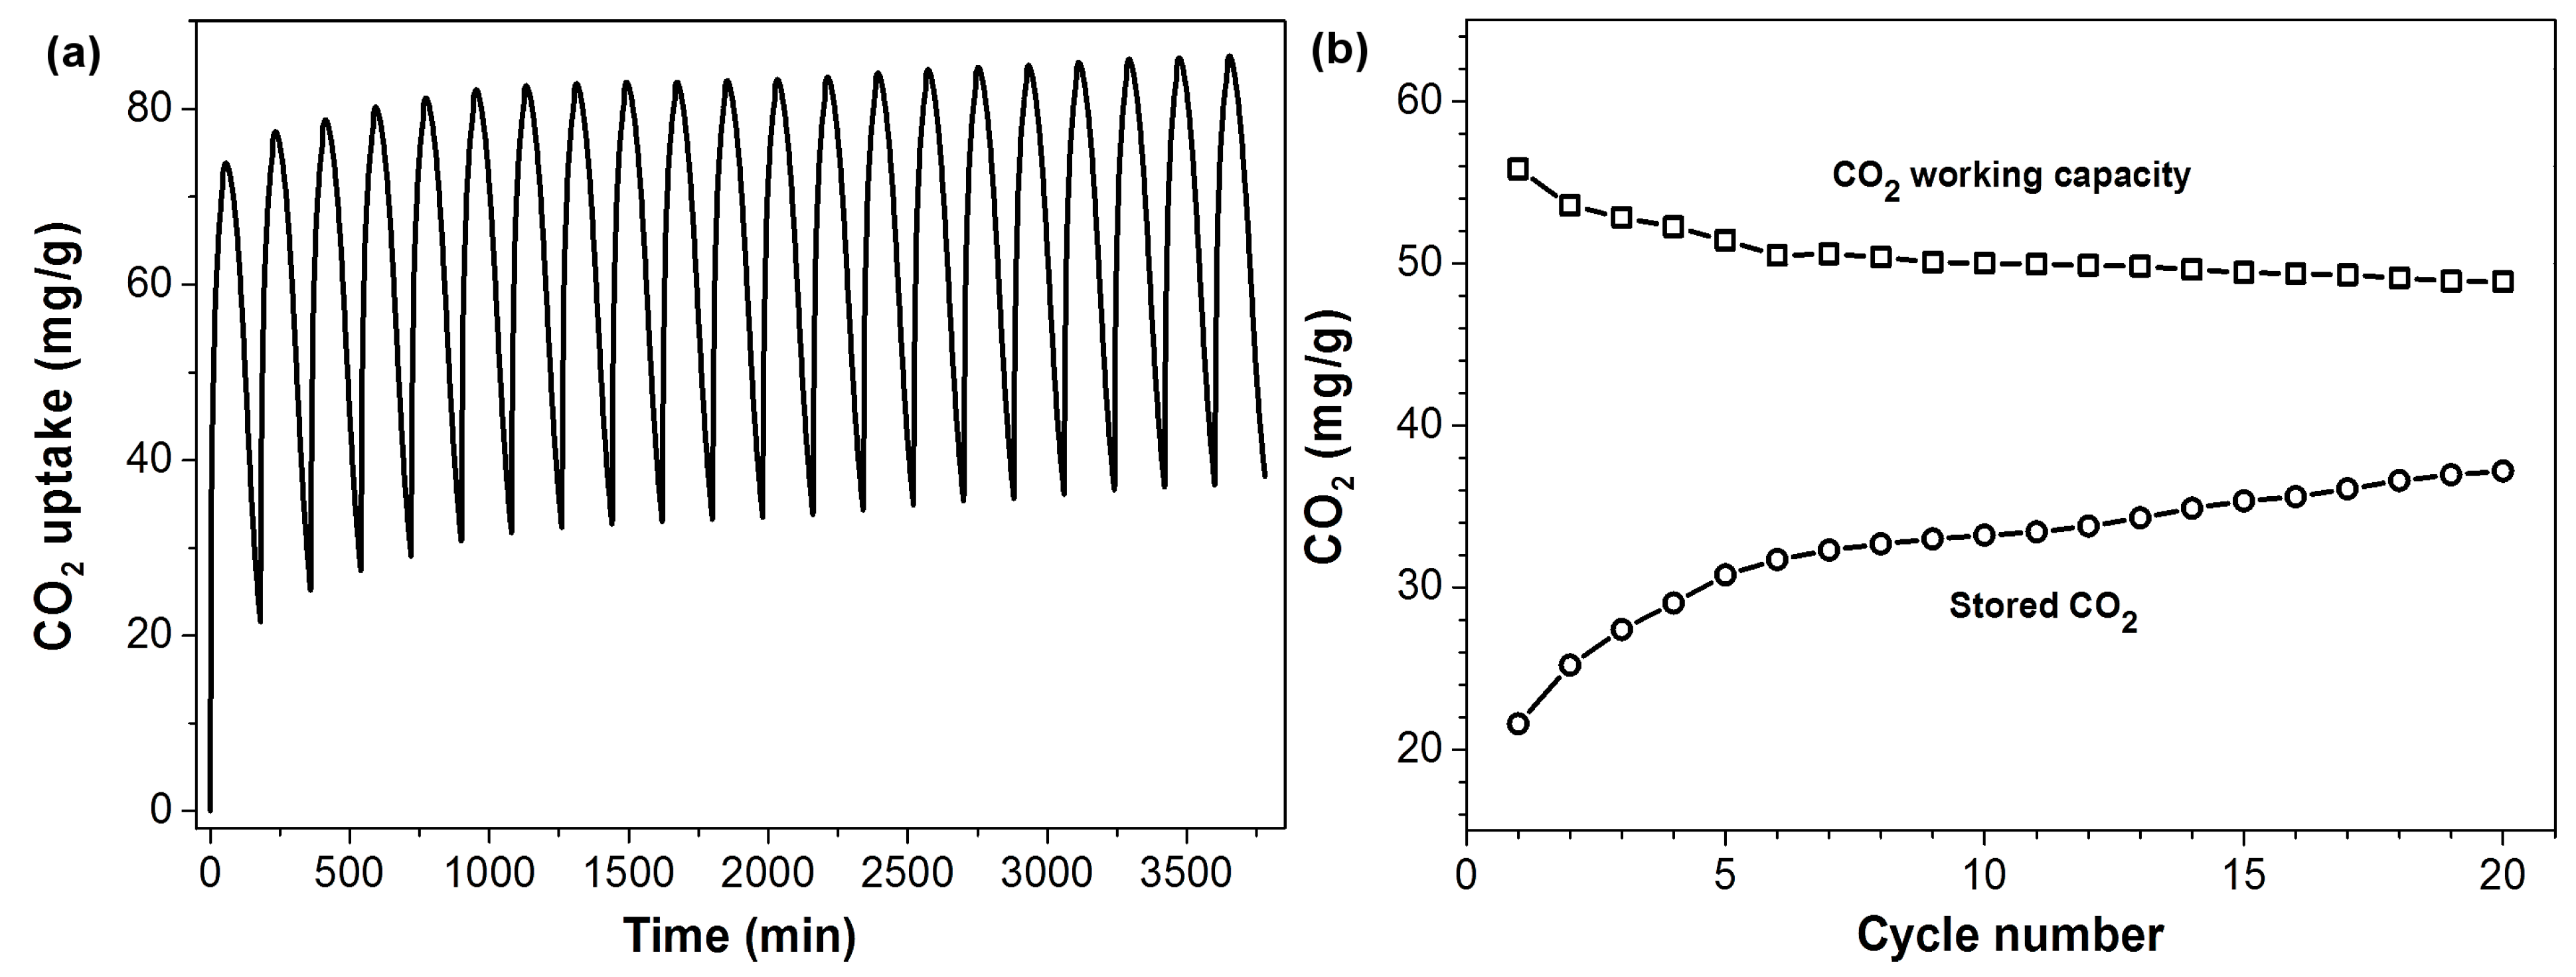
The CO
2 sorption/desorption cycling performance of PEHA-C
60 is shown in
Figure 5. PEHA-C
60 was first conditioned in Ar at 90 °C for 1 h, the temperature was then decreased to 50 °C and the material cycled in CO
2 (for 45 min) and Ar (for 135 min) for twenty times at constant temperature. The resulting CO
2 working capacity decreases slightly after each cycle going from 55 to 50 mg/g (1.25 and 1.13 mmol/g, respectively). This decrease in sorption capacity is not caused by a deterioration of the CO
2 capture performance of the material, but to a progressive increase of the residual amount of CO
2 stored in the sorbent after each cycle, as shown in
Figure 5b. PEHA-C
60 is then affected by a slow CO
2 desorption rate, however this limitation can be easily overcome at higher desorption temperatures.
Figure 5.
CO2 sorption/desorption cycles of PEHA-C60. (a) CO2 capture and release cycles in single component CO2 and Ar, respectively, at 50 °C and ambient pressure; (b) CO2 working capacity and amount of stored CO2 for each cycle.
Figure 5.
CO2 sorption/desorption cycles of PEHA-C60. (a) CO2 capture and release cycles in single component CO2 and Ar, respectively, at 50 °C and ambient pressure; (b) CO2 working capacity and amount of stored CO2 for each cycle.


