Article

LINC00261 and the Adjacent Gene FOXA2 Are Epithelial Markers and Are Suppressed during Lung Cancer Tumorigenesis and Progression

1
Division of Cancer Research, Department of Thoracic Surgery, Medical Center—University of Freiburg, Faculty of Medicine, University of Freiburg, 79106 Freiburg, Germany
2
German Cancer Consortium (DKTK), Partner Site Freiburg, 79106 Freiburg, Germany
3
Division of RNA Biology & Cancer, German Cancer Research Center (DKFZ), 69120 Heidelberg, Germany
4
CellNetworks Excellence Cluster, University of Heidelberg, 69120 Heidelberg, Germany
*
Author to whom correspondence should be addressed.
Non-Coding RNA 2019, 5(1), 2; https://doi.org/10.3390/ncrna5010002
Submission received: 20 November 2018 / Revised: 16 December 2018 / Accepted: 17 December 2018 / Published: 28 December 2018
(This article belongs to the Special Issue Non-Coding RNA and Cell Migration)

Abstract

:
Lung cancer continues to be the leading cause of cancer-related deaths worldwide, with little improvement in patient survival rates in the past decade. Long non-coding RNAs (lncRNAs) are gaining importance as possible biomarkers with prognostic potential. By large-scale data mining, we identified LINC00261 as a lncRNA which was significantly downregulated in lung cancer. Low expression of LINC00261 was associated with recurrence and poor patient survival in lung adenocarcinoma. Moreover, the gene pair of LINC00261 and its neighbor FOXA2 were significantly co-regulated. LINC00261 as well as FOXA2 negatively correlated with markers for epithelial-to-mesenchymal transition (EMT) and were suppressed by the EMT inducer TGFβ. Hierarchical clustering of gene expression data from lung cancer cell lines could further verify the association of high LINC00261/FOXA2 expression to an epithelial gene signature. Furthermore, higher expression of the LINC00261/FOXA2 locus was associated with lung cancer cell lines with lower migratory capacity. All these data establish LINC00261 and FOXA2 as an epithelial-specific marker pair, downregulated during EMT and lung cancer progression, and associated with lower cell migration potential in lung cancer cells.

1. Introduction

Cancer is a multigenic disease and unifying principles governing the molecular mechanisms of cancer progression and metastasis are yet to be defined [1]. Large-scale gene expression profiling studies have established the molecular heterogeneity of tumors and there is a constant search for novel biomarkers with predictive value in early diagnosis, prognosis, and prediction of recurrence or progression [2,3,4,5]. The non-coding transcriptome is emerging as a major source for candidates in this direction [6]. Several non-coding RNAs (ncRNAs) including microRNAs (miRNAs) and long non-coding RNAs (lncRNAs) have been reported as predictive markers for tumorigenesis and tumor progression in diverse malignancies [7,8,9].
Metastasis, a process by which tumor cells spread from their primary site to distant locations in the body, is a characterizing feature of aggressive tumors and constitutes the major reason for cancer-related fatalities [10]. The role of cell migration and epithelial-to-mesenchymal transition (EMT) in metastatic progression is now well established [11]. An epithelial tumor needs to trans-differentiate into a mesenchymal-like phenotype to actively degrade the extra-cellular matrix and translocate through the tissue and blood stream. A reversal of this process of EMT, referred to as MET, could then be important for tumor formation at distant sites [12]. Thus, a coherent set of spatial and temporal events are required for the establishment of metastatic lesions. In addition to protein-coding genes constituting transcription factors and epigenetic regulators, miRNAs, and lncRNAs contribute to this process [13,14].
Lung cancer is the most common form of cancer world-wide. While there has been a steady increase in survival for most cancers, the five-year survival for lung cancer is currently only 18% [15]. As the name suggests, the lncRNA metastasis associated in lung adenocarcinoma transcript 1 (MALAT1), one of the earliest lncRNA linked to cancer, is a biomarker for metastasis in lung cancer [16]; MALAT1 is not only a marker, but also an essential factor and potential therapeutic target in lung cancer metastasis [8]. Here, we utilized a similar approach to analyze the non-coding transcriptome of lung adenocarcinoma (LUAD) and lung squamous cell carcinoma (LUSC) tumor samples for genes associated with progression and identified LINC00261 and its neighboring gene FOXA2 as probable tumor suppressors with strong association to non-migrating epithelial cells.

2. Results

2.1. Low Expression of LINC00261 Correlates with Metastatic Progression and Predicts Poor Survival in LUAD

In search of lncRNAs relevant to lung cancer progression and metastasis, we performed large-scale data mining of the RNA-Seq data from primary LUAD obtained from The Cancer Genome Atlas (TCGA, Bethesda, MD, USA) via the TANRIC database [17]. For an in-depth analysis, the patient details available at the TCGA data portal were filtered on the basis of the clinical outcome of disease: patients were selected that either developed a metastasis or recurrence within the first 24 months after R0 surgery or that were disease-free for at least 24 months after surgery. Ninety-eight of the 488 RNA-Seq samples could be matched with these clinical evaluation parameters to be classified as disease-free post-surgical intervention or recurring/progressing to metastasis (Table 1).
The RNA-Seq data from these two cohorts possessed comparable patient parameters except for the clinical outcome in cancer progression and were compared to identify novel prognostic markers for lung cancer progression. A high E-cadherin (CDH1)/N-cadherin (CDH2) ratio is considered as an epithelial signature which would suggest low metastatic potential. As expected, the disease-free group displayed higher CDH1/CDH2 ratios, even though the values were not statistically significant (Figure 1A). In contrast, the lncRNA LINC00261 emerged as a novel candidate which showed significant downregulation in primary LUAD tumors which recurred or gave rise to metastatic lesions at distant sites (Figure 1B). Consistently, low expression of LINC00261 was significantly associated with poor patient survival in LUAD (Figure 1C). We analyzed whether an EMT-related signature with prognostic value could be developed by combined monitoring of LINC00261 and CDH1 expression. However, low CDH1/LINC00261 expression signature did not reveal significant association with patient survival (Figure 1D).

2.2. LINC00261 Expression is Downregulated in Lung Cancer

To establish whether the expression of LINC00261 was generally decreased between normal tissues and primary lung tumor samples, we employed two independent LUAD cohorts with publicly available gene expression data obtained by two independent, but complementary methods: RNA-Seq data from TCGA (“TCGA”) or microarray data from an independent cohort (“Korea”) [18]. Interestingly, we observed a strong and significant suppression of LINC00261 in both LUAD cohorts compared to the respective normal tissue controls (Figure 2A,B). The same was observed for lung squamous cell carcinoma in the TCGA LUSC cohort (Figure 2C). This was suggestive of a general tumor suppressor function for this lncRNA in lung cancer.

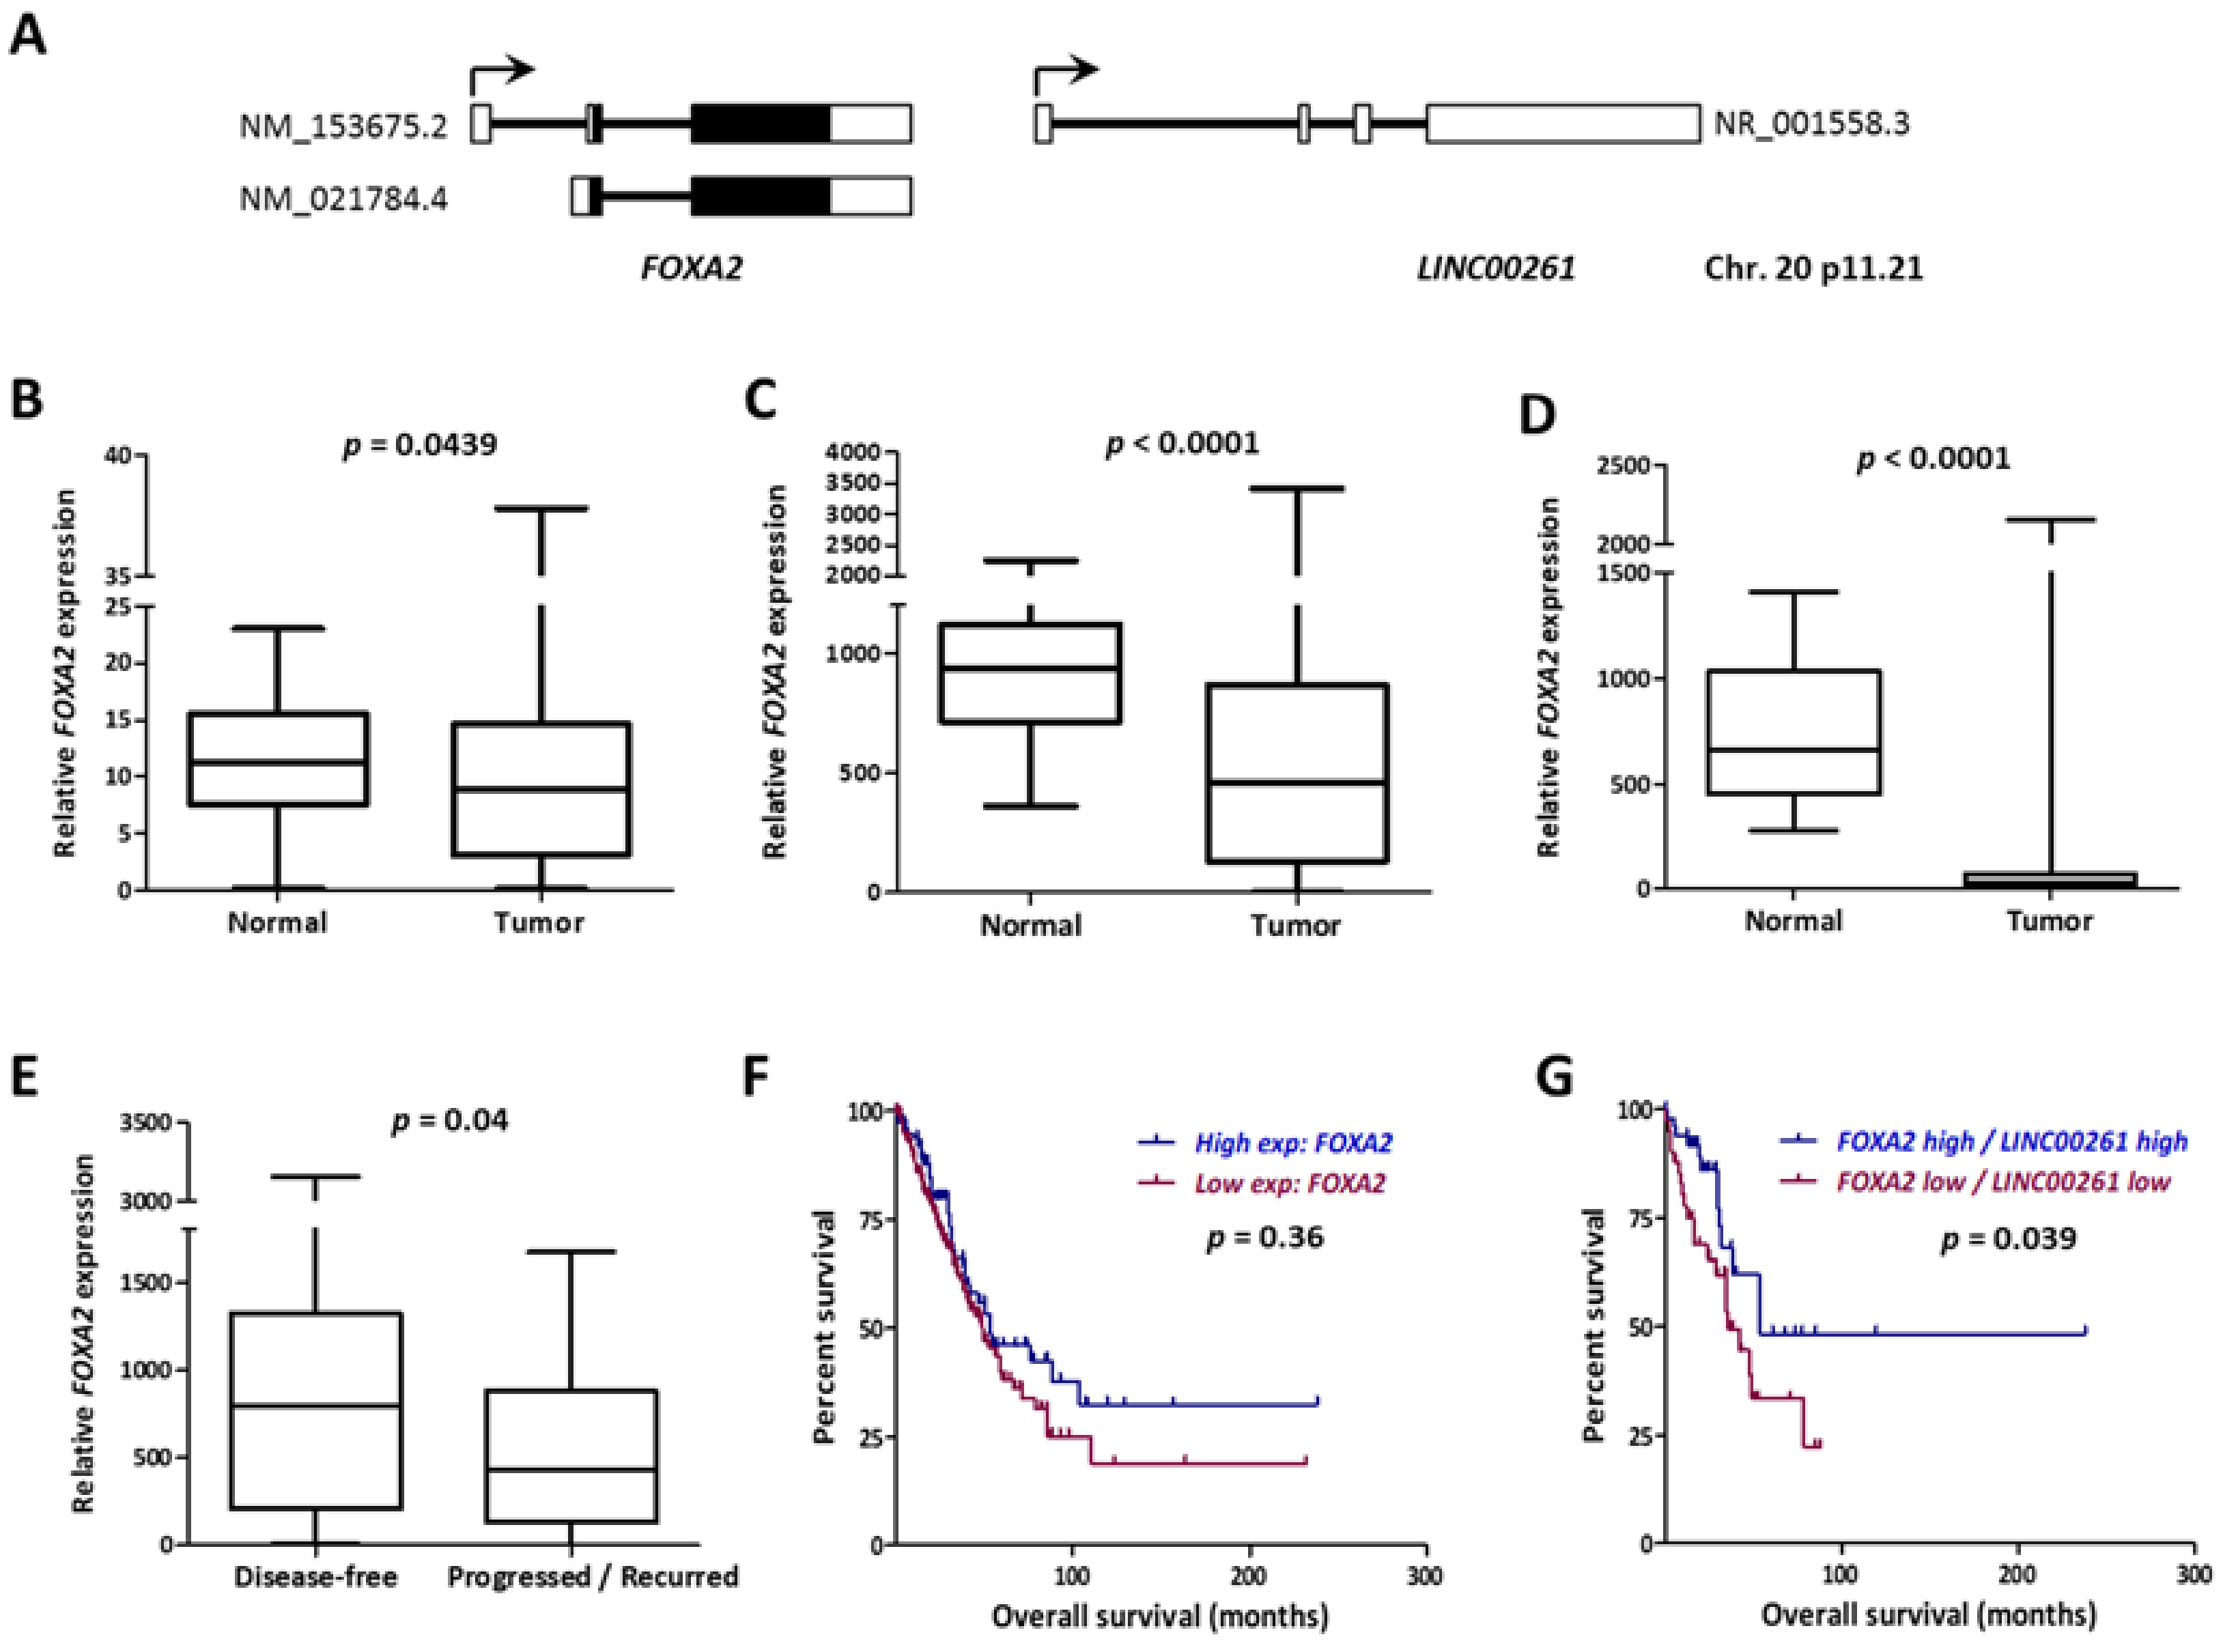
2.3. LINC00261 Expression Strongly Correlates with the Neighboring FOXA2 Gene

The LINC00261 gene and its genomic context are highly conserved in human and mouse genomes and it is placed closely downstream to the FOXA2 gene in sense direction (Figure 3A). FOXA2 is an established negative regulator of metastasis [19]. Notably, we found FOXA2 also significantly downregulated in LUAD and LUSC tumors in all three cohorts (Figure 3B–D). More importantly, similar to LINC00261, low expression of FOXA2 was also indicative of higher recurrence in LUAD (Figure 3E). When the lncRNA and messenger RNA (mRNA) data from LUAD were merged and compared, FOXA2 showed the strongest correlation with LINC00261 expression in both normal and tumor samples independently in the LUAD and the LUSC datasets (Figure S1). Since low LINC00261 expression was associated with poor patient survival in LUAD, we analyzed whether the same was true for FOXA2. Even though Kaplan–Meier survival analysis did not reveal significant differences in survival between FOXA2 low- and high-expression groups, a low FOXA2/LINC00261 co-expression signature was strongly associated with poor patient survival (Figure 3F,G).

2.4. LINC00261/FOXA2 Expression is Indicative of an Epithelial Gene Signature in Lung Cancer and is Suppressed in TGFβ-Induced EMT

To understand the contribution of LINC00261 towards cancer progression and metastasis, we monitored the correlation of LINC00261 expression with that of TGFβ1 and the epithelial marker CDH1. In the non-cancerous control samples with high LINC00261 expression, we observed a strong negative and positive correlation with TGFβ1 and CDH1 expression, respectively (Figure 4A,B). A negative association with the EMT-inducer TGFβ1 and the strong positive correlation with CDH1 was indicative of epithelial-specific expression of LINC00261. To verify this hypothesis, we treated two lung cancer cell lines, which displayed high endogenous LINC00261 expression, with TGFβ1 to induce EMT and quantified LINC00261 expression. In both cell lines, there was a strong TGFβ-dependent suppression of LINC00261 expression, establishing that LINC00261 was an epithelial marker (Figure 4C). Consistent with the co-expression of LINC00261/FOXA2 in lung cancer samples, TGFβ1 also induced a significant suppression of FOXA2 (Figure 4D). To monitor whether this association of the LINC00261/FOXA2 locus with epithelial cells and epithelial markers was a broadly conserved process in lung cancer, we further employed a sophisticated bioinformatic analysis. A recent study identified a 76-gene EMT signature to categorize NSCLC cell lines into epithelial and mesenchymal subgroups [20]. We utilized this gene signature and performed hierarchical clustering analysis with a large-scale lung cancer cell line gene expression dataset from the Cancer Cell Line Encyclopedia (CCLE) [21] revealing two distinct clusters (Figure S2), which showed a strong intra-group correlation. Analysis of EMT markers CDH1 and VIM in the clusters could conclusively verify the identity of cluster 1 as mesenchymal and cluster 2 as epithelial (Figure S3). When LINC00261 and FOXA2 expression was monitored in these two clusters, a significant upregulation of these genes was observed in the epithelial cluster (Figure 4E,F), once again verifying the association of the LINC00261/FOXA2 locus with epithelial cell lineages.

2.5. LINC00261 Expression Negatively Correlates with Migration Capacity in Lung Cancer Cell Lines

The comparative analysis of tumor samples clearly established LINC00261 as a biomarker with consistent reduction in tumors with propensity to progress towards metastasis. In addition, clustering analysis and the downregulation during TGFβ1-induced EMT defined an association with non-mesenchymal cells. Hence, we explored whether LINC00261 could be associated with cell migration which is linked to lung cancer progression. We employed our data for a panel of lung cancer cell lines which were analyzed for their capacity to migrate on a cell culture-treated surfaces or surfaces coated with the extracellular matrix proteins collagen or fibronectin [22]. After classifying the cell lines into distinct sets of fast and slow migrating cell lines (Figure 5A), we analyzed the expression of LINC00261 and FOXA2 in these two groups of cell lines. Importantly and consistent with the expression pattern in the primary tumor samples, both genes derived from the LINC00261/FOXA2 locus were strongly downregulated in the fast migrating lung cancer cell lines compared to the slow migrating cell lines (Figure 5B,C).

3. Discussion

Cancer progression is a multistep process associated with stage-specific alterations in the transcriptome leading to uncontrolled proliferation, resistance to cell death, and increased invasiveness. Several lncRNA transcripts have been shown to display cancer-specific expression patterns, making them potential candidates as biomarkers and targets in cancer diagnosis and therapy. Comparison of gene expression between tumor and normal samples has been the most common approach to identify potential cancer gene candidates—for mRNAs as well as lncRNAs. The prototype candidate is the nuclear lncRNA MALAT1 which was originally identified as a metastasis-associated transcript in lung cancer. Further studies have established a functional role for MALAT1 in metastatic progression, with participation in splicing and transcriptional regulation [8]. Here, we have made use of publicly available tumor transcriptome datasets for lung adenocarcinoma and lung squamous cell carcinoma and compared it to the clinical stratification information to identify lncRNAs associated with lung cancer progression and recurrence. The top candidate identified by our analysis was LINC00261 which was strongly downregulated in lung cancer. Patients with primary LUAD tumors with low expression of LINC00261 were more prone to develop metastatic lesions indicating a potential prognostic value of this transcript. Interestingly, several genome-wide studies verified this cancer-specific expression profile of LINC00261 and a recent study also reported low LINC00261 expression as a prognostic marker for non-small cell lung cancer corroborating our results [23,24,25,26].
LINC00261 was originally identified and reported as definitive endoderm-associated lncRNA1 (DEANR1). In the non-tumor settings, LINC00261 is strongly expressed in endodermal tissues and drives the endoderm differentiation by upregulating the expression of the endoderm differentiation factor FOXA2. Interestingly, we observed a positive correlation between the expression of LINC00261 and its neighboring gene FOXA2 in normal as well as lung tumor samples, with both genes being suppressed during tumor progression as well as TGFβ-induced EMT. There are some parallels between tumor progression and early stages of endoderm differentiation, where LINC00261/DEANR1 acts in cis by recruiting the EMT-associated transcription factors SMAD2/3 to the FOXA2 promoter. While we could see that LINC00261 expression is FOXA2-dependent, the inverse was not true in the lung cancer cell lines tested (Figure S4). This could indicate a difference in the transcriptional network between endoderm and lung cancer cell lines. However, it should be noted that the LINC00261 knockdown efficiencies achieved here were moderate and the residual lncRNA expression could be sufficient to support FOXA2 expression. FOXA2 is an established epithelium-specific transcription factor with a role in normal epithelial differentiation [8,27,28]. Consequently, it suppresses lung and breast cancer progression and metastasis by opposing EMT [19,29]. Our study showed that LINC00261 is co-regulated with its neighbor FOXA2, and thus could play a role in FOXA2-mediated epithelial-specific transcription program. In addition to the normal versus tumor comparisons and co-regulation during TGFβ-induced EMT in representative lung cancer cell lines, we could further expand our analysis to a large panel of 185 lung cancer cell lines. By using a recently developed gene signature matrix for hierarchical clustering, we could categorize these cell lines into epithelial and mesenchymal subtypes and LINC00261/FOXA2 expression was indeed strongly upregulated in the epithelial cluster. More importantly, when the expression of LINC00261/FOXA2 transcripts were correlated with the experimentally verified group of fast and slow migrating lung cancer cell lines, higher expression was evidently associated with the slow migrating cell line panel. All these data indicated that there is an inverse correlation between LINC00261/FOXA2 expression and EMT and cell motility.
Whether LINC00261 plays any functional role in lung cancer progression or EMT is an unanswered question, but its overexpression in gastric cancer suppressed metastasis by direct interaction and degradation of the EMT-associated transcription factor Slug [30]. Overexpression of LINC00261 also suppresses colon cancer metastasis by sequestering β-catenin in the cytoplasm, facilitating its degradation and suppressing Wnt signaling. Moreover, low LINC00261 expression also correlates with cisplatin resistance in colon cancer cell lines and overexpression sensitizes them to anticancer DNA-damaging agents [31]. Thus, LINC00261 is a lncRNA associated with diverse forms of cancer, is highly conserved evolutionarily, and is co-regulated with its neighboring gene FOXA2 during EMT and tumorigenesis. The LINC00261/FOXA2 expression signature presented here seems to be of great potential in predicting the disease aggressiveness and progression of LUAD. In addition to the prognostic value, suppression of the LINC00261/FOXA2 locus may be a targetable node in the process of pathological EMT during cancer progression. Our data provides an important basis for future investigations on the role of the LINC00261/FOXA2 axis in lung cancer tumorigenesis, progression and metastasis to characterize their tumor suppressive and anti-metastatic functions in lung cancer.

4. Materials and Methods

4.1. Cell Culture, Reagents and Treatments

All cell lines were obtained from the American Type Culture Collection (ATCC, Manassas, VA, USA) and were periodically authenticated using Multiplex Cell Authentication by Multiplexion (Heidelberg, Germany). A549 cells were cultured in Dulbecco’s Modified Eagles Medium (DMEM, SIGMA, St. Louis, MO, USA, D5671) supplemented with 10% fetal bovine serum (FBS) and 2 mM L-Glutamine. All other cell lines were propagated in RPMI 1640 medium (Thermo Scientific, Waltham, MA, USA A1049101) supplemented with 10% FBS. Wherever indicated, cells were treated with 5 ng/mL TGFβ1 (Peprotech, Rocky Hill, NJ, USA, 100-21B) for 24 h and processed for RNA isolation and RT-qPCR.

4.2. RNA Isolation, cDNA Synthesis and RT-qPCR

RNA was isolated using TRI reagent (SIGMA, St. Louis, MO, USA T9424) according to the manufacturer’s protocol. RNA samples were treated with Turbo DNase (Thermo Scientific, Waltham, MA, USA AM2238) and re-purified using Phenol:Chloroform:Isoamyl alcohol (25:24:1) (Carl-Roth, Karlsruhe, Germany X985). Reverse transcription was carried out with 1 µg RNA using random-hexamer primers with the Revertaid Reverse transcriptase (ThermoFisher, Waltham, MA, USA EP0442). The 1:40 diluted cDNAs were analyzed by SYBR Green RT-qPCR (Power SYBRTM Green PCR Master Mix, ThermoFisher, Waltham, MA, USA 4367659) using the Applied Biosystems StepOne plus thermal cycler. Relative transcript expression was calculated by the comparative Ct-method (2-ddCt). GAPDH was used as reference gene. RT-qPCR primers used in the study include: LINC00261- sense ACATTTGGTAGCCCGTGGAG, antisense TCTTCCCCGGAGAACTAGCA; FOXA2- sense GAGACTTTGGGGAGACGGTG, antisense CGGGTGAAGAAGACTGCTGT; GAPDH- sense GTGAAGGTCGGAGTCAACG, antisense TGAGGTCAATGAAGGGGTC.

4.3. Analysis of Cell Migration

Lung cancer cell lines were stained with the lipophilic tracer DiR (Biotium, Fremont, CA, USA 60017) and seeded as described previously [32]. Cell migration was imaged in tricoated 96-well ORIS cell migration plates (Platypus Technologies, Madison, WI, USA) using the Li-COR Odyssey infra-red scanner.

4.4. Knockdown Experiments

For LINC00261 and FOXA2 knockdown, NCI-H520 and Calu-6 cell were seeded in 6-well plates at a density of 5 × 10⁵ and 2 × 10⁵ cells per well, respectively. On day 2, cells were transfected with 10 nM of control siPOOL, siPOOL for FOXA2 and two siPOOLs for LINC00261 (siTOOLs Biotech, Planegg, Germany) using Lipofectamine RNAiMAX reagent (Thermo Scientific, Waltham, MA, USA 13778150). Seventy-two hours post transfection, cells were lysed in 1 mL TRI reagent (Sigma, St. Louis, MO, USA) for RNA extraction and further analysis by RT–qPCR. siPOOLs sequences are listed in Table S1.

4.5. Data Analysis and Statistics

Long ncRNA expression data in LUAD and LUSC were downloaded from TANRIC (https://bioinformatics.mdanderson.org/main/TANRIC:Overview) and the respective clinical data for the TCGA-LUAD dataset was obtained from the cBIO portal (http://www.cbioportal.org/index.do). The filtering parameters and the final stage-specific analysis is presented in the text and in Table 1. For correlation studies, the expression data for coding genes (FOXA2, TGFB1, and CDH1) in lung cancer samples were also obtained from the cBIO portal. Clinical data with matched gene expression z-scores for 508 LUAD samples were downloaded from cBIO portal, classified as high (>+0.5 z-score) or low (<−0.5 z-score) expression and were used for generating Kaplan–Meier Plots using GraphPad Prism 5.
For the hierarchical clustering analysis, a microarray expression dataset for 185 lung cancer cell lines was obtained from CCLE (https://portals.broadinstitute.org/ccle). Using R, a (Pearson) correlation matrix was computed from the gene expression dataset by applying a 76-gene epithelial/mesenchymal signature reported earlier [20]. Since nine genes from the signature were not represented in the microarray datasets, these were excluded from the analysis. Hierarchical clustering was performed using standard R heatmap function (distance euclidian, method complete). The two distinct clusters were verified to be epithelial and mesenchymal by monitoring CDH1 and VIM expression in the dataset.
All data were processed using the Microsoft Excel 2010 program (Microsoft, Redmond, WA, USA). Graphs were plotted and statistical analysis was performed using GraphPad Prism 5. Statistical significance was assessed using Mann–Whitney tests unless stated otherwise in the respective figure legends. The p-values are displayed in respective figure panels.

Financial Disclosure Statement

S.D. (Sven Diederichs) is co-owner of siTOOLs Biotech GmbH, Martinsried, Germany.

Supplementary Materials

The following are available online at https://www.mdpi.com/2311-553X/5/1/2/s1, Figure S1. Positive correlation of LINC00261 and FOXA2 in lung cancer. Figure S2. Heat map showing the results of hierarchical clustering of gene expression data from lung cancer cell lines. Figure S3. E-cadherin (CDH1) and Vimentin (VIM) expression in lung cancer cell line clusters. Figure S4. FOXA2 regulates LINC00261 expression while LINC00261 knockdown does not affect FOXA2 expression. Table S1. Sequences of siPOOL used as negative control and siPOOLs targeting FOXA2 and LINC00261.

Author Contributions

Conceptualization, S.D. (Sven Diederichs); Formal analysis, S.D. (Sonam Dhamija), Y.S. and S.D. (Sven Diederichs); Funding acquisition, S.D. (Sven Diederichs); Investigation, S.D. (Sonam Dhamija), A.C.B. and K.M.; Methodology, S.D. (Sonam Dhamija) and A.C.B.; Project administration, S.D. (Sonam Dhamija); Resources, J.S.; Supervision, S.D. (Sven Diederichs); Writing—original draft, S.D. (Sonam Dhamija); Writing—review & editing, S.D. (Sonam Dhamija) and S.D. (Sven Diederichs).

Funding

Research in the Diederichs labs was supported by the German Research Foundation (DFG Di 1421/7-1, DFG Di 1421/9-1, EXC81 CellNetworks, SFB 850), and the National Center for Tumor Diseases Heidelberg (NCT 3.0 Integrative Projects in Basic Cancer Research).

Financial Disclosure Statement

S.D. (Sven Diederichs) is co-owner of siTOOLs Biotech GmbH, Martinsried, Germany.

Acknowledgments

The datasets used in this study were in whole or partly based upon data generated by the TCGA Research Network (http://cancergenome.nih.gov/) and the Cancer Cell Line Encyclopedia project. We thank the Lighthouse Core Facility at the Center for Translational Cell Research (ZTZ) in Freiburg for support with image acquisition using Li-COR Odyssey scanner for migration experiments. Sonam Dhamija would like to thank the CellNetworks post-doctoral fellowship program (Heidelberg) for support.

Conflicts of Interest

The authors declare no conflict of interest. The funders had no role in the design of the study; in the collection, analyses, or interpretation of data; in the writing of the manuscript, and in the decision to publish the results.

References

  1. Yurgelun, M.B.; Chenevix-Trench, G.; Lippman, S.M. Translating Germline Cancer Risk into Precision Prevention. Cell 2017, 168, 566–570. [Google Scholar] [CrossRef] [PubMed]
  2. Mathis, R.A.; Sokol, E.S.; Gupta, P.B. Cancer cells exhibit clonal diversity in phenotypic plasticity. Open Biol. 2017, 7. [Google Scholar] [CrossRef] [PubMed]
  3. Meacham, C.E.; Morrison, S.J. Tumour heterogeneity and cancer cell plasticity. Nature 2013, 501, 328–337. [Google Scholar] [CrossRef] [PubMed] [Green Version]
  4. Burrell, R.A.; McGranahan, N.; Bartek, J.; Swanton, C. The causes and consequences of genetic heterogeneity in cancer evolution. Nature 2013, 501, 338–345. [Google Scholar] [CrossRef] [PubMed]
  5. Samur, M.K.; Shah, P.K.; Wang, X.; Minvielle, S.; Magrangeas, F.; Avet-Loiseau, H.; Munshi, N.C.; Li, C. The shaping and functional consequences of the dosage effect landscape in multiple myeloma. BMC Genom. 2013, 14, 672. [Google Scholar] [CrossRef] [PubMed]
  6. Chandra Gupta, S.; Nandan Tripathi, Y. Potential of long non-coding RNAs in cancer patients: From biomarkers to therapeutic targets. Int. J. Cancer 2017, 140, 1955–1967. [Google Scholar] [CrossRef] [PubMed]
  7. Gupta, R.A.; Shah, N.; Wang, K.C.; Kim, J.; Horlings, H.M.; Wong, D.J.; Tsai, M.C.; Hung, T.; Argani, P.; Rinn, J.L.; et al. Long non-coding RNA HOTAIR reprograms chromatin state to promote cancer metastasis. Nature 2010, 464, 1071–1076. [Google Scholar] [CrossRef] [Green Version]
  8. Gutschner, T.; Hammerle, M.; Eissmann, M.; Hsu, J.; Kim, Y.; Hung, G.; Revenko, A.; Arun, G.; Stentrup, M.; Gross, M.; et al. The noncoding RNA MALAT1 is a critical regulator of the metastasis phenotype of lung cancer cells. Cancer Res. 2013, 73, 1180–1189. [Google Scholar] [CrossRef]
  9. Li, Y.; Li, Y.; Chen, W.; He, F.; Tan, Z.; Zheng, J.; Wang, W.; Zhao, Q.; Li, J. NEAT expression is associated with tumor recurrence and unfavorable prognosis in colorectal cancer. Oncotarget 2015, 6, 27641–27650. [Google Scholar] [CrossRef] [Green Version]
  10. Spano, D.; Heck, C.; De Antonellis, P.; Christofori, G.; Zollo, M. Molecular networks that regulate cancer metastasis. Semin. Cancer Biol. 2012, 22, 234–249. [Google Scholar] [CrossRef]
  11. Krebs, A.M.; Mitschke, J.; Lasierra Losada, M.; Schmalhofer, O.; Boerries, M.; Busch, H.; Boettcher, M.; Mougiakakos, D.; Reichardt, W.; Bronsert, P.; et al. The EMT-activator Zeb1 is a key factor for cell plasticity and promotes metastasis in pancreatic cancer. Nat. Cell Biol. 2017, 19, 518–529. [Google Scholar] [CrossRef] [PubMed]
  12. Nieto, M.A. Epithelial plasticity: A common theme in embryonic and cancer cells. Science 2013, 342, 1234850. [Google Scholar] [CrossRef] [PubMed]
  13. Dhamija, S.; Diederichs, S. From junk to master regulators of invasion: LncRNA functions in migration, EMT and metastasis. Int. J. Cancer 2016, 139, 269–280. [Google Scholar] [CrossRef] [PubMed]
  14. Rokavec, M.; Horst, D.; Hermeking, H. Cellular Model of Colon Cancer Progression Reveals Signatures of mRNAs, miRNA, lncRNAs, and Epigenetic Modifications Associated with Metastasis. Cancer Res. 2017. [Google Scholar] [CrossRef] [PubMed]
  15. Siegel, R.L.; Miller, K.D.; Jemal, A. Cancer statistics, 2016. CA Cancer J. Clin. 2016, 66, 7–30. [Google Scholar] [CrossRef] [PubMed] [Green Version]
  16. Ji, P.; Diederichs, S.; Wang, W.; Boing, S.; Metzger, R.; Schneider, P.M.; Tidow, N.; Brandt, B.; Buerger, H.; Bulk, E.; et al. MALAT-1, a novel noncoding RNA, and thymosin β4 predict metastasis and survival in early-stage non-small cell lung cancer. Oncogene 2003, 22, 8031–8041. [Google Scholar] [CrossRef] [PubMed]
  17. Li, J.; Han, L.; Roebuck, P.; Diao, L.; Liu, L.; Yuan, Y.; Weinstein, J.N.; Liang, H. TANRIC: An interactive open platform to explore the function of lncRNAs in cancer. Cancer Res. 2015, 75, 3728–3737. [Google Scholar] [CrossRef]
  18. Lee, E.S.; Son, D.S.; Kim, S.H.; Lee, J.; Jo, J.; Han, J.; Kim, H.; Lee, H.J.; Choi, H.Y.; Jung, Y.; et al. Prediction of recurrence-free survival in postoperative non-small cell lung cancer patients by using an integrated model of clinical information and gene expression. Clin. Cancer Res. 2008, 14, 7397–7404. [Google Scholar] [CrossRef]
  19. Tang, Y.; Shu, G.; Yuan, X.; Jing, N.; Song, J. FOXA2 functions as a suppressor of tumor metastasis by inhibition of epithelial-to-mesenchymal transition in human lung cancers. Cell Res. 2011, 21, 316–326. [Google Scholar] [CrossRef]
  20. Byers, L.A.; Diao, L.; Wang, J.; Saintigny, P.; Girard, L.; Peyton, M.; Shen, L.; Fan, Y.; Giri, U.; Tumula, P.K.; et al. An epithelial-mesenchymal transition gene signature predicts resistance to EGFR and PI3K inhibitors and identifies Axl as a therapeutic target for overcoming EGFR inhibitor resistance. Clin. Cancer Res. 2013, 19, 279–290. [Google Scholar] [CrossRef]
  21. Barretina, J.; Caponigro, G.; Stransky, N.; Venkatesan, K.; Margolin, A.A.; Kim, S.; Wilson, C.J.; Lehar, J.; Kryukov, G.V.; Sonkin, D.; et al. The Cancer Cell Line Encyclopedia enables predictive modelling of anticancer drug sensitivity. Nature 2012, 483, 603–607. [Google Scholar] [CrossRef] [PubMed] [Green Version]
  22. Becker, A.C.; Sharma, Y.; Dhamija, S.; Seiler, J.; Diederichs, S. Novel players in lung adenocarcinoma cell migration. Manuscript in preparation.
  23. Cao, W.J.; Wu, H.L.; He, B.S.; Zhang, Y.S.; Zhang, Z.Y. Analysis of long non-coding RNA expression profiles in gastric cancer. World J. Gastroenterol. 2013, 19, 3658–3664. [Google Scholar] [CrossRef] [PubMed]
  24. Muller, S.; Raulefs, S.; Bruns, P.; Afonso-Grunz, F.; Plotner, A.; Thermann, R.; Jager, C.; Schlitter, A.M.; Kong, B.; Regel, I.; et al. Next-generation sequencing reveals novel differentially regulated mRNAs, lncRNAs, miRNAs, sdRNAs and a piRNA in pancreatic cancer. Mol. Cancer 2015, 14, 94. [Google Scholar] [CrossRef] [PubMed]
  25. Yu, H.; Xu, Q.; Liu, F.; Ye, X.; Wang, J.; Meng, X. Identification and validation of long noncoding RNA biomarkers in human non-small-cell lung carcinomas. J. Thorac. Oncol. 2015, 10, 645–654. [Google Scholar] [CrossRef] [PubMed]
  26. Liu, Y.; Xiao, N.; Xu, S.F. Decreased expression of long non-coding RNA LINC00261 is a prognostic marker for patients with non-small cell lung cancer: A preliminary study. Eur. Rev. Med. Pharmacol. Sci. 2017, 21, 5691–5695. [Google Scholar] [CrossRef]
  27. Gosalia, N.; Yang, R.; Kerschner, J.L.; Harris, A. FOXA2 regulates a network of genes involved in critical functions of human intestinal epithelial cells. Physiol. Genom. 2015, 47, 290–297. [Google Scholar] [CrossRef] [PubMed] [Green Version]
  28. Wan, H.; Dingle, S.; Xu, Y.; Besnard, V.; Kaestner, K.H.; Ang, S.L.; Wert, S.; Stahlman, M.T.; Whitsett, J.A. Compensatory roles of Foxa1 and Foxa2 during lung morphogenesis. J. Biol. Chem. 2005, 280, 13809–13816. [Google Scholar] [CrossRef] [PubMed]
  29. Zhang, Z.; Yang, C.; Gao, W.; Chen, T.; Qian, T.; Hu, J.; Tan, Y. FOXA2 attenuates the epithelial to mesenchymal transition by regulating the transcription of E-cadherin and ZEB2 in human breast cancer. Cancer Lett. 2015, 361, 240–250. [Google Scholar] [CrossRef]
  30. Yu, Y.; Li, L.; Zheng, Z.; Chen, S.; Chen, E.; Hu, Y. Long non-coding RNA linc00261 suppresses gastric cancer progression via promoting Slug degradation. J. Cell. Mol. Med. 2017, 21, 955–967. [Google Scholar] [CrossRef]
  31. Wang, Z.K.; Yang, L.; Wu, L.L.; Mao, H.; Zhou, Y.H.; Zhang, P.F.; Dai, G.H. Long non-coding RNA LINC00261 sensitizes human colon cancer cells to cisplatin therapy. Braz. J. Med. Biol. Res. 2017, 51, e6793. [Google Scholar] [CrossRef]
  32. Menon, M.B.; Ronkina, N.; Schwermann, J.; Kotlyarov, A.; Gaestel, M. Fluorescence-based quantitative scratch wound healing assay demonstrating the role of MAPKAPK-2/3 in fibroblast migration. Cell Motil. Cytoskelet. 2009, 66, 1041–1047. [Google Scholar] [CrossRef] [PubMed] [Green Version]
Figure 1. LINC00261 is a biomarker for progression and poor survival in lung adenocarcinoma. (A) Ratio of gene expression values for CDH1 and CDH2 were calculated for the 98 LUAD tumor samples described and categorized into disease-free (n = 44) and progressed/recurred (n = 54) in Table 1. Low ratios in progressed/recurred samples indicate positive correlation with invasive cells. (B) LINC00261 expression values from the same dataset showing significantly lower levels of expression in progressed/recurred samples. (C,D) Kaplan–Meier plot showing the association of LINC00261 expression (C) or LINC00261/CDH1 expression (D) with patient survival in LUAD (all stages). p-value refers to log-rank p-value.
Ncrna 05 00002 g001
Figure 2. LINC00261 is suppressed in lung cancer. (AC) The LINC00261 expression data from LUAD-Korea (n = 77 normal/83 tumor). (A) LUAD-TCGA (n = 55 normal/486 tumor) and (B) lung squamous cell carcinoma (LUSC)-TCGA (n = 17 normal/220 tumor). (C) Datasets are represented as box plots.
Ncrna 05 00002 g002
Figure 3. FOXA2 gene neighboring LINC00261 is co-downregulated in lung cancer. (A) The FOXA2/LINC00261 gene locus on the small arm of human chromosome 20. Black boxes indicate coding exons and white boxes indicate non-coding exons. The accession numbers for reference transcripts are indicated. (BD) The FOXA2 expression data from LUAD-Korea (n = 77 normal/83 tumor), (B) LUAD-TCGA (n = 55 normal/486 tumor), and (C) the LUSC-TCGA (n = 17 normal/220 tumor). (D) Datasets are represented as box plots. (E) FOXA2 expression is significantly low in progressed/recurred LUAD tumor samples described in Table 1. (F,G) Kaplan–Meier Plot showing the association of FOXA2 expression or (F) LINC00261/FOXA2 expression with (G) patient survival in LUAD (all stages). p-value refers to log-rank p-value.
Ncrna 05 00002 g003
Figure 4. LINC00261 and FOXA2 are indicative of an epithelial gene signature in normal lung and lung cancer cell lines. (A,B) Correlation plots showing strong correlation between LINC00261 and TGFβ1 (A)/CDH1. (B) Expression in normal lung samples. (C,D) LINC00261 (C) and FOXA2 (D) are downregulated during TGFβ-induced epithelial-to-mesenchymal transition (EMT) in A549 and Calu-6 lung cancer cell lines (n = 3). p-value was calculated using ANOVA test. (E,F) The expression of LINC00261 (E) and FOXA2 (F) is stronger in the epithelial cluster of lung cancer cell lines generated by hierarchical clustering based on a previously established EMT signature (n = 62 mesenchymal/123 epithelial cell lines).
Ncrna 05 00002 g004
Figure 5. LINC00261 is a negative regulator of lung cancer cell migration. (A) Representative pictures showing a slow (NCI-H1993) and a fast (NCI-H2030) migrating cell line in the cell migration assay with the Oris system. Near infrared-fluorescent scans of cell monolayer are shown with the average percentage of the central free area for migration at 0, 24 h, and 48 h. (B,C) LINC00261 (B) and FOXA2 (C) expression in fast (n = 5) and slow (n = 6) migrating cell lines showing high expression of both genes in slow migrating cells.
Ncrna 05 00002 g005
Table 1. Clinical parameters for the 98 lung adenocarcinoma (LUAD) from The Cancer Genome Atlas (TCGA) samples categorized based on the clinical outcome of tumor progression.
ParametersDisease-FreeRecurred/Progressed
Patients4454
N02731
N11116
N257
NX10
Stage IA129
Stage IB1417
Stage IIA36
Stage IIB1014
Stage IIIA58
Median Age (years)67.067.0
Age Range (years)41–8342–84
Male1825
Female2629
Neoadjuvant Treatment00
Smoking History3747
Lifelong Non-Smoker67

