
Experimental and Numerical Investigation of the Aerodynamic Ventilation Drag of Heavy-Duty Vehicle Wheels

1
Institute of Automotive Engineering, University of Stuttgart, 70569 Stuttgart, Germany
2
Forschungsinstitut für Kraftfahrwesen und Fahrzeugmotoren Stuttgart, 70569 Stuttgart, Germany
*
Author to whom correspondence should be addressed.
Fluids 2023, 8(2), 64; https://doi.org/10.3390/fluids8020064
Submission received: 4 January 2023
/
Revised: 25 January 2023
/
Accepted: 8 February 2023
/
Published: 10 February 2023
Abstract
:Due to current EU regulations, constant-speed testing on test tracks is used for aerodynamic certification of heavy-duty vehicles (HDV). However, the aerodynamic development of HDVs is performed using wind tunnels and computational fluid dynamics (CFD). Both techniques commonly neglect the rotational aerodynamic losses of the wheels—the so-called ventilation drag—that are present when driving on the road. This is due to the fact that there is no full-scale wind tunnel for this type of vehicle with a suitable belt system for the simulation of the wheel rotation. Furthermore, the ventilation drag of HDV wheels has been neglected in CFD due to their almost completely closed rim design. These constraints lead to an underprediction of the aerodynamic forces in comparison to the results under on-road conditions when performing constant-speed tests. In order to investigate the ventilation drag of HDV wheels, measurements were carried out on a 1:4.5 scale generic tractor-trailer model in the Model Scale Wind Tunnel of the University of Stuttgart. The measured aerodynamic forces as well as the measured flow field data provide the basis for the definition and validation of a procedure for analyzing the ventilation drag in CFD. Accordingly, the ventilation drag of a full scale HDV was investigated in CFD. The results show that the tire treading and rim geometry have a significant influence on ventilation drag that contributes to the total aerodynamic drag of the HDV. The present work shows that the ventilation drag has a relevant impact on the total aerodynamic drag of HDVs and should therefore not be neglected. The presented CFD approach thus allows to assess the aerodynamic drag under real on-road conditions in an early stage of the vehicle development.
Keywords:
aerodynamics; ventilation drag; HDV; tractor-trailer; wheels; automotive; CFD; wind tunnel; PIV1. Introduction
The CO2 emission targets for HDVs are set by the European Union through the Regulation (EU) 2019/1242 [1]. To consider the contribution of aerodynamics to the CO2 emissions, the aerodynamic drag has to be determined using a certification procedure where constant-speed testing on test tracks is performed [2,3].
The aerodynamic development of HDVs is done in wind tunnels or by means of CFD simulations. While the ventilation drag is implicitly measured by the wheel-torque meter during on-road tests and directly taken into account on the total aerodynamic drag, it is usually neglected in state-of-the-art CFD or it just cannot be measured in wind tunnel testing. Thus, the ventilation drag is an important quantity to consider for the comparison between the aerodynamic drag obtained via constant-speed testing and the one provided by wind tunnel or CFD.
Research on passenger cars showed that the aerodynamic drag generated by the wheels and wheel-houses can be responsible for up to 30% of the total aerodynamic drag [4,5]. Additionally, it has been demonstrated that the wheels experience an aerodynamic ventilation moment due to pressure and friction forces. This braking moment can also be expressed as a drag force (ventilation drag) acting on the wheel axle and must thus be considered when the overall aerodynamic drag is investigated. In the literature, different methods for determining the aerodynamic ventilation moment of passenger cars can be found [6,7,8,9]. These methods present modifications to a normal wind tunnel setup allowing the isolated measurement of the ventilation moment. Their execution significantly depends on the available ground simulation system in each wind tunnel. On the other hand, CFD has been also applied for predicting the ventilation drag on passenger car wheels [10]. The used CFD approaches were able to evaluate the ventilation drag but have limitations and uncertainties due to simplifications in the modeling of the wheel rotation.
There are several reasons why no research on ventilation drag of HDV wheels has been done. On one hand, available wind tunnels are rarely dimensioned for the size of these vehicles. Moreover, the ground simulation systems are not suitable for performing measurements with the required wheel sizes nor under such load conditions. On the other hand, the aerodynamic influence of HDV wheels has been considered uncritical in the past because of their mostly closed rims. This fact has led to the simplification of the wheel modeling in the state-of-the-art CFD, which impedes the proper analysis of the ventilation drag experienced by the wheels.
The aim of this paper is to investigate the ventilation drag of a European HDV with different wheel configurations using CFD. To define a robust method for quantifying the influence of the ventilation drag numerically, a validation study of the CFD prediction capabilities was performed. For this purpose, measurements of a generic tractor-trailer model were undertaken in the Model Scale Wind Tunnel of the University of Stuttgart. The investigations give insight into the involved flow phenomena and the resulting ventilation drag. They furthermore allow the consolidation of the used CFD procedure. Finally, CFD simulations were done to assess the contribution of ventilation drag to the total aerodynamic drag of a HDV.
2. Approach for Determining the Ventilation Drag in CFD
This section introduces the features of the developed test vehicle. The experimental setup and the utilized numerical methods are introduced. A detailed comparison of the obtained results is done.
To study the ventilation drag of HDV wheels, a 1:4.5 scale vehicle model was designed, manufactured, and investigated in the Model Scale Wind Tunnel of the University of Stuttgart. Force measurements with the wind tunnel balance and flow filed measurements with a PIV system were done on different HDV wheel configurations. The focus is on the ventilation drag of different treaded tires and rim topologies. The experiments aim to identify the relevant flow features and also provide a database for the validation of the numerical simulation. In a next step, an approach for investigating and quantifying the ventilation drag in CFD is introduced.
2.1. Development of a Test Vehicle
The developed vehicle model generates a flow topology in the vicinity of the wheel that is comparable to a real commercial vehicle. The shape of the vehicle model is based on the generic tractor-trailer of the German Association for Research in Automotive Technology (FAT) [11,12].
Since the investigation of the ventilation drag focuses on the forces and moments acting on the wheels, the representation of the flow conditions in the wheel area is of great importance. Therefore, the design of the test vehicle was reduced to a quarter vehicle model, which only covers half of the width and both axles of the tractor. This design also allows to keep the influence of the blockage effects of the wind tunnel as small as possible while at the same time allowing investigations at high Reynolds numbers () making sure the results can be transferred to full scale. The resulting blockage ratio between the cross-section of the wind tunnel nozzle and the vehicle frontal area is 7.8%.
The 1:4.5 scale of the vehicle model is determined due to the necessary quality of the measurements and the boundary conditions of the model-scale wind tunnel. The goal is to achieve a fully developed turbulent boundary layer at [8]. Furthermore, the vehicle model has to fit on the five-belt system used simulate the relative motion between vehicle and floor and to rotate the wheels.
For designing the vehicle model shown in Figure 1, an iterative process is used. The requirements and specifications are incorporated into the model in different development loops. The design of the vehicle model is fully digital, and it is supported by several CAE programs. First, the commercial CFD software Simulia PowerFLOW is used to develop the outer skin of the model, the geometry of which is intended to reproduce the aerodynamic conditions in the wheel area of a real HDV. In the next step, the geometry of the vehicle model consolidated in the CFD is converted into a CAD model suitable for manufacturing. A detailed description of the development and production of the vehicle model can be found in [13].
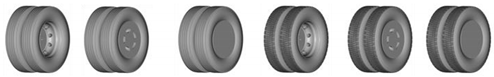
The wheels correspond to a type 315/70 R 22.5 in 1:4.5 scale. The modular design of the wheels, as shown in Figure 2, enables the investigation of different rim and tread geometries. Both the front wheel and the twin wheels on the rear axle are based on a reference rim from solid aluminum which allows the attachment of different rim shapes and treads from rapid prototyping.
To investigate the ventilation drag, two different treads and three different rim shapes are used. Figure 3 shows the chosen tread topologies, which are based on a realistic tire geometry from Continental. Furthermore, three different rim covers can be fitted (Figure 4). While the standard rim (a) represents a conventional front axle rim, the rim covers (b) and (c) represent rim shapes with flat outer surface. The eco rim (b) is based on a design proposed by Vdovin et al. [10] for passenger cars.
2.2. Experimental Setup for Wind Tunnel Testing
All experimental investigations were carried out in the model scale wind tunnel at the Institute of Automotive Engineering (IFS) of the University of Stuttgart. It is a Göttingen type wind tunnel with an open jet test section. The nozzle cross-sectional area is 1.65 m2. The wind tunnel is equipped with a turntable and a ground simulation system, including a state of the art five-belt and boundary layer control system. The underfloor balance installed in the test section allows to measure the aerodynamic forces and moments acting on the vehicle [14].
The force required to overcome the wheel resistance Is applied by the wheel rotation units. This is an internal force of the vehicle-balance system that is not measured in the standard wind tunnel setup. To isolate the forces acting on the wheels, the vehicle model is attached to the test section floor via the rocker panel struts, displayed in Figure 5. The forces are measured by the underfloor balance since it is directly connected to the wheel rotation units. The total force to be overcome by the wheel which will be measured by the balance represents the superposition of the ventilation drag , the rolling resistance , and the aerodynamic forces acting on the belts. To exclude the rolling resistance and the frictional losses from the measurements, a velocity of 5 km/h is chosen as value of tare. At this speed, the aerodynamic forces are negligible, whereas the rolling resistance is supposed to be nearly constant over the whole speed range. Therefore, for low speed, it is possible to evaluate the mechanical and frictional losses on the wheel and subtract them from the final measurements. However, the influence of the aerodynamic forces on the belts are difficult to capture separately from the measurement. Consequently, the measured aerodynamic forces experienced by the wheel stand for the superposed ventilation drag and the aerodynamic effect of the belts. The time-averaged value of this longitudinal force is designated as .
In addition to the investigation of the aerodynamic forces, the flow field in the vicinity of the rotating wheel is measured by means of Particle Image Velocimetry (PIV). The FlowMaster PIV system from LaVision GmbH was used, consisting of a Nd:YAG-Laser, two SCMOS cameras, as well as a timing and recording computer. The obtained images record the movement of the particles, which are translated into the velocity components of the flow field using a cross-correlation.
The measurements are carried out in several laser sheet positions including the upstream and downstream regions beside the rotating front wheel. The location of four planes oriented normal to the ground plane are shown in Figure 6. The measured flow fields close to the vehicle can be distorted by laser reflections from nearby surfaces. The reflections cause areas that can shine brighter than the particles on the laser sheet illuminated by the laser. To minimize this phenomenon, all potentially reflective surfaces are covered with low-reflection coatings.
2.3. Numerical Setup for Modeling Wheel Rotation in CFD
The commercial CFD code Simulia PowerFLOW is used for all numerical simulations. PowerFLOW is widely used in the automotive industry, a large number of validation reports can be found in the literature [15,16,17]. The underlying Lattice–Boltzmann Method is based on the mesoscopic kinetic theory that considers particle distribution tracking and is inherently transient. The behavior of the particle distribution function with position , velocity , time and the collision operator is described by the Boltzmann equation (Equation (1)). The left side of this equation shows the advection of the particle distribution while the right side represents the redistribution of the particle distribution function due to collisions. Equation (2) shows the collision operator in its Bhatnagar–Gross–Krook form with the relaxation time constant and the equilibrium distribution [18]. For discretizing the Boltzmann equation on a lattice, 3 spatial dimensions and 19 discrete velocities are considered in Simulia PowerFLOW. The fluid–wall interaction is calculated using a volumetric boundary scheme that allows the modeling of no-slip walls, slip walls, and wall functions at each facet particle [19].
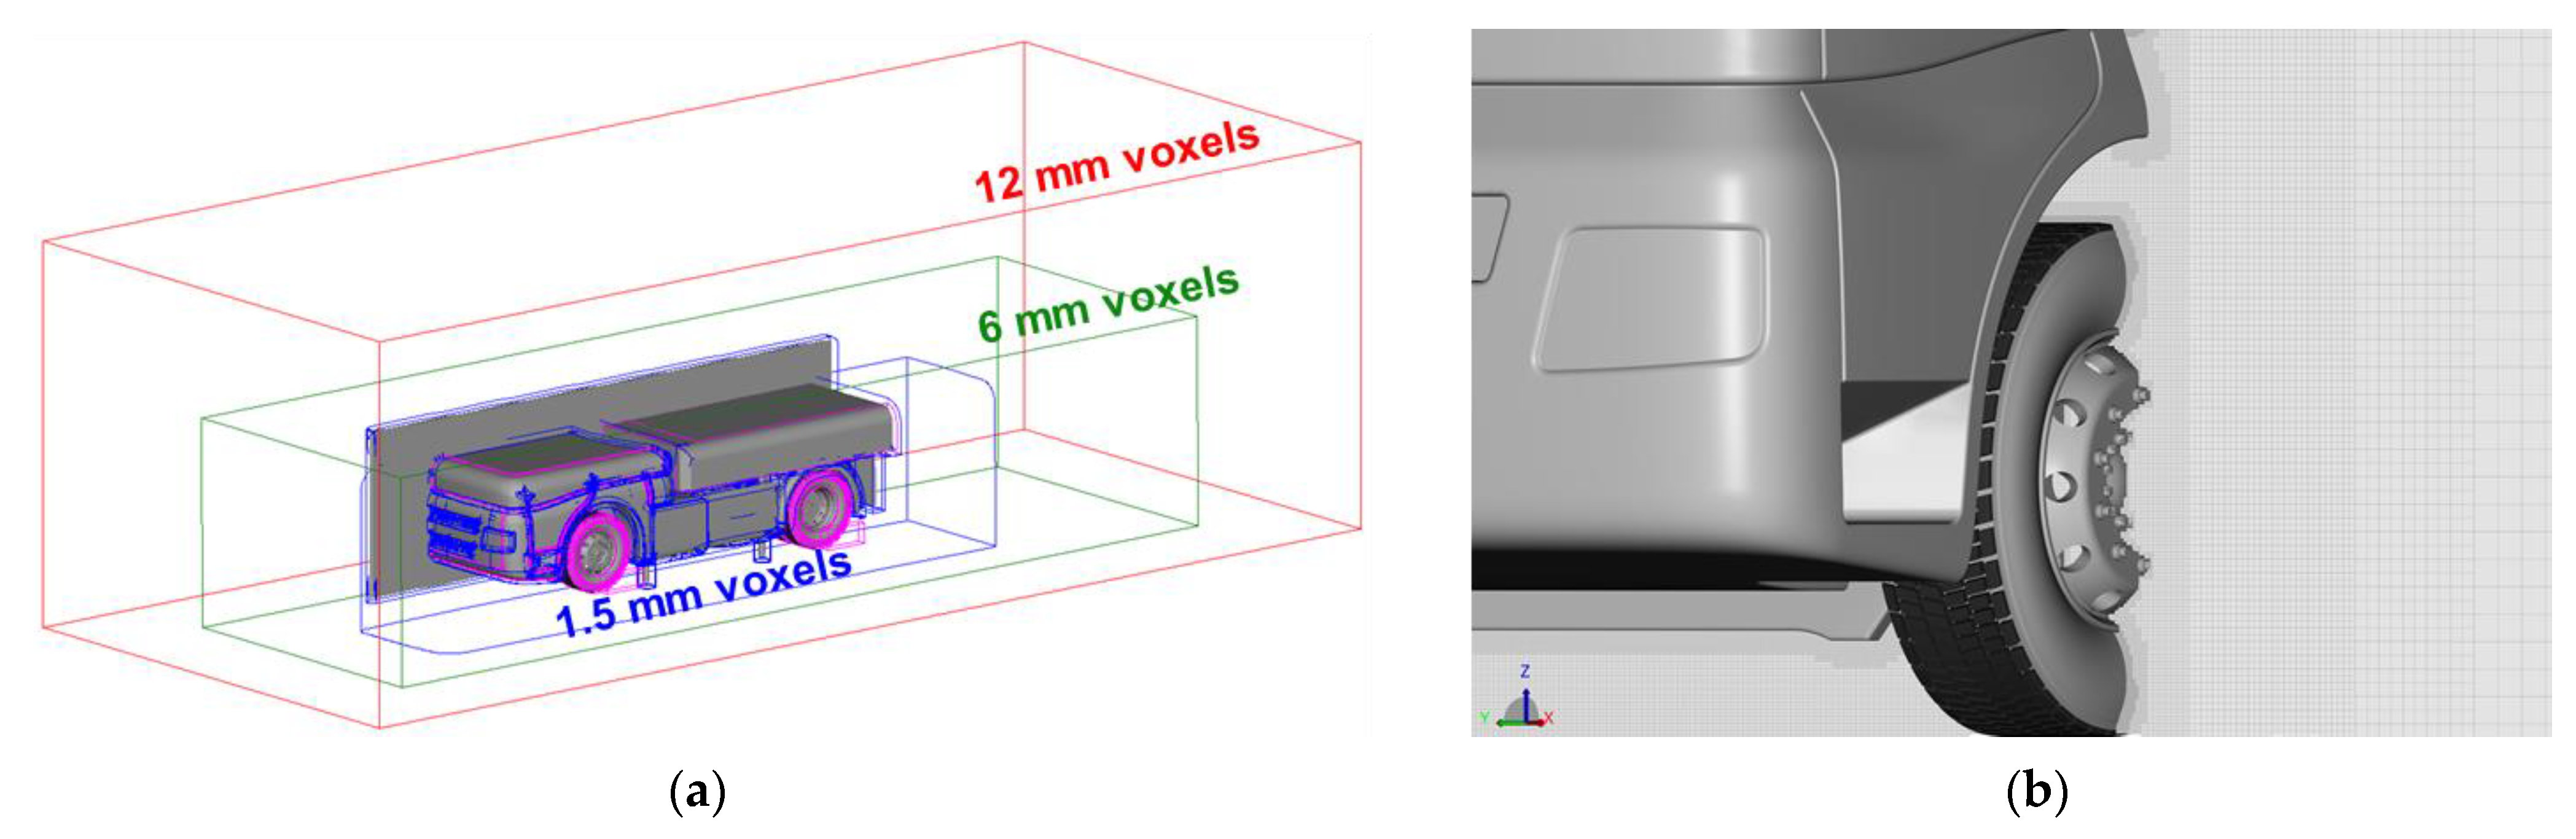
The applied VLES (Very Large Eddy Simulation) turbulence model and an adapted RNG 𝑘-ε model for the unresolved small scales allow to capture the relevant turbulence effects in the highly turbulent flow field. The simulation domain is discretized by using cubic volumetric elements called voxels that are cells of the lattice, where the large-scale turbulence is resolved. Several regions with increased resolution are added to resolve the sensitive flow phenomena on the vehicle following the best practices provided by Simulia. The finest voxels are assigned to the highest resolution level and they have a size of 0.375 mm (Figure A1). The turbulence is considered in the collision operator by adjusting the relaxation time to as shown in Equation (3), where is the temperature, is the local strain parameter, and is a model coefficient. A detailed description of the equations for solving the turbulent kinetic energy and the turbulent dissipation can be found in [20].
The simulation domain is created with dimensions large enough to avoid any blockage or interference effects. The implemented boundary conditions are velocity inlet, pressure outlet, and frictionless boundary conditions for the sidewalls and ceiling. Moreover, the five-belt system, consisting of a central moving belt and four wheel belts, has been implemented. It allows to reproduce the rolling road and the contact patch of the wheels in a realistic way. According to the wind tunnel configuration, a moving wall boundary condition was assigned to each belt.
In general, rotating geometries represent a transient flow situation. However, their representation in the numerical simulation depends on the modeling complexity, the expected accuracy as well as the necessary computing power. While some flow situations can be modeled as steady-state due to their simplicity, other flow problems have to be solved by using complex grid motion techniques to capture the time-dependent nature of the flow, which requires a considerable increase in computing power.
Determining the ventilation drag of a wheel in CFD requires an accurate representation of the wheel as well as a realistic and time-dependent modeling of the rotation. The approach for modeling the rotation of HDV wheels applied in this study combines several methods available in Simulia PowerFLOW. The purpose is to achieve the best possible accuracy while at the same time reducing the necessary computing power. Wall boundary conditions with a given tangential velocity are applied to the axisymmetric regions of the wheel such as the wheel shoulder or the tread with longitudinal grooves. As shown in Figure 7 the rims are enclosed in isolated volumes which physically rotate when applying the sliding-mesh approach. Here, the calculated flow quantities are transferred between the global static grid and the rotating sub-grid via a rotationally symmetrical interface using interpolation [21]. On the other hand, the patterns of the treaded tires are modeled by means of the immersed boundary method. This method allows to consider a non-conformal geometry on a computational grid and represents its movement by incorporating the appropriate boundary conditions in the vicinity of the geometry [22]. Finally, since the experimentally investigated wheels are rigid—they do not deform as in the case of real tires—it is not necessary to consider shape changes on the tire shoulder. To represent the contact patch in the simulation, the tires penetrate the respective belts.
With the used methods for modeling the wheel rotation, the aerodynamic influence of the wheel rotation as well as the influence of the rim and tire geometry can be represented. This approach is thus suited for investigating the time-dependent, aerodynamic forces of rotating wheels. The rotational aerodynamic losses of the wheels due to the pressure and friction forces are captured by the chosen modelling. In that sense, the pressure distribution on the rotating rim and tire treads can be properly represented thanks to the grid motion techniques. The friction losses of the wheel are captured by the used wall boundary modelling.
2.4. Comparison of the Results and Validation
All measurements were carried out at a freestream velocity of . The maximum velocity was limited to ensure the operational safety of the 3D printed treads. The translation speed of the belts of the ground simulation system is also 60 m/s, which results in a wheel rotation velocity of 5090 rpm so that a fully developed turbulent boundary layer with is achieved. The investigated inflow situation thus corresponds to a straight-ahead drive at approximately 50 km/h for a full scale HDV.
The experimental force measurements are recorded over a measuring time of 60 s. The numerical simulations are simulated for 3 s after being initialized with the flow field of a previous coarse discretized simulation. An averaging interval of 1 s is selected to average the forces calculated in the simulation. All other parameters of the simulation analysis correspond to those of the experimental evaluation.
The results of the wind tunnel measurements and the CFD simulations shown in Table 1 show a good agreement of force values for the individual wheel configurations. The maximum deviation between CFD and WT is 0.15 N and is close to the measurement accuracy of the balance (±0.1 N).
The crosswise position of the treads to the incident flow results in a local increase of the pressure and friction forces acting on the tire. The comparison of the forces between the variants with different tire topology shows that the influence of the treaded pattern leads to an increase of of approximately 180% in the test. However, applying the profiling in the simulation amounts to an increase in the calculated forces of approx. 230%.
The ventilation drag can be reduced when using aerodynamically improved rims. The wind tunnel measurements of the wheel configurations with closed and eco rims show a reduction of the measured force of 10–18% compared to the standard rim. Moreover, the simulation results show a similar reduction (5–16%) of the ventilation drag due to the flat rims. Furthermore, it can be observed that the force measurements performed in the model wind tunnel are more sensitive to the rim shape, while the CFD results of the closed and eco rim differ little from each other.
Table 2 shows the results of the aerodynamic ventilation forces acting on the twin wheels. Analogous to the study of the front wheel, there are moderate deviations between the measured and simulated forces. The maximum deviation between CFD and WT is 0.43 N. However, this deviation is greater than that on the front axle and is particularly noticeable on the twin wheels with longitudinal grooves.
Again, the treaded pattern increases the ventilation drag compared to the longitudinal grooves. This increase amounts to 70% in the wind tunnel tests and approximately 90% in the CFD simulations. However, the observed increase on the rear axle is smaller than that on the front axle. The reason for this is the different inflow situation experienced by the wheels on the front and rear axle. While the single wheel in the front wheel arch is directly exposed to the airflow, the twin wheels are in the wake of the front wheel and under the influence of the underbody airflow.
Fitting flat hub covers to the twin wheels results in a reduction of ventilation drag. The improvement of the aerodynamic properties compared to the standard rim is evaluated similarly in the experiment and in CFD. The difference between the closed and eco covers is minimal due to the characteristics of the underbody airflow at the rear axle.
In general, a good agreement between the experimental and the simulated flow field can be observed in Figure 8. The horseshoe vortex is fully developed at wheel shoulder height (h1) and its size, intensity as well as the flow separation at the flank of the tire are represented in the same way by both results. Likewise, at the height of the lower rim edge (h2), the interactions of the horseshoe vortex and the wheel wake are comparable. The small, detached flow area at wheel hub height (h3) indicates that the wheel is shielded by the wheel housing. Finally, the flank vortex in the upper area of the wheel housing (h4) is reproduced equally by both results.
The influence of the thread and the rim shape on the flow topology is illustrated in Figure 9. The flow field on the lower plane h2 shows that the use of a flat rim, such as the eco rim, reduces the size of the horseshoe vortex, regardless of the tires used. This flow behavior is equally reflected in the simulation results. On the other hand, the treaded pattern of the tire causes a change in shape and displacement of the wheel horseshoe vortex.
To evaluate the quality of the applied CFD procedure with regard to the determination of the ventilation drag, the numerically calculated forces are compared with the measurements obtained in the wind tunnel for each wheel configuration investigated. The percentage deviation of CFD results from the experimental measurements is 5% to 15% regardless of the wheel type, rim type, or topology of the tread. An exception to this is the results of the tests with longitudinal grooves on the rear axle, which show a deviation of up to 30%. The mentioned deviation is independent of the rim shape and indicates that there may be differences in the inflow experienced by the twin wheel. Furthermore, the sensitivity of the CFD procedure with respect to geometrical wheel changes is also evaluated. In this regard, the measured and simulated forces show comparable tendencies due to the different treads and rim shapes.
The methods used to model the wheel rotation in CFD allow a good representation of the flow phenomena observed in the wind tunnel. The introduced CFD approach is able to predict the aerodynamic forces, the flow topology, and the changes in the flow field due to geometric changes on the wheel.
3. Analysis of the Ventilation Drag of HDV in CFD
A tractor-trailer configuration is investigated, which was already used in the context of previous research work of the FAT [3,23]. It consists of a tractor model TGA 18.480 from MAN Truck&Bus and a Krone 3-axle semi-trailer with box body (Figure 10). The HDV wheels are 315/70 R 22.5, the tires are represented as deformation-free in CFD. They are equipped with two different tread topologies from Continental AG (Figure 3). In order to ensure comparability with the road tests, the original rims on the tractor and on the semi-trailer axels are considered.
Due to the high demand of computational resources required for the simulations with detailed wheel modelling and the amount of wheel configurations to be investigated, local simulations are carried out within the scope of this paper. The transient boundary seeding approach of Simulia PowerFLOW has been used [24]. This enables the execution of partial simulations around a region of interest on the vehicle, in which time-dependent boundary conditions from a previous simulation are specified to prescribe the flow field. Such partial simulations further reduce the simulation domain size and are used to investigate the aerodynamic influence of geometric variations.
3.1. Investigation of the Ventilation Drag of HDV Wheels
The boundary conditions for reproducing the incident flow in CFD are specified in accordance with previous publications [3,23] and are based on the flow situation from the road test. For this purpose, the flow field of a large number of driving tests was analyzed in a previous study [3]. The average flow field derived from the evaluated driving tests is subsequently used to represent a stationary frontal flow in the numerical simulation. To define the flow situation experienced by the HDV, a vehicle speed of 24.4 m/s, which corresponds to the average driving speed in the driving test, and the frontal average wind speed of 2.9 m/s from the evaluation of the wind situation are added. Similar to the simulations of the vehicle model, the simulation domain is created to minimize blockage and the implemented boundary conditions are velocity inlet, pressure outlet, and frictionless boundary conditions for the sidewalls and ceiling. To represent the relative speed between the ground and the vehicle, a ground translation speed equal to is given. Finally, the modeling approach presented for the scale model is also used to represent the wheel rotation of the different wheel configurations (Figure 7).
Table 3 presents the numerically investigated ventilation drag of the respective wheel configurations on the left hand side of the HDV. For better comparability of the results and for confidentiality reasons with the truck manufacturers at the FAT, the listed values are normalized with the ventilation drag of the front wheel with longitudinal grooves ().
The treaded pattern causes an increase in regardless of the rim shape and axle type. Due to the profiled tread on the wheels, the ventilation drag of the trailer axle increases by up to 250%. This is due to the underbody flow and the comparatively exposed wheels. In contrast, the twin wheels on the rear axle are located in the wake of the front wheels and are shielded by the wheel housing. This causes a 180% higher ventilation drag. In comparison to the results from the investigations on the scale model, the influence of the tires on the ventilation drag is higher for the full-scale commercial vehicle. The reason for this is that the investigations on the full scale HDV wheels are carried out at a higher inflow speed, which means a higher rotational speed of the wheels. While the results presented here are carried out at an approach velocity of 87.8 km/h, the model scale wind tunnel tests and the validation simulations on the vehicle model took place at approx. 50 km/h, referred to the 1:1 scale.
To analyze the flow field, the time-averaged magnitude of the speed is normalized with the incident flow velocity . In Figure 11 and Figure 12, three different wheel height planes are shown. The flow field at the front wheel is chosen because of the pronounced topology. The flow field shown in Figure 11 indicates that the horseshoe vortex is shifted to the rear when using treaded tires. This behavior is similar to the previously shown results on the quarter vehicle model. Likewise, the pattern on the tread causes a different flow separation on the wheel flank, which influences the incident flow to the rim. In the lower wheel area, it can also be observed how the wheel wake is influenced by the mud flap.
3.2. Contribution of the Ventilation Drag to the Total Aerodynamic Drag
To evaluate the influence of the ventilation drag on the total aerodynamic drag, the overall ventilation drag of the HDV investigated numerically is to be compared to the aerodynamic coefficient determined in the road test. For this purpose, the driving test results from [3] and the corresponding determination of the drag coefficients are adopted.
To analyze the contribution of the overall ventilation drag, predefined wheel configurations are taken into account, which are usually used in Europe by HDVs. As shown in Figure 12, these are wheel setups with different tire combinations on the various axles. Setups 2 and 3 represent the most common combinations mounted on commercial vehicles on European roads.
The determination of the overall ventilation drag of a HDV is formed from the sum of the contributions of the wheels mounted on the vehicle. In accordance with this, the total ventilation drag of the tractor-trailer configurations from Figure 12 is determined by adding the individual contribution of the respective wheel configuration, which are listed in Table 3.
Table 4 presents the total ventilation drag of the respective setups . The results of the total ventilation drag of the respective setups are referenced to the ventilation drag of setup 1 (). They show that mounting treaded tires on the rear axle (setup 2) causes a 58% increase of the total ventilation drag. Likewise, the complete fitting of the wheels with treaded tires (setup 3) causes an increase in ventilation drag of 229% compared to a configuration with longitudinal grooves only (setup 1).
To compare the aerodynamic drag and the ventilation drag, it is possible to define the ventilation drag in the same way as the aerodynamic drag force:
where is the reference frontal area of the vehicle and represents the air density. Since both the ventilation drag coefficient and the drag coefficient , refer to the same frontal area and driving situation, they can be directly compared.
To estimate the contribution of the ventilation drag on the total aerodynamic drag of the HDV, the reference drag coefficient multiplied by the frontal area obtained by means of constant-speed testing in [3] is taken into account. Due to the used measurement procedure includes the ventilation drag. To estimate the contribution of the ventilation drag to the total aerodynamic drag of the HDV, the following ratio is used:
In Table 5, the contribution of the ventilation drag of the different HDV setups from Figure 12 are shown according to Equation (5). It can be seen that the ventilation drag represents 1.3–4.1% of the total aerodynamic drag for European tractor-trailer configurations depending on the tire setup. These results also help to quantify the deviation between the certification values from on-road testing and the commonly used development tools (wind tunnel and CFD) when neglecting ventilation drag.
4. Conclusions
The aim of this paper was to quantify the contribution of the ventilation drag to the total aerodynamic drag of a European tractor-trailer. To this end, a CFD approach for analyzing the ventilation drag in CFD was introduced and validated by means of wind tunnel tests. The CFD approach allows the investigation of different tire treads and rim geometries. The results show the influence on the ventilation drag and also allowed the study of the most common tire combinations mounted on HDV in European roads.
To validate the CFD approach, a 1:4.5 scale quarter tractor-trailer model was manufactured and investigated in the Model Scale Wind Tunnel of the University of Stuttgart. Ventilation drag measurements and flow field measurements on different HDV scale wheel configurations were undertaken. The numerical results showed a very good agreement with the experiments. Furthermore, the CFD approach exhibited a high sensitivity allowing to reproduce the tendencies due to the different treads and rim shapes observed in the wind tunnel testing.
The numerical investigation of the ventilation drag of a full scale tractor-trailer was carried out on a configuration with a detailed tractor with 3-axle semi-trailer. The selected wheels were 315/70 R 22.5 and their tires were represented deformation-free in CFD. The boundary and inflow conditions were specified in accordance with the flow situation from the road test.
The influence of different treaded tires on the ventilation drag was analyzed. It was shown that profiled tread patterns increase the ventilation drag regardless of the rim shape and axle type. Flow-exposed wheels such as those on the trailer axle experience an increase of the ventilation drag by up to 250% when mounting profiled tread tires in comparison to grooved ones. However, the treaded pattern leads to an increase of the ventilation drag of 180% on shielded wheels through the wheelhouse as front wheels and twin wheels on the rear axle.
The contribution of the ventilation drag on the total aerodynamic drag was analyzed by comparing the overall ventilation drag of the tractor-trailer determined numerically with the aerodynamic coefficient from the road test. Three tractor-trailer configurations with standard rims and different tire combinations on their axles, which are commonly found on European roads, were investigated. It was shown that the ventilation drag represents 1.3% of the total aerodynamic drag when fitting grooved tires in all wheels, while it can reach 4.1% for a fully treaded tire configuration. The ventilation drag of a third tractor-trailer configuration, which only had tread tires on the twin wheels on the rear axle, represents 2% of the total aerodynamic drag. This means an increase of the ventilation of 59% compared to a fully grooved tire configuration, which can grow up to 229% in the case of a fully treaded configuration and underlines the importance of the tread topology on the ventilation drag.
Author Contributions
C.P.F. established the paper’s concept, prepared, performed and evaluated the experiments/simulations, and drafted this paper. D.S. had input in the conceptual stage and proofread the paper. T.K. is the immediate supervisor and also had input in the conceptual stage and proofread the paper. A.W. is the doctoral adviser of C.P.F. and gave valuable input during the process. All authors have read and agreed to the published version of the manuscript.
Funding
This research was funded by German Research Association of Automotive Technology (FAT).
Data Availability Statement
Data not available due to privacy.
Conflicts of Interest
The authors declare no conflict of interest.
Abbreviations
| IFS | Institut für Fahrzeugtechnik, University of Stuttgart |
| FAT | Forschungsvereinigung Automobiltechnik e.V. |
| CAE | Computer Aided Engineering |
| CAD | Computer Aided Design |
| CFD | Computational Fluid Dynamics |
| PIV | Particle Image Velocimetry |
| HDV | Heavy Duty Vehicles |
| VLES | Very Large Eddy Simulation |
| Reynolds number | |
| Force (N) | |
| ) | |
| Drag coefficient | |
| Ventilation drag | |
| T | Temperature (K) |
| ) | |
| Local strain parameter (-) | |
| ) | |
| ) | |
| Relaxation time (-) |
Appendix A
Figure A1.
Volume discretization of the scale model: (a) Refinement regions with local voxel sizes of 12 mm, 6 mm, 1.5 mm, and offset regions with 0.375 mm resolution (pink); (b) Voxel grids for the cross section of the front wheel.
Figure A1.
Volume discretization of the scale model: (a) Refinement regions with local voxel sizes of 12 mm, 6 mm, 1.5 mm, and offset regions with 0.375 mm resolution (pink); (b) Voxel grids for the cross section of the front wheel.
References
- European Parliament and Council. Setting CO2 emission performance standards for new heavy-duty vehicles and amending Regulations (EC) No 595/2009 and (EU) 2018/956. In EU Commission Regulation; European Parliament and Council: Brussels, Belgium, 2019. [Google Scholar]
- Rodriguez, J.F.; Delgado, O.; Demirgok, B.; Baki, C. Heavy-Duty Aerodynamic Testing for CO2 Certification: A Methodology Comparison; SAE Technical Paper 2019-01-0649; SAE International: Warrendale, PA, USA, 2019. [Google Scholar]
- Peiró Frasquet, C.; Kuthada, T.; Wagner, A.; Wiedemann, J. Analyse der Einflussfaktoren auf die Abweichung zwischen CFD und Fahrversuch bei der Bestimmung des Luftwiderstands von Nutzfahrzeugen. In FAT-Schriftenreihe 330; Forschungsvereinigung Automobiltechnik e.V.: Berlin, Germany, 2020. [Google Scholar]
- Wiedemann, J. The Influence of the Ground Simulation and Wheel Rotation on Aerodynamic Drag Optimization–Potential for Reducing Fuel Consumption. SAE Tech. Pap. 1996, 105, 810–819. [Google Scholar]
- Pfadenhauer, M.; Wickern, G.; Zwicker, K. On the influence of wheels and tyres on the aerodynamic drag of the vehicles. In Proceedings of the MIRA International Conference on Vehicle Aerodynamics, Gaydon, UK, 25–26 October 1996. [Google Scholar]
- Mayer, W.; Wiedemann, J. The Influence of Rotating Wheels on Total Road Load. SAE Tech. Pap. 2007, 116, 1100–1108. [Google Scholar]
- Vdovin, A.; Bonitz, S.; Landstrom, C.; Lofdahl, L. Investigation of Wheel Ventilation-Drag using a Modular Wheel Design Concept. SAE Int. J. 2013, 6, 308–315. [Google Scholar] [CrossRef]
- Link, A. Analyse, Messung und Optimierung des aerodynamischen Ventilationswiderstands von Pkw-Rädern. In Doktorarbeit; Springer Fachmedien Wiesbaden: Wiesbaden, Germany, 2018. [Google Scholar]
- Link, A.; Wittmeier, F.; Kuthada, T.; Widdecke, N.; Wiedemann, J. Bestimmung des aerodynamischen Ventilationswiderstands von Pkw-Rädern. In Proceedings of the Tagung Fahrzeugaerodynamik, Haus der Technik, München, Germany, 5 July 2016. [Google Scholar]
- Vdovin, A.; Lofdahl, L.; Sebben, S. Investigation of Wheel Aerodynamic Resistance of Passenger Cars. SAE Int. J. 2014, 7, 639–645. [Google Scholar] [CrossRef]
- Devesa, A.; Indinger, T. Fuel Consumption Reduction by Geometry Variations on a Generic Tractor-Trailer Configuration. SAE Int. J. Commer. Veh. 2012, 5, 18–28. [Google Scholar] [CrossRef]
- Peiró Frasquet, C.; Indinger, T. Numerische Untersuchungen zur Aerodynamik von Nutzfahrzeugkombinationen bei realitätsnahen Fahrbedingungen unter Seitenwindeinfluss. In FAT-Schriftenreihe 281; Forschungsvereinigung Automobiltechnik e.V.: Berlin, Germany, 2013. [Google Scholar]
- Peiró Frasquet, C.; Kuthada, T.; Wagner, A.; Wiedemann, J. Analyse der Einflussfaktoren auf die Abweichung zwischen CFD und Fahrversuch bei der Bestimmung des Luftwiderstands von Nutzfahrzeugen mit Fokus auf den Ventilationswiderstand von Nfz-Rädern. In FAT-Schriftenreihe 359; Forschungsvereinigung Automobiltechnik e.V.: Berlin, Germany, 2022. [Google Scholar]
- Wittmeier, F. The Recent Upgrade of the Model Scale Wind Tunnel of University of Stuttgart. SAE Int. J. Passeng. Cars Mech. Syst. 2017, 10, 203–213. [Google Scholar] [CrossRef]
- Parpais, S.; Farce, J.; Bailly, O.; Genty, H. A Comparison of Experimental Investigations and Numerical Simulations around Two-box form Models. In 4th MIRA International Vehicle Aerodynamics Conference; MIRA: Warwick, RI, USA, 2002. [Google Scholar]
- Fischer, O.; Kuthada, T.; Wiedemann, J.; Dethioux, P. CFD Validation Study for a Sedan Scale Model in an Open Jet Wind Tunnel; SAE International: Warrendale, PA, USA, 2008. [Google Scholar]
- Kandasamy, S.; Duncan, B.; Gau, H.; Maroy, F. Aerodynamic Performance Assessment of BMW Validation Models using Computational Fluid Dynamics; SAE International: Warrendale, PA, USA, 2012. [Google Scholar]
- Krüger, T.; Kusumaatmaja, H.; Kuzmin, A.; Shardt, O.; Silva, G.; Viggen, E.M. The Lattice Boltzmann Method: Principles and Practice; Springer International Publishing: Cham, Switzerland, 2017. [Google Scholar]
- Kotapati, R.; Keating, A.; Kandasamy, S.; Duncan, B.; Shock, R.; Chen, H. The Lattice-Boltzmann-VLES Method for Automotive Fluid Dynamics Simulation, a Review. In SAE Technical Paper; 2009-26-0057; Springer: Berlin/Heidelberg, Germany, 2009. [Google Scholar]
- Pervaiz, M.M.; Teixeira, C.M. Two equation turbulence modeling with the lattice-Boltzmann method. ASME Publ. PVP 1999, 397, 15–24. [Google Scholar]
- Demirdžić, I.; Perić, M. Finite volume method for prediction of fluid flow in arbitrarily shaped domains with moving boundaries. Int. J. Numer. Methods Fluids 1990, 10, 771–790. [Google Scholar] [CrossRef]
- Mittal, R.; Iaccarino, G. Immersed Boundary Methods. Annu. Rev. Fluid Mech. 2005, 37, 239–261. [Google Scholar] [CrossRef]
- Peiró Frasquet, C.; Indinger, T. Bestimmung des Luftwiderstandsbeiwerts von realen Nutzfahrzeugen im Fahrversuch und Vergleich verschiedener Verfahren zur numerischen Simulation. In FAT-Schriftenreihe 298; Forschungsvereinigung Automobiltechnik e.V.: Berlin, Germany, 2017. [Google Scholar]
- SIMULIA® PowerFLOW® Best Practices Guide for External Aerodynamics. In Dassault Systèmes Restricted-Use Material; PowerFLOW®: London, UK, 2017.
Figure 1.
Quarter vehicle model of a HDV: (a) Geometry for CFD investigations; (b) CAD model for manufacturing; (c) Final model for testing in wind tunnel.
Figure 1.
Quarter vehicle model of a HDV: (a) Geometry for CFD investigations; (b) CAD model for manufacturing; (c) Final model for testing in wind tunnel.
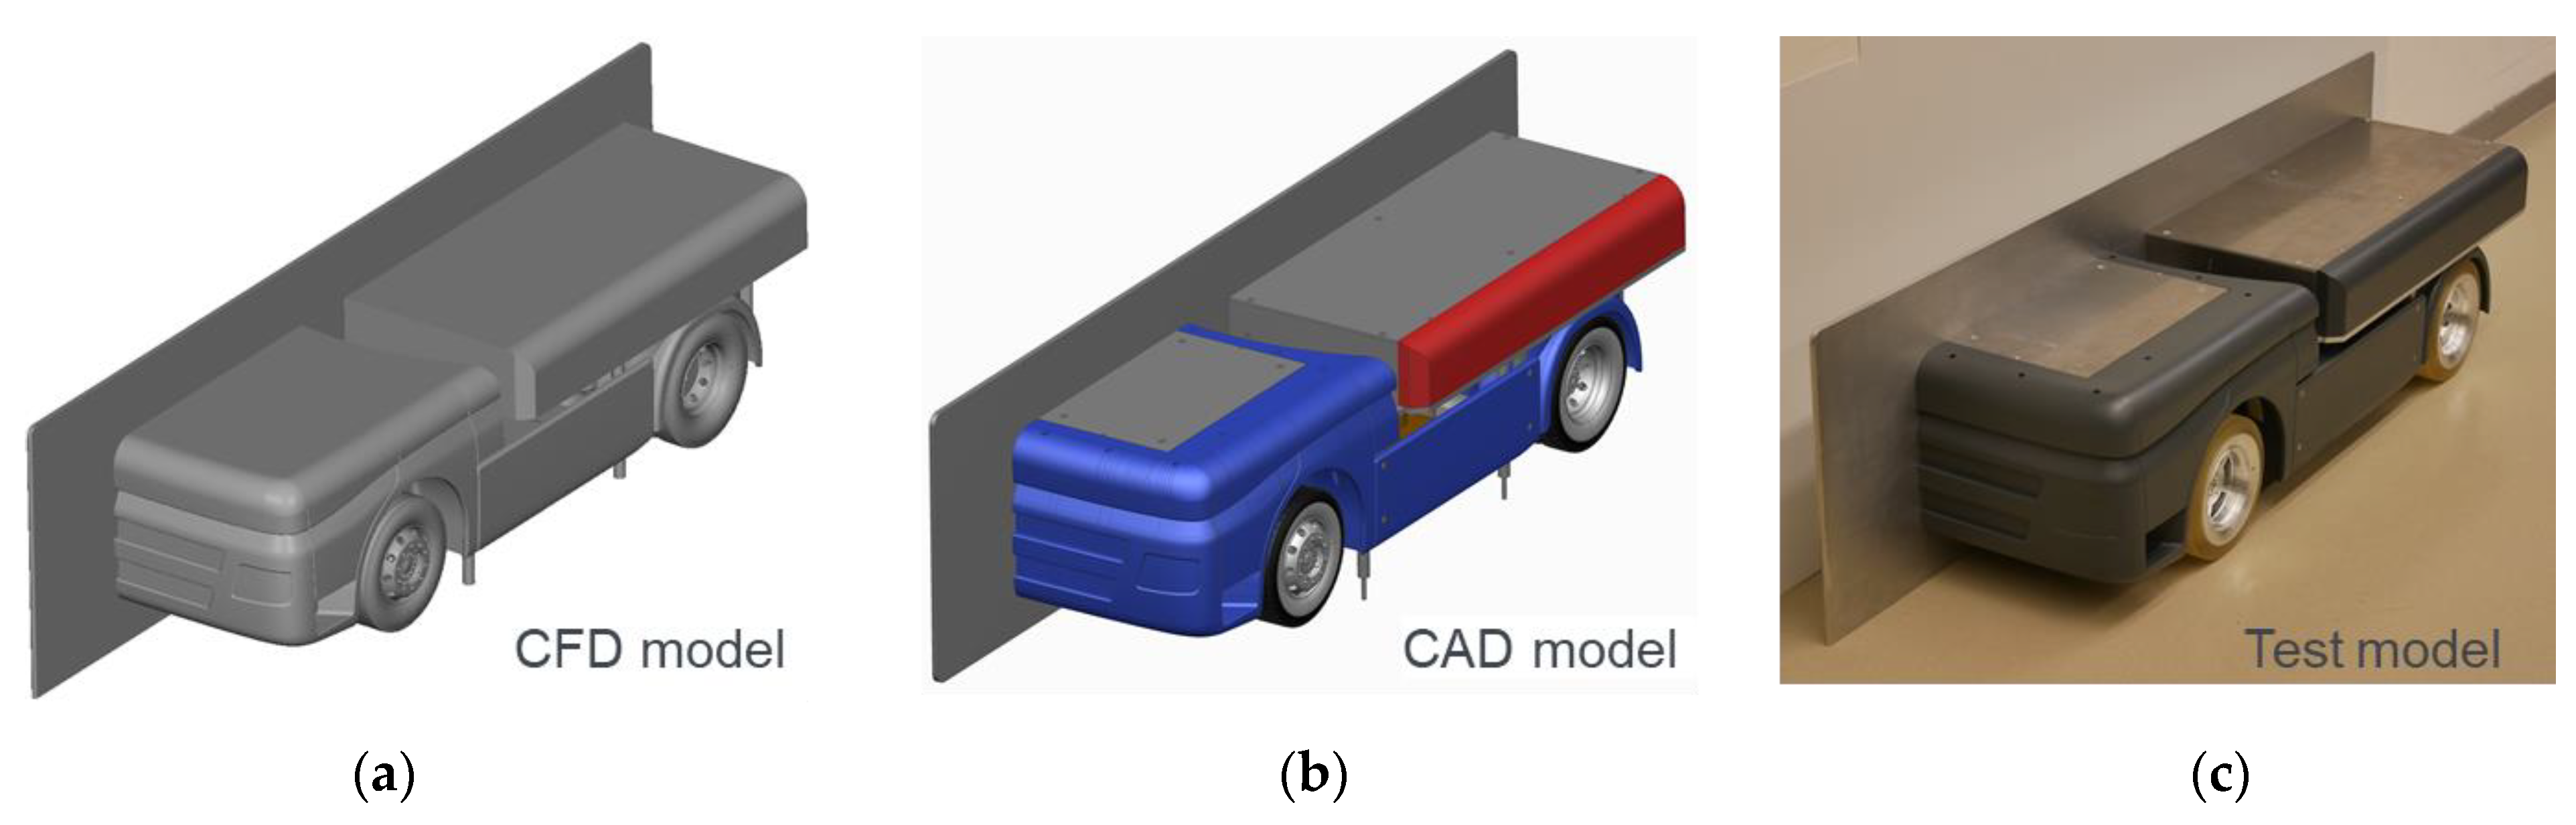
Figure 2.
Front wheel of the vehicle model: (a) Manufactured wheel; (b) Assembly sketch showing the different components of the wheel.
Figure 2.
Front wheel of the vehicle model: (a) Manufactured wheel; (b) Assembly sketch showing the different components of the wheel.

Figure 3.
Investigated tread topologies: (a) Front wheel with longitudinal grooves; (b) Front wheel with treaded pattern.
Figure 3.
Investigated tread topologies: (a) Front wheel with longitudinal grooves; (b) Front wheel with treaded pattern.

Figure 4.
Investigated rim shapes: (a) “Standard” front wheel rim; (b) Flat “eco rim” with ventilation openings based on [10]; (c) Flat “closed rim”.
Figure 4.
Investigated rim shapes: (a) “Standard” front wheel rim; (b) Flat “eco rim” with ventilation openings based on [10]; (c) Flat “closed rim”.
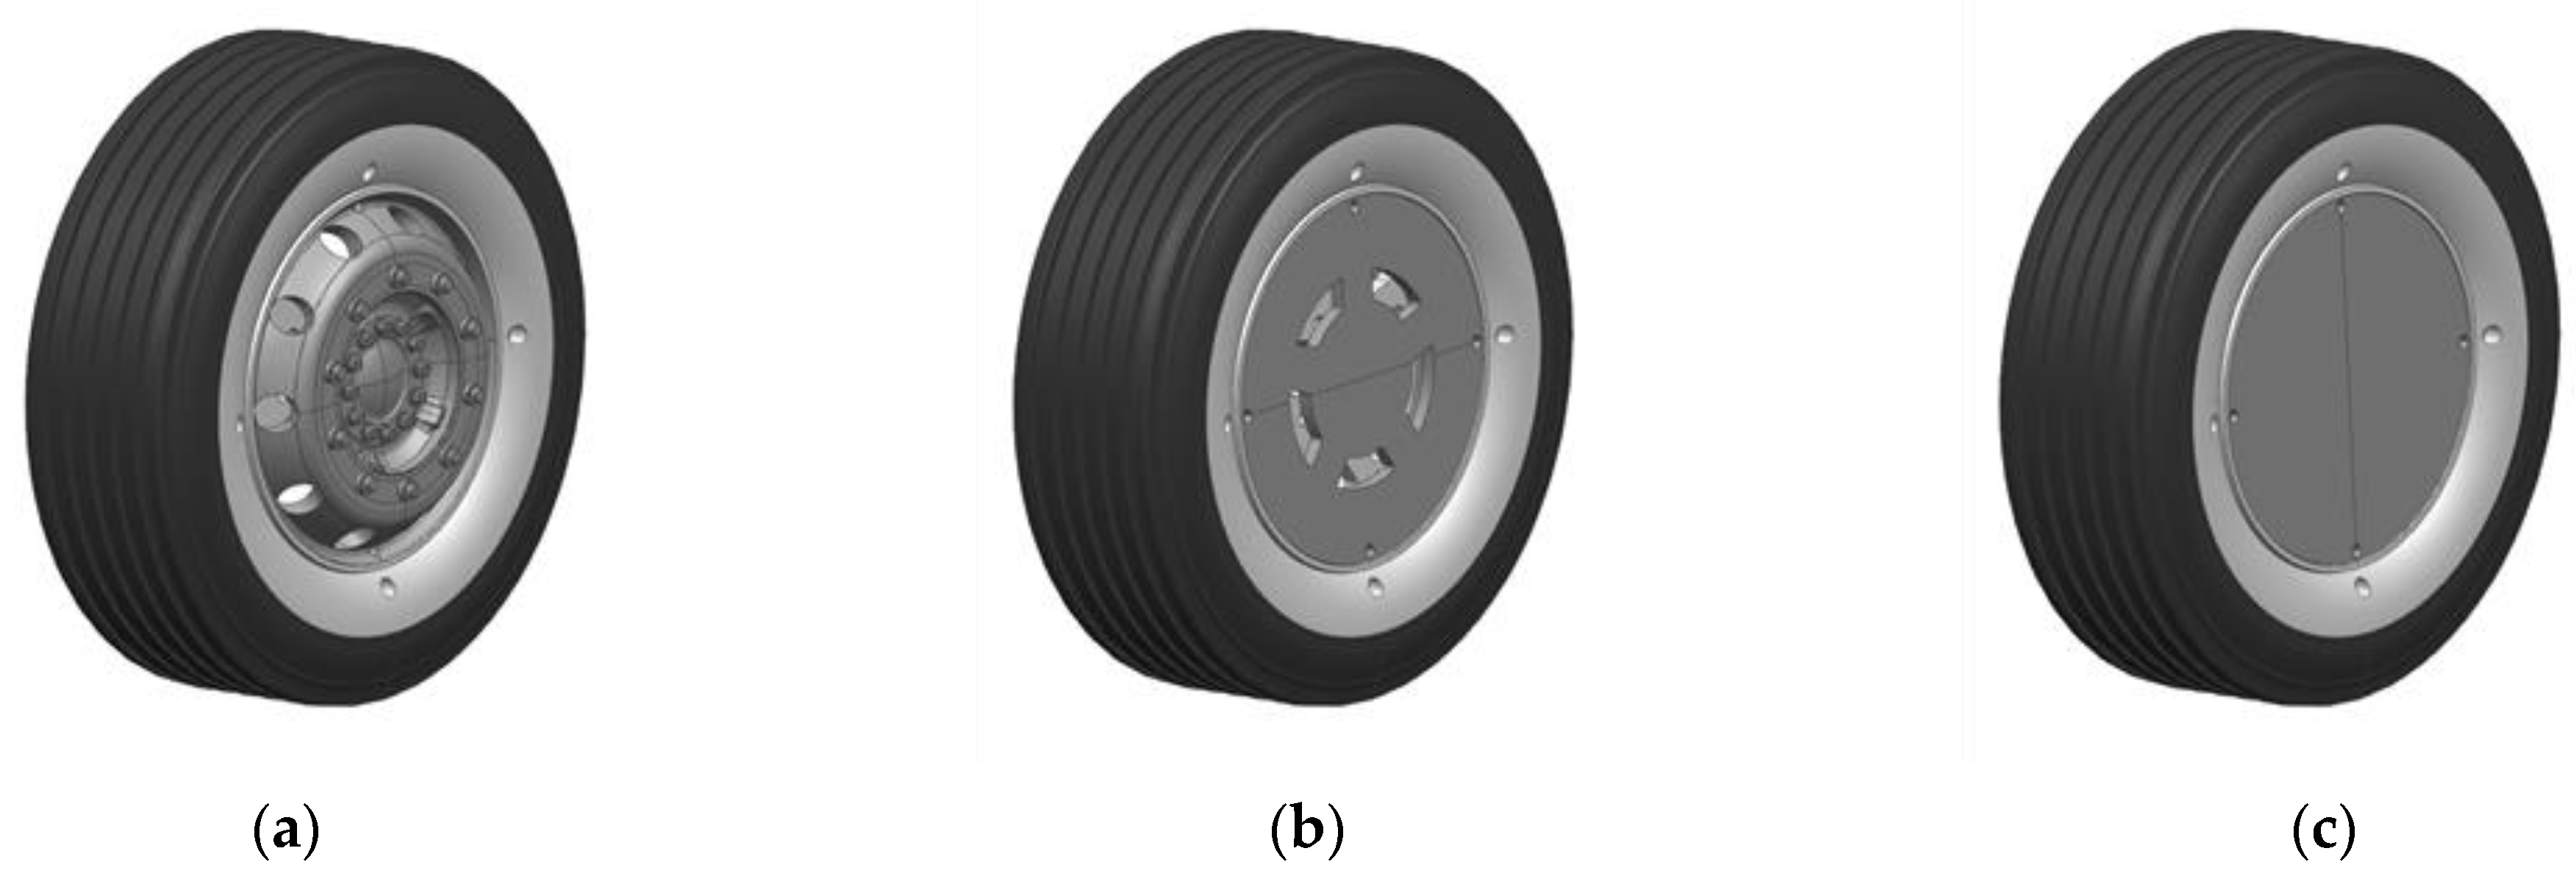
Figure 5.
Wind tunnel measurements: (a) Vehicle model on the test section; (b) Sketch showing the force measurement with the balance.
Figure 5.
Wind tunnel measurements: (a) Vehicle model on the test section; (b) Sketch showing the force measurement with the balance.

Figure 6.
PIV measurements: (a) Schematic representation of plane locations where measurements are taken; (b) Front wheel with low-reflection setup.
Figure 6.
PIV measurements: (a) Schematic representation of plane locations where measurements are taken; (b) Front wheel with low-reflection setup.

Figure 7.
CFD modeling of wheel rotation: (a) Front wheel with longitudinal grooves; (b) Front wheel with treaded pattern.
Figure 7.
CFD modeling of wheel rotation: (a) Front wheel with longitudinal grooves; (b) Front wheel with treaded pattern.
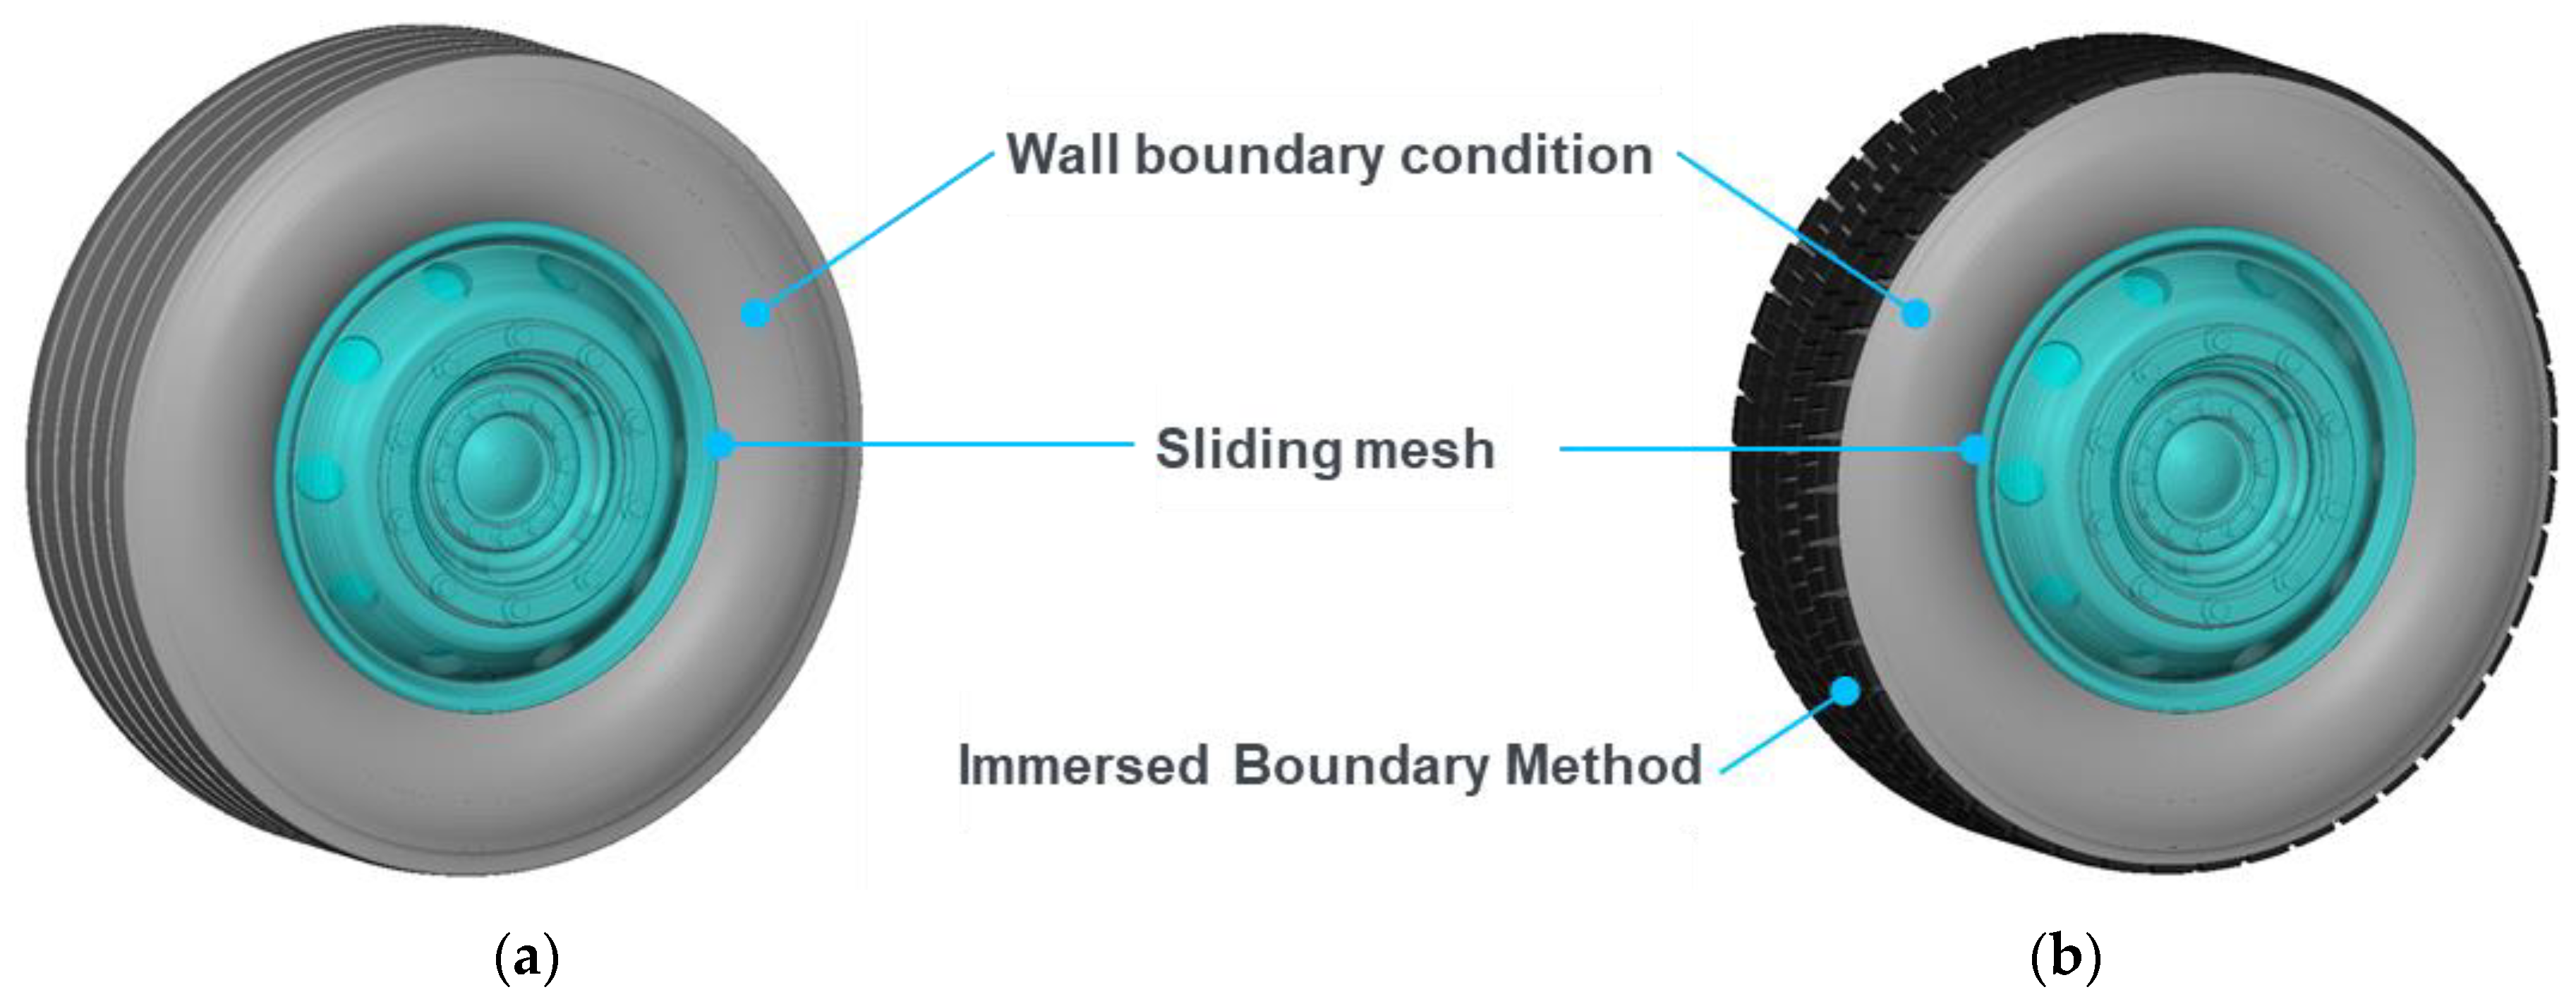
Figure 8.
Flow field comparison: PIV measurements and CFD results on several 340 mm × 150 mm planes for the front wheel with longitudinal grooves and standard rim.
Figure 8.
Flow field comparison: PIV measurements and CFD results on several 340 mm × 150 mm planes for the front wheel with longitudinal grooves and standard rim.
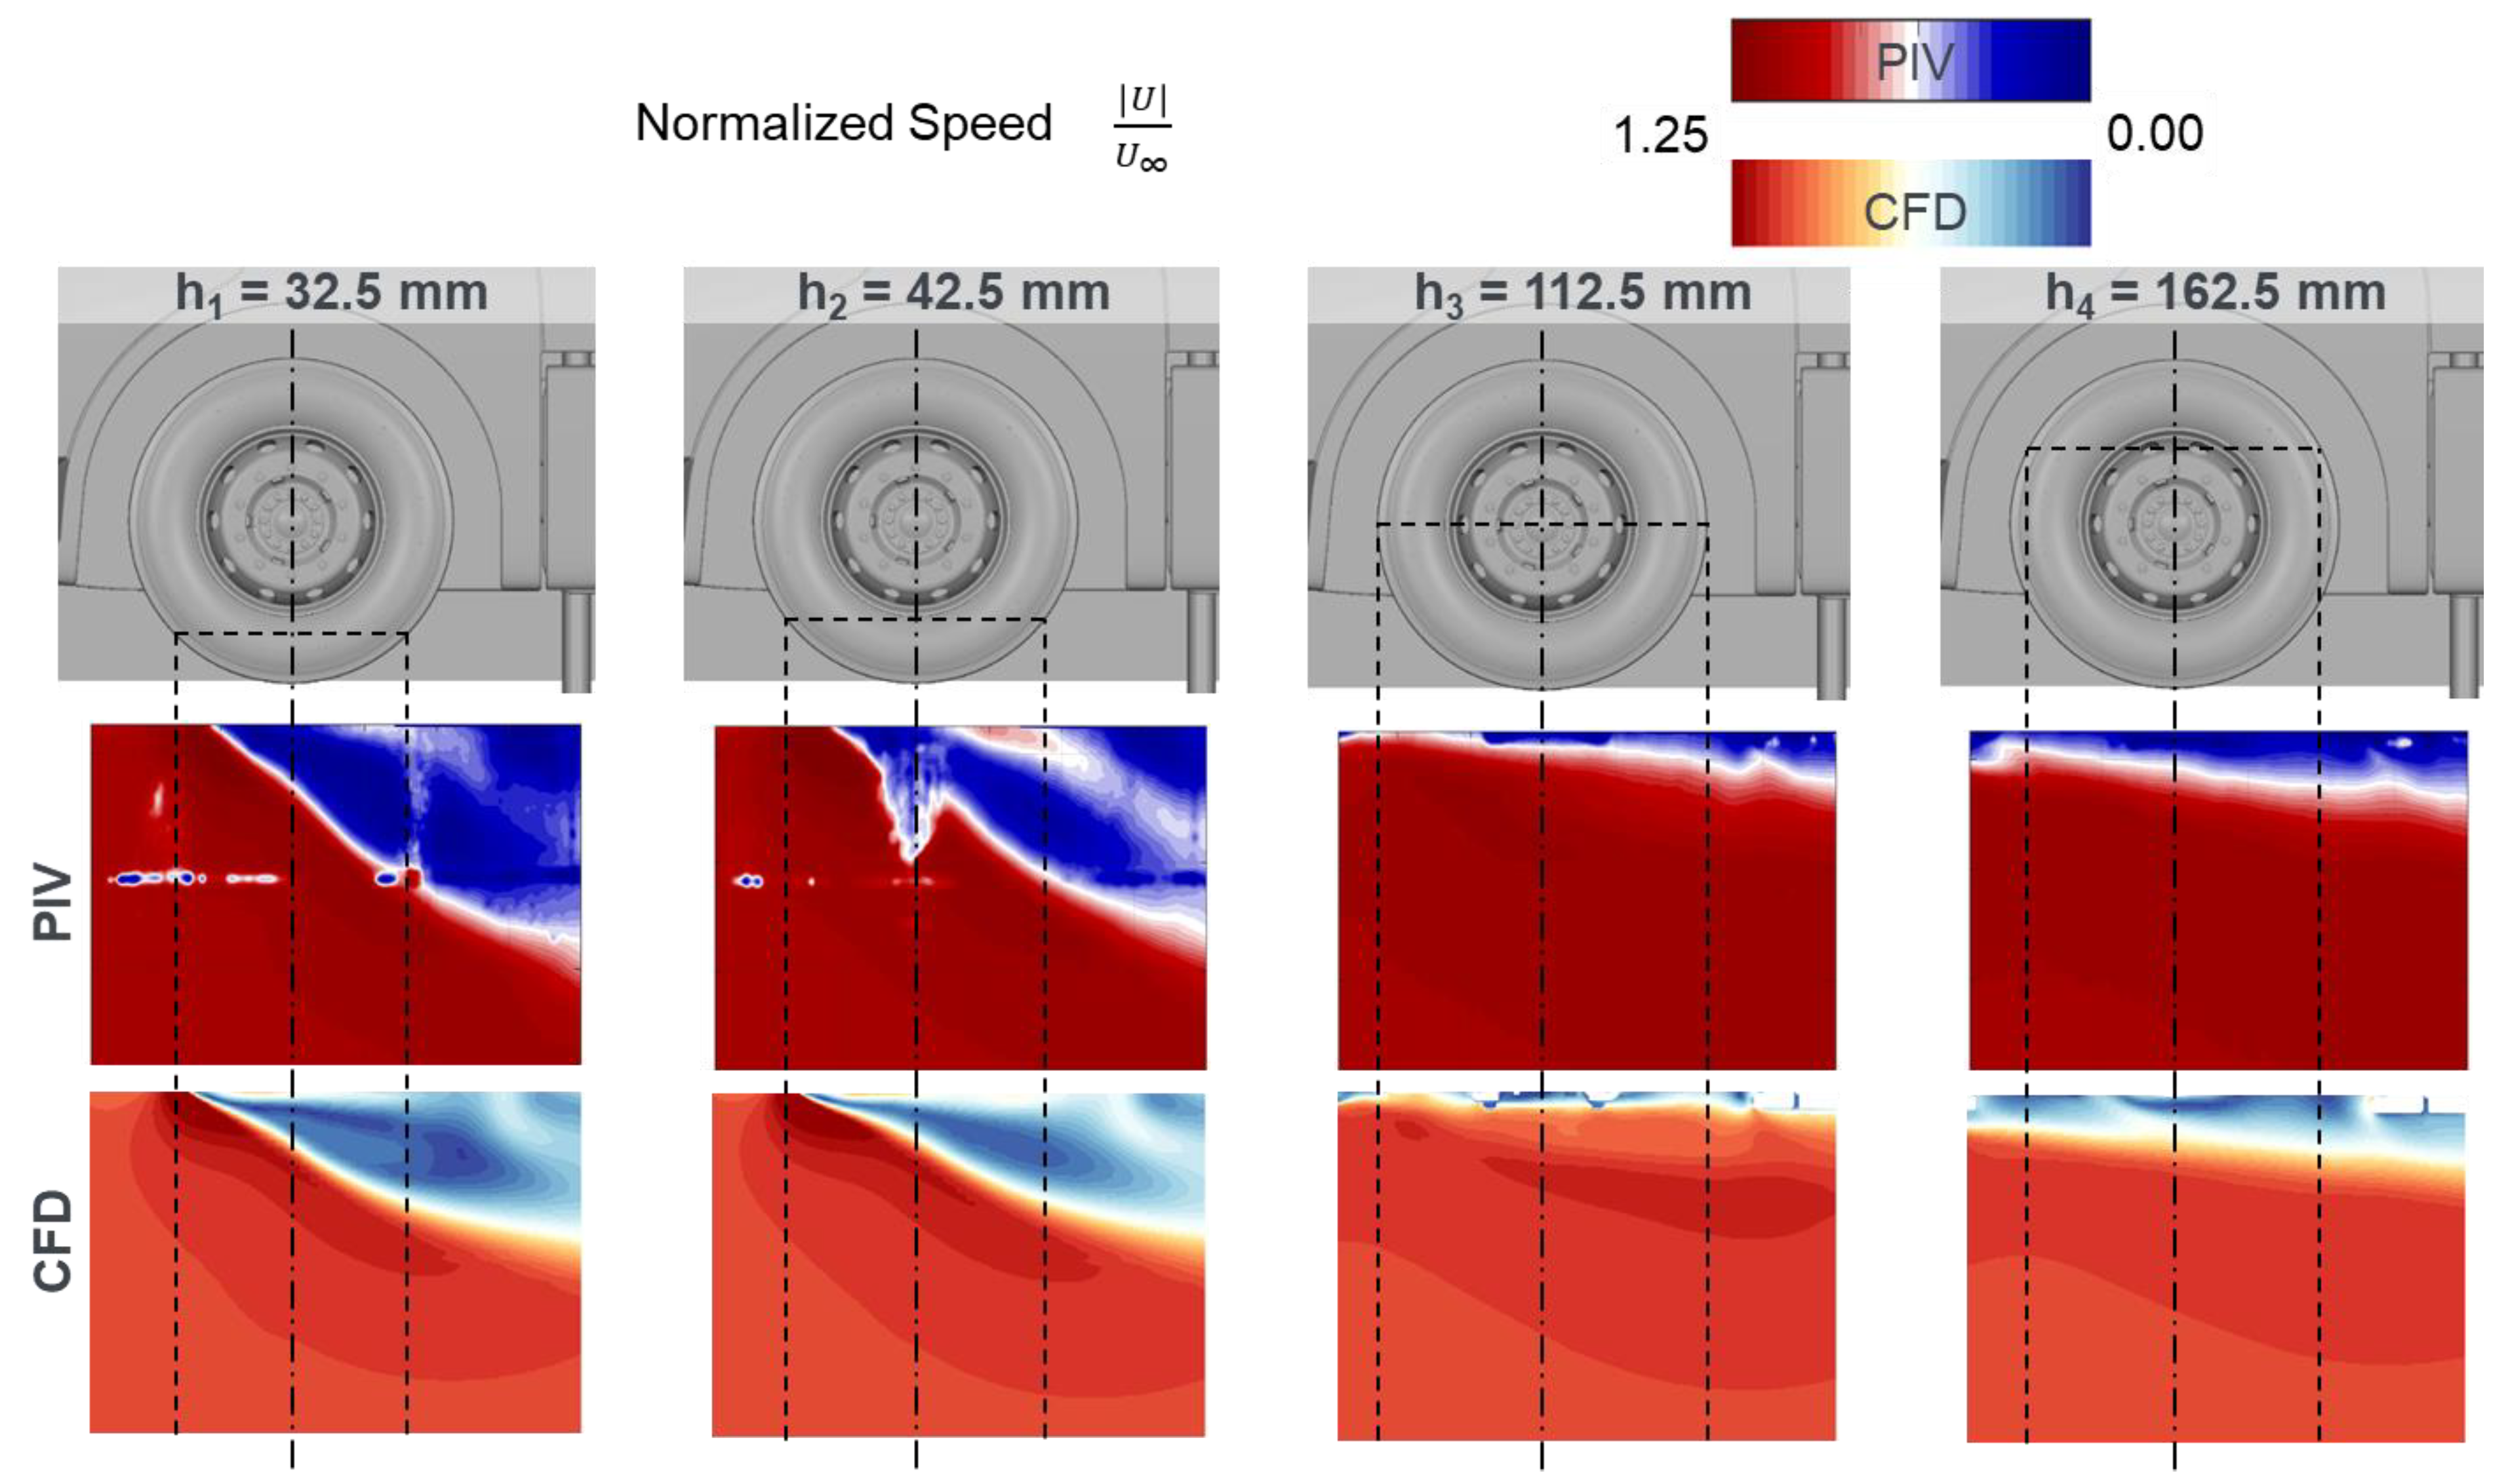
Figure 9.
Flow field comparison: PIV measurements and CFD results at the lower 340 mm × 150 mm plane for the front wheel with different treads and rim shapes. (a) Grooves with standard rim; (b) Grooves with eco rim; (c) Treaded pattern with standard rim; (d) Treaded pattern with eco rim.
Figure 9.
Flow field comparison: PIV measurements and CFD results at the lower 340 mm × 150 mm plane for the front wheel with different treads and rim shapes. (a) Grooves with standard rim; (b) Grooves with eco rim; (c) Treaded pattern with standard rim; (d) Treaded pattern with eco rim.
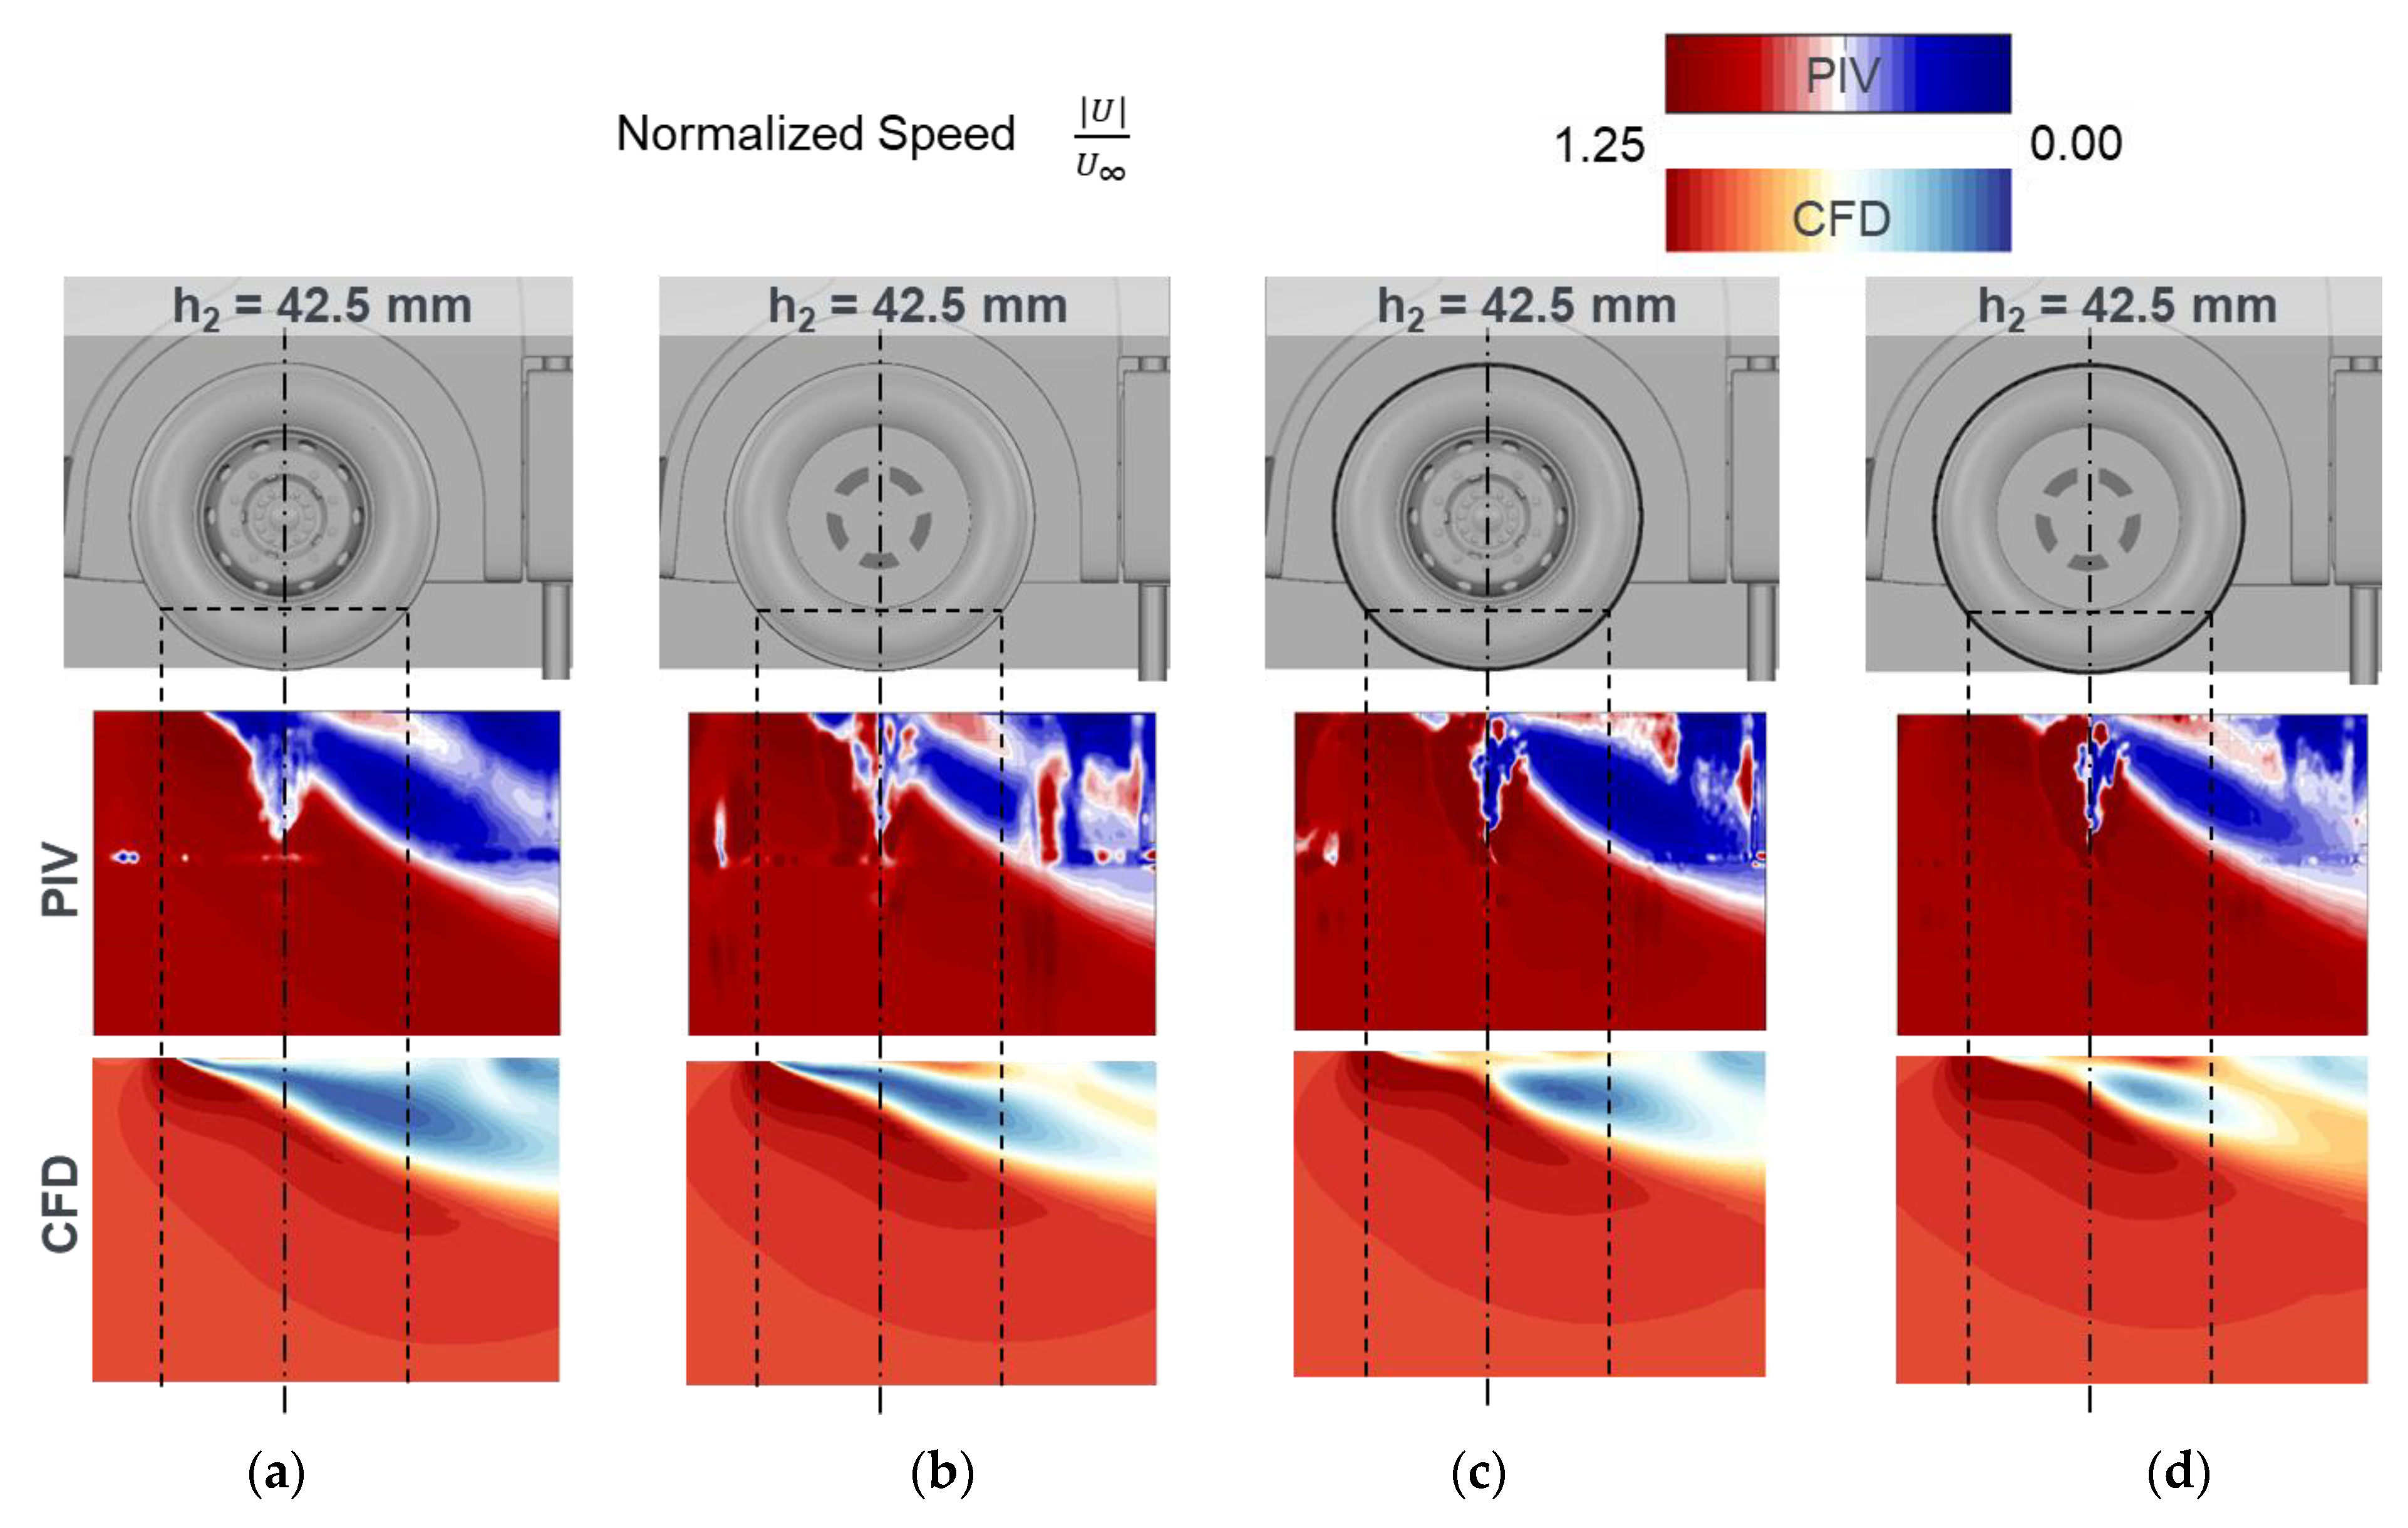
Figure 10.
(a) Vehicle geometry used for the investigations; (b) Local simulation region.

Figure 11.
Flow field comparison: CFD results on three different planes oriented normal to the ground plane for the front wheel.
Figure 11.
Flow field comparison: CFD results on three different planes oriented normal to the ground plane for the front wheel.

Figure 12.
Overview of predefined wheel setups on the HDV depending on the tire type.


Table 1.
Comparison of the measured and simulated ventilation drag of the front wheel for different wheel configurations.
Table 1.
Comparison of the measured and simulated ventilation drag of the front wheel for different wheel configurations.
 | |||||||
|---|---|---|---|---|---|---|---|
| Grooved Standard | Grooved Eco | Grooved Closed | Treaded Standard | Treaded Eco | Treaded Closed | ||
| WT | in N | 0.37 | 0.32 | 0.30 | 1.00 | 0.90 | 0.85 |
| CFD | in N | 0.34 | 0.28 | 0.28 | 1.06 | 0.95 | 1.00 |
Table 2.
Comparison of the measured and simulated ventilation drag of the rear wheel for different wheel configurations.
Table 2.
Comparison of the measured and simulated ventilation drag of the rear wheel for different wheel configurations.
 | |||||||
|---|---|---|---|---|---|---|---|
| Grooved Standard | Grooved Eco | Grooved Closed | Treaded Standard | Treaded Eco | Treaded Closed | ||
| WT | in N | 1.83 | 1.64 | 1.65 | 3.04 | 2.77 | 2.66 |
| CFD | in N | 1.4 | 1.26 | 1.26 | 2.67 | 2.44 | 2.44 |
Table 3.
Normalized ventilation drag of the different wheel configurations at the front axle (FA), the rear axle (RA), and the trailer axle (TA).
Table 3.
Normalized ventilation drag of the different wheel configurations at the front axle (FA), the rear axle (RA), and the trailer axle (TA).
| Grooved | Treaded | |
|---|---|---|
| FA | 1.00 | 2.74 |
| RA | 1.60 | 4.56 |
| TA1 | 0.77 | 3.04 |
| TA2 | 0.82 | 3.12 |
| TA3 | 0.88 | 3.25 |
Table 4.
Total ventilation drag of the different HDV setups from Figure 12 referenced to the setup 1 in percentage.
Table 4.
Total ventilation drag of the different HDV setups from Figure 12 referenced to the setup 1 in percentage.
| Setup 1 | Setup 2 | Setup 3 | |
|---|---|---|---|
| - | 58% | 229% |
Table 5.
Contribution of the ventilation drag to the total aerodynamic drag of the HDV according to Equation (5) of the different wheel setups from Figure 12 in percentage.
Table 5.
Contribution of the ventilation drag to the total aerodynamic drag of the HDV according to Equation (5) of the different wheel setups from Figure 12 in percentage.
| Setup 1 | Setup 2 | Setup 3 | |
|---|---|---|---|
| 1.3% | 2.0% | 4.1% |
Disclaimer/Publisher’s Note: The statements, opinions and data contained in all publications are solely those of the individual author(s) and contributor(s) and not of MDPI and/or the editor(s). MDPI and/or the editor(s) disclaim responsibility for any injury to people or property resulting from any ideas, methods, instructions or products referred to in the content. |
© 2023 by the authors. Licensee MDPI, Basel, Switzerland. This article is an open access article distributed under the terms and conditions of the Creative Commons Attribution (CC BY) license (https://creativecommons.org/licenses/by/4.0/).
Share and Cite
MDPI and ACS Style
Peiró Frasquet, C.; Stoll, D.; Kuthada, T.; Wagner, A. Experimental and Numerical Investigation of the Aerodynamic Ventilation Drag of Heavy-Duty Vehicle Wheels. Fluids 2023, 8, 64. https://doi.org/10.3390/fluids8020064
AMA Style
Peiró Frasquet C, Stoll D, Kuthada T, Wagner A. Experimental and Numerical Investigation of the Aerodynamic Ventilation Drag of Heavy-Duty Vehicle Wheels. Fluids. 2023; 8(2):64. https://doi.org/10.3390/fluids8020064
Chicago/Turabian StylePeiró Frasquet, Carlos, Daniel Stoll, Timo Kuthada, and Andreas Wagner. 2023. "Experimental and Numerical Investigation of the Aerodynamic Ventilation Drag of Heavy-Duty Vehicle Wheels" Fluids 8, no. 2: 64. https://doi.org/10.3390/fluids8020064