Phosphorus Distribution in Delta Sediments: A Unique Data Set from Deer Creek Reservoir


Department of Civil and Environmental Engineering, Brigham Young University, Provo, UT 84602, USA
*
Author to whom correspondence should be addressed.
Hydrology 2018, 5(4), 58; https://doi.org/10.3390/hydrology5040058
Submission received: 28 September 2018
/
Revised: 8 October 2018
/
Accepted: 9 October 2018
/
Published: 11 October 2018
(This article belongs to the Special Issue Water Quality Monitoring in Streams, Rivers, Lakes and Reservoirs: Novel Methods and Applications)
Abstract
:Recently, Deer Creek Reservoir (DCR) underwent a large drawdown to support dam reconstruction. This event exposed sediments inundated by the reservoir, since dam completion in the early 1940s. This event allowed us to take sediment data samples and evaluate them for phosphorous (P) content. It is difficult for normal reservoir sediment studies to have sediment samples at high spatial resolution because of access. During the drawdown, we collected 91 samples on a grid 100 m in one direction and 200 m in the other. This grid defined an area of approximately 750,000 m2 (185 acre). We took both surface samples, and at some sites, vertical samples. We determined water soluble P for all the samples, and P in four other reservoirs or fractions for 19 samples. Results showed water soluble P in the range of 2.28 × 10⁻³ to 9.81 × 10⁻³, KCl-P from 2.53 × 10⁻³ to 1.10 × 10⁻², NaOH-P from 5.30 × 10⁻² to 4.60 × 10⁻¹, HCl-P from 1.28 × 10⁻¹ to 1.34, and residual (mostly organic) P from 8.23 × 10⁻¹ to 3.23 mg/g. We provide this data set to the community to support and encourage research in this area. We hope this data set will be used and analyzed to support other research efforts.
1. Introduction
Detrimental reservoir eutrophication often caused by nutrients affects water use [1,2]. Reservoir water quality managers often limit nutrients, such as phosphorus (P), to the reservoir. This is difficult, as P comes from many sources, including dust particulate matter [1,3,4,5,6,7,8]. Often, these approaches have minimal impact to water quality [9]. One potential reason is sediments that can release P to the water column [9,10,11,12,13,14] reducing the effectiveness of other measures [15]. Reservoirs are susceptible to nutrient recycling because of sediment delta re-cutting and residence times [16].
Most reservoirs do not have any, or at best, have limited data on nutrients in the sediments [17]. Even though P is a major driver of eutrophication, the literature has minimal information on sediment P distributions [18], likely because of the difficulty in collecting these data [1,19]. For most reservoirs, the sediment delta is of higher concern because of the annual drawdown and sediment re-cutting cycle [20,21]. Fabre [22] showed that sediments in the reservoir delta can be resuspended by adding nutrients to the water column. Most reported sediment P studies use a few core samples or laboratory experiments [12,23,24,25,26], and cannot evaluate spatial distribution patterns or impacts.
Deer Creek Reservoir (DCR) is an important water supply reservoir in northern Utah. The reservoir was completed in the early 1940s [27]. Owing to DCR’s importance as a water supply reservoir, researchers and government agencies have performed several water quality studies [28,29,30,31,32].
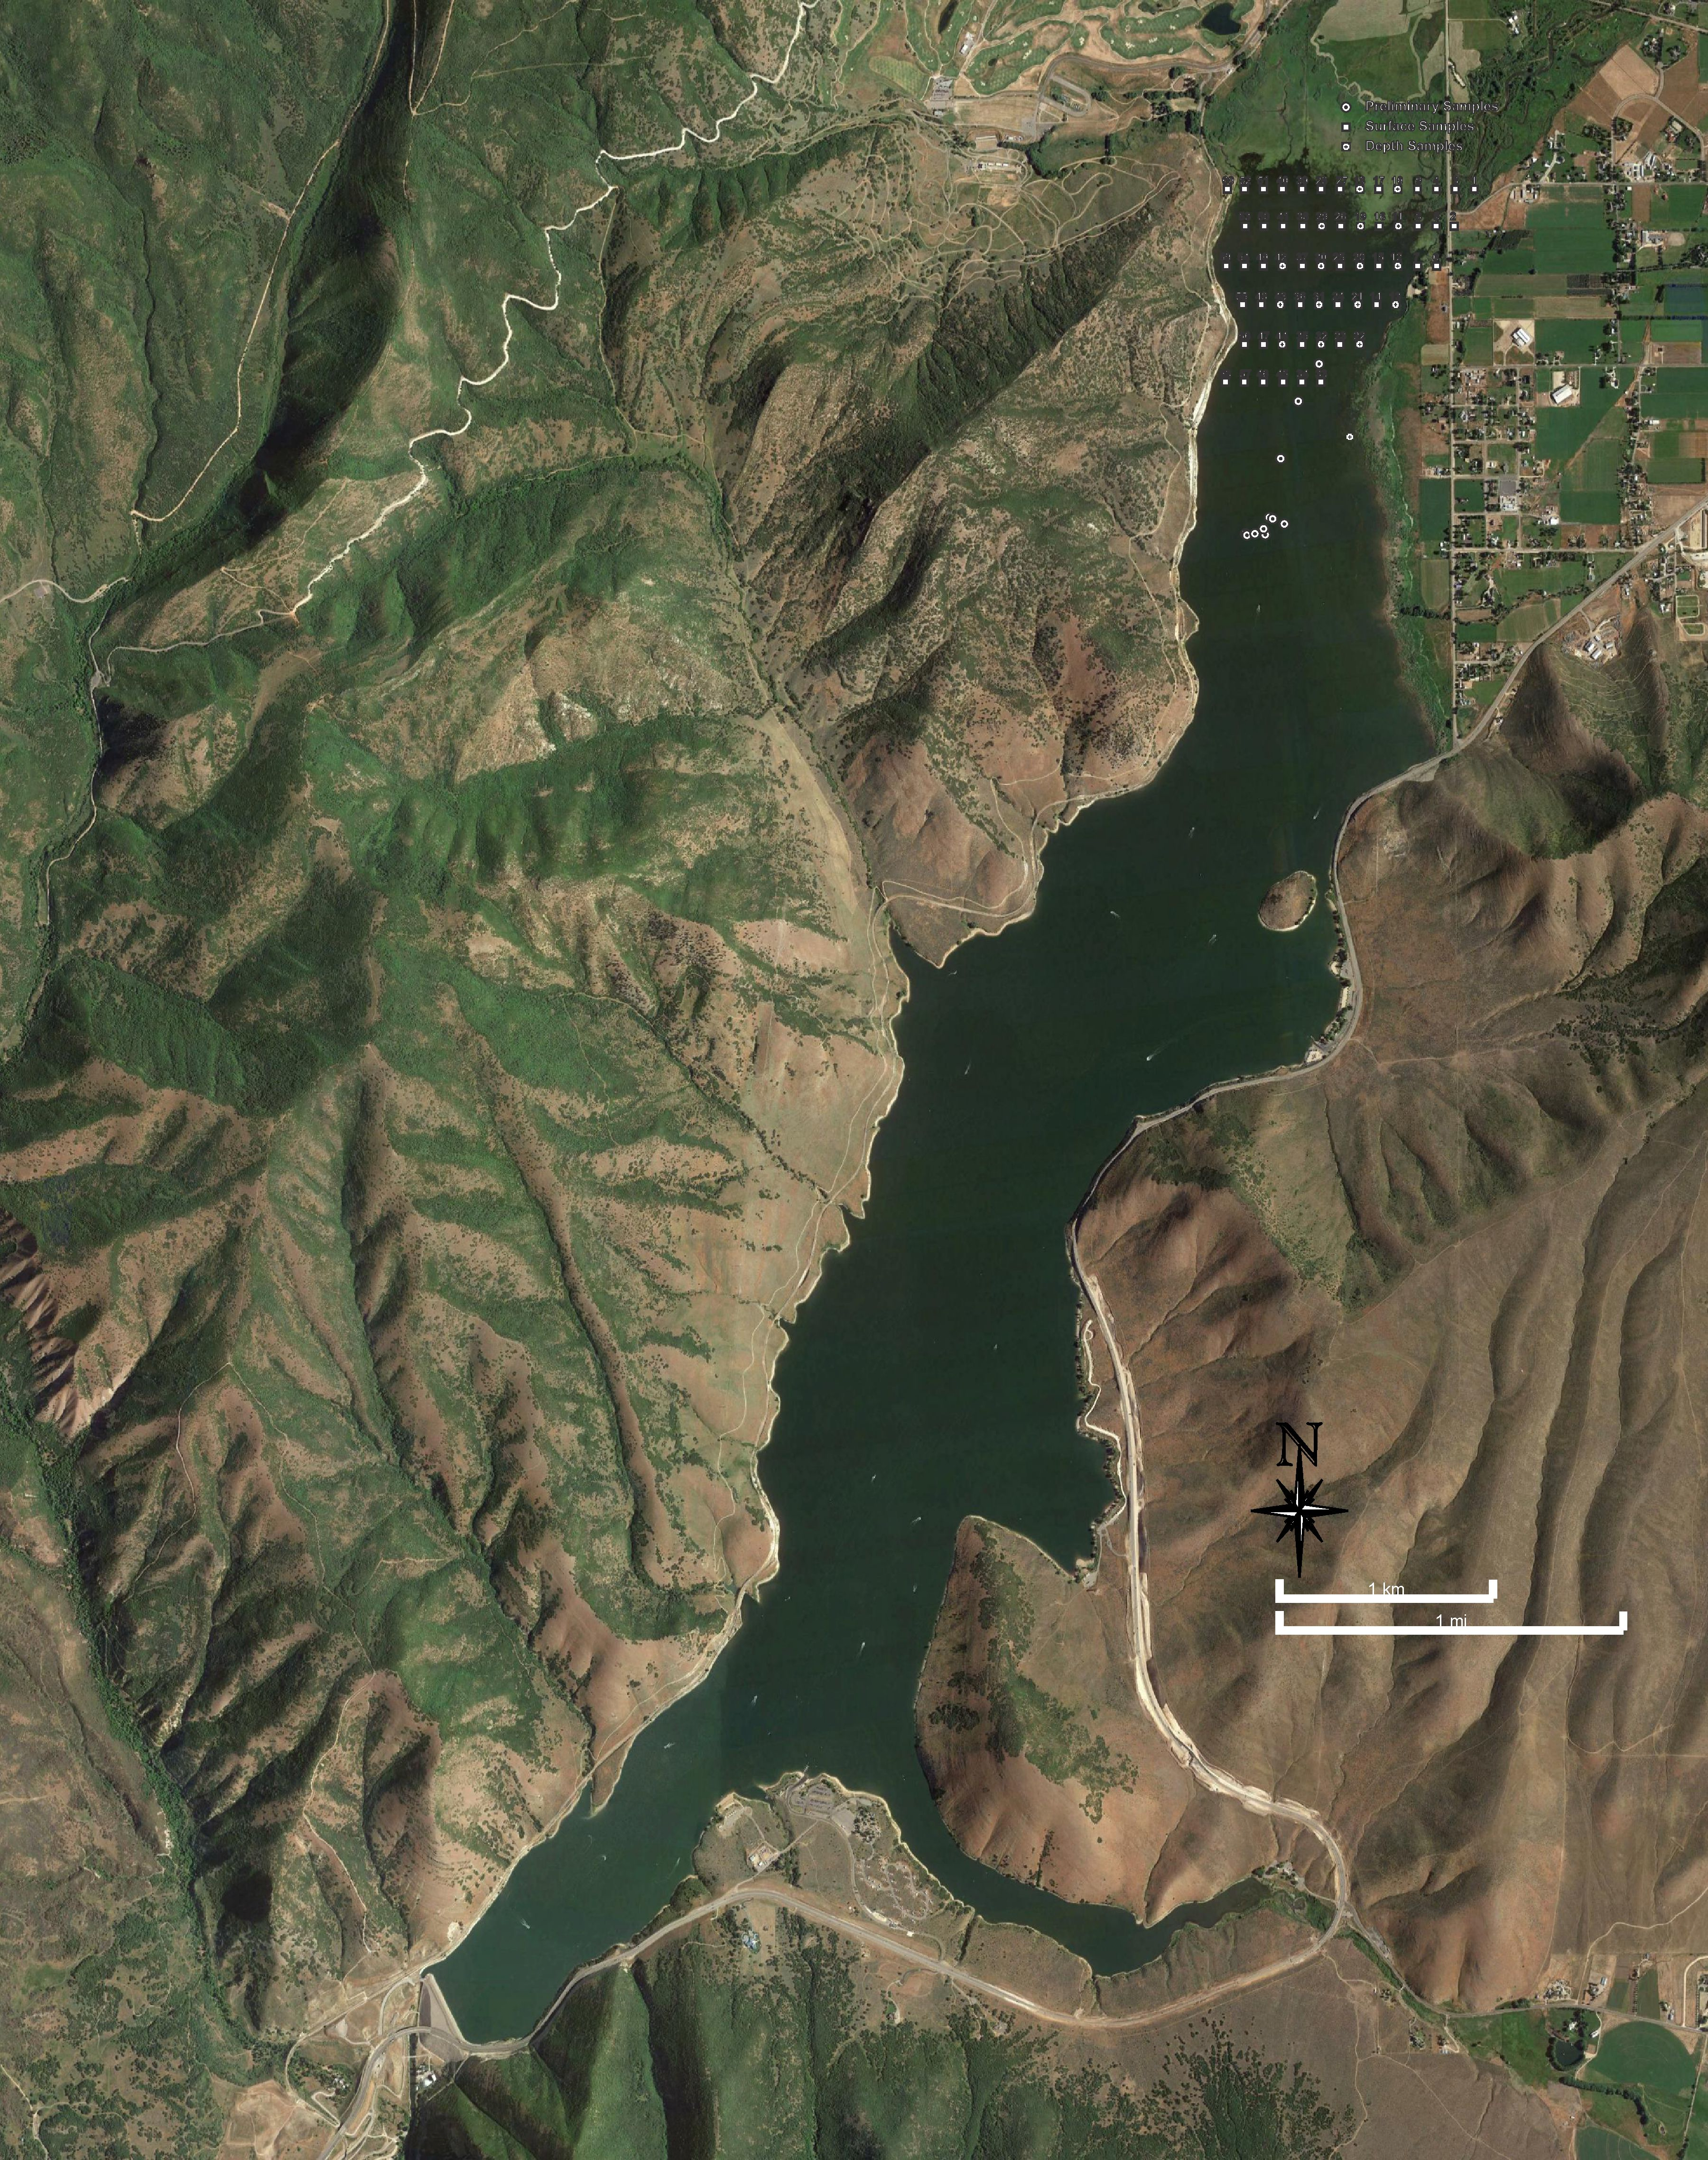
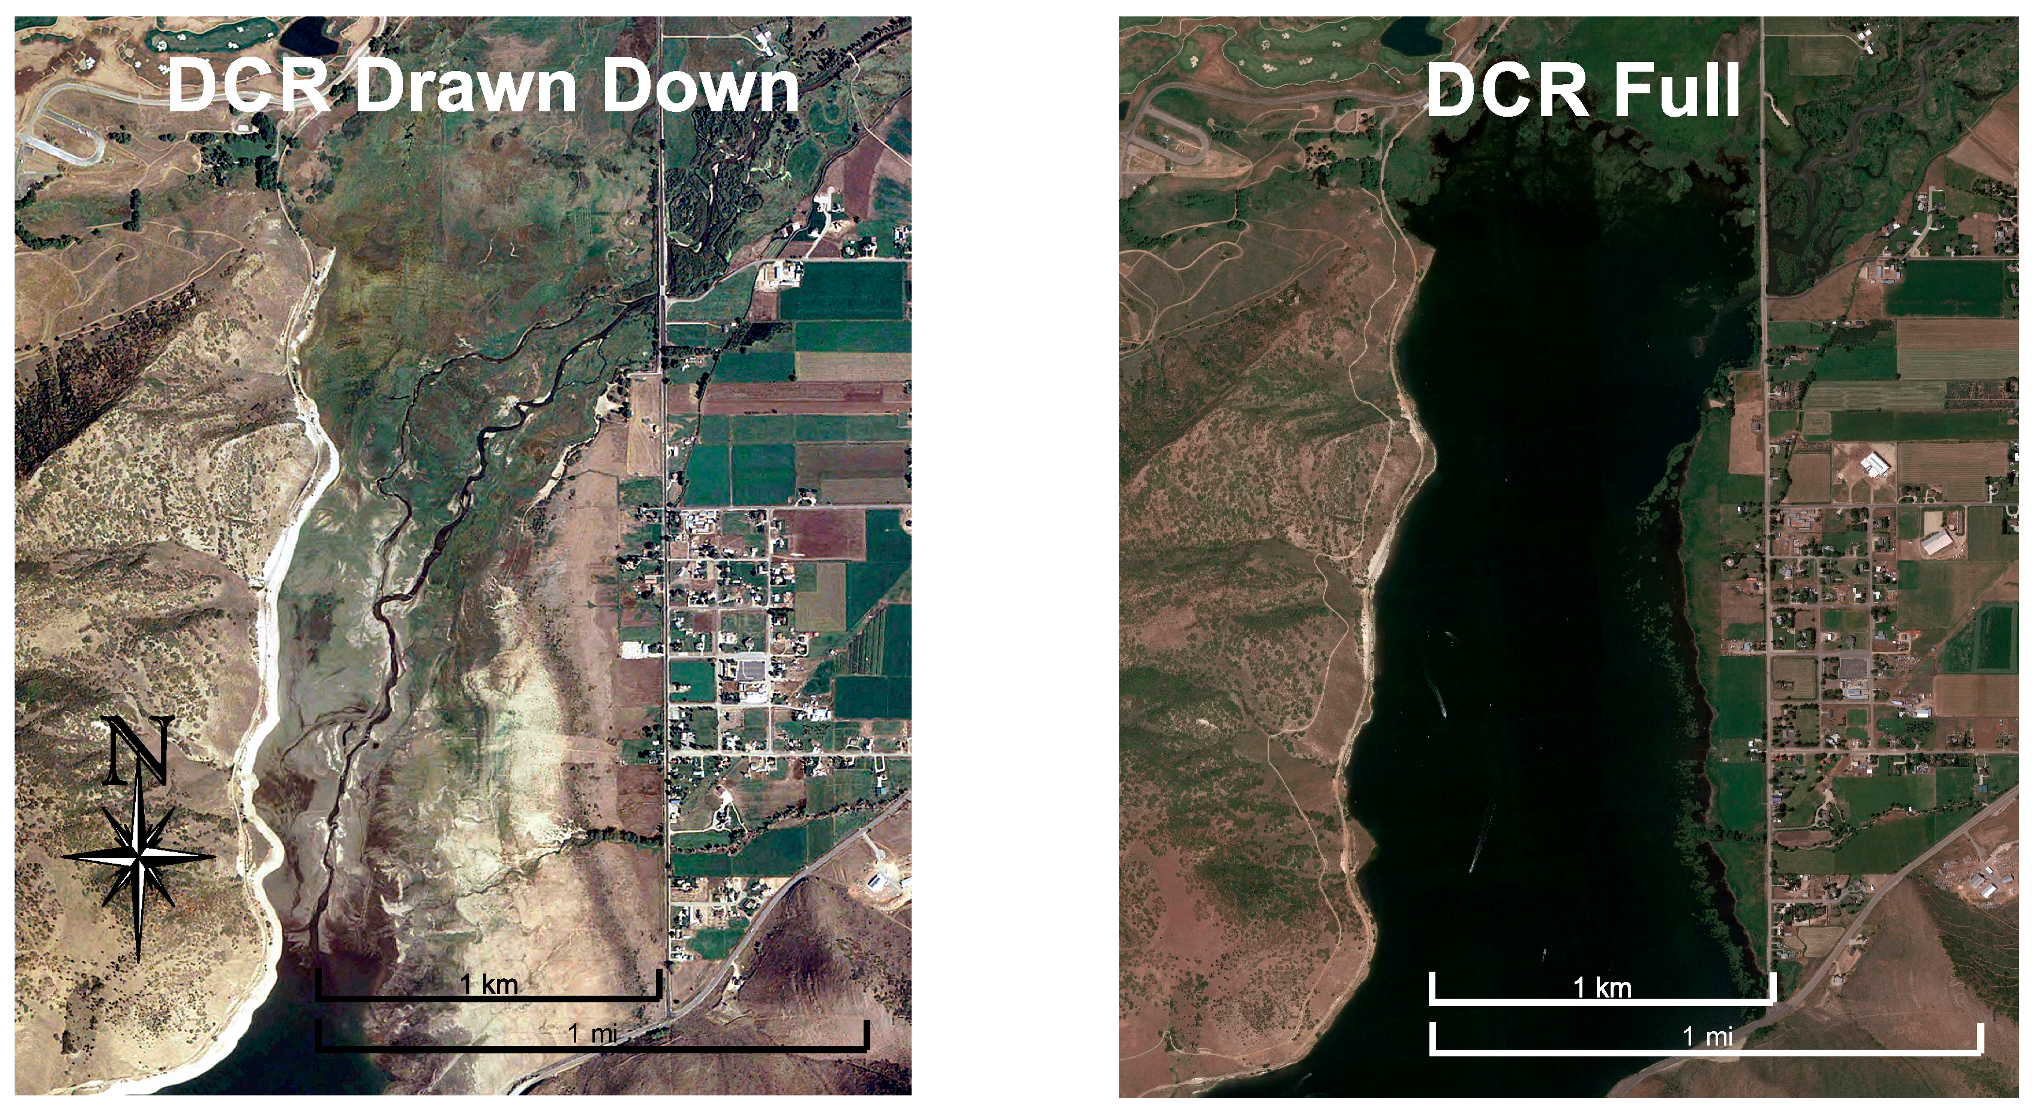
The DCR drawdown for dam reconstruction allowed access to approximately 5 km of the sediment delta that had previously been inundated. This exposed area is shown in Figure 1, and it allowed access to most of the sediment delta. The drawdown, shown in Figure 1, exposed over 5 km of sediments. This allowed for easier sample collection on a high-resolution grid, over a large portion of the sediment delta. There has been another study that evaluated the P distribution in DCR sediments, but it only used 4 locations [33,34]. The previous study did not evaluate spatial distributions, even though the data indicated that there were variations [34]. A historical DCR drawdown in 2001, recut the sediment delta and caused taste and odor problems because of the resulting geosmin release [32]. This indicated that delta re-cutting impacts DCR water quality.
Our work provides field data that is useful for understanding how delta sediments affect nutrient dynamics within the DCR, by quantifying the types and amounts of different P pools across the delta, along with their spatial distribution. We expect this data set will help researchers to generalize this work to other reservoirs with similar problems, because this data set provides a more detailed characterization of P distribution at a higher spatial resolution than normally available. This data set should help researchers address an important area of concern in reservoirs.
We provided this data set, with detailed method descriptions, to the community as a resource to support research into this important topic. Better understanding of the impacts of internal P cycling, and the role played by sediment resuspension and recycling can help reservoir and water quality managers to better address nutrient issues. This work addresses resuspension by providing a high-resolution data set, which includes fractionation results. Understanding P fractionation is important, as much of the P in sediments is not available to the water column on resuspension. We compare our results from samples collected on an exposed sediment delta (exposed for about 1 year) to results from about 25 years earlier, using submerged samples collected in the hypolimnion [34] to provide a very basic insight into potential differences. Both sets of samples were collected in the same region of the reservoir.
2. Collection and Analysis
2.1. Sample Collection
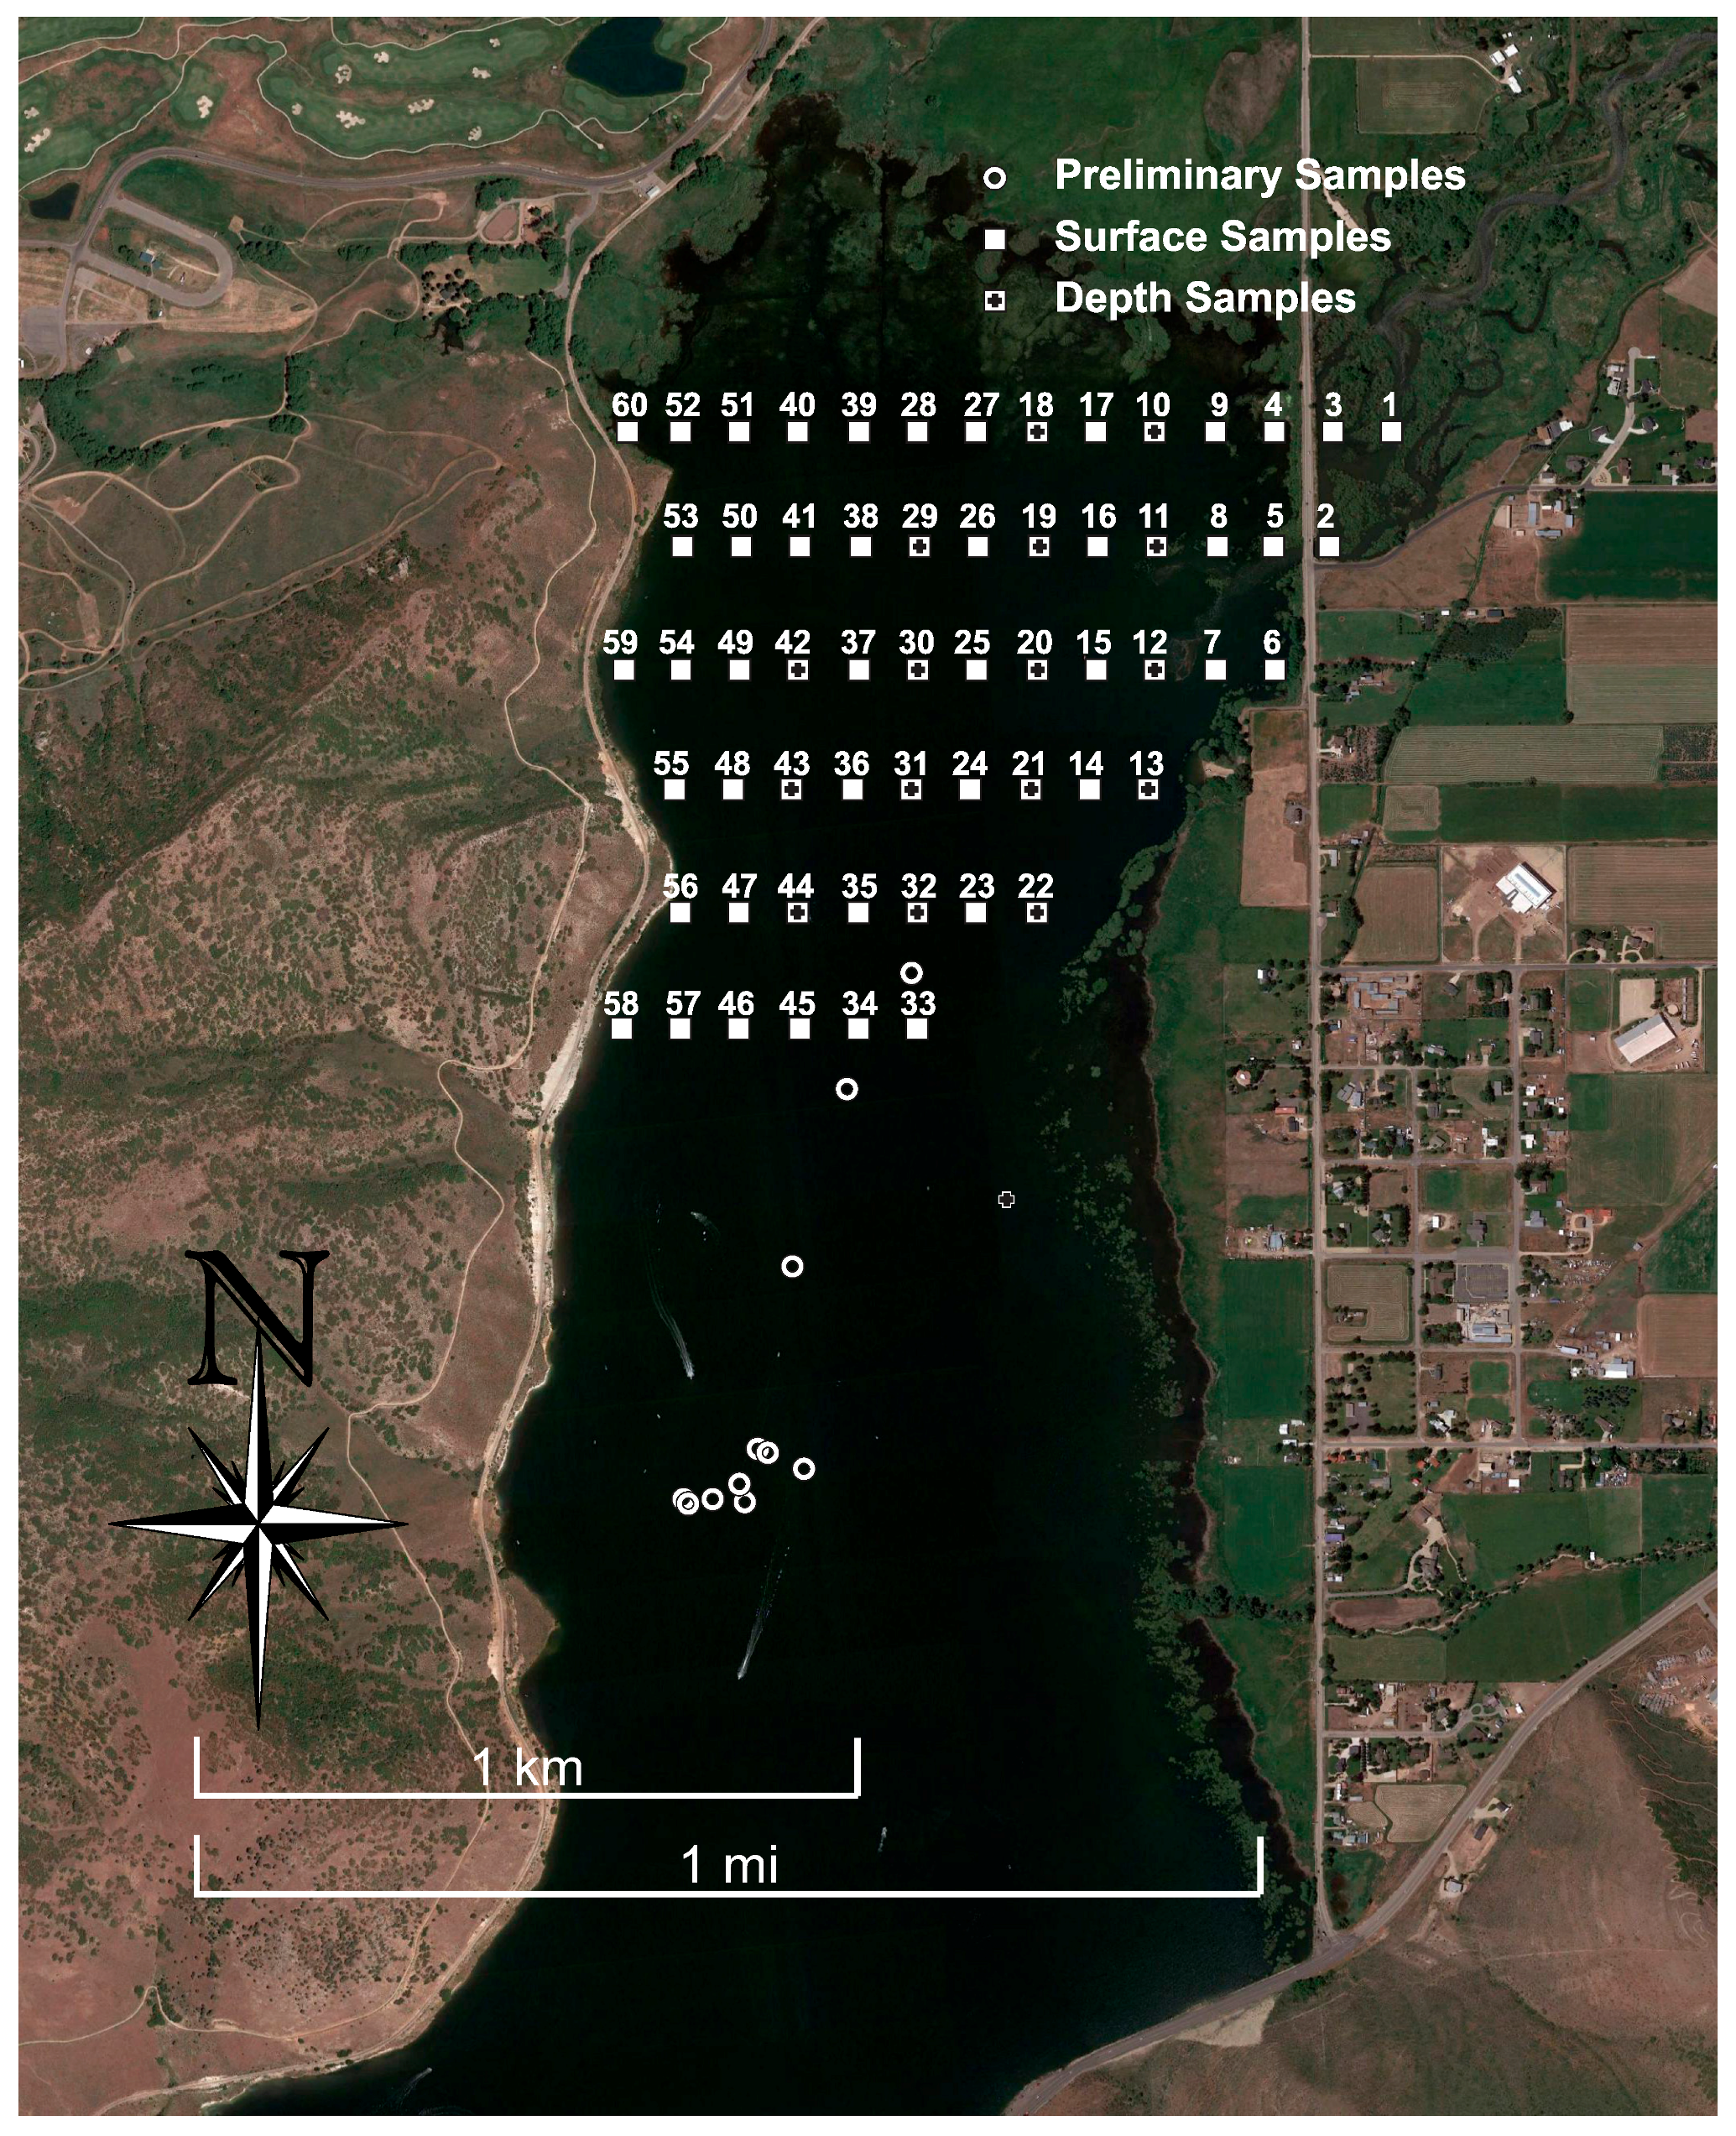
We collected sediment samples at the locations shown in Figure 2. Figure 1 shows the delta during the drawdown; Figure 2 shows the sample locations with the reservoir full. The samples were taken at 100 and 200 m spacing for distances along and between the transects, respectively. We took two different types of sample, i.e., 57 surface (S) samples (white squares in Figure 1) and 15 samples that included both surface and vertical samples (black crosses in white squares in Figure 1). We did not sample locations 1 through 6 or location 60 because they were beyond the delta limits. For 11 of the 15 vertical samples, we sampled at the surface, at 6 inches and at 1 foot. At four of the 15 vertical locations (points 12, 20, 30, and 42), we took an additional sample at 2 feet.
We made field trips over a 4 week summer period in 2008. We used hand augers to obtain the samples. We kept the samples refrigerated soon after collection until analysis. We performed the analysis within one week of collection. For the majority (n = 91) of the samples, we only analyzed the concentration of P in the water-soluble pool or fraction. In 19 of the samples, we analyzed P in four additional pools or fractions. The full results are available in the electronic supplement to this article.
2.2. Geochemical Fractionation
In sediments, P can be present in different chemical forms or pools. Different pools behave differently in the environment, with some relatively immobile and not bioavailable, and other forms easily mobile and bioavailable [35,36]. Forms such as apatite minerals do not influence reservoir water quality as they are not bioavailable, whilst other forms, such as the water-soluble or salt-extractable pools, can easily be released into the reservoir water column [37].
It is difficult to measure accurately P content in different pools, but in the soil science community, they have developed analysis methods called fractionation, extraction, or selective dissolution methods to analyze the P concentration in different pools [37,38,39,40,41]. These methods mix different solvents with the sediment in sequence to extract a selected P-pool, and then they use either centrifugation or filtration to separate the supernatant. P concentration is measured from this liquid.
We followed the Moore and Coale [42] fractionation scheme. This scheme distinguishes five separate P forms, defined by the extracting solution used:
- Fr.W: water soluble and interstitial water P
- Fr.KCl: anion exchange sites, loosely sorbed P
- Fr.NaOH: Al- and Fe-bound or adsorbed P
- Fr.HCl: Ca-bound (apatite) P
- Fr.K2S2O8: residual (mostly organic) P
The final step can be performed in two ways, where either case requires sediment digestion. This digestion can either be performed on the sediment residual, or a separate sediment aliquot. If the latter is used, the results provide the total P concentrations in the sediment. Regarding sediment digestion, we followed the Standard Methods persulfate digestion [43]. In general, P in the first three fractions is readily available to the water column. The 3rd fraction, Fr.NaOH, can be released from the sediments in anoxic or anaerobic iron-reducing conditions, a frequent occurrence in reservoir sediments.
The methods we used are shown in Table 1. Table 1 also presents the methods used in the earlier DCR study [34]. There is one major difference, the earlier study included an additional fraction to determine Fe-bound or oxide-occluded P [34]. In our results, P from this fraction was included in the Fr.HCl fraction. This is somewhat conservative, and we assumed that the Fr.HCl is generally not bioavailable, whilst the Fe-bound P could potentially be released under reducing conditions.
We used 250 mL Nalgene polypropylene tubes in the fractionation process, with ~10.0 g sediment samples. We shook the samples using a Cole Parmer 51,704 series shaker and centrifuged them with a Sorvall Superspeed RC2-B ultracentrifuge. We filtered suspended solids from supernatants by vacuum filtration with 0.45 μm Geotech geofilters, using a Nalgene reusable filter holder. This size traditionally defines the boundary between dissolved and suspended solids. We prepared 161 samples (including duplicates) for measurement.
2.3. Measurement
We used a standard colorimetric analysis to measure P in the form of orthophosphates in water and wastewater [43]. Specifically, we used the Hach amino acid method (Hach method 8178) with a Hach DR5000 spectrophotometer, for measurement of P in solution after each fractionation step [44]. Hach method 8178 is a colorimetric analysis following Standard Methods [43], which measures dissolved orthophosphates in a range from 0.23 to 30.00 mg·L−1. The Hach method uses factory-supplied calibration curves to convert intensity measurements to concentrations.
2.4. Sediment Concentration Conversion
To determine P content of the sediment, we converted the measured P solution concentrations to sediment concentrations with the following equation:
where: CP.in.wat is the P concentration in solution (mg·L−1); Vliq is the extractant volume (L); D is the dilution factor; mdry.sed is the dry sediment mass (g); and CP.in.sed is the P concentration in dry sediment (mg·g−1). We adjusted for entrained solution and lost sediment, to calculate the values used in this equation. We determined sediment water content and used that data to calculate the dry mass of sediment (mdry.sed) used in the fractionation.
3. Results
We analyzed 161 solutions for P concentrations. Of the 91 samples, we analyzed 72 for water-soluble P and Fr.W only. We completed a full fractionation for the remaining 19 samples. Complete fractionation determines P content in all five pools. We provide the complete results and coordinates for all sample locations in the electronic Supplemental File associated with this manuscript.
3.1. Fr.W (Water Soluable Fraction)
In the 72 samples analyzed only for Fr.W, the average P concentration was 5.19 × 10⁻³ and 5.12 × 10⁻³ mg/g dry sediment, for the 72 samples only analyzed for Fr.W and for all the samples, respectively. The standard deviation, σ, of the Fr.W only samples was 3.95 × 10⁻³, which was relatively high ~76% of average. This high standard deviation indicated variation in P-distribution.
Table 2, Table 3 and Table 4 present P with variations by depth, longitudinally, and laterally, respectively. Table 2 presents average Fr.W concentration data by depth (6 inches, 1 foot, and 2 feet) and it indicates a decreasing trend with depth.
In Table 3, the sampling area is presented as transects (as shown in Figure 1), with the first being the most upstream, or nearest in the reservoir inflow. By observation, the data showed a general trend of decreasing concentrations in the downstream direction, though transect 2 is a notable exception. Table 4 presents the data spatially organized by columns (as shown in Figure 1), with column 1 on the right when facing upstream. In general, these data showed higher concentrations on the right side and lower concentrations on the left side across the width of the delta.
Table 2, Table 3 and Table 4 indicate directional trends. Whilst there are various potential processes that could cause these trends, we did not collect data to explore this question.
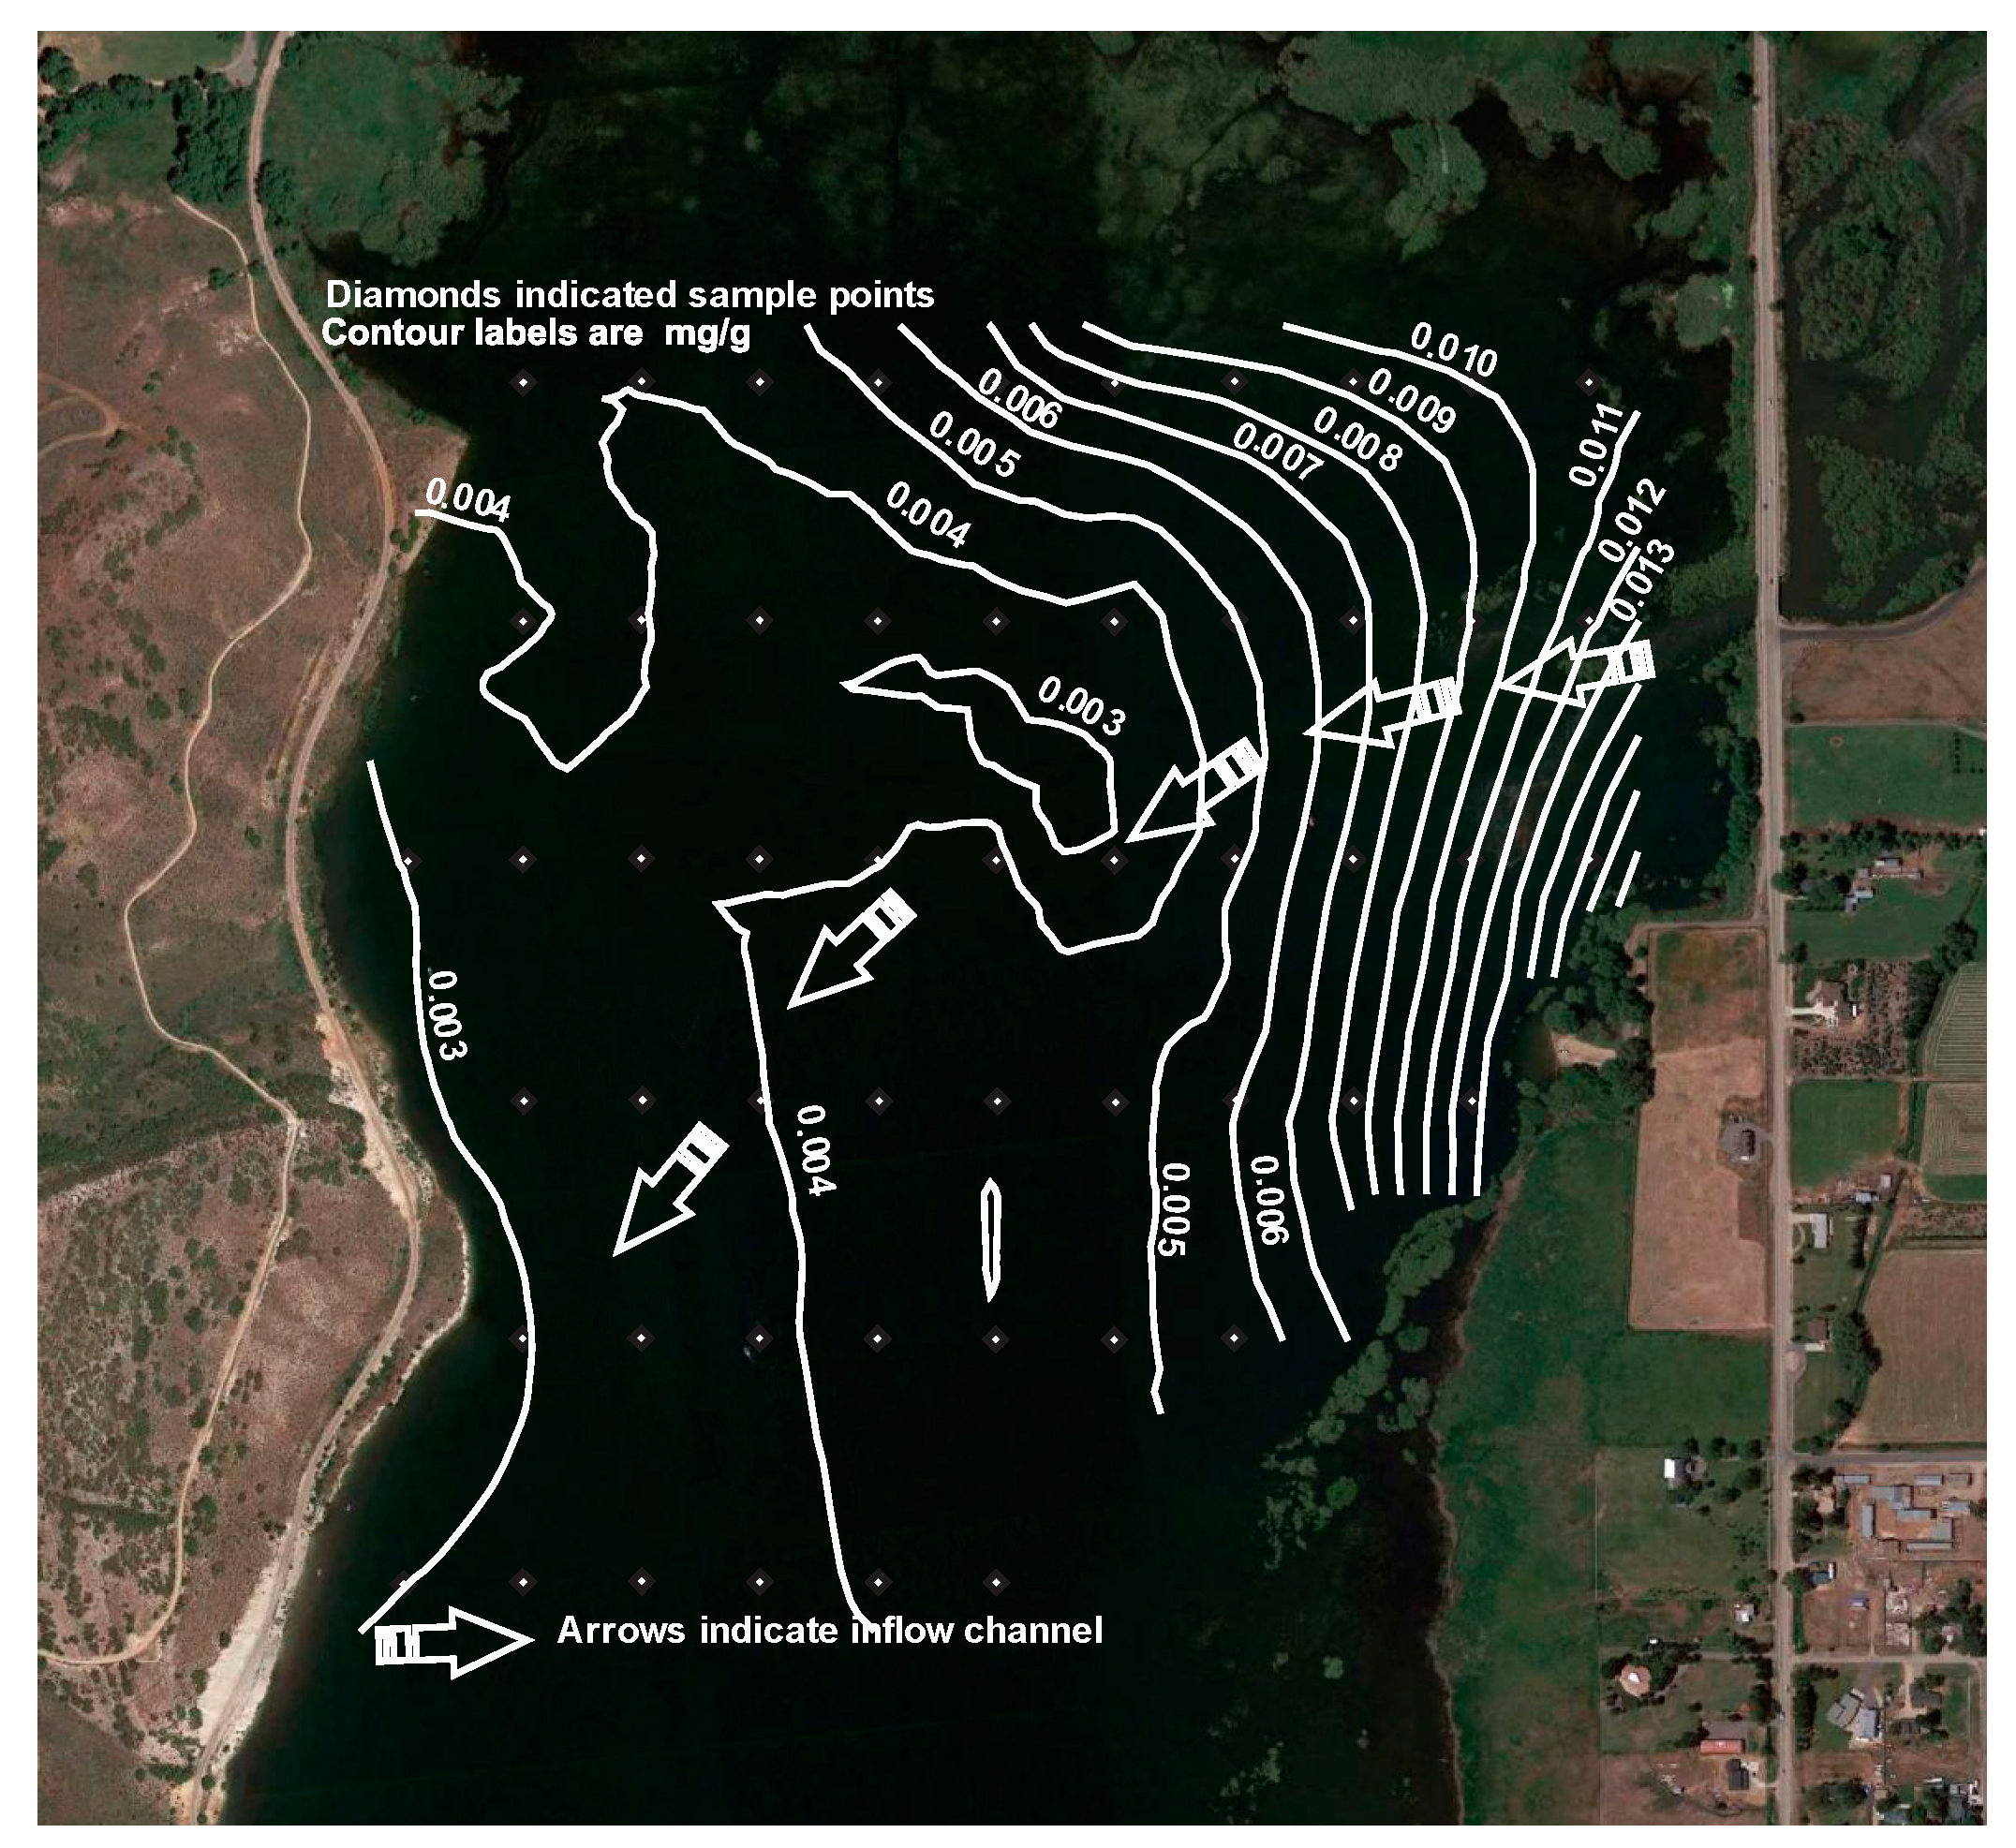
We estimated a continuous P-distribution map to visualize P concentration across the delta, we used kriging implemented in the Groundwater Modeling System (GMS) [45]. Using Kriging, we interpolated an estimated Fr.W P distribution map using the Fr.W P concentrations (n = 55). Figure 3 shows this distribution as contour data.
The direction trends implied by Table 3 and Table 4, are more clearly shown in Figure 3. P-concentration profiles seemed to follow the existing talweg. Maps of other P-pools were similar. We attribute the difference to the smaller number of samples available to guide the estimation. We do not present these maps, as they are based on a relatively few number of samples. However, we provide the data for other researchers to explore these issues.
This work is preliminary in nature, and further geostatistical analysis should confirm and expand on some of these initial findings regarding anisotropy of P content across the delta, and the potential causes of such variation. Additional study could use co-kriging or other methods to better estimate other P-fraction concentrations at sample locations, where we only measured the Fr.W fraction.
3.2. Complete Fractionation
Table 5 presents the average P concentrations in each of the five fractions. We performed complete fractionation on 19 samples. We provide the complete data set in the electronic supplement.
The sediments, on average, contained much less P in the water soluble (Fr.W) and KCl-extractable pools than in the other pools, whilst there was significantly more (over two orders of magnitude) in the NaOH-extractable, the HCl-extractable, and the residual P pools. Apatite P, extracted with HCl (Fr.HCl), was present in significant amounts, as expected from results of previous work [33,34], and because these sediments were largely calcareous [32]. The residual P (organic, plus P not extracted in previous steps) was the largest fraction present.
3.3. Comparison with Previous Study
Table 6 compares average sediment P concentrations for similar fractions of the current and the previous Messer DCR study [34]. Concentrations reported from Messer et al. [34] (their Table 2) were from their upper sampling location, which is likely within our study area based on their map. The fractionation schemes were slightly different as shown in Table 6, not only in extractants used, but also in other aspects, such as shaking time and quantity of sediment extracted. Additionally, sediments collected in the previous study [34] were taken from the bottom of the reservoir, whilst those used in this study were taken from the exposed delta. Obviously, there is a substantial time difference (~25 years) between the two studies, and several changes have occurred (e.g., completion of the Jordanelle Reservoir upstream, and limitations on influent P based on management reforms), which could have affected P content of sediments.
As shown in Table 6, Messer et al., [34] performed one step (Fr.NH4Cl), whilst we performed two steps (Fr.W and Fr.KCl) to start the fractionation. The sediments contained much less P from these pools in the current study, though this might be reasonable when considering that our sample sediments came from the exposed delta, whilst theirs were from the hypolimnion of the reservoir (exposed v. in solution). Levels of Fr.NaOH P were very comparable, with slightly higher amounts in the current work. This is most likely due to the distinct environments, where P may resorb to or co-precipitate with Fe minerals upon drying of sediments. Apatite P content was much higher in the sediments from the current work. This might be due to pools, perhaps from the CBD step that we did not perform, dissolving into solution with the strong acid. Authigenically formed apatite might be part of the explanation as well; these Ca-P complexes are more likely to dissolve in solution than detrital forms of apatite. Alternatively, the greater amounts of apatite could provide evidence that limitations on external P loading have worked, since this P pool was not regulated as other pools were [34].
There were significant amounts of residual P present in both studies, and this is another point of departure between the two studies. In the current work, we calculated total P by the summation of concentrations of individual pools, whilst in the previous work total P was determined by digestion of a separate aliquot of sediment. To compare, we could calculate residual P for the previous study by subtracting inorganic P from the total P they obtained. However, they extracted more inorganic P (897.8 mg·kg−1 by summation of Fr.NaOH, Fr.CBD, and Fr.HCl) than they obtained by total digestion (825.8 mg·kg−1) (see Table 6 for summary of results), so we do not place any confidence in this comparison. The anomaly in their data might be due to resorption of P in the fractionation process or because of P entrained in solutions.
Our study and the previous study used different fractionation schemes. Initially it seems that we should be able to compare P concentrations by cumulative sums, but Wang, et al. [46] show that the fractions extracted by various schemes are not well defined. They note that each fractionation scheme yielded operationally defined pools, that cannot be used to identify specific P compounds. This means that quantitative comparisons between different schemes is difficult, and comparisons are limited to qualitative discussions. One specific issue that affects different schemes is reabsorption to CaCO3 [46]. As DCR sediments are calcareous, this could significantly affect the behavior of different fractionation schemes.
4. Conclusions
This work makes available a unique data set for researchers. It is part of a larger project attempting to understand, characterize, and model water quality issues at DCR. We gathered these data to characterize how deposited delta sediments might provide a recycled nutrient, specifically P source to the water column, in the case of reservoir flooding (refilling after withdrawal) over the exposed delta. This study provided useful data and insights for further work in this area.
Fr.W P concentrations have spatial trends both horizontally and vertically. Based on our limited data, the other fractions of P behaved similarly [47], which was supported by P-distribution maps. By observation, it appeared that the general ratios between the P-fractions was relatively constant, allowing co-kriging or other methods to be used to evaluate spatial distributions in more detail. As noted, we used kriging to characterize these distributions that follow the general Fr.W patterns.
We hope that researchers will use this unique data set to better understand processes in reservoir sediment deltas, including re-cutting and resuspension and the resulting spatial trends. This can inform reservoir managers about the impact that reservoir drawdowns could have, as the drawdowns affect nutrient concentrations due to re-cutting and resuspension of delta sediments.
Our initial results suggest that there is more apatite-P in the exposed delta sediments than in submerged sediments sampled previously, based on comparison of our results with those of Messer et al. [34]. This could have repercussions on refilling reservoirs, as some of the apatite-P found in delta sediments might be of authigenic (precipitated in area previously covered by water), instead of detrital origin. This type of process might have implications in the Western United States, where the extended droughts over recent years have significantly lowered many reservoirs exposing delta sediments. This modified P might more easily become available as the reservoir is refilled, releasing additional nutrients to the water column.
This increased apatite fraction may also indicate that the external P loading reductions started in 1981, as described by Reference [32], have been successful. Apatite-P is the least bioavailable pool due to high insolubility, so Messer et al. [34] recommended that this pool not be targeted for reduction. Our data showed an increased percentage for this pool and it may be evidence of reduction in the other P pools that were targeted for reduction. We expect to explore these issues further, and hope that by providing these field data to the research community, we can spur additional insight.
Supplementary Materials
The following are available online at https://www.mdpi.com/2306-5338/5/4/58/s1. Table S1: Coordinates for sample locations; Table S2: Summary of sediment P concentrations (mg∙g−1) for Sample Locations 7–29; and Table S3: Summary of sediment P concentrations (mg∙g−1) for sample locations 30–59.
Author Contributions
Conceptualization, W.C., M.B.B., and G.P.W.; methodology, W.C.; formal analysis, W.C. and G.P.W.; writing—original draft preparation, W.C. and G.P.W.; writing—review and editing, W.C., M.B.B., and G.P.W.
Funding
This research was funded by the Upper Colorado Region of the U.S. Bureau of Reclamation and the Provo River Watershed Council.
Acknowledgments
Jerry B. Miller provided comments and limnological information about DCR. David G. Tingey, of the Geological Sciences department at BYU, provided lab access and method development help. Two undergraduate students, Ron D. Kent and David A. Isleman, helped with sampling and analyzing sediments, and computational tools GMS and WMS.
Conflicts of Interest
The authors declare no conflict of interest. The funders had no role in the design of the study; in the collection, analyses, or interpretation of data; in the writing of the manuscript, or in the decision to publish the results.
References
- Morris, G.L.; Fan, J. Reservoir Sedimentation Handbook: Design and Management of Dams, Reservoirs, and Watersheds for Sustainable Use; McGraw-Hill: New York, NY, USA, 1998. [Google Scholar]
- Smith, V.; Tilman, G.; Nekola, J. Eutrophication: Impacts of excess nutrient inputs on freshwater, marine, and terrestrial ecosystems. Environ. Pollut. 1999, 100, 179–196. [Google Scholar] [CrossRef]
- Sas, H. Lake Restoration by Reduction of Nutrient Loading; Academia Verlag: New York, NY, USA, 1989. [Google Scholar]
- Sigua, G.; Kang, W.; Coleman, S. Soil profile distribution of phosphorus and other nutrients following wetland conversion to beef cattle pasture. J. Environ. Qual. 2006, 35, 2374. [Google Scholar] [CrossRef] [PubMed]
- Suberkropp, K.; Chauvet, E. Regulation of leaf breakdown by fungi in streams: Influences of water chemistry. Ecology 1995, 1433–1445. [Google Scholar] [CrossRef] [Green Version]
- Carpenter, S.; Caraco, N.; Correll, D.; Howarth, R.; Sharpley, A.; Smith, V. Nonpoint pollution of surface waters with phosphorus and nitrogen. Ecol. Appl. 1998, 8, 559–568. [Google Scholar] [CrossRef]
- Olsen, J.; Williams, G.; Miller, A.; Merritt, L. Measuring and calculating current atmospheric phosphorous and nitrogen loadings to utah lake using field samples and geostatistical analysis. Hydrology 2018, 5, 45. [Google Scholar] [CrossRef]
- Sharma, S.; Nalley, D.; Subedi, N. Characterization of temporal and spatial variability of phosphorus loading to lake erie from the western basin using wavelet transform methods. Hydrology 2018, 5, 50. [Google Scholar] [CrossRef]
- Rossi, G.; Premazzi, G. Delay in lake recovery caused by internal loading. Water Res. 1991, 25, 567–575. [Google Scholar] [CrossRef]
- Granéli, W. Internal phosphorus loading in lake ringsjön. Hydrobiologia 1999, 404, 19–26. [Google Scholar] [CrossRef]
- Mayer, T.; Ptacek, C.; Zanini, L. Sediments as a source of nutrients to hypereutrophic marshes of point pelee, ontario, canada. Water Res. 1999, 33, 1460–1470. [Google Scholar] [CrossRef]
- Surridge, B.; Heathwaite, A.; Baird, A. The release of phosphorus to porewater and surface water from river riparian sediments. J. Environ. Qual. 2007, 36, 1534. [Google Scholar] [CrossRef] [PubMed]
- Nowlin, W.; Evarts, J.; Vanni, M. Release rates and potential fates of nitrogen and phosphorus from sediments in a eutrophic reservoir. Freshw. Biol. 2005, 50, 301–322. [Google Scholar] [CrossRef] [Green Version]
- Holtan, H.; Kamp-Nielsen, L.; Stuanes, A. Phosphorus in soil, water and sediment: An overview. Hydrobiologia 1988, 170, 19–34. [Google Scholar] [CrossRef]
- Pace, M.L.; Funke, E. Regulation of planktonic microbial communities by nutrients and herbivores. Ecology 1991, 72, 904–914. [Google Scholar] [CrossRef]
- Gibson, C.E. Dynamics of phosphorus in freshwater and marine environments. In Phosphorus Loss from Soil to Water; Tunney, H., Carton, O.T., Brookes, P.C., Johnson, A.E., Eds.; CAB International: Wexford, Ireland, 1997; pp. 119–136. [Google Scholar]
- Szmant, A.; Forrester, A. Water column and sediment nitrogen and phosphorus distribution patterns in the florida keys, USA. Coral Reefs 1996, 15, 21–41. [Google Scholar] [CrossRef]
- Abu-Hmeidan, H.Y.; Williams, G.P.; Miller, A.W. Characterizing total phosphorus in current and geologic utah lake sediments: Implications for water quality management issues. Hydrology 2018, 5, 8. [Google Scholar] [CrossRef]
- Thornton, K.W.; Kennedy, R.H.; Magoun, A.D.; Saul, G.E. Reservoir water quality sampling design. J. Am. Water Resour. Assoc. 1982, 18, 471–480. [Google Scholar] [CrossRef]
- Hakanson, L. Determination of characteristic values for physical and chemical lake sediment parameters. Water Resour. Res. 1981, 17, 1625–1640. [Google Scholar] [CrossRef]
- Hakanson, L. Sediment sampling in different aquatic environments: Statistical aspects. Water Resour. Res. 1984, 20, 41–46. [Google Scholar] [CrossRef]
- Fabre, A. Experimental studies on some factors influencing phosphorus solubilization in connexion with the drawdown of a reservoir. Hydrobiologia 1988, 159, 153–158. [Google Scholar] [CrossRef]
- Eckert, W.; Nishri, A.; Parparova, R. Factors Regulating the Flux of Phosphate at the Sediment-Water Interface of a Subtropical Calcareous Lake: A Simulation Study with Intact Sediment Cores; Kluwer Academic Publishers: Dordrecht, The Netherlands, 1997; pp. 401–409. [Google Scholar]
- Golterman, H.L. The Chemistry of Phosphate and Nitrogen Compounds in Sediments; Kluwer Academic Publishers: Dordrecht, The Netherlands, 2004. [Google Scholar]
- Devine, J.; Vanni, M. Spatial and seasonal variation in nutrient excretion by benthic invertebrates in a eutrophic reservoir. Freshw. Biol. 2002, 47, 1107–1121. [Google Scholar] [CrossRef] [Green Version]
- Fisher, L.H.; Wood, T.M. Effect of Water-Column PH on Sediment Phosphorus Release Rates in Upper Klamath Lake, Oregon, 2001; United States Geological Survey: Washington, DC, USA, 2004. [Google Scholar]
- Buckley, K.L. History of the Salt Lake Aqueduct; Metropolitan Water District of Salt Lake & Sandy: Salt Lake City, UT, USA, 2004; p. 15. [Google Scholar]
- Hansen, C.; Burian, S.; Dennison, P.; Williams, G. Spatiotemporal variability of lake water quality in the context of remote sensing models. Remote Sens. 2017, 9, 409. [Google Scholar] [CrossRef]
- Hansen, C.H.; Williams, G.P.; Adjei, Z.; Barlow, A.; Nelson, E.J.; Miller, A.W. Reservoir water quality monitoring using remote sensing with seasonal models: Case study of five central-utah reservoirs. Lake Reserv. Manag. 2015, 31, 225–240. [Google Scholar] [CrossRef]
- Hansen, C.; Swain, N.; Munson, K.; Adjei, Z.; Williams, G.P.; Miller, W. Development of sub-seasonal remote sensing chlorophyll-a detection models. Am. J. Plant Sci. 2013, 4, 21. [Google Scholar] [CrossRef]
- Hansen, C.H.; Williams, G.P.; Adjei, Z. Long-term application of remote sensing chlorophyll detection models: Jordanelle reservoir case study. Nat. Resour. 2015, 6, 123. [Google Scholar] [CrossRef]
- PSOMAS. Deer Creek Reservoir Drainage, Tmdl Study; Utah Department of Natural Resources: Salt Lake City, UT, USA, 2002. [Google Scholar]
- Messer, J.J.; Ihnat, J.M. Reconnaissance of Sediment-Phosphorus Relationships in Some Utah Reservoirs; Utah Water Research Laboratory, Utah State University: Logan, UT, USA, 1983; Volume UWRL/Q-83/03. [Google Scholar]
- Messer, J.J.; Hardy, T.B.; Ihnat, J.M. Sediment-Phosphorus Relationships in Deer Creek Reservoir; Utah Water Research Laboratory, Utah State University: Logan, UT, USA, 1984; Volume UWRL/Q-84/01. [Google Scholar]
- Sims, J.T.; Pierzynski, G.M. Chemistry of phosphorus in soils. In Chemical Processes in Soils; Tabatabai, M.A., Sparks, D.L., Eds.; Soil Science Society of America, Inc.: Madison, WI, USA, 2005; pp. 151–192. [Google Scholar]
- Pierzynski, G.M.; Sims, J.T.; Vance, G.F. Soils and Environmental Quality; CRC Press, Taylor & Francis Group: Boca Raton, FL, USA, 2005. [Google Scholar]
- Shang, C.; Zelazny, L.W. Selective dissolution techniques for mineral analysis of soils and sediments. In Methods of Soil Analysis Part 5—Mineralogical Methods; Ulery, A.L., Drees, L.R., Eds.; Soil Science Society of America, Inc.: Washington, DC, USA, 2008; Volume 5. [Google Scholar]
- Chang, S.C.; Jackson, M.L. Fractionation of soil phosphorus. Soil Sci. 1957, 84, 133–144. [Google Scholar] [CrossRef]
- Dean, L.A. An attempted fractionation of the soil phosphorus. J. Agric. Sci. 1938, 28, 234–246. [Google Scholar] [CrossRef]
- Kouwe, F.A.; Golterman, H.L. Rol van bodemfosfaten in het eutropieringsproces. H2O 1976, 9, 84–86. [Google Scholar]
- van Eck, G.T.M. Forms of phosphorus in particulate matter from the hollands diep/haringvliet, the netherlands. Hydrobiologia 1982, 91, 665–681. [Google Scholar] [CrossRef]
- Moore, P.A.; Coale, F. Phosphorus Fractionation in Flooded Soils and Sediments; Department of Agronomy, Kansas State University: Manhattan, KS, USA, 2000; p. 102. [Google Scholar]
- Stieg, S.; Fisher, B.R.; Mathre, O.B.; Wright, T.M. Inorganic nonmetallic constituents: Phosphorus. In Standard Methods for the Examination of Water and Wastewater; Franson, M.A.H., Eaton, A.D., Eds.; American Public Health Association & American Water Works Association & Water Environment Federation: Baltimore, MD, USA, 2005. [Google Scholar]
- Hach. Dr5000 Spectrophotometer: Procedures Manual; Hach Company: Loveland, CO, USA, 2005. [Google Scholar]
- Aquaveo Groundwater Modeling System (GSM) Software, Version 6.5; Aquaveo LLC: Provo, UT, USA, 2008.
- Wang, C.; Zhang, Y.; Li, H.; Morrison, R.J. Sequential extraction procedures for the determination of phosphorus forms in sediment. Limnology 2013, 14, 147–157. [Google Scholar] [CrossRef] [Green Version]
- Borgnino, L.; Orona, C.; Avena, M.; Maine, M.A.; Rodriguez, A.; De Pauli, C.P. Phosphate concentration and association as revealed by sequential extraction and microprobe analysis: The case of sediments from two argentinean reservoirs. Water Resour. Res. 2006, 42. [Google Scholar] [CrossRef]
Figure 1.
Deer Creek reservoir during the construction drawdown (left panel) and full (right panel). The draw down was extensive, exposing over a 3 km of sediments.
Figure 1.
Deer Creek reservoir during the construction drawdown (left panel) and full (right panel). The draw down was extensive, exposing over a 3 km of sediments.
Figure 2.
Sediment sample locations showing preliminary samples (circles), surface samples (squares), and samples at multiple depths (squares with cross).
Figure 2.
Sediment sample locations showing preliminary samples (circles), surface samples (squares), and samples at multiple depths (squares with cross).
Figure 3.
Contours of the Fr.W (water-soluble) fraction from the surface samples. Arrows indicate the inflow talweg, which is better seen in the left panel of Figure 1. The general spatial distribution follows the inflow channels.
Figure 3.
Contours of the Fr.W (water-soluble) fraction from the surface samples. Arrows indicate the inflow talweg, which is better seen in the left panel of Figure 1. The general spatial distribution follows the inflow channels.

Table 1.
Comparison of fractionation schemes used in this and the previous Deer Creek study. The table provides the extracting solution and shaking time for both studies. The first and last P fractions (Fr.W and Fr.K2S2O8) steps did not include shaking. In the table, “current” refers to this study, “previous” refers to the study by Messer, Hardy and Ihnat [34].
| P Fraction | Current Solvent | tshake (h) Current/Previous | Previous Solvent |
|---|---|---|---|
| Fr.W | DI Water | - | - |
| Fr.KCl | 1.0 M KCl | 2/2 | 1.0 N NH4Cl |
| Fr.NaOH | 0.1 M NaOH | 17/18 | 0.1 N NaOH |
| Fr.CBD | - | - | CBD * |
| Fr.HCl | 0.5 M HCl | 24/18 | 0.5 M HCl |
| Fr.K2S2O8 | Persulfate | - | Persulfate |
* CBD is a Na-citrate, Na-bicarbonate, and Na-dithionite solvent.
Table 2.
The average water-soluble (Fr.W) P concentrations in the sediment. The results are presented in the order of sample depth.
Table 2.
The average water-soluble (Fr.W) P concentrations in the sediment. The results are presented in the order of sample depth.
| Depth | n | CP.avg (mg·g−1) |
|---|---|---|
| Surface | 55 | 5.64 × 10⁻³ |
| 6 in | 15 | 4.43 × 10⁻³ |
| 12 in | 13 | 4.06 × 10⁻³ |
| 2 ft | 4 | 3.99 × 10⁻³ |
| All | 87 | 5.12 × 10⁻³ |
Table 3.
Longitudinal variation in average surface Fr.W P concentrations, with the samples presented as transects with transect 1 being the most upstream.
Table 3.
Longitudinal variation in average surface Fr.W P concentrations, with the samples presented as transects with transect 1 being the most upstream.
| Transect | n | CP.avg (mg·g−1) |
|---|---|---|
| 1 | 10 | 7.29 × 10⁻³ |
| 2 | 10 | 4.81 × 10⁻³ |
| 3 | 11 | 6.31 × 10⁻³ |
| 4 | 8 | 5.59 × 10⁻³ |
| 5 | 5 | 3.82 × 10⁻³ |
| 6 | 7 | 4.03 × 10⁻³ |
Table 4.
Lateral variation in average surface Fr.W P concentrations. Data are presented starting from the right side of the delta (looking upstream). Column 1 contains points 7–9 seen in Figure 1.
Table 4.
Lateral variation in average surface Fr.W P concentrations. Data are presented starting from the right side of the delta (looking upstream). Column 1 contains points 7–9 seen in Figure 1.
| Column | n | CP.avg (mg·g−1) | Group |
|---|---|---|---|
| 1 | 3 | 1.53 × 10⁻² | High |
| 2 | 4 | 5.88 × 10⁻³ | |
| 3 | 4 | 9.68 × 10⁻³ | |
| 4 | 5 | 7.62 × 10⁻³ | |
| 5 | 5 | 4.10 × 10⁻³ | Low |
| 6 | 5 | 3.47 × 10⁻³ | |
| 7 | 6 | 4.54 × 10⁻³ | |
| 8 | 6 | 4.73 × 10⁻³ | |
| 9 | 6 | 4.04 × 10⁻³ | |
| 10 | 6 | 3.10 × 10⁻³ | |
| 11 | 2 | 3.23 × 10⁻³ |
Table 5.
Average sediment P concentrations for various fractions. The first two pools tend to be found in much lower concentrations than the other pools, with the organic P (from Fr.K2S2O8) found in greatest concentrations.
Table 5.
Average sediment P concentrations for various fractions. The first two pools tend to be found in much lower concentrations than the other pools, with the organic P (from Fr.K2S2O8) found in greatest concentrations.
| Pool | n | CP.avg (mg·g−1) |
|---|---|---|
| Fr.W | 19 | 4.70 × 10⁻³ |
| Fr.KCl | 18 | 4.93 × 10⁻³ |
| Fr.NaOH | 19 | 1.82 × 10⁻¹ |
| Fr.HCl | 18 | 9.39 × 10⁻¹ |
| Fr.K2S2O8 | 19 | 1.46 |
Table 6.
Fractionation results from current and previous studies by Messer, Hardy and Ihnat [34]. The previous study reports the sum of Fr.NaOH and Fr.CBD as non-apatite inorganic-P (NAIP).
Table 6.
Fractionation results from current and previous studies by Messer, Hardy and Ihnat [34]. The previous study reports the sum of Fr.NaOH and Fr.CBD as non-apatite inorganic-P (NAIP).
| CP.avg (mg·kg−1) | |||
|---|---|---|---|
| This Study | This Study | Messer * | Messer |
| Fr.W | 4.66 | - | - |
| Fr.KCl | 4.53 | - | - |
| Fr.W+Fr.KCl | 9.19 | 54.3 | Fr.NH4Cl |
| Fr.NaOH | 174.07 | 155.2 | Fr.NaOH |
| - | - | 355.8 | Fr.NaOH + Fr.CBD |
| Fr.HCl | 926.31 | 542.0 | Fr.HCl |
| Fr.PFD | 1460 | - | Total (NAIP + Fr.HCl) |
| Total (by sum) | 2572.5 | 1107.3 * | Total (by sum) |
| - | - | 825.6 | Total (by digestion) |
* We calculated total P by sum, for the previous work; though this did not include organic P. Note that the current total-P was higher than total-P by digestion as completed by Reference [34].
© 2018 by the authors. Licensee MDPI, Basel, Switzerland. This article is an open access article distributed under the terms and conditions of the Creative Commons Attribution (CC BY) license (http://creativecommons.org/licenses/by/4.0/).
Share and Cite
MDPI and ACS Style
Casbeer, W.; Williams, G.P.; Borup, M.B. Phosphorus Distribution in Delta Sediments: A Unique Data Set from Deer Creek Reservoir. Hydrology 2018, 5, 58. https://doi.org/10.3390/hydrology5040058
AMA Style
Casbeer W, Williams GP, Borup MB. Phosphorus Distribution in Delta Sediments: A Unique Data Set from Deer Creek Reservoir. Hydrology. 2018; 5(4):58. https://doi.org/10.3390/hydrology5040058
Chicago/Turabian StyleCasbeer, Warren, Gustavious P. Williams, and M. Brett Borup. 2018. "Phosphorus Distribution in Delta Sediments: A Unique Data Set from Deer Creek Reservoir" Hydrology 5, no. 4: 58. https://doi.org/10.3390/hydrology5040058
Note that from the first issue of 2016, this journal uses article numbers instead of page numbers. See further details here.