Article

Influence of Precipitation Forcing Uncertainty on Hydrological Simulations with the NASA South Asia Land Data Assimilation System

1
Department of Earth and Planetary Sciences, Johns Hopkins University, 301 Olin Hall, 3400 N. Charles Street, Baltimore, MD 21218, USA
2
Hydrological Sciences Laboratory, NASA Goddard Space Flight Center, Greenbelt, MD 20771, USA
3
International Centre for Integrated Mountain Development (ICIMOD), GPO Box 3226 Kathmandu, Nepal
4
NASA Marshall Space Flight Center, Earth Science Branch, 320 Sparkman Drive, Huntsville, AL 35805, USA
5
Hydrology and Remote Sensing Laboratory, Agricultural Research Service, USDA, 10300 Baltimore Avenue, Beltsville, MD 20705, USA
*
Author to whom correspondence should be addressed.
Hydrology 2018, 5(4), 57; https://doi.org/10.3390/hydrology5040057
Submission received: 23 August 2018 / Revised: 25 September 2018 / Accepted: 3 October 2018 / Published: 10 October 2018

Abstract

:
Accurate meteorological estimates are critical for process-based hydrological simulation and prediction. This presents a significant challenge in mountainous Asia where in situ meteorological stations are limited and major river basins cross international borders. In this context, remotely sensed and model-derived meteorological estimates are often necessary inputs for distributed hydrological analysis. However, these datasets are difficult to evaluate on account of limited access to ground data. In this case, the implications of uncertainty associated with precipitation forcing for hydrological simulations is explored by driving the South Asia Land Data Assimilation System (South Asia LDAS) using a range of meteorological forcing products. MERRA2, GDAS, and CHIRPS produce a wide range of estimates for rainfall, which causes a widespread simulated streamflow and evapotranspiration. A combination of satellite-derived and limited in situ data are applied to evaluate model simulations and, by extension, to constrain the estimates of precipitation. The results show that available gridded precipitation estimates based on in situ data may systematically underestimate precipitation in mountainous regions and that performance of gridded satellite-derived or modeled precipitation estimates varies systematically across the region. Since no station-based data or product including station data is satisfactory everywhere, our results suggest that the evaluation of the hydrological simulation of streamflow and ET can be used as an indirect evaluation of precipitation forcing based on ground-based products or in-situ data. South Asia LDAS produces reasonable evapotranspiration and streamflow when forced with appropriate meteorological forcing and the choice of meteorological forcing should be made based on the geographical location as well as on the purpose of the simulations.

1. Introduction

There is a pressing need for objective, reliable, and physically consistent information on the variability in water resources across South Asia. This is particularly true for transboundary hydrological basins that have headwaters in the Hindu Kush-Himalaya (HKH) mountain belt. These mountains give rise to some of the longest rivers of the world and these rivers, in turn, provide water resources to hundreds of millions of people spread across numerous countries. Meteorological and hydrological conditions in the mountains themselves, however, are poorly monitored due to their forbidding terrain, small human populations, and insufficient financial support. The scientific community is in agreement about the lack of knowledge of the magnitude and distribution of high altitude precipitation [1,2,3,4,5,6]. As a result, hydrological monitoring and prediction in these critical river basins is fraught with uncertainty, which poses challenges to cooperative transboundary management, flood warnings, preparedness activities, and projections of hydrologic change under global warming and upstream development. Furthermore, climate change increases the uncertainty, intensity, and the frequency of hydrological extremes [7,8].
These challenges have inspired efforts to improve hydrological monitoring and prediction through data sharing initiatives, satellite remote sensing [9,10,11,12,13], and the application of both global and locally-customized hydrological models to the region [14,15,16,17,18,19,20,21,22,23,24] including a special emphasis on South India [25].
The South Asia Land Data Assimilation System (South Asia LDAS) is a collaborative modeling initiative that is representative of these efforts. South Asia LDAS consists of a suite of advanced Land Surface Models (LSM) implemented at a 5-km horizontal resolution for fully distributed hydrological simulations across all of South Asia. The system, which is built on the NASA Land Information System (LIS) [26] software platform, merges models with satellite data, as remotely sensed observations are applied as meteorological forcing data (e.g., satellite-derived precipitation estimates), land surface parameters (e.g., land cover and vegetation fraction), and, in some instances, update observations in hydrological data assimilation (e.g., satellite-derived snow cover observations). The system was developed cooperatively by multiple institutions and will be operationally housed at the International Center for Integrated Mountain Development (ICIMOD), which is located in Kathmandu, Nepal. Specific application areas for South Asia LDAS include drought monitoring, flood prediction, and analysis of hydrological variability and trends.
Like other efforts at hydrological analysis in the region, South Asia LDAS is susceptible to uncertainty due to uncertainty in meteorological monitoring products especially in the HKH mountains. Meteorological forcing is known to be a leading source of uncertainty in LSM simulations [27,28] and the problem is particularly severe in the HKH. While one could attempt to calibrate hydrological models to force hydrological predictions to be reasonable even when meteorological fields are biased, this form of calibration risks producing a modeling system that is tuned to match an output of interest but that is not physically meaningful. This limits generalizability, confidence in non-calibrated output variables, and applicability of the system when confronted with extremes outside the historic record or with the need to simulate climate or development scenarios.
Recognizing this challenge, we evaluated precipitation datasets themselves against available observations. We also examined LSM predictions including evapotranspiration and streamflow in order to assess the impact that precipitation forcing has on the realism of hydrological simulation. The purpose of these evaluations is to examine the potential for hydrological modelling and its evaluation for providing an indirect evaluation of precipitation forcing, which is particularly useful for a region in which no existing precipitation forcing datasets are satisfactory everywhere. Consequently, South Asia LDAS can be used more judiciously for hydrologic monitoring and forecast by choosing an appropriate precipitation dataset as a forcing for targeted geographic region. We considered simulations with only one LSM and without active data assimilation. The results, therefore, should not be interpreted as a complete or optimized hydrological re-analysis but as a study of how one advanced LSM responds to different precipitation forcing in this region. The spatial domain of simulation covers 6°N–40°N and 60°E–100°E. Even though the South Asia LDAS includes a large area that includes much of Afghanistan, the Tibetan Plateau, China, and Myanmar, we focus our analysis on transboundary rivers that originate in the HKH and flow south.

2. Methods

2.1. Datasets

Observed Precipitation data: Gridded precipitation estimates are available for the study region through the activities of the Asian Precipitation—Highly Resolved Observational Data Integration Towards Evaluation of Water Resources (APHRODITE) project [29]. The APHRODITE product has previously been applied successfully in studies of precipitation variability over South Asian countries including the mountainous regions [30,31]. Since it is a robustly evaluated gauge-based product, we apply it in this study as the closest approximation of a ground-based gridded product that can be used to evaluate the precipitation from Climate Hazards Group InfraRed Precipitation with Station data (CHIRPS), the NASA Modern-Era Retrospective analysis for Research, and Applications version 2 (MERRA2), and the Global Data Assimilation System (GDAS). We use the dataset at 0.25° spatial resolution for the time period between 2001–2007, the period of overlap between all products applied in this study: GDAS [32], MERRA2 [33], and CHIRPS [34].
In addition to a comparison with gridded precipitation estimates from APHRODITE, we perform point-by-point comparisons with monthly accumulated meteorological station precipitation data from Pakistan, Nepal, Bangladesh, and Bhutan. These data were aggregated from stations maintained by the Hindukush-Himalayas Hydrological Cycle Observing System (HKH-HYCOS) program at ICIMOD. Most of these stations use tipping bucket to measure rainfall. Data are used here for the period between 2012 and 2017.
Other sources of precipitation and meteorological data: Gridded sub-daily meteorological fields including air temperature were extracted from one operational weather product (GDAS) and one research grade reanalysis system (MERRA2). In addition, we made use of daily precipitation estimates from the satellite-derived CHIRPS product as supplementary forcing for LSM simulations. GDAS assimilates surface observations, balloon data, wind profiler data, aircraft reports, buoy observations, and satellite observations. It is primarily used by the NCEP global forecast system model. It is available since 2001 to present at a variable spatial resolution: 1° at the beginning of the period, which increased to 0.25° in recent years. Kumar et al. [35] compared the GDAS/GFS air temperature with WRF and found fewer errors in GDAS/GFS. Shah and Mishra [36] have successfully used GDAS/GFS temperature and precipitation products for real-time drought monitoring across India.
MERRA2 is the most recent reanalysis product produced by the NASA Global Modeling and Assimilation Office. Compared to the previous version of MERRA [33,37], MERRA2 introduced the assimilation of modern hyperspectral radiance, microwave observations, and GPS-Radio Occultation datasets. It also makes use of NASA ozone observations. The GEOS-5 model and assimilation systems have also been improved relative to the original MERRA product. MERRA2 surface fields are available hourly at 50 km resolution for the time period from 1980 to the present. Ghatak et al. [38] found satisfactory results when comparing air temperature from MERRA with station observations over India. In this study, we use both the final MERRA2 precipitation fields, which include a correction using the in situ data, and the “uncorrected” MERRA2 product that does not include post hoc correction for surface fields.
CHIRPS is a quasi-global rainfall dataset, which is available for the time period from 1981 to the present [34]. It produces gridded rainfall estimates from geostationary infrared satellite imagery with calibration against active radar satellite systems and correction to in situ meteorological station observations. When applied as LSM forcing, CHIRPS daily rainfall estimates are disaggregated to 3 hourly estimates based on diurnal precipitation variability in MERRA2.
The three datasets applied in this study known as GDAS, MERRA2, and CHIRPS are not intended to be an exhaustive or even a regionally optimized selection of available products. Rather, they are examples of three systematically different approaches to generating quasi-global meteorological estimates suitable for distributed hydrological simulation.
Evapotranspiration data: In situ observations of evapotranspiration are difficult to obtain in the study region and they are almost completely absent at a high elevation. Nevertheless, evapotranspiration is a useful variable to consider when evaluating fully distributed hydrological simulations. It is a predicted variable, it is temporally and spatially variable, and, unlike streamflow, it is a distributed rather than basin-integrated measure of the water balance. For this reason, we employ the Atmosphere-Land Exchange Inverse Model (ALEXI) [39,40,41,42] estimates of weekly total evapotranspiration as an independent point of comparison for LSM simulations. ALEXI derives surface turbulent heat flux estimates on the basis of a two-source land surface model coupled with a one-dimensional boundary layer model. ALEXI uses time-differential measurements of a morning land surface temperature rise to diagnose the partitioning of available energy into sensible, latent, and ground heat flux components [42]. For this application, we use the global ALEXI product using Clouds and the Earth’s Radiant Energy System (CERES) insolation, which is available at 5 km resolution for the period from 2003 to the present. We interpret comparisons between LSM simulations and ALEXI with caution. ALEXI is based on observations in that it is a satellite-derived product, but the product has not been robustly evaluated in the study region and may include significant uncertainties. For this reason, we use ALEXI for independent “comparison” purposes and not for literal evaluation of LSM simulated fluxes.
Streamflow data: Daily stream flow data from the river Indus and its tributaries are used to compare the model and observed stream flow for the year 2014. These data are available at the Indus River System Authority (http://www.pakirsa.gov.pk/) but is compiled by the University of Washington SASWE research group. Daily observed stream flow data for the time period between 1977 and 2010 has also been acquired from the ICIMOD Kosi Basin Program for a site at Chatara on the Kosi River in Nepal. This is another transboundary river basin that shares water between Tibet, India, and Nepal. Notably, this river basin includes the highest peak in the world, which makes it a prime example of the large altitudinal gradients found in the region.
Water height data: Recognizing the limited availability of in situ stream gauge data, we also use water height data derived from satellite altimetry. Satellite altimetry data from Jason 2 over the Indus basin is available to download from the HYDROWEB website (http://hydroweb.theia-land.fr/). Data are used for four sites (geographical locations are shown in map 7b) from the Indus basin for the time period between 2008 and 2015. The altimetry records represent instantaneous measurements of the Earth’s surface height corresponding to a specified reference ellipsoid.
Definition of River Basins: HydroSHEDS (Hydrological data and maps based on SHuttle Elevation Derivatives at multiple Scales) provides geo-referenced data on the watershed and other hydrographic information [43]. These datasets were applied to determine the boundaries of watersheds and river basins evaluated in the study.

2.2. Model

The Noah Land Surface Model, v3.3 (hereafter “Noah”) [44] was implemented for 10-km horizontal resolution simulations for a domain that includes all of South Asia. The model time step is 30 min. All simulations were performed in the LIS version 7 software framework.
Two simulations (Table 1) use meteorological forcing from MERRA2 where one of them uses precipitation from MERRA2 corrected precipitation (will be indicated as ‘MERRA2-C’) and the other uses MERRA2 uncorrected precipitation (will be indicated as ‘MERRA2-UC’) for the period from 1980 to 2016. We performed another simulation (Table 1) with MERRA2 meteorological forcing with precipitation from CHIRPS for the period between 1981 and 2016. Two additional simulations are performed for a shorter time domain of 2001 to 2016 with meteorological forcing from GDAS where one uses precipitation from GDAS and the other uses precipitation from CHIRPS (Table 1). All these simulations had a spin-up for the full time domain and have accounted for irrigation using a simple “flood” irrigation algorithm described in previous studies. Irrigation is triggered once the root zone soil moisture state drops below a threshold with respect to the wilting point [45,46,47]. Water is then added to the root zone until the top layer is saturated and saturation is sustained for 30 min.
All simulations used MODIS-derived land cover, vegetation parameters, and gridded soil property estimates from FAO [48]. The Hydrological Modeling and Analysis Platform (HyMAP) routing module was used to simulate river flow [49]. HyMAP introduces time delays for both runoff and baseflow and includes the formulations to model the interaction between rivers and floodplains. It also takes into account the floodplain water flow among the grid cells and evaporation from the open water. The runoff and baseflow are routed through the kinematic wave formulation.
Noah simulations were compared to each other and to independent datasets using standard statistical measures including the root mean square error (RMSE), Nash-Sutcliffe Efficiency (NSE), the absolute and relative bias, and linear correlation coefficients.

3. Results & Discussion

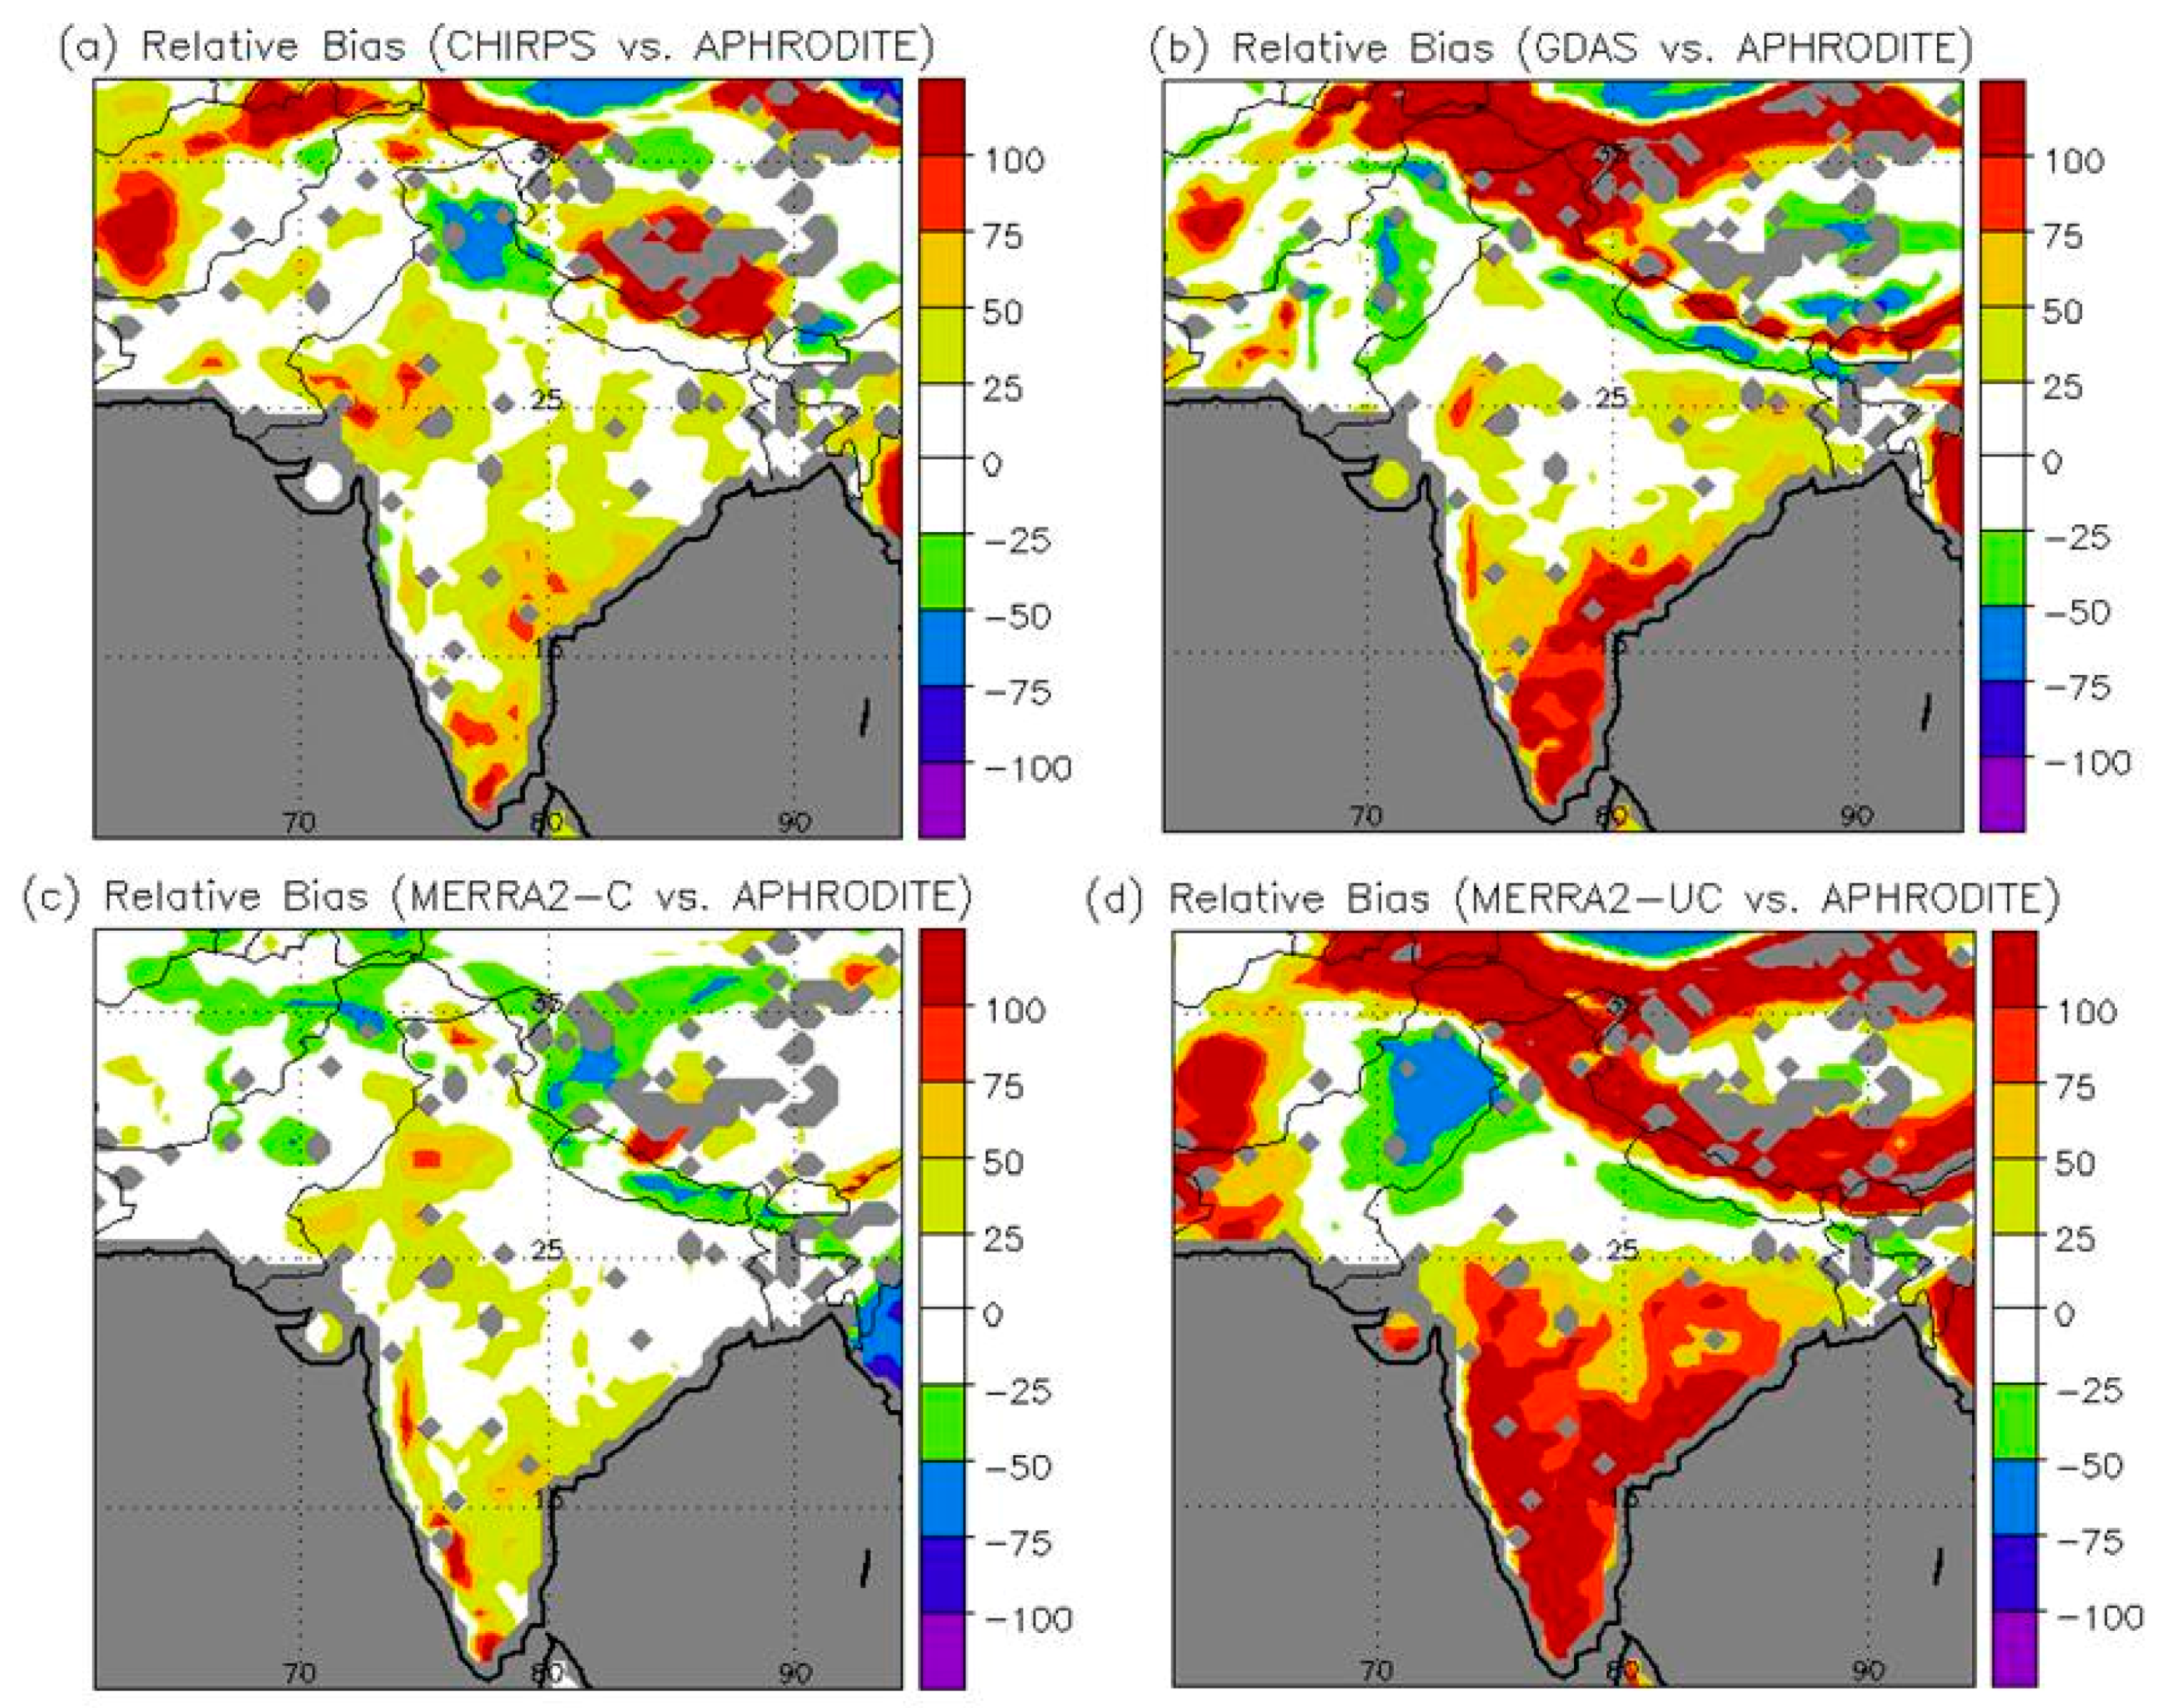
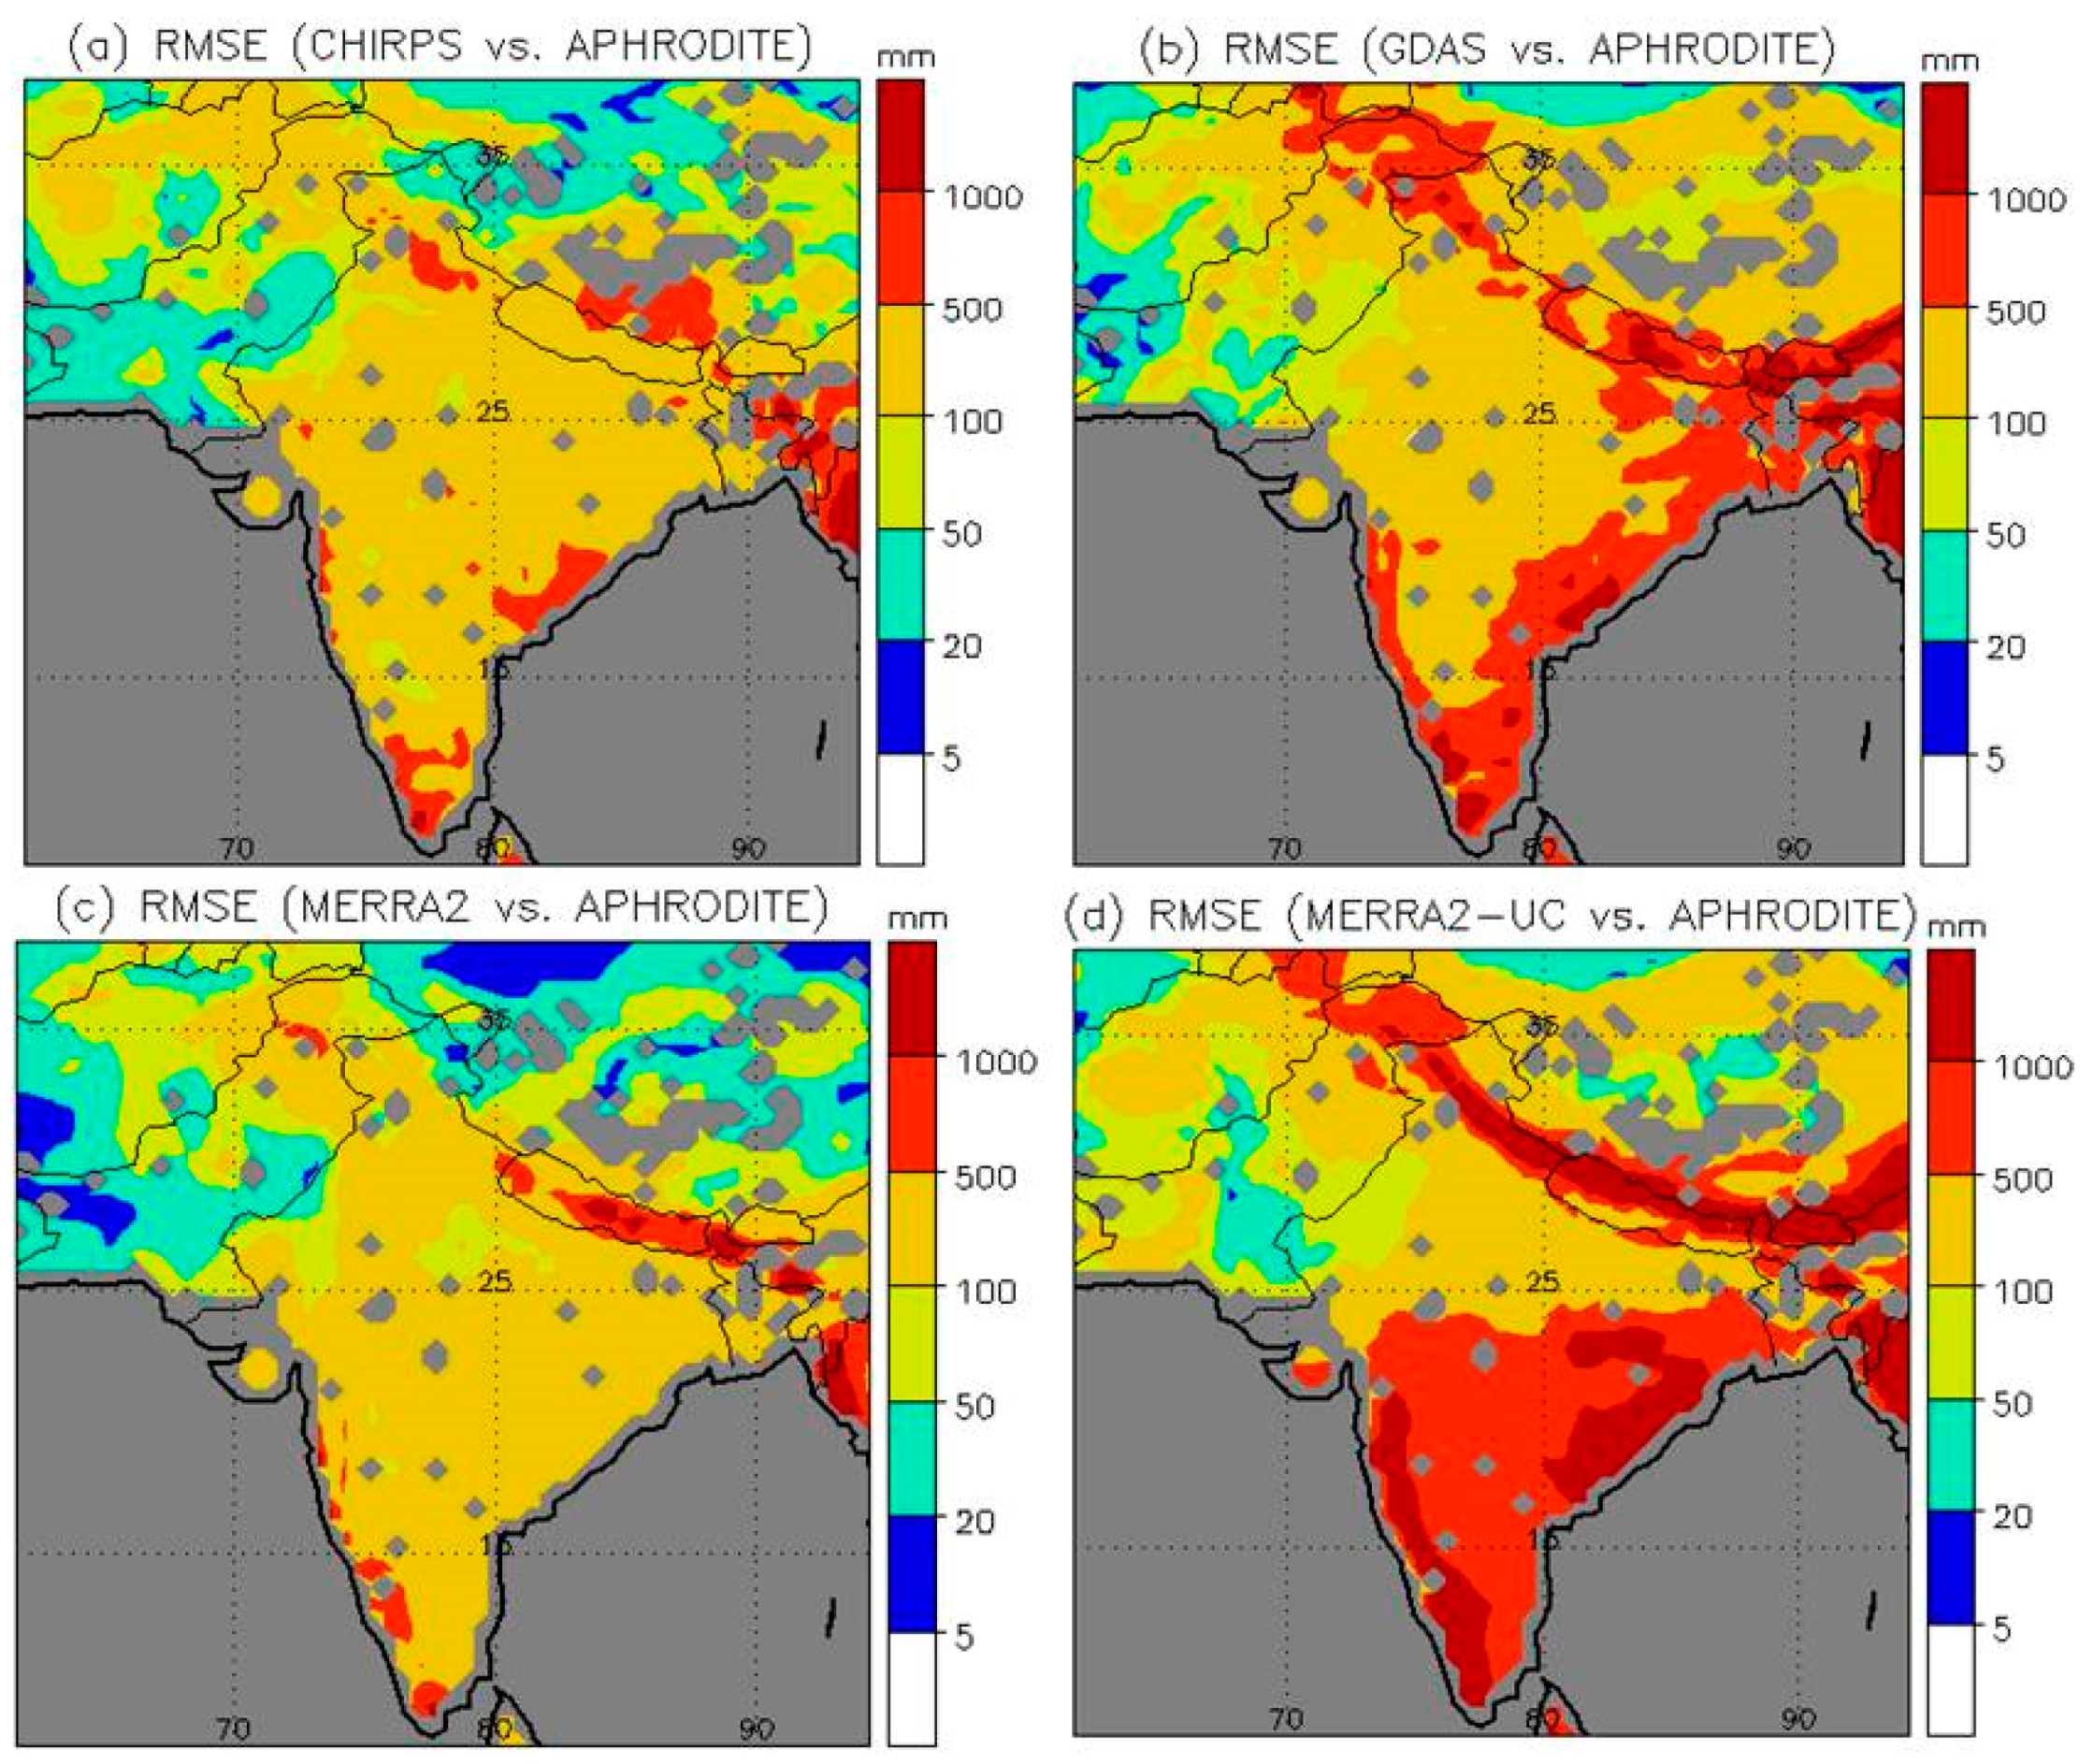
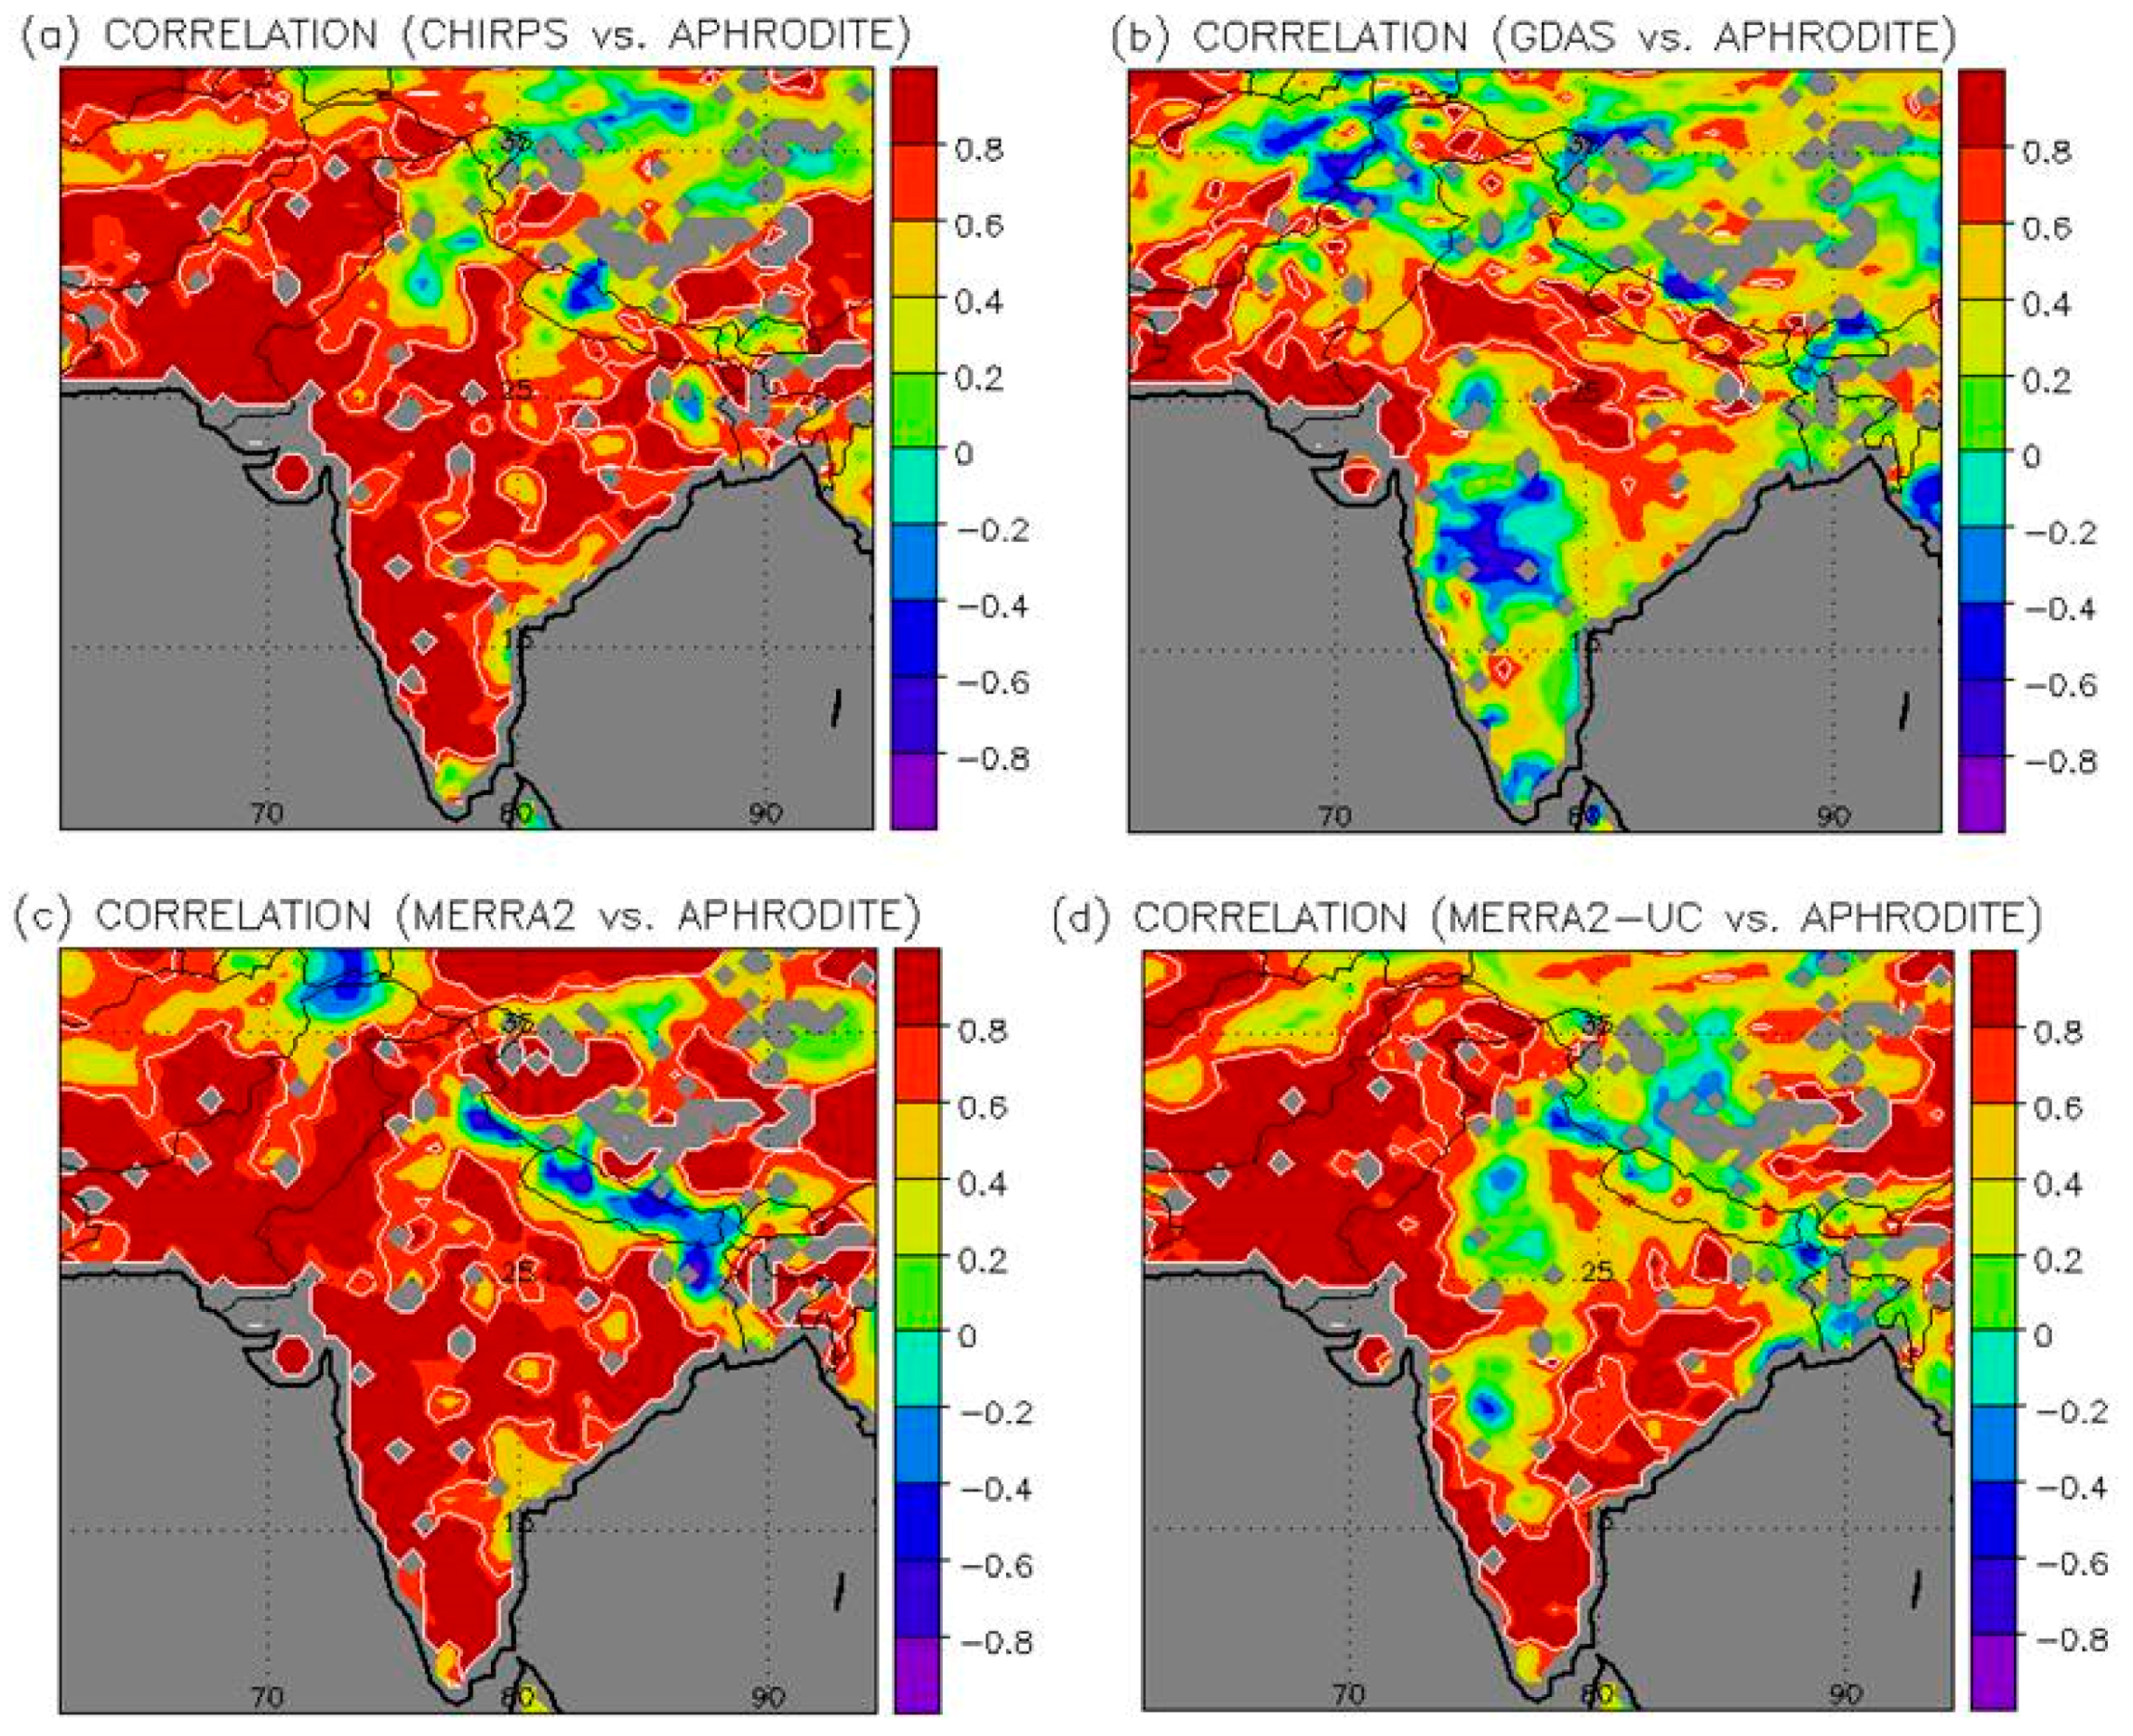
3.1. Meteorological Forcing

First, we examine differences between the key meteorological forcing variable known as precipitation. For the precipitation comparison, we examine the four unique precipitation data sources (CHIRPS, GDAS, MERRA2-C, and MERRA2-UC) and consider their performance relative to the APHRODITE gauge-based product. All four products capture the general spatial distribution of the annual average precipitation (Supplementary Figure S1) with maxima in the high altitude HKH and in the humid eastern portion of the domain. There are, however, substantial quantitative differences between products, which is clear when we map the relative bias measured against APHRODITE (Figure 1).
CHIRPS provides reasonably good visual agreement with APHRODITE for the mean annual precipitation (Figure 1a) where relative bias is within ±25% over large portions of the domain. There is an apparent wet bias (relative to APHRODITE) in the Tibetan Plateau and in portions of Afghanistan. The only strong negative bias (drier than APHRODITE, 50% to 70%) in CHIRPS is over part of Kashmir and Himachal Pradesh (parts of northern India). GDAS, in comparison, shows substantial relative bias to APHRODITE over higher altitude regions of the study area. Very high positive bias (wetter than APHRODITE, greater than 50%) is found over Karakoram, Pamir, portions of the Central and Eastern Himalayas and over the South-Eastern part of the Deccan Plateau and the Eastern Ghats in peninsular India. MERRA2-C shows the best visual agreement with APHRODITE over most of the study domain with biases within 25%. Exceptions are isolated areas of the wet bias in the Western Ghats of India. MERRA2-UC shows a widespread relative bias greater than 100% (wetter than APHRODITE) over the high mountainous part of the Himalayas, Karakoram, and over the Deccan Plateau. In summary, high altitude areas of the mountain chain in the north and the plateau in the south are the sources of major discrepancy. According to this analysis, then, CHIRPS and MERRA2-C have a much lower precipitation bias relative to APHRODITE than do GDAS or, even more so, MERRA2-UC. We have also provided the RMSE value and correlation coefficient at each grid cell between APHRODITE and our four precipitation forcing datasets (see Figure 2 and Figure 3). The spatial pattern of RMSE generally reinforces the relative bias analysis (see Figure 1 and Figure 2). Correlation analysis suggests a maximum spatially widespread positive correlation between APHRODITE and MERRA2-C (Figure 3).
We emphasize that the comparison with APHRODITE does not represent a perfect ground truth. APHRODITE is gauge-based, but, over large areas, it relies on interpolation due to a lack of meteorological station coverage. This absence of data is particularly severe over the west Tibetan Plateau and at high elevations. Furthermore, APHRODITE precipitation is extremely underestimated over higher altitudes, which is shown by Reference [50] using glacier mass balance over the upper Indus basin. On average, actual precipitation is twice that and, in extreme cases, it is a factor of 10 higher than the APHRODITE interpolated value [50]. There has been no similar study of APHRODITE across the entire domain considered in this study, but the results of Immerzeel et al. [50] suggests that there is a potential for a dry bias at high elevations that might also affect the product over other parts of the mountainous region. Comparisons of model and satellite products against APHRODITE, then, are not a definitive evaluation in the data poor but are hydrologically critical headwater regions of the HKH.
To complement the APHRODITE analysis, we perform point checks using monthly accumulated precipitation records obtained from 34 meteorological stations spread across Pakistan, Nepal, Bhutan, and Bangladesh (Figure 4 and Supplementary Table S1). Consistent with the APHRODITE result, CHIRPS and MERRA2-C appeared to perform best across these stations. Average RMSE in monthly rainfall across all stations over this period was 114.1 mm for MERRA2-C and 119.3 mm for CHIRPS while it was 169.9 mm for GDAS and 289.0 mm for MERRA2-UC. For this cross-station evaluation, we used all available data. Since some stations have more missing data than others, the exact RMSE values might not reflect the true average performance for a common period. To address this limitation, RMSE for individual stations for each of the simulations are provided in Supplementary Table S1. This table shows that CHIRPS provided the lowest RMSE at 14 stations with particularly good performance in Bangladesh while MERRA2-C performed best at 16 stations with very strong performance in Pakistan. Please note that the values extracted from a gridded product may not give ideal representation of precipitation recorded at a weather station. Strong performance of both CHIRPS and MERRA2-C relative to GDAS and MERRA2-UC is not particularly surprising since both CHIRPS and MERRA2-C include a correction to the in situ station data. Stations incorporated to APHRODITE might also be used by these other products. Our understanding is that the station data used in our point comparisons are not included in either product since they are tipping bucket gauges maintained by the HKH-HYCOS program that do not participate in standard data aggregation programs.

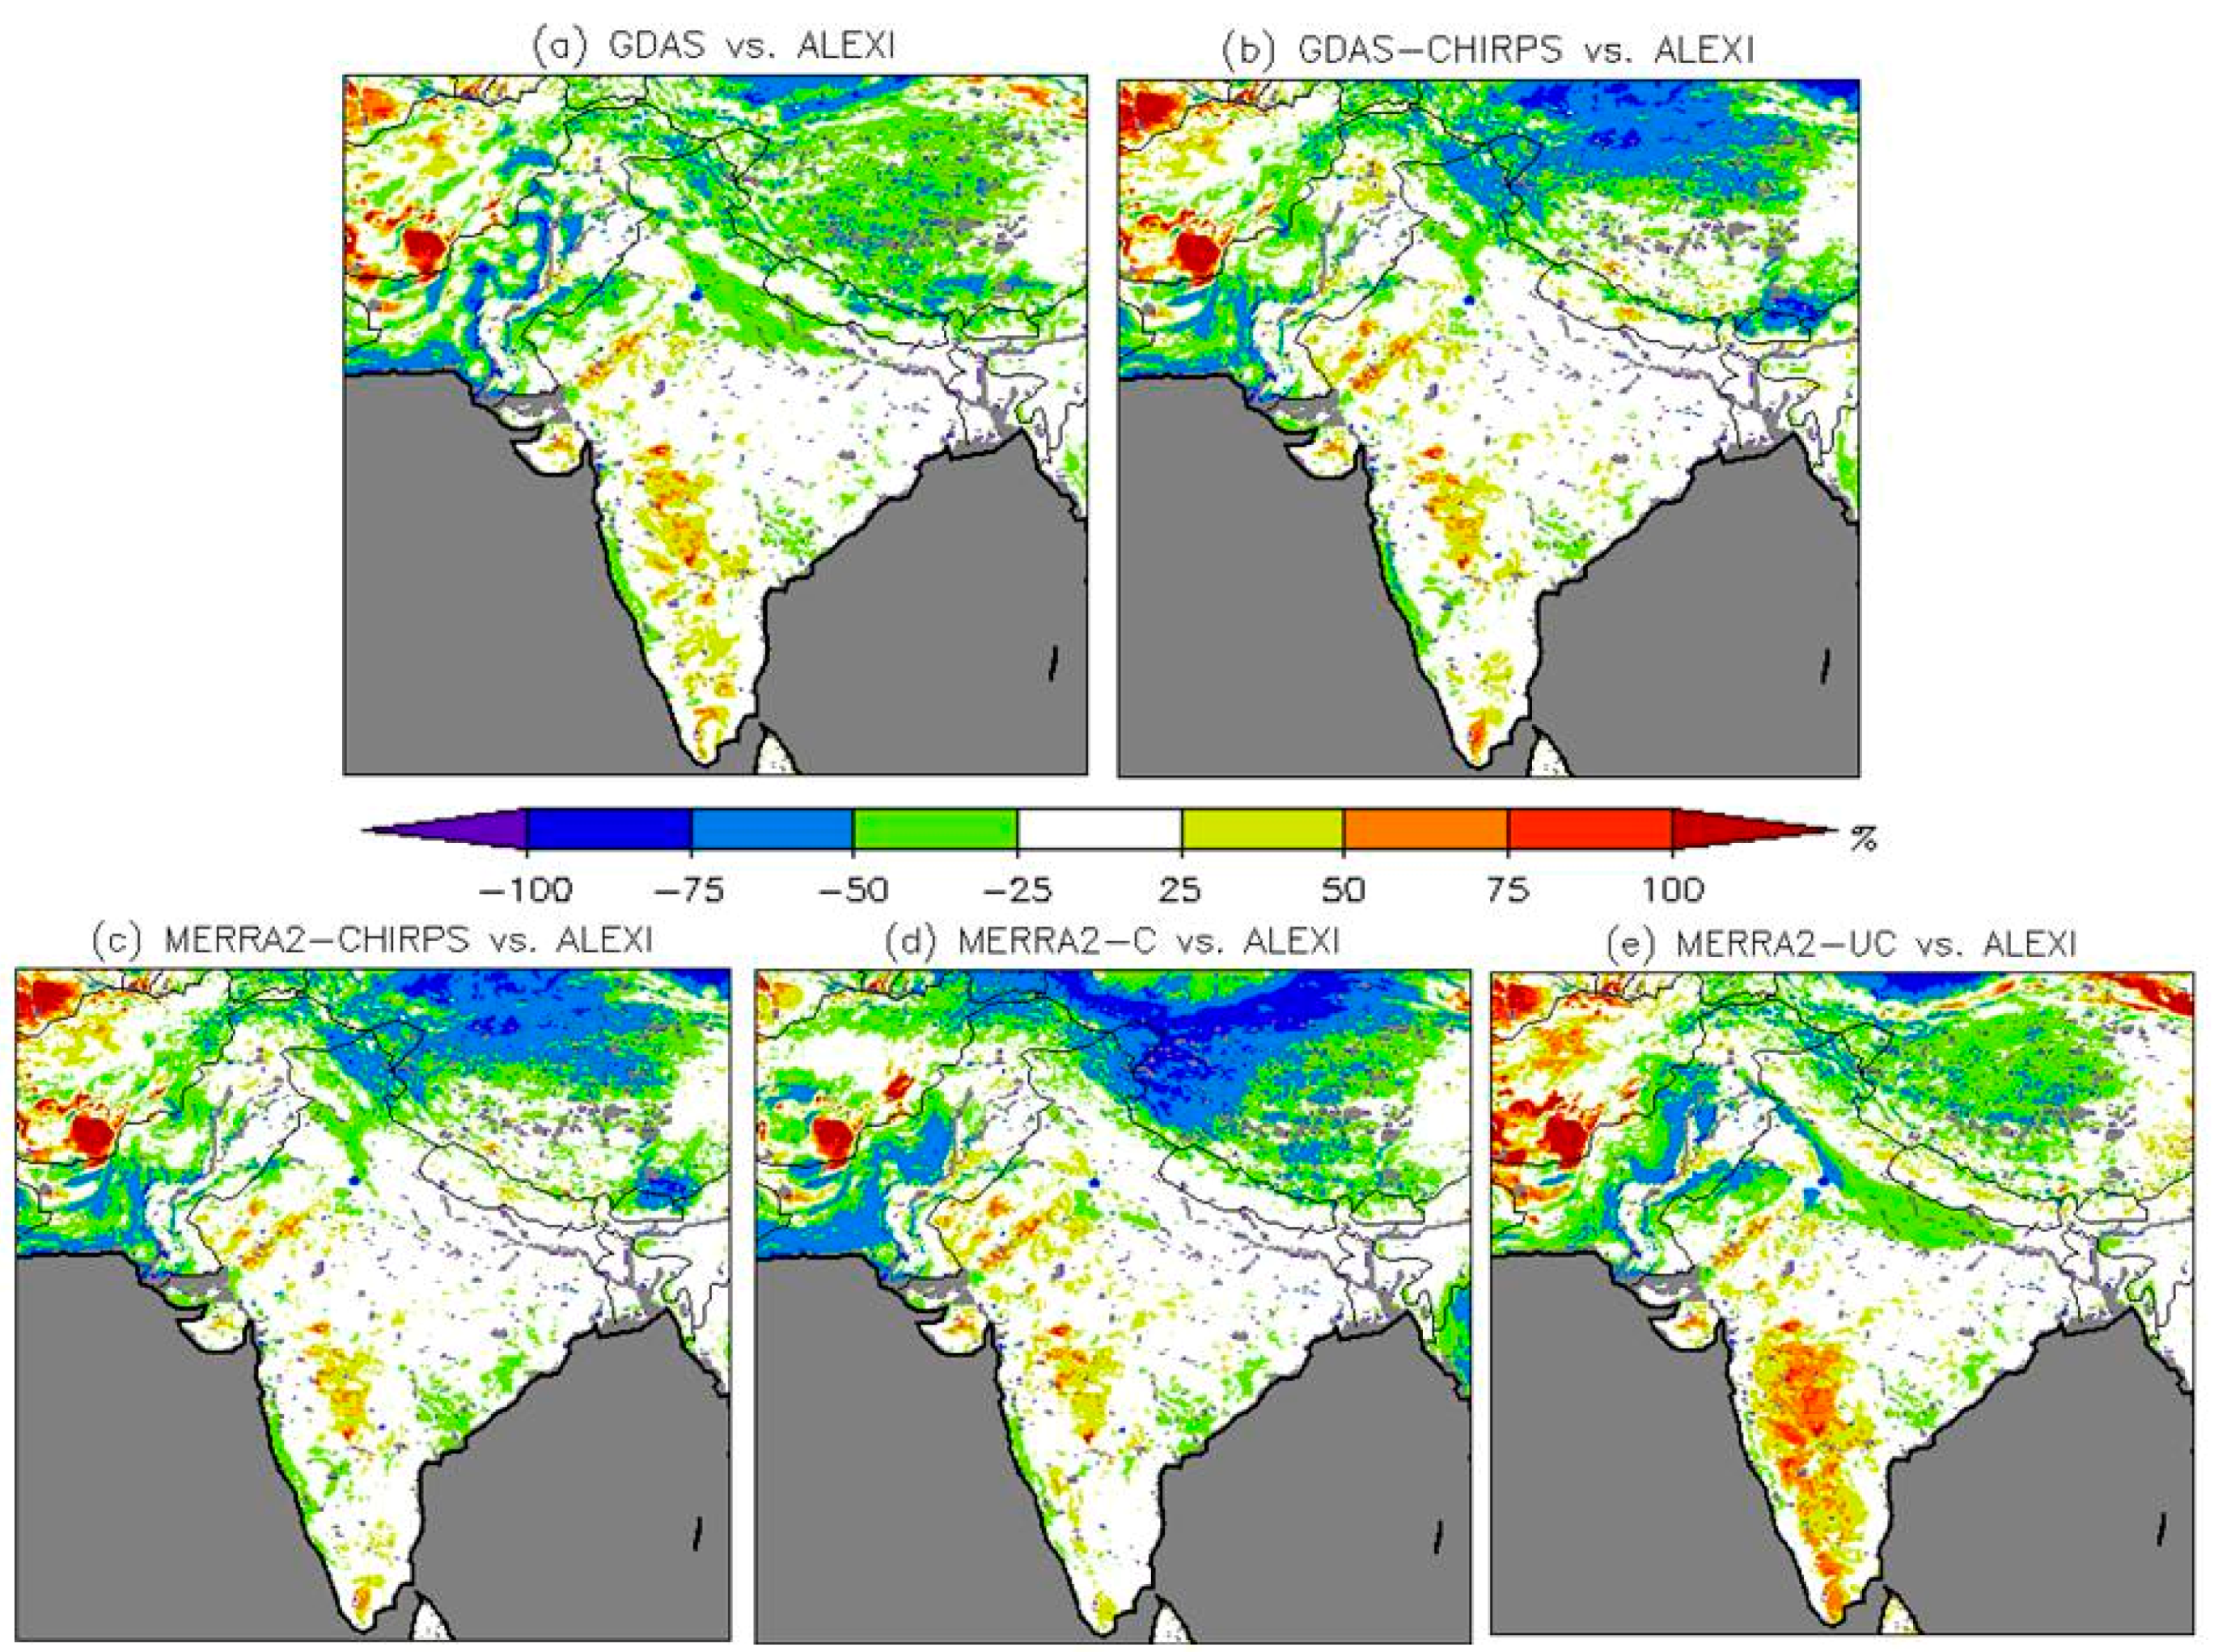
3.2. Evapotranspiration

Climatology of annual evapotranspiration (ET) in each simulation as well as in ALEXI is mapped in Supplementary Figure S2. Note that the Indus valley and the lower Ganges-Brahmaputra river basin show high annual ET and mountainous regions of the north of the domain exhibit low ET. Next, we compared climatology of the annual simulated ET to ALEXI through a relative bias (Figure 5). We emphasize that these comparisons do not represent a definitive evaluation since ALEXI may have its own uncharacterized biases in this region. For example, we see systematic differences between all five Noah simulations and ALEXI on the Deccan Plateau and Aravalli Mountains of India (simulated ET higher than ALEXI ET) and in the mountainous region of Suleiman in Pakistan (simulated ET lower than ALEXI ET). This could be due to Noah errors, but the fact that all simulations differ from ALEXI in the same direction in these regions suggests that ALEXI might be encountering biases on these topographic features. Nevertheless, while we do not have quantitative evaluations of ALEXI in this region, numerous evaluation studies from diverse climate zones around the world have found ALEXI biases to be on the order of 10% or smaller. Therefore, outside of specific, localized artifacts, we expect that ALEXI estimates are reasonably reliable and that large deviations from ALEXI are indications of the model error. For example, while all simulations show some difference from ALEXI in the heart of the Deccan Plateau, MERRA2-UC shows widespread and large positive bias (greater than 75%, more ET in the model compared to ALEXI) over much of the peninsular India. This mirrors the MERRA2-UC precipitation field (relative bias as in Figure 1). This high ET relative to other simulations and ALEXI provides further evidence suggesting that MERRA2-UC has a wet bias in this region.
Figure 5 also shows that a greater than 50% negative bias (less ET in model) is found over the Karakoram and over the Tibetan Plateau in GDAS-CHIRPS, MERRA2-CHIRPS, and MERRA2-C. In other words, the model forced with precipitation from CHIRPS and MERRA2-C has less ET than estimated by ALEXI. In this case, ALEXI bias cannot be ruled out. Nevertheless, the significant underestimate of ET in simulations relative to ALEXI suggests that these simulations might have a low bias in precipitation. Precipitation comparisons with APHRODITE (Figure 1) do not fully corroborate this interpretation, but it is possible that APHRODITE itself underestimates precipitation in this high altitude, poorly instrumented region. The low ET bias shown in Figure 5, then, would provide additional evidence that CHIRPS and MERRA2-C underestimate precipitation and ET in the Karakorum and Tibet.

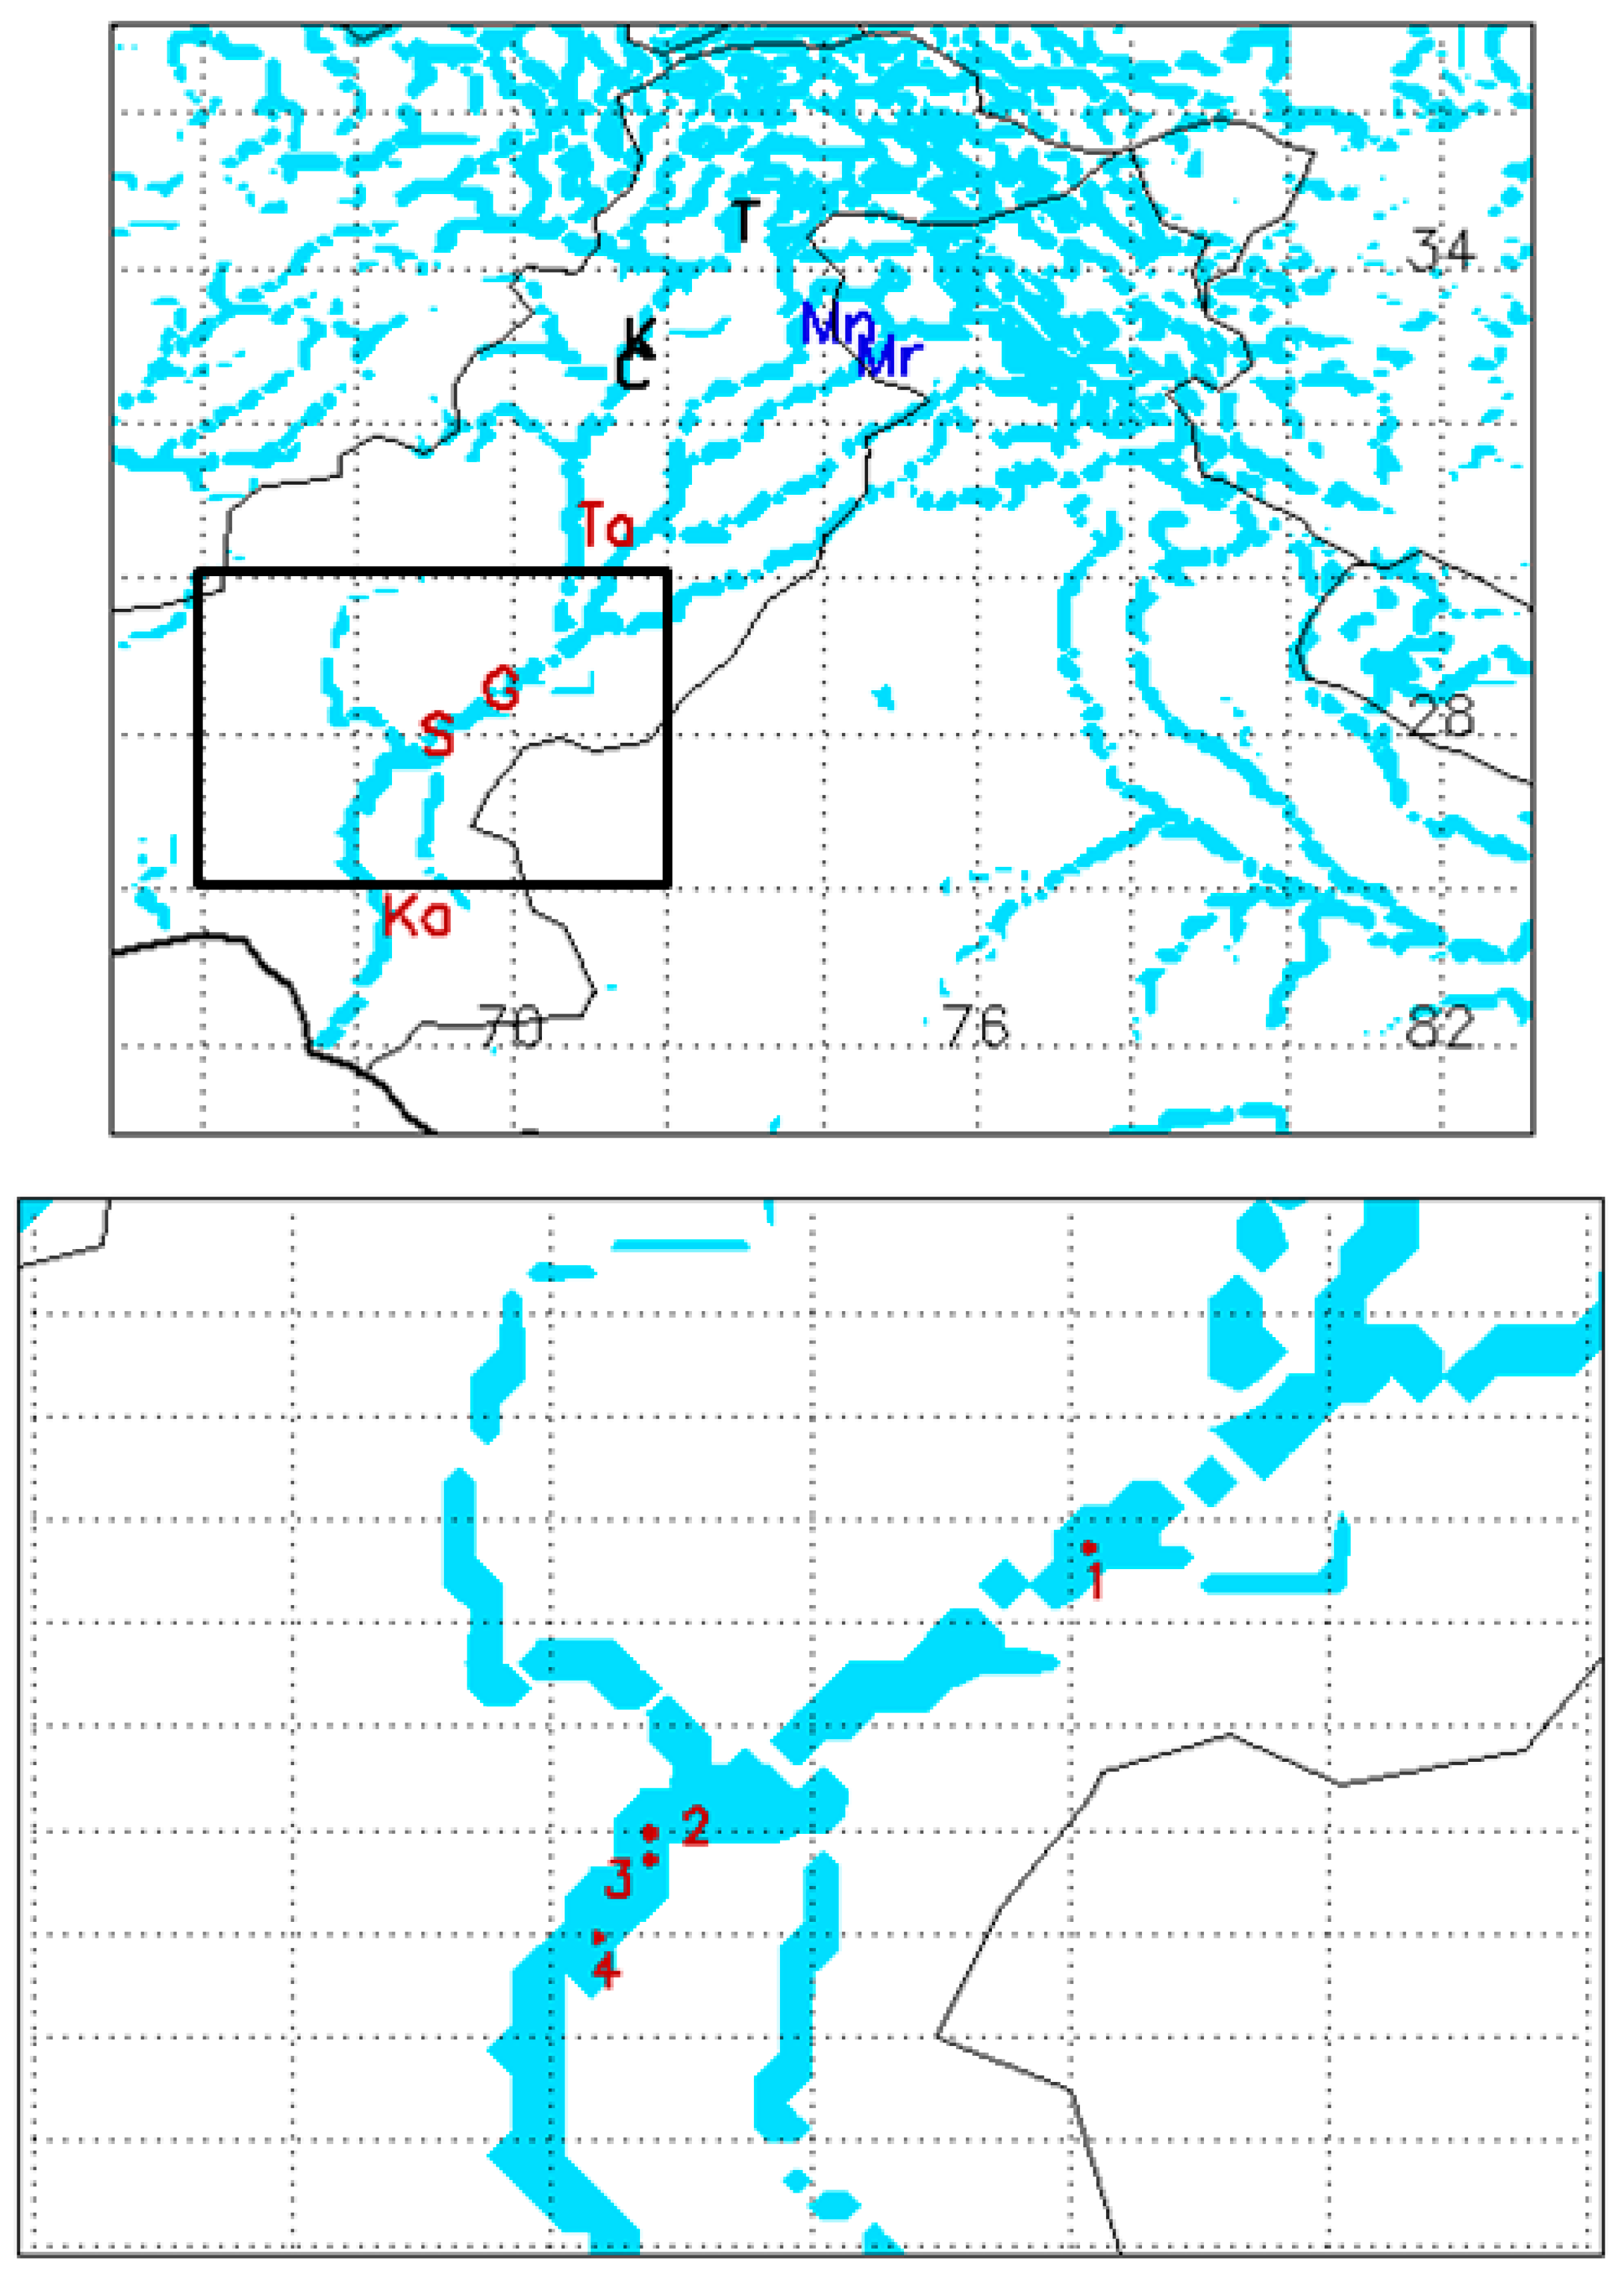
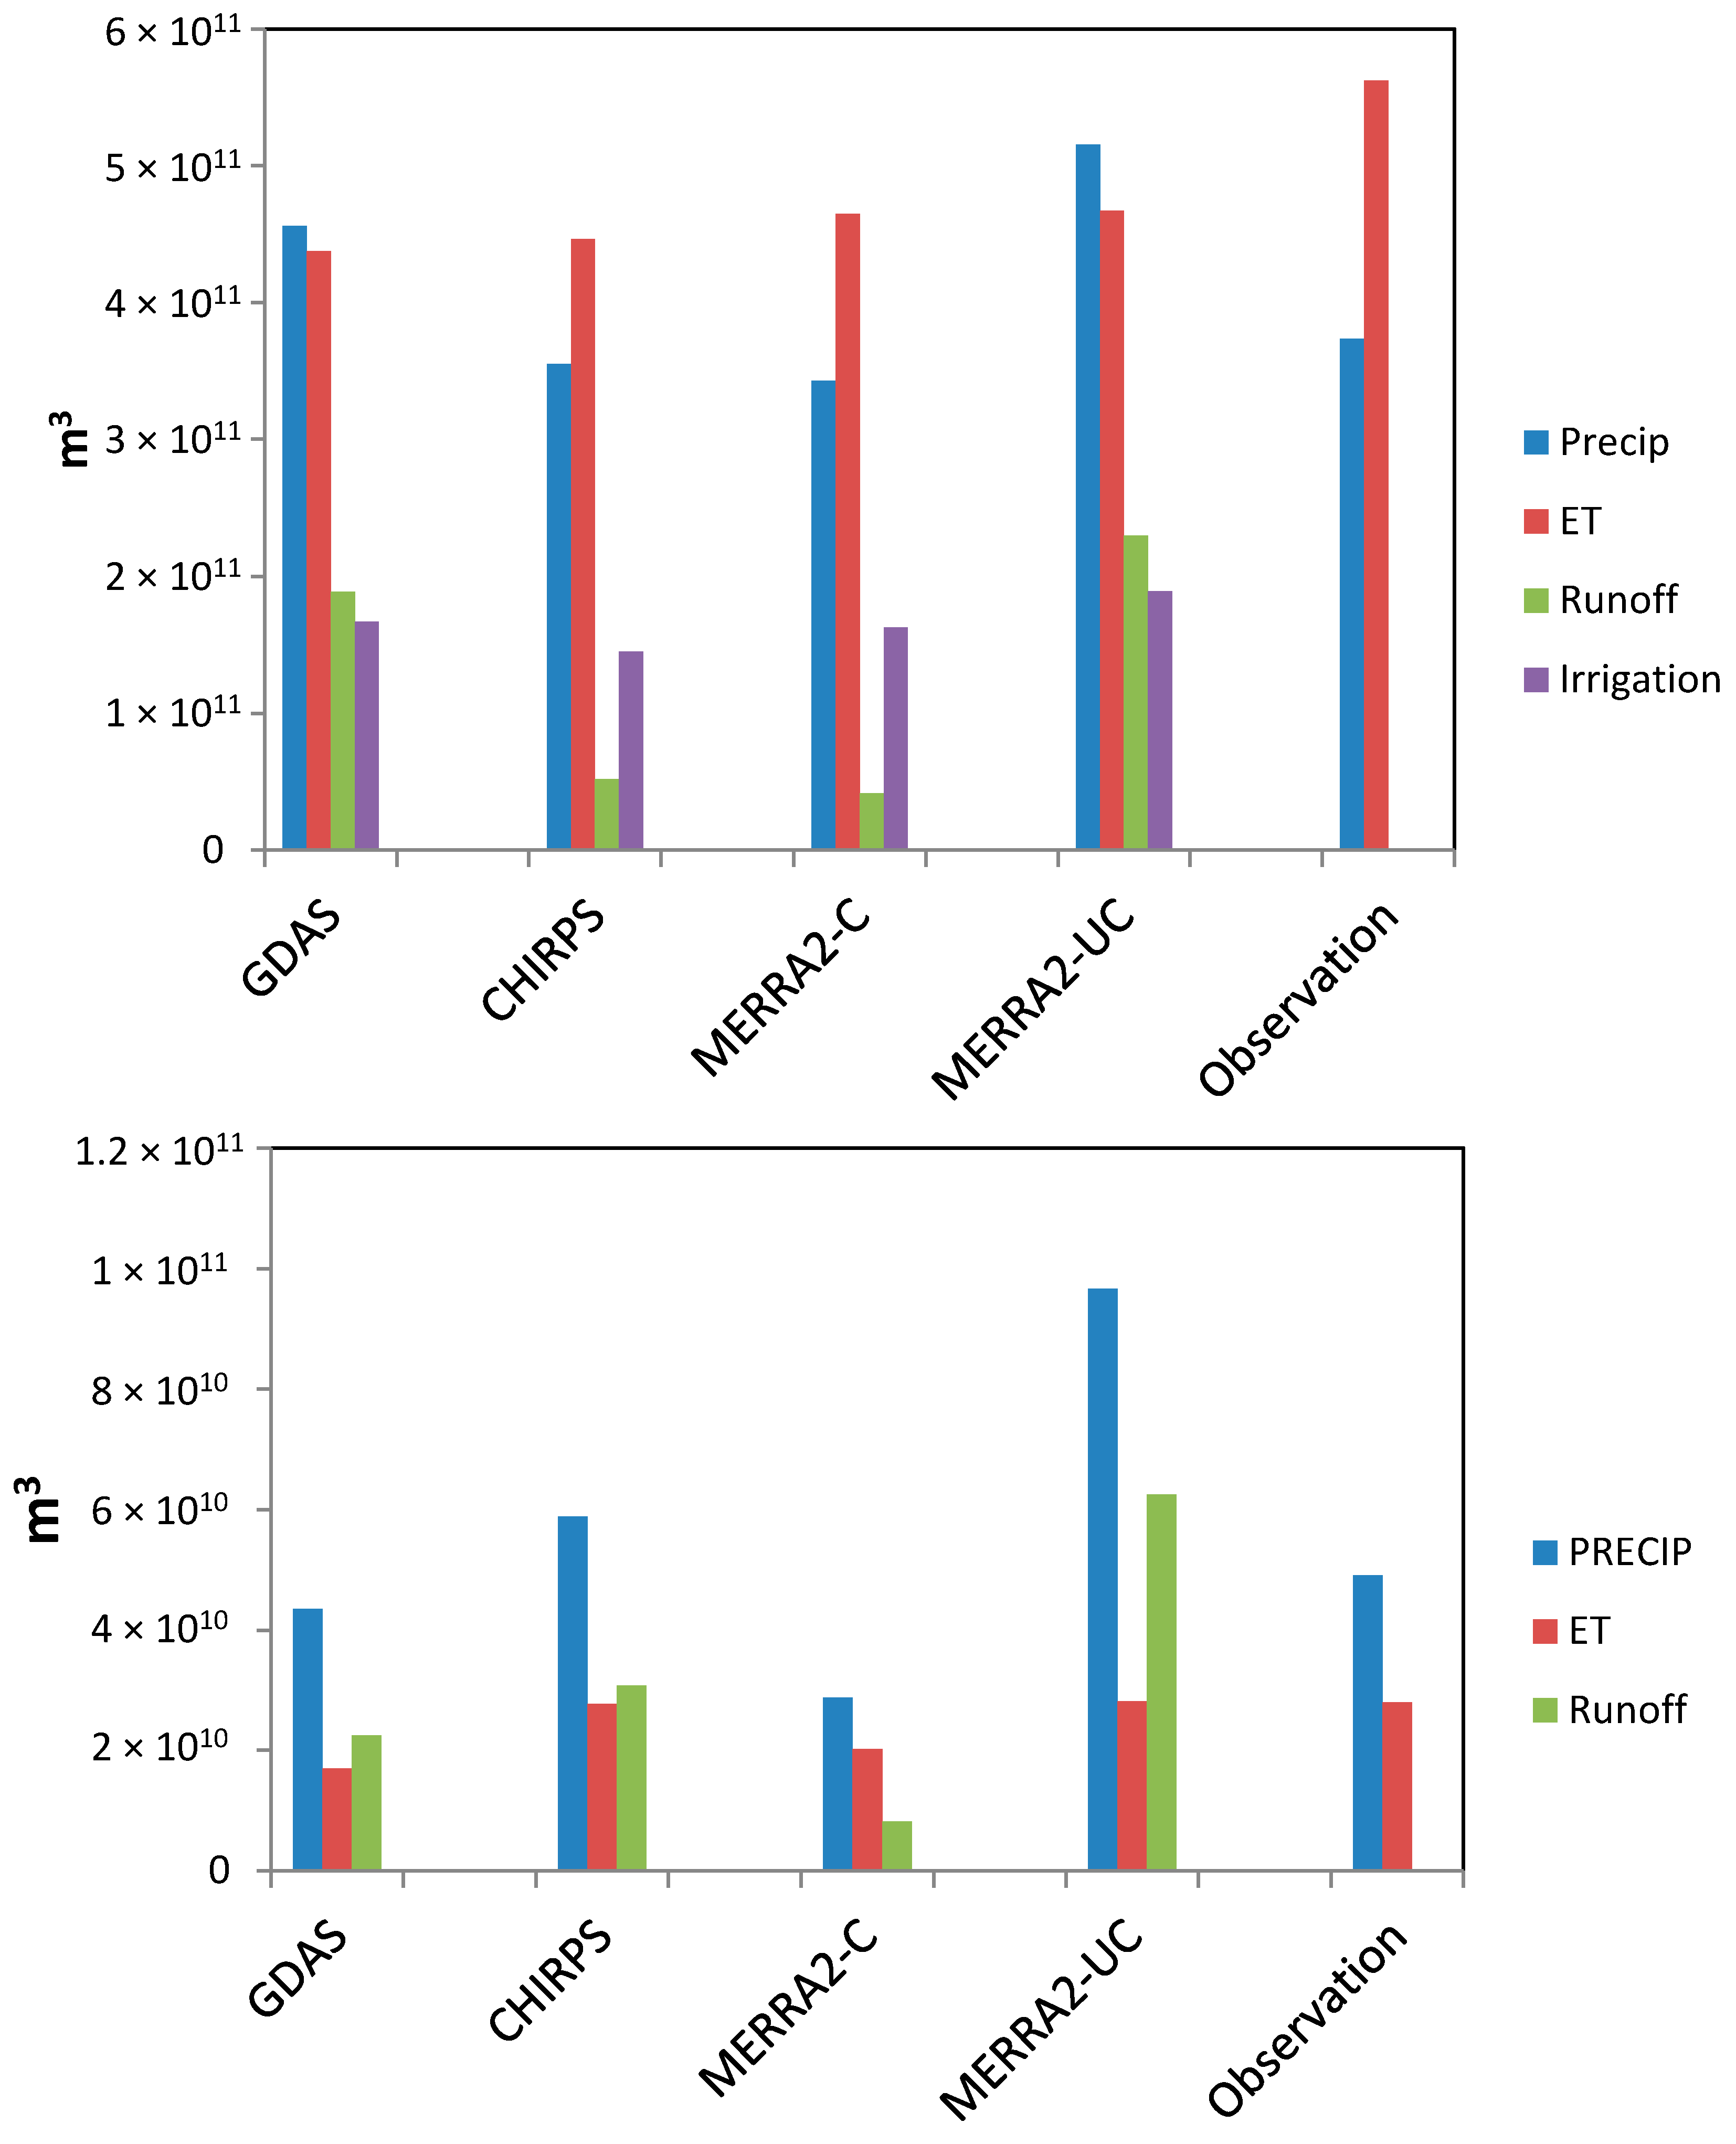
3.3. Basin Scale Analysis

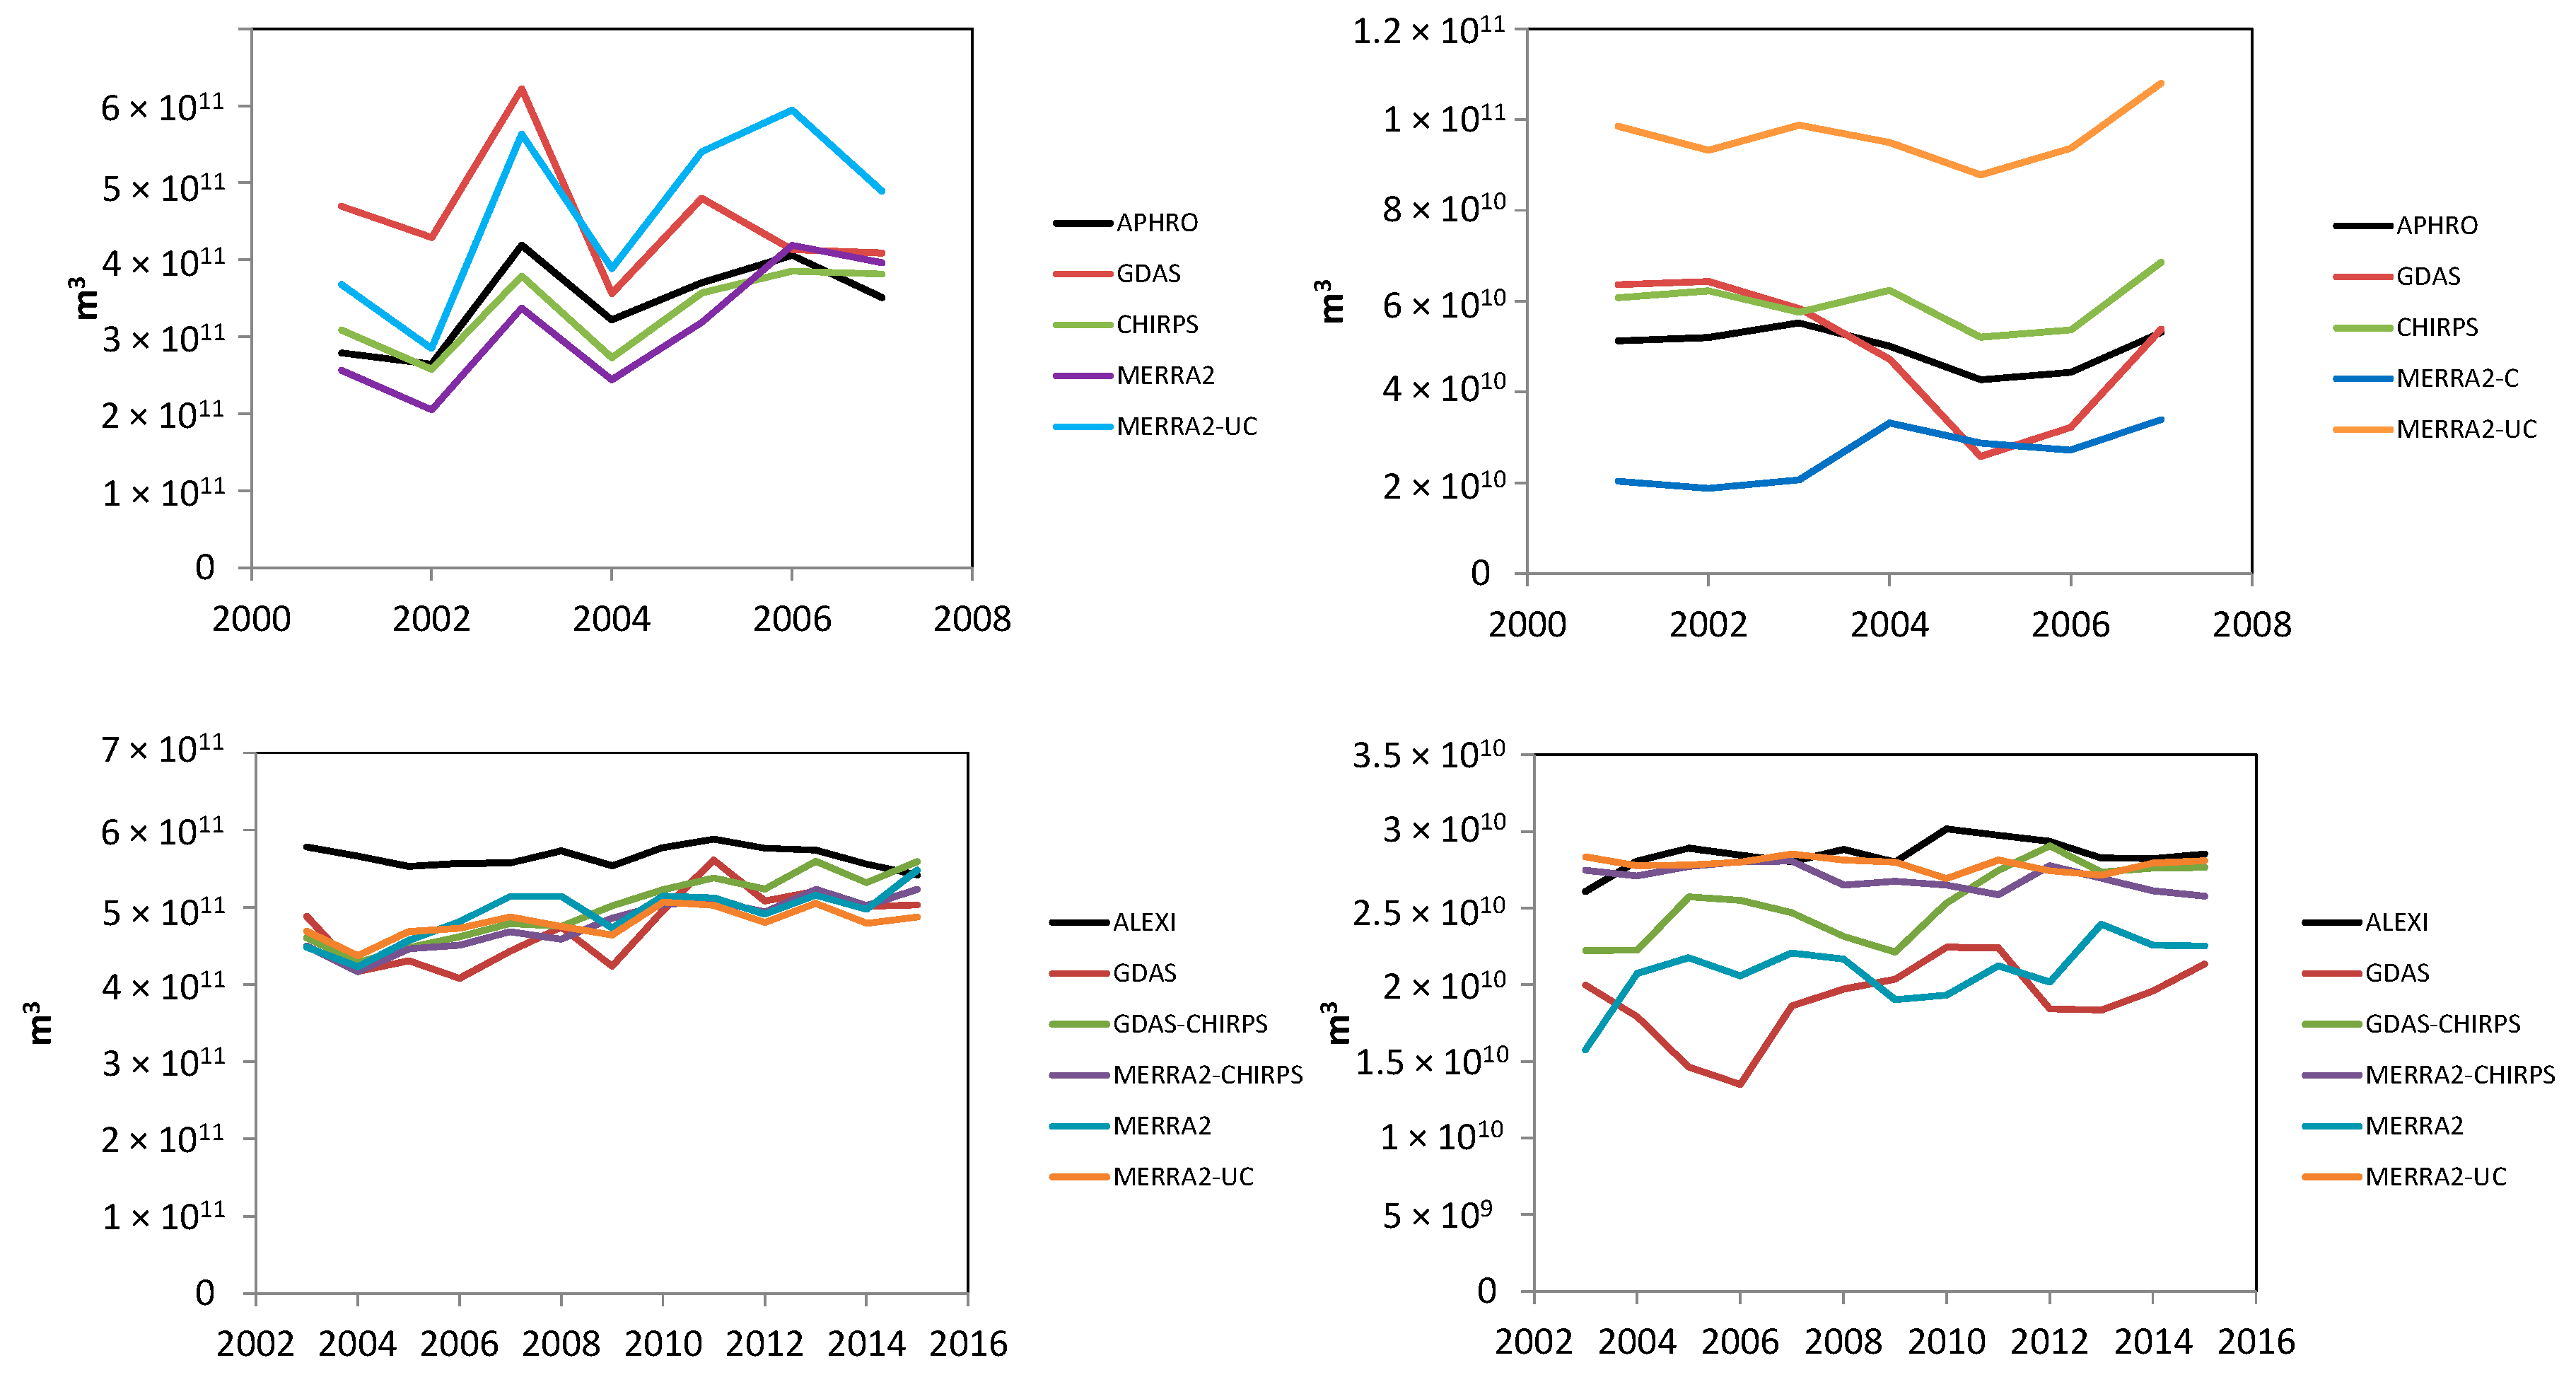
3.3.1. Precipitation and ET
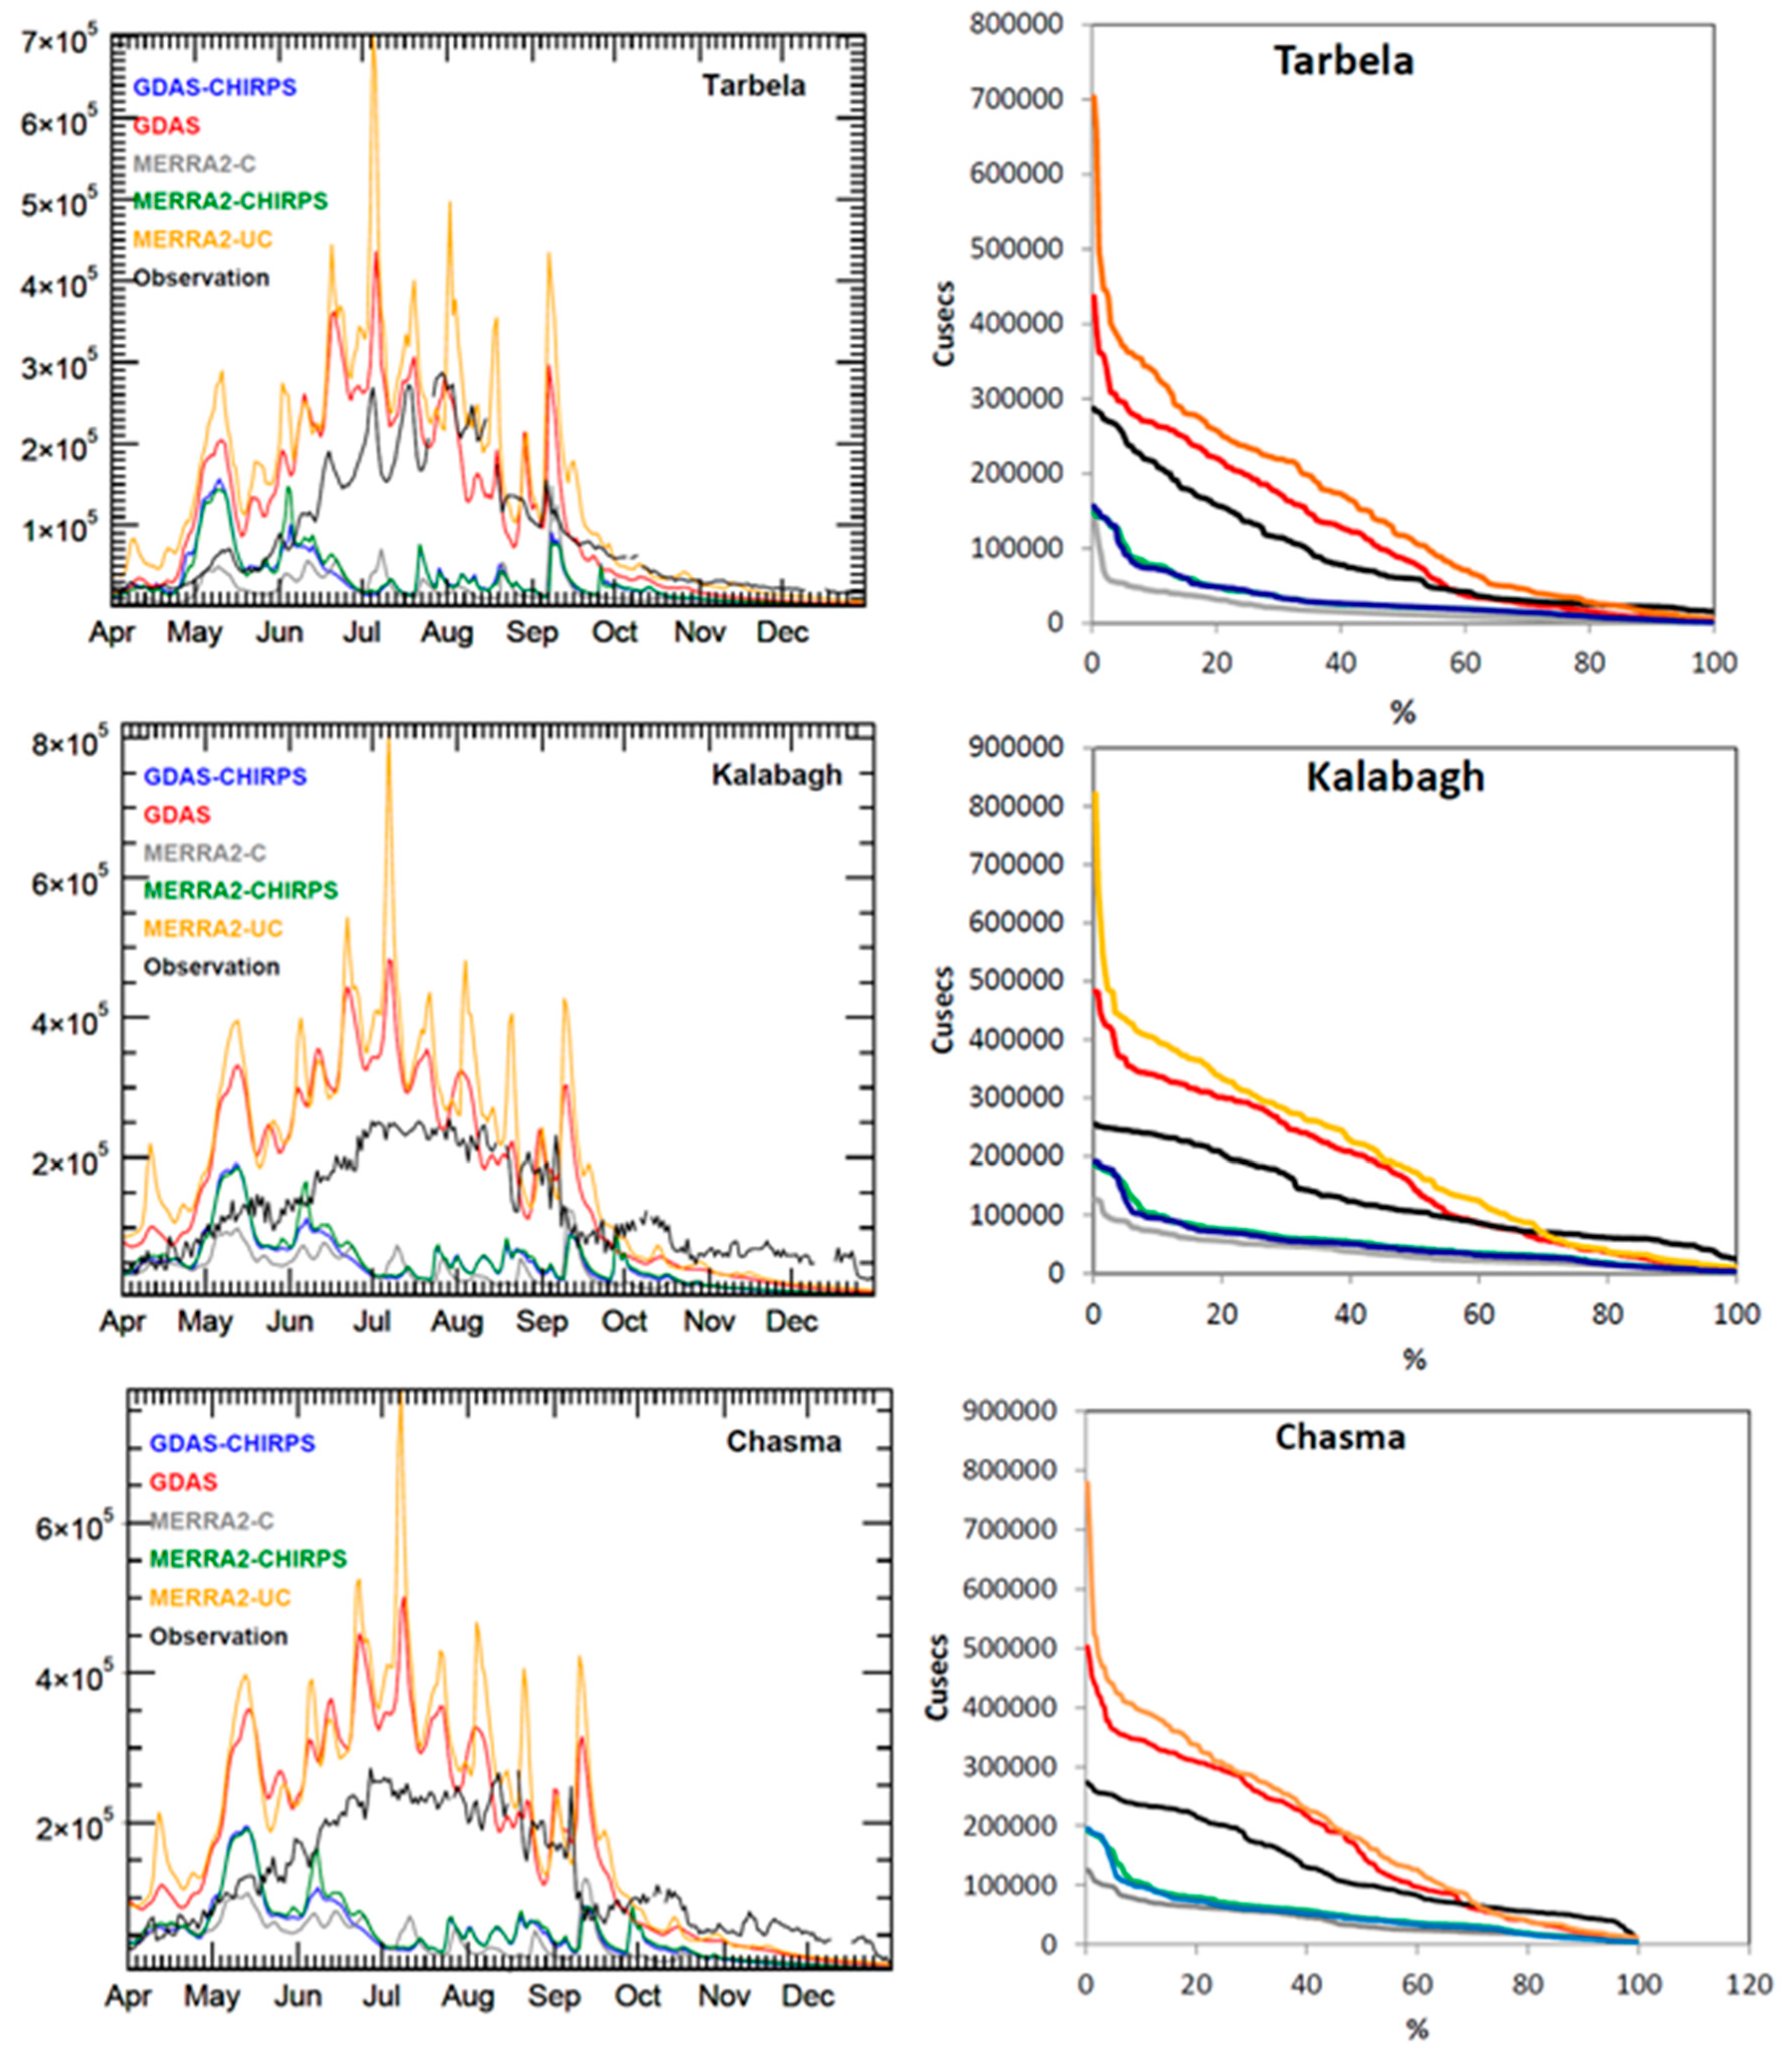
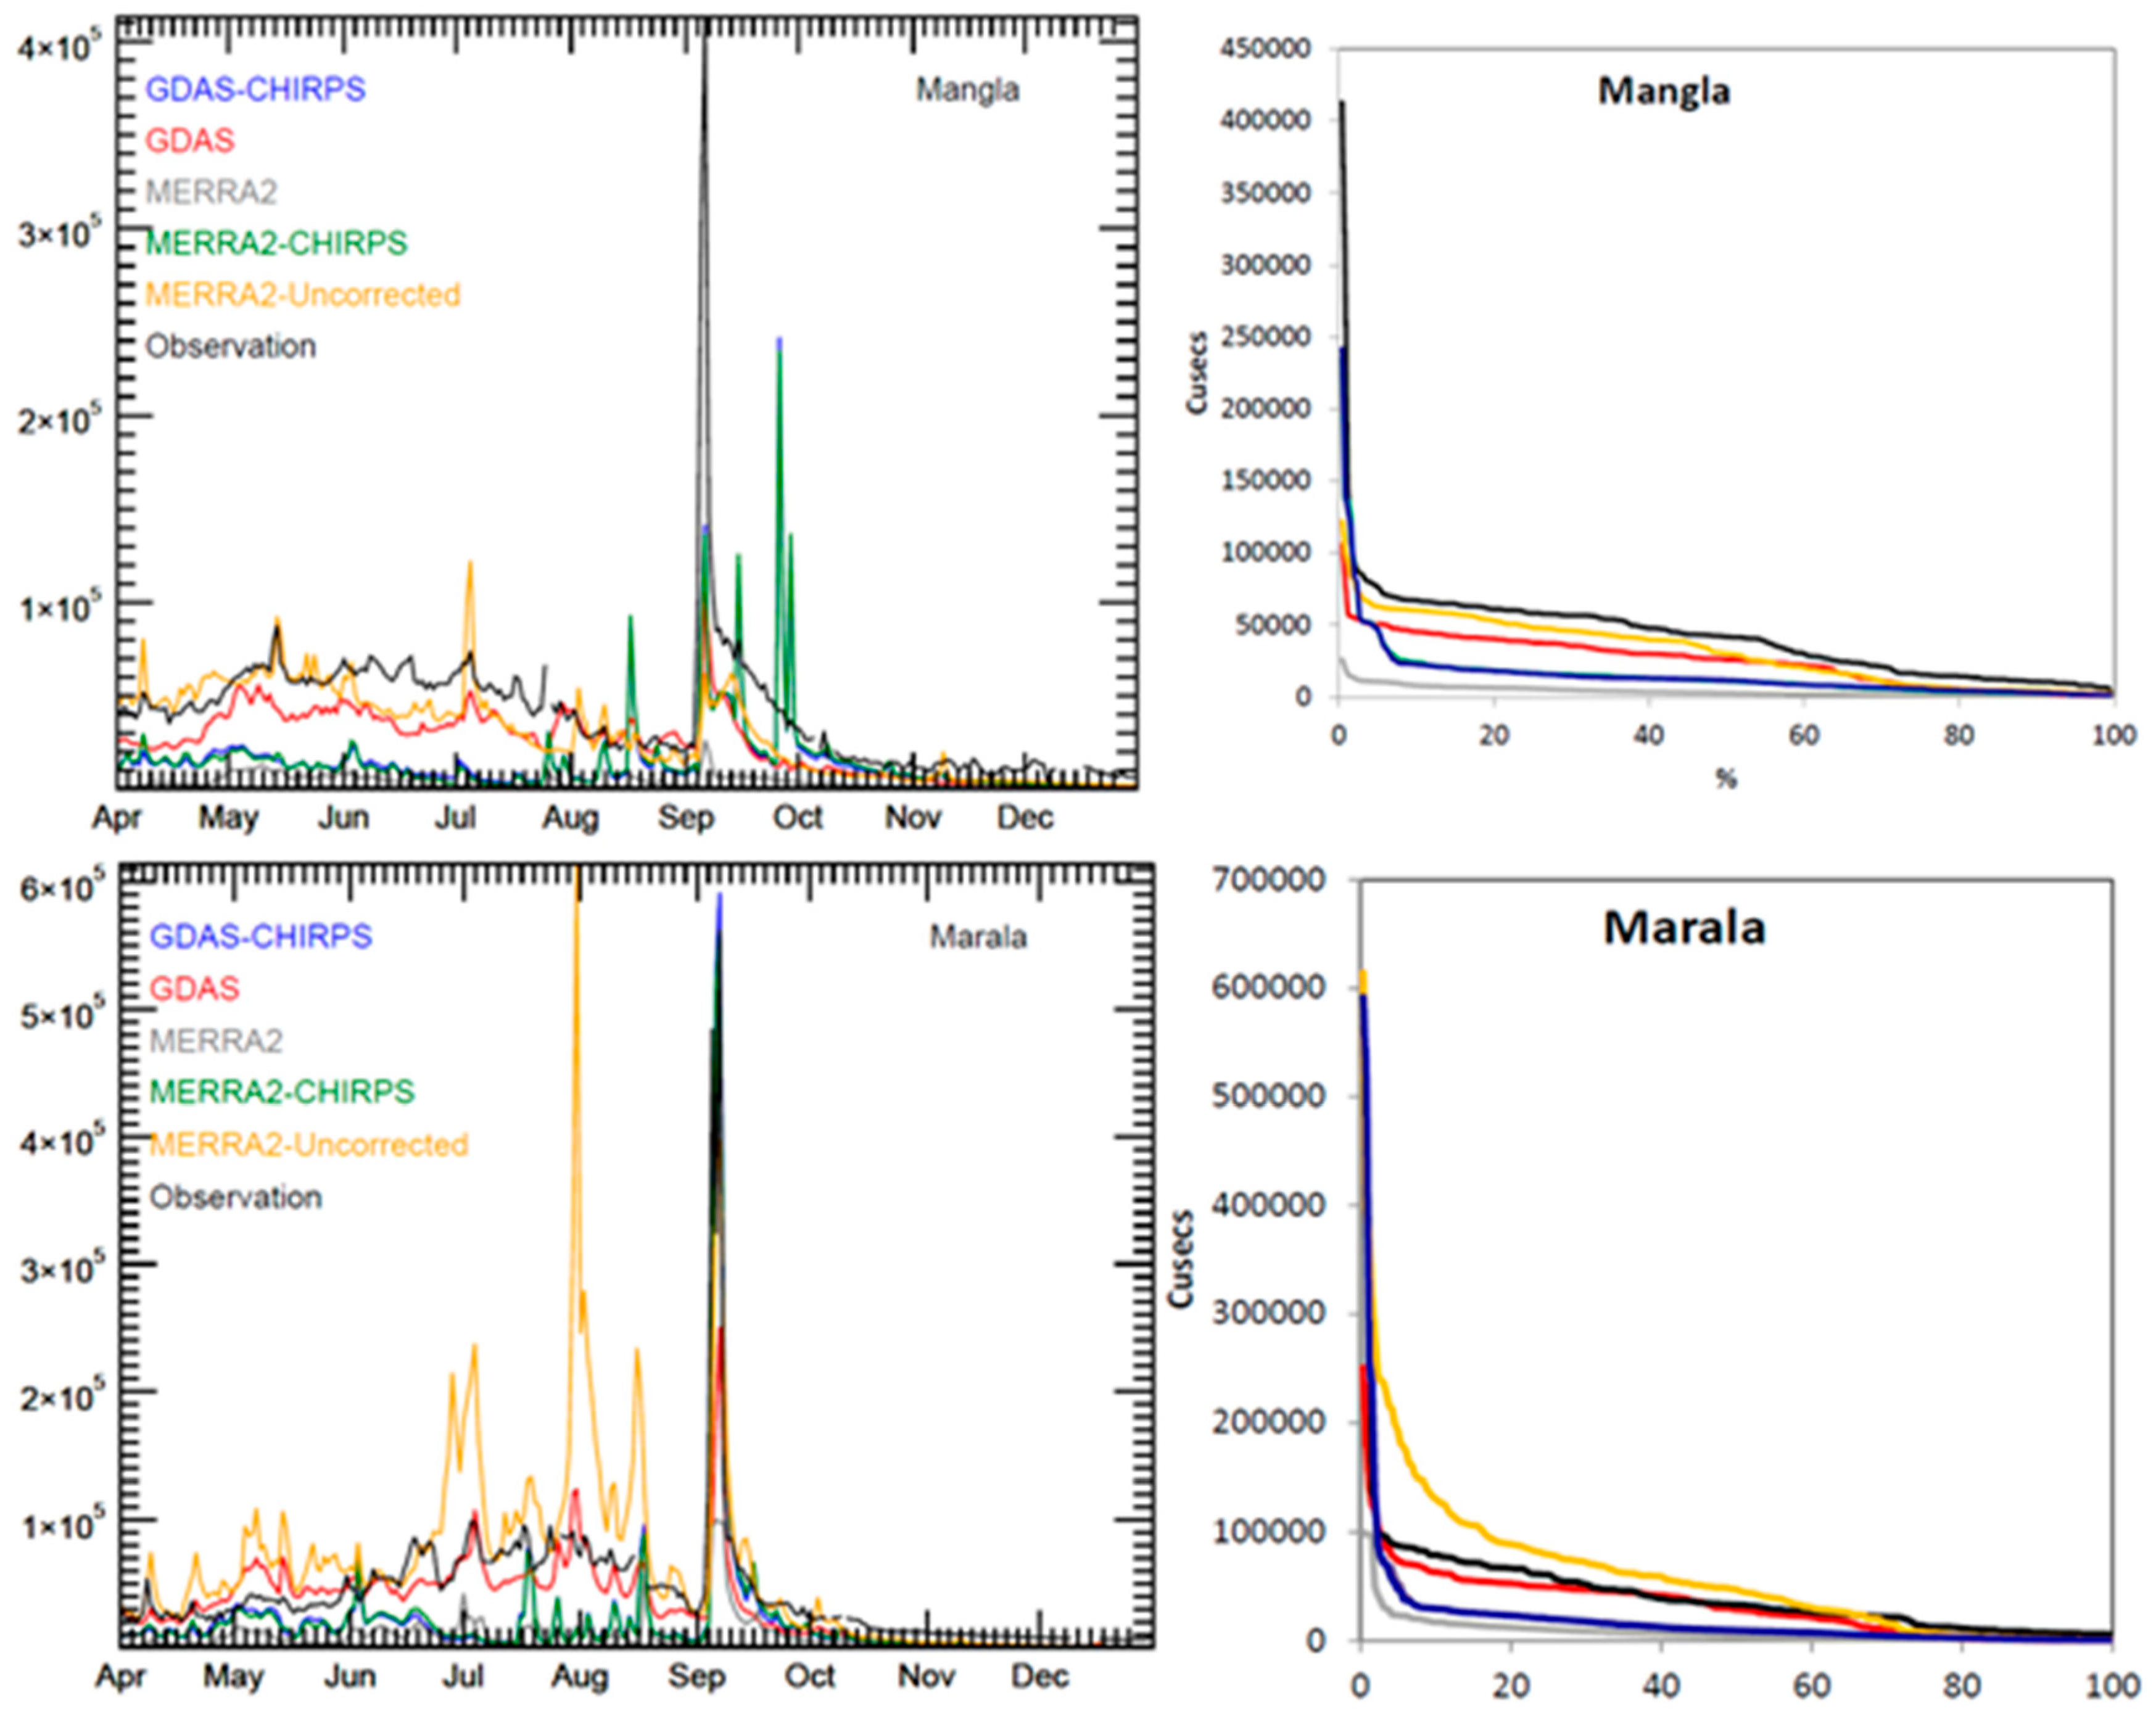
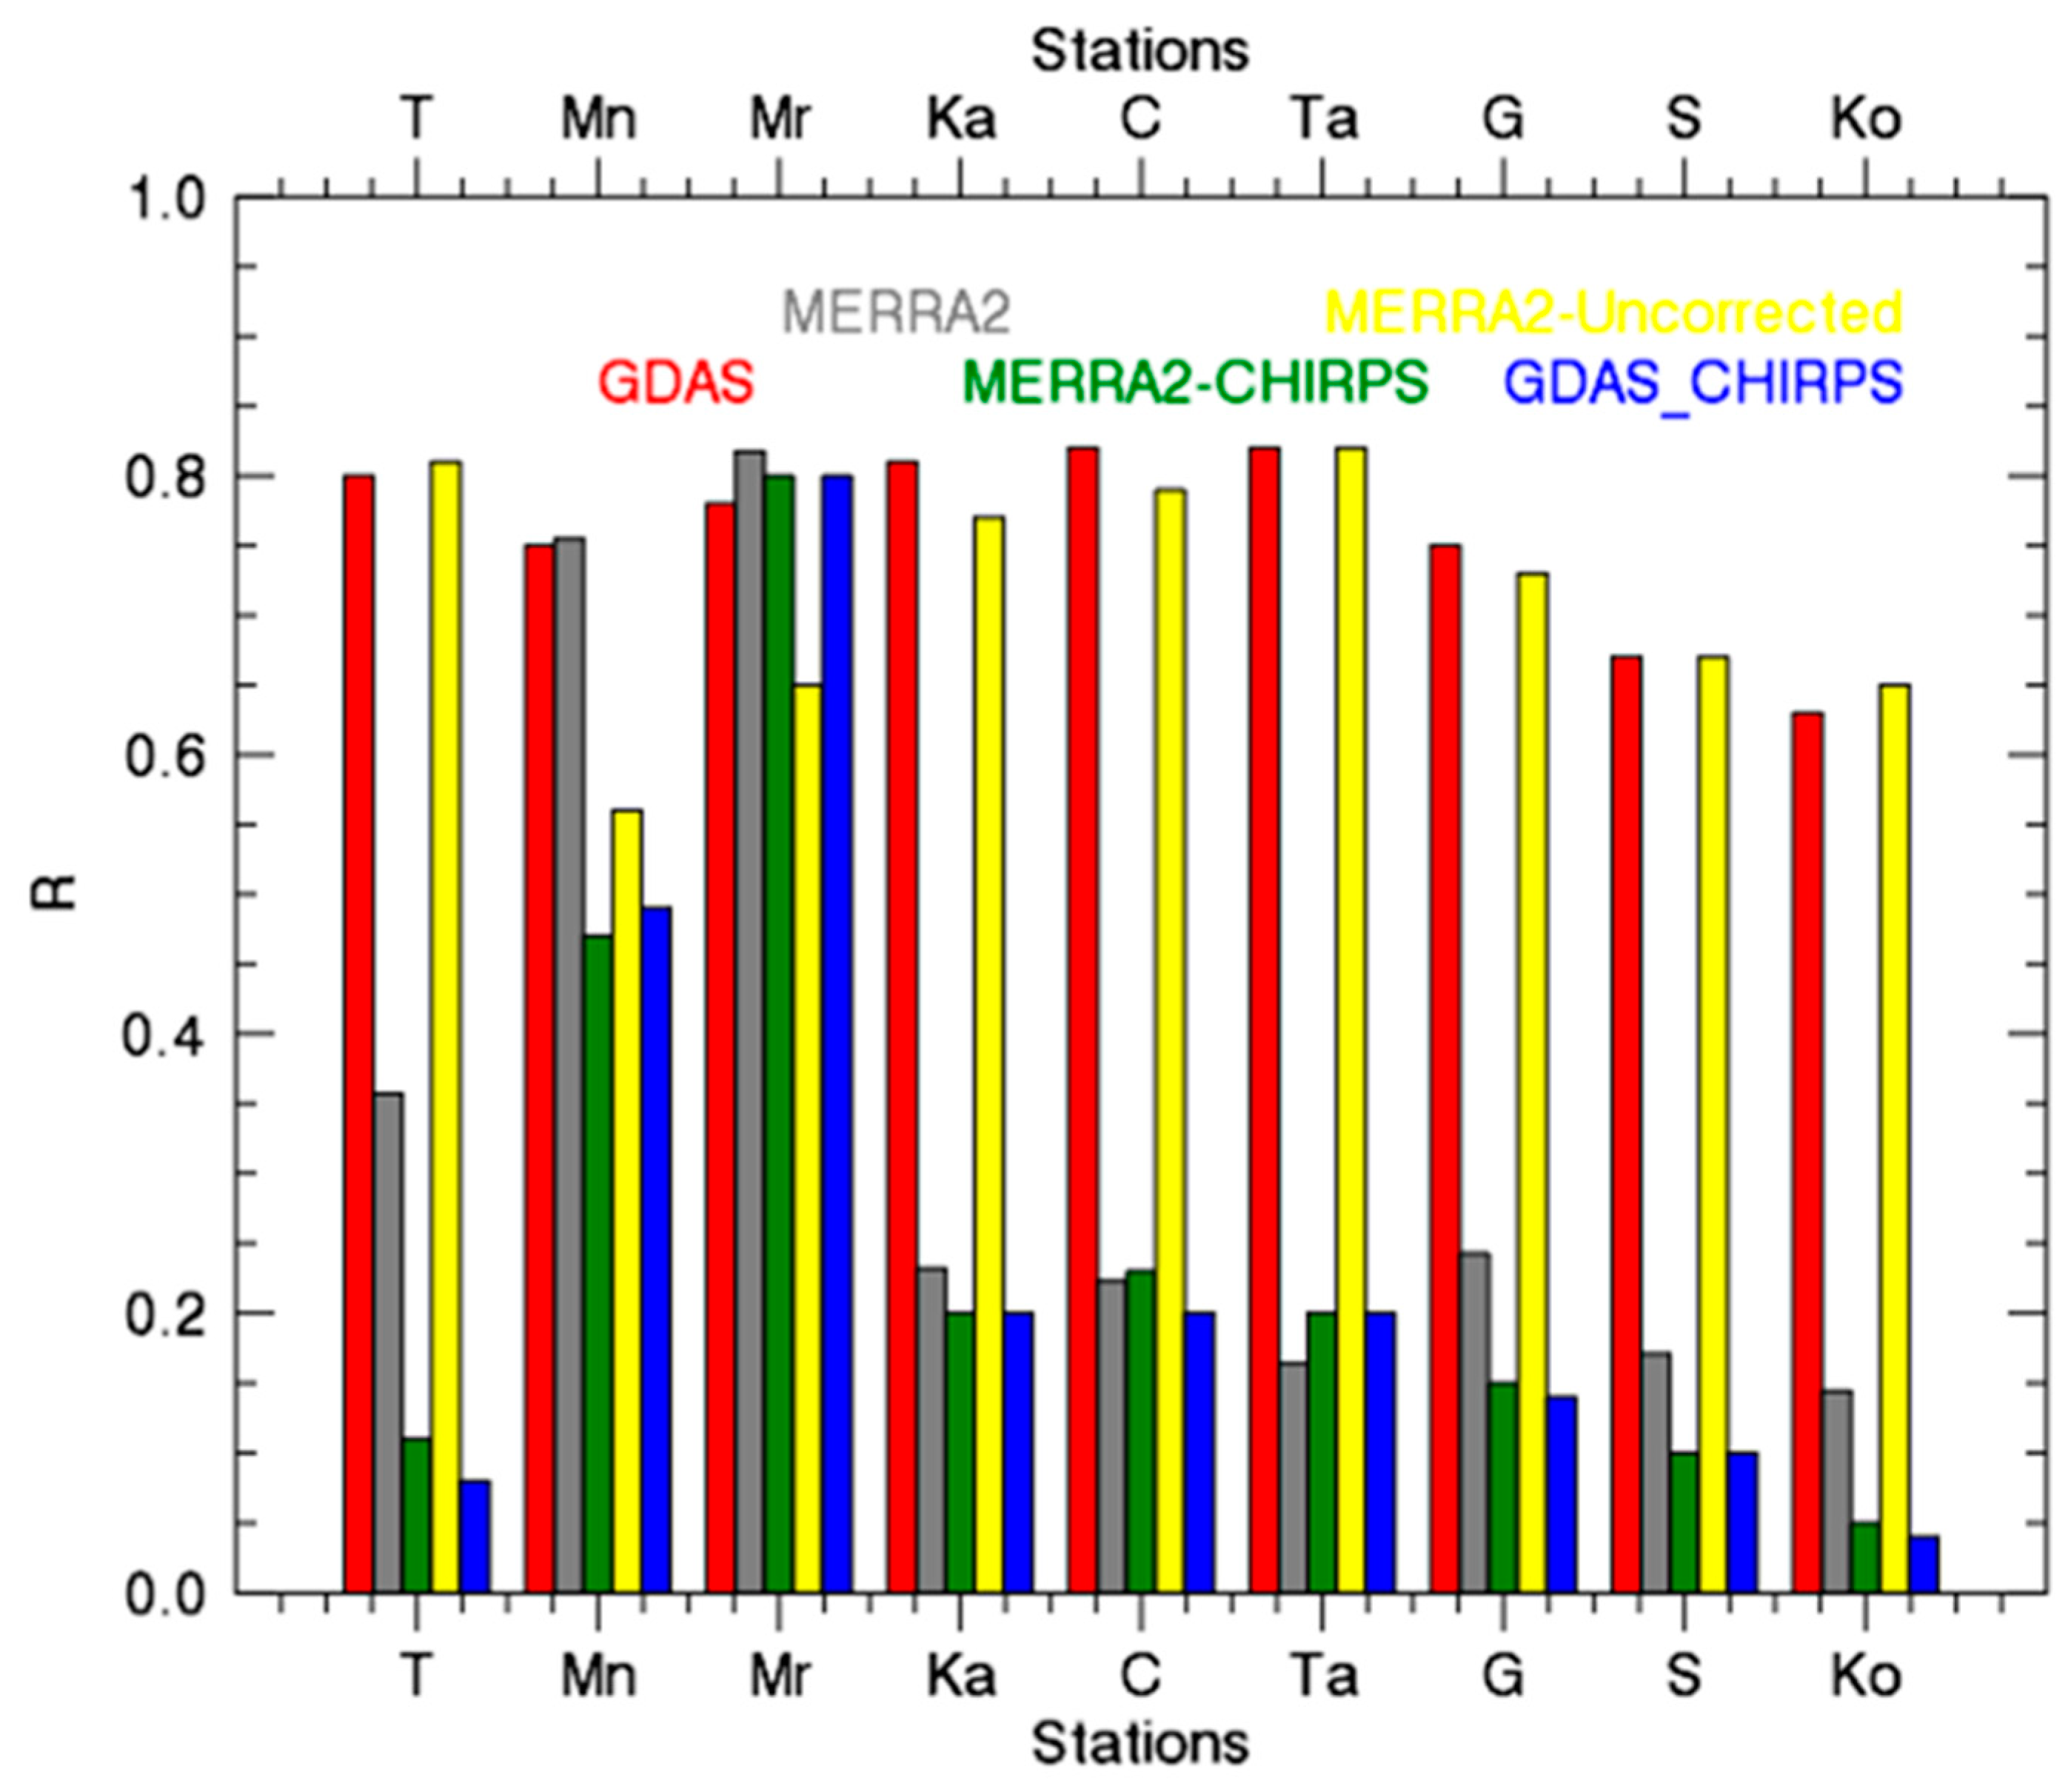
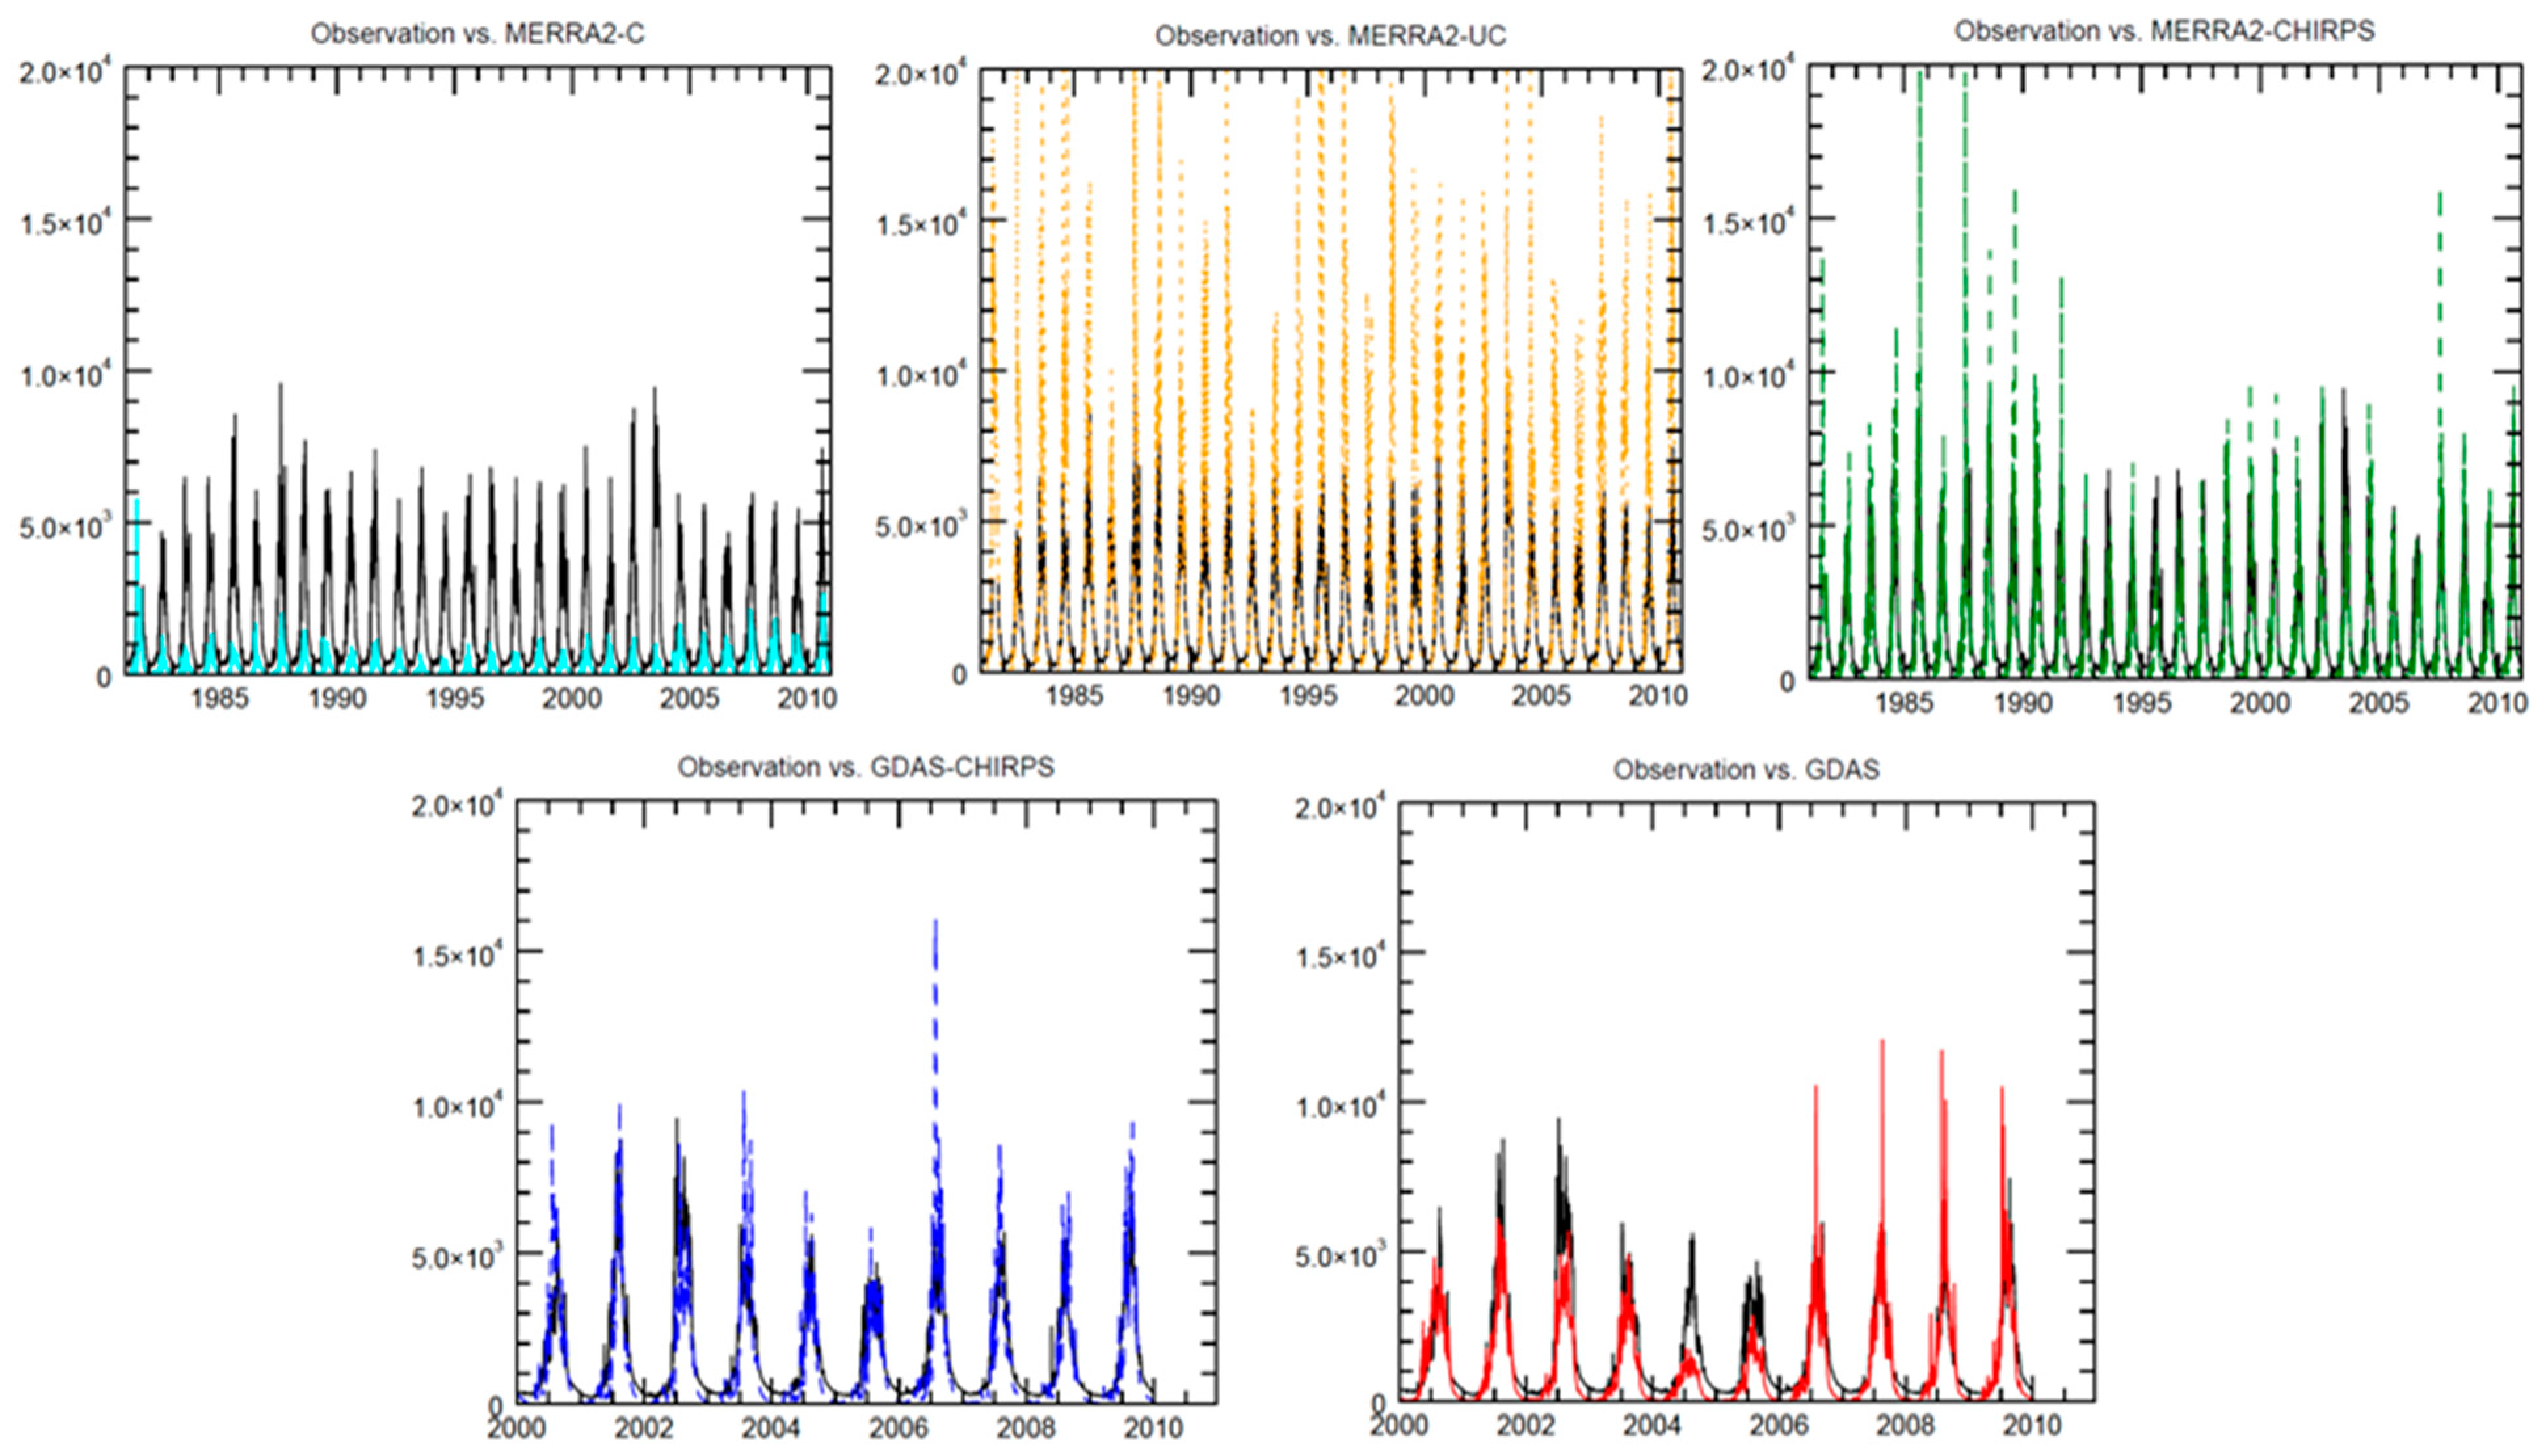
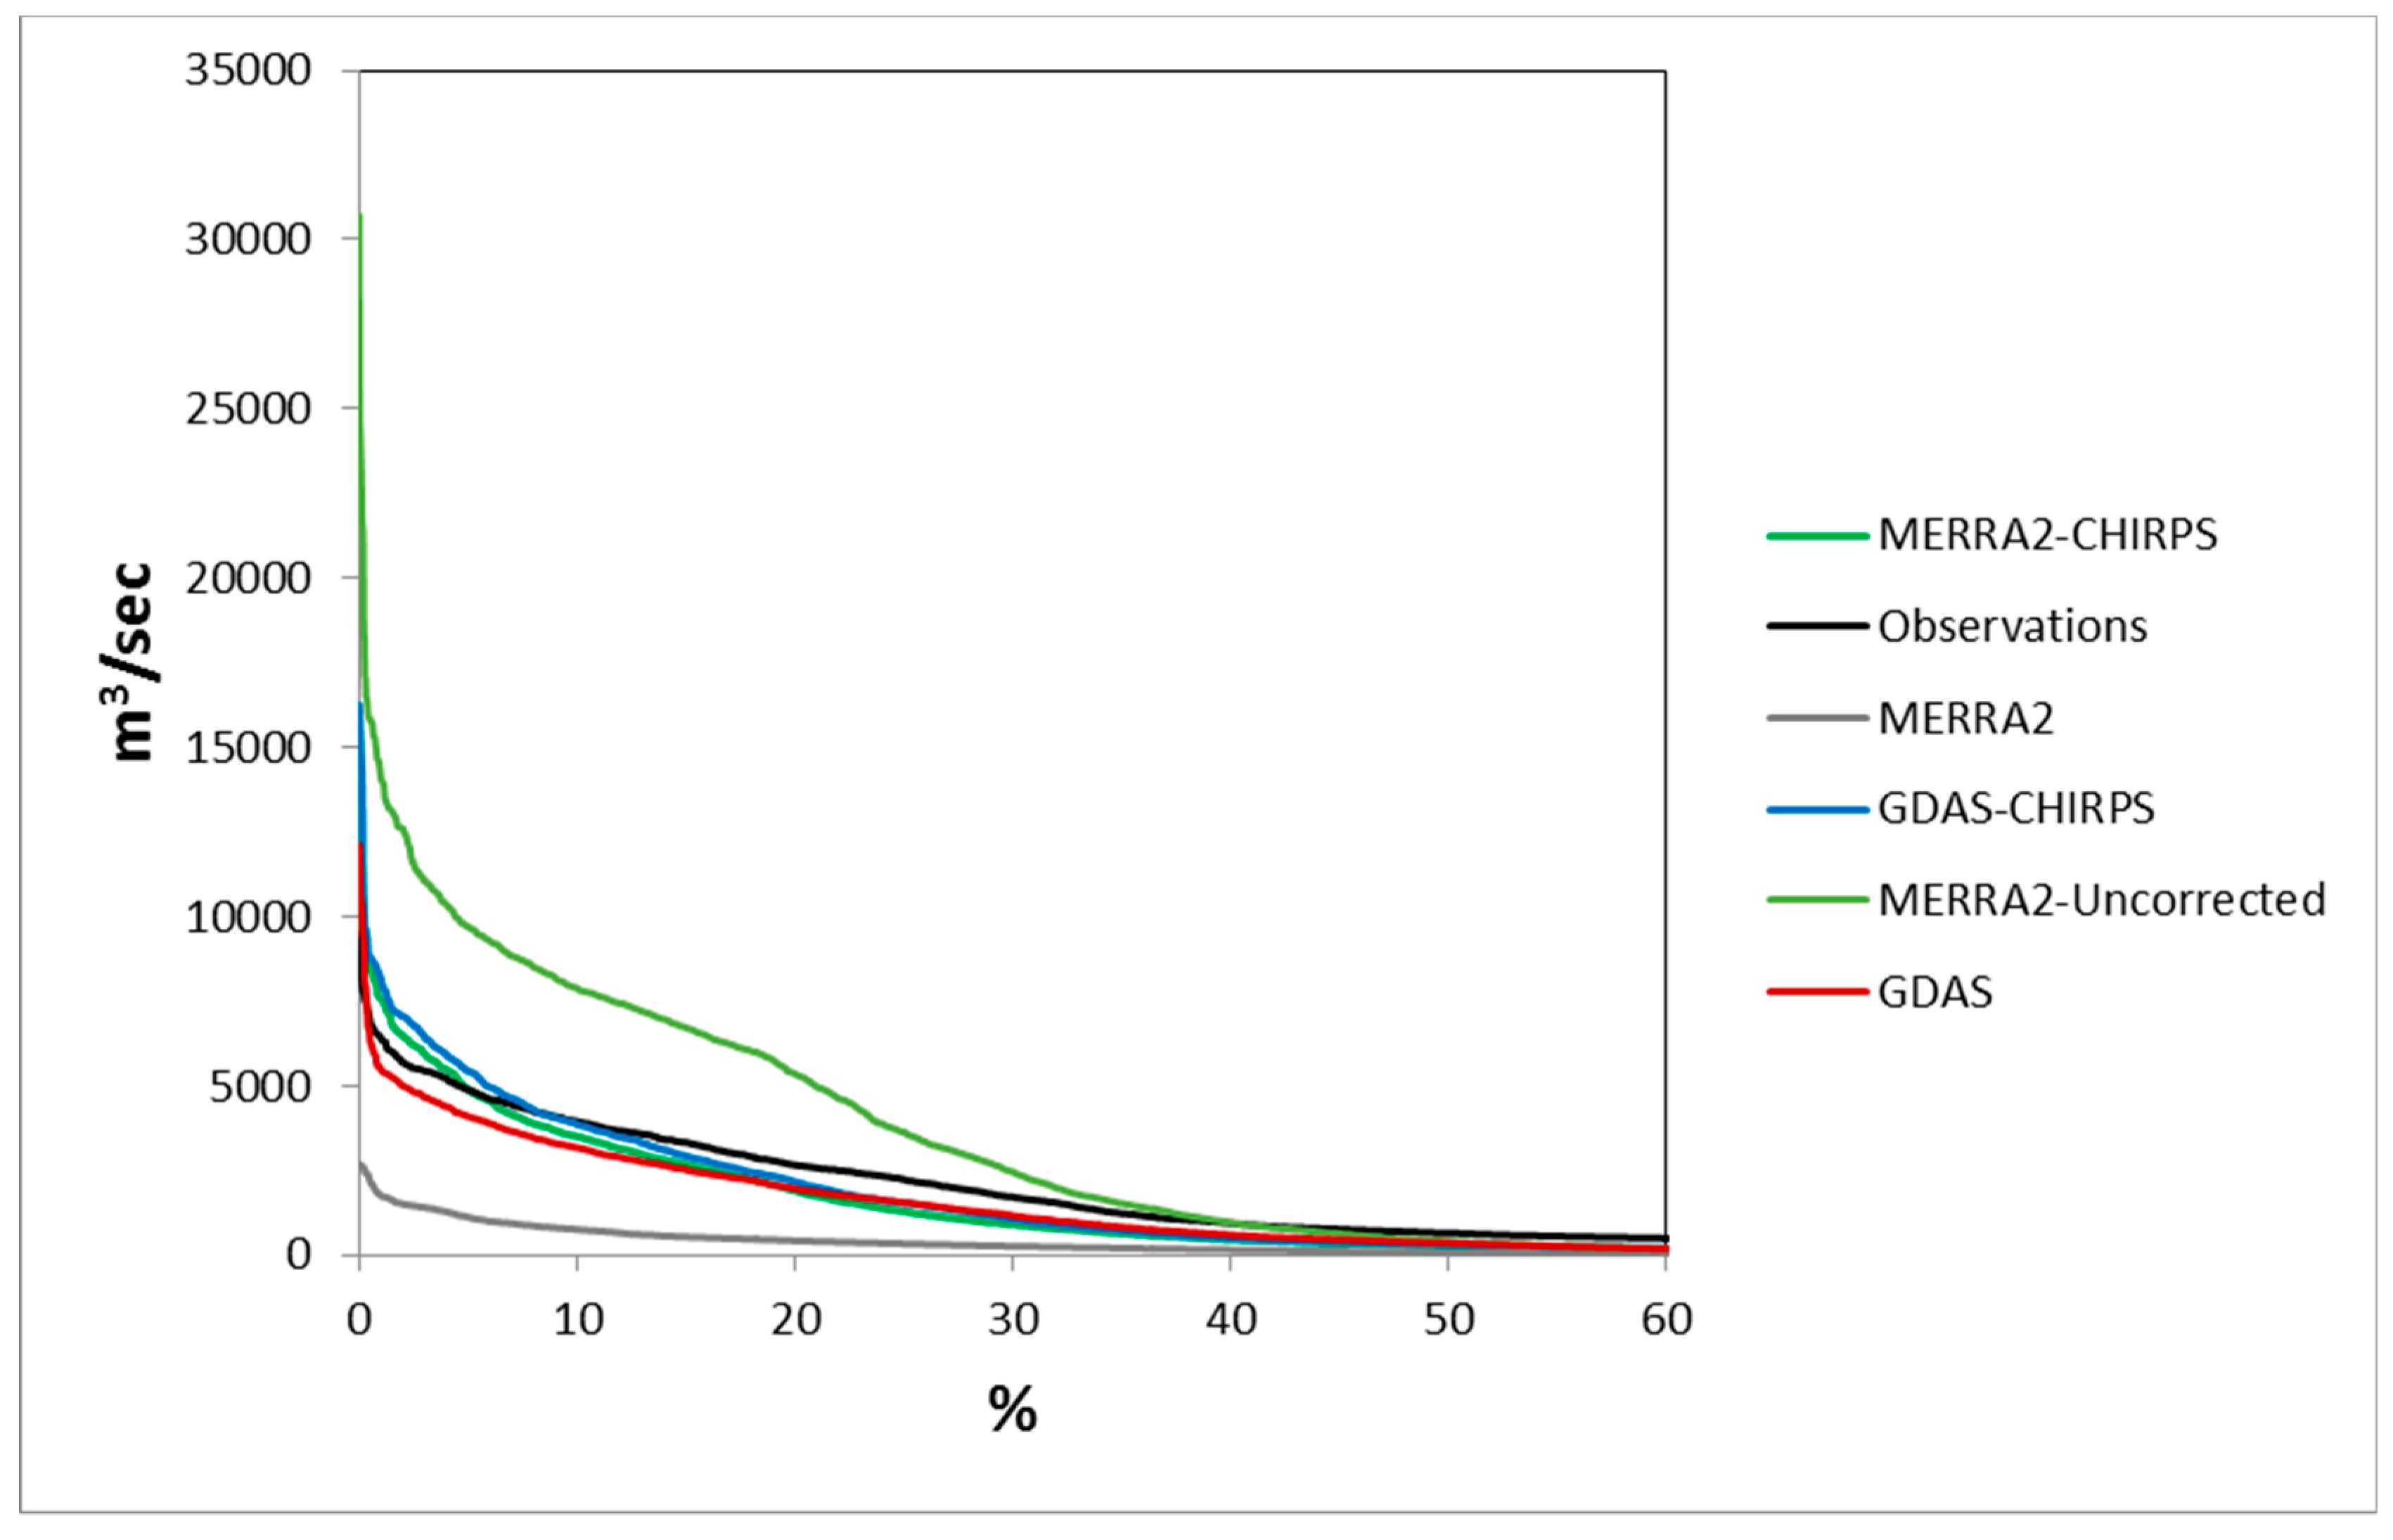
Figure 6 shows the time series of annual total precipitation and total ET for the whole Indus River basin. Figure 6 also shows the same for a Nepalese portion of the Kosi River basin and Supplementary Figure S3 shows the same for the upper Indus basin. Figure 6 and Supplementary Figure S3 are consistent with Figure 1 and Figure 5 and suggest that the MERRA2-UC and MERRA2-C precipitation fall on the wet and dry side of the spectrum, respectively. At the same time, simulated ET is generally lower than ALEXI ET. The upper Indus basin is less affected by the irrigation practices than the lower part of the basin. However, the general picture holds true in both cases if the ET estimate is reliable. The precipitation products that match APHRODITE in these basins might actually underestimate total precipitation due to a dry bias in high elevation regions while the products that “overestimate” relative to APHRODITE might actually provide a more accurate estimate of total precipitation input to the basin. It also implies that all simulations underestimate ET from irrigation relative to ALEXI, which is not surprising considering that irrigation is simulated in an idealized demand-driven manner that does not account for off-field losses or other inefficiencies. We have also shown similar analyses for two river basins in South India known as the Tapti and Godavari (Supplementary Figure S4). These results are consistent with Figure 1 and Figure 5 showing that precipitation and ET from the model output overestimate observed precipitation from APHRODITE and ALEXI ET.

3.3.2. Streamflow

Our evaluation of simulated streamflow focuses on two river basins: the Indus River basin in the Western Himalaya (Indus) and the Kosi River basin in the Central Himalaya. The Indus is by far the larger and more extensively regulated river system. For this reason, we distinguish between upstream gauge locations that are less impacted by human activities and downstream locations that are heavily impacted by upstream regulation. We define Tarbela, Kalabagh, and Chasma sites on the main stem Indus, Mangla on the Jhelum River, and Marala on the Chenab River as the five upstream sites (Figure 7).
Streamflow data for these sites could only be obtained for the year 2014. As shown in Figure 1, MERRA2-UC and GDAS both systematically overestimate precipitation in the Indus basin relative to APHRODITE. In Figure 8 and Figure 9, we see that these products also lead to overestimates of streamflow at upstream Indus sites relative to the gauge record. However, the precipitation products that appeared to be more accurate when compared to both APHRODITE and point records of gauged precipitation (CHIRPS and MERRA-C) lead to dramatic underestimation of streamflow at these sites when applied as forcing to Noah with the HyMAP. This dataset includes daily streamflow from the year 2014, which was marked by a devastating flood due to intense rainfall over the Kashmir area and over the eastern side of Pakistan (mainly upstream areas of left-hand side tributaries of Indus). Thus, the affected area overlaps our study locations of Mangla and Marala. Day-to-day streamflow of tributaries of Indus clearly shows that the flood event is well captured by the model at Mangla and at Marala. Peak modeled streamflow is apparent in the month of September on the same day when observed peak streamflow occurred. However, observed streamflow is mostly underestimated by the model.
These performance patterns are reflected in the statistics of model performance at these gauge locations. The simulation that uses GDAS forcing has the lowest RMSE at all five sites (Table 2). NSE scores are highly varied between simulations and across sites, but GDAS has the highest values—albeit sometimes quite low in absolute terms—for all five sites.
Consistent with these results, the GDAS simulation shows the strongest correlation with daily streamflow at upstream gauge locations (Figure 10). MERRA2-UC also shows high correlations, which are sometimes even higher than GDAS due to the fact that it captures seasonality better than the drier simulations do. Interestingly, GDAS and MERRA2-UC simulations also show a high correlation with daily gauged discharge at downstream sites on the Indus River—Taunsa, Guddu, Sukkur, and Kotri—where we know that flow is altered by extensive upstream management. The ability of the wetter simulations to capture seasonality drives these relatively high correlations. Similar results are seen for correlation between simulated streamflow and water height at altimetry locations in the lower Indus River basin (Table 3).
Like the Indus river, the Kosi is a trans-boundary river. The basin is considerably smaller than the Indus, but topography is even more extreme and complex. In this basin, we had access to only one river gauge (at Chatara, in Nepal), but the time period was much longer and included our entire simulation record. Consistent with previously presented results, MERRA2-UC is the wettest streamflow simulation and MERRA2-C yields the driest streamflow. GDAS and CHIRPS are intermediate. In this basin, those two products provide the best visual match to the gauge record (Figure 11), which is the closest match to the duration curve (Figure 12) and the lowest RMSE for daily streamflow variability (Table 4). Correlations with observed daily streamflow are quite high for all simulations (Table 4) since all simulations capture the seasonal cycle of streamflow in this basin. On interannual timescales, GDAS provides the highest correlation and CHIRPS provides the lowest RMSE for the monsoon season (Table 5), but correlation coefficients are generally low for all simulations. This could simply be the product of a short period of analysis and a relatively low inter-annual variability in that period.
In the Indus river basin, the drier products such as MERRA2-C and CHIRPS and in the Kosi river basin MERRA-C fail even to capture the dominant seasonality of flow due to a low, event-dominated hydrograph through the monsoon season. Clearly, several factors could contribute to this result including errors in Noah’s partitioning of available water between ET and runoff. However, the fact that simulations with these precipitation datasets underestimate ET relative to ALEXI and river flow relative to gauge records strongly implies that the precipitation records that include station observations have a tendency towards a dry bias over some regions despite their agreement with available in situ records and APHRODITE.
Figure 13 shows the water balance of the Indus and Kosi river basins. In the Indus river, irrigation water added in the lower portion of the basin elevate total ET to the point that MERRA2-C and CHIRPS ET exceeds precipitation in the basin. Interestingly, the amount of irrigation water applied (yellow bars) does not correlate with precipitation (blue bars). One might expect that simulations with less precipitation require more irrigation, but, in this case, the precipitation total is dominated by the headwaters region while the irrigation signal comes from the lower basin. Therefore, there is no direct relationship between the two. Irrigation applications are higher in simulations with MERRA2-C and CHIRPS show ET higher than the precipitation due to the added water from irrigation over the Indus basin. The Kosi River basin upstream of our gauge site contains almost no irrigation. This makes it possible to calculate a natural runoff ratio in both observations using APHRODITE precipitation and gauged streamflow and in our simulations. For the simulations, the basin average runoff ratio ranges from ~29% and ~65% across simulations while observations imply a 97% runoff ratio. Runoff coefficients vary considerably over the space and are difficult to measure. Therefore, it is difficult to make conclusions about model performance based on this range. However, a runoff coefficient of 97% for the entire Kosi basin upstream of the gauge site, as suggested by observations, seems highly unlikely. Runoff ratios can exceed 90% in some mountainous catchments e.g., [50], but a value as high as 97% over such an extensive catchment is not expected. The value is also inconsistent with satellite ET observations for the Kosi. This unrealistically high runoff ratio offers further evidence that APHRODITE suffers from a dry bias in HKH headwater regions.

4. Conclusions

We evaluate a suite of hydrologic simulations forced with different meteorological forcing by using Noah LSM coupled with a HyMAP routing module under the framework of South Asia LDAS. We evaluate precipitation forcing with observations and observation-based products. Furthermore, we evaluate modeled ET with ALEXI ET and modeled streamflow with observed streamflow and with satellite altimetry. We use meteorological forcing from GDAS, MERRA2-C, MERRA2-UC, and CHIRPS to examine the impact of multiple precipitation forcing datasets on the simulation of regional hydrology. These meteorological datasets are generated through systematically different approaches. GDAS is a global atmospheric analysis that includes data assimilation but does not apply a gauge correction to rainfall estimates. MERRA2 is a re-analysis that generates both uncorrected and gauge-corrected precipitation fields and CHIRPS is a satellite-derived rainfall product that diagnoses rainfall rather than simulating atmospheric dynamics. All three products are widely used in the scientific community.
High altitude regions of HKH and plateau areas of southern India exhibit major discrepancy between precipitation products and observations. Overall, MERRA2-C and CHIRPS show less relative bias compared with APHRODITE over the majority of the domain. This includes better agreement over the Indus and Kosi river basins where we focus our hydrological evaluation. As opposed to MERRA2-C, MERRA2-UC exhibits much higher precipitation than observed. GDAS falls in between these two extremes.
A comparison between modeled ET and ALEXI ET has been done for the whole domain and the evaluation of streamflow has been done at the basin-scale. Both of these evaluations suggest that South Asia LDAS does produce reasonably reliable hydrologic estimates when forced with appropriate meteorological forcing. The relative bias (positive/negative) of ET over a broad region of South Asia is less than 25%. However, total ET from all simulations over both Indus and Kosi river basins are lower than ALEXI ET. For streamflow, MERRA2-UC yielded overestimates of river discharge in both the Indus and Kosi river basins where MERRA2-C yielded underestimates. GDAS yielded streamflow estimates that were in between these extremes for both basins while CHIRPS yielded good agreement with observed streamflow for the Kosi river but led to low streamflow estimates in the Indus basin. Therefore, evaluation of satellite or model-derived precipitation products based on results of hydrological simulation, i.e., streamflow and ET, can differ from evaluations based on the direct comparison with in situ precipitation observations and products derived from in situ precipitation observations. This discrepancy suggests that APHRODITE does not offer a consistent ground truth over the HKH region especially over the western side. Our result is consistent with Immerzeel et al. [51] and extends the finding to a broader geographic extent. Furthermore, this study suggests that products such as MERRA2-C and CHIRPS, which include station data, may inherit a dry bias from observations.
In the complex, remote topography of the HKH and reliable in situ meteorological monitoring is an enormous challenge. This poses difficulties for hydrological modeling, but it also points to the potential value of physically-based hydrological models as proxy systems for evaluating precipitation datasets. While the interposition of a model adds considerable uncertainty to the evaluation, it also integrates spatially distributed, episodic, and often remote precipitation into variables like streamflow, which is more easily monitored, and ET, which can be estimated by complementary remote sensing techniques. In this way, the hydrologically-based evaluation can help constrain precipitation estimates and identify systematic bias in rainfall estimates over large areas that include the remote terrain.

Supplementary Materials

The following are available online at https://www.mdpi.com/2306-5338/5/4/57/s1, Figure S1: Climatology of annual precipitation (mm) based on 2001-2007 for (a) APHRODITE, (b) CHIRPS (c) GDAS (d) MERRA2-C and (e) MERRA2-UC; Figure S2: Climatology of annual evapotranspiration (mm) based on 2003-2015 for (a) ALEXI, (b) GDAS (c) GDAS- CHIRPS (d) MERRA2-CHIRPS, (e) MERRA2-C and (f) MERRA2-UC; Figure S3: Timeseries of annual precipitation (m3) (top) and annual ET (m3) (bottom) over the upper Indus river basin from observations and from model simulations with multiple meteorological forcings; Figure S4: Same as figure 6 except for Godavari and Tapti rivers. Table S1 Root mean square error of monthly accumulated precipitation between station observation and CHIRPS, GDAS and MERRA2-UC and MERRA2-C for the period of 2012-2017.

Author Contributions

D.G. and B.Z. designed the experiments and D.G. performed the simulations. S.K. developed the LIS. D.G. performed the analyses and prepared the manuscript. B.Z. provided guidance in this project. Co-authors participated in the editing process. C.H. and M.A. provided ALEXI data. M.A.M. and B.B. provided station-based data mentioned in Section 2.

Funding

This work has been supported by NASA (grant number #NNX16AN38G and #NNX17AB40G). Mir A. Matin and Birendra Bajracharya are partially supported by the SERVIR-HKH initiative funded by USAID and NASA.

Acknowledgments

We are thankful to Mehedi Maswood and Safat Sikder (Faisal Hossain’s group) from the University of Washington for compiling the streamflow data from the Indus River System Authority (http://www.pakirsa.gov.pk/). We are thankful to ICIMOD’s Hindu Kush Himalaya Hydrological Cycle Observing System (HKH-HYCOS) initiative for providing us with the station’s observation of precipitation and the Department of Hydrology and Meteorology (DHM) Nepal for providing streamflow data. Computing was supported by the resources at the NASA Center for Climate Simulation. The views and interpretations in this paper are those of the authors and are not necessarily attributable to ICIMOD, USAID, or NASA.

Conflicts of Interest

The authors declare no conflict of interest.

References

  1. Hewitt, K. The Karakoram anomaly? Glacier expansion and the “elevation effect,” Karakoram Himalaya. Mt. Res. Dev. 2005, 25, 332–340. [Google Scholar] [CrossRef]
  2. Hewitt, K. Tributary glacier surges: An exceptional concentration at Panmah Glacier, Karakoram Himalaya. J. Glaciol. 2007, 53, 181–188. [Google Scholar] [CrossRef]
  3. Immerzeel, W.W.; Pellicciotti, F.; Bierkens, M.F.P. Rising river flows throughout the twenty-first century in two Himalayan glacierized watersheds. Nat. Geosci. 2013, 6, 742–745. [Google Scholar] [CrossRef]
  4. Mishra, V. Climatic uncertainty in Himalayan Water Towers. J. Geophys. Res. Atmos. 2015, 120, 2689–2705. [Google Scholar] [CrossRef]
  5. Ragettli, S.; Pellicciotti, F. Calibration of a physically based, spatially distributed hydrological model in a glacierized basin: On the use of knowledge from glaciometeorological processes to constrain model parameters. Water Resour. Res. 2012, 48, 1–20. [Google Scholar] [CrossRef]
  6. Winiger, M.; Gumpert, M.; Yamout, H. Karakorum-Hindukush-western Himalaya: Assessing high-altitude water resources. Hydrol. Process. 2005, 19, 2329–2338. [Google Scholar] [CrossRef]
  7. Lutz, A.F.; Immerzeel, W.; Kraaijenbrink, P.; Shrestha, A.B.; Bierkens, M.F. Climate Change Impacts on the Upper Indus Hydrology: Sources, Shifts and Extremes. PLoS ONE 2016, 11, e0165630. [Google Scholar] [CrossRef] [PubMed]
  8. Immerzeel, W.W.; van Beek, L.P.H.; Bierkens, M.F.P. Climate change will affect the Asian water towers. Science 2010, 328, 1382–1385. [Google Scholar] [CrossRef] [PubMed]
  9. Yamanokuchi, T.; Tadono, T.; Tomiyama, N. Detection of glacier lake using ALOS PALSAR data at Bhutan. In Proceedings of the American Geophysical Union, Fall Meeting 2010, San Francisco, CA, USA, 13–17 December 2010. [Google Scholar]
  10. Bajracharya, S.R.; Maharjan, S.; Shrestha, F.; Shrestha, B.; Wanqin, G.; Shiyin, L.; Xiaojun, Y.; Khattak, G.A. The Status of Glaciers in the Hindu Kush-Himalayas from satellite data. In Proceedings of the American Geophysical Union, Fall Meeting 2011, San Francisco, CA, USA, 5–9 December 2011. [Google Scholar]
  11. Bajracharya, S.R.; Maharjan, S.B.; Shrestha, F. The status and decadal change of glaciers in Bhutan from the 1980s to 2010 based on satellite data. Ann. Glaciol. 2014, 55, 159–166. [Google Scholar] [CrossRef] [Green Version]
  12. Bajracharya, S.R.; Maharjan, S.B.; Shrestha, F.; Bajracharya, O.R.; Baidya, S. Glacier Status in Nepal and Decadal Change from 1980 to 2010 Based on Landsat Data; International Centre for Integrated Mountain Development (ICIMOD): Kathmandu, Nepal, 2014. [Google Scholar]
  13. Bajracharya, S.R.; Maharjan, S.B.; Shrestha, F.; Guo, W.; Liu, S.; Immerzeel, W.; Shrestha, B. The glaciers of the Hindu Kush Himalayas: Current status and observed changes from the 1980s to 2010. Int. J. Water Resour. Dev. 2015, 31, 161–173. [Google Scholar] [CrossRef]
  14. Shrestha, M.N. Spatially distributed hydrological modelling considering land-use changes using remote sensing and GIS. In Proceedings of the Map Asia 2003, Kuala Lumpur, Malaysia, 17–19 July 2003. [Google Scholar]
  15. Shrestha, S.; Bastola, S.; Babel, M.S.; Dulal, K.N.; Magome, J.; Hapuarachchi, H.A.P.; Kazama, F.; Ishidaira, H.; Takeuchi, K. The assessment of spatial and temporal transferability of a physically based distributed hydrological model parameters in different physiographic regions of Nepal. J. Hydrol. 2007, 347, 153–172. [Google Scholar] [CrossRef]
  16. Nepal, S.; Krause, P.; Flügel, W.-A.; Fink, M.; Fischer, C. Understanding the hydrological system dynamics of a glaciated alpine catchment in the Himalayan region using the J2000 hydrological model. Hydrol. Process. 2013, 28, 1329–1344. [Google Scholar] [CrossRef]
  17. Dhar, S.; Mazumdar, A. Hydrological modelling of the Kangsabati river under changed climate scenario: Case study in India. Hydrol. Process. 2009, 23, 2394–2406. [Google Scholar] [CrossRef]
  18. Hengade, N.; Eldho, T.I. Assessment of LULC and climate change on the hydrology of Ashti Catchment, India using VIC model. J. Earth Syst. Sci. 2016, 125, 1623–1634. [Google Scholar] [CrossRef]
  19. Shah, R.D.; Mishra, V. Development of an experimental near real-time drought monitor for India. J. Hydrometeorol. 2015, 16, 327–345. [Google Scholar] [CrossRef]
  20. Mishra, V.; Shah, R.; Azhar, S.; Shah, H.; Modi, P.; Kumar, R. Reconstruction of droughts in India using multiple land surface models (1951–2015). Hydrol. Earth Syst. Sci. Discuss. 2017. [Google Scholar] [CrossRef]
  21. Hossain, F. Satellites as the panacea to transboundary limitations to longer range flood forecasting? Water Int. 2007, 32, 376–379. [Google Scholar] [CrossRef]
  22. Pellicciotti, F.; Buergi, C.; Immerzeel, W.W.; Konz, M.; Shrestha, A.B. Challenges and uncertainties in hydrological modeling of remote Hindu Kush-KarakoramHimalayan (HKH) basins: Suggestions for calibration strategies. Mt. Res. Dev. 2012, 32, 39–50. [Google Scholar] [CrossRef]
  23. Hossain, F.; Maswood, M.; Siddique-E-Akbor, A.H.; Yigzaw, W.; Mazumdar, L.C.; Ahmed, T.; Hossain, M.; Shah-Newaz, S.M.; Limaye, A.; Lee, H.; et al. A promising radar altimetry satellite system for operational flood forecasting in flood-prone Bangladesh. IEEE Geosci. Remote Sens. Mag. 2014, 2, 27–36. [Google Scholar] [CrossRef]
  24. Lutz, A.F.; Immerzeel, W.W.; Shrestha, A.B.; Bierkens, M.F.P. Consistent increase in High Asia’s runoff due to increasing glacier melt and precipitation. Nat. Clim. Chang. 2014, 4, 587–592. [Google Scholar] [CrossRef]
  25. Immerzeel, W.W.; Gaur, A.; Zwart, S.J. Integrating remote sensing and a process-based hydrological model to evaluate water use and productivity in a South Indian catchment. Agric. Water Manage. 2008, 95, 11–24. [Google Scholar] [CrossRef]
  26. Kumar, S.V.; Peters-Lidard, C.D.; Tian, Y.; Houser, P.R.; Geiger, J.; Olden, S.; Lighty, L.; Eastman, J.L.; Doty, B.; Dirmeyer, P.; et al. Land information system—An interoperable framework for high resolution land surface modeling. Environ. Model. Softw. 2006, 21, 1402–1415. [Google Scholar] [CrossRef]
  27. Kato, H.; Rodell, M.; Beyrich, F.; Cleugh, H.; van Gorsel, E.; Liu, H.; Meyers, T.P. Sensitivity of land surface simulations to model physics, land characteristics, and forcings, at four CEOP Sites. J. Meteorol. Soc. Jpn. 2007, 87A, 187–204. [Google Scholar] [CrossRef]
  28. Zaitchik, B.F.; Rodell, M.; Olivera, F. Evaluation of the Global Land Data Assimilation System using global river discharge data and a Source-to-Sink routing scheme. Water Resour. Res. 2010, 46, W06507. [Google Scholar] [CrossRef]
  29. Yatagai, A.; Kamiguchi, K.; Arakawa, O.; Hamada, A.; Yasutomi, N.; Kitoh, A. APHRODITE: Constructing a Long-term Daily Gridded Precipitation Dataset for Asia based on a Dense Network of Rain Gauges. Bull. Am. Meteorol. Soc. 2012, 93, 1401–1415. [Google Scholar] [CrossRef]
  30. Andermann, C.; Bonnet, S.; Gloaguen, R. Evaluation of precipitation data sets along the Himalayan front. Geochem. Geophys. Geosyst. 2011, 12, Q07023. [Google Scholar] [CrossRef]
  31. Kapnick, S.B.; Delworth, T.L.; Ashfaq, M.; Malyshev, S.; Milly, P.C.D. Snowfall less sensitive to warming in Karakoram than in Himalayas due to a unique seasonal cycle. Nat. Geosci. 2014, 7, 834–840. [Google Scholar] [CrossRef]
  32. Kanamitsu, M. Description of the NMC global data assimilation and forecast system. Weather Forecast. 1989, 4, 334–342. [Google Scholar] [CrossRef]
  33. Gelaro, R.; McCarty, W.; Suáreza, M.J.; Todling, R.; Molod, A.; Takacs, L.; Randlesa, C.A.; Darmenov, A.; Bosilovich, M.G.; Reichle, R.; et al. The Modern-Era Retrospective Analysis for Research and Applications, version 2 (MERRA-2). J. Clim. 2017. [Google Scholar] [CrossRef]
  34. Funk, C.; Peterson, P.; Landsfeld, M.; Pedreros, D.; Verdin, J.; Shukla, S.; Husak, G.; Rowland, J.; Harrison, L.; Hoell, A.; et al. The climate hazards infrared precipitation with stations—A new environmental record for monitoring extremes. Sci. Data 2015, 2, 150066. [Google Scholar] [CrossRef] [PubMed]
  35. Kumar, P.; Kishtawal, C.M.; Pal, P.K. Skill of regional and global model forecast over Indian region. Theor. Appl. Climatol. 2016, 123, 629–636. [Google Scholar] [CrossRef]
  36. Shah, H.; Mishra, V. Uncertainty and Bias in Satellite Precipitation Estimates over the Indian Sub-continental River basins: Implications for streamflow simulation and Flood Prediction. J. Hydrometeorol. 2015, 17, 615–636. [Google Scholar] [CrossRef]
  37. Rienecker, M.M.; Suarez, M.J.; Gelaro, R.; Todling, R.; Bacmeister, J.; Liu, E.; Bosilovich, M.G.; Schubert, S.D.; Takacs, L.; Kim, G.-K.; et al. MERRA—NASA’s Modern-Era Retrospective Analysis for Research and Applications. J. Clim. 2011. [Google Scholar] [CrossRef]
  38. Ghatak, D.; Zaitchik, B.; Hain, C.; Anderson, M. The role of local heating in the 2015 Indian Heat Wave. Sci. Rep. 2017, 7, 7707. [Google Scholar] [CrossRef] [PubMed]
  39. Anderson, M.C.; Norman, J.M.; Diak, G.R.; Kustas, W.P.; Mecikalski, J.R. A two-source time-integrated model for estimating surface fluxes using thermal infrared remote sensing. Remote Sens. Environ. 1997, 60, 195–216. [Google Scholar] [CrossRef]
  40. Anderson, M.C.; Kustas, W.P.; Norman, J.M. Upscaling tower and aircraf fuxes from local to continental scales using thermal remote sensing. Agron. J. 2007, 99, 240–254. [Google Scholar] [CrossRef]
  41. Anderson, M.C.; Norman, J.M.; Mecikalski, J.R.; Otkin, J.A.; Kustas, W.P. A climatological study of evapotranspiration andmoisture stress across the continental United States: 1. Model formulation. J. Geophys. Res. 2007, 112, D11112. [Google Scholar] [CrossRef]
  42. Hain, C.R.; Crow, W.T.; Anderson, M.C.; Yilmaz, M.T. Diagnosing Neglected Soil Moisture Source–Sink Processes via a Termal Infrared–Based Two-Source Energy Balance Model. J. Hydrometeorol. 2015, 16, 1070–1086. [Google Scholar] [CrossRef]
  43. Lehner, B.; Verdin, K.; Jarvis, J. New global hydrograph derived from spaceborne elevation data. Eos 2008, 89, 93–94. [Google Scholar] [CrossRef]
  44. Ek, M.B.; Mitchell, K.E.; Lin, Y.; Rogers, E.; Grunmann, P.; Koren, V.; Gayno, G.; Tarplay, J.D. Implementation of Noah land surface model advances in the National Centers for Environmental Prediction operational mesoscale Eta model. J. Geophys. Res. 2003, 108, 8851. [Google Scholar] [CrossRef]
  45. Evans, J.P.; Zaitchik, B.F. Modeling the large scale water balance impact of different irrigation systems. Water Resour. Res. 2008, 44, W08448. [Google Scholar] [CrossRef]
  46. Yilmaz, M.T.; Anderson, M.C.; Zaitchik, B.F.; Hain, C.R.; Crow, W.T.; Ozdogan, M.; Chun, J.A.; Evans, J.P. Comparison of prognostic and diagnostic surface flux modeling approaches over the Nile River basin. Water Resour. Res. 2014, 50, 386–408. [Google Scholar] [CrossRef] [Green Version]
  47. Lawston, P.M.; Santanello, J.A.; Zaitchik, B.F.; Rodell, M. Impact of irrigation methods on land surface model spinup and initialization of WRF forecasts. J. Hydrometeorol. 2015. [Google Scholar] [CrossRef]
  48. Sanchez, P.A.; Ahamed, S.; Carré, F.; Hartemink, A.E.; Hempel, J.; Huising, J.; Lagacherie, P.; McBratney, A.B.; McKenzie, N.J.; Mendonça-Santos, M.L.; et al. Digital soil map of the world. Science 2009, 325, 680–681. [Google Scholar] [CrossRef] [PubMed]
  49. Getirana, A.C.V.; Boone, A.; Yamazaki, D.; Decharme, B.; Papa, F.; Mognard, N. The hydrological modeling and analysis platform (HyMAP): Evaluation in the Amazon basin. J. Hydrometeorol. 2012. [Google Scholar] [CrossRef] [Green Version]
  50. Scherrer, S.; Naef, F.; Faeh, A.O.; Cordery, I. Formation of runoff at the hillslope scale during intense precipitation. Hydrol. Earth Syst. Sci. 2007, 11, 907–922. [Google Scholar] [CrossRef] [Green Version]
  51. Immerzeel, W.W.; Wanders, N.; Lutz, A.F.; Shea, J.M.; Bierkens, M.F.P. Reconciling high altitude precipitation in the upper Indus Basin with glacier mass balances and runoff. Hydrol. Earth Syst. Sci. Discuss. 2015, 12, 4755–4784. [Google Scholar] [CrossRef]
Figure 1. Relative bias (%) of climatology of annual precipitation based on the period from 2001 to 2007 between APHRODITE and (a) CHIRPS, (b) GDAS, (c) MERRA2-C, and (d) MERRA2-UC. The grey color indicates a region with no data.
Hydrology 05 00057 g001
Figure 2. RMSE of annual precipitation based on the period from 2001 to 2007 between APHRODITE and (a) CHIRPS, (b) GDAS, (c) MERRA2-C, and (d) MERRA2-UC. The grey color indicates a region with no data.
Hydrology 05 00057 g002
Figure 3. Pearson’s correlation coefficients between annual precipitation from APHRODITE and annual precipitation from (a) CHIRPS, (b) GDAS, (c) MERRA2-C, and (d) MERRA2-UC based on the period from 2001 to 2007. The correlation coefficient significant at the 5% confidence level is plotted here with a white line. The grey color indicates the region with no data.
Hydrology 05 00057 g003
Figure 4. The location of stations providing observational precipitation data from (top left) Nepal: B = Bahrabise, Bi = Busti, C = Chatara, D = Dhankuta, J = Jiri, L = Lukla, O = Okhaldhunga, Pw = Pachuwarghat, R = Rabuwabazar, T = Tumlingtar, t = Turkeghat, (top right) Bangladesh: B = Bhairab Bazar, C = Chatlaghat, K = Kurigram, L = Lalan Shah Bridge, S = Sirajganj, Sr = Srimangal, Sg = Sunamgunj, Z = Zakigunj, (bottom left) Pakistan: H = AWS-Gupis, A = AWS-Kalam, G = Ganish Bridge, H = HS-Gupis, A = HS-Kalam, L = Lower Dir, N = Nowshera, Z = Zulam and (bottom right) Bhutan: A = AWS-Trashi Yangtse, G = Gongrichu, K = Korilla, P = Pangbang, S = Sumpa, T = Trashi Yangtse, and U = Uzorong.
Hydrology 05 00057 g004
Figure 5. Relative bias of climatology of annual ET based on the period from 2003 to 2015 between ALEXI and model simulations with (a) GDAS, (b) GDAS-CHIRPS, (c) MERRA2-CHIRPS, (d) MERRA2-C, and (e) MERRA2-UC. The grey color indicates a region with no data.
Hydrology 05 00057 g005
Figure 6. Time series of annual precipitation (m3) (top-left) and annual ET (m3) (bottom-left) over the Indus river basin. Time series of annual precipitation (m3) (top-right) and annual ET (m3) (bottom-right) over the Kosi river basin. ET from ALEXI is used for an independent comparison with simulated ET using multiple meteorological forcing (GDAS, GDAS-CHIRPS, MERRA2-CHIRPS, MERRA2, and MERRA2-Uncorrected).
Hydrology 05 00057 g006
Figure 7. Location of observed streamflow from Indus and its tributaries (Top). Black-colored stations are from upstream locations along the Indus river, red-colored stations are from downstream locations along the Indus river, and blue-colored stations are along the tributaries of the Indus river. T = Tarbela, K = Kalabagh, C = Chasma, Mn = Mangla, Mr = Marala, Ta = Taunsa, G = Guddu, S = Sukkur, and Ko = Kotri. The location of the water height sites from altimetry is shown (bottom), which is the enlarged region shown in the black box in the top figure.
Hydrology 05 00057 g007
Figure 8. Comparison between the observed (black line) daily streamflow in 2014 and the modeled streamflow with meteorological forcing from GDAS-CHIRPS (Blue), GDAS(Red), MERRA2-C (grey), MERRA2-CHIRPS (green), MERRA2-UC (Orange) for Tarbela (top left), Kalabagh (middle left), and Chasma (bottom left). The same color scheme is used to plot the duration curve for the streamflow from multiple meteorological forcing for the same three stations (right column). Unit in y axis is cusecs and x axis is %. The duration curves show the probability that a given flow will be equaled or exceeded the percentage of time.
Hydrology 05 00057 g008
Figure 9. Same as in Figure 8 except for stations Mangla (top) and Marala (bottom).
Hydrology 05 00057 g009
Figure 10. The correlation coefficient between modeled streamflow and observed daily streamflow in 2014 for stations along the Indus river and its tributaries, which is shown in Figure 7.
Hydrology 05 00057 g010
Figure 11. Comparison between daily observed and model streamflow (m3/sec) at Chattara (Nepal).
Hydrology 05 00057 g011
Figure 12. Duration curve of streamflow at Chattara (Kosi river basin) from multiple simulations. Dataset from Figure 11 has been used to calculate the duration curve for this station. Unit in y axis is m3/sec and in x axis is %. The duration curves show the probability that a given flow will be equaled or exceeded the percentage of time.
Hydrology 05 00057 g012
Figure 13. Average annual precipitation (m3), average annual ET (m3), average annual runoff (surface and sub-surface) (m3), and average annual irrigated water (m3) are plotted from model simulations and from observations. The top bar graph is plotted for Indus and the bottom one is plotted for the Kosi river basin.
Hydrology 05 00057 g013
Table 1. Details about the model simulations used in this paper.
SimulationResolutionPeriodLand Surface ModeBase Meteorological ForcingSupplementary Precipitation
MERRA2 with corrected Precipitation10 km1980–2016Noah3.3MERRA2MERRA2 Corrected Precipitation
MERRA2 with uncorrected Precipitation10 km1980–2016Noah3.3MERRA2MERRA2 Uncorrected Precipitation
MERRA2-CHIRPS10 km1981–2016Noah3.3MERRA2CHIRPS
GDAS10 km2001–2016Noah3.3GDASGDAS
GDAS-CHIRPS10 km2001–2016Noah3.3GDASCHIRPS
Table 2. The root mean square error and the Nash-Sutcliffe efficiency coefficient between the model and the observed daily streamflow in 2014 over the Indus river basin (see Figure 4 and Table 1 for details about location and simulation).
Indus Basin (Pakistan)GDASMERRA2-UCMERRA2-CMERRA2-CHIRPSGDAS-CHIRPS
RMSENSERMSENSERMSENSERMSENSERMSENSE
Tarbela65,551.90.23100,258−0.8199,109.7−0.7695,770.1−0.6596,550.9−0.67
Mangla31,559.00.2632,221.80.2351,251.6−0.9542,559.9−0.3442,141.3−0.32
Marala36,022.60.5356,568.2−0.1554,894.9−0.0839,416.30.4440,112.90.42
Kalabagh91,768.7−0.81126,489−2.45110,799−1.65102,005−1.24104,433−1.35
Chasma91,374.9−0.52121,648−1.69112,319−1.30103,420−0.95106,488−1.07
Table 3. The Pearson correlation coefficient (R) between the water level height and the stream flow at four altimetry sites over the Indus river basin.
RGDAS GDAS-CHIRPS MERRA2-C MERRA2-UC MERRA2-CHIRPS
Site 10.840.540.650.850.53
Site 20.750.490.600.800.47
Site 30.710.50.570.780.49
Site 40.790.60.610.80.55
Table 4. The Pearson correlation coefficient and the root mean square error between the daily model and the observed streamflow at Chattara (Nepal) (see Table 1 for details about simulation).
CHATTARA (Nepal)GDAS (2001–2010)GDAS-CHIRPS (2001–2010)MERRA2-C (2001–2010)MERRA2-UC (2001–2010)MERRA2-CHIRPS (2001–2010)
R0.840.830.71 0.88 0.8
RMSE970.0031083.231864.182587.801149.37
Table 5. The Pearson correlation coefficient and the root mean square error between the annual (monsoon season) model and the observed streamflow at Chattara (Nepal) (see Table 1 for details about simulation).
CHATTARA (Nepal)GDAS (2001–2010)GDAS-CHIRPS (2001–2010)MERRA2-C (2001–2010)MERRA2-UC (2001–2010)MERRA2-CHIRPS (2001–2010)
R (Monsoonal Average)0.380.23−0.150.250.25
RMSE (monsoon season only)1065.20767.8062750.173284.07910.870

