
Urban Stormwater Temperature Surges: A Central US Watershed Study

Water Resources Program, Department of Forestry, School of Natural Resources, University of Missouri, 203 ABNR Building, Columbia, MO 65211, USA
*
Author to whom correspondence should be addressed.
†
These authors contributed equally to this work.
Hydrology 2015, 2(4), 193-209; https://doi.org/10.3390/hydrology2040193
Submission received: 10 July 2015
/
Revised: 18 September 2015
/
Accepted: 20 October 2015
/
Published: 28 October 2015
Abstract
:Impacts of urban land use can include increased stormwater runoff temperature (Tw) leading to receiving water quality impairment. There is therefore a need to target and mitigate sources of thermal pollution in urban areas. However, complex relationships between urban development, stormwater runoff and stream water heating processes are poorly understood. A nested-scale experimental watershed study design was used to investigate stormwater runoff temperature impacts to receiving waters in a representative mixed-use urbanizing watershed of the central US. Daily maximum Tw exceeded 35.0 °C (threshold for potential mortality of warm-water biota) at an urban monitoring site for a total of five days during the study period (2011–2013). Sudden increases of more than 1.0 °C within a 15 min time interval of Tw following summer thunderstorms were significantly correlated (CI = 95%; p < 0.01) to cumulative percent urban land use (r2 = 0.98; n = 29). Differences in mean Tw between monitoring sites were significantly correlated (CI = 95%; p = 0.02) to urban land use practices, stream distance and increasing discharge. The effects of the 2012 Midwest USA drought and land use on Tw were also observed with maximum Tw 4.0 °C higher at an urban monitoring site relative to a rural site for 10.5 h. The current work provides quantitative evidence of acute increases in Tw related to urban land use. Results better inform land managers wishing to create management strategies designed to preserve suitable thermal stream habitats in urbanizing watersheds.
1. Introduction
Stream water temperature (Tw) is a critical physical determinant of aquatic ecosystem health [1,2,3]. For example, Tw regulates chemical reaction rates [1] and the development, distribution and primary productivity of aquatic organisms [4]. When Tw reaches 32 to 40 °C, many North American freshwater fish species will perish [5]. Additionally, stream Tw directly regulates the amount of dissolved oxygen (DO) water can hold. When DO levels are lower than biochemical oxygen demand (BOD) heterotrophic aquatic species can asphyxiate [6] or suffer reproductive problems ranging from birth defects to mortality [7]. A literature review by Caissie [1] identified four main factors that influence Tw including (1) meteorological influences (e.g., solar radiation, air temperature); (2) topographic influences (e.g., riparian vegetation, latitude and altitude); (3) stream discharge (e.g., volume of water, inflow and outflow); and (4) streambed interactions (e.g., groundwater input, hyporheic exchange). Land use practices (e.g., deforestation, flow alteration, urban development) that impact any of these four factors may alter Tw regimes and thus threaten aquatic ecosystem health [1,3].
Stream water temperature is often strongly dependent on meteorological conditions during baseflow periods [8]. However, streamflow volume can become a dominant determinant of Tw as discharge increases. For example, Gu et al. [9] showed that the high heat capacity of water resulting in an inverse relationship between streamflow and Tw. A study by Sinokrot and Gulliver [10] showed that Tw increased above 32.0 °C (threshold of potential mortality of North American freshwater fishes) and even 35.0 °C (threshold of potential death) as discharge and stream depth decreased in Central Platte River located in Nebraska, USA. Such increases in Tw occurred when incoming solar radiation was high and water depth was low [10].
Urban development can contribute to increased stream temperature through increased heat absorbed and re-emitted from land surfaces (i.e., concrete, asphalt, roof tops, and other structures) [11] and, more generally, the urban heat island (UHI) effect [12]. Urbanization can also increase subsurface temperatures [13] which may impact stream water temperature regimes through increased advected heat flux at the stream-streambed and bank interface [14]. Recent studies showed that urban stormwater runoff from heated impervious surfaces following summer thunderstorms can cause sudden surges in Tw and concluded that there is an urgent need to investigate, model, and mitigate the effects of urbanization on the thermal regime of streams for aquatic ecosystem and human health [15,16,17,18,19].
Previous researchers used mathematical models (e.g., regression models, deterministic models) to quantify thermal pollution from urban runoff following summer thunderstorms [16,18]. Nelson and Palmer [18] derived empirical relationships to quantify temperature surges following summertime thunderstorms. Results showed that temperature surges ranging from 2.0 °C to 7.0 °C in a 30 min interval occurred in up to 10% of summer days at a highly urbanized site (58% impervious surface coverage). Nelson and Palmer [18] concluded that headwater streams may be impacted more by urbanization than climate change. A study by Herb et al. [16] used deterministic models dependent on climate data to determine thermal impact of individual storm events. Results showed thermal impact from a storm was due to large rainfall events at high dew point temperature, or moderate rainfall amounts and high land surface temperature. The severity of thermal pollution was dependent on dew point temperature, the amount of incoming solar radiation for the day prior to a rainfall event, and the percentage of impervious surface coverage in the drainage area. Chen et al. [20] estimated hourly Tw using deterministic models dependent on riparian vegetation and other variables including, but not limited to, solar radiation, topographic shading, and stream width. Other studies have used deterministic models to quantify the temperature of stormwater runoff [21,22]. For example, Van Buren et al. [22] used deterministic models to quantify runoff temperature as a function of rainfall and pavement temperature.
Current understanding of the relative impacts of land use on stream temperature regimes has advanced in recent years [15,16,17,18,19]. However, it has also been noted repeatedly that the effects of natural and anthropogenic forces on Tw are highly complex and geographically distinct, and thus in need of further investigation, particularly in urban environments where management and sustainability of aquatic ecosystem health and water quality is of particular concern [1]. Therefore, the objectives of the current work were to investigate: (a) the effects of urban runoff on acute increases in Tw and (b) the effects of urban land use on Tw as discharge increases using three water years of data collected from five gauging sites located in a mixed-land use urbanizing watershed of the central US.
2. Experimental Section
2.1. Study Site
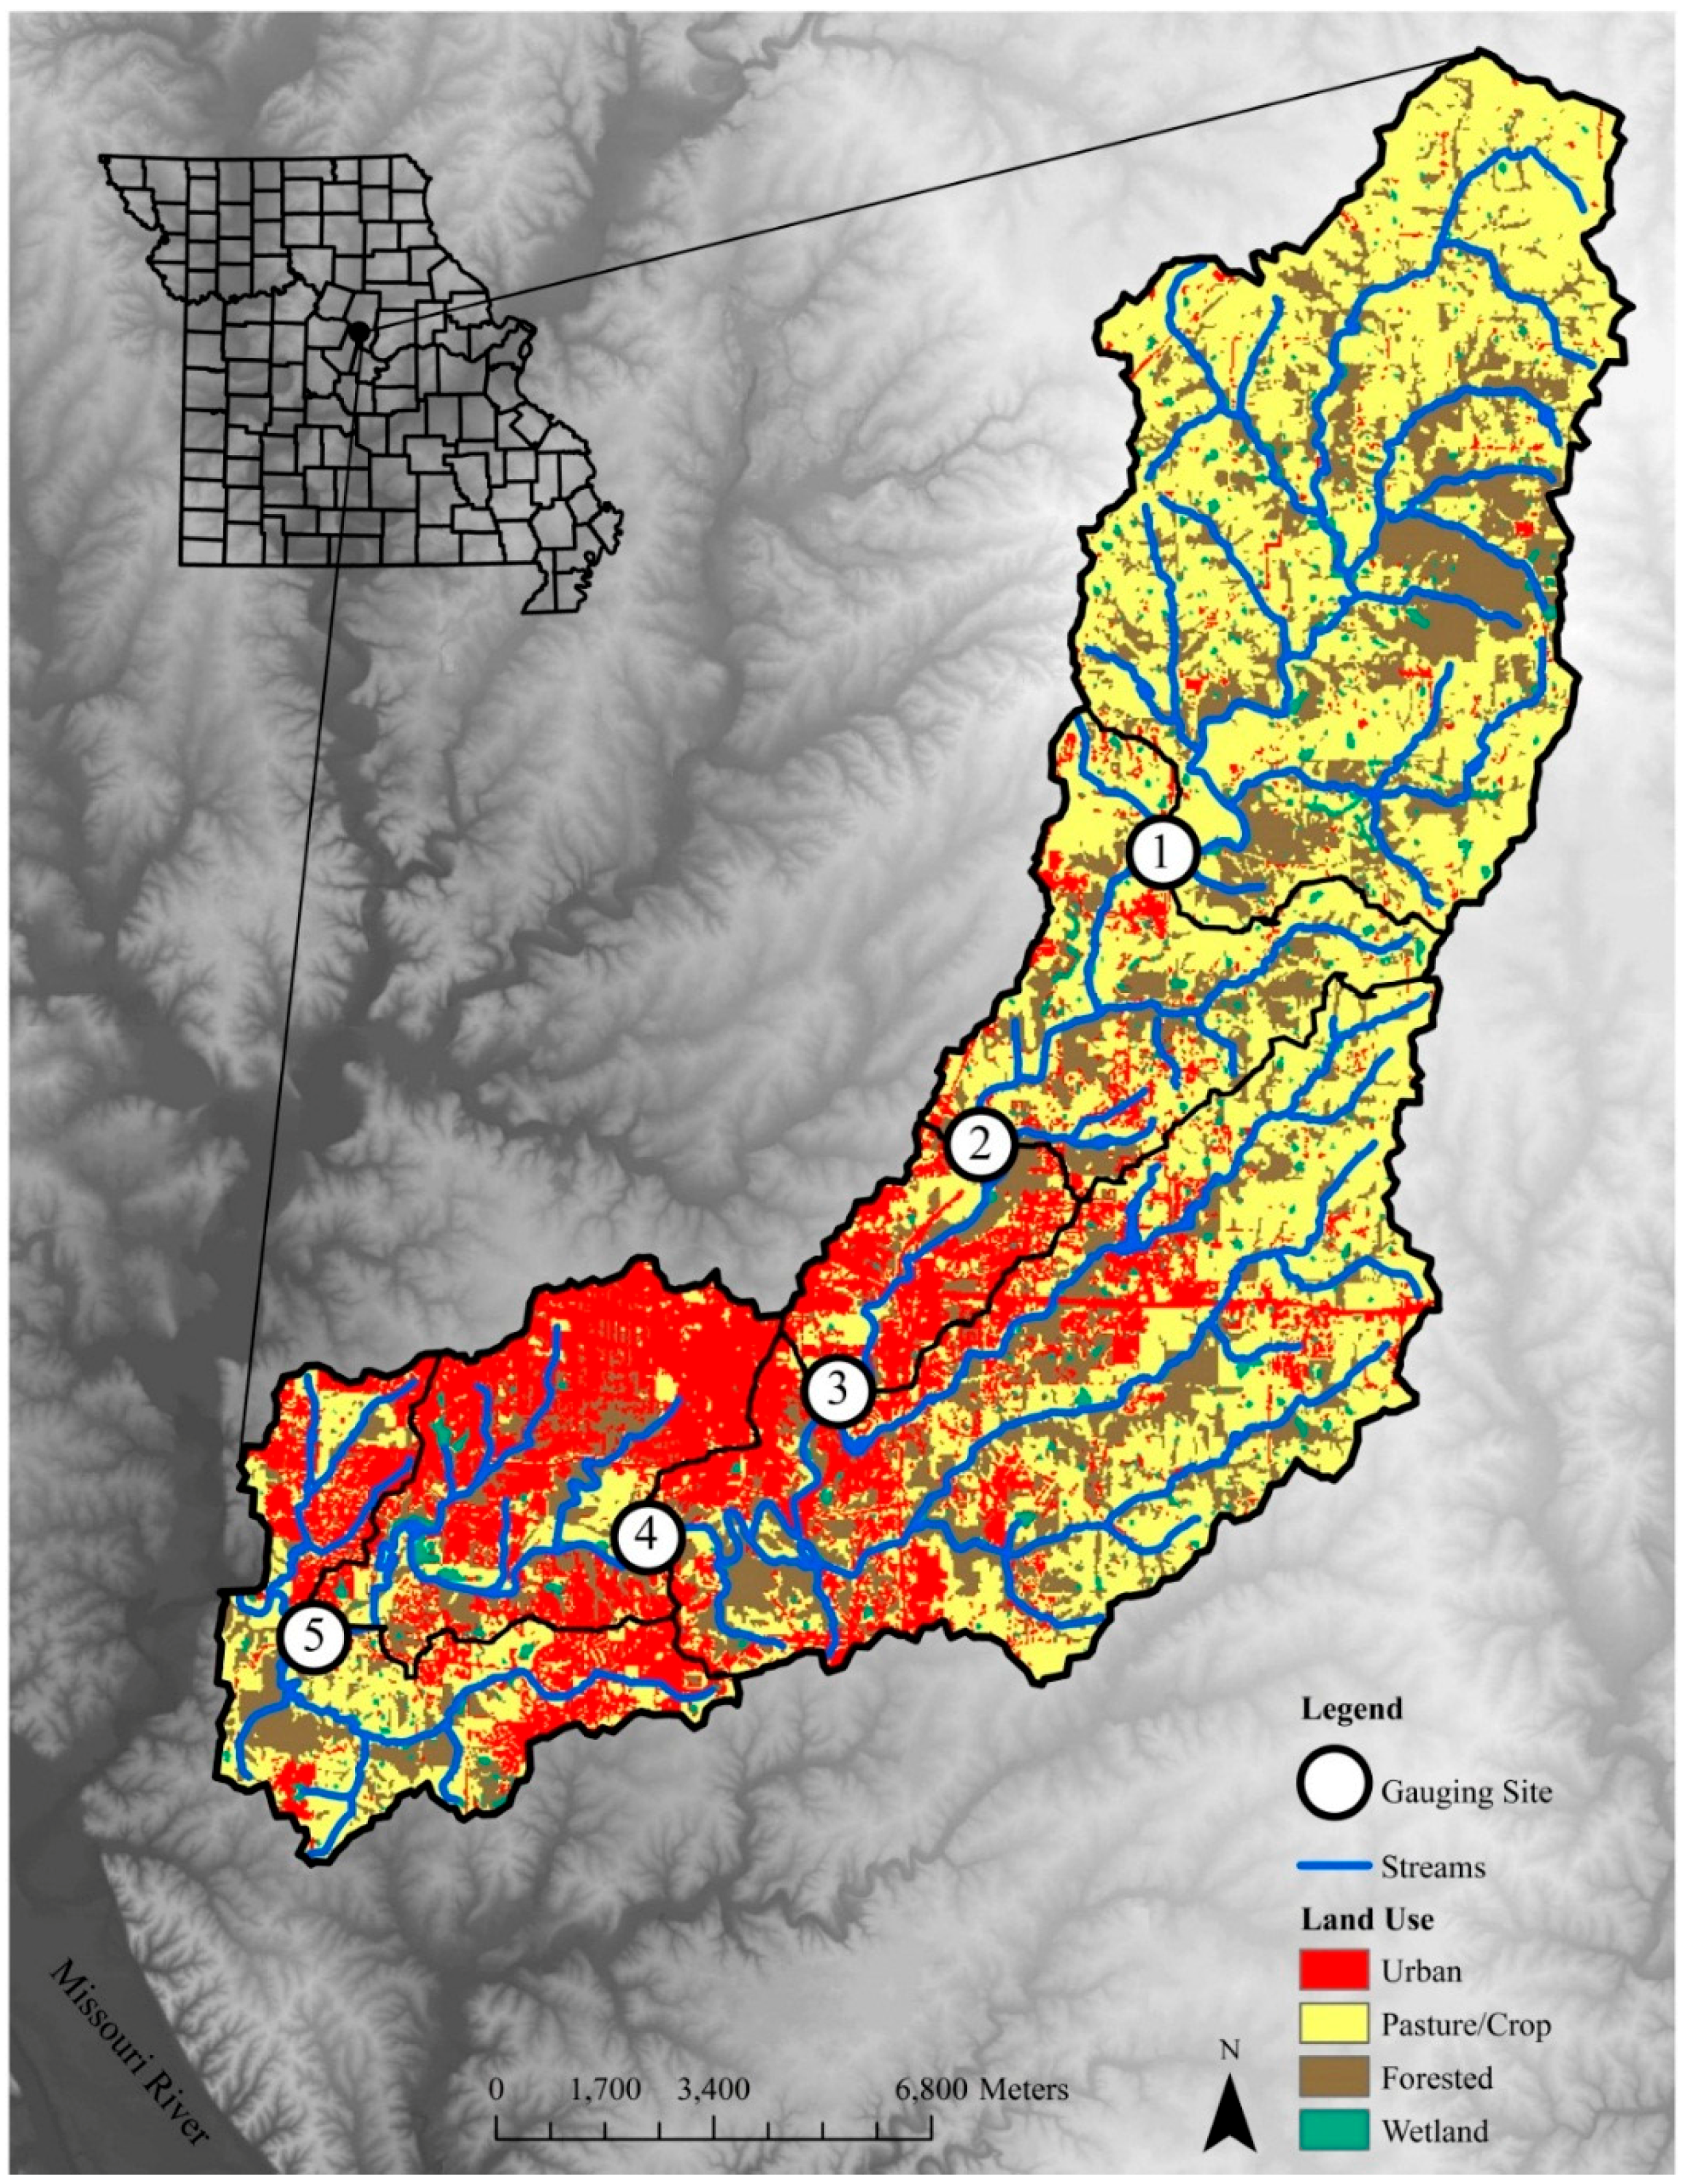
Hinkson Creek Watershed (HCW) is located in the lower Missouri Moreau River Basin (LMMRB, HUC 10300102), and is approximately 230 km2 in drainage area. Elevation ranges from 274 m above mean sea level at the headwaters to 177 m above mean sea level at the watershed outlet. The headwaters of HCW are primarily rural agricultural lands and forested areas while the lower reaches are mostly urbanized [23] (Table 1, Figure 1). Approximately 60% of the City of Columbia, Missouri is located in the lower half of the HCW [24]. The population of Columbia, Missouri was estimated to be 113,225 as per 2014 census results [25]. Approximately 27.74 km2 of impervious surface are within the municipal boundary of The City of Columbia [26].

Table 1.
Cumulative contributing area of sub-basins, stream length, average stream width, and land use types in Hinkson Creek Watershed. Land use areas are shown parenthetically as cumulative percent of upstream drainage area. Percent riparian shading data from Hooper [27].
| Sub-Basin | Site #1 | Site #2 | Site #3 | Site #4 | Site #5 |
|---|---|---|---|---|---|
| Total Area (km2) | 77 | 101 | 114 | 180 | 206 |
| Stream Length (km) | 20 | 27 | 32 | 40 | 49 |
| Stream Width (m) | 12.2 | 16 | 13.4 | 18.4 | 14.1 |
| Riparian Shading | 66% | 51% | 35% | 43% | 48% |
| Urban (km2) | 3.9 (5.1) | 6.1 (6.0) | 12.5 (11.0) | 28.8 (16.0) | 47.4 (23.0) |
| Pasture/Crop (km2) | 43.9 (57.0) | 56.6 (56.0) | 58.1 (51.0) | 82.8 (46.0) | 84.5 (41.0) |
| Forested (km2) | 27.7 (36.0) | 36.4 (36.0) | 41 (36.0) | 64.8 (36.0) | 70 (36.0) |
| Wetland/Water (km2) | 1.5 (1.9) | 2 (2.0) | 2.3 (2.0) | 3.6 (2.0) | 4.1 (2.0) |
Figure 1.
Location of gauging sites (n = 5) and respective sub-basins in the Hinkson Creek Watershed, central Missouri, USA.
Figure 1.
Location of gauging sites (n = 5) and respective sub-basins in the Hinkson Creek Watershed, central Missouri, USA.
Soils in the headwater portion of HCW consist of loamy loess with an underlying claypan [28]. Soils in the lower reaches consist of silty and sandy clay [28]. Alluvial soils are found in the floodplain of the lower reaches with infiltration rates vary from agricultural sites to bottom land hard wood forest sites ranging from 0.1 to 126.0 cm/h, respectively [29]. A cherty clay solution residuum corresponding to the Weller-Bardley-Clinkenbeard (CBC) association can be found near the watershed outlet [28]. Hardwood forests in the HCW are dominated by oak species.
A nested-scale experimental watershed study design partitioned HCW into five sub-basins during the current work. Each sub-basin had different dominant land uses (e.g., site #1 drained 43.9 km2 agricultural, while site #5 drained 47.4 km2 urban) (Table 1 and Figure 1) [11,30]. Site #5 was located near the watershed outlet. Sites #1 through #4 were nested within Site #5. Total drainage area increases from site #1 (77 km2) in the headwaters to site #5 (206 km2) near the watershed outlet. The current work took advantage of available stage and Tw data collected at each gauging site in HCW.
All gauging sites were located on the main channel of HCW (i.e., Hinkson Creek) (Figure 1). Baseflow analyses indicated Hinkson Creek is stormflow dominated with indices ranging from 0.17 at the headwaters (site #1) to 0.27 near the watershed outlet (site #5). While geologic formations of Mississippian limestone are present in the lower reaches of Hinkson Creek [28], to the best of the authors’ knowledge, there are no known springs that might influence the Tw regime.
2.2. Methods
The study period of this work included three Water Years’s (WY’s) (1 October 2010 to 30 September 2013). Every nested hydroclimate station was equipped with a TE525WS Rain Gauge to measure precipitation, Campbell Scientific, Inc., Logan, UT, USA, model HMP45C air temperature and relative humidity probes with radiation shields, a LI200X LICOR pyrometer, and a Sutron Accubar® Constant Flow Bubble Gauge and Recorder to measure stage (Table 2). Stage was measured every 10 seconds. Ten second data were averaged and stored in Campbell Scientific CR-1000 data loggers every 5 min. Stage-discharge rating curves were used to estimate stream discharge. For the current research, the incremental cross section method was used to manually measure stream discharge in order to develop rating curves [31].
Table 2.
Instrumentation installed at gauging sites along Hinkson Creek, Missouri, USA, and associated variables sensed, necessary for the current work.
| Instrument | Measurement | Accuracy |
|---|---|---|
| TE525WS Rain Gauge | Precipitation in mm | +1% at 2.54 cm/h rainfall rate to −3.5% at 5.08 to 7.62 cm/h rainfall rate |
| LI200X, LICOR pyrometer | Solar Radiation in W/m2 | ±5% |
| Sutron Accubar® Constant Flow Bubble Gauge/Recorder 560133 | Water stage in mm | 0.02% at 0–25 ft to 0.05% at 26–50 ft |
| Campbell Scientific, Inc. Model HMP45C Temperature and Relative Humidity Probe with radiation shield | Air temperature in °C and relative humidity in % | ±0.2 °C at 20 °C to ±0.5 at 60 °C |
| Campbell Scientific, Inc. CS107-L temperature probe | Water temperature in °C | ±0.2 °C |
2.2.1. Stream Water Temperature
In-stream Campbell Scientific CS107-L temperature probes were installed in June of 2010. The accuracy of the probes was ±0.2 °C (Table 2). The temperature probes were pre-calibrated and tested from the manufacturer. Since gauging site #4 (USGS stream gauging site: 06910230) data were logged at 15 min time-steps, water temperature data were reduced (i.e., normalized) from other sites by averaging raw five minute data to 15 min time steps for analysis of Tw surges. The number of days with daily maximum Tw greater than 32.0 °C (threshold for mortality for many North American fish) and daily maximum Tw greater than 35.0 °C (critical thermal maximum (heating rate of 1.0 °C/min) for many North American fish) during the study period was quantified for each monitoring site [10,32]. Critical thermal maximum threshold is the highest temperature that many North American fish species cannot tolerate. Analysis for Tw surges following summer thunderstorms were conducted similar to the methods provided by Anderson et al. [15] and Rice et al. [19] where a Tw surge was defined as greater than 1.0 °C increase in Tw within 15 min time interval. Surge duration was calculated as the time from the beginning of the Tw surge until Tw returned to pre-surge temperature.
2.2.2. Streamflow Class Calculations
The effects of stream discharge on Tw variability were analyzed by calculating mean Tw above and below median discharge values for each site similar to the work of Webb et al. [33]. Analyzing Tw at different flow classes enabled quantitative characterization of Tw variability at each gauging site during different flow periods. For example, the <50% flow class represented Tw when streamflow was less than median discharge (0.2 m3/s) at site #5 while the >50% flow class represented Tw when streamflow was greater than median discharge (0.2 m3/s) at site #5. Stream temperature data in the >50% flow class were separated into four additional flow classes (>60%, >70%, >80%, and >90%). Additionally, the 90% flow class was separated into nine additional flow classes at 1% intervals from 91% to 100%. The >99% flow class shows Tw when Hinkson Creek was approximately bankfull. Thus, Tw data were separated into a total of 15 different flow classes. Mean Tw was associated with each respective flow class and tested for significant differences using Analysis of Variance (ANOVA, CI = 0.05).
3. Results
3.1. Climate during Study
Annual total precipitation ranged from 744 mm (WY 2012) to 1020 mm (WY 2013) with a mean of 838 mm for the three year study period (Table 3), which was 244 mm less than the 20 year average of 1082 mm/year [28]. Mean Ta ranged from 12.3 °C at site #1 to 13.5 °C at site #3 with a five site mean of 13.0 °C. Mean daily total solar radiation ranged from 12.9 MJ/m2 at site #4 to 14.8 MJ/m2 at site #2 with a five site mean of 13.8 MJ/m2.
Table 3.
Summary of statistics during the study period (WY 2011–2013) for five hydroclimate stations located in Hinkson Creek Watershed, Missouri, USA.
| Climate Data | Daily Statistic | Site #1 | Site #2 | Site #3 | Site #4 | Site #5 |
|---|---|---|---|---|---|---|
| Precip. (mm) | * Annual Total | 838.4 | 826.5 | 872.1 | 866.0 | 803.8 |
| Discharge | Mean | 0.7 | 0.7 | 1.0 | 1.5 | 2.5 |
| (m3/s) | † St. Dev. | 4.5 | 4.2 | 5.3 | 6.2 | 10.0 |
| Minimum | <0.1 | <0.1 | <0.1 | <0.1 | <0.1 | |
| Maximum | 82.1 | 66.4 | 86.7 | 114.9 | 137.9 | |
| Tw (°C) | Mean | 13.7 | 14.2 | 14.2 | 14.4 | 14.2 |
| St. Dev. | 8.6 | 9.7 | 9.5 | 9.5 | 9.4 | |
| Minimum | 0 | 0.4 | 0.2 | 0.1 | 0.1 | |
| Maximum | 32.1 | 34.7 | 36.1 | 33.9 | 32.9 |
* Precipitation (Precip) data are three year (WY 2011–2013) average annual totals.† “St. Dev.” is standard deviation.
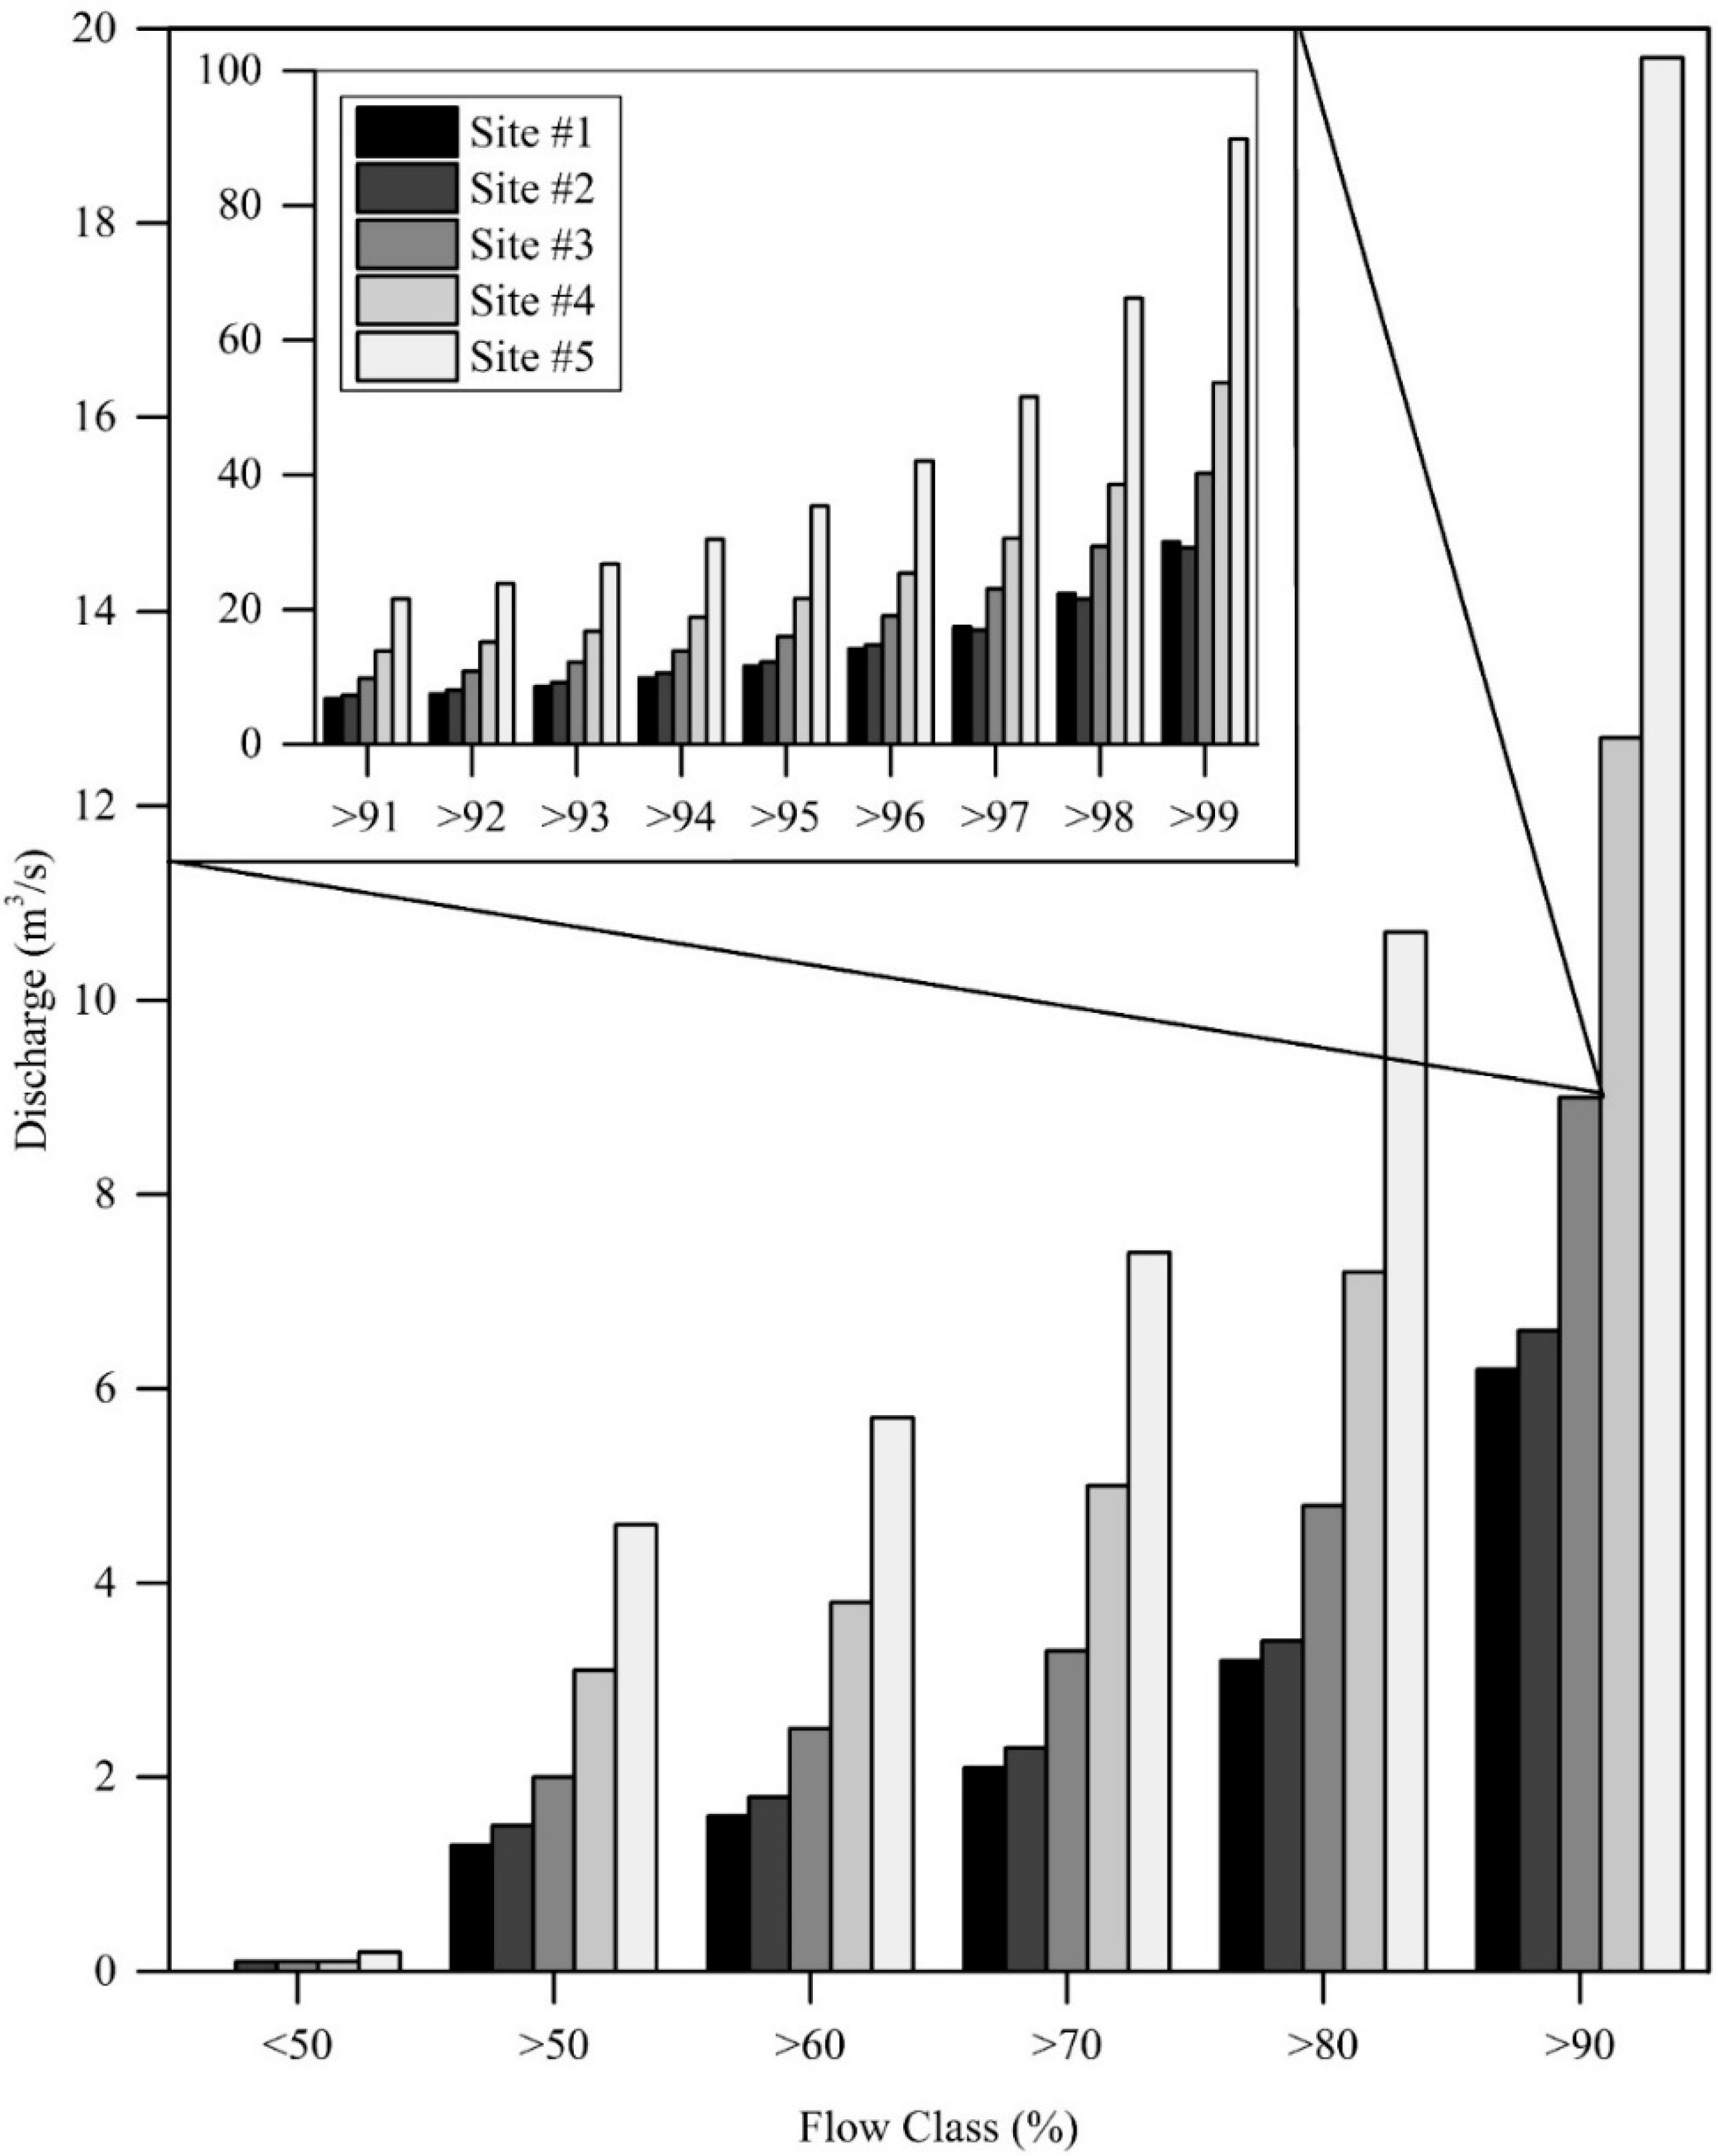
Mean discharge ranged from 0.7 m3/s at site #1 to 2.5 m3/s at site #5 with a five site mean of 1.3 m3/s. Maximum discharge ranged from 66.4 m3/s at site #2 to 137.9 m3/s at site #5 with a five site mean of 97.6 m3/s. Daily average discharge was less than 0.1 m3/s at site #1 to site #5 for a total of 835, 769, 549, 433, 93 days, respectively, during the three year study. There was a significant (p < 0.01) difference identified in mean discharge between gauging sites. Drainage area and cumulative percent urban land use accounted for 92.6% of the explained variance in annual mean discharge.
3.2. Stream Water Temperature
Daily mean Tw was 0.2 to 0.7 °C greater at site #4 relative to all other sites. Conversely, daily mean Tw was 0.5 to 0.7 °C lower at rural site #1 in the headwaters than all other gauging sites (Table 3). Differences in daily mean Tw from sites #2 through #5 were often within the accuracy limitations of the sensor (±0.2 °C). The total number of days that Tw was greater than 32.0 °C (thermal maximum) ranged from 1 day at site #1 to a total of 55 days at site #3 with an all site mean of 19 days during the study (Table 4). The maximum duration Tw was greater than 32.0 °C ranged from 0.25 h at site #1 to 9.75 h at site #4 with a five site mean of 6.55 h. The maximum duration that Tw was greater than 32.0 °C occurred at site #4 and not site #3 likely due to differences in stage and water volume between each site. The number of day’s Tw was above the 32.0 °C thermal maximum peaked at site #3 for 55 days and decreased to 8 days at site #5. Maximum Tw was above the 35.0 °C critical thermal maximum at site #3 for 5 days during the 2012 drought summer when daily total solar radiation rates were greater than 25MJ/m2, maximum Ta was greater than 40.0 °C, and discharge was low (0.1 m3/s). On 23 July 2012, Tw peaked at 36.1 °C and exceeded the critical thermal maximum threshold of 35.0 °C for 2.5 h at urban site #3. At that time, Tw was presumably less dependent on the temperature of inflows and more dependent on meteorological conditions (i.e., solar radiation and Ta), and reduced stage (29.7 cm) near the location of the Tw sensor. The differences between sites on the days Tw was greater than 32 °C, and the maximum duration Tw was greater than 32 °C followed the same general trend as the difference in riparian shading at each site. Riparian tree canopy shading, measured every 100 m of the stream channel in 2013 and 2014, decreased from site #1 (66%) to site #3 (35%), and then increased from site #3 to site #5 (48%) (Table 1) [27]. Linear regression analysis confirmed relationships observed between riparian shading and days Tw was greater than 32 °C (r2 = 0.617, p = 0.07), and the maximum duration Tw was greater than 32 °C (r2 = 0.72, p = 0.04).
Table 4.
Days stream water temperature was greater than 32.0 and 35.0 °C during water years 2011–2013, and summary statistics of Tw surges sensed at five hydroclimate stations located in Hinkson Creek Watershed, Missouri, USA. Summary statistics of Tw surges are averages (n = 29).
| Critical Thermal Criteria | Site #1 | Site #2 | Site #3 | Site #4 | Site #5 |
|---|---|---|---|---|---|
| Days Tw > 32.0 °C | 1 | 12 | 55 | 20 | 8 |
| Max duration Tw > 32.0 °C (hours) | 0.3 | 7.3 | 8.3 | 9.8 | 7.3 |
| Average Tw Surge (°C) | -- | -- | 2.0 | 2.9 | 4.8 |
| Average Surge Duration (h) | -- | -- | 3.0 | 7.6 | 9.2 |
Figure 2.
Mean discharge above and below median values for each gauging site (WY 2011 to 2012) in Hinkson Creek Watershed, USA. The nested plot expands the >90% flow class for a total of 15 flow classes.
Figure 2.
Mean discharge above and below median values for each gauging site (WY 2011 to 2012) in Hinkson Creek Watershed, USA. The nested plot expands the >90% flow class for a total of 15 flow classes.
When 15 min interval Tw data were analyzed for Tw surges during summers, Tw surges were only found in sub-basins where urban land use (and accompanying impervious surfaces) was greater than 12.5%. A total of 29 Tw surges were observed at urban gauging sites #3–#5 during summer months (Table 4). Maximum peak Tw following a Tw surge was 34.2 °C at site #3. Mean Tw surge and surge duration were 2.7 °C and 5.1 h, respectively. Maximum Tw surge and surge duration were 4.8 °C and 9.1 h, respectively, at site #5. Multiple linear regression analysis revealed significant linear relationships (r2 > 0.95; p < 0.027) between dependent variables (mean Tw surge, and surge duration), and percent urban land use (positive correlate) and percent forested land use (negative correlate) in 25, 50, 75, 100 m stream buffers and drainage area to each monitoring site.
3.3. Streamflow Class Separations
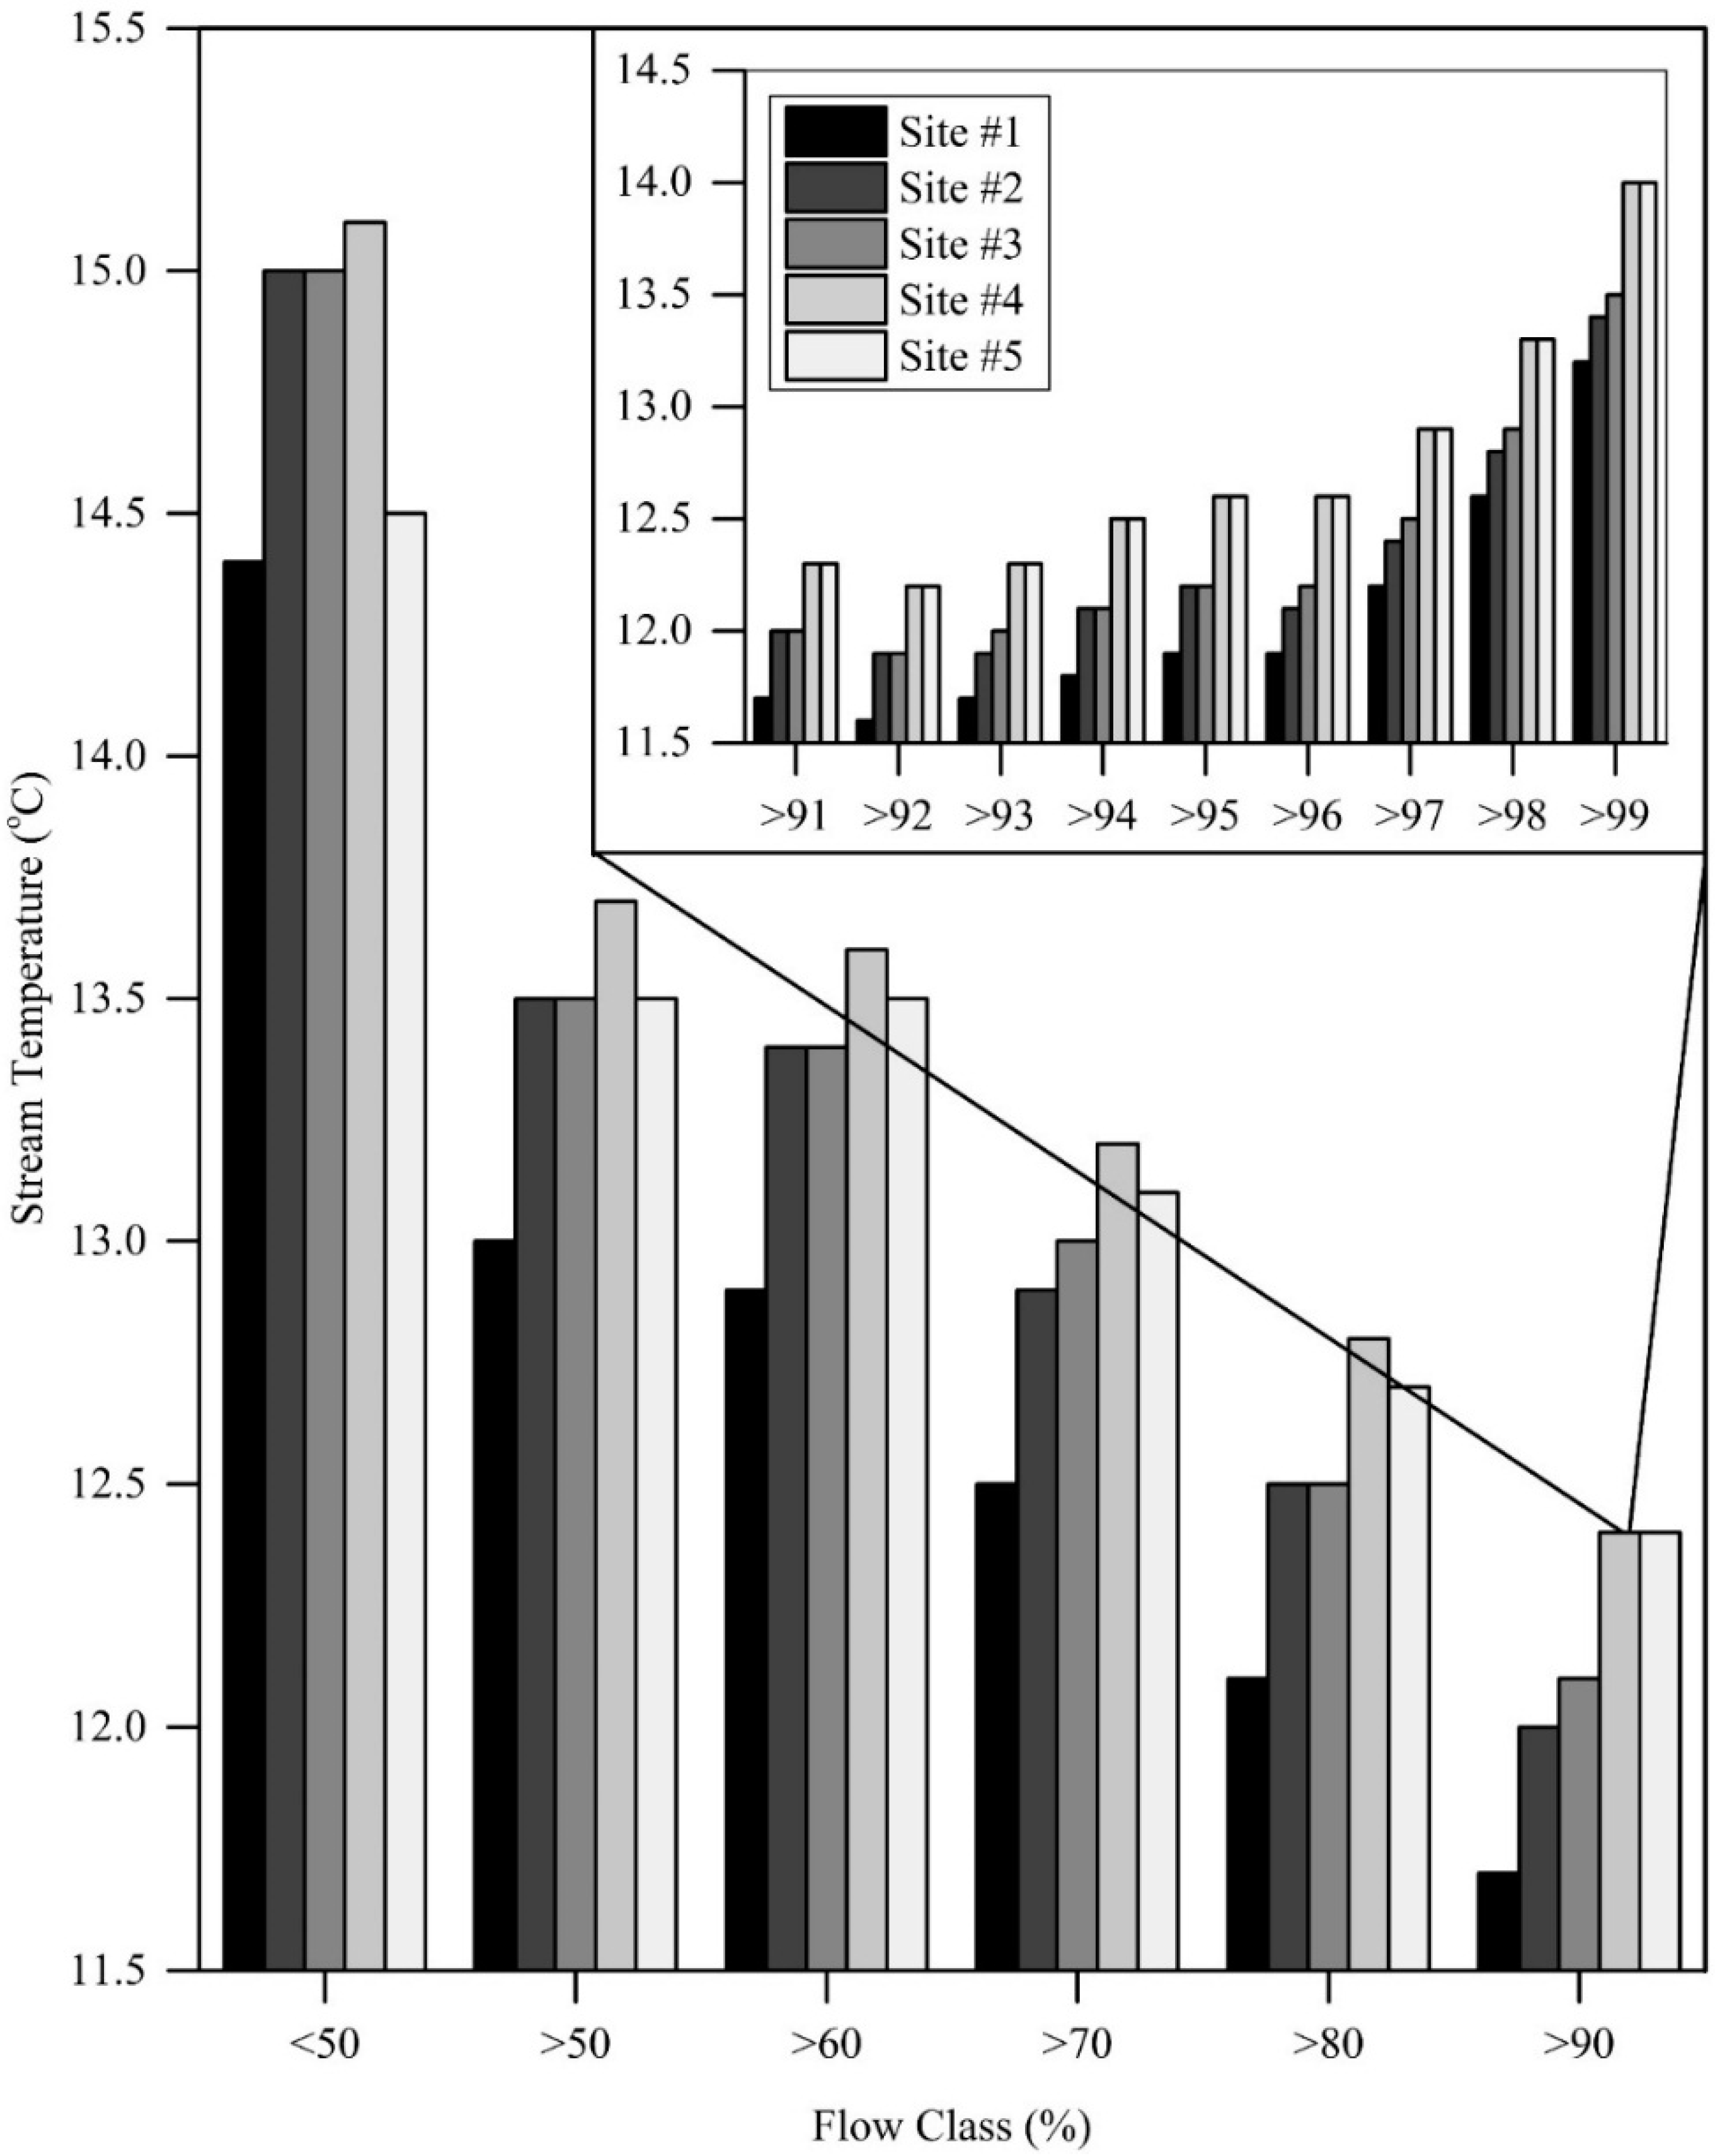
Results of flow class separation analyses showed mean discharge increased exponentially above median flow values (>50% flow class) (Figure 2). As discharge increased, mean Tw at urban sites #4 and #5 was significantly (CI = 95%; p = 0.01) higher than rural/suburban sites #1–#3. Urban sites #4 and #5 showed the greatest increase in Tw with increased flow relative to all the other Hinkson Creek sites (Figure 3). There was also a significant (CI = 95%; p = 0.01) longitudinal increase in Tw in Hinkson Creek with stream distance from site #1 to site #5. When discharge was low (i.e., <50% flow class), there was no significant correlation between mean Tw and urban land use (r2 = −0.33; CI = 95%; p = 0.91), or stream distance (r2 = −0.32; CI = 95%; p = 0.90). Mean Tw was higher in <50% flow class compared to the >50% flow class because streamflow was often below median values during the dry season (July through October), which occurred during the warmer months of the year. Correlations between discharge and mean Tw increased as flow class increased, but results from ANOVA did not show a significant relationship at the 95% confidence level (p > 0.07). Multiple regression analyses showed strong (CI = 95%; p = 0.01) correlations between stream discharge and urban land use as flow class increased, accounting for 93% of the explained variance in mean Tw.
Figure 3.
Mean stream water temperatures above and below median values for each gauging site (WY 2011 to 2012) in Hinkson Creek Watershed, USA. The nested plot expands the >90% flow class for a total of 15 flow classes.
Figure 3.
Mean stream water temperatures above and below median values for each gauging site (WY 2011 to 2012) in Hinkson Creek Watershed, USA. The nested plot expands the >90% flow class for a total of 15 flow classes.
4. Discussion
4.1. Climate during Study
Annual mean discharge during the study (WY 2011–2013) was 10% less than the historic record of annual mean discharge of 1.78 m3/s recorded intermediately (1967–1981, 1986–1991, and 2007–2013) at the U.S. Geological Survey gauging station #06910230. Climate during the study period included a year of “extreme” to “exceptional” (D3 to D4) drought conditions in WY 2012 [34]. Ultimately, drought conditions during the study supplied a distinct data set for the investigation of the relationship between streamflow and Tw, considering shallow water is susceptible to heating during low-flow periods and can be amplified with drought [18,10].
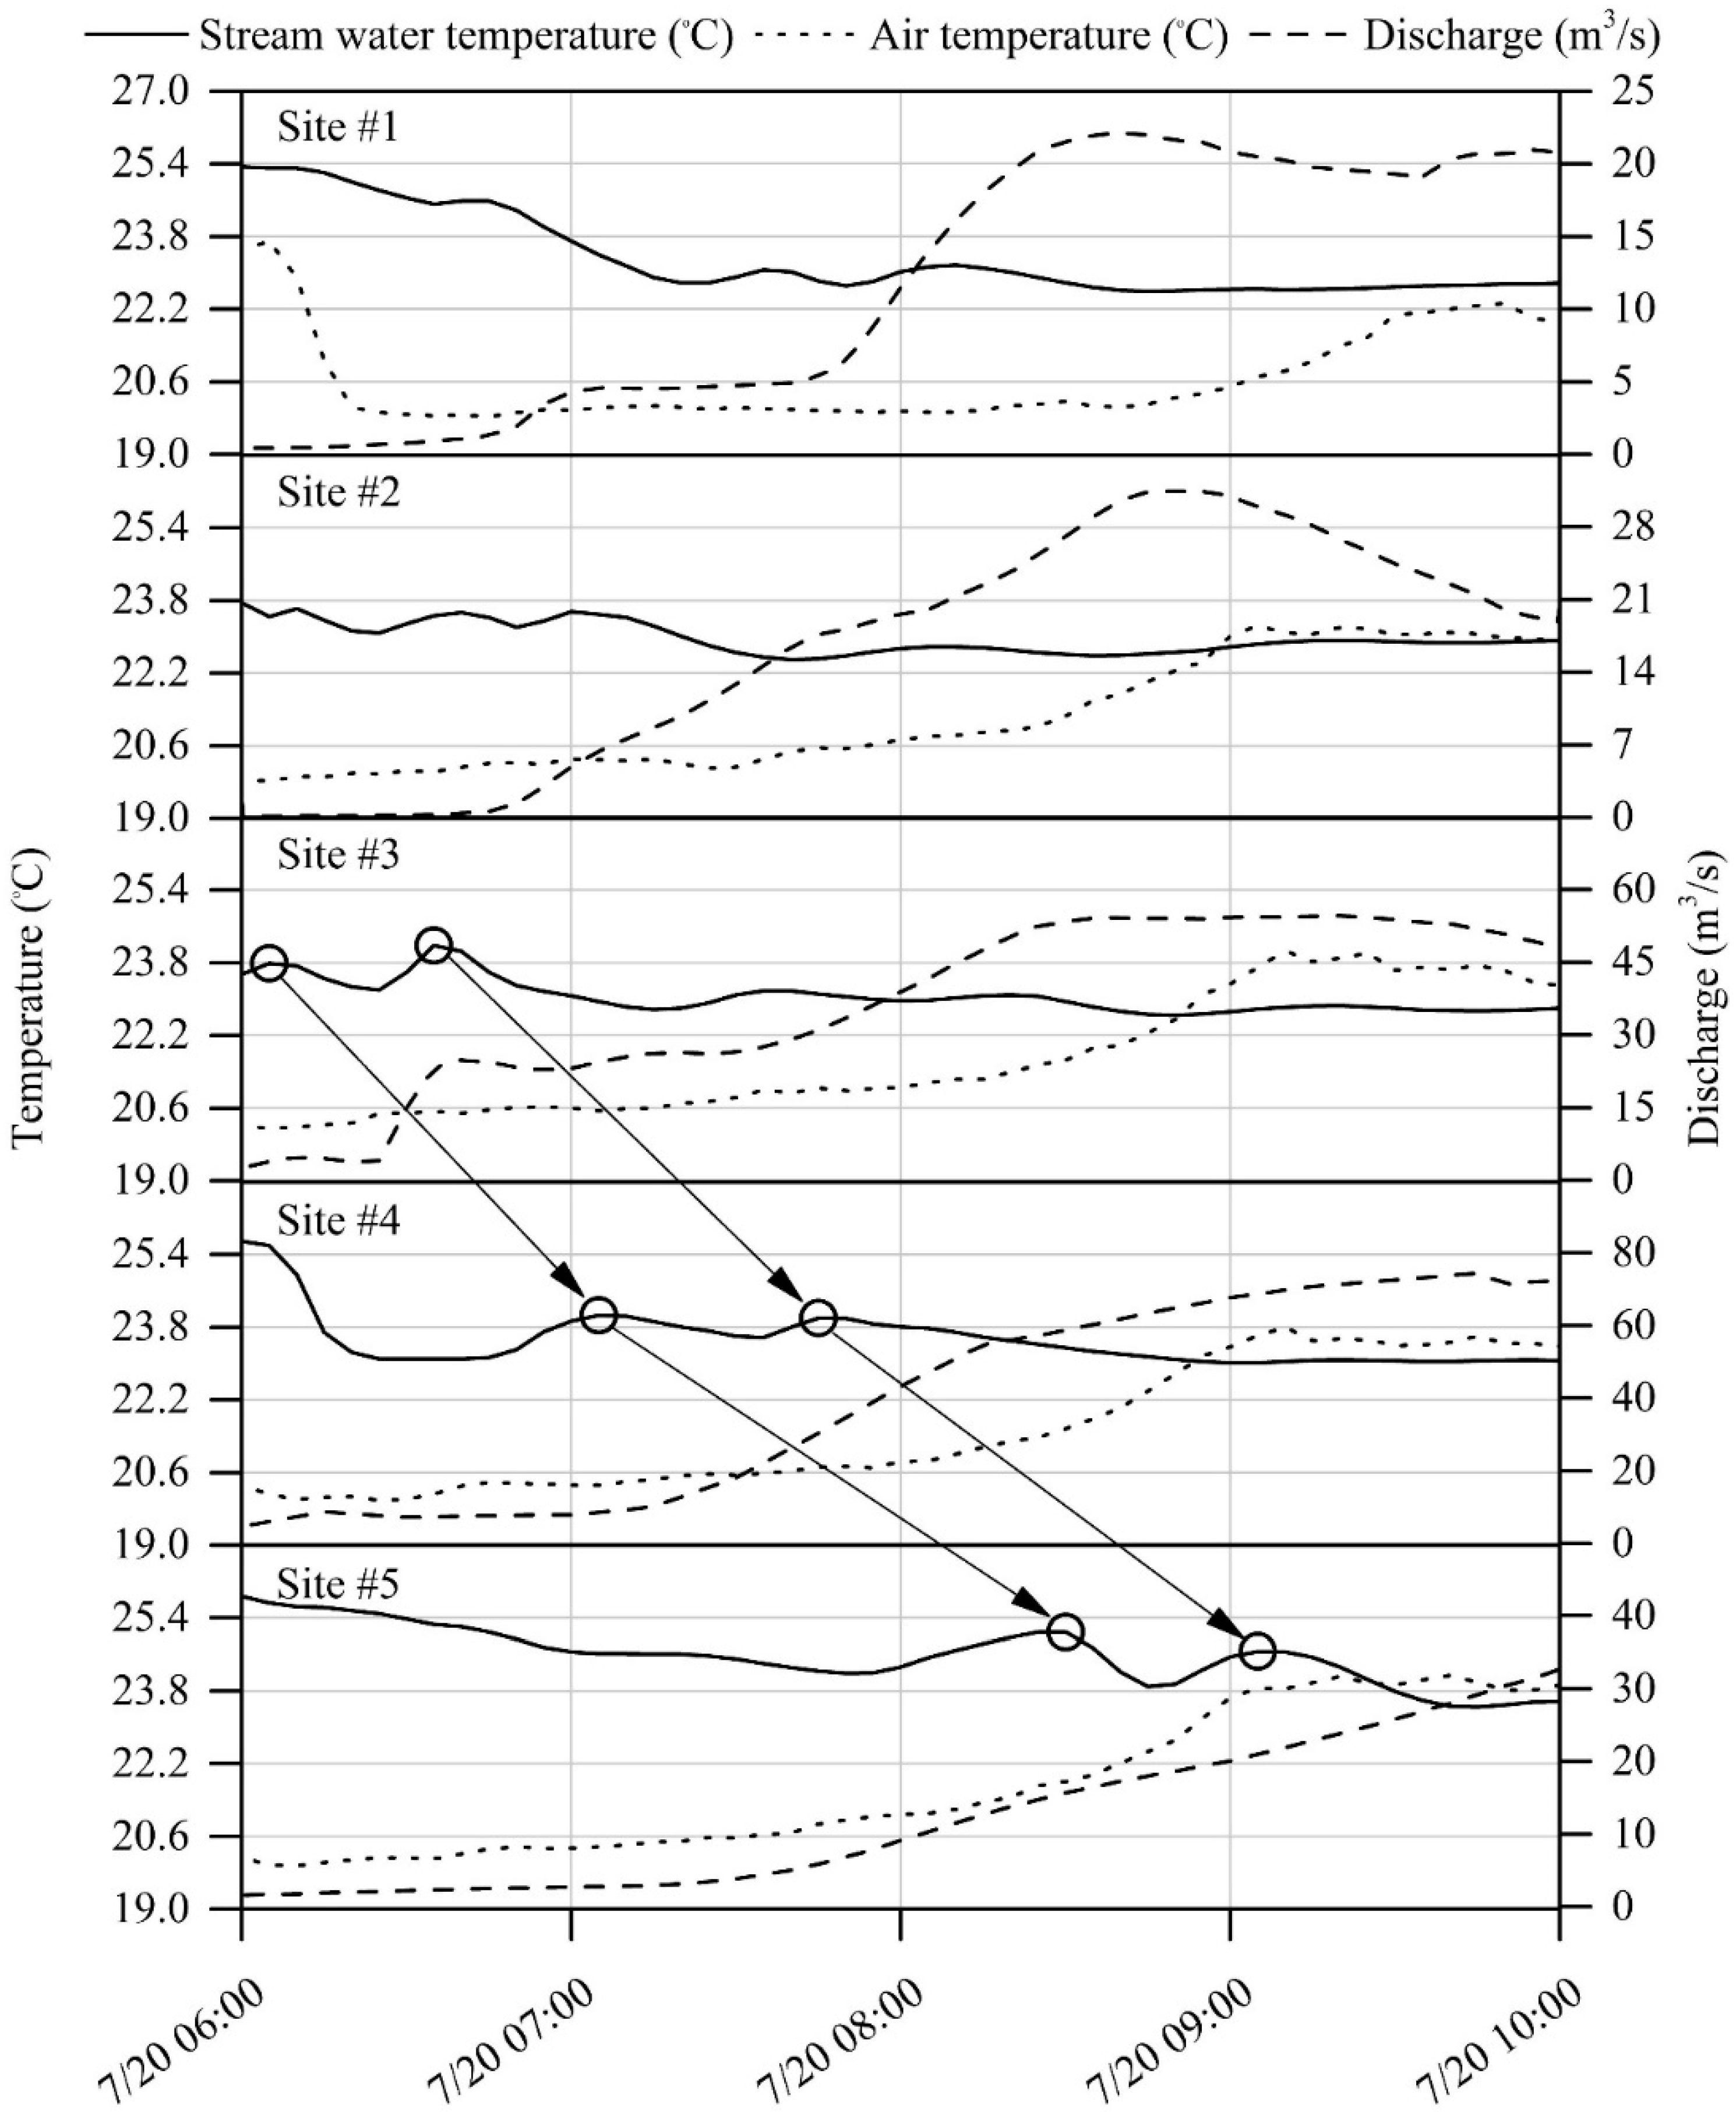
Figure 4.
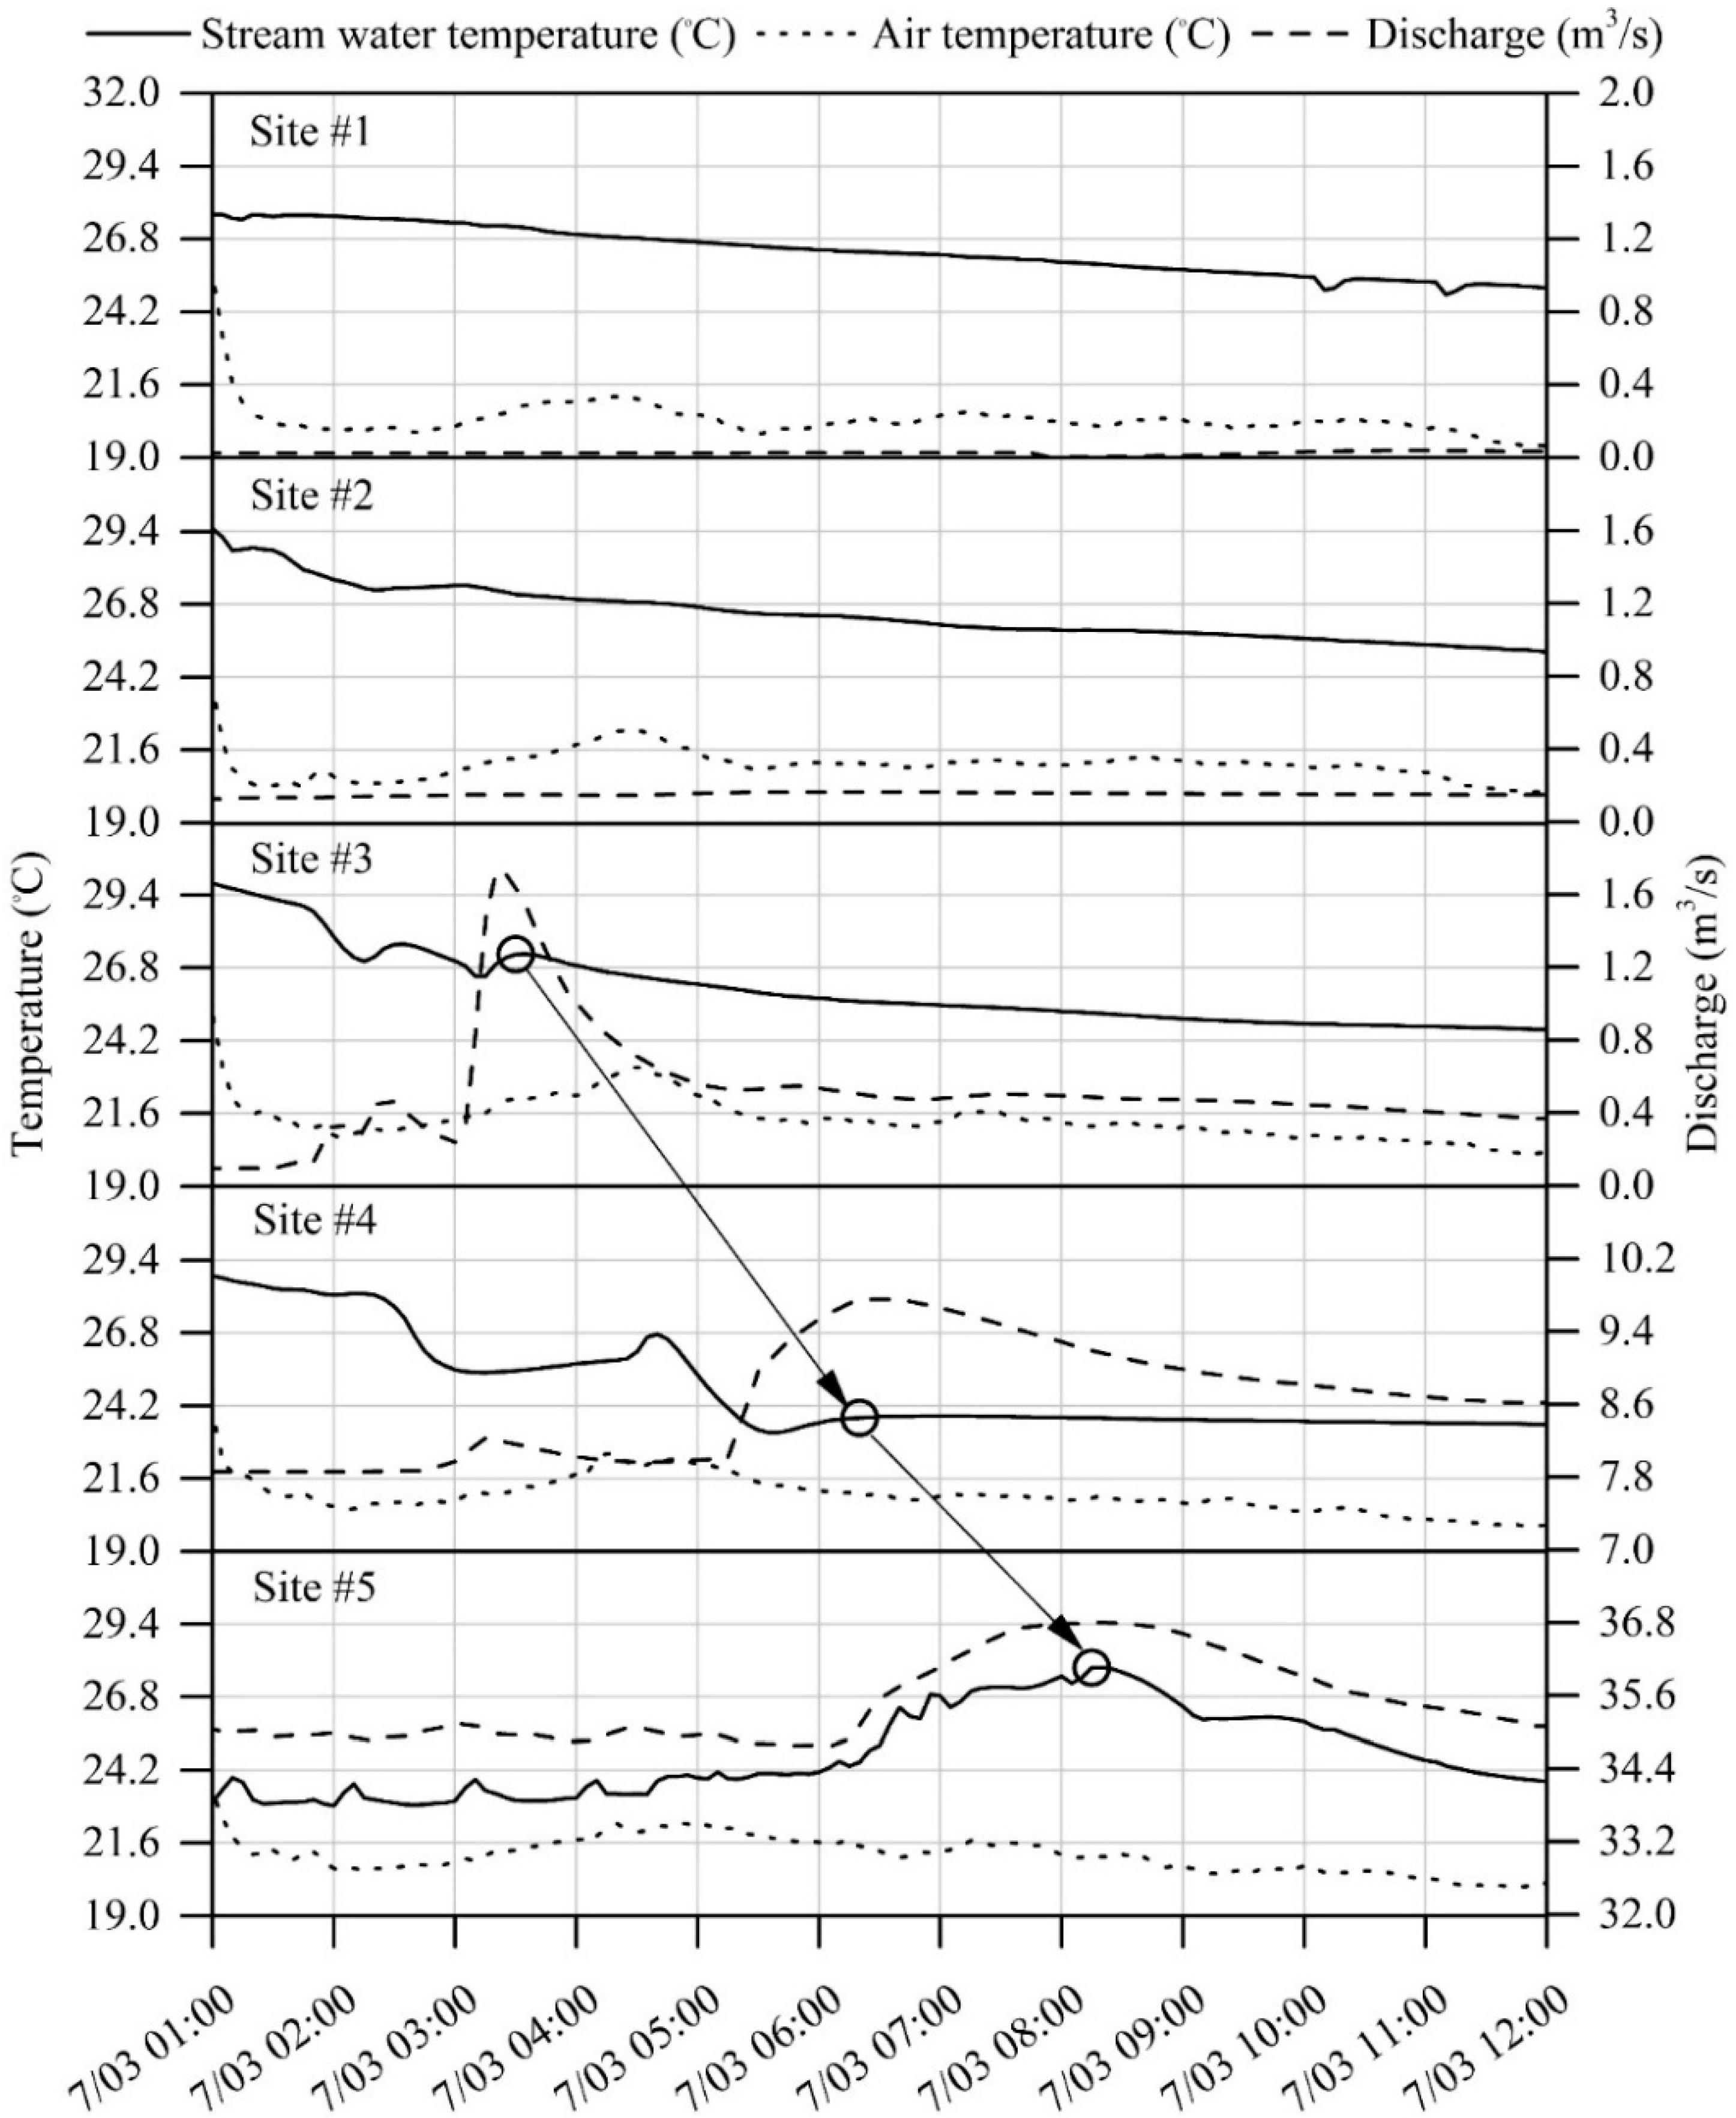
Stream water temperature surges sensed at gauging sites in Hinkson Creek following a summer thunderstorm near sunset during summer 2011. The black circles mark the peak Tw surges and the arrows track the Tw surges downstream from sites #3 through #5.
Figure 4.
Stream water temperature surges sensed at gauging sites in Hinkson Creek following a summer thunderstorm near sunset during summer 2011. The black circles mark the peak Tw surges and the arrows track the Tw surges downstream from sites #3 through #5.

4.2. Stream Water Temperature
Urban heat island effects observed by Hubbart et al. [11] coupled with the Tw surges observed in the current work provide compelling evidence regarding the effects of increased heat absorbed and emitted from paved surfaces to the study watershed. The positive relationship between impervious surface coverage (ISC) associated with urban land use and sudden increases in Tw following summer thunderstorms (Tw surges) in the current work were in agreement with the findings of Rice et al. [19]. Rice et al. [19] showed mean Tw surge amplitude increased as ISC within a 25 m stream buffer increased above 40% with a peak Tw surge of 3.27 °C where 75% ISC was found in a 25 m stream buffer. The multiple regression relationship between mean Tw surge and duration and percent urban (positive correlate) and forested (negative correlate) land uses within 25, 50, 75, 100 m stream buffers and entire drainage area to each monitoring point was likely also a causal relationship and in agreement with previous studies [1,3,20]. In the current work, percent urban land use increased by 21.7%, and forested land use decreased by −2.9% as drainage area increased by 129 km2 from site #1 in the headwaters to site #5 near the watershed outlet. Stream temperature surges were not observed in rural sub-basins with less than 6.2% urban land use and greater than 36% forested land use (sites #1 and #2). Urban land use was greater than 10% of total drainage area at sites #3–#5. Figure 4 shows Tw surges (approximately 1 °C increase in Tw within 15 min) persisted from suburban site #3 to downstream gauging sites #4 (8 km) and #5 (9 km). It was not possible to separate the contribution of upstream temperature from the temperature of surface runoff from within each subbasin in the current study. The loss of flow volume between sites #4 and #5 shown in Figure 4 was presumably due to instream transmission losses and bank storage of water.
While the Tw surges shown in Figure 4 were less than 2 °C in magnitude, Figure 5 shows that large plumes of heated stormwater can increase Tw by as much as 4 °C for up to 5 h as the flood wave moves downstream. In Figure 5, the differences in discharge between sites #4 and #5 are due to a back watering phenomenon from the Missouri River that increased stage at site #5 during the summer of 2011. It is noteworthy that a Tw surge at site #5 at 18:00 p.m. on 3 July 2011 was not detected upstream at gauging site #4. Presumably the Tw surge came from stormwater runoff that entered approximately 1.3 km downstream of site #4 where Flat Branch Creek, a 1st order tributary intersects with Hinkson Creek. The headwaters of Flat Branch Creek originate in the downtown area of the City of Columbia and drain the majority (60%) of the high density urban land area from the city. This is an important observation highlighting how the nested-scaled experimental watershed study design can be useful to trace the source of a nonpoint source pollutant such as Tw in a mixed use watershed.
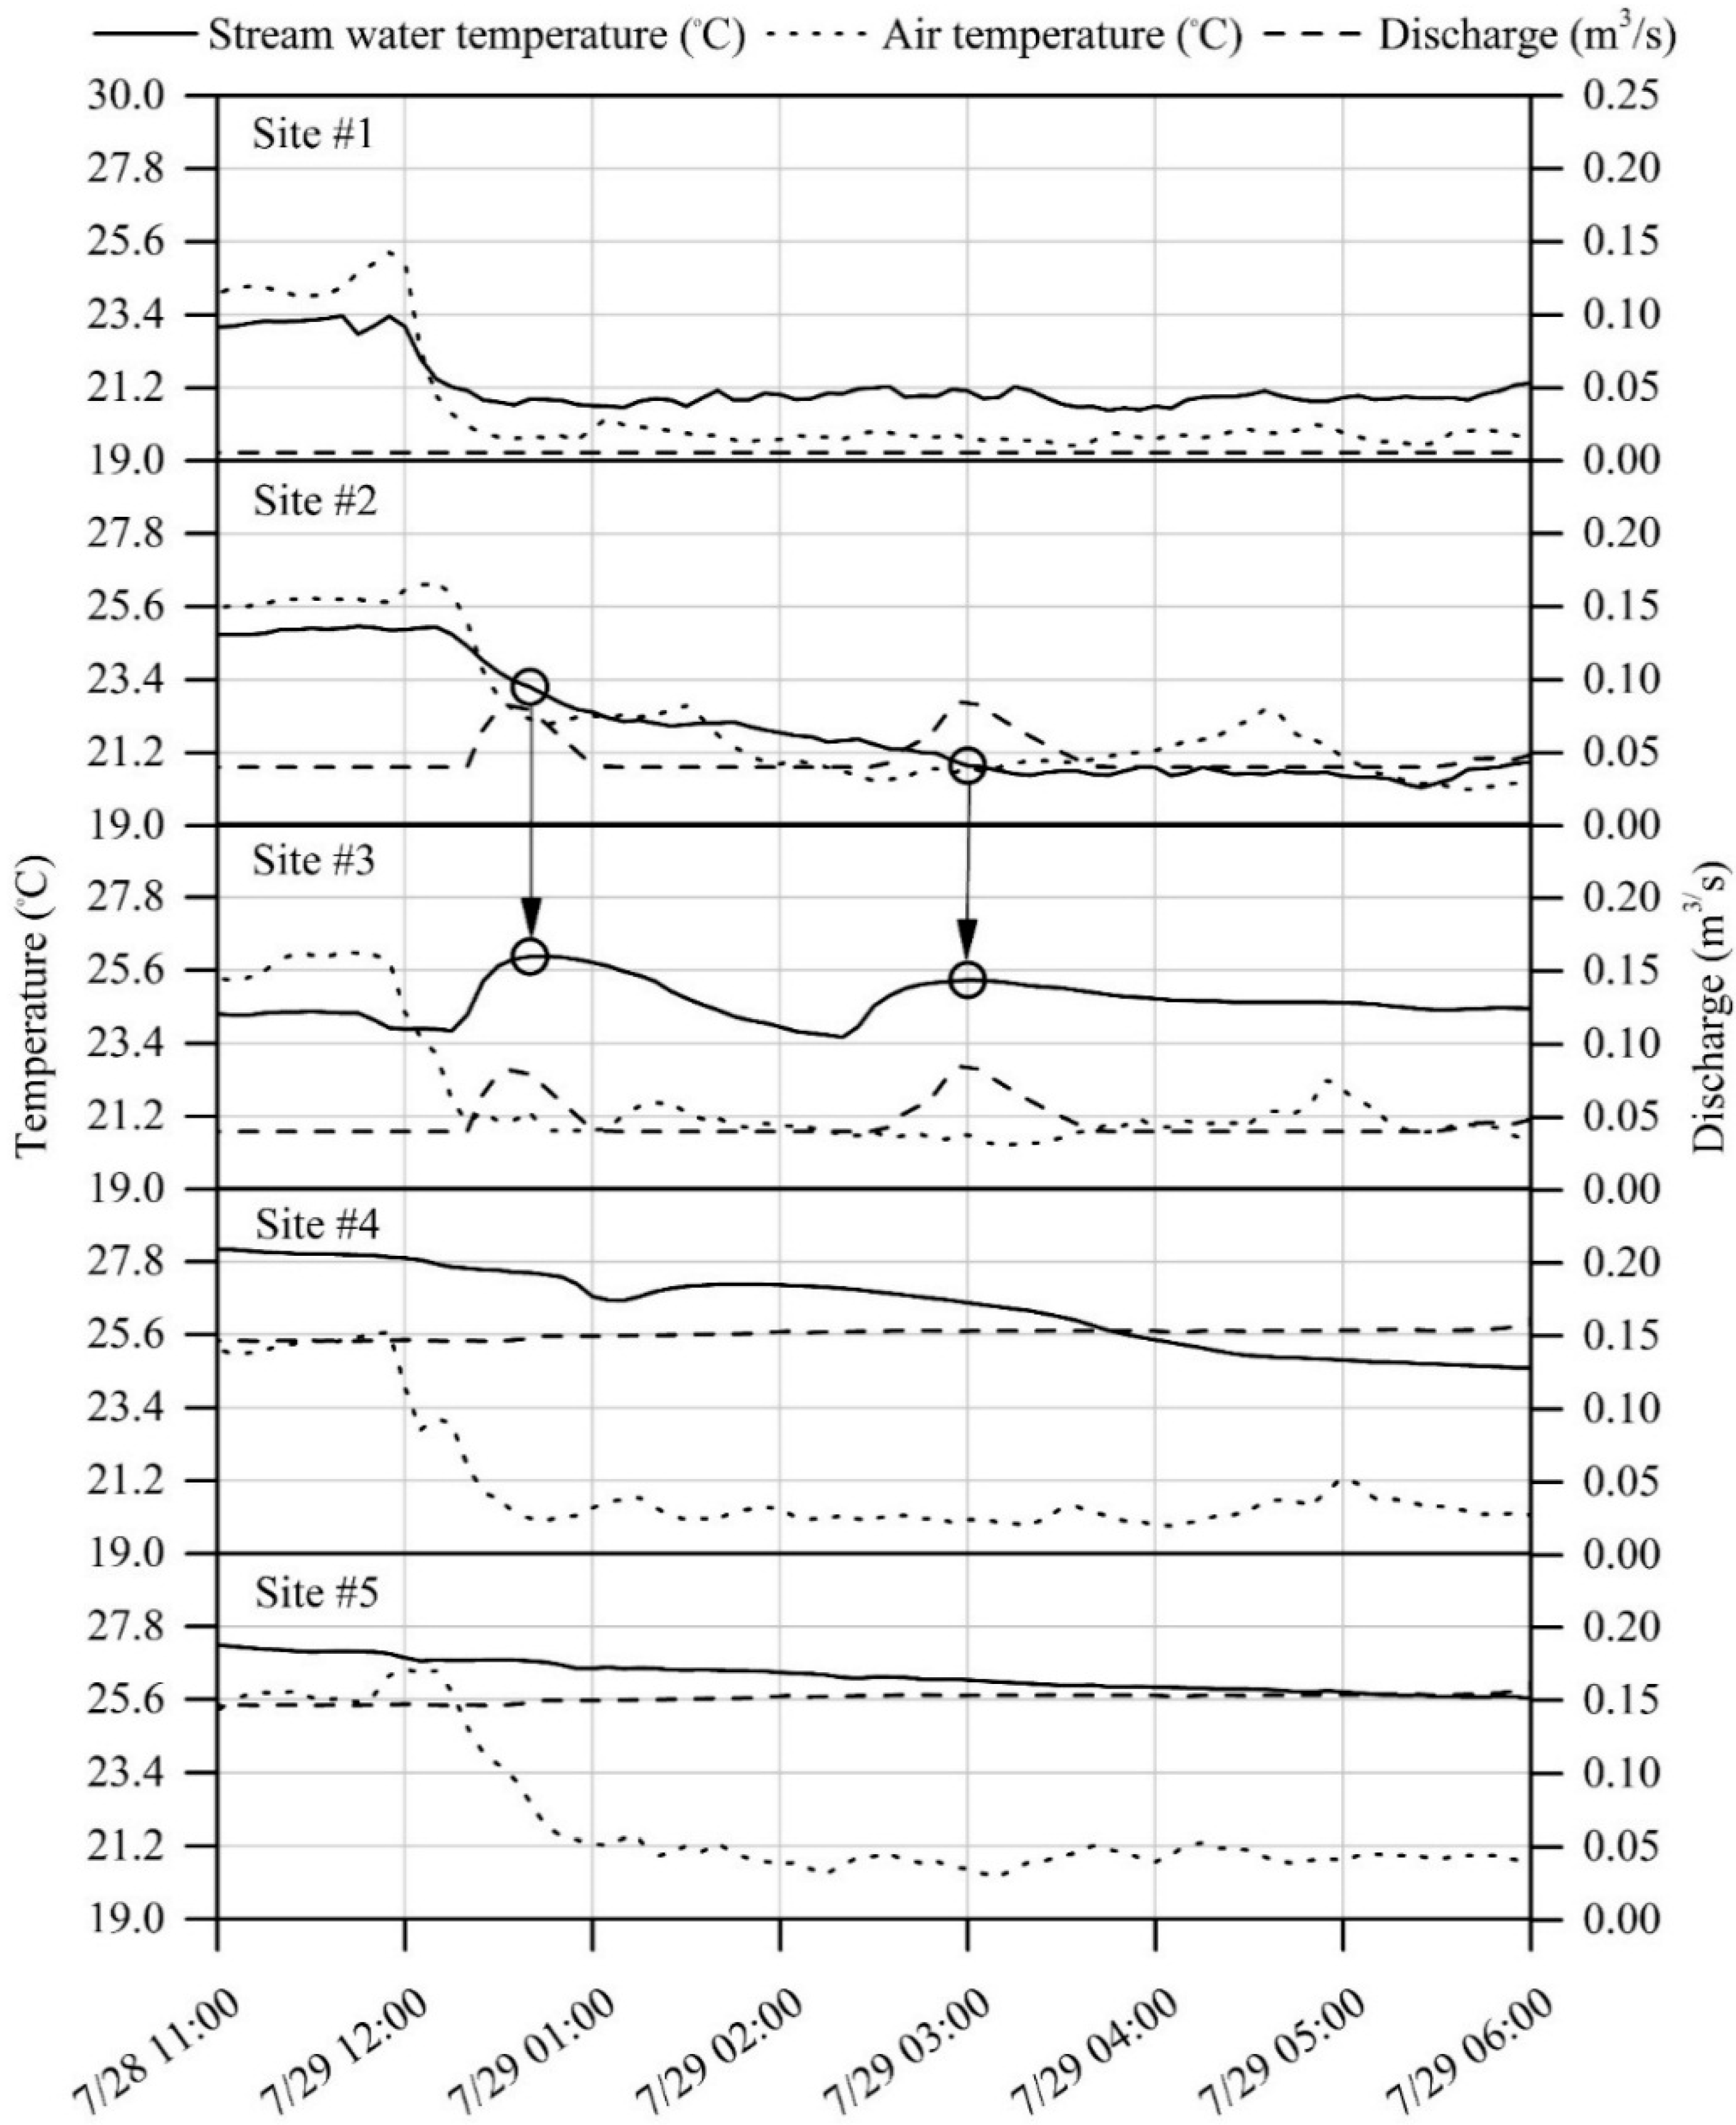
Small summer precipitation events transported Tw surges, even in the middle of the night (Figure 6). For example, at 23:00 p.m. on 28 July 2012 (drought summer) discharge was low in Hinkson Creek at site #3 (<0.1 m3/s). A precipitation event of approximately 6 mm transported surface heat from the urban sub-basin #3 into Hinkson Creek at approximately 00:15 a.m. of 29 July 2012. At that time, there were two Tw surges detected at site #3 with a mean Tw surge of approximately 1.5 °C. The surges did not persist downstream because of the rainfall event was small (less than 8 mm) and soils were under drought conditions that summer. The authors acknowledge that the sources of the Tw surges observed in Figure 6 could have been from unknown sources other than runoff from urban landscapes. For example, unknown point sources of thermal effluent may have been discharged into the stream nearby, or warm water pools may have been flushed following small rainfall runoff events. However, the authors submit that such contributions would have likely been negligible and much less pervasive with stream distance.
Figure 5.
Plume of heated stormwater sensed in Hinkson Creek after a summer thunderstorm during summer 2011. The black circles mark the peak Tw after the increase in discharge and the arrows track the event downstream from sites #3 through #5.
Figure 5.
Plume of heated stormwater sensed in Hinkson Creek after a summer thunderstorm during summer 2011. The black circles mark the peak Tw after the increase in discharge and the arrows track the event downstream from sites #3 through #5.
4.3. Streamflow Class Calculations
Streamflow class separation analysis of mean discharge and Tw data recorded at each gauging site supported observed urban land use impacts on mean Tw as discharge increased (Figure 2 and Figure 3). However, the independent and interacting natural and anthropogenic causes of the increases in Tw at sites #4 and #5 were difficult to decouple in the current work. While the correlation between discharge and Tw increased as flow class increased, the relationship between discharge and Tw alone was not significant at the 95% confidence interval (p > 0.07). The differences were attributed, at least in part, to natural processes including travel time, meteorology, stream shading and channel friction. Theoretically, Tw approaches equilibrium temperature as travel time increases with distance from the headwaters especially when the headwaters are groundwater dominated [35]. However, it is suggested that for the current investigation, stream temperature was more dependent on the temperature and volume of surface runoff than baseflow contributions as shown in Tw modeling results from previous research that investigated daily average stream temperature in Hinkson Creek [36]. For example, baseflow analysis showed baseflow indexes were low in the headwaters (0.17 at site #1) and increased with stream distance (0.27 near the watershed outlet). Increases in Tw as flow class increased were likely affected by urban land use considering the significant (p = 0.01) differences in mean Tw at urban sites relative to rural sites, and the sudden tractable increases in precipitation and Tw that were only sensed at urban gauging sites. For example, the Tw surges observed in Figure 5 were in >90% flow class. Anderson et al. [37] found that, in general, Tw increased with downstream distance due to both the effects of urbanization and equilibrium temperature in a case study in Boone, North Carolina. Other studies have shown urbanization can increase subsurface temperature [13], which may impact Tw regimes through increased advective heat flux at the stream-streambed interface [14]. While the investigation of UHI effect on Tw via increased subsurface temperature was beyond the scope of the current work, observed UHI in the study watershed [11] likely promoted elevated dew point temperatures greater than Tw preceding large rainfall events. This is presumably the driving cause of elevated Tw in the >90% streamflow classes considering Herb et al. [16] showed thermal impact increases when dew point temperature exceeds Tw preceding large rainfall events. Ultimately, a complete decoupling of the natural and anthropogenic impacts was not possible in the current study due to the fact that the effects of downstream drainage network on Tw could not be separated using the present information.
4.4. Study Implications
Hinkson Creek Watershed is representative of the Lower Missouri Moreau River Basin (LMMRB) in regard to hydrologic processes, water quality, climate, and land use making the study watershed a useful laboratory for watershed restoration efforts focused on controlling nonpoint source pollution in the region [23]. A nested scale experimental watershed study design was used to trace a diffuse pollutant (i.e., Tw surges) that has been shown in previous studies to impair aquatic ecosystem health [18]. This information is useful to land managers charged to conserve suitable thermal stream habitats in mixed-land-use urbanizing watersheds. Best management practices (BMPs) should be promoted that promote that redirect heated stormwater runoff from critical source areas (e.g., forested floodplains or wetlands) and thus mitigate thermal impacts to receiving water bodies [38].
Land managers charged to protect aquatic ecosystem health may wish to consider implementing management practices designed to cool heated stormwater in urban catchments because of the relationship between increased Tw and urban land use associated with impervious surfaces observed in this research and other similar studies [15,16,17,18,19]. The Tw surges observed in this research were fewer and of lesser magnitude and duration relative to studies by Nelson and Palmer [18] and Rice et al. [19] likely due to the relationship between Tw surge frequency and impervious surface coverage (ISC) in the catchment [18], and the relationship between ISC within a 25 m stream buffer and magnitude of and duration of Tw surges [19]. Thus, future projected increases in impervious surfaces in the watershed may lead to more frequent Tw surges in the HCW.
Figure 6.
Two stream water temperature surges sensed at site #3 in Hinkson Creek following a summer thunderstorm during summer 2012. The black circles mark the peak Tw following the increase in discharge at site #3 and the arrows track the event downstream from site #2 to site #3.
Figure 6.
Two stream water temperature surges sensed at site #3 in Hinkson Creek following a summer thunderstorm during summer 2012. The black circles mark the peak Tw following the increase in discharge at site #3 and the arrows track the event downstream from site #2 to site #3.
5. Conclusions
Stream water temperature (Tw) was investigated in a mixed-land-use urbanizing watershed of the central USA to better understand urban impervious impacts on receiving water temperatures. Three water years of Tw data were collected using a nested-scale experimental watershed study design approach. Drought conditions during 2012 provided a worst case scenario for Tw in a low-order urban stream. Stream temperature exceeded the 35 °C critical thermal maximum at an urban monitoring site for five total days with a maximum duration of 2.5 consecutive h during the summer of drought when maximum Ta was greater than 40.0 °C, and discharge was low (0.1 m3/s). A total of 29 sudden increases in Tw at urban gauging sites (Tw surges) were observed during summers 2011, 2012, and 2013 when receiving water flow exceeded 32.0 °C (thermal maximum Tw threshold). Plumes of heated stormwater resulted in increases in Tw by as much as 4 °C for up to five hours as the flood wave moved toward the watershed outlet.
Study results provide quantitative evidence of the effects of urban land use on the stream water temperature regime. An average of 10 summertime Tw surges was observed during the study. Results indicate that maximum Tw and Tw surges increased with increased impervious surface coverage. These findings are informative for improving management practices to reduce the temperature of stormwater runoff before it is discharged into nearby streams to mitigate sudden increases in Tw following precipitation events in urbanizing catchments and are applicable regionally and in other mixed-land-use urbanizing watersheds globally.
Acknowledgments
Funding was provided by the U.S. Environmental Protection Agency Region 7 through the Missouri Department of Natural Resources (P.N: G08-NPS-17) under Section 319 of the Clean Water Act, and the Missouri Department of Conservation. Results presented may not reflect the views of the sponsors and no official endorsement should be inferred. Collaborators include (but are not limited to) Boone County Public Works, City of Columbia, University of Missouri, and the U.S. Geological Survey. Special thanks are due to many Interdisciplinary Hydrology Laboratory scientists for field assistance and multiple reviewers whose constructive comments greatly improved the article.
Author Contributions
The authors contributed equally to this work.
Conflict of Interest
The authors declare no conflict of interest.
References
- Caissie, D. The thermal regime of rivers: A review. Freshw. Biol. 2006, 51, 1389–1406. [Google Scholar]
- Subehi, L.; Fukushima, T.; Onada, Y.; Mizugaki, S.; Gomi, K.; Kosugi, K.; Hiramatsu, S.; Kitahara, H.; Kuraji, K.; Terajima, T. Analysis of stream water temperature changes during rainfall events in forested watersheds. Liminology 2010, 11, 115–124. [Google Scholar] [CrossRef]
- Webb, B.; Hannah, D.; Moore, R.; Brown, L.; Nobilis, F. Recent advances in stream and river temperature research. Hydrol. Process. 2008, 22, 902–918. [Google Scholar] [CrossRef]
- Bishop, P.L.; Eighmy, T.T. Aquatic wastewater treatment using Elodea Nuttallii. Water Pollut. Control Fed. 1989, 65, 641–648. [Google Scholar]
- Beitinger, T.L.; Bennett, W.A.; McCauley, R.W. Temperature tolerances of North American freshwater fishes exposed to dynamic changes in temperature. Environ. Biol. Fish. 2000, 58, 237–275. [Google Scholar] [CrossRef]
- Anka-Lufford, L.; Bets, J.D.; Cooper, A.M.; Daly, A.L.; Soundariarajan, S.; Stingel, A.M.; Winschel, G.A. A Chemical and Anthropogenic Impact Study of Lake Lonely; Skidmore College: Saratoga Springs, NY, USA, 2007. [Google Scholar]
- Cox, B.A. A review of currently available in-stream water-quality models and their applicability for simulating dissolved oxygen in lowland rivers. Sci. Total Environ. 2003, 314–316, 335–377. [Google Scholar] [CrossRef]
- Ward, J.V. Thermal characteristics of running waters. Hydrobiologia 1985, 125, 31–46. [Google Scholar] [CrossRef]
- Gu, R.; McCutcheon, S.; Chen, C. Development of weather dependent flow requirements for river temperature control. Environ. Manag. 1999, 24, 529–540. [Google Scholar] [CrossRef]
- Sinokrot, B.A.; Gulliver, J.S. In-stream flow impact on river water temperatures. J. Hydrol. Res. 2000, 38, 339–349. [Google Scholar] [CrossRef]
- Hubbart, J.A.; Kellner, E.; Hooper, L.; Lupo, A.R.; Market, P.S.; Guinan, P.E.; Stephan, K.; Fox, N.I.; Svoma, B.M. Localized climate and surface energy flux alterations across an urban gradient in the central US. Energies 2014, 7, 1770–1791. [Google Scholar] [CrossRef]
- Paul, M.J.; Myer, J.L. Streams in the urban landscape. Annu. Rev. Ecol. Syst. 2001, 32, 333–365. [Google Scholar] [CrossRef]
- Menberg, K.; Blum, P.; Schaffietel, A.; Bayer, P. Long-term evolution of anthropogenic heat fluxes into a subsurface urban heat island. Environ. Sci. Technol. 2013, 47, 9747–9755. [Google Scholar] [CrossRef] [PubMed]
- Kurylyk, B.L.; MacQuarrie, K.T.B.; Caissie, D.; McKenzie, J.M. Shallow groundwater thermal sensitivity to climate change and land cover disturbances: Derivation of analytical expressions and implications for stream temperature modeling. Hydrol. Earth Syst. Sci. 2015, 19, 2469–2489. [Google Scholar] [CrossRef]
- Anderson, W.P.; Storniolo, R.E.; Rice, J.S. Bank thermal storage as a sink of temperature surges in urbanized streams. J. Hydrol. 2011, 409, 525–537. [Google Scholar] [CrossRef]
- Herb, W.R.; Janke, B.; Mohseni, O.; Stefan, H.G. Thermal pollution of streams by runoff from paved surfaces. Hydrol. Process. 2008, 22, 987–999. [Google Scholar] [CrossRef]
- Hester, E.T.; Bauman, K.S. Stream and Retention pond thermal response to heated summer runoff from urban impervious surfaces. J. Am. Water Resour. Assoc. 2012, 49, 328–342. [Google Scholar] [CrossRef]
- Nelson, K.C.; Palmer, M.A. Stream water temperature surges under urbanization and climate change: Data, models, and responses. J. Am. Water Resour. Assoc. 2007, 43, 440–452. [Google Scholar] [CrossRef]
- Rice, J.S.; Anderson, W.P.; Thaxton, C.S. Urbanization influences on stream temperature behavior within low-discharge headwater streams. Hydrol. Res. Lett. 2011, 5, 27–31. [Google Scholar] [CrossRef]
- Chen, Y.D.; Carsel, R.F.; McCutcheon, S.C.; Nutter, W.L. Stream temperature simulation of forested riparian areas: I. Watershed-scale model development. J. Environ. Eng. 1998, 124, 304–315. [Google Scholar]
- Sun, N.; Yearsley, J.; Voisin, N.; Lettenmaier, D.P. A spatially distributed model for the assessment of land use impacts on stream temperature in small urban watersheds. Hydrol. Process. 2015, 29, 2331–2345. [Google Scholar] [CrossRef]
- Van Buren, M.A.; Watt, W.E.; Marsalek, J.; Anderson, B.C. Thermal enhancement of stormwater runoff by paved surfaces. Water Resour. 2000, 34, 1359–1371. [Google Scholar] [CrossRef]
- Hubbart, J.A.; Holmes, J.; Bowman, G. Integrating science based decision making and TMDL allocations in urbanizing watersheds. Watershed Sci. Bull. 2010, 1, 19–24. [Google Scholar]
- Missouri Department of Natrual Resources (MDNR). Total Maximum Daily Load (TMDL) for Hinkson Creek, Boone County; MDNR: Jefferson City, MO, USA, 2011. [Google Scholar]
- United States Census Bureau (USCB). US Census Bureau: State and County Quick Facts. 2014. Available online: http://quickfacts.census.gov/qfd/states/29000.html (accessed on 22 October 2015). [Google Scholar]
- Zhou, B.; He, H.S.; Nigh, T.A.; Schulz, J.H. Mapping and analyzing change of impervious surface for two decades using multitemporal Landsat imagery in Missouri. Int. J. Appl. Earth Observ. Geoinf. 2012, 18, 195–206. [Google Scholar] [CrossRef]
- Hooper, L.W. A Stream Physical Habitat Assessment in an Urbanizing Watershed of the Central USA. Master’s Thesis, University of Missouri, Columbia, MO, USA, 2015. [Google Scholar]
- Hubbart, J.A.; Zell, C. Considering streamflow trend analyses uncertainty in urbanizing watersheds: A baseflow case study in the central United States. Earth Interact. 2013, 17, 1–28. [Google Scholar] [CrossRef]
- Hubbart, J.A.; Muzika, R.M.; Huang, D.; Robinson, A. Improving Quantitative Understanding of Bottomland Hardwood Forest Influence on Soil Water Consumption in an Urban Floodplain. Watershed Sci. Bull. 2011, 3, 34–43. [Google Scholar]
- Hubbart, J.A.; Kellner, E.; Freeman, G. A case study considering the comparability of mass and volumetric suspended sediment data. Environ. Earth Sci. 2013, 71, 4051–4060. [Google Scholar] [CrossRef]
- Dottori, F.; Martina, M.L.V.; Todini, E. A dynamic rating curve approach to indirect discharge measurement. Hydrol. Earth Syst. Sci. 2009, 13, 847–863. [Google Scholar] [CrossRef]
- Dinan, K.F. Application of the Stream Network Temperature Model (SNTEMP) to the Central Platte River, Nebraska; Professional Paper; Department of Fishery and Wildlife Biology, Colorado State University: Fort Collins, CO, USA, 1992. [Google Scholar]
- Webb, B.W.; Clack, P.D.; Walling, D.E. Water—Air temperature relationships in a Devon River system and the role of flow. Hydrol. Process. 2003, 17, 3069–3084. [Google Scholar] [CrossRef]
- National Oceanic and Atmospheric Administration (NOAA) National Climatic Data Center. State of the Climate: Drought for Annual 2012. Available online: http://www.ncdc.noaa.gov/sotc/drought/2012/13 (accessed on 10 July 2014).
- Bogan, T.; Mohseni, O.; Stefan, H.G. Stream temperature-equilibrium temperature relationship. Water Resour. Res. 2003. [Google Scholar] [CrossRef]
- Zeiger, S.J.; Hubbart, J.A.; Anderson, S.; Stambaugh, M. Quantifying and modeling urban stream temperature: A central US watershed study. Hydrol. Process. 2015. [Google Scholar] [CrossRef]
- Anderson, W.P.; Anderson, J.L.; Thaxton, C.S.; Babyak, C.M. Changes in stream temperature in response to restoration of groundwater discharge and solar heating in a culverted, urban stream. J. Hydrol. 2010, 393, 309–320. [Google Scholar] [CrossRef]
- Davis, AP. Green engineering principles promote low-impact development. Environ. Sci. Technol. 2005, 39, 338A–344A. [Google Scholar] [CrossRef] [PubMed]
© 2015 by the authors; licensee MDPI, Basel, Switzerland. This article is an open access article distributed under the terms and conditions of the Creative Commons Attribution license (http://creativecommons.org/licenses/by/4.0/).
Share and Cite
MDPI and ACS Style
Zeiger, S.J.; Hubbart, J.A. Urban Stormwater Temperature Surges: A Central US Watershed Study. Hydrology 2015, 2, 193-209. https://doi.org/10.3390/hydrology2040193
AMA Style
Zeiger SJ, Hubbart JA. Urban Stormwater Temperature Surges: A Central US Watershed Study. Hydrology. 2015; 2(4):193-209. https://doi.org/10.3390/hydrology2040193
Chicago/Turabian StyleZeiger, Sean J., and Jason A. Hubbart. 2015. "Urban Stormwater Temperature Surges: A Central US Watershed Study" Hydrology 2, no. 4: 193-209. https://doi.org/10.3390/hydrology2040193