
Design and Investigation of a 3D-Printed Micro-Fluidized Bed


1
School of Engineering, Newcastle University, Newcastle Upon Tyne NE1 7RU, UK
2
Newcastle Research & Innovation Institute Singapore (NewRIIS), 80 Jurong East Street 21, #05-04, Singapore 609607, Singapore
3
Singapore Institute of Food and Biotechnology Innovation (SIFBI), Agency for Science, Technology and Research (A*STAR), Singapore 138673, Singapore
*
Author to whom correspondence should be addressed.
ChemEngineering 2021, 5(3), 62; https://doi.org/10.3390/chemengineering5030062
Submission received: 27 July 2021
/
Revised: 3 September 2021
/
Accepted: 8 September 2021
/
Published: 13 September 2021
(This article belongs to the Special Issue Optimization of Operations and Processes in Chemical Engineering Involving Fluidization)
Abstract
:Micro-fluidized bed has aroused much attention due to its low-cost, intensified-process and fast-screening properties. In this paper, a micro-fluidized bed (15 × 15 mm in cross-section) was designed and fabricated with the use of the stereolithography printing technique, for the investigation of bubbles’ hydrodynamics and comparison of the solids (3D-printed particles VS fungal pellets) fluidization characteristics. In a liquid–gas system, bubble flow regime started from mono-dispersed homogeneous regime, followed by poly-dispersed homogeneous regime, transition bubble regime and heterogeneous bubble regime with increasing gas flowrates from 3.7 mL/min to 32.7 mL/min. The impacts from operating parameters such as gas flowrate, superficial liquid velocity and gas sparger size on bubble size, velocity and volume fraction have been summarized. In liquid–solid fluidization, different solid fluidization regimes for both particles bed and pellets bed were identified. From the bed expansion results, much higher Umf of 7.8 mm/s from pellets fluidization was observed compared that of 2.3 mm/s in particles fluidization, because the hyphal structures of fungal pellets increased surface friction but also tended to agglomerate. The similar R–Z exponent n (5.7 and 5.5 for pellets and particles, respectively) between pellets and particles was explained by the same solid diameter, but much higher Ut of 436 µm/s in particles bed than that of 196 µm/s in pellets bed is a consequence of the higher density of solid particles. This paper gives insights on the development of MFB and its potential in solid processing.
1. Introduction
Fluidized beds use the liquid and/or gas flows instead of moving parts to improve mixing, thus exhibiting the advantages of sufficient multiphase contact but less energy consumption and mechanical stress [1,2,3]. In recent years, micro-fluidized bed (MFB) has attracted more attention due to its fast screening and process-intensifying properties [4,5]. Therefore, MFB has been applied to different areas such as solid processing [6,7], chemical conversions [8,9,10], CO2 capture [11], wastewater treatment [12,13], bioproduction [14,15], etc.
With more novel designs and applications of MFB being reported, the hydraulic diameter of the bed column used as the defining principle is becoming broader and fuzzier. Initially, Potic et al. [16] proposed the concept of MFB with an inner diameter (ID) of 1 mm. The asserted boundary for MFB witnessed a gradual increase from the submillimeter scale [17,18] to millimeter scale [19,20] and the current centimeter scale [21]. For instance, a fluidized bed reaction analyzer with a 2 cm ID developed by Xu and his colleagues for their thermochemical studies was regarded as micro-scale by them due to the distinguished reactor flow characteristics [22,23]. Furthermore, Gao et al. [24] called a fluidized bed reactor with 7.5 cm ID as MFB when using it for pyrolysis of three Iranian waste oils. This might be the largest fluidized bed so far which was specifically defined as MFB by the authors. Recently, Zhang et al. [4] defined the term of MFB by the reactor residence time characteristics principle to be the systems with sub-50 mm ID as well as the bed-to-particle diameter ratio (dB/dP) within 100. In summary, the inevitable wall effects, residence time characteristics and surface force unique to the micro-fluidization over the classical larger fluidization systems would define the MFB, meaning that such a fuzzy boundary can include most fluidized beds that possess up to centimeter-scale bed column to the range of MFB [20,25,26].
To date, varieties of fabrication methods and materials have been reported for the construction of MFB. The most widely used approach is the quartz/glass capillaries with transparent walls, which allow for the visualization analysis [18,27,28]. Similarly, MFB made by micro-milling Perspex can meet the demand of clear visualization and improve the mechanical strength of the bed column [20,29]. To make bed ID within micrometer scale, soft lithography techniques with advantages of low cost and rapid manufacturing have been proposed [17,30]. However, for the experiments involving thermochemical reactions and strong corrosivity, the materials such as Perspex or polydimethylsiloxane (PDMS) may not endure the extreme conditions, giving rise to the development of fluidized bed made of stainless steel [31]. In recent years, the fabrication of MFB via 3D-printing techniques has become a hot topic, as the additive manufacturing produces highly complex and/or bespoke geometries in a much cheaper and faster way compared to the traditional workshops [32]. For instance, McDonough et al. [33] used the stereolithography printing technique to fabricate a toroidal fluidized bed (50 mm ID), allowing to minimize the particle entrainment by the swirling fluidization, and do Nascimento et al. [19] developed a liquid–solid micro-circulating fluidized bed of 2 × 2 mm2 cross-sections by using digital light processing (Miicraft+ printer, Young Optics Europe GmbH, Jena, Germany) and stereolithography (Form2 printer, Formlabs GmbH, Berlin, Germany), which successfully reduced the circulating fluidized bed size to the micro-bed dimensions.
Nowadays, one of the main applications of MFB is for bioprocessing and bioproduction such as wastewater treatment, cell cultivation, fungal fermentation based on the liquid–solid and gas–liquid–solid systems [4]. The multiphase fluidized bed bioreactors present excellent gas/liquid–solid mixing and lower mass transfer limitation compared to the conventional packed bed reactor [34]. More importantly, the liquid–solid/gas–liquid–solid systems can mitigate the cell damage/death due to mechanical stress which is caused by the agitated impellers in stirred-tank bioreactor. To allow the fluidization of tiny microbials, the cell immobilization methods such as attachment and encapsulation are used to make the microorganisms to be fluidizable with the carriers by the upward liquid and/or gas flow [35]. In liquid–solid fluidized bed systems, for instance, Chowdhury et al. [36] used a liquid–solid circulating fluidized-bed (LSCFB) bioreactor to identify that the overall removal rates for organic (chemical oxygen demand, COD), nitrogen (N), and phosphorous (P) could be up to of 91%, 78% and 85%, respectively, with the fluidization of the Lava rock particles incorporated with biomass. Kuyukina et al. [37] studied the petroleum-contaminated water treatment with the use of MFB (14 mm ID, 120 mm length) containing different immobilized biocatalysts on the hydrophobized carriers such as sawdust, poly (vinyl alcohol) cryogel (cryoPVA) and poly (acrylamide) cryogel (cryoPAAG), which reported to remove 70%–100% of n-alkanes (C10–C19) and 66%–70% of 2–3-ring PAHs from wastewater. In fact, the gas–liquid–solid systems are more widely used in bioproduction, as the cells require the oxygen to grow and the anaerobic microbial can produce the biogas (i.e., CO2) in the form of bubbles. For instance, Wu et al. [38] combined the immobilized anaerobic sludge and a MFB bioreactor (27 mm ID and a height of 120 cm) to produce biohydrogen and bioethanol production, the formed gas–liquid–solid MFB system reached a maximum H2 production rate of 59 mmol /h/L with the sugar substrate of sucrose at the liquid velocity of 0.91 cm/s and a largest H2 yield of 1.04 mol mol hexose−1 with glucose at the liquid velocity of 0.55 cm/s. In addition, by using the expanded clay (2.8–3.35 mm) as a support material for biomass immobilization, Cavalcante de Amorim et al. [39] demonstrated that the hydrogen content increased significantly as the hydraulic retention time (HRT) decreased in their three-phase MFB system fed with glucose-based synthetic wastewater. However, compared to the immobilized cells/enzymes, the fungal pellets could be directly fluidized by the liquid/gas flow without the procedures of immobilization in a biocarrier, but the gradually increased size as well the morphology largely impact pellet fluidization. The change of pellet size means a fixed flowrate could not maintain a good fluidization, which could result in pellet sedimentation or elutriation when the flowrate was too low or too high. Therefore, it is important to adjust the gas/liquid flowrate to maintain a good fluidization state.
Our previous study has investigated the fungal pellets fluidization in MFB, indicating the unique bed expansion properties and the effects of bubble flows on pellets fluidization [40]. However, the bubbles’ characteristics (size, velocity, etc.) in our MFB system remain unclear. In addition, the unique solid properties of pellets can be further explored by comparing its fluidization performance with conventional solids with relative smooth surface. Therefore, in the present study, we used the same MFB for a systematic investigation of the bubble characteristics in gas–liquid fluidization system under different gas sparger sizes, liquid/gas flowrates are presented. In addition, 1.5 g of mature fungal pellets and 3D-printed particles which have the same diameter (2 mm) but different solid density, solidity and surface structure are used for liquid–solid fluidization study, which highlighted the significance of solid properties on solid expansion and fluidization quality, thus providing foundations for potential application of MFB involving unique solids (such as pellets, surface functionalized particles, immobilized cells, etc.)
2. Materials and Methods
2.1. Fluidized Bed Design and Fabrication
The MFB comprises two main sections: the lower section containing liquid/gas inlets and distribution plate (Figure 1a,b) and the upper bed column section (Figure 1c). In general, the lower section is a square manifold (15 × 15 mm in cross section, 5 mm in height) with an 8 × 8 hole array (size of hole: 1 × 1 mm), which is used for the liquid distributor. Meanwhile, the single gas sparger is a hole drilled at the center of the distributor, to accommodate a tight-fitting glass capillary tubing (CM Scientific, Bradford, UK) with ~3 mm OD and the different micrometer-scale IDs (50, 100 and 150 µm). The different gas sparger ID can alter the bubble hydrodynamics such as bubble size and velocity. The bed column, fabricated using a 3D printer (Form2 SLA printer, Formlabs, Somerville, MA, USA), has a rectangular geometry with a 150 mm column height and a 15 × 15 mm square cross section. The Form2 used a 405 nm UV laser (140 lm spot size, 250 mW) to cure a translucent methyl acrylate based proprietary resin (FLGPCL02) comprising methyl acrylate monomer (55–75% w/w), methyl acrylate oligomers (35–40% w/w) and photoinitiator additives (10–15% w/w), which ensures the solidity of the parts and prevents gas/liquid leakage [41]. The upper and lower sections are assembled using the flat flange plates, which featured a circular groove (as can be seen in Figure 1a,c) fitted with an O-ring rubber gasket (to prevent liquid/gas leakage) as well as 4 holes (for bolts), as shown in Figure 1d.
2.2. Materials and Procedures
In the gas–liquid system experiments, the glass capillaries whose IDs ranged from 50 to 150 µm were used as gas sparger. The gas phase was air, and the liquid phase was air and ultrapure water. In liquid–solid fluidizations, 1.5 g of the 3D-printed particles (the same methyl acrylate based proprietary resin used for MFB fabrication) and mature fungal pellets (from the Basidiomycete Nidula niveo-tomentosa) were used as the solid phase. The images showing the different morphology of 3D-printed particles and fungal pellets (photographed by using a Scan 1200, Interscience, Saint-Nom-la-Bretèche, France) were presented in Figure 2. Detailed properties of the solids are listed in Table 1.
The experimental setup used for both the gas–liquid and liquid–solid fluidizations is illustrated in Figure 3. In gas–liquid fluidization, compressed air was supplied and then regulated by the pressure regulator (R07-200-RNEG, IMI Norgren, Birmingham, UK) to reach a desired flowrate using the gas rotameter (FL-3635G, Omega Engineering, Manchester, UK), while the liquid phase of ultrapure water was pumped through the liquid inlet tubing and reached the fluidization column by a peristaltic pump (Watson Marlow 530U, Wilmington, MA, USA) and supplied to the fluidization column using soft tubing (FSA121869, Sartorius, Göttingen, Germany). For the liquid flow, the investigated flow rate ranged from 0 to 34.04 mm/s. After the liquid flow was introduced into the MFB with fixed velocity, the gas flowrate was gradually increased until the coalesced bubble flow occurred, thus ensuring the accurate visualization of bubbles instead of slug flow [18]. For the liquid–solid fluidization study, the gas phase was switched off, but the solid phase was inoculated in the bed. The solid expansion was then achieved by the upward liquid flows. Both the bubbles movements and solid fluidization were recorded by the Basler acA640-750uc camera (100 fps for gas–liquid fluidization system, 20 fps for liquid–solid fluidization, exposure time in 0.003 s) combined with a fixed focal length Lens (12 mm/F1.8 Lens, Edmund Optics Inc., Barrington, NJ, USA), and was monitored using the Pylon Viewer software for off-line analysis [40].
2.3. Bubbles’ Characterization
2.3.1. Bubble Size
The bubble size measurement is based on the bubbles in the image sequences captured by high-speed camera. In the calculation of average bubble diameter, the Sauter mean diameter equation was applied to give more weights to the larger bubbles in the multi-bubble flows [18,42]. The equation is given as:
where db, ni and di are the bubbles’ Sauter mean diameter, number of bubbles and individual bubble diameter, respectively.
2.3.2. Bubbles’ Velocity
The bubbles rising paths were usually an upward spiral rather than straight-lines rises because of the physicochemical properties of liquid phase (i.e., viscosity, surface tension, density, etc.) [43,44]. Therefore, the bubble velocity Ub in the experiments refer to the bubble rising velocities (or vertical component of velocities). To characterize Ub, the function of Manual Tracking Plugin in Fiji ImageJ is applied [45]. The operational principle for a bubble velocity measurement is to record the bubble’s displacement in Y direction (from the bed bottom to the top liquid/gas interface) and the corresponding time for the bubble’s movement. Here, the Y-displacement is the height of fluidized bed, while the time can be obtained based on the number of frames for the bubble to move from the bottle to top, as the high-speed camera takes images at the speed of 10 ms/frame (100 fps).
2.3.3. Gas Volume Fraction
The gas volume fraction, ƐG, is a dimensionless quantity that is defined as the ratio of gas volume to the volume of the column [46]. The measurement of ƐG is an effective method to predict the gas supply in a reactor. It is obvious that the bubble size and velocity would vary with the changes of liquid velocity, gas velocity and gas sparger diameter, leading to the variation of ƐG. This part of experiments is to investigate gas volume fraction under the parameters of gas/liquid velocity, gas orifice size. Gas volume fraction ƐG is calculated though the equation below:
where Vb is the volume of each bubble, VB is the volume of bed column. The sum of bubble volume in each frame was obtained by the total volume of the bubbles in the column. The column volume is a fixed value of 33.75 mL with the bed geometry of 15 × 15 mm in cross-section and 150 mm in height.
2.4. Bed Voidage Characterization
The initial bed voidage Ɛ0 is a key parameter which impacts the fluidization performance. The calculation of Ɛ0 for printed particles was based on the typical equation [26]:
where H0, A, m and ρS is the initial bed height, bed cross-sectional area, solid mass and density, respectively, while Ɛ0 for pellets bed would be complex, because the volume of submerged pellets was 1.4 times bigger than the filtered volume. Thus, a revised equation for calculating Ɛ0 for fungal pellets is listed below [40]:
3. Results and Discussion
3.1. Gas–Liquid System
3.1.1. Bubble Flow Regimes
The representative images showing the gradual transitions of bubble flow regimes are presented in Figure 4 for the 100 µm gas sparger system with no liquid flow. The operating parameters of different operation modes, design parameters and working fluids of the fluidized bed system would determine the gas flow regimes. Among these parameters, the bubble flow regimes are highly dependent on the bed column size (dB), gas sparger size (dG) and the gas flowrate (QG). For instance, Li et al. [18] identified three distinctive flow regimes including the dispersed bubble flow, the coalesced bubble flow and the slug flow in three-phase MFB of 0.8 mm ID with the increase of gas flowrate. The formation of slug flow in their study was mainly due to the narrow column, whose cross section could be fully occupied by the coalesced bubbles to form the gas slugs. However, no slug flow was observed in our study, as the bed column size of 15 mm in our MFB was sufficient to contain the multiple bubbles. In the relatively larger-diameter column, Besagni et al. [47] classified the bubble flow regimes into homogenous bubble regime (including mono-dispersed homogeneous and poly-dispersed homogeneous), transition bubble regime and heterogeneous bubble regime, which well described the regimes of bubble flows observed in the experiments of this study.
Here, the bubble flow regimes started from mono-dispersed homogeneous flow at low gas flowrate (Figure 4a) and turned into poly-dispersed homogeneous regime (Figure 4b–d) with the increase of gas flowrate. Regardless of whether it is mono-dispersed or poly-dispersed, the homogeneous regime means that discrete bubbles are uniformly distributed without coalescence [48]. In addition, the bubble density as well as bubble size in homogeneous bubble regime increased linearly with gas flowrate, which are discussed in the later section. However, the continual increase of gas flowrate facilitated the emergence of coalesced bubbles, which remained discrete with uniform bubble size distribution (Figure 4e). This discrete coalesced bubble flow is regarded as transition bubble regime. At high gas flowrate, larger bubbles with wider size distribution are encountered but the distance between individual bubbles decreased [49]. More bubbles coalesced as they ascended to form the heterogeneous bubble regime, in which the coalesced bubbles were interspersed between the small ones [50], as shown in Figure 4f. Apart from the gas flowrates, the gas orifices sizes can also influence the bubble flow regimes. In general, the smaller sparger size (i.e., 50 µm) needs a lower gas flowrate than 100 and 150 µm sparger to reach the transition point from mono-dispersed homogeneous flow to poly-dispersed homogeneous regime and coalesced flow because the single bubble flow tended to be split into multi bubbles by the smaller orifice, forming the mono-dispersed homogeneous flow, further poly-dispersed homogeneous regime and final coalesced flow. In this paper, the investigated bubble flow regimes starting from mono-dispersed flow to coalesced flow ensure the individual bubbles could be clearly distinguished by the two-dimensional measurement of high-speed camera due to small intrinsic dimension of the MFB; therefore, the optical disturbance is not an issue [51]. Although three-dimensional measurement of the local bubbles’ properties by multiple probes might be more accurate, the probes are reported to cause the destruction of the rising bubbles instead of a precise determination of the local state of fluidization [52].
3.1.2. Bubbles’ Size
Bubbles’ size distributions (from dispersed bubble flows to coalesced bubble flows) under the parameters of gas sparger sizes, gas flowrates and liquid velocities were characterized (Figure 5). Under the certain ranges of gas and liquid flowrates, bubble size distributions were 1.5–2.3 mm, 1.8–2.8 mm and 2.3–3.8 mm when gas orifice was 50, 100 and 150 µm, respectively. The results indicated that sparger size was a predominant factor to determine db, as larger gas orifices promote bigger bubbles’ expansion and formation before they are detached from the gas nozzle [53]. Alternatively, it is noted that db increased with increasing gas flowrate, which was explained by the high gas flowrate for introducing more gas in liquid column at the certain time to enhance the formation and expansion of bubbles. The same conclusions that the mean bubble diameter increased with gas orifice size and superficial gas velocity (similar to the gas flowrate investigated in this paper) were reported and correlated by Akita and Yoshida [54]. They also pointed out that mean bubble diameter decreased with increasing column diameter for a given superficial gas velocity, which was not confirmed in this paper but could be further explored using our bubble column system in the future.
In contrast, db decreased with the increase of liquid velocity, as the co-current liquid flow accelerated bubbles detachment, thus shortening the time for bubble expansion. However, the influence from liquid velocity on bubble size was relatively insignificant, which could be reflected from the small descent slopes of the curves in Figure 5. Therefore, this section not only confirmed that the bubble size is primarily enhanced by the orifice diameter and gas flowrate [55] but also revealed that the co-current liquid flow accelerates bubble detachment to inhibit bubble growth.
3.1.3. Bubbles’ Velocity
For the range of gas and liquid flowrates studied, the values of Ub were determined to range from 1.46 to1.86 m/s, 1.86 to 2.30 m/s and 1.91 to 2.36 m/s when gas orifice size was 50, 100 and 150 µm, respectively (Figure 5). The increased bubble velocities with increasing gas orifices size indicated that micro-channels of the submerged orifice inhibited the bubble rising velocities. The kinetic energy of gas was regarded to be the same at a given gas flowrate, but the different orifice size resulted in the energy consumption due to pressure drop when the gas passing through the gas sparger tubing was varied [56]. The smaller orifice required a higher pressure drop and consumed more kinetic energy, thus leading to the lower bubbling velocity. In addition, the bubble velocity was observed to increase with the increase of gas flowrate, which was consistent with the previous studies [57,58]. Furthermore, it is obvious that the upward liquid flows can promote bubble rising velocity because of the co-current flows. However, this promotion from liquid flow was not drastic when the bubble regime changed from the homogenous bubble regime to the heterogeneous bubble regime at a high gas flowrate, indicating the importance of bubble regime transitions. Finally, the relative larger error bars with the fluctuated curves in Figure 6 indicated the rise velocity of bubbles could be also affected by other factors besides the investigated operating parameters of gas orifice size, gas flowrates and liquid velocity. These unexpected factors could be the following:
- (1)
- The proximity and size of neighboring bubbles influenced the individual rising bubbles [59].
- (2)
- During the flow regime transition from homogenous bubble regime to heterogeneous bubble regime, bubbles tended to coalesce which impacted each other’s rise velocity [60].
- (3)
- The variations of bubbles’ velocity were observed even for single bubbles of the one size rising in an infinite medium [61].
Here, in our experiments, the high-speed camera with 100 fps speed could precisely capture the corresponding bubble and its rapid variation, but it is still quite difficult to detect every velocity variation of individual bubble’s movement from the bottom of bed column to the top liquid/gas interface, compared to the previous study, which used two probes with one of them mounted above others so that the rise velocity of the bubble was measured by the vertical distance of two probes divided by the pulse separation time [62,63]. However, it is difficult to identify the specific bubbles due to the splitting or coalescence of bubbles between two probes [51,64]. Hence, our experiments with the use of high-speed camera can improve the accuracy of bubbles measurement.
3.1.4. Gas Volume Fraction
Bubbles’ volume fraction ƐG is the ratio of total bubbles volume to the bed volume, where the total bubbles volume is not only related to the average bubble size but also the number of bubbles. The characterization of ƐG under the effects of different gas flowrate, liquid velocity and gas orifice size are illustrated in Figure 7. It is noticed that ƐG increased significantly with the increase of gas flowrate, as high gas flowrate meant more gas pumped into the chamber per unit time to produce more bubbles. This observation is consistent with Zenit et al. [65], who reported a positive correlation between superficial gas velocity and mean gas volume fraction measured by an impedance probe. However, ƐG was observed to significantly increase when the high gas flowrate turned the homogenous flow regime into the heterogeneous regime (e.g., ƐG significantly increased when gas flowrate increased from 9.9 mL/min to 1.5 mL/min in Figure 7a), where coalesced bubbles largely increased the total bubbles volume. The big error bars in heterogeneous bubble flow regimes suggests the existence of numbers of dispersed bubbles. On the other hand, the relatively horizontal curves of ƐG with the increase of liquid velocity indicated that the co-current liquid flow had no impact on ƐG, although its effects on bubble size and velocity have been confirmed. Finally, at a fixed gas and liquid flowrate, ƐG was observed to increase with increasing gas sparger size. A larger gas sparger can allow for the growth of bubble size, thus contributing to the higher ƐG. For instance, in the homogeneous flow regimes with 9.9 mL/min of gas flowrate and no liquid flow, ƐG reached 0.20%, 0.31% and 0.33% when gas sparger size was 50, 100 and 150 µm, respectively. Besides, the higher ƐG from the larger gas spargers were also witnessed in heterogeneous flow regime, as ƐG in conditions of 100 and 150 µm gas sparger was 0.53%–0.57% and 0.71%–0.73% respectively, with the gas flowrate of 32.7 mL/min (Figure 7b,c). Therefore, this section has concluded that ƐG was increased with increasing the gas flowrate and the gas sparger size, but independent of liquid flows.
3.2. Liquid–Solid Fluidizations
To compare the effects of particles on liquid–solid fluidization, 1.5 g of 3D-printed particles and fungal pellets are fluidized by ultrapure water in the liquid–solid MFB system. Both liquid–solid fluidization regimes and the particulate solid bed expansion properties have been investigated and compared.
3.2.1. Flow Regimes
The snapshots of 1.5 g of particles fluidization by ultrapure water were presented in Figure 8. With the increase of superficial liquid velocity, different flow regimes including packed bed regime, creeping fluidization, particulate fluidization and parvoids fluidization were observed in this study. The main classifications for the different regimes are discussed below:
- Packed bed. Fixed particle bed structure with no bed height changes at low superficial liquid velocity (Figure 8a,b).
- Creepingly fluidization. The packed bed became loose, and the bed height started to expand creepingly when the superficial liquid velocity reached the minimum fluidization velocity (Figure 8c,d).
- Particulate fluidization. Followed by minimum fluidization, there was little motion of the particles across the bulk of the cross-section, although some porous gaps in the particles’ bed were observed along the walls (Figure 8e,f).
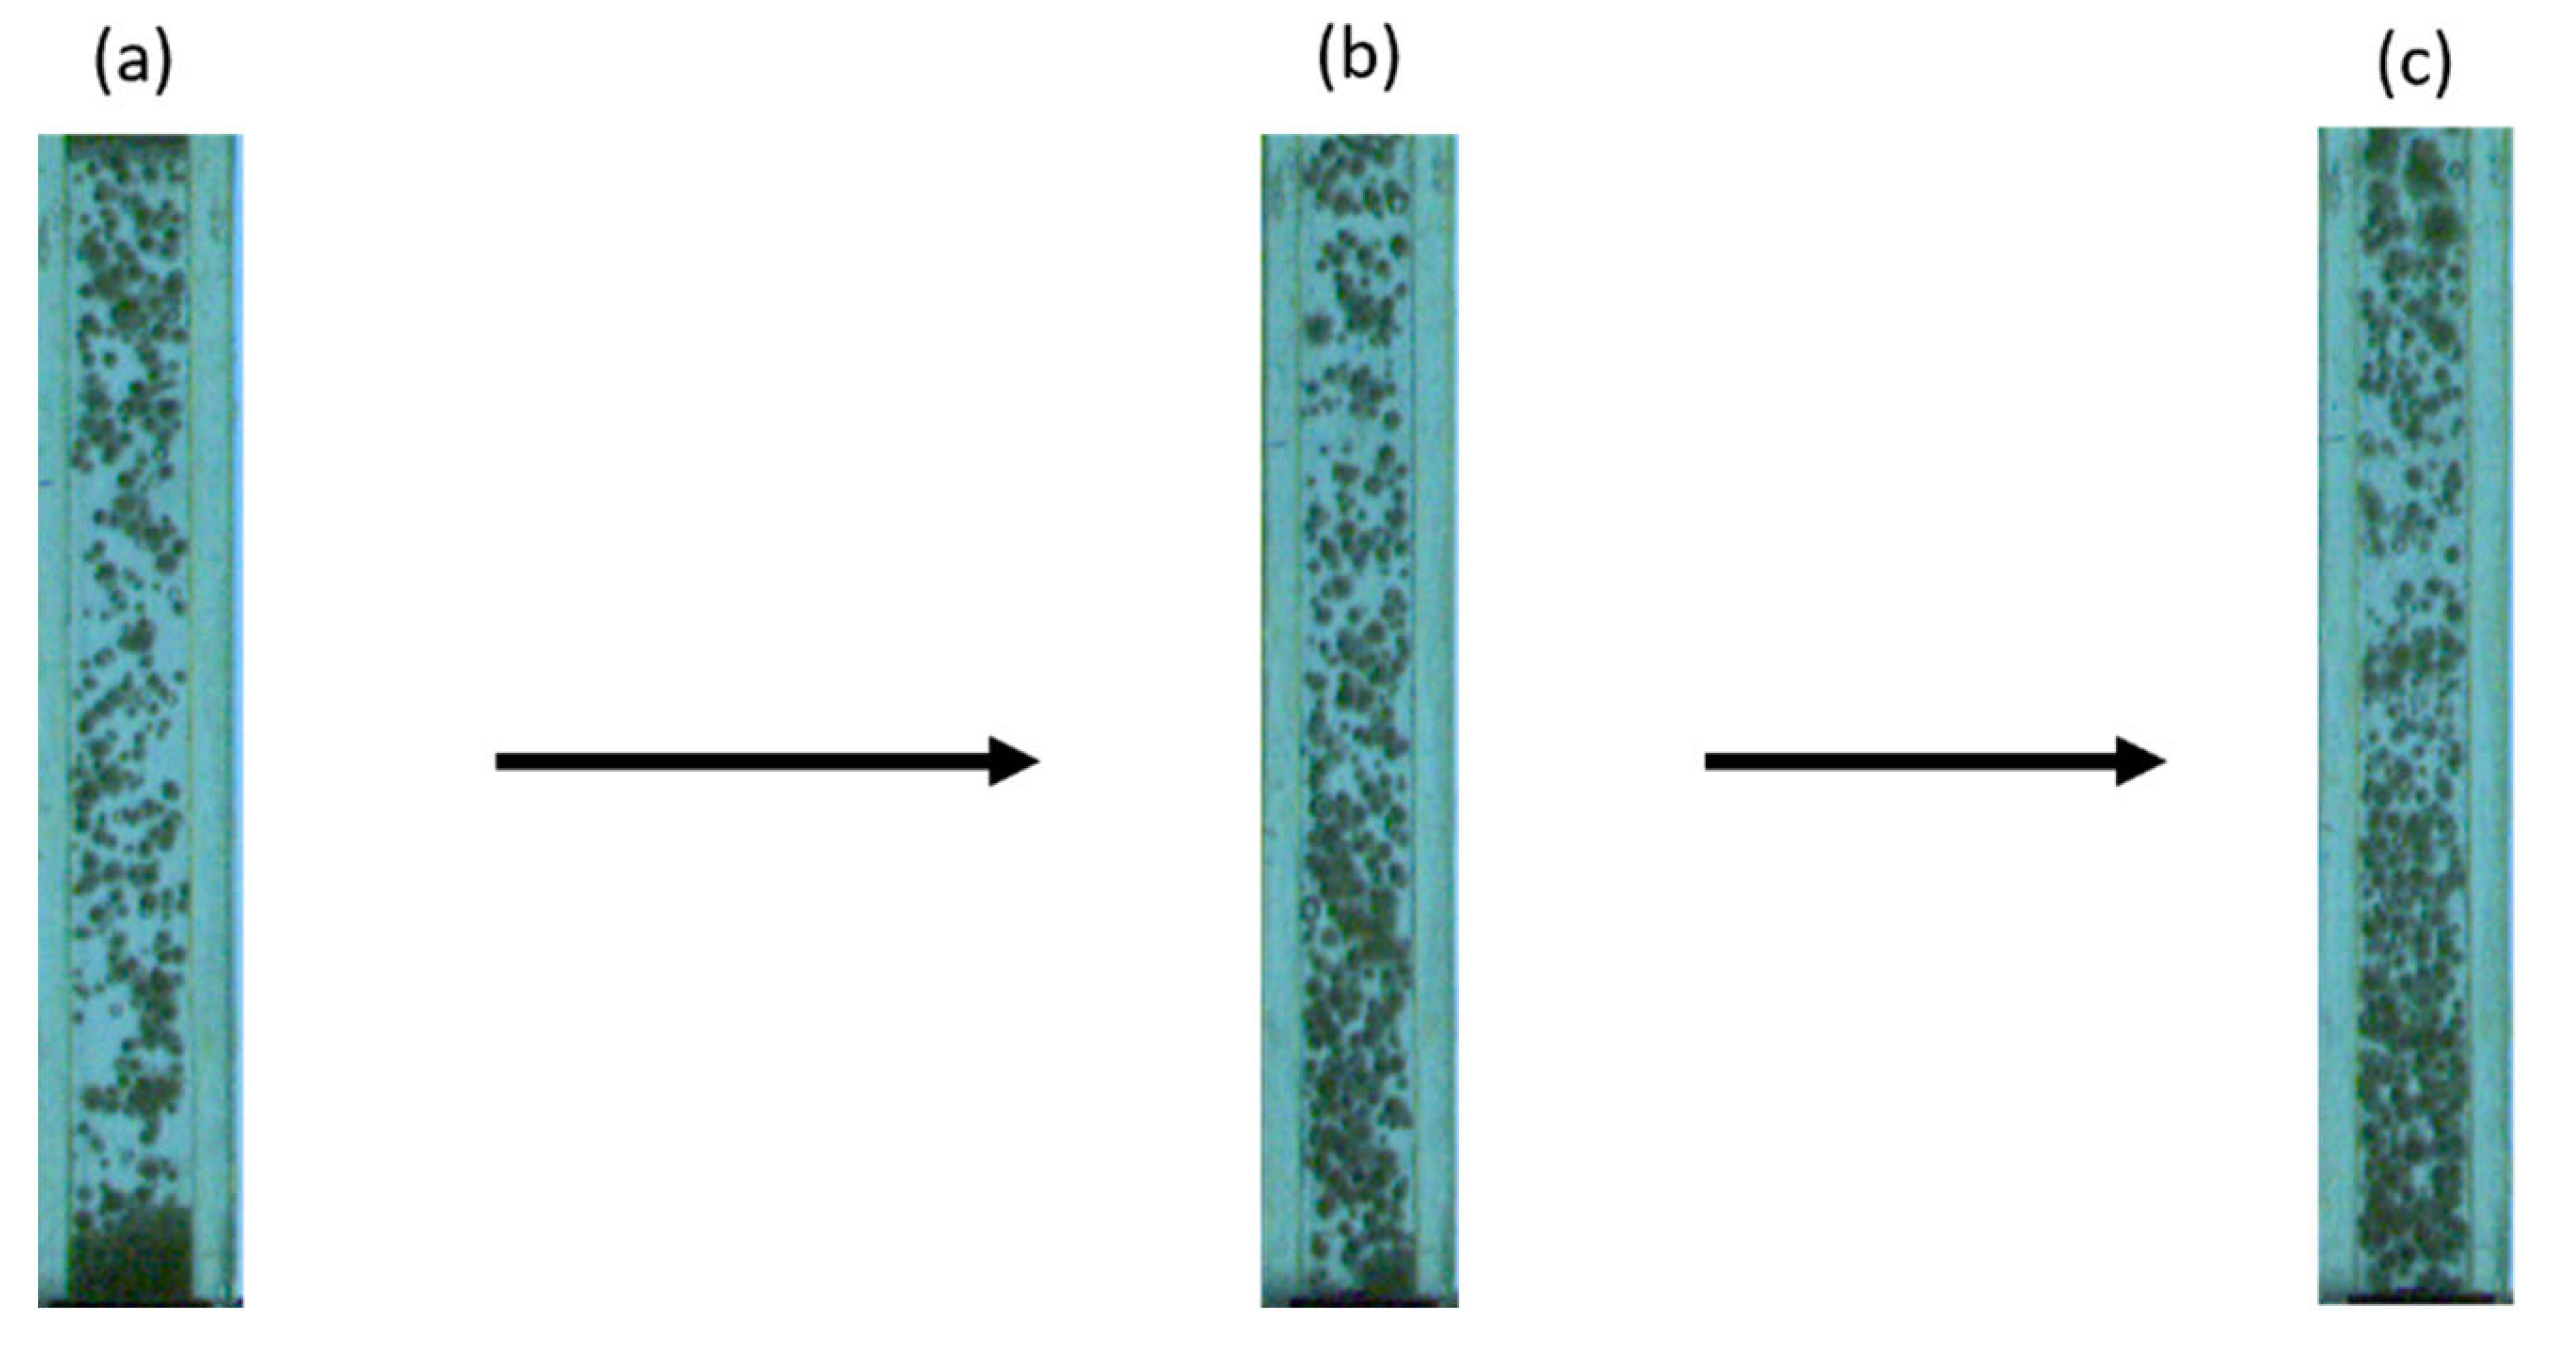
The pellets fluidization, however, exhibited distinctive flow regimes. Based on our previous study [40], the flow regimes for pellets fluidization started from static bed to extended bed, followed by partially fluidized bed and fully fluidized bed, as shown in Figure 9. The existences of the extended bed and partially fluidized bed regimes were due to the filamentous structures of the floccose pellets. Specifically, the extended bed regimes were due to the pellet agglomeration, as the upward liquid flow loosened the interacted aggregates instead of breaking them up, which was reflected by the extended bed height with no dispersed pellet fluidization. With the continuously increase of liquid flow, part of the aggregated pellets was dispersed and fluidized along the column to form partially fluidized bed, which eventually reached the fully fluidized bed regime. A more detailed descriptions with representative snapshots for pellet fluidization were reported by Zhang et al. [40].
3.2.2. Bed Expansion Study
In the liquid–solid fluidization study, solid bed expansion was expressed by the ratio of the increased bed height to static bed height, (H − H0)/H0. Figure 10 plots the solid bed expansion versus superficial liquid velocity based on the defluidization process, which avoided pressure overshoot and hysteresis effects [67]. The relationship between the bed expansion ratio of 3D-printed particles and UL is linear, from which the Umf for particles could be obtained from the intersect by extrapolating the fitting line to the abscissa [26]. The linear expansion behavior of pellets again UL was also reflected by the fitting lines, but there was an apparent slope change at a different liquid flow. Such a slope transition was initially reported by Smith et al. [68], who observed the gradual transition from packed bed to fluidized bed during the fluidization studies of flocs and pellets. Based on our previous report, the smaller slope was due to the extended bed regime where pellets were agglomerated together and bed height increased slowly at low UL, while the larger slope has resulted from the fluidization regime changed from the extended bed into the partially fluidized bed that pellets started to fluidize. Therefore, Umf for pellets fluidization should be defined as the liquid velocity which led to the expansion and detachment of the pellets from the base, with good overall fluidization [40].
Based on the different definitions of Umf for 3D-printed particles and fungal pellets, the determined experimental values of Umf for particles and pellets was 2.3 mm/s and 7.8 mm/s, respectively. The gap between the results indicated the importance of surface force on solids fluidization. Compared to the relatively smooth surface of the printed particles, the fluidization of fungal pellets was strongly inhibited by the outer filamentous hyphae, which not only agglomerated and interacted to form the fungal clumps but also increased the surface friction. Thus, higher liquid flow was required to break the fungal clumps into dispersed pellets and fluidize these floccose pellets.
3.2.3. Richardson–Zaki Expansion Curves Fitting
The calculated initial bed voidage Ɛ0 for 1.5 g of printed particles and pellets was 0.51 and 0.57 using Equation (3) and Equation (4), respectively. Consequently, the logarithmic expansion curves were described by the well-known Richardson–Zaki equation [69]. As shown in Figure 11, the R–Z exponents n for particles and pellets were the slope of the linear fitting line A and line B, respectively. R–Z exponents for pellets fluidization had two distinctive values of 5.7 and 15.1 corresponding to the partially fluidized and fully fluidized bed regime, respectively. However, the exponent value of n for particles fluidization kept constant at ~5.5, which was clearly greater than that of the original R–Z value of 4.65 [69] but close to the value of 5.1 reported by Zivkovic. et al. [67] for the fluidization of soda lime glass microspheres (30.5 µm in diameter) in ethanol. Although the n value of pellets could be up to 15 at a low liquid flowrate, but it decreased to the same level as particles. The same level of n between pellets and particles was because of the same size (~2 mm, shown in Table 1). Tang et al. [26] concluded that the increase of size of solids had apparent effects on the extrapolated n, as the increase of particles size from 104 µm to 287µm led the extrapolated n to increase from 5.02 to 5.90. However, in our experiments, both solids have a same size (~2 mm, shown in Table 1), giving the same level of extrapolated n.
The extrapolated terminal velocity Ut was obtained by extrapolating the fitting lines to a voidage of unity. Based on the fitting line A and line B, Ut reached up to 95.5 mm/s and 31.6 mm/s for particles and pellets, respectively, which were much higher than the theoretical Stokes law terminal velocity of 436 µm/s and 196 µm/s for particles and pellets, respectively. This again indicates the influence of wall effects and surface force of particles on solid fluidization. Compared to the fungal pellets, the higher theoretical and extrapolated Ut for particles fluidization was due to the higher density of printed particles, which could be explained from Stokes Law [19]. In addition, different from the dense and solid particles, pellet is actually a core of packed hyphae surrounded by the hairy region that contains the radially growing portion of the hyphae [70].
3.3. Fluidizations by Bubbles in Gas–Liquid–Solid System
The effects of solid density on fluidization performance were also investigated using the gas–liquid fluidization system. In the gas–solid fluidization system, the 3D-printed particles could not be well fluidized by the single bubble flow but formed a gas channeling [4], because the smaller bubbles (<3 mm in size) were insufficient to suspend the whole high-density particles in a 15 × 15 mm cross-sectional bed.
In contrast, fungal pellets with hollow structures would be easier to be elutriated, namely, have a lower fluidization velocity. Based on our previous study of pellet fluidization by gas only [40], the pellet bed was turned from the partially fluidized bed (Figure 12a) into fully fluidized bed (Figure 12b,c) when increasing the gas flowrate from 9.9 mL/min to 43.8 mL/min, because the bubble flow not only increased pellets upward expansion but also decreased pellet agglomeration. Therefore, for future fungal fermentation using fluidized bed reactor, it is important to adjust liquid/gas flowrate, not only to maintain a good pellet fluidization but also to avoid pellet elutriation.
4. Conclusions
This paper reported the hydrodynamics of bubbles and solids (fungal pellets and printed particles) fluidization in a 3D-printed MFB. The bubbles’ movement and solid fluidization were recorded with a high-speed camera system, which was placed in front of the bed. Compared to the inserted probes reported by other researchers, the external-positioned recording system in this paper could capture the whole bed region, detect rapid variations of bubbles/solids and avoid disturbing the state of fluidization.
In the gas–liquid system, bubble flow regimes including mono-dispersed homogeneous regime, poly-dispersed homogeneous regime, transition bubble regime and heterogeneous bubble regime were identified when increasing the gas flowrate from 3.7 mL/min to 32.7 mL/min. Bubble size primarily increased with increasing orifice diameter and gas flowrate but slightly decreased with the liquid velocity, as the co-current liquid flow enhanced bubble detachment to inhibit bubble growth. Bubble velocity was increased with the increase of gas flowrate as well as the upward liquid flow, but the promotion from liquid flow was insignificant in heterogeneous bubble regime. Gas volume fraction increased with gas flowrate and gas sparger size but was independent of liquid flowrate.
In liquid–solid fluidization, different fluidization regimes were identified between particles and pellets fluidization. During the bed expansion study, higher surface force and pellet agglomeration pellets fluidization induced larger Umf. The similar n during pellets and particles bed expansion was due to the same solid diameter of 2 mm, but the higher Ut from particles bed was explained by the higher density of particles than pellets. This paper highlights the different fluidization hydrodynamics of fungal pellets, thus contributing to the development of MFB and its potential application in the bioprocessing area.
Author Contributions
Conceptualization, methodology, data curation and writing, Y.Z. and V.Z.; writing—review and editing, K.-L.G., Y.-L.N. and V.Z.; resources, supervision and project administration, V.Z. and Y.C.; funding acquisition, V.Z. and Y.C. All authors have read and agreed to the published version of the manuscript.
Funding
Y.Z. acknowledges the CEAM International Postgraduate Scholarship (LOC/150025720/400382711) from Newcastle University and financial supports from SIFBI of A*STAR (under IAFPP3-H20H6a0028), Singapore during his Ph.D. study.
Institutional Review Board Statement
Not applicable.
Informed Consent Statement
Not applicable.
Data Availability Statement
Data are available on request due to restrictions.
Conflicts of Interest
The authors declare no conflict of interest.
Nomenclature
| A | Cross-sectional area of bed column |
| db | Bubbles’ Sauter mean diameter |
| dB | Diameter of internal bed |
| dG | Gas sparger size |
| di | Individual bubble diameter |
| dS | Solid diameter |
| H0 | Static bed height |
| H | Bed height |
| ID | Inner diameter |
| MFB | Micro-fluidized bed |
| m | Solid mass |
| n | Exponent of Richardson–Zaki equation |
| ni | Number of bubbles |
| QG | Volumetric gas flowrate |
| R2 | Coefficient of determination |
| Ub | Bubble rising velocity |
| UL | Liquid velocity |
| Umf | Minimum fluidization velocity |
| Ut | Extrapolated terminal velocity |
| Vb | Individual bubble volume |
| VB | Volume of bubble column |
| Greek Letters | |
| Ɛ | Bed voidage |
| ƐG | Gas volume fraction |
| Ɛ0 | Initial/static bed voidage |
| ρS | Solid density |
References
- Anotai, J.; Wasukran, N.; Boonrattanakij, N. Heterogeneous fluidized-bed Fenton process: Factors affecting iron removal and tertiary treatment application. Chem. Eng. J. 2018, 352, 247–254. [Google Scholar] [CrossRef]
- Lundberg, L.; Soria-Verdugo, A.; Pallarès, D.; Johansson, R.; Thunman, H. The role of fuel mixing on char conversion in a fluidized bed. Powder Technol. 2017, 316, 677–686. [Google Scholar] [CrossRef]
- Wang, C.; Zhu, J. Developments in the understanding of gas–solid contact efficiency in the circulating fluidized bed riser reactor: A review. Chin. J. Chem. Eng. 2016, 24, 53–62. [Google Scholar] [CrossRef]
- Zhang, Y.; Goh, K.-L.; Ng, Y.L.; Chow, Y.; Wang, S.; Zivkovic, V. Process intensification in micro-fluidized bed systems: A review. Chem. Eng. Process. Process Intensif. 2021, 164, 108397. [Google Scholar] [CrossRef]
- Han, Z.; Yue, J.; Zeng, X.; Yu, J.; Wang, F.; Sun, S.; Yao, H.; Luo, G.; Liu, X.; Sun, Y.; et al. Characteristics of gas-solid micro fluidized beds for thermochemical reaction analysis. Carbon Resour. Convers. 2020, 3, 203–218. [Google Scholar] [CrossRef]
- Li, J.; Liu, X.; Zhou, L.; Zhu, Q.; Li, H. A two-stage reduction process for the production of high-purity ultrafine Ni particles in a micro-fluidized bed reactor. Particuology 2015, 19, 27–34. [Google Scholar] [CrossRef]
- Tsutsumi, A.; Nakamoto, S.; Mineo, T.; Yoshida, K. A novel fluidized-bed coating of fine particles by rapid expansion of supercritical fluid solutions. Powder Technol. 1995, 85, 275–278. [Google Scholar] [CrossRef]
- Wang, F.; Zeng, X.; Shao, R.; Wang, Y.; Yu, J.; Xu, G. Isothermal gasification of in situ/ex situ coal char with CO2 in a micro fluidized bed reaction analyzer. Energy Fuels 2015, 29, 4795–4802. [Google Scholar] [CrossRef]
- Yu, J.; Yao, C.; Zeng, X.; Geng, S.; Dong, L.; Wang, Y.; Gao, S.; Xu, G. Biomass pyrolysis in a micro-fluidized bed reactor: Characterization and kinetics. Chem. Eng. J. 2011, 168, 839–847. [Google Scholar] [CrossRef]
- Zeng, X.; Wang, F.; Wang, Y.; Li, A.; Yu, J.; Xu, G. Characterization of char gasification in a micro fluidized bed reaction analyzer. Energy Fuels 2014, 28, 1838–1845. [Google Scholar] [CrossRef]
- Shen, T.; Zhu, X.; Yan, J.; Shen, L. Design of micro interconnected fluidized bed for oxygen carrier evaluation. Int. J. Greenh. Gas Control 2019, 90, 102806. [Google Scholar] [CrossRef]
- Kuyukina, M.S.; Ivshina, I.B.; Serebrennikova, M.K.; Krivoruchko, A.V.; Korshunova, I.O.; Peshkur, T.A.; Cunningham, C.J. Oilfield wastewater biotreatment in a fluidized-bed bioreactor using co-immobilized Rhodococcus cultures. J. Environ. Chem. Eng. 2017, 5, 1252–1260. [Google Scholar] [CrossRef]
- Qiu, L.; Chen, W.; Zhong, L.; Wu, W.; Wu, S.; Chen, J.; Zhang, F.; Zhong, W. Formaldehyde biodegradation by immobilized Methylobacterium sp. XJLW cells in a three-phase fluidized bed reactor. Bioprocess Biosyst. Eng. 2014, 37, 1377–1384. [Google Scholar] [CrossRef]
- Dussán, K.J.; Justo, O.R.; Perez, V.H.; David, G.F.; Junior, E.G.S.; da Silva, S.S. Bioethanol production from sugarcane bagasse hemicellulose hydrolysate by immobilized s. shehatae in a fluidized bed fermenter under magnetic field. BioEnergy Res. 2019, 12, 338–346. [Google Scholar] [CrossRef]
- Da Silva, A.N.; Macêdo, W.V.; Sakamoto, I.K.; Pereyra, D.D.L.A.D.; Mendes, C.O.; Maintinguer, S.I.; Caffaro Filho, R.A.; Damianovic, M.H.Z.; Varesche, M.B.A.; de Amorim, E.L.C. Biohydrogen production from dairy industry wastewater in an anaerobic fluidized-bed reactor. Biomass Bioenergy 2019, 120, 257–264. [Google Scholar] [CrossRef]
- Potic, B.; Kersten, S.R.A.; Ye, M.; van der Hoef, M.A.; Kuipers, J.A.M.; van Swaaij, W.P.M. Fluidization with hot compressed water in micro-reactors. Chem. Eng. Sci. 2005, 60, 5982–5990. [Google Scholar] [CrossRef]
- Zivkovic, V.; Biggs, M.J. On importance of surface forces in a microfluidic fluidized bed. Chem. Eng. Sci. 2015, 126, 143–149. [Google Scholar] [CrossRef] [Green Version]
- Li, X.; Liu, M.; Li, Y. Bed expansion and multi-bubble behavior of gas-liquid-solid micro-fluidized beds in sub-millimeter capillary. Chem. Eng. J. 2017, 328, 1122–1138. [Google Scholar] [CrossRef]
- do Nascimento, O.L.; Reay, D.A.; Zivkovic, V. Solid circulating velocity measurement in a liquid–solid micro-circulating fluidised bed. Processes 2020, 8, 1159. [Google Scholar] [CrossRef]
- do Nascimento, O.L.; Reay, D.A.; Zivkovic, V. Influence of surface forces and wall effects on the minimum fluidization velocity of liquid-solid micro-fluidized beds. Powder Technol. 2016, 304, 55–62. [Google Scholar] [CrossRef]
- Rao, A.; Curtis, J.S.; Hancock, B.C.; Wassgren, C. The effect of column diameter and bed height on minimum fluidization velocity. AIChE J. 2010, 56, 2304–2311. [Google Scholar] [CrossRef]
- Zeng, X.; Wang, F.; Adamu, M.H.; Zhang, L.; Han, Z.; Xu, G. High-temperature drying behavior and kinetics of lignite tested by the micro fluidization analytical method. Fuel 2019, 253, 180–188. [Google Scholar] [CrossRef]
- Zeng, X.; Zhang, J.; Adamu, M.H.; Wang, F.; Han, Z.; Zheng, Q.; Zhang, L.; Xu, G. Behavior and kinetics of drying, pyrolysis, gasification, and combustion tested by a microfluidized bed reaction analyzer for the staged-gasification process. Energy Fuels 2020, 34, 2553–2565. [Google Scholar] [CrossRef]
- Gao, W.; Farahani, M.R.; Jamil, M.K.; Siddiqui, M.K.; Siddiqui, H.M.A.; Imran, M.; Rezaee-Manesh, R. Kinetic modeling of pyrolysis of three Iranian waste oils in a micro-fluidized bed. Pet. Sci. Technol. 2017, 35, 183–189. [Google Scholar] [CrossRef]
- Liu, X.; Xu, G.; Gao, S. Micro fluidized beds: Wall effect and operability. Chem. Eng. J. 2008, 137, 302–307. [Google Scholar] [CrossRef]
- Tang, C.; Liu, M.; Li, Y. Experimental investigation of hydrodynamics of liquid–solid mini-fluidized beds. Particuology 2016, 27, 102–109. [Google Scholar] [CrossRef]
- Doroodchi, E.; Peng, Z.; Sathe, M.; Abbasi-Shavazi, E.; Evans, G.M. Fluidisation and packed bed behaviour in capillary tubes. Powder Technol. 2012, 223, 131–136. [Google Scholar] [CrossRef]
- Boffito, D.C.; Neagoe, C.; Edake, M.; Pastor-Ramirez, B.; Patience, G.S. Biofuel synthesis in a capillary fluidized bed. Catal. Today 2014, 237, 13–17. [Google Scholar] [CrossRef]
- Do Nascimento, O.L.; Reay, D.; Zivkovic, V. Study of transitional velocities of solid–liquid micro-circulating fluidized beds by visual observation. J. Chem. Eng. Jpn. 2018, 51, 349–355. [Google Scholar] [CrossRef] [Green Version]
- Zivkovic, V.; Kashani, M.N.; Biggs, M. Experimental and theoretical study of a micro-fluidized bed. AIP Conf. Proc. 2013, 1542, 93–96. [Google Scholar] [CrossRef]
- Lu, Y.; Zhao, L.; Han, Q.; Wei, L.; Zhang, X.; Guo, L.; Wei, J. Minimum fluidization velocities for supercritical water fluidized bed within the range of 633–693K and 23–27MPa. Int. J. Multiph. Flow 2013, 49, 78–82. [Google Scholar] [CrossRef]
- McDonough, J.R. A perspective on the current and future roles of additive manufacturing in process engineering, with an emphasis on heat transfer. Therm. Sci. Eng. Prog. 2020, 19, 100594. [Google Scholar] [CrossRef]
- McDonough, J.R.; Law, R.; Reay, D.A.; Groszek, D.; Zivkovic, V. Miniaturisation of the toroidal fluidization concept using 3D printing. Chem. Eng. Res. Des. 2020, 160, 129–140. [Google Scholar] [CrossRef]
- Qie, Z.; Alhassawi, H.; Sun, F.; Gao, J.; Zhao, G.; Fan, X. Characteristics and applications of micro fluidized beds (MFBs). Chem. Eng. J. 2021, 428, 131330. [Google Scholar] [CrossRef]
- Pjontek, D.; Donaldson, A.; Macchi, A. Three-phase (gas–liquid–solid) fluidization. In Essentials of Fluidization Technology; Wiley-VCH Verlag: Weinheim, Germany, 2020; pp. 553–589. [Google Scholar]
- Chowdhury, N.; Zhu, J.; Nakhla, G.; Patel, A.; Islam, M.J.C.E. A novel liquid-solid circulating fluidized-bed bioreactor for biological nutrient removal from municipal wastewater. Chem. Eng. Technol. 2009, 32, 364–372. [Google Scholar] [CrossRef]
- Kuyukina, M.S.; Ivshina, I.B.; Serebrennikova, M.K.; Krivorutchko, A.B.; Podorozhko, E.A.; Ivanov, R.V.; Lozinsky, V.I. Petroleum-contaminated water treatment in a fluidized-bed bioreactor with immobilized Rhodococcus cells. Int. Biodeterior. Biodegrad. 2009, 63, 427–432. [Google Scholar] [CrossRef]
- Wu, K.-J.; Chang, C.-F.; Chang, J.-S. Simultaneous production of biohydrogen and bioethanol with fluidized-bed and packed-bed bioreactors containing immobilized anaerobic sludge. Process Biochem. 2007, 42, 1165–1171. [Google Scholar] [CrossRef]
- Cavalcantedeamorim, E.; Barros, A.; Rissatozamariollidamianovic, M.; Silva, E. Anaerobic fluidized bed reactor with expanded clay as support for hydrogen production through dark fermentation of glucose. Int. J. Hydrog. Energy 2009, 34, 783–790. [Google Scholar] [CrossRef]
- Zhang, Y.; Ng, Y.L.; Goh, K.-L.; Chow, Y.; Wang, S.; Zivkovic, V. Fluidization of fungal pellets in a 3D-printed micro-fluidized bed. Chem. Eng. Sci. 2021, 236, 116466. [Google Scholar] [CrossRef]
- McDonough, J.R.; Law, R.; Reay, D.A.; Zivkovic, V. Fluidization in small-scale gas-solid 3D-printed fluidized beds. Chem. Eng. Sci. 2019, 200, 294–309. [Google Scholar] [CrossRef]
- Kowalczuk, P.B.; Drzymala, J. Physical meaning of the Sauter mean diameter of spherical particulate matter. Part. Sci. Technol. 2015, 34, 645–647. [Google Scholar] [CrossRef]
- Boubendir, L.; Chikh, S.; Tadrist, L. On the surface tension role in bubble growth and detachment in a micro-tube. Int. J. Multiph. Flow 2020, 124, 103196. [Google Scholar] [CrossRef]
- Kováts, P.; Thévenin, D.; Zähringer, K. Influence of viscosity and surface tension on bubble dynamics and mass transfer in a model bubble column. Int. J. Multiph. Flow 2020, 123, 103174. [Google Scholar] [CrossRef]
- Andrews, S.; Gilley, J.; Coleman, M.P. Difference Tracker: ImageJ plugins for fully automated analysis of multiple axonal transport parameters. J. Neurosci. Methods 2010, 193, 281–287. [Google Scholar] [CrossRef] [PubMed]
- Sardeshpande, M.V.; Harinarayan, S.; Ranade, V.V. Void fraction measurement using electrical capacitance tomography and high speed photography. Chem. Eng. Res. Des. 2015, 94, 1–11. [Google Scholar] [CrossRef]
- Besagni, G.; Inzoli, F.; De Guido, G.; Pellegrini, L.A. Experimental investigation on the influence of ethanol on bubble column hydrodynamics. Chem. Eng. Res. Des. 2016, 112, 1–15. [Google Scholar] [CrossRef]
- Kaji, M.; Sawai, T.; Mori, K.; Iguchi, M. Behaviours of bubble formation from a bottom porous nozzle bath. In Proceedings of the 5th World Conference on Experimental Heat Transfer, Fluid Mechanics and Thermodynamics (ExHFT-5), Thessaloniki, Greece, 24–28 September 2001; pp. 1503–1508. [Google Scholar]
- Zhang, J.P.; Grace, J.R.; Epstein, N.; Lim, K.S. Flow regime identification in gas-liquid flow and three-phase fluidized beds. Chem. Eng. Sci. 1997, 52, 3979–3992. [Google Scholar] [CrossRef]
- Sharaf, S.; Zednikova, M.; Ruzicka, M.C.; Azzopardi, B.J. Global and local hydrodynamics of bubble columns—Effect of gas distributor. Chem. Eng. J. 2016, 288, 489–504. [Google Scholar] [CrossRef]
- Werther, J.; Molerus, O. The local structure of gas fluidized beds—I. A statistically based measuring system. Int. J. Multiph. Flow 1973, 1, 103–122. [Google Scholar] [CrossRef]
- Xue, J.; Al-Dahhan, M.; Dudukovic, M.P.; Mudde, R.F. Four-point optical probe for measurement of bubble dynamics: Validation of the technique. Flow Meas. Instrum. 2008, 19, 293–300. [Google Scholar] [CrossRef]
- Ramakrishnan, S.; Kumar, R.; Kuloor, N.R. Studies in bubble formation—I bubble formation under constant flow conditions. Chem. Eng. Sci. 1969, 24, 731–747. [Google Scholar] [CrossRef]
- Akita, K.; Yoshida, F. Bubble size, interfacial area, and liquid-phase mass transfer coefficient in bubble columns. Ind. Eng. Chem. Process Des. Dev. 1974, 13, 84–91. [Google Scholar] [CrossRef]
- Kulkarni, A.A.; Joshi, J.B. Bubble formation and bubble rise velocity in gas–Liquid systems: A review. Ind. Eng. Chem. Res. 2005, 44, 5873–5931. [Google Scholar] [CrossRef]
- Zivkovic, V.; Zerna, P.; Alwahabi, Z.T.; Biggs, M.J. A pressure drop correlation for low Reynolds number Newtonian flows through a rectangular orifice in a similarly shaped micro-channel. Chem. Eng. Res. Des. 2013, 91, 1–6. [Google Scholar] [CrossRef] [Green Version]
- Whitehead, A.B.; Dent, D.C.; Bhat, G.N. Fluidisation studies in large gas-solid systems Part I: Bubble rise rates. Powder Technol. 1967, 1, 143–148. [Google Scholar] [CrossRef]
- Whitehead, A.B.; Dent, D.C.; Young, A.D. Fluidisation studies in large gas-solid systems Part II: The effect of distributor design and solid properties on fluidisation quality. Powder Technol. 1967, 1, 149–156. [Google Scholar] [CrossRef]
- Godard, K.; Richardson, J. Bubble velocities and bed expansions in freely bubbling fluidised beds. Chem. Eng. Sci. 1969, 24, 663–670. [Google Scholar] [CrossRef]
- Clift, R.; Grace, J. Bubble Interaction in Fluidised Beds. Ph.D. Thesis, McGill University, Montréal, QC, Canada, 1970. [Google Scholar]
- Rowe, P.; Matsuno, R. Single bubbles injected into a gas fluidised bed and observed by X-rays. Chem. Eng. Sci. 1971, 26, 923–935. [Google Scholar] [CrossRef]
- Kiambi, S.L.; Duquenne, A.-M.; Dupont, J.-B.; Colin, C.; Risso, F.; Delmas, H. Measurements of bubble characteristics: Comparison between double optical probe and imaging. Can. J. Chem. Eng. 2003, 81, 764–770. [Google Scholar] [CrossRef] [Green Version]
- Rüdisüli, M.; Schildhauer, T.J.; Biollaz, S.M.A.; Ruud van Ommen, J. Bubble characterization in a fluidized bed by means of optical probes. Int. J. Multiph. Flow 2012, 41, 56–67. [Google Scholar] [CrossRef]
- Werther, J.; Molerus, O. The local structure of gas fluidized beds—II. The spatial distribution of bubbles. Int. J. Multiph. Flow 1973, 1, 123–138. [Google Scholar] [CrossRef]
- Zenit, R.; Koch, D.L.; Sangani, A.S. Impedance probe to measure local gas volume fraction and bubble velocity in a bubbly liquid. Rev. Sci. Instrum. 2003, 74, 2817–2827. [Google Scholar] [CrossRef] [Green Version]
- Di Felice, R. Hydrodynamics of liquid fluidisation. Chem. Eng. Sci. 1995, 50, 1213–1245. [Google Scholar] [CrossRef]
- Zivkovic, V.; Biggs, M.J.; Alwahabi, Z.T. Experimental study of a liquid fluidization in a microfluidic channel. AIChE J. 2013, 59, 361–364. [Google Scholar] [CrossRef] [Green Version]
- Smith, E.; James, A.; Fidgett, M. Fluidization of microbial aggregates in tower fermenters. In Proceedings of the 2nd Engineering Foundation Conference, Cambridge, UK, 2–6 April 1978; pp. 196–201. [Google Scholar]
- Richardson, J.F.; Zaki, W.N. The sedimentation of a suspension of uniform spheres under conditions of viscous flow. Chem. Eng. Sci. 1954, 3, 65–73. [Google Scholar] [CrossRef]
- Espinosa-Ortiz, E.J.; Rene, E.R.; Pakshirajan, K.; van Hullebusch, E.D.; Lens, P.N.L. Fungal pelleted reactors in wastewater treatment: Applications and perspectives. Chem. Eng. J. 2016, 283, 553–571. [Google Scholar] [CrossRef]
Figure 1.
3D Models of the MFB: (a) top view of the lower section, (b) front view of lower section, (c) upper main column with (d) image of the actually assembled 3D-printed MFB [40].
Figure 1.
3D Models of the MFB: (a) top view of the lower section, (b) front view of lower section, (c) upper main column with (d) image of the actually assembled 3D-printed MFB [40].

Figure 2.
Images showing the different morphology of (a) 3D-printed particles and (b) fungal pellets.
Figure 2.
Images showing the different morphology of (a) 3D-printed particles and (b) fungal pellets.
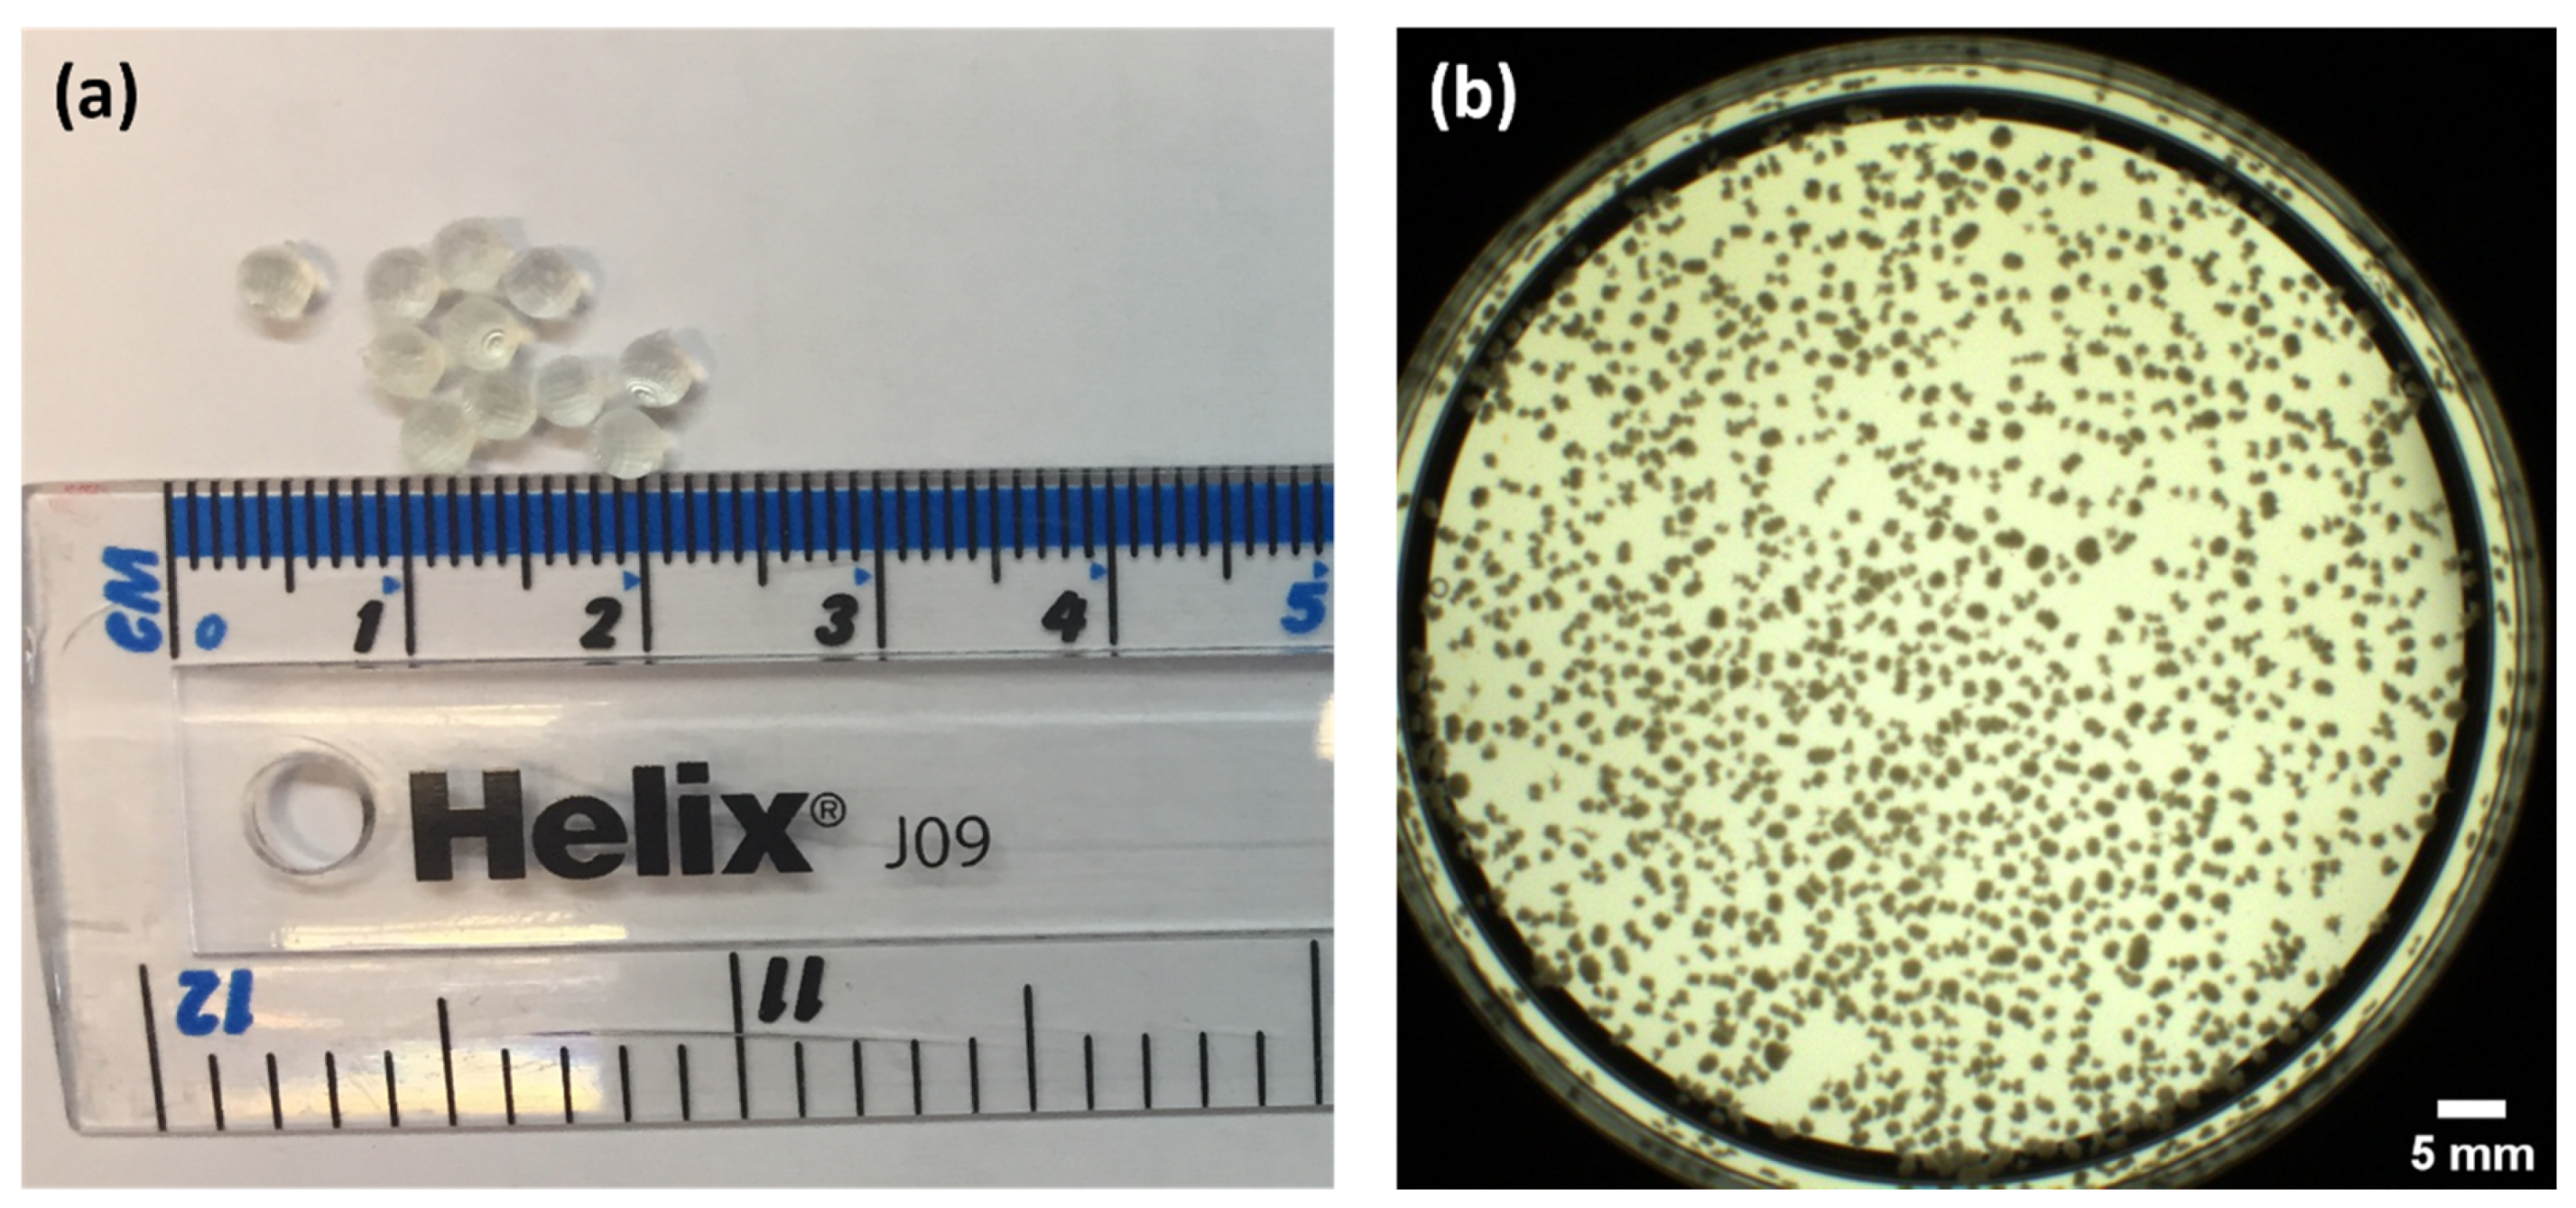
Figure 3.
Schematic diagram of the experimental setup for gas–liquid bubble experiments.
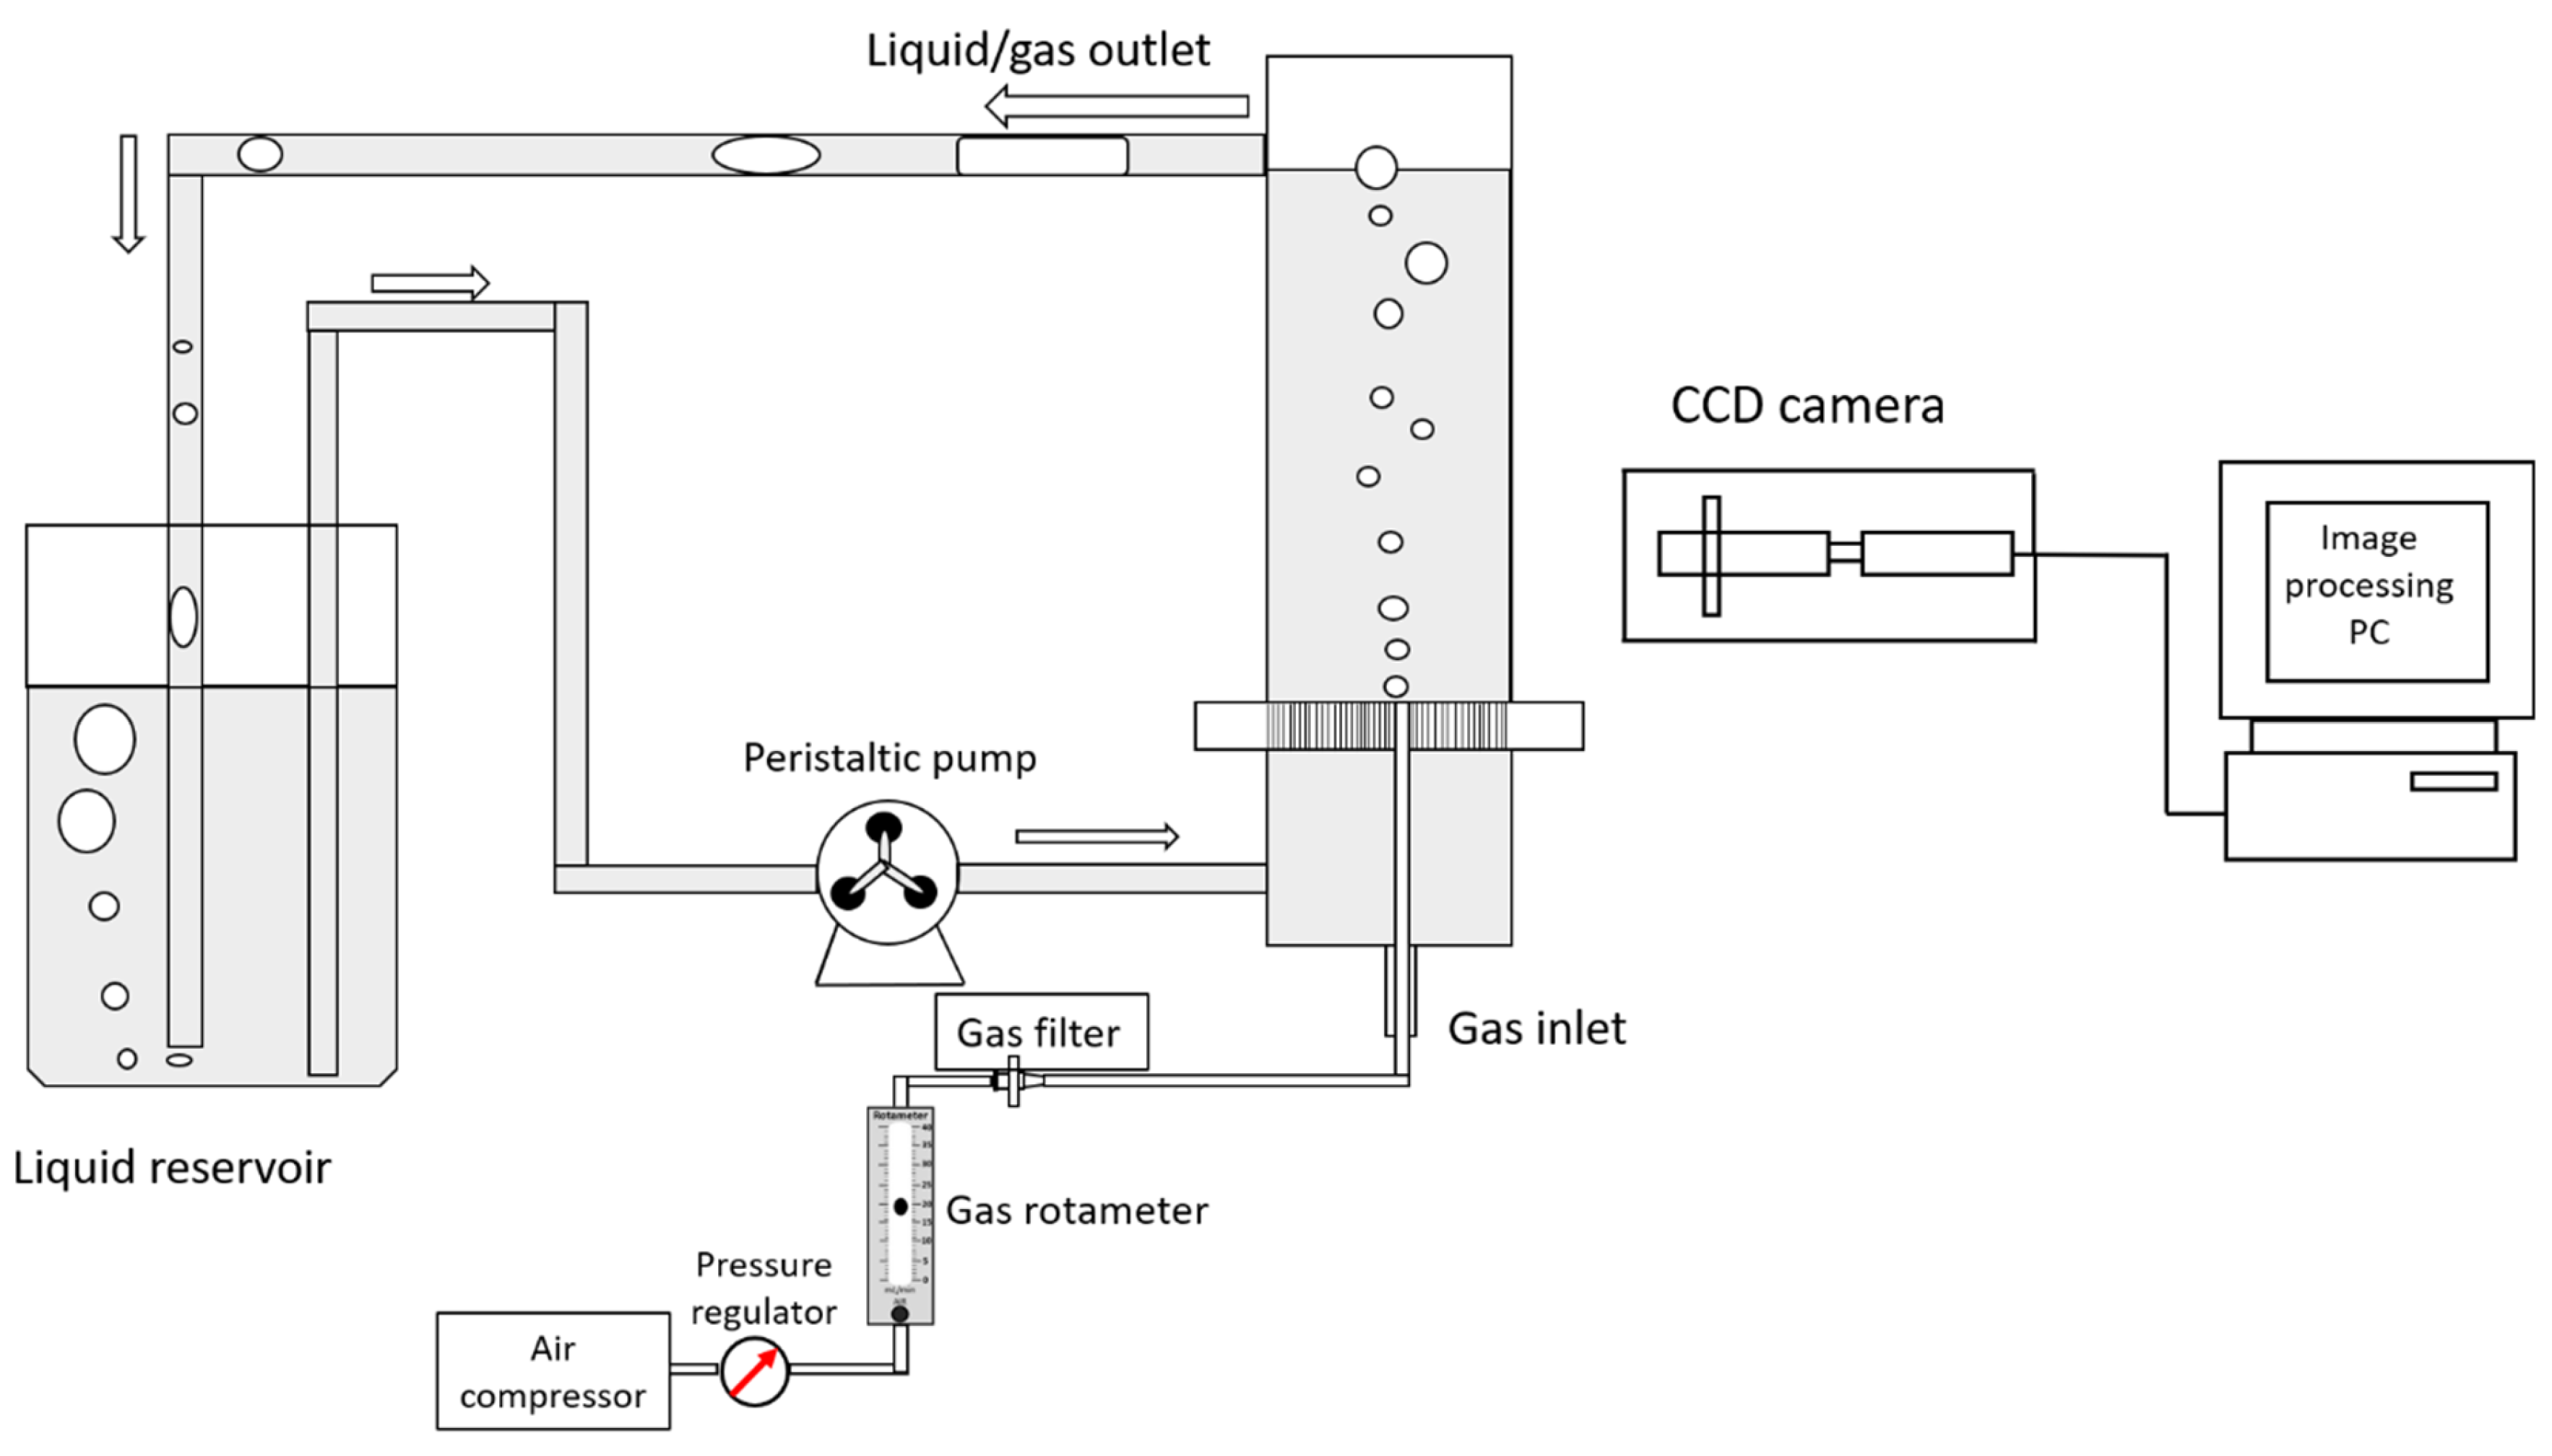
Figure 4.
Representative pictures of bubble flow regimes with the increase of gas flowrate under a static liquid flow. dG = 100 µm. (a) QG = 3.7 mL/min; (b) QG = 5.4 mL/min; (c) QG = 9.9 mL/min; (d) QG = 15.5 mL/min; (e) QG = 22.9 mL/min; (f) QG = 32.7 mL/min.
Figure 4.
Representative pictures of bubble flow regimes with the increase of gas flowrate under a static liquid flow. dG = 100 µm. (a) QG = 3.7 mL/min; (b) QG = 5.4 mL/min; (c) QG = 9.9 mL/min; (d) QG = 15.5 mL/min; (e) QG = 22.9 mL/min; (f) QG = 32.7 mL/min.

Figure 5.
The mean bubbles’ size for different capillary sizes of (a) dG = 50 µm, (b) dG = 100 µm, (c) dG = 50 µm as a function of liquid velocity, UL and gas flowrates, QG.
Figure 5.
The mean bubbles’ size for different capillary sizes of (a) dG = 50 µm, (b) dG = 100 µm, (c) dG = 50 µm as a function of liquid velocity, UL and gas flowrates, QG.

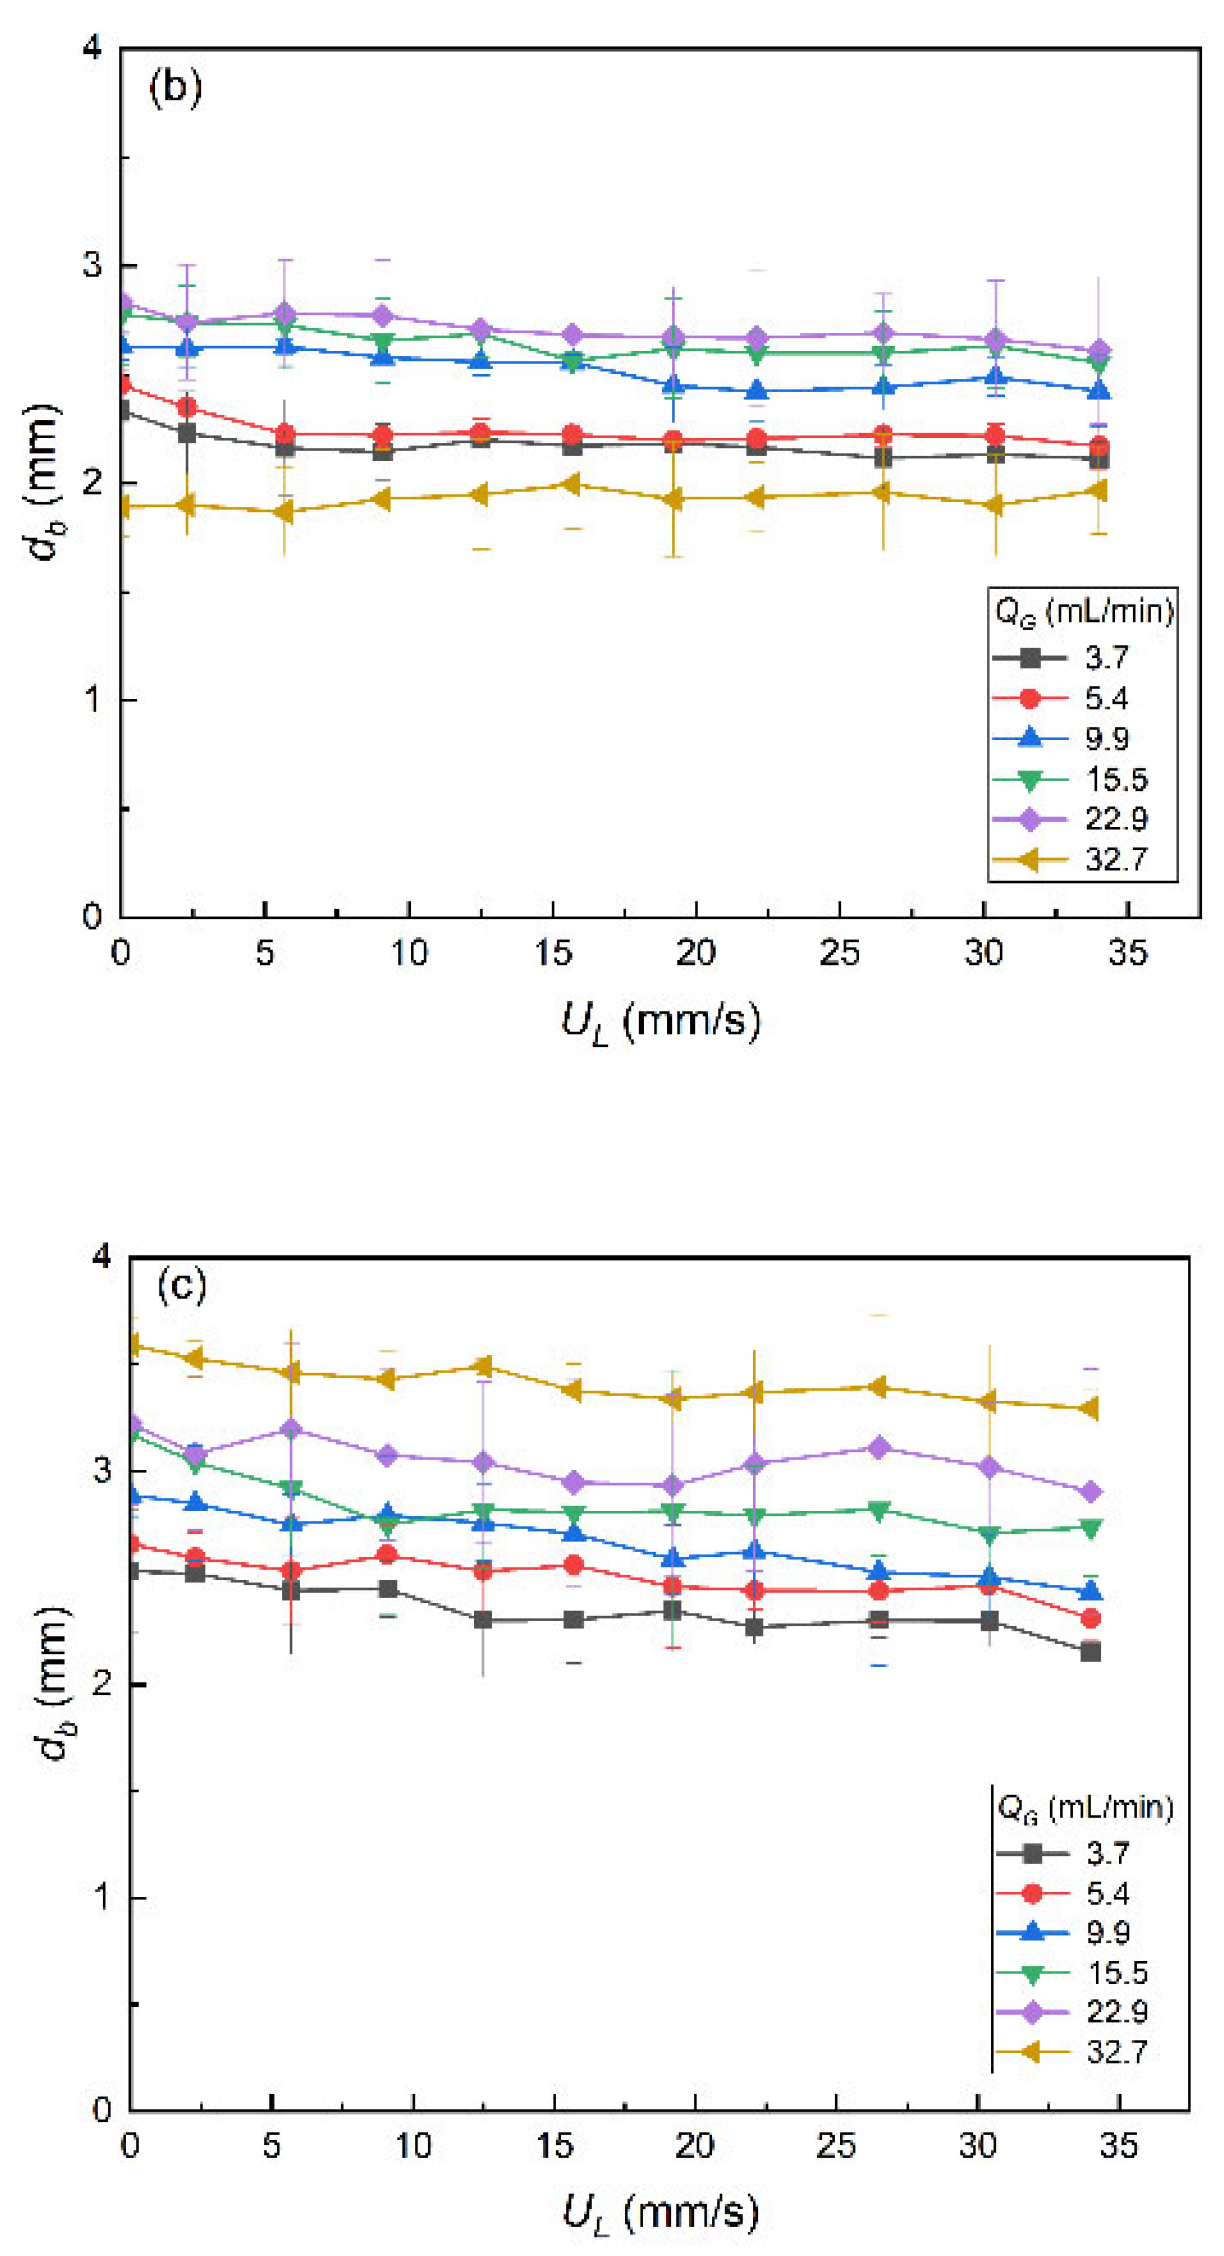
Figure 6.
Bubbles’ velocity as a function of liquid velocity, UL for the different gas flowrates, QG. Subfigures correspond to the three different orifice sizes of (a) dG = 50 µm, (b) dG = 100 µm and (c) dG = 150 µm.
Figure 6.
Bubbles’ velocity as a function of liquid velocity, UL for the different gas flowrates, QG. Subfigures correspond to the three different orifice sizes of (a) dG = 50 µm, (b) dG = 100 µm and (c) dG = 150 µm.
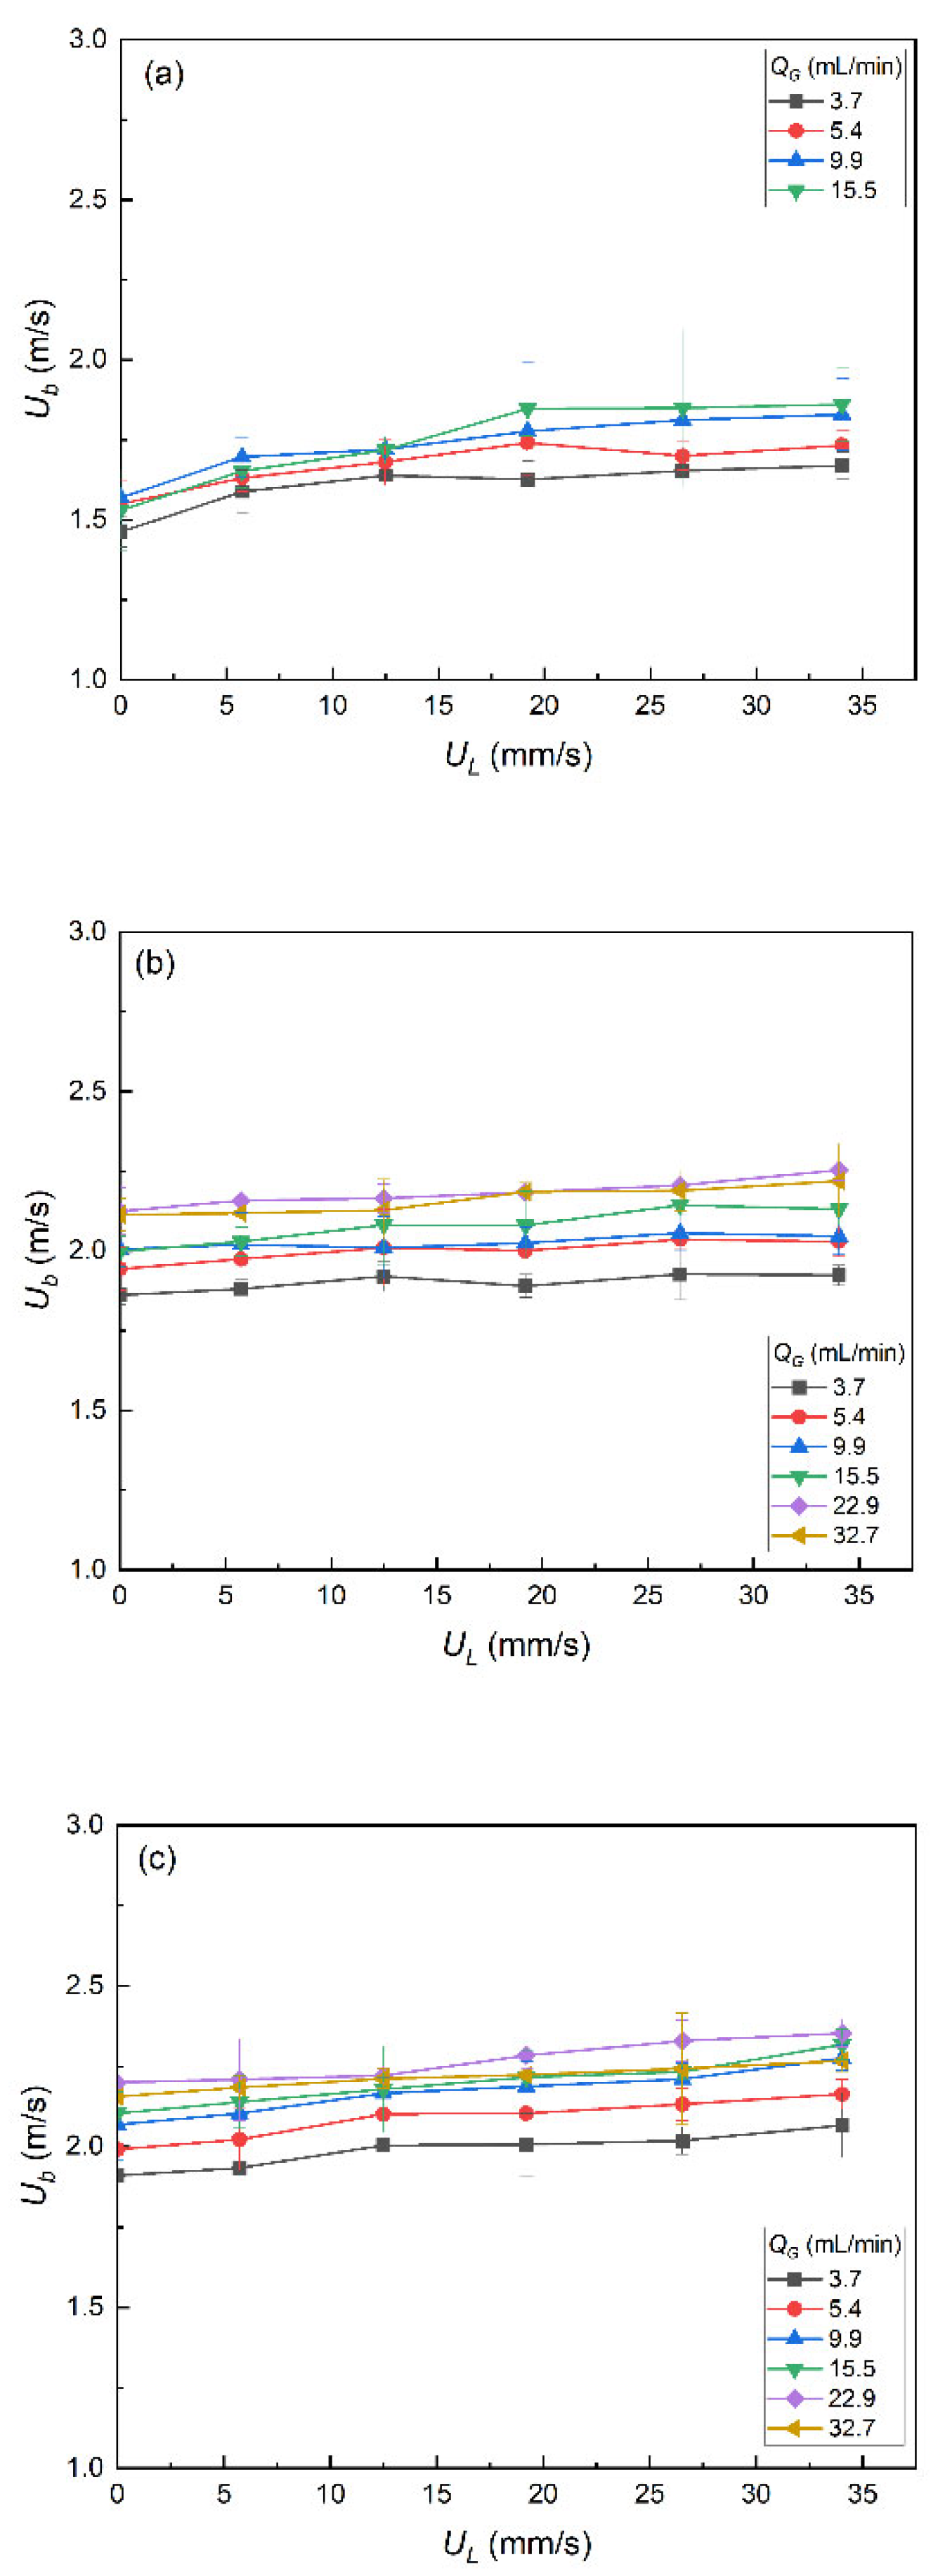
Figure 7.
Characterization of gas volume fraction, ƐG as a function of gas flowrate, QG and liquid velocity, UL with different gas sparger sizes: (a) dG = 50 µm, (b) dG = 100 µm, (c) dG = 150 µm.
Figure 7.
Characterization of gas volume fraction, ƐG as a function of gas flowrate, QG and liquid velocity, UL with different gas sparger sizes: (a) dG = 50 µm, (b) dG = 100 µm, (c) dG = 150 µm.
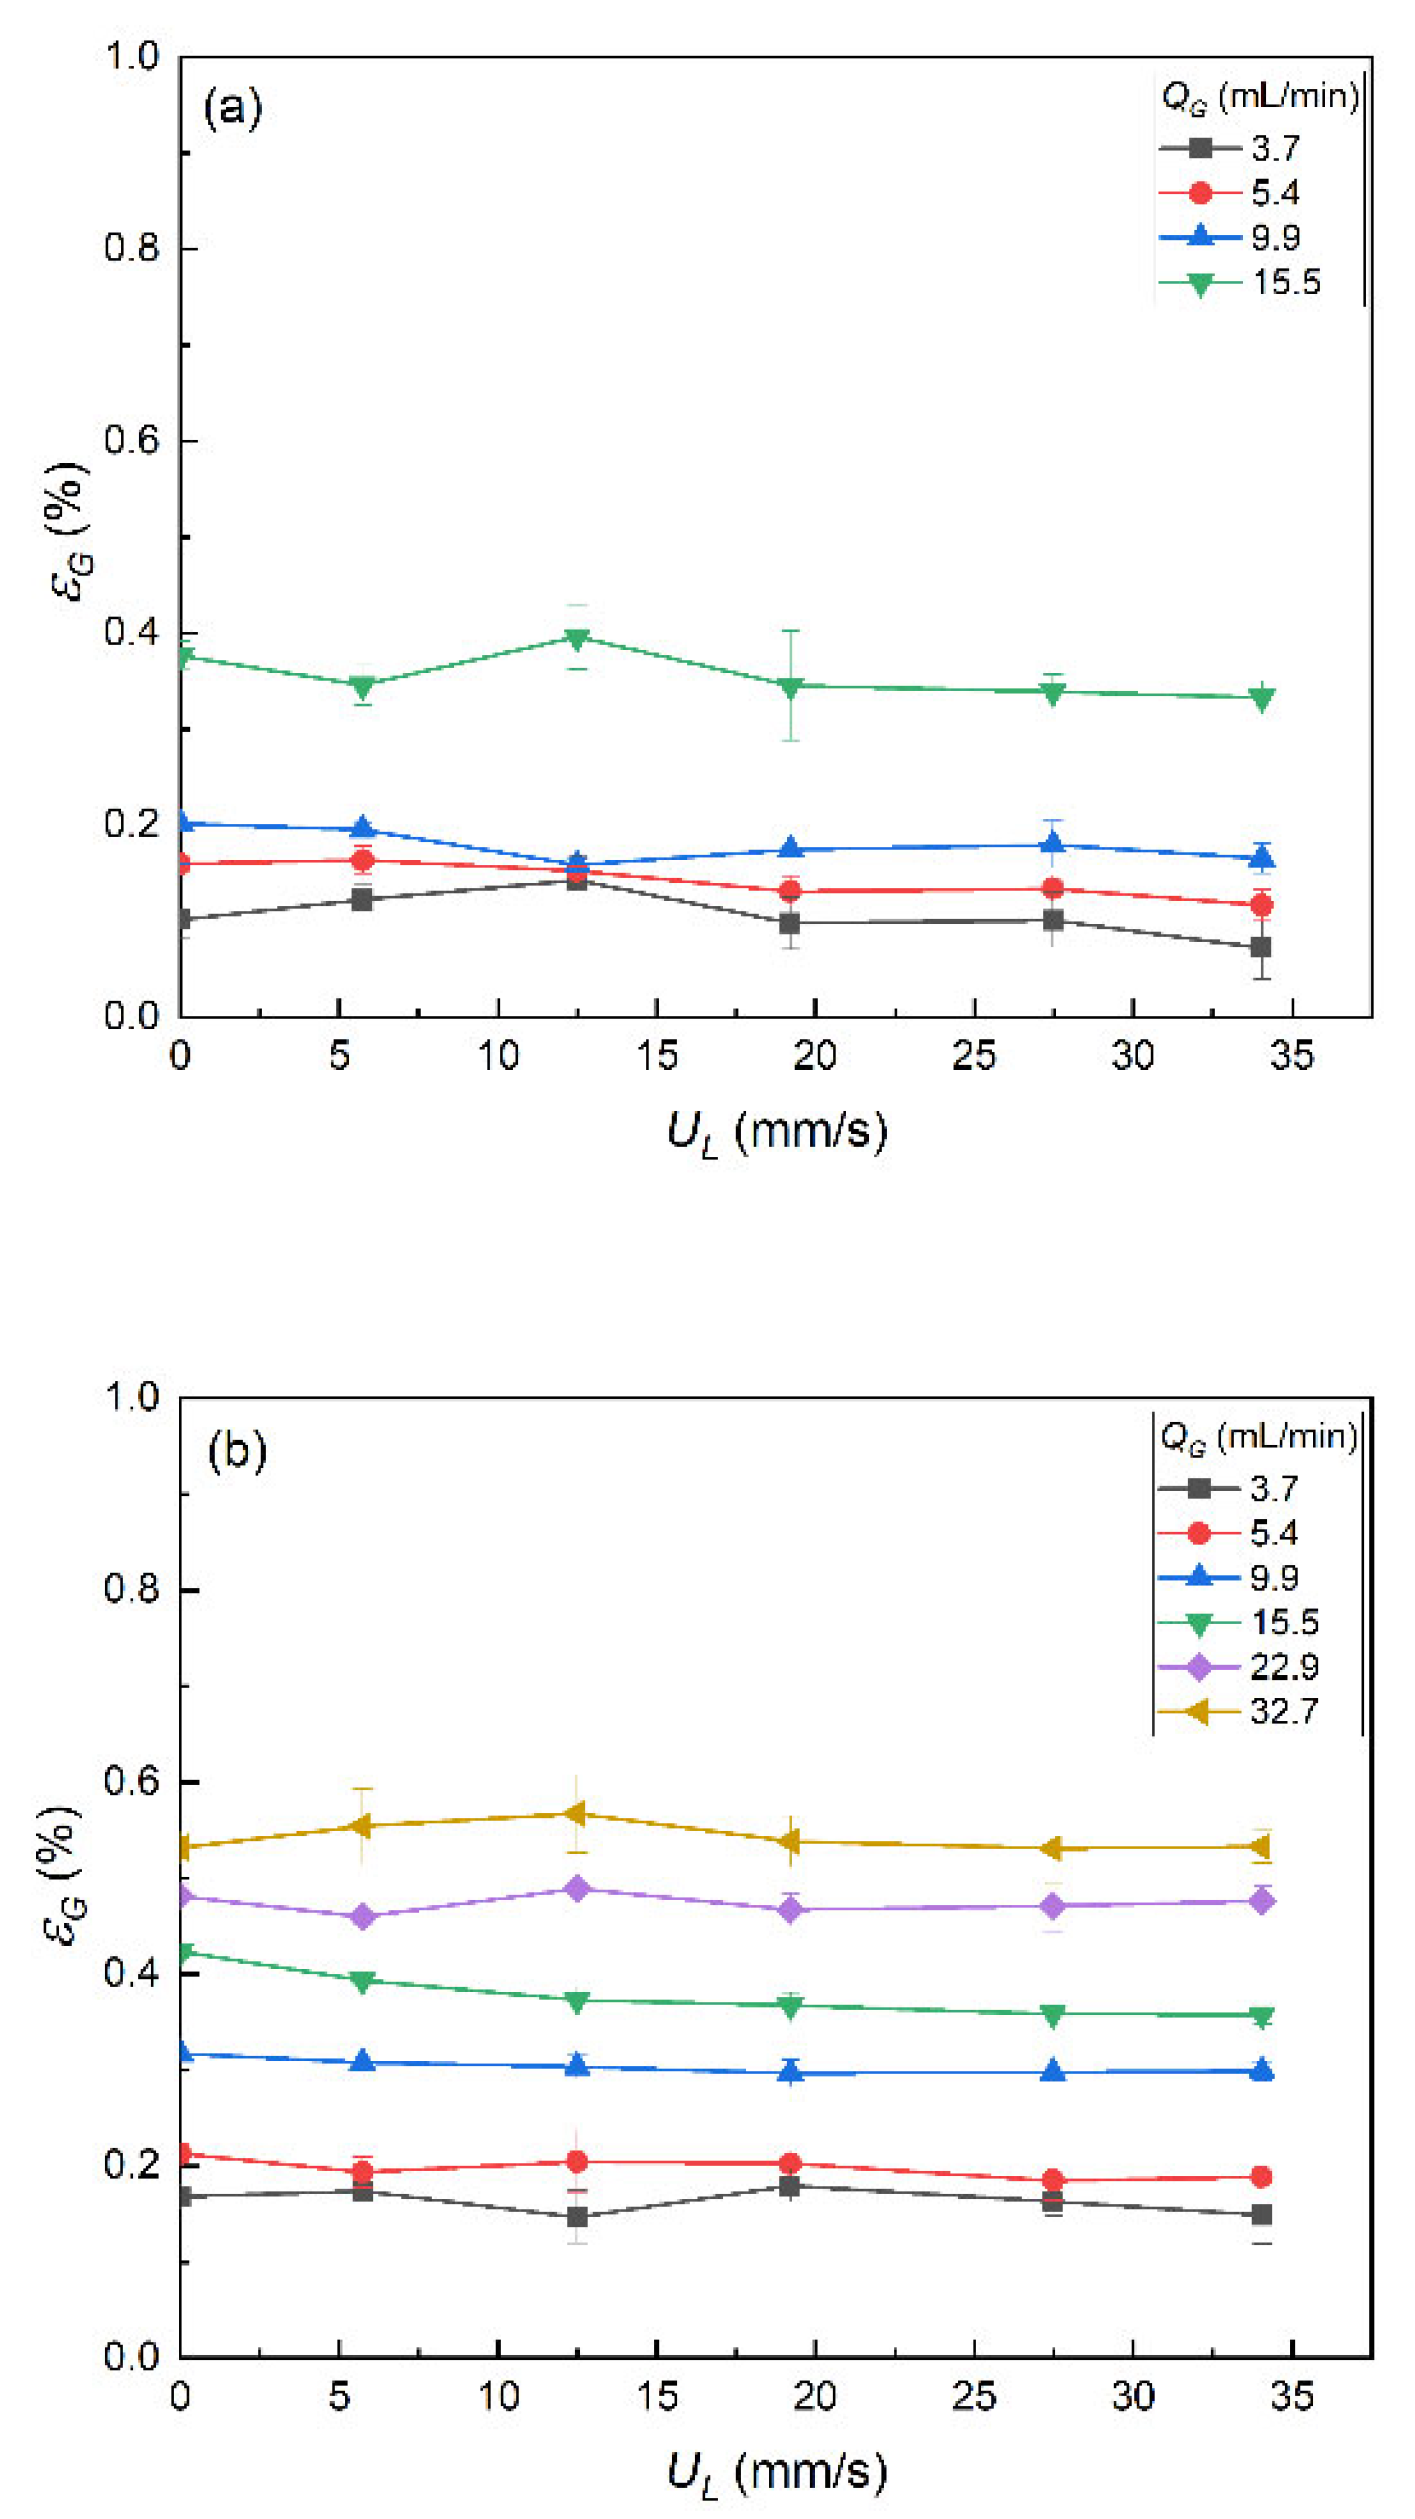
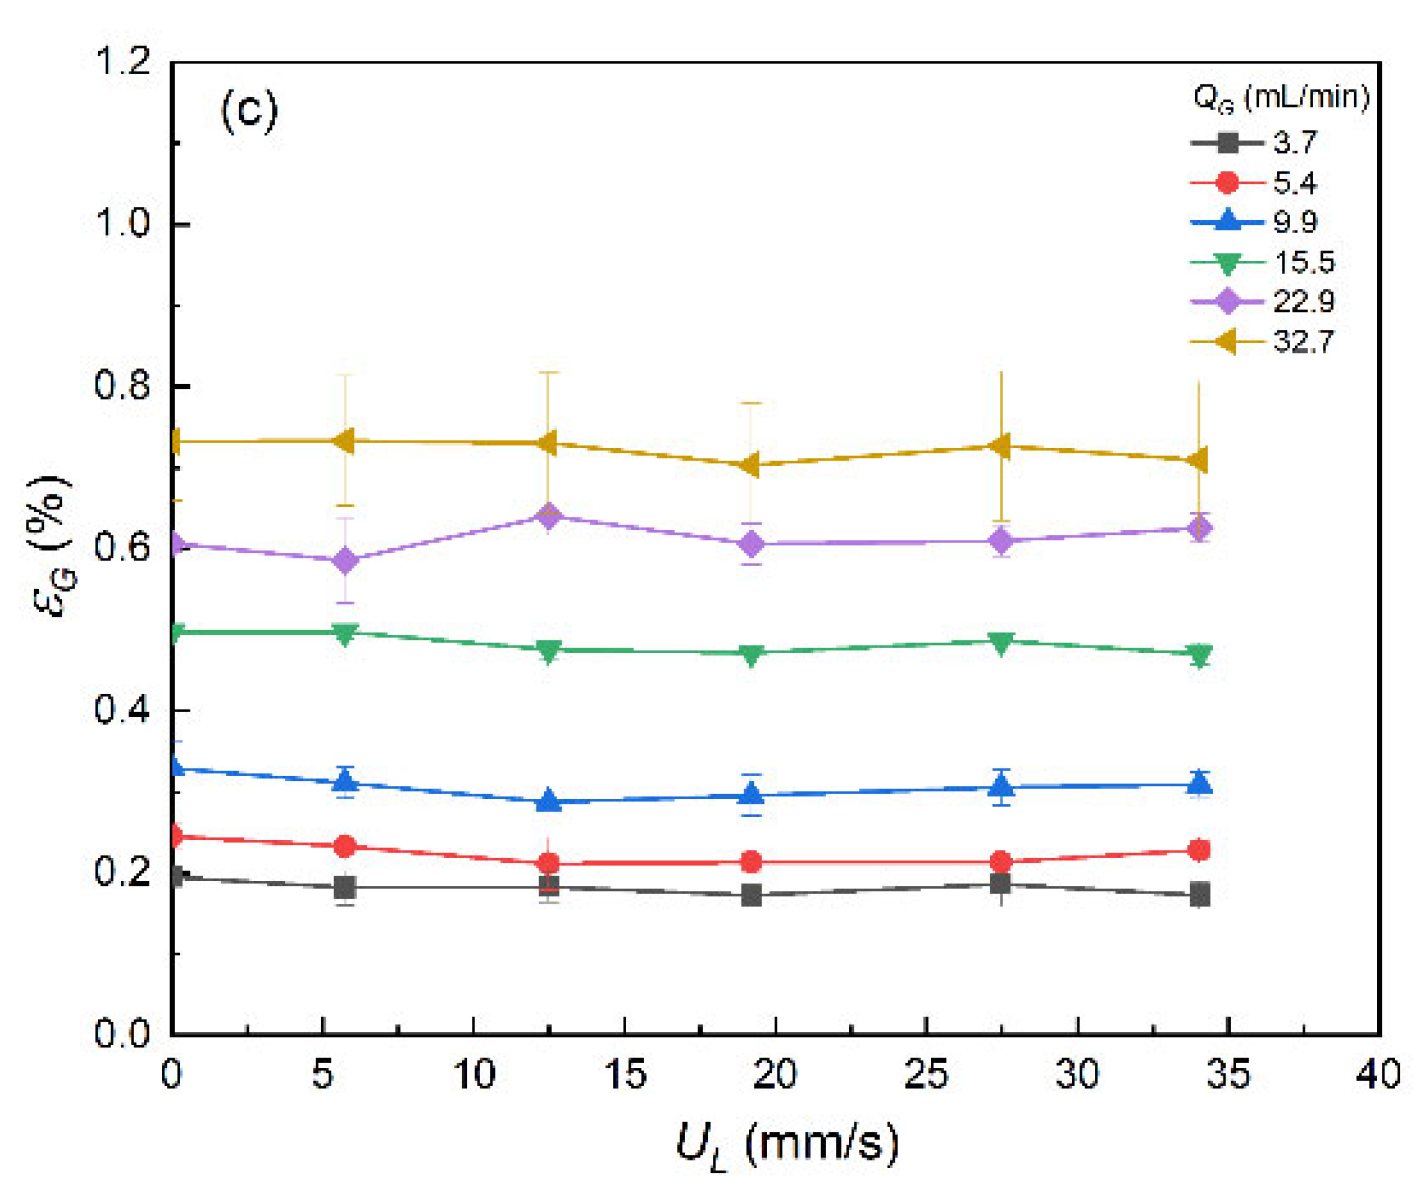
Figure 8.
Fluidization regime changes with the increasing superficial liquid velocity in particles fluidization: (a) UL = 0 mm/s, (b) UL = 2.3 mm/s, (c) UL = 5.4 mm/s, (d) UL = 8.7 mm/s, (e) UL = 12.0 mm/s, (f) UL = 15.1 mm/s, (g) UL = 18.1 mm/s, (h) UL = 21.1 mm/s, (i) UL = 22.0 mm/s.
Figure 8.
Fluidization regime changes with the increasing superficial liquid velocity in particles fluidization: (a) UL = 0 mm/s, (b) UL = 2.3 mm/s, (c) UL = 5.4 mm/s, (d) UL = 8.7 mm/s, (e) UL = 12.0 mm/s, (f) UL = 15.1 mm/s, (g) UL = 18.1 mm/s, (h) UL = 21.1 mm/s, (i) UL = 22.0 mm/s.
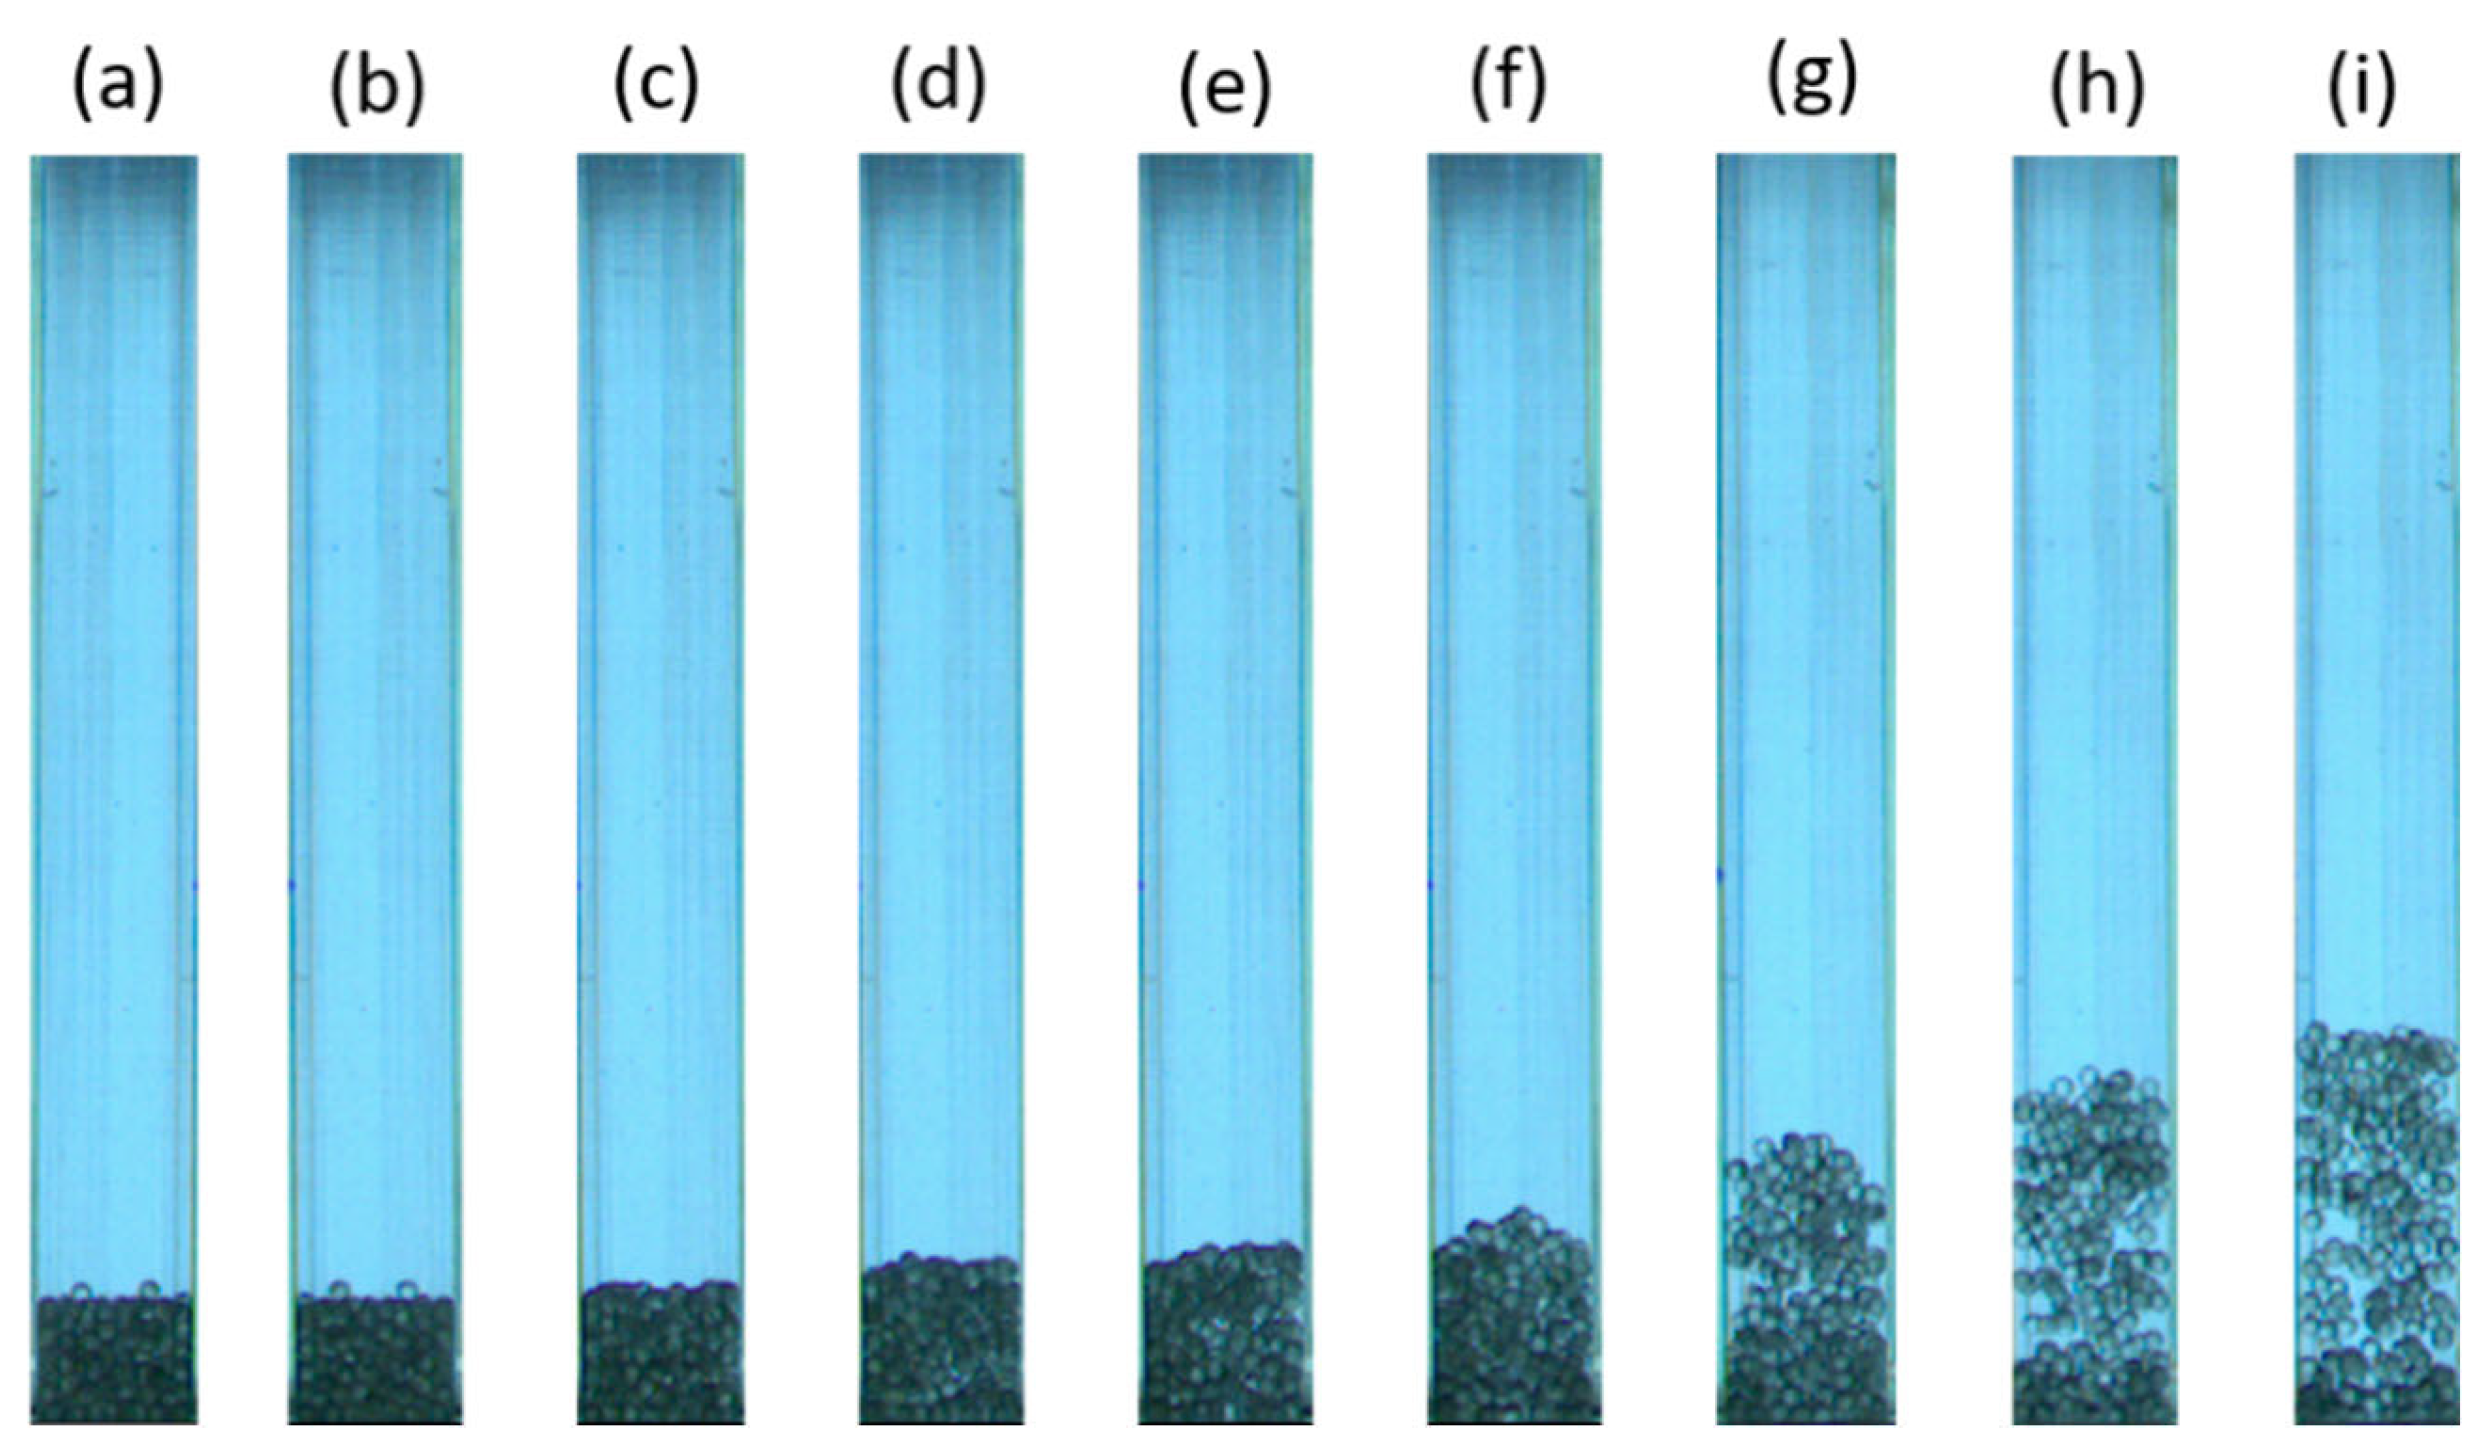
Figure 9.
Fluidization regime changes with the increasing superficial liquid velocity in pellet fluidization: (a) UL = 0 mm/s, (b) UL = 1.2 mm/s, (c) UL = 2.6 mm/s, (d) UL = 3.9 mm/s, (e) UL = 4.5 mm/s, (f) UL = 5.7 mm/s, (g) UL = 7.0 mm/s [40].
Figure 9.
Fluidization regime changes with the increasing superficial liquid velocity in pellet fluidization: (a) UL = 0 mm/s, (b) UL = 1.2 mm/s, (c) UL = 2.6 mm/s, (d) UL = 3.9 mm/s, (e) UL = 4.5 mm/s, (f) UL = 5.7 mm/s, (g) UL = 7.0 mm/s [40].
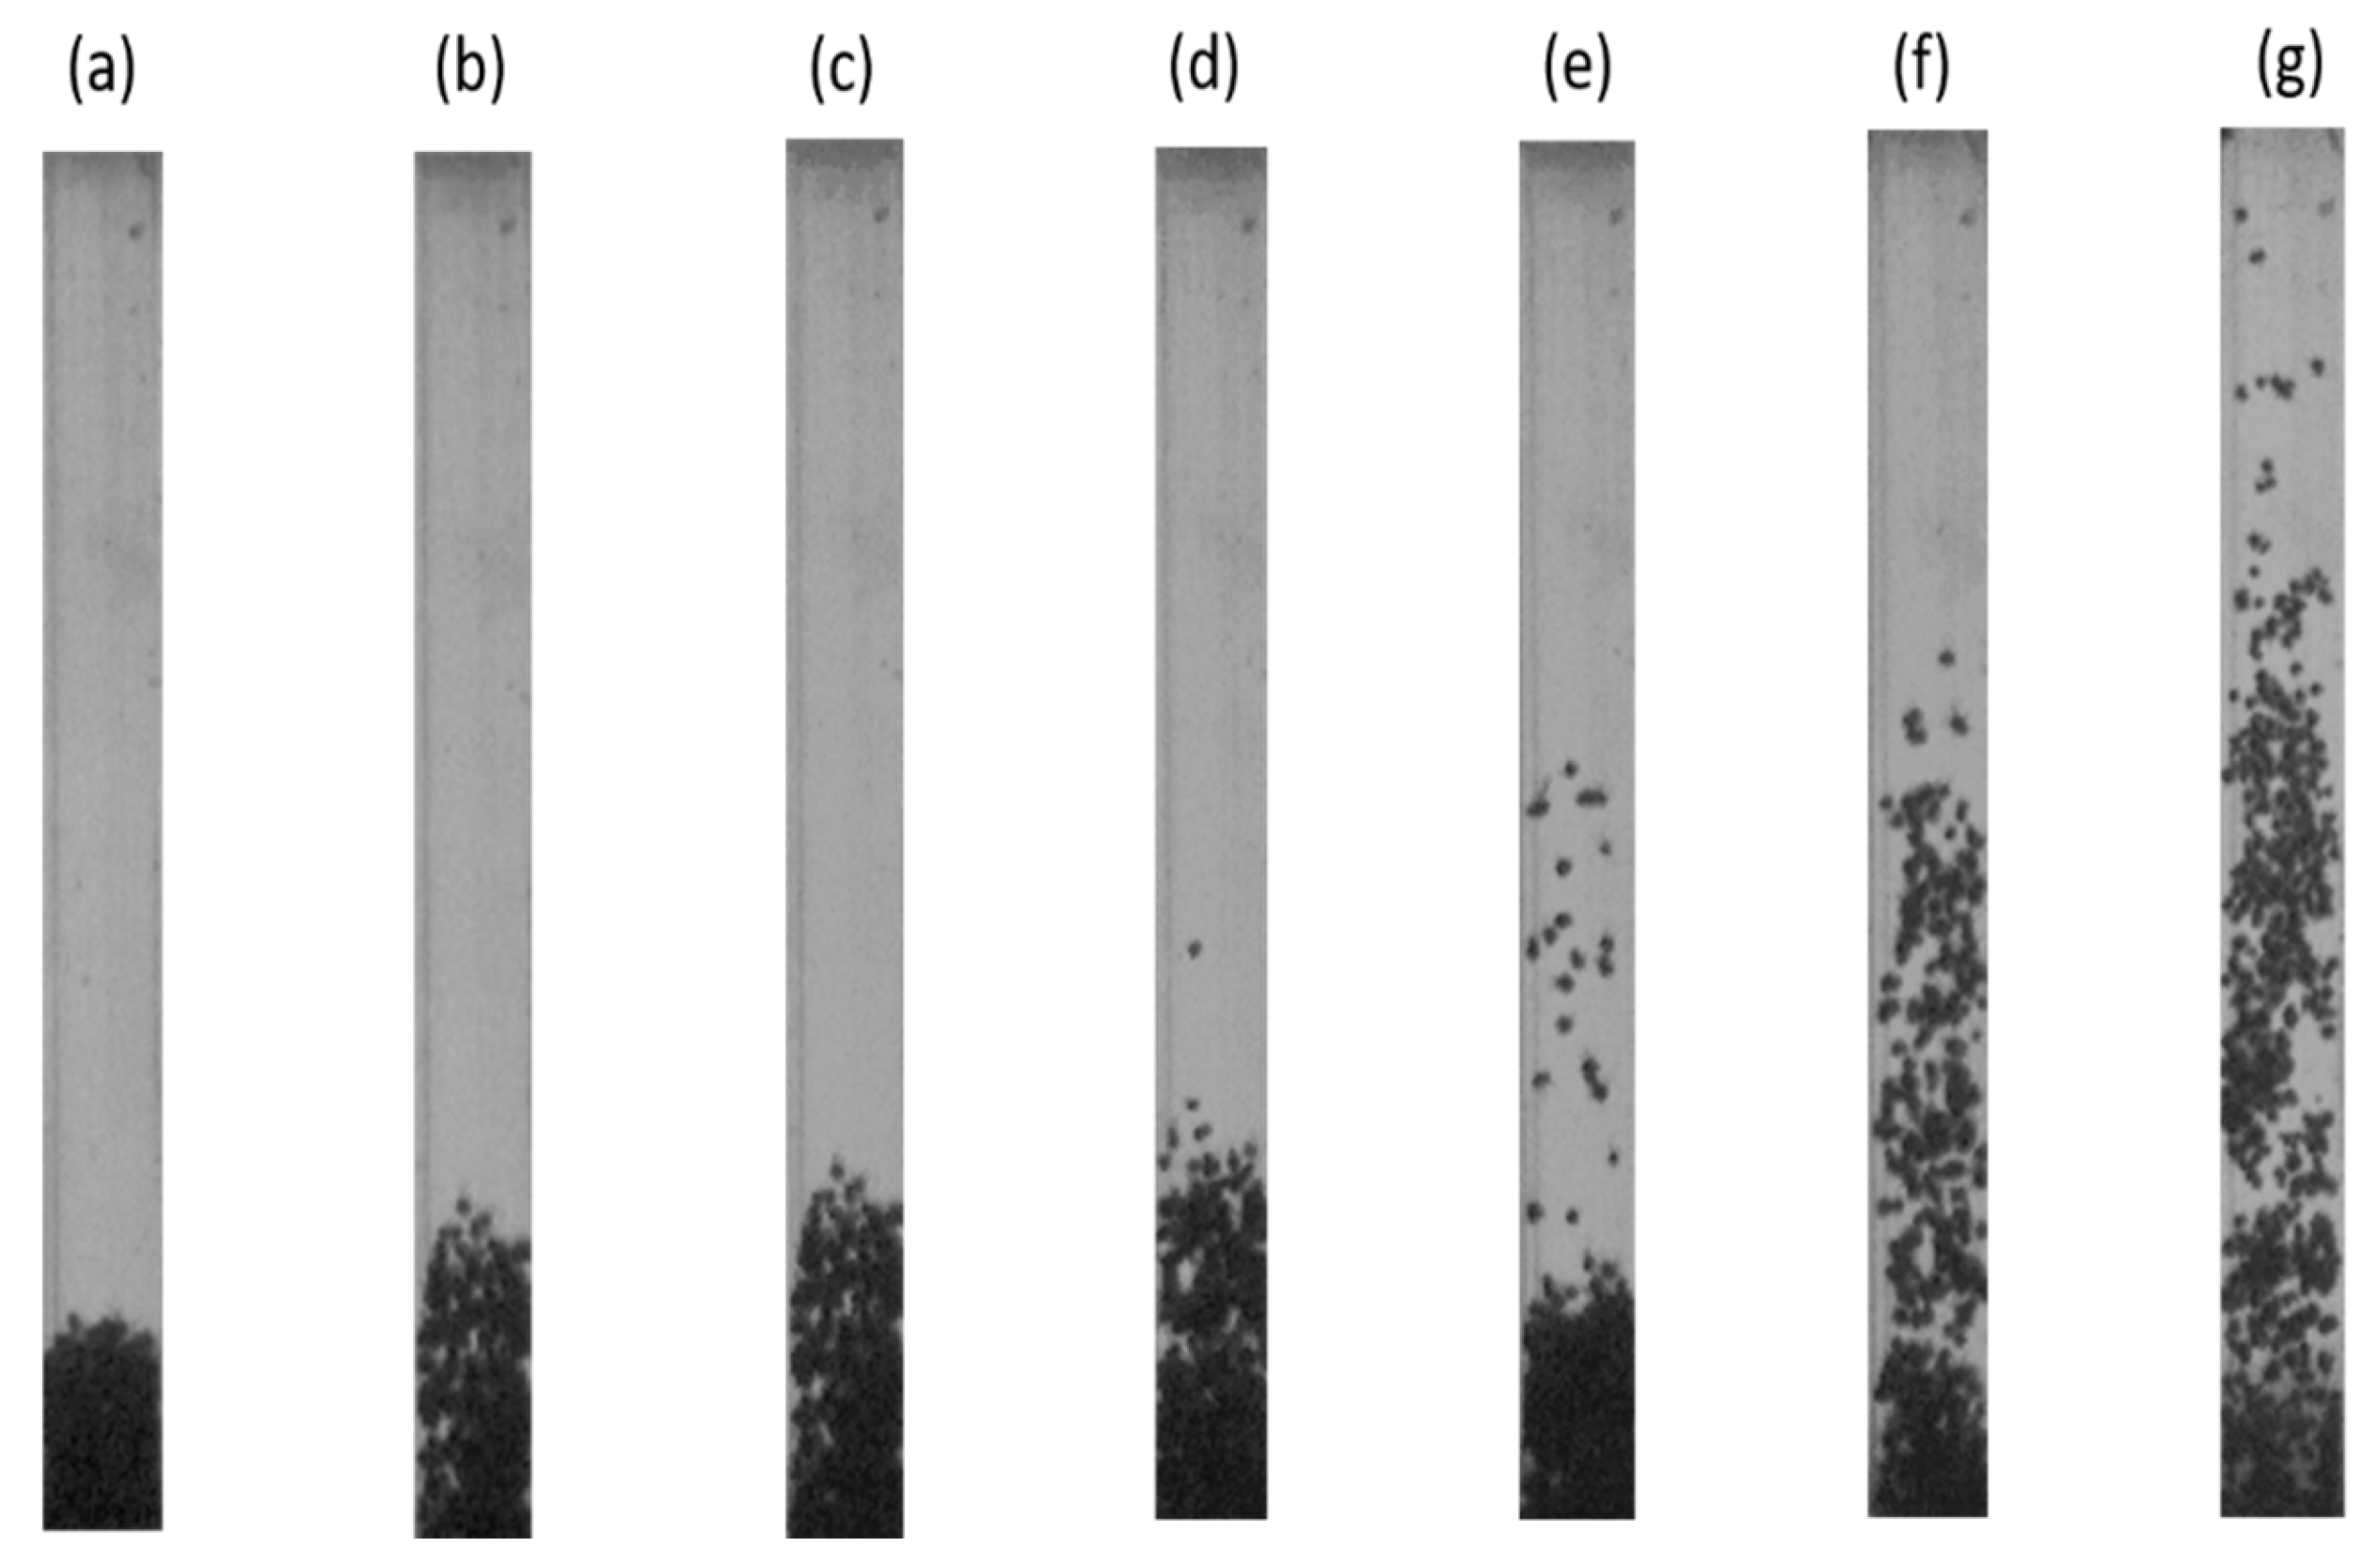
Figure 10.
Comparison of the bed height ratio as a function of superficial liquid velocity, UL, for 3D-printedr particles and fungal pellets.
Figure 10.
Comparison of the bed height ratio as a function of superficial liquid velocity, UL, for 3D-printedr particles and fungal pellets.
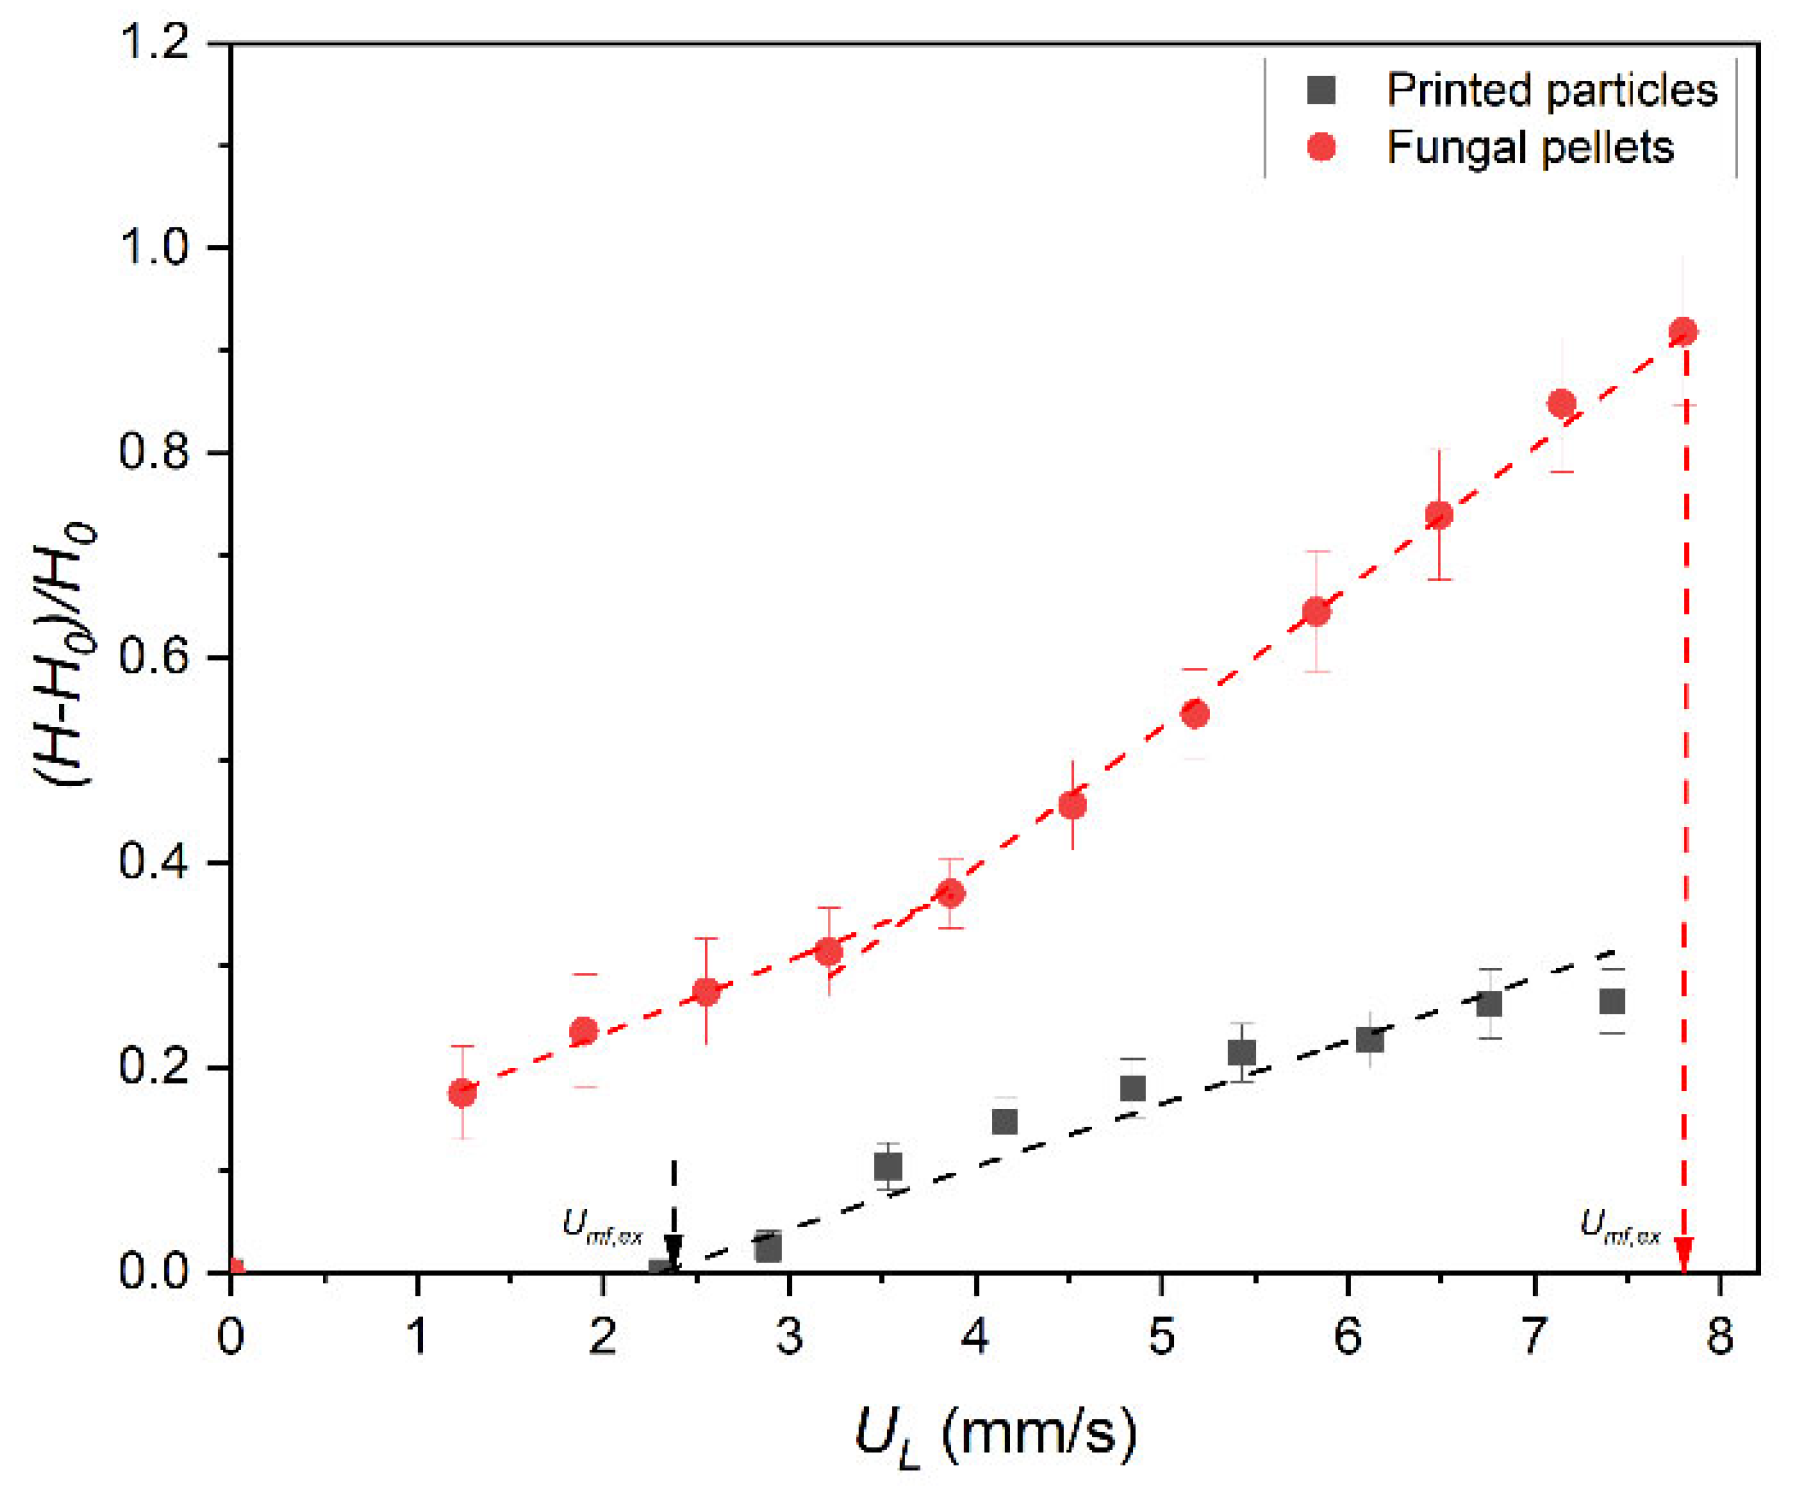
Figure 11.
R–Z relationships based on bed expansion characteristics for 3D-printed particles and fungal pellets.
Figure 11.
R–Z relationships based on bed expansion characteristics for 3D-printed particles and fungal pellets.

Figure 12.
Representative snapshots of different flow regimes for fungal pellets fluidization with increasing gas flowrate: (a) QG = 9.9 mL/min, (b) QG = 22.9 mL/min, (c) QG = 43.8 mL/min [40].
Figure 12.
Representative snapshots of different flow regimes for fungal pellets fluidization with increasing gas flowrate: (a) QG = 9.9 mL/min, (b) QG = 22.9 mL/min, (c) QG = 43.8 mL/min [40].

Table 1.
Details of the solid phases used in liquid–solid fluidization study.
| Materials | Density (g/cm3) | Diameter (mm) | Sphericity |
|---|---|---|---|
| Printed particles | 1.20 ± 0.02 | 2.0 | 0.99 |
| Fungal pellets | 1.09 ± 0.09 | 1.80 ± 0.55 | 0.82 ± 0.12 |
Publisher’s Note: MDPI stays neutral with regard to jurisdictional claims in published maps and institutional affiliations. |
© 2021 by the authors. Licensee MDPI, Basel, Switzerland. This article is an open access article distributed under the terms and conditions of the Creative Commons Attribution (CC BY) license (https://creativecommons.org/licenses/by/4.0/).
Share and Cite
MDPI and ACS Style
Zhang, Y.; Goh, K.-L.; Ng, Y.-L.; Chow, Y.; Zivkovic, V. Design and Investigation of a 3D-Printed Micro-Fluidized Bed. ChemEngineering 2021, 5, 62. https://doi.org/10.3390/chemengineering5030062
AMA Style
Zhang Y, Goh K-L, Ng Y-L, Chow Y, Zivkovic V. Design and Investigation of a 3D-Printed Micro-Fluidized Bed. ChemEngineering. 2021; 5(3):62. https://doi.org/10.3390/chemengineering5030062
Chicago/Turabian StyleZhang, Yi, Kheng-Lim Goh, Yuen-Ling Ng, Yvonne Chow, and Vladimir Zivkovic. 2021. "Design and Investigation of a 3D-Printed Micro-Fluidized Bed" ChemEngineering 5, no. 3: 62. https://doi.org/10.3390/chemengineering5030062