Dry Reforming of Methane over a Ruthenium/Carbon Nanotube Catalyst


1
Otto H. York Department of Chemical and Materials Engineering, New Jersey Institute of Technology, Newark, NJ 07102, USA
2
Department of Chemistry and Environmental Science, New Jersey Institute of Technology, Newark, NJ 07102, USA
*
Authors to whom correspondence should be addressed.
ChemEngineering 2020, 4(1), 16; https://doi.org/10.3390/chemengineering4010016
Submission received: 23 January 2020
/
Revised: 26 February 2020
/
Accepted: 4 March 2020
/
Published: 9 March 2020
(This article belongs to the Special Issue Advanced Functional Low-dimensional Materials and Their Applications)
Abstract
:In this study, CH4 dry reforming was demonstrated on a novel microwave-synthesized ruthenium (Ru)/carbon nanotube (CNT) catalyst. The catalyst was tested in an isothermal laboratory-packed bed reactor, with gas analysis by gas chromatography/thermal conductivity detection. The catalyst demonstrated excellent dry-reforming activity at modest temperatures (773–973 K) and pressure (3.03 × 10⁵ Pa). Higher reaction temperatures favored increased conversion of CH4 and CO2, and increased H2/CO product ratios. Slight coke deposition, estimated by carbon balance, was observed at higher temperatures and higher feed CH4/CO2. A robust global kinetic model composed of three reversible reactions—dry reforming, reverse water gas shift, and CH4 decomposition—simulates observed outlet species concentrations and reactant conversions using this Ru/CNT catalyst over the temperature range of this study. This engineering kinetic model for the Ru/CNT catalyst predicts a somewhat higher selectivity and yield for H2, and less for CO, in comparison to previously published results for a similarly prepared Pt_Pd/CNT catalyst from our group.
1. Introduction
Because of enhanced petroleum production by hydraulic fracturing, vast quantities of co-produced natural gas are flared annually worldwide [1,2]. In Texas, for example, a lack of sufficient gas pipeline capacity has severely depressed local natural gas market prices, resulting in negative prices and more flaring [3]. In addition to flaring, there is also concern for fugitive CH4 emissions associated with petroleum production [4]. Methane has a global warming potential 30 times higher than CO2 [5].
Methane dry reforming (DR) (overall: CH4 + CO2 → 2CO + 2H2, ∆H298K = 2.473 × 10⁵ J) would remove two greenhouse gases while generating useful synthesis gas (H2, CO) as a chemical feedstock [6,7,8], especially for important chemicals such as ammonia and methanol, and for Fischer–Tropsch liquids [9,10]. The energy needed for the reforming can be supplied by burning some of the CH4. The CO2 can be trucked in, especially from sequestration sources. While this scheme does not ultimately eliminate the greenhouse gases, it does provide some useful return in the form of fuels and/or chemicals. Alternatively, the DR could be solar powered [11].
Typical heterogeneous DR catalysts use inorganic oxide supports; e.g., Al2O3, SiO2, TiO2 [6,12,13,14]. The active sites fall into two groups. First are base-metals, including Fe, Co, and Ni [6,12,13]. The Ni is widely studied since it is catalytically active and cheap. However, the Ni catalyst sinters at common DR reaction temperatures (800–1100 K), and has a relatively weak coking resistance [6,13]. Cobalt offers an improved coking resistance compared to Ni [15]. In a recent development [16], a highly stable and coke-resistant catalyst composed of Mo-doped Ni nanoparticles on a MgO support was demonstrated for high DR activity.
The second active site group consists of noble metals, commonly Rh, Ru, Pt, Pd, and Ir [6,14,17]. Although expensive, noble metal catalysts resist coking, sinter less, and are more active for higher-temperature applications.
A potentially useful support for DR catalysts is carbon nanotubes (CNTs). The CNTs are one-dimensional cylindrical structures consisting of wrapped single or multi-layer graphene sheets [18]. Its special structure results in excellent thermal and electrical conductivities, high mechanical strength, large surface area, relatively high oxidation stability, surface chemical flexibility and porous structure [19].
The advantages of CNTs as catalyst supports for a number of heterogeneous catalysis processes have been identified. Dry reforming of CH4 over Ni/CNT and Ni/SiO2 catalysts produced approximately the same conversions, but Ni/CNT showed much better stability. This was attributed to a redirection of carbon deposits away from the Ni sites to growth along the CNT tips [20]. Dry reforming of CH4 over Co/CNT and Co/MgO showed higher CH4 conversions from Co/CNT, which also had lower carbon deposition rates and less catalyst deactivation [21].
In this work, Ru supported on a CNT catalyst was synthesized by a versatile microwave technique, and then tested for methane DR activity. There is no current literature on the use of Ru (as the sole metal) on CNT used as DR catalyst for CH4. Observed data are compared against equilibrium. An engineering model, useful for calculations such as reactor design, and based on three global reactions, adequately represents the DR data.
2. Materials and Methods
2.1. Carbon Nanotubes
The multi-walled carbon nanotubes (Cheap Tubes Inc., Cambridgeport, VT, USA) used were 10–30 × 10−6 m length by 20-30 × 10−9 m outer diameter. Other compounds used in the synthesis (Sigma-Aldrich) were 95%+ purity. The synthesis strategy begins with CNT functionalization (becoming F-CNTs) with carboxylic acid groups, followed by the addition of Ru.
The Ru/CNT synthesis is described in detail elsewhere [22]. The synthesis begins with CNT carboxylation to enhance dispersibility for the subsequent Ru addition. A known mass of CNTs are dispersed into concentrated H2SO4 + HNO3 (aqueous). The suspension is radiated with microwaves to 413 K for 1200 s, and then cooled (room temperature). Vacuum filtering (10−5 m pore size) follows, with Milli Q water washing to pH ≈ 7. These F-CNTs are then vacuum-dried at 343 K.
The dried F-CNTs are then dispersed in diethylene glycol by sonication. A RuCl3.nH2O, sodium acetate, and Milli Q water mixture is added, followed by more sonication. The new dispersion is processed in the microwave reactor at 473 K for 600 s. It is estimated that a roughly 20% conversion of the Ru starting material occurs. Upon cooling, the mass is vacuum filtered and ethanol-washed. The Ru/CNT are finally vacuum-dried at 343 K to a constant mass.
2.2. Catalyst Testing System
The apparatus used for the Ru/CNT catalysis testing is described elsewhere [23,24]. The CH4, CO2, and diluent He flow rates were set by calibrated mass flow controllers. Catalyst was uploaded into the fritted metal cup of a 6.35 × 10⁻³ m stainless steel Swagelok (Nupro) in-line filter. The stainless steel tube assembly was placed in a 3-zone electric furnace. Results presented elsewhere [23] show that the steel reactor vessel was inert during these DR experiments.
The on-line gas analysis was performed with a model 5890 Hewlett-Packard gas chromatograph/thermal conductivity detector (GC/TCD) fed through a gas sample loop and valve. The pressure in the reactor flow system was monitored and manually controlled. The operator alternately directed feed (bypass) or reactor effluent to the on-line GC/TCD.
In this DR research, the inlet CH4 and CO2 were diluted by 85% He, resulting in approximately constant total molar flow rate. The experimental CH4, CO, CO2 mole fractions allowed atomic carbon balances, and estimates of any carbon deposits. These data also facilitated H and O balances for H2 and H2O concentrations. Where feasible, H2 levels determined this way were verified by the GC/TCD data for H2.
System pressure was kept constant (3.03 × 10⁵ Pa, abs.). Temperatures studied were 773–973 K, while the molar CH4/CO2 feed ratio was 0.5–2.0. Most runs were at constant total inlet rate (1.12 × 10⁻⁶ std. m3/s). Total catalyst mass was 0.002 kg (0.0004 kg Ru/CNTs, 0.0016 kg Y-zeolite). The resulting gas space velocity (GSV) was 5.56 × 10⁻⁴ m3/s-kg. Variable total feed rate experiments were also done at an equimolar feed CH4 and CO2.
3. Results
3.1. Catalyst Characterization
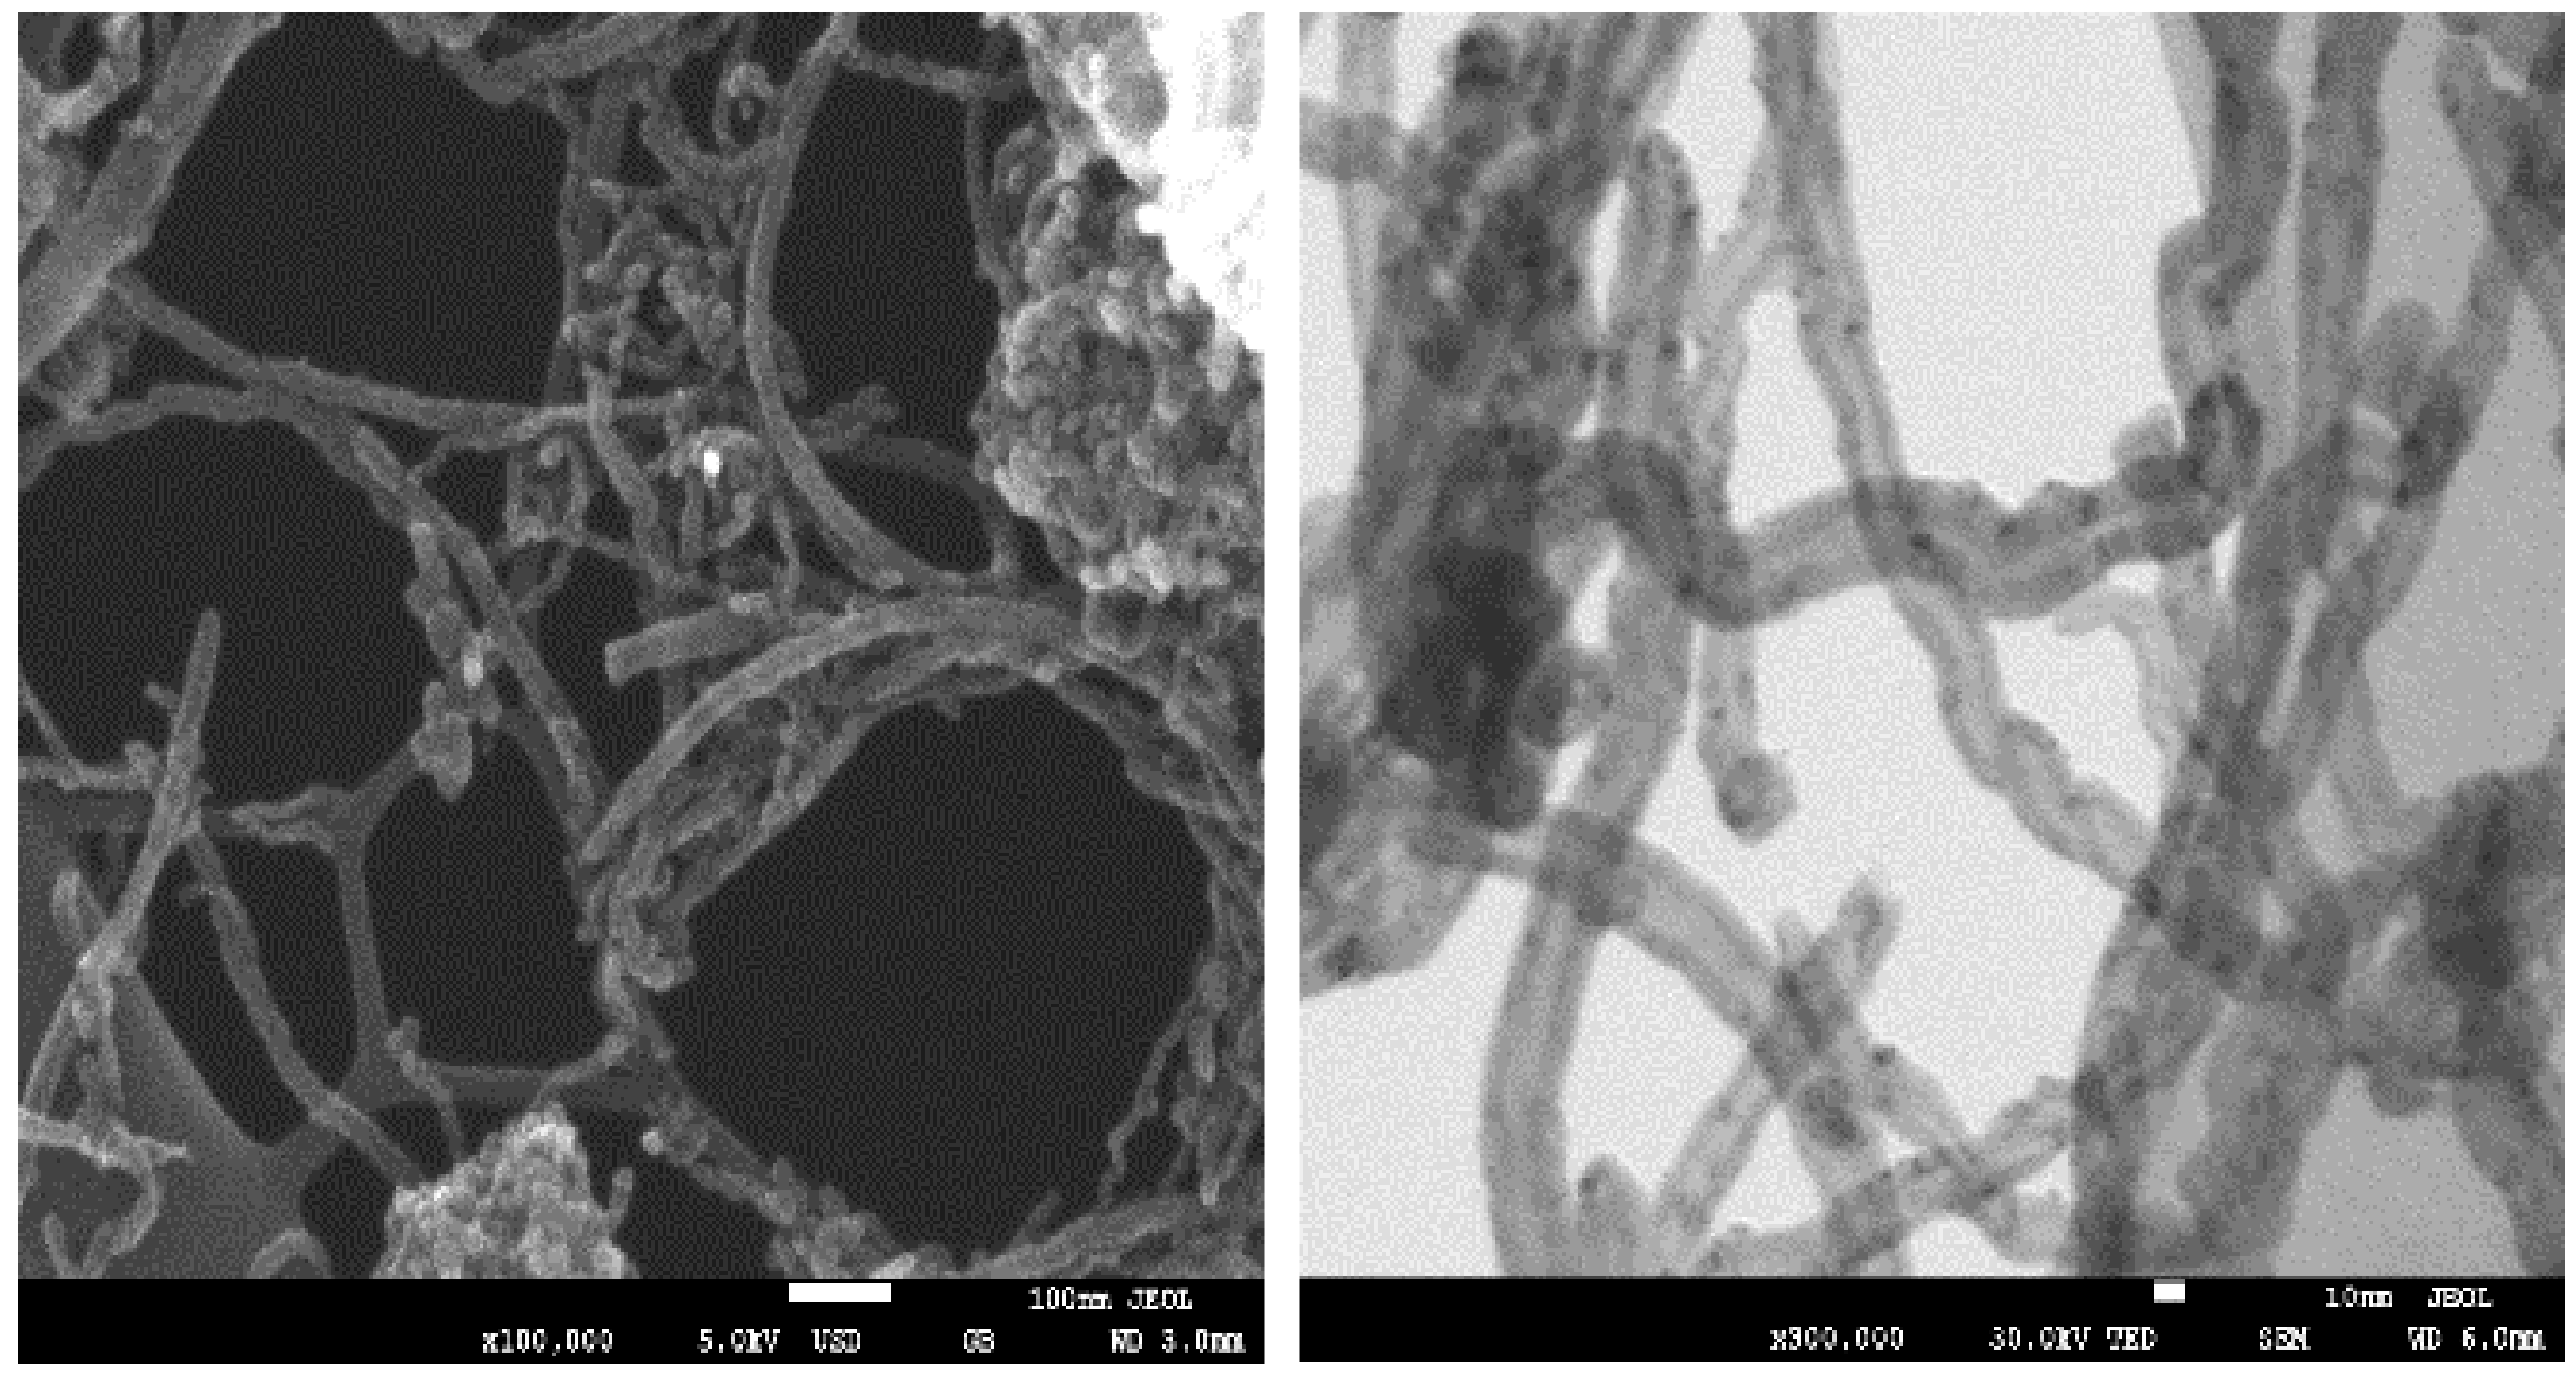
The Ru/CNT was characterized using a scanning electron microscope (SEM, JEM 2800) and a transmission electron microscope (TEM, F2000). Figure 1 (left) shows SEM images of the synthesized Ru/CNT. After Ru deposition, the CNTs are intact with no apparent damage. Close inspection of the TEM image in Figure 1 (right) reveals Ru nanoparticles. Their approximate particle size range is 1–5 × 10⁻⁹ m. Subsequent SEM testing of the catalyst after all the DR runs showed little if any sintering of the Ru.
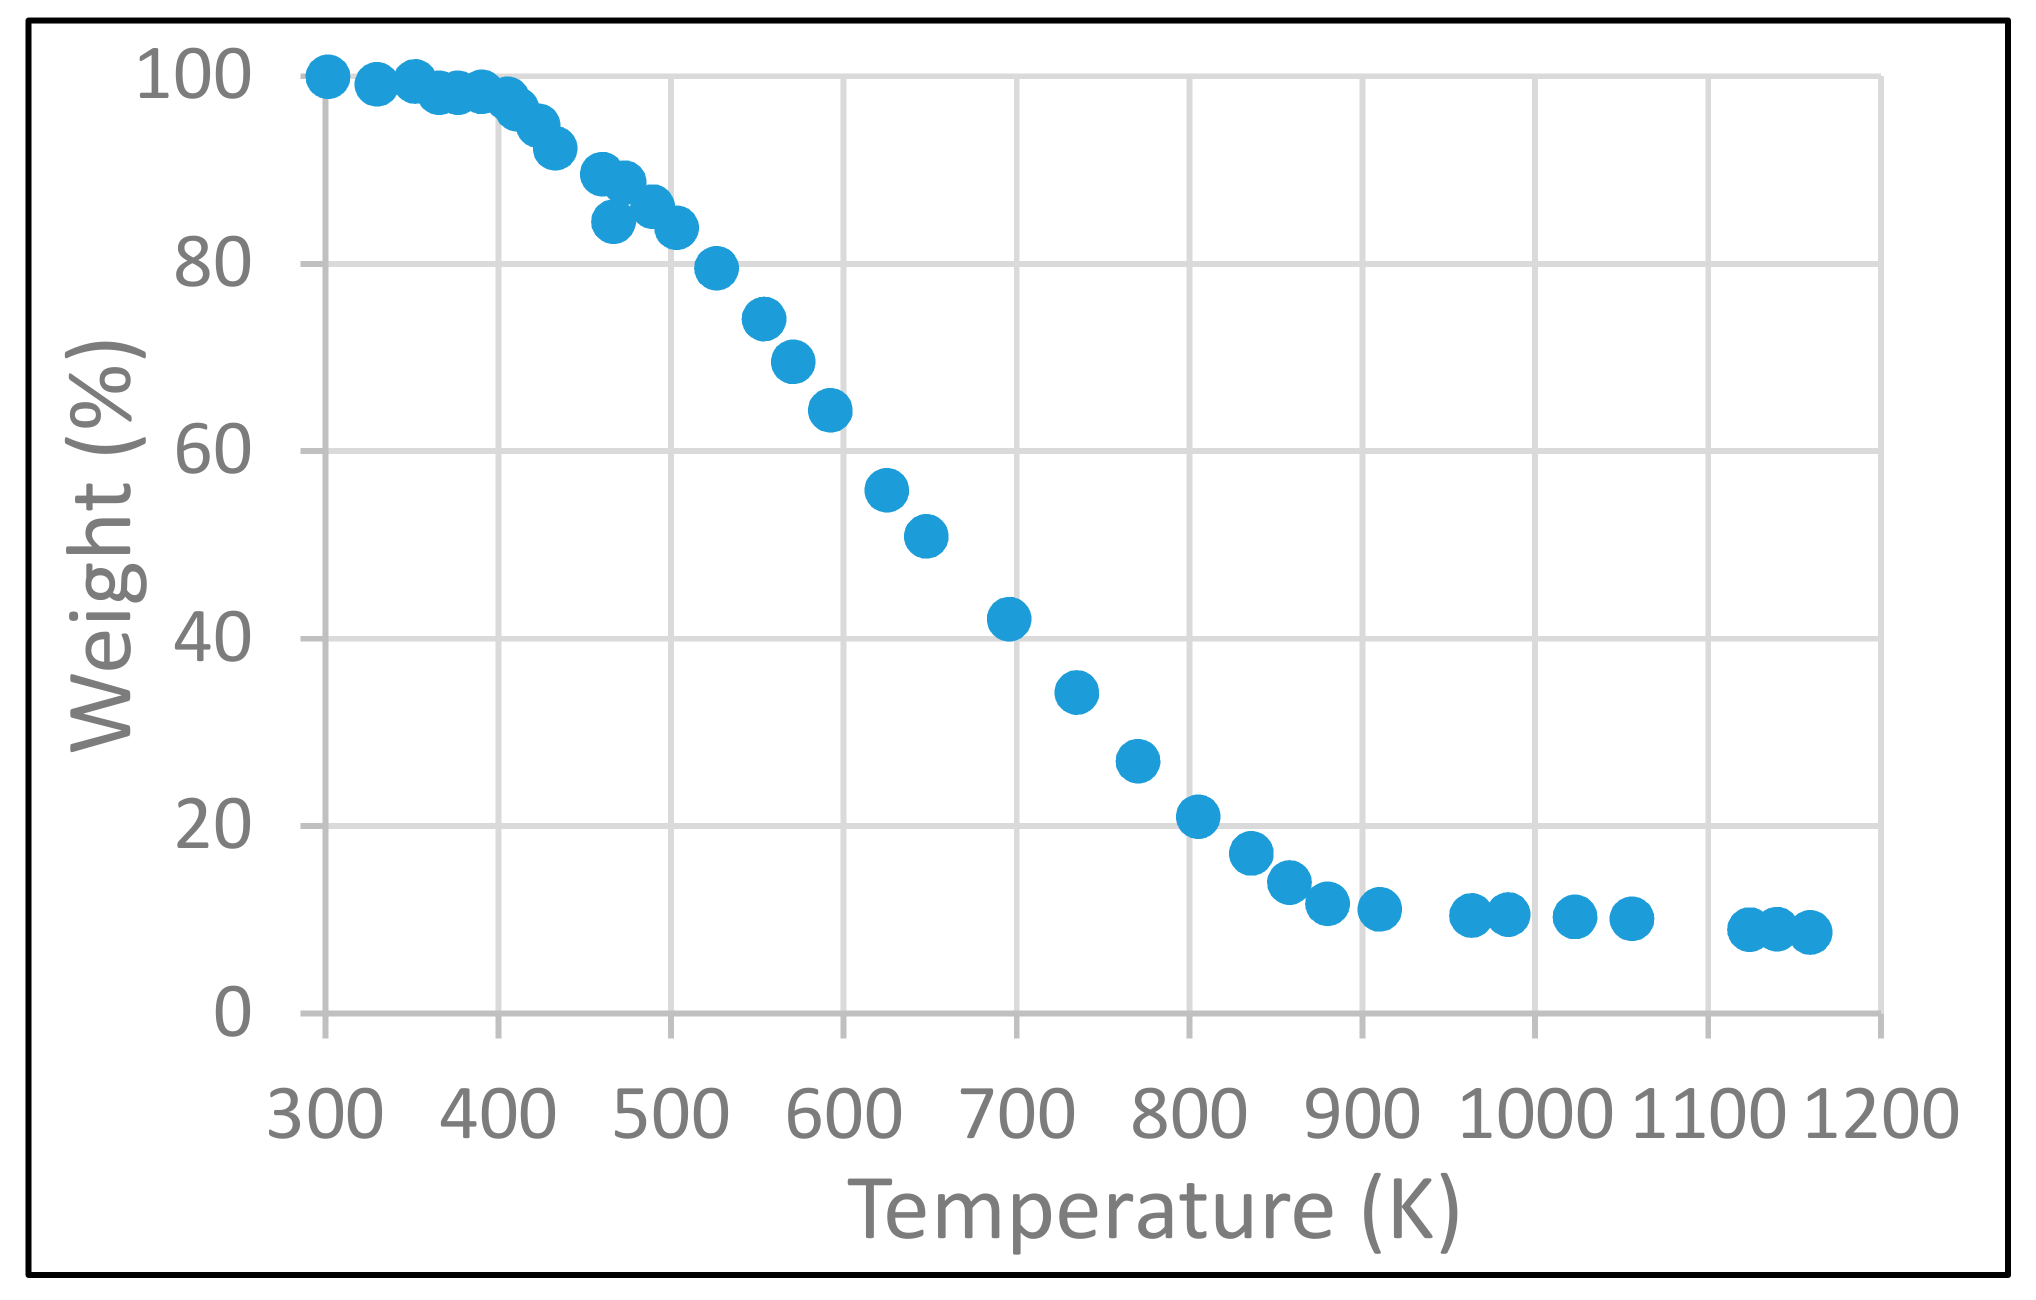
The thermogravimetric analysis (TGA, in air) of our Ru/CNTs is shown in Figure 2. Weight loss in the 403–873 K range is due to Ru/CNT decomposition in air. The 10% remaining mass is likely RuO2. Elemental analysis from energy-dispersive X-ray spectroscopy (EDX) (Table 1) is consistent with this hypothesis.
To extend the physical mass of the solids for ease of handling, the Ru/CNT were mixed with Y-zeolite of similar particle size. The Y-zeolite was the inert Na form, used as delivered (Alfa Aesar, Haverhill, MA, USA) with a 5.5:1 molar ratio SiO2:Al2O3. The solids mixture was 20 wt.% Ru/CNT. Results presented elsewhere [23] show that the added zeolite was effectively inert during our DR experiments. The particles (~3 × 10⁻⁵ m diameter) were small enough to avoid significant external and internal mass transfer resistances (Mears and Weisz-Prater criteria, respectively, as discussed in [23]). Based on CO adsorption and BET surface area tests of the Ru/CNT-zeolite catalyst, the Ru site density was ~9 × 10⁻⁸ moles/m2 [23].
3.2. Modeling
Modeling begins with reaction equilibrium calculations. Then we propose a three reaction global engineering kinetic model calibrated against experimental data.
3.2.1. Equilibrium Calculations
In this study, all experimental runs were tested with the Chemkin-Pro® equilibrium application [25]. The calculation is based on the element-potential method used in Stanjan [26]. The equilibrium composition minimizes total Gibbs Free Energy.
The equilibrium calculation is run with specified temperature (constant), pressure (constant), and feed composition. The allowed equilibrium species are H2, H2O, CO, CO2, CH4, He, and solid carbon (Cs, when allowed—assumed graphite). The Chemkin-Pro database provides the thermodynamic properties of the species.
Table 2 compares the equilibrium simulation results with and without the solid carbon Cs for an experimental case. For a feed where CH4/CO2 = 1, the amount of H2 is roughly about the same in the two cases. However, allowing Cs results in much less equilibrium CH4 and CO. Indeed, Cs is the second largest quantity species after H2, and the equilibrium H2/CO ≥ 1. Without Cs, equilibrium H2/CO < 1. A similarly large impact of Cs in equilibrium was reported elsewhere [27].
3.2.2. Global Kinetic Model
An engineering global kinetic model has the advantage of offering relatively easy calculations for an otherwise complex reaction system. It is not meant to substitute for a detailed elementary reaction mechanism that requires a complex software package such as Chemkin-Pro to evaluate. The global model is a screening tool, and is limited to the region over which it is calibrated.
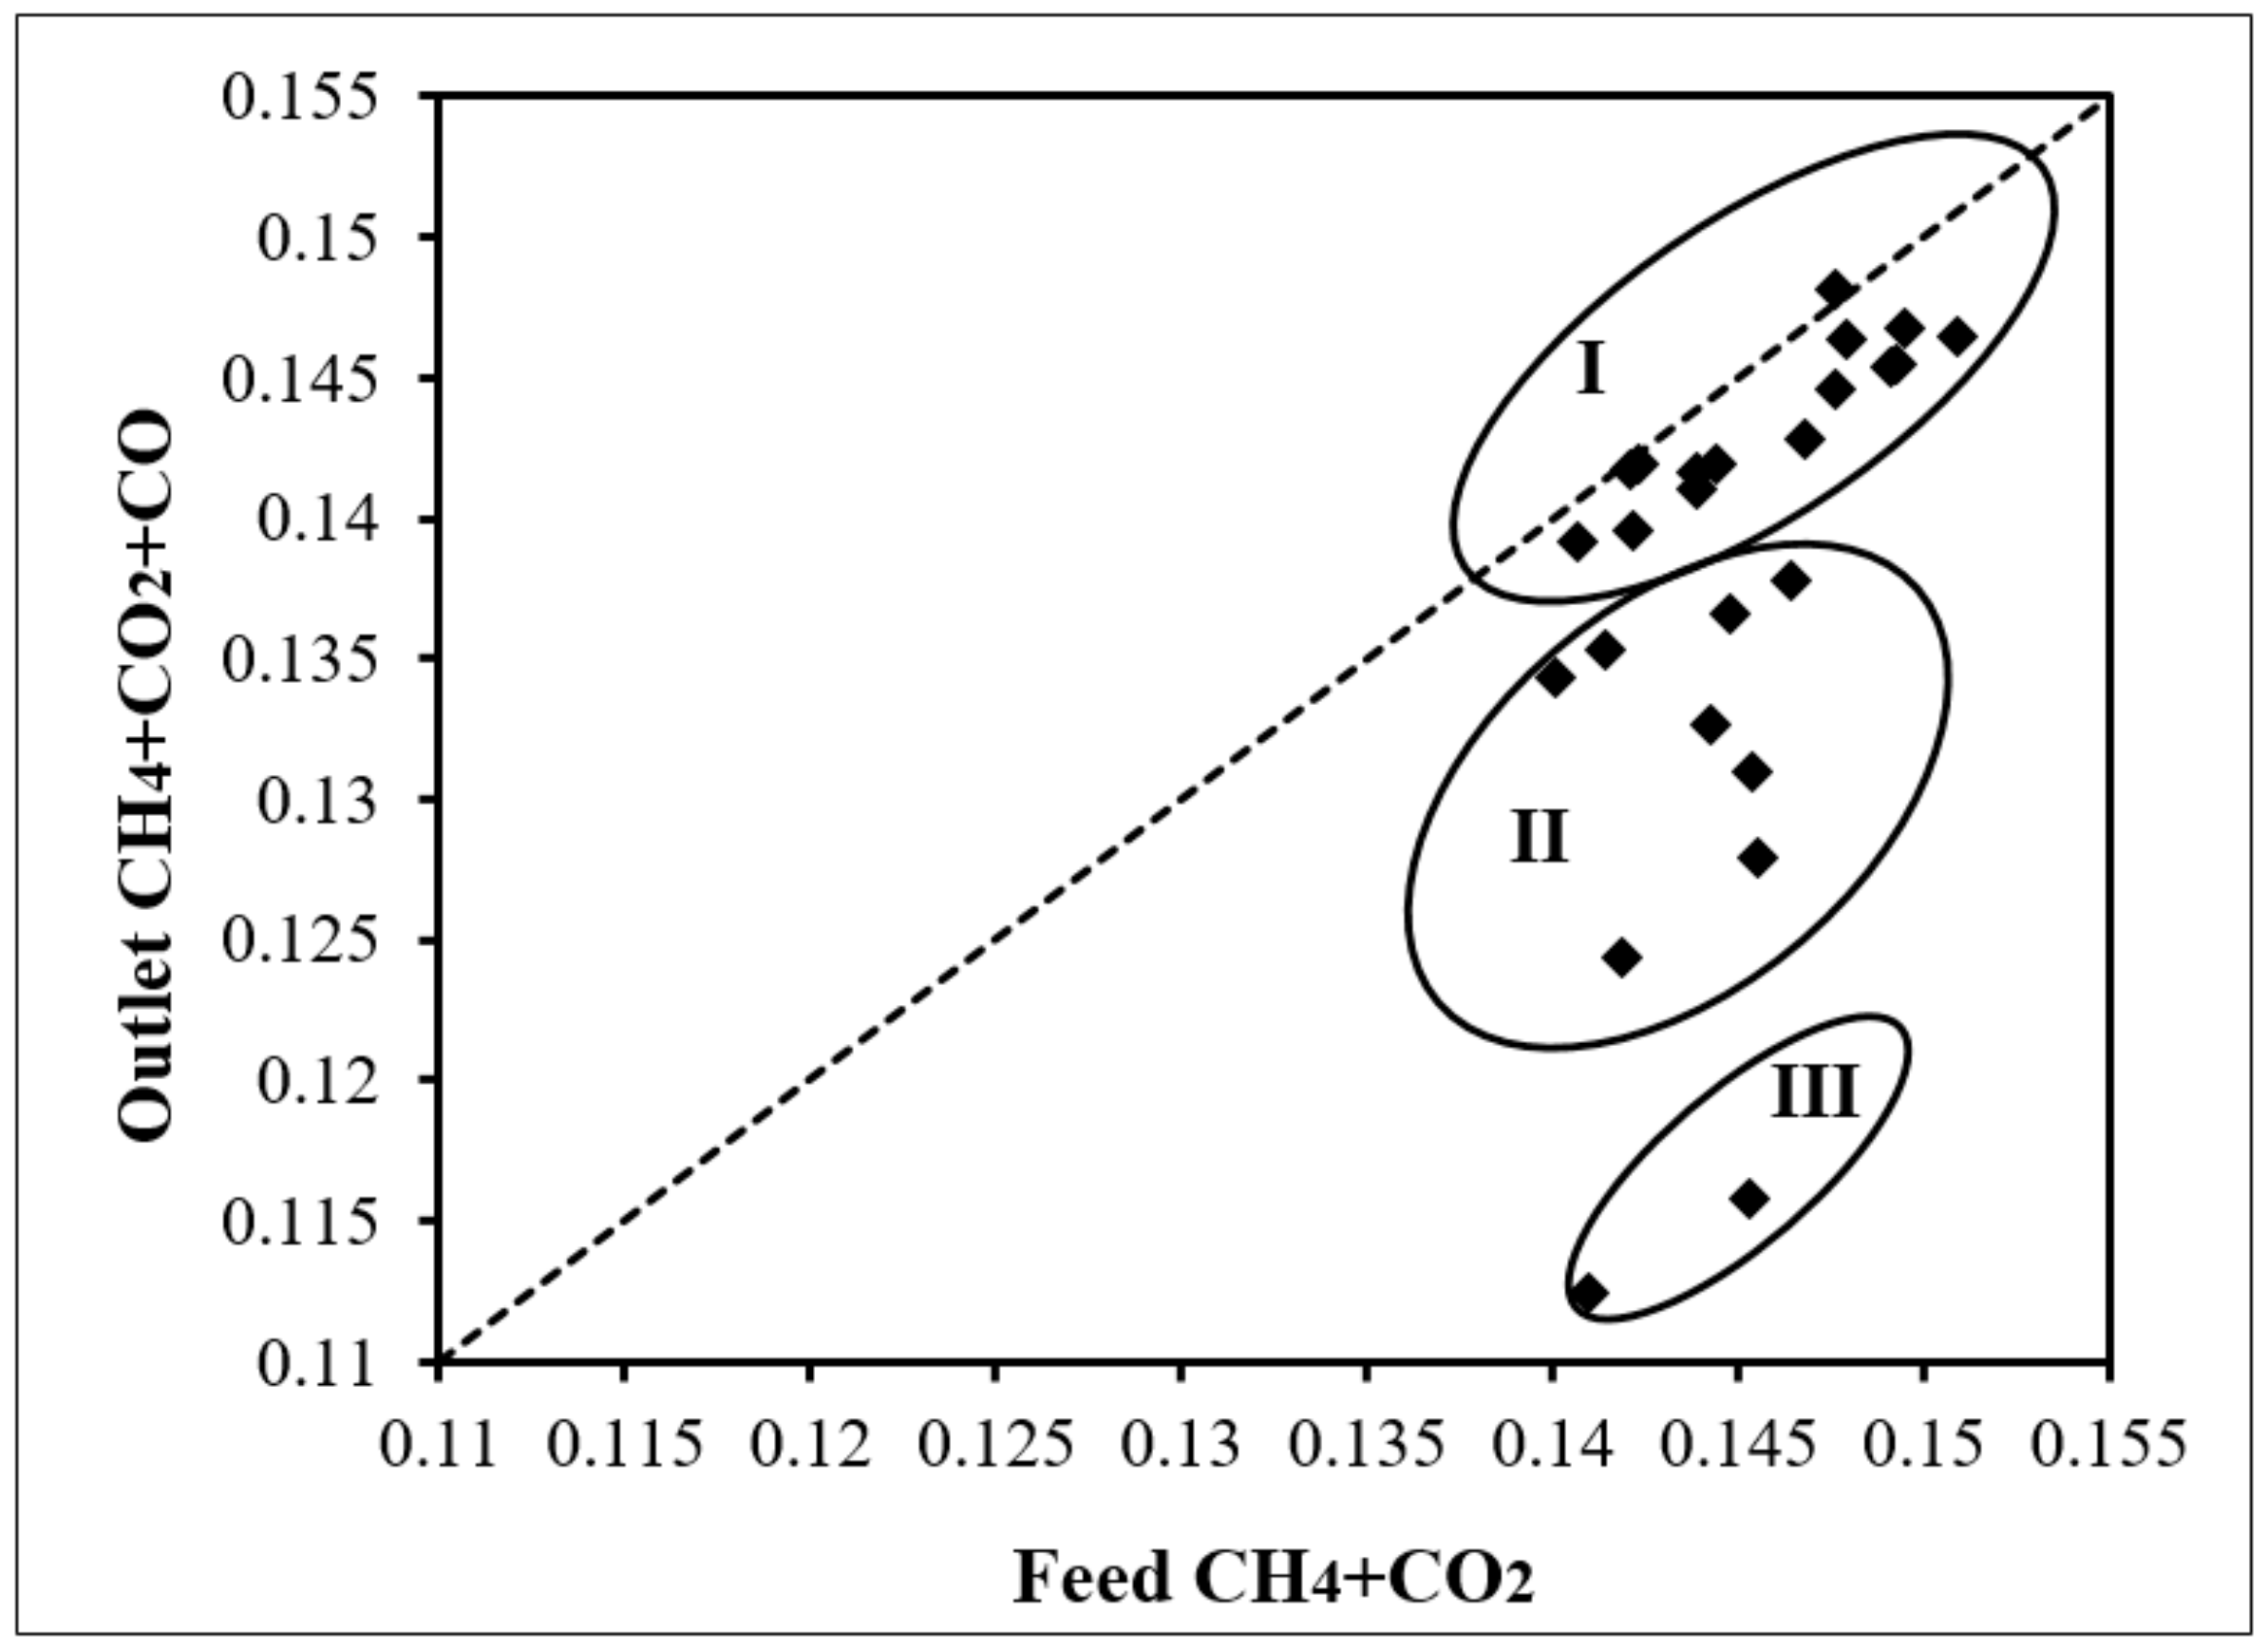
Analysis began with an experimental carbon balance. Measured feed CH4 + CO2 mole fractions were compared to measured outlet CH4 + CO2 + CO. Heavy He dilution minimized the impact of any changes in total molar rate by reactions. Figure 3 presents a parity plot of the experimental carbon balance. Points below the diagonal suggest carbon deposition occurred during those runs.
A closer look of the marker distribution in the graphic reveals:
- Circle I shows the runs at 773, 823, and 873 K. These are very close or even at the parity line suggesting little carbon deposition at these lower temperatures.
- Circle II and III present the runs at 923 K and 973 K. Compared to circle I, higher temperature favors coke formation.
- Circle III shows two cases at 973 K. They are even further from the parity line than the other runs at 973K (Circle II, feed CH4/CO2 range 0.51–1.01) due to higher feed CH4/CO2 (1.53, 2.08). The same observation is obtained at the other temperatures—higher CH4/CO2 at comparable temperatures favors coke formation.
- For all runs, the further below the parity line, the higher H2/CO is observed. It is implied that the formation of higher H2 is coincident with coke formation.
In view of Figure 3, our global kinetic model uses the following three reactions:
Dry Reforming CH4 + CO2 = 2CO + 2H2
Reverse Water Gas Shift CO2 + H2 = H2O + CO
Methane Decomposition CH4 = Cs + 2H2
Equation (1) presents the ideal DR reaction, and is chosen naturally. The reverse water gas shift (RWGS, Equation (2)) occurs during reforming [28]. Reactions 1 and 2 suggest H2/CO <1, which is coincident with most of our cases. However, numerous runs showed H2/CO >1 at higher temperatures and feed CH4/CO2. This might be explained by either the CH4 decomposition (MD, Equation (3)) generating more H2, or Boudouard reaction (2 CO → CO2 + Cs) consuming more CO. However, higher temperatures favor MD equilibrium but discourage Boudouard. It has been claimed that DR occurs through a catalytic decomposition of CH4 to adsorbed C and H atoms, thus facilitating carbon deposits [28]. Finally, Reactions 2 and 3 are known to occur during CH4 DR [21].
The selected reversible reactions for the global model and their rate expressions are summarized in Table 3. If the approach to equilibrium ηi > 1, the reaction goes left to right; if ηi < 1, the reaction goes in reverse; if ηi = 1, the reaction is at equilibrium. The equilibrium constants Kpi (Table 3), are regressed vs. temperature from an on-line calculator [29]. For Reactions 1 and 3, the first order CH4 kinetics are suggested elsewhere [28]. The Reaction 2 first-order CO2 kinetics are also suggested elsewhere [30]. A regression strategy was used to estimate the Arrhenius parameter pairs (Ai, Ei), Assuming a packed-bed reactor (PBR) model (Table 4), our DR experiments were simulated. The experimental CH4 and CO2 conversions are sufficiently high (>10%) that an integral PBR model is used rather than a simple differential reactor.
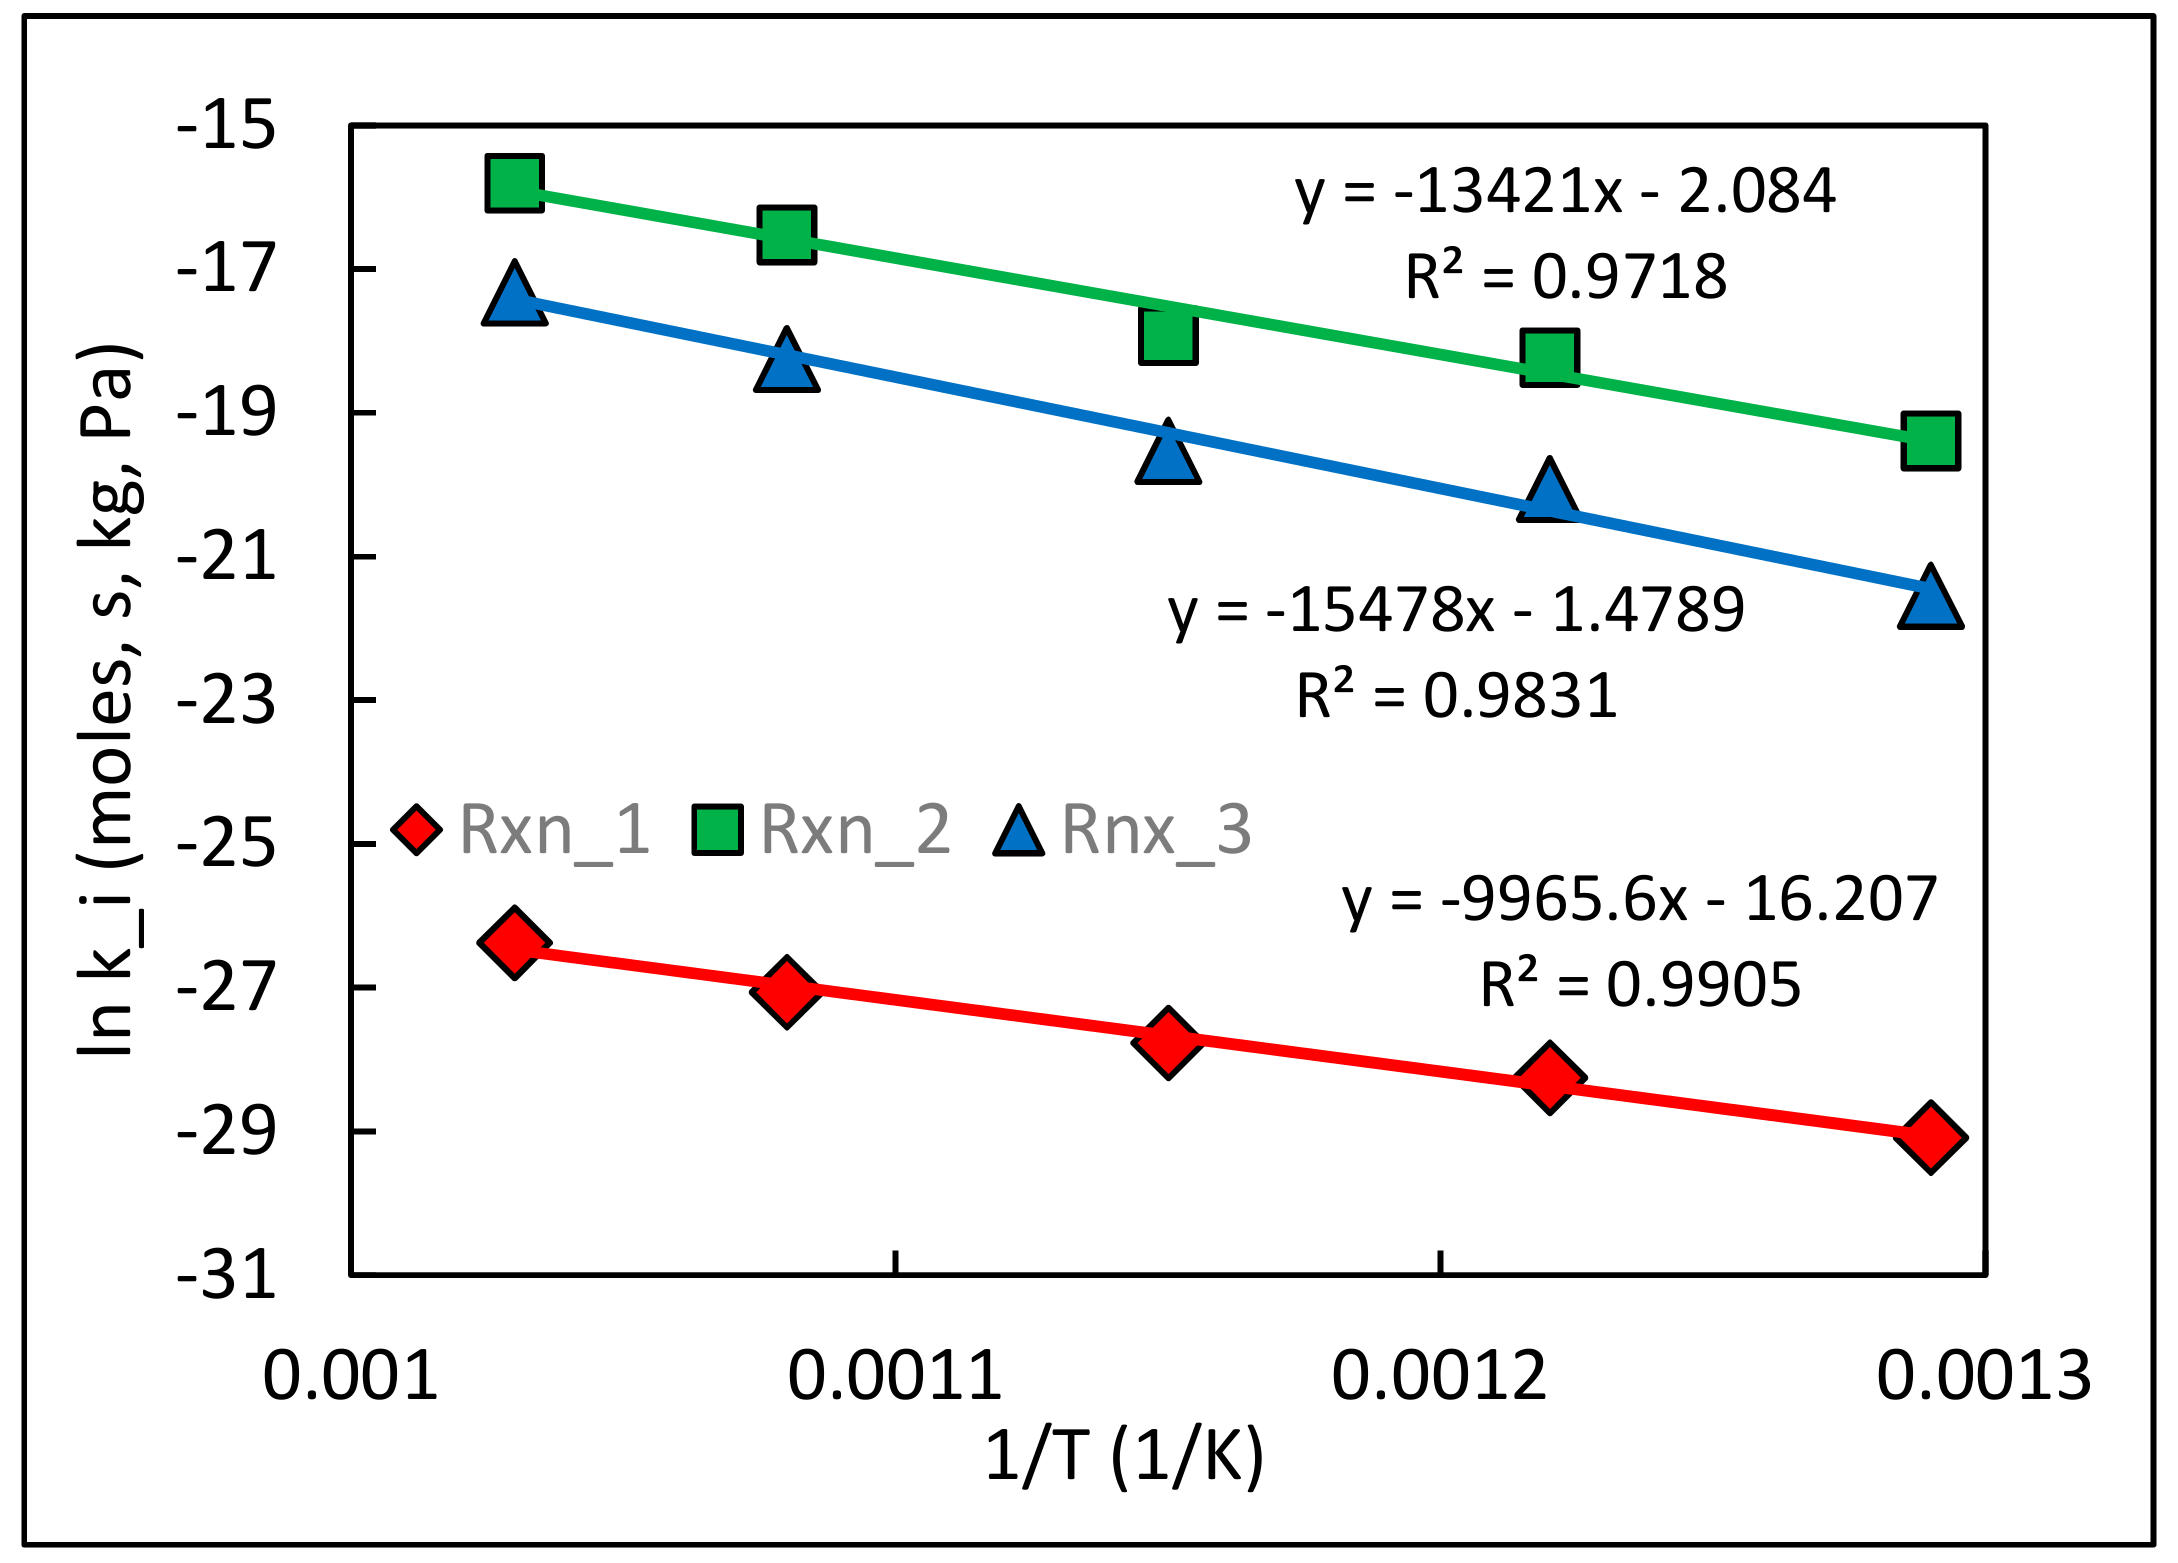
An original Matlab program was developed to simultaneously integrate all PBR species balances with the input of all experimental inlet mole fractions and flow rates at a given temperature and pressure, and then to compare the calculated outlet mole fractions with experimental values. The Matlab program repeats the regression process, resulting in optimized rate constants ki at that temperature. The optimized rate constants ki at each temperature were correlated (Figure 4) to obtain quality Arrhenius parameters of each reaction (Table 5).
A similar analysis method [31] was successfully applied to optimize a 3-global reaction set for methane dehydroaromatization (MDA), inspired elsewhere [32]. In this MDA study, a detailed kinetic mechanism for the surface elementary reactions [33] was evaluated in a PBR model to create a simulated experimental database.
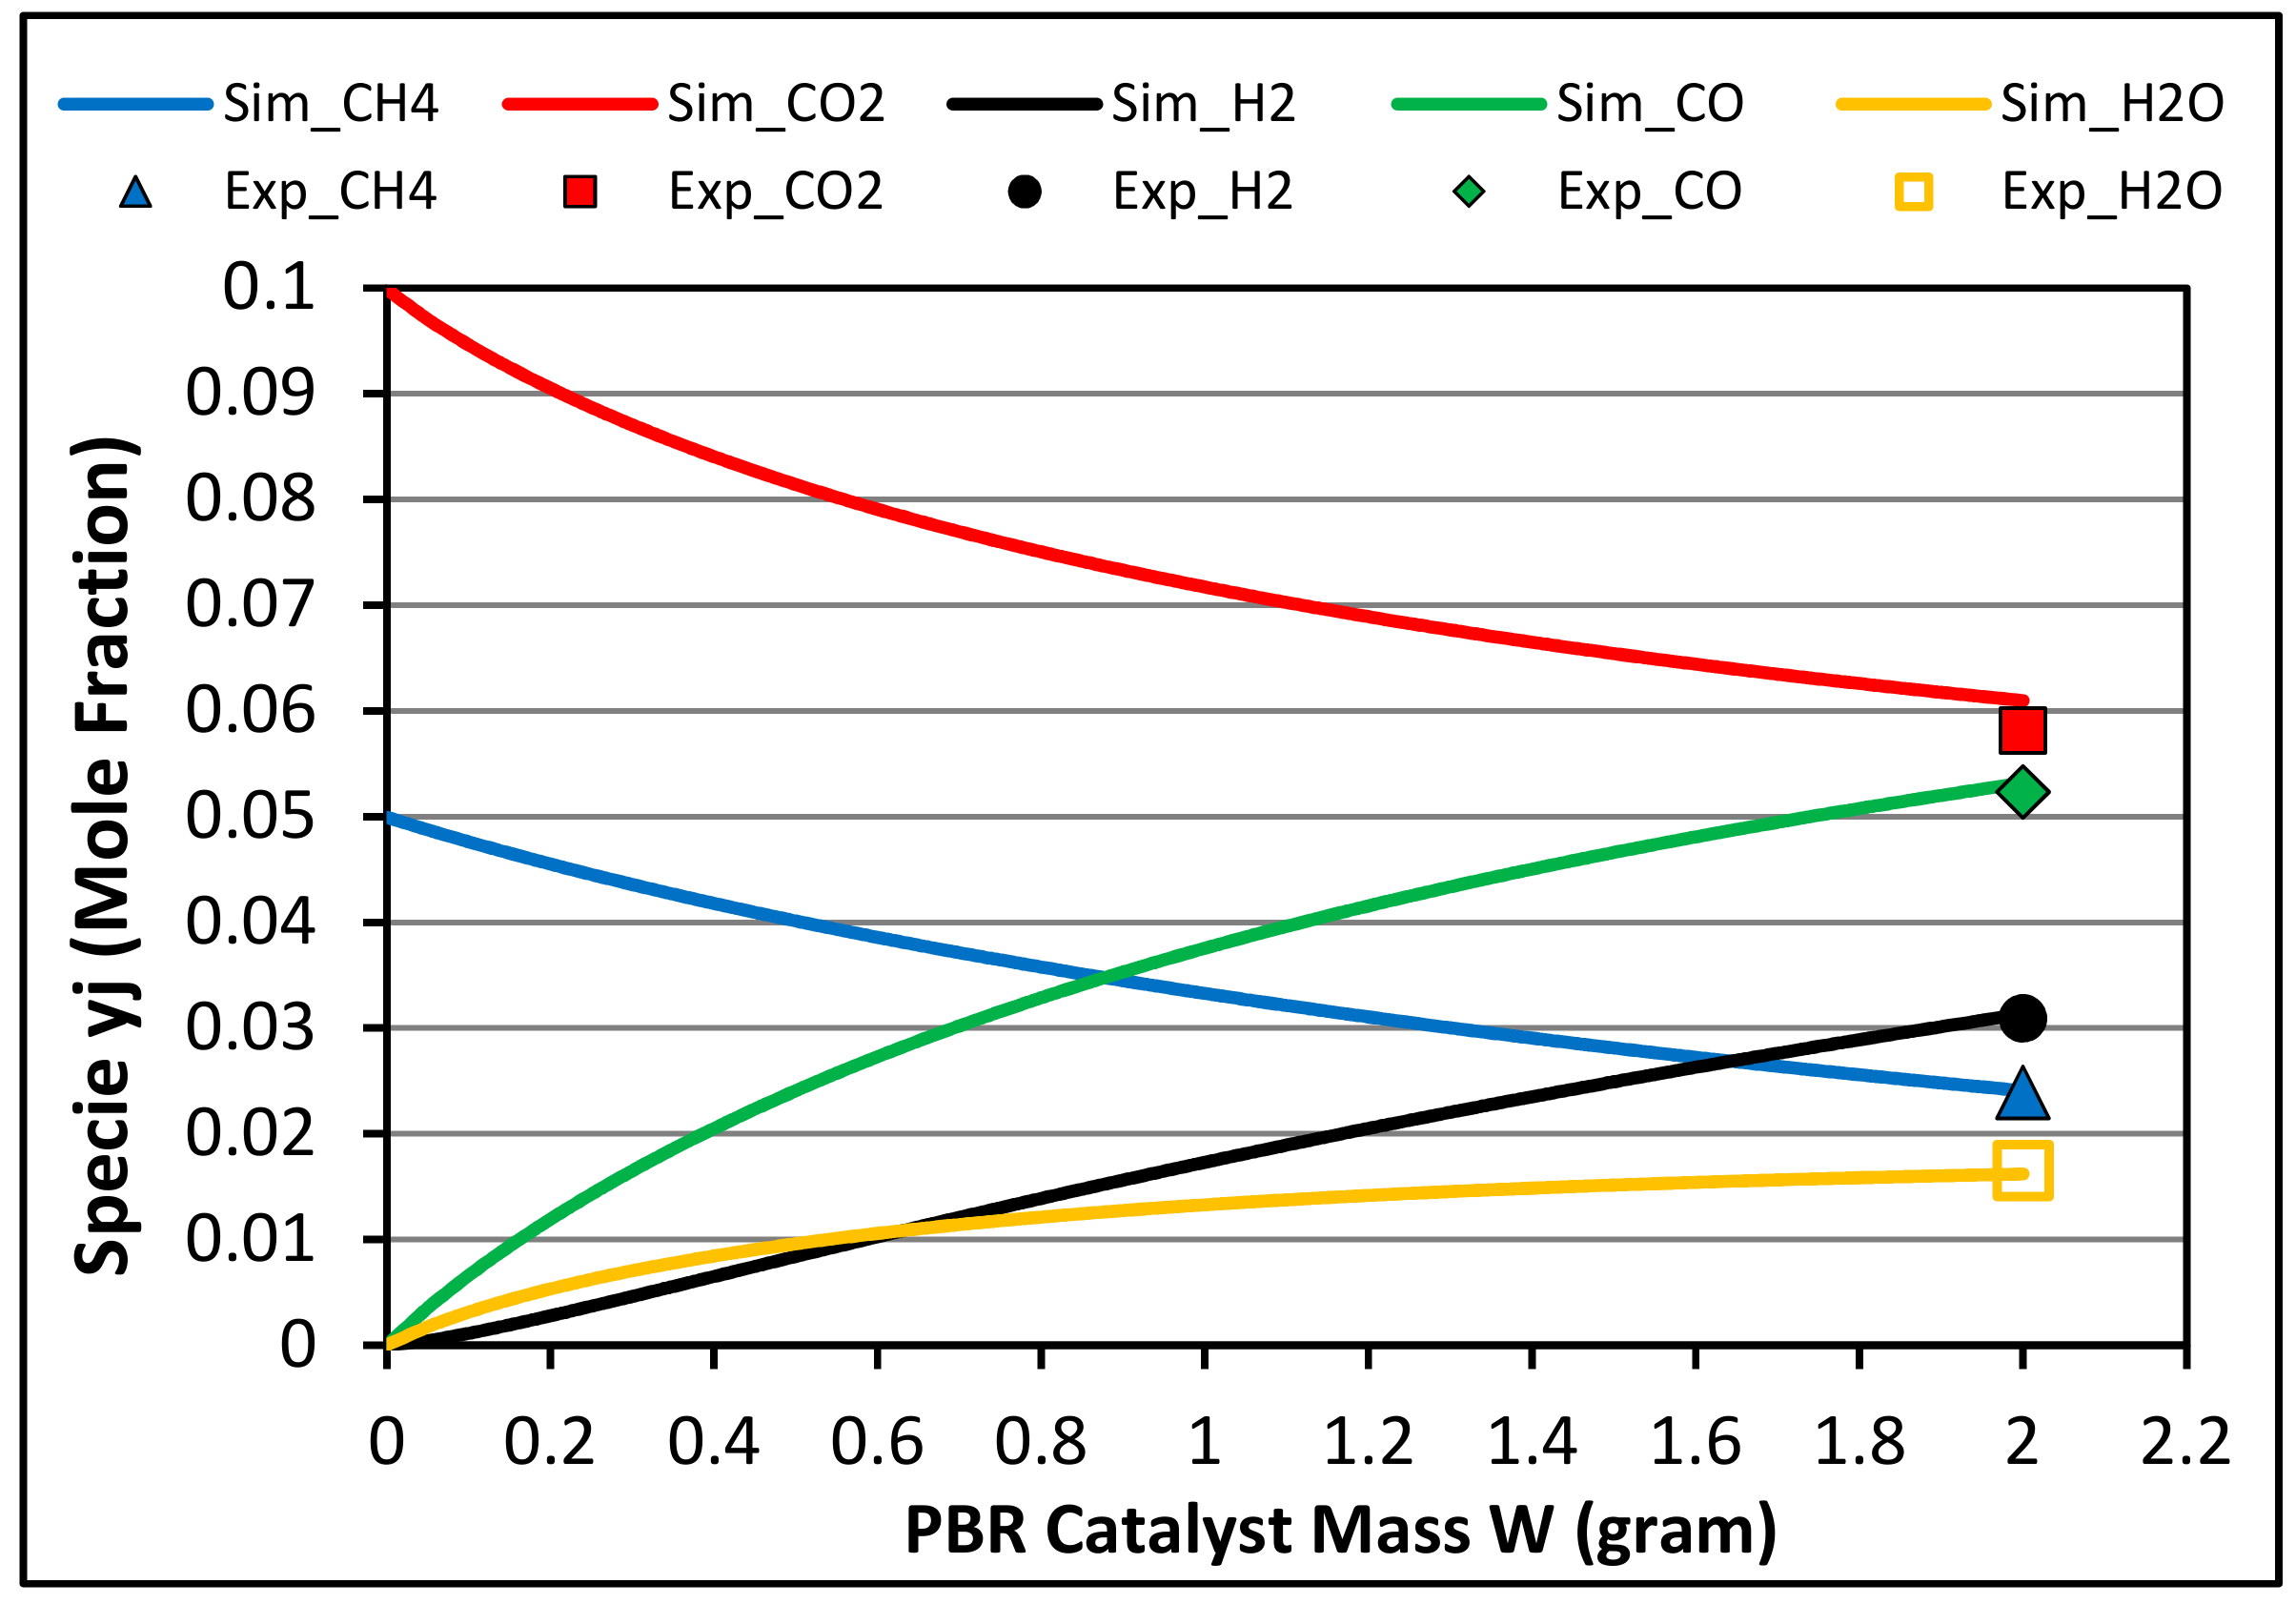
Using the best-fit Arrhenius parameters (Table 5) with the 3-reaction global kinetic set, the experimental DR runs were again simulated, with predicted values compared to the observed. Figure 5 shows example simulated and experimental (outlet) mole fractions at 923 K, 3.03 × 10⁵ Pa, feed 1.12 × 10⁻⁶ m3/s, and feed CH4/CO2 = 0.5. Species H2 and CO rise steadily, while CO2 and CH4 both drop. The experimental outlet mole fractions are well simulated by the global 3-reaction model.
4. Discussion
The results above illustrate how the 3-reaction global model above was built up based on the observed reactor outlet species concentrations with various experimental temperatures and feed molar CH4/CO2 ratios. In this section, these results are discussed by demonstrating the utility of the 3-reaction global model by comparison against useful quantities such as reactant conversions and product H2/CO ratios. The equilibrium values are also presented in these cases for comparison.
4.1. Species Concentrations at Reactor Outlet
For all experimental runs, the CH4, CO2, CO mole fractions were directly measured by GC/TCD. Oxygen atom balances were used, based on measured inlet and effluent CO2 and CO concentrations, to estimate H2O. No trace of O2 was detected in any case. Combined with H atom balance, H2 was estimated using measured inlet and outlet CH4.
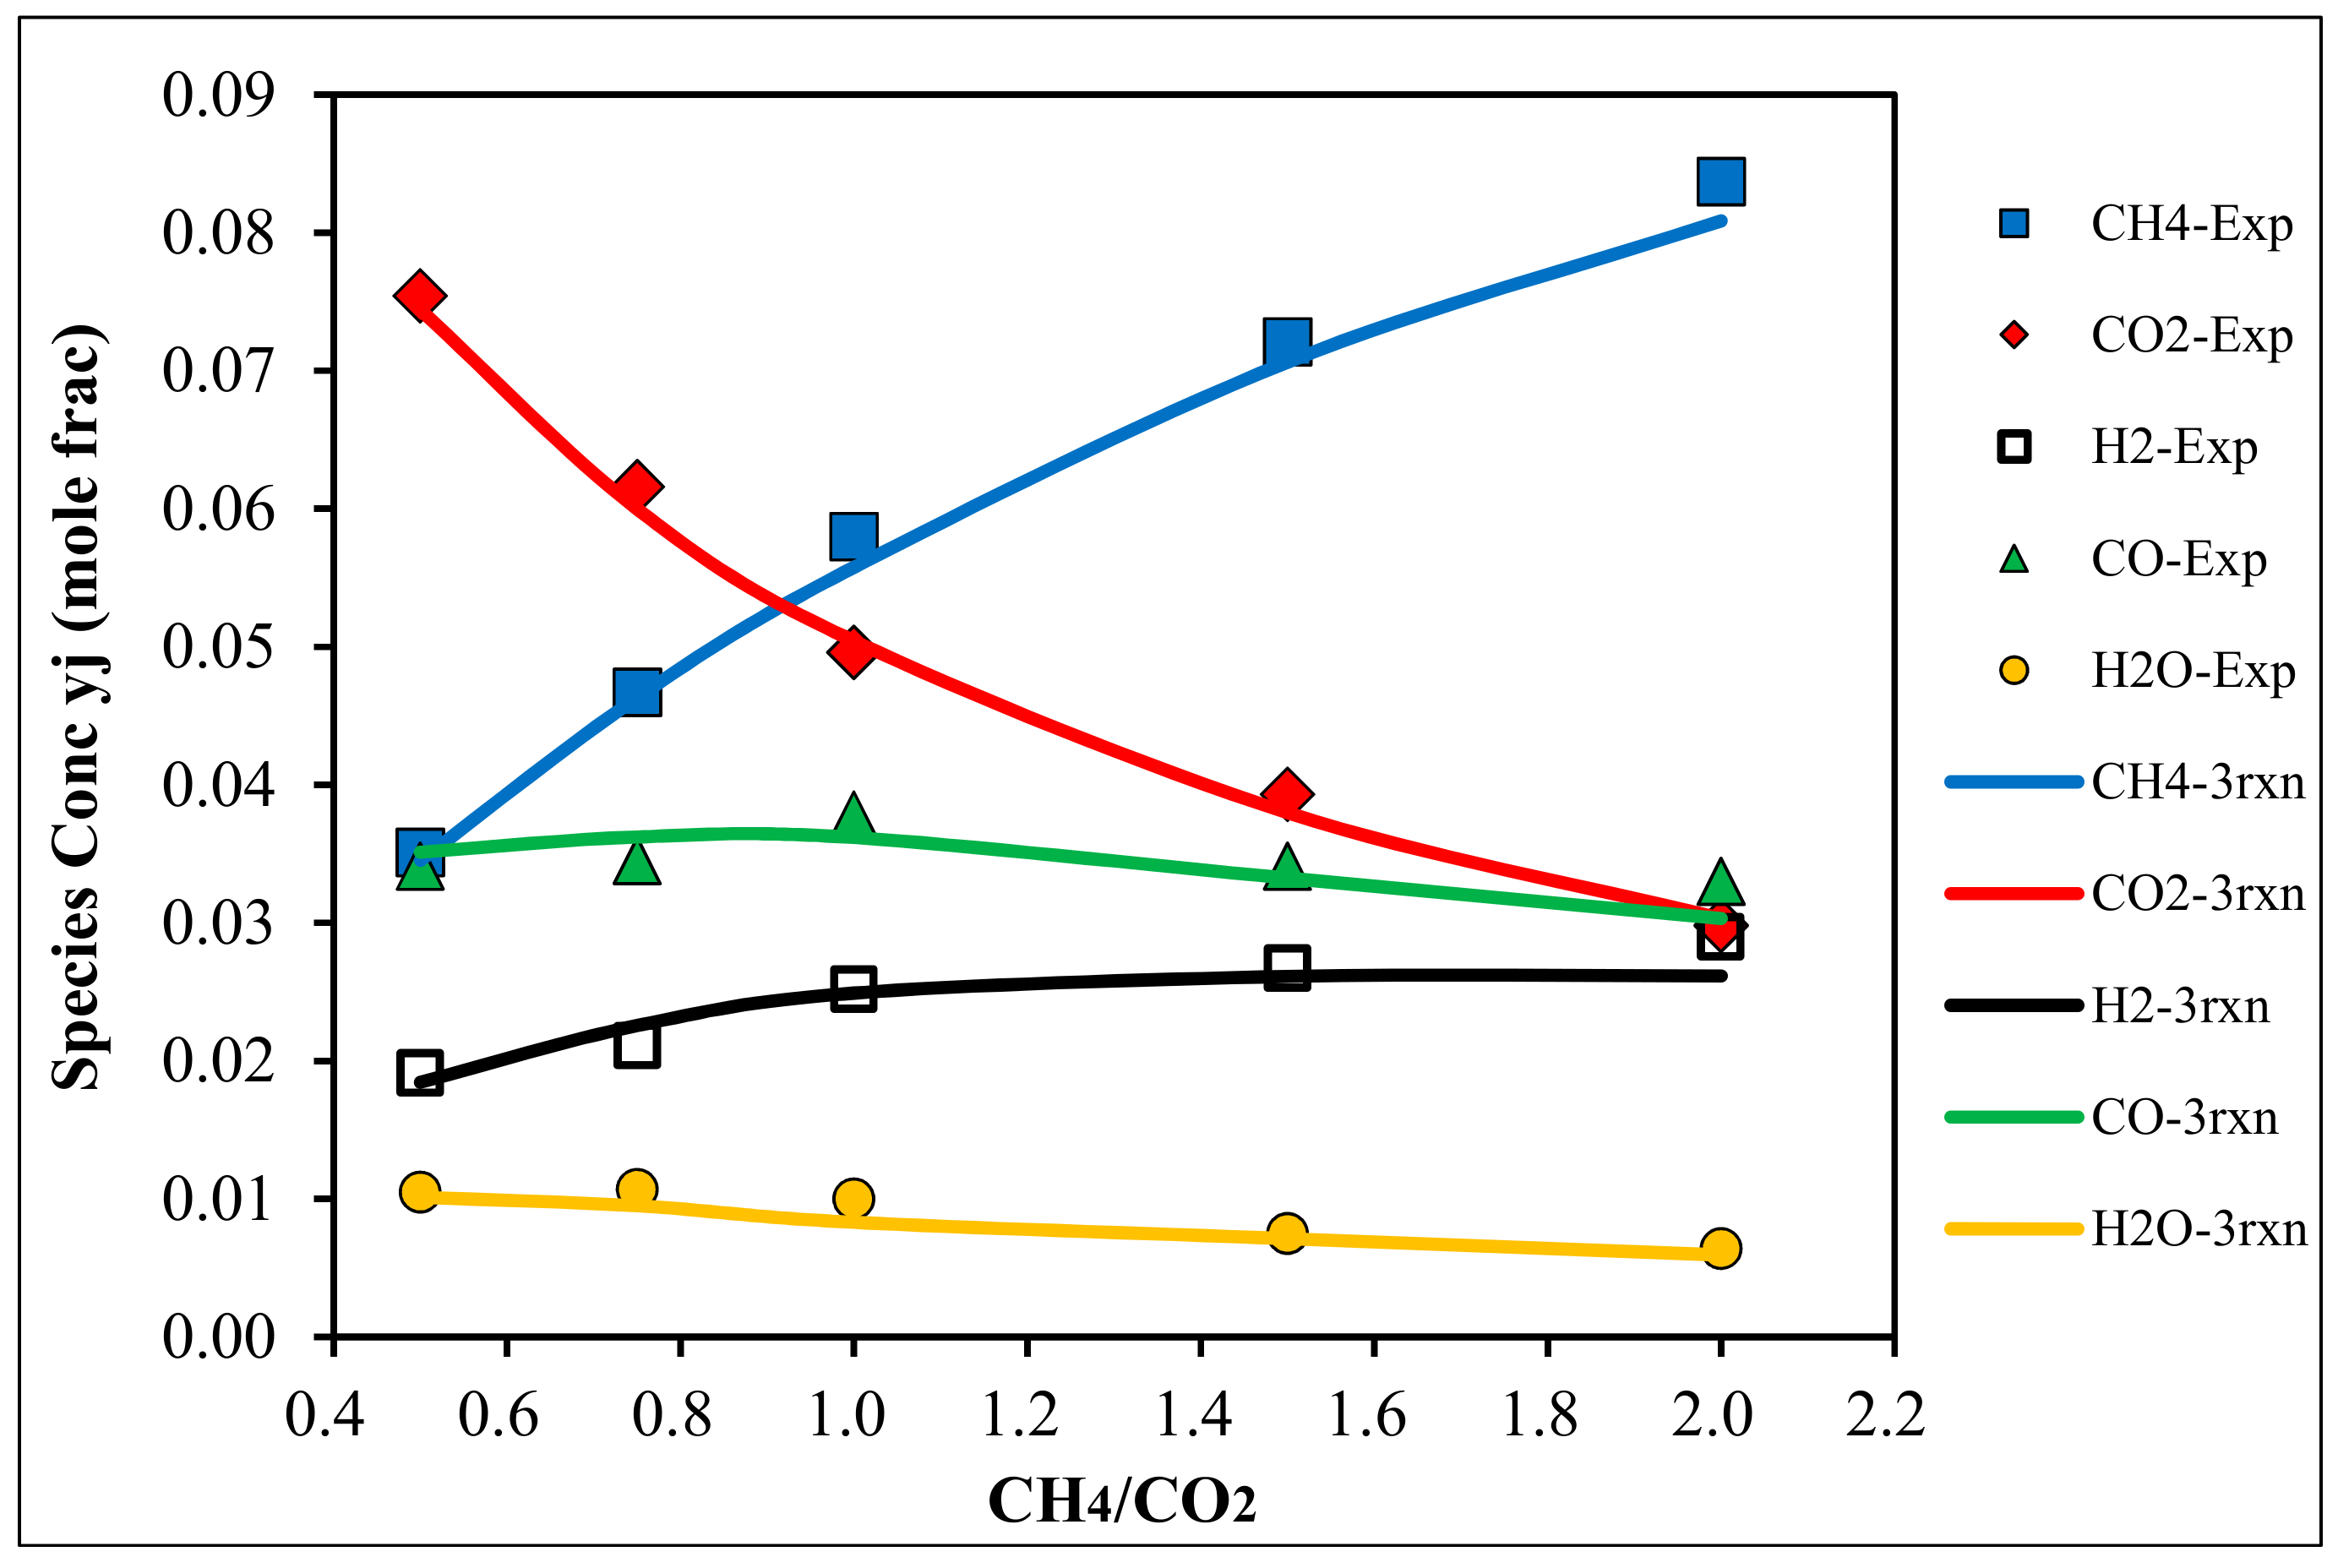
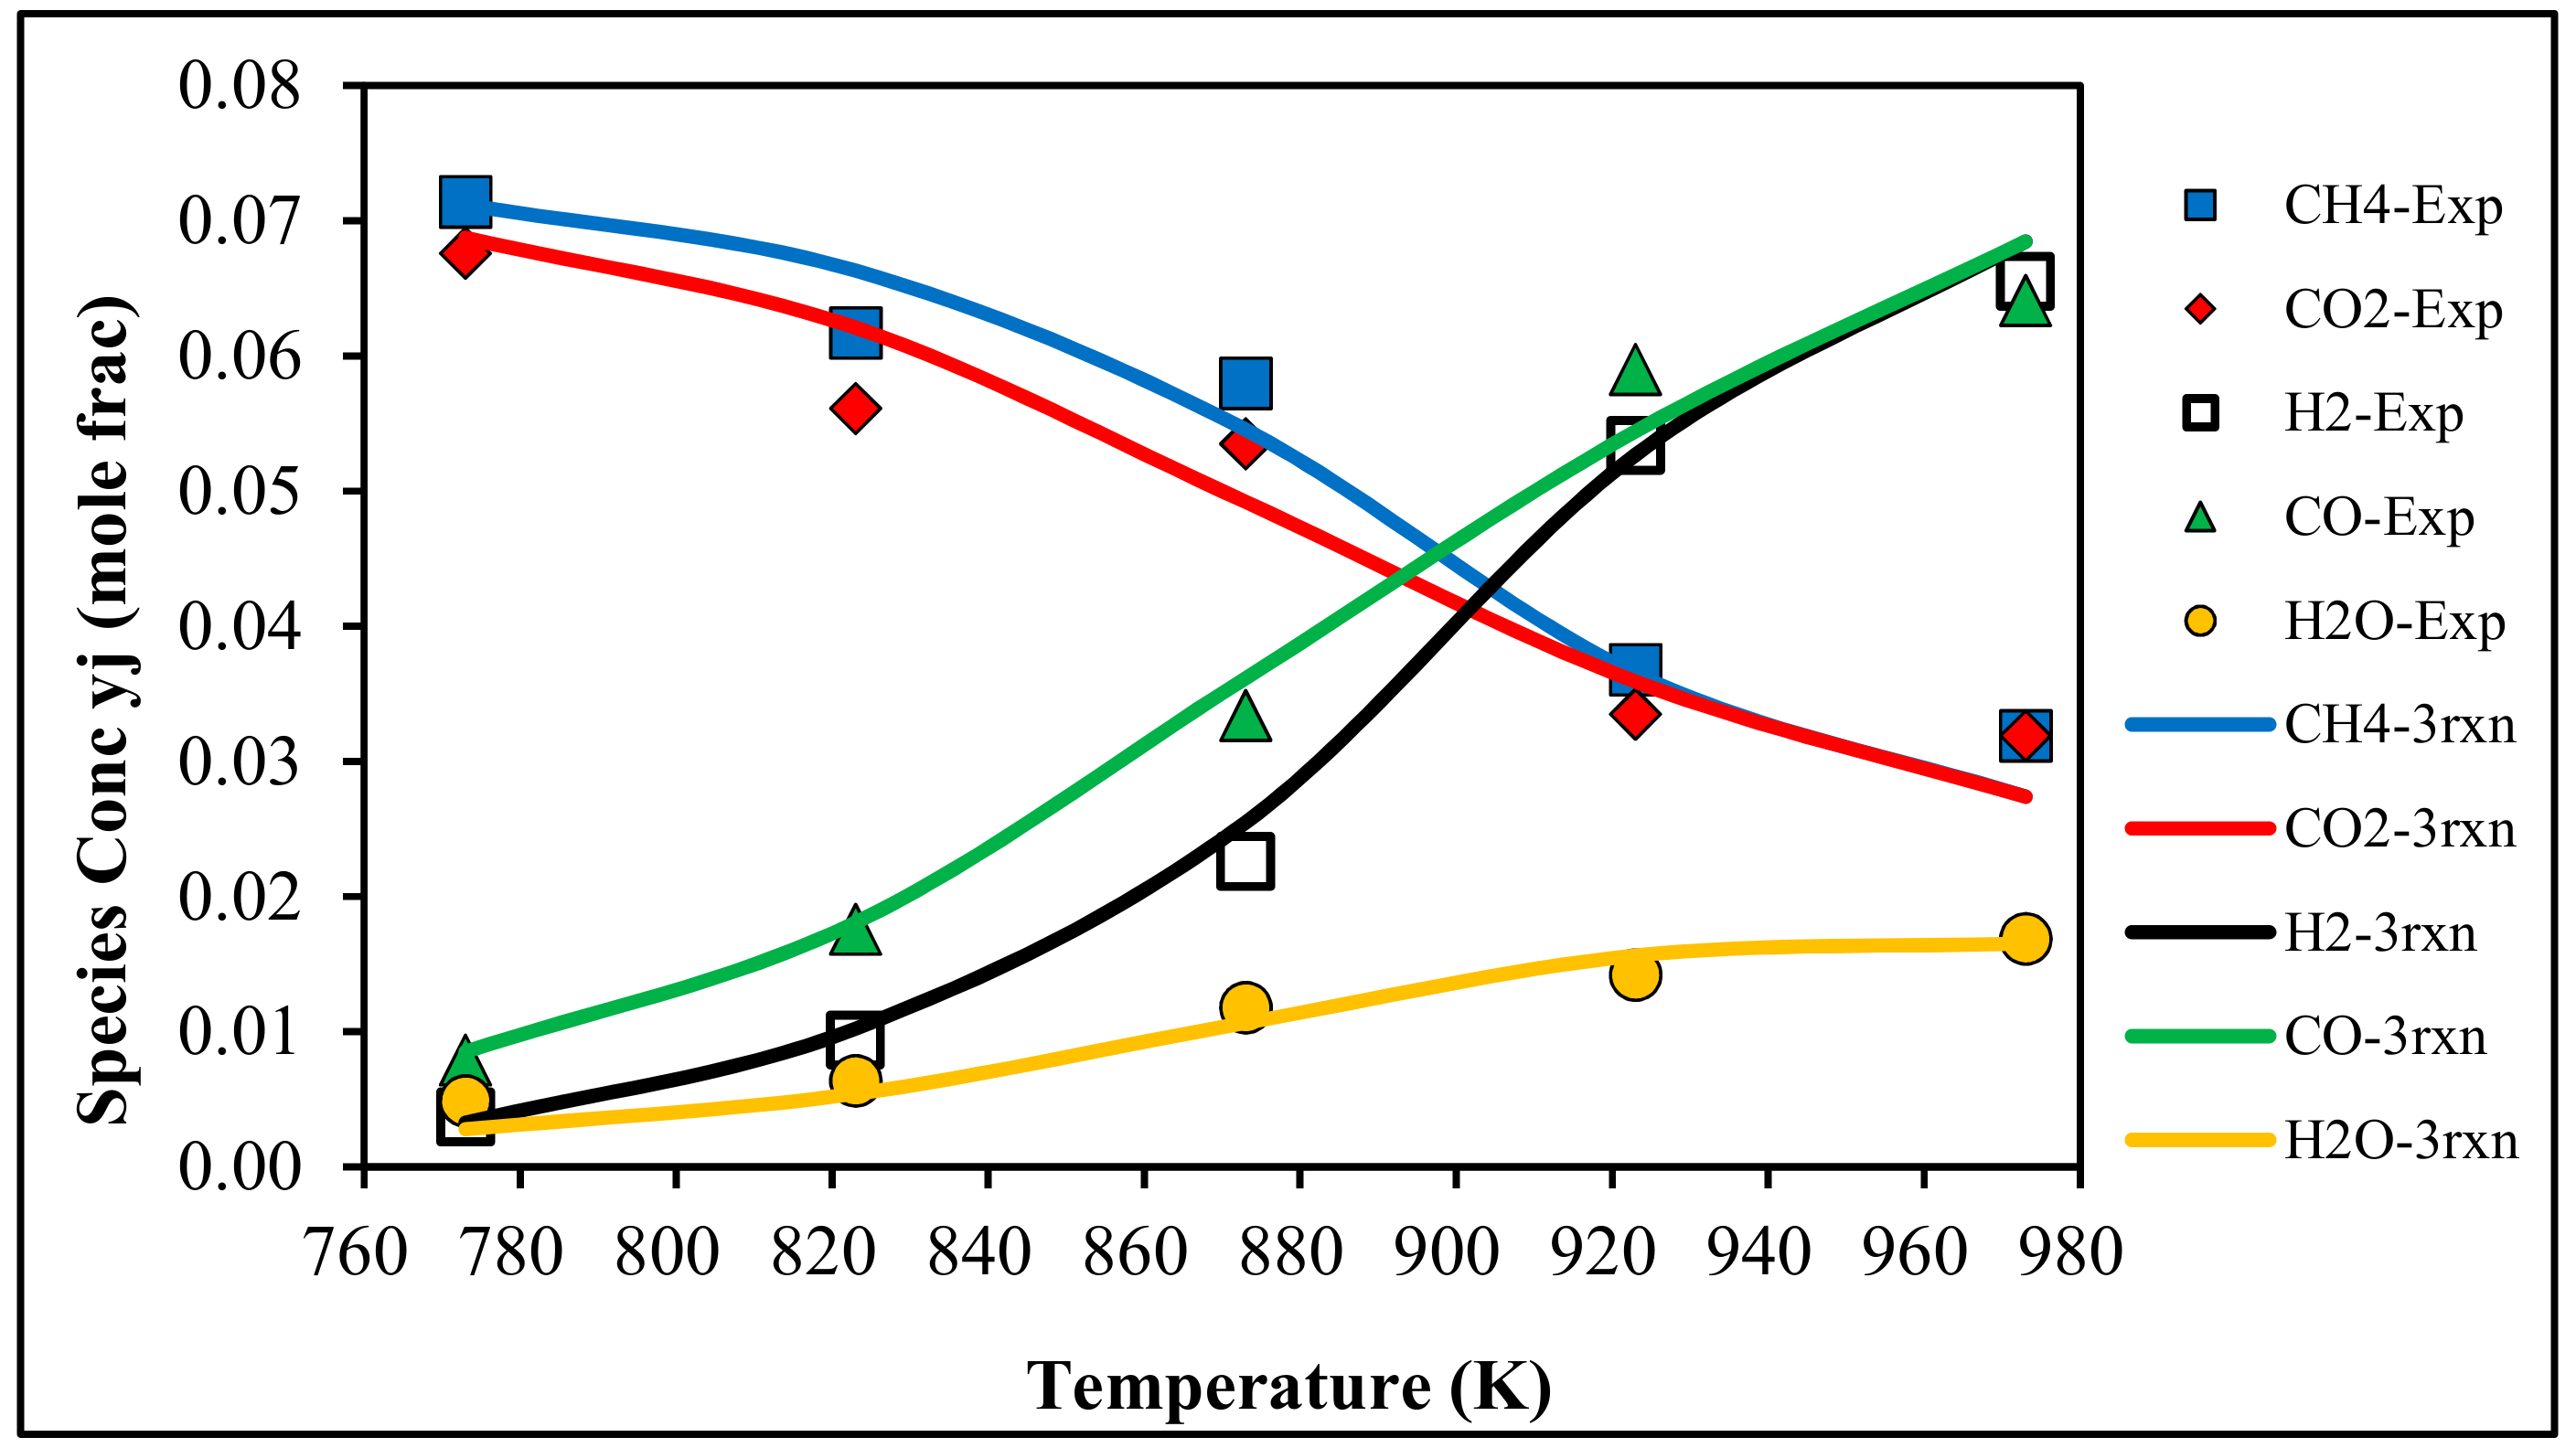
To compare the 3-reaction model with experimental results, Figure 7 shows outlet species for all cases at 873 K at constant feed rate but different feed CH4/CO2. Figure 8 presents the compositions of all cases at CH4/CO2 = 1.0 with constant feed rate as a function of temperature. Acceptable agreements establish the precision of the 3-reaction model. The outlet concentrations of CO, H2O, and H2 are significantly impacted by reaction temperature, less so by the inlet CH4/CO2.
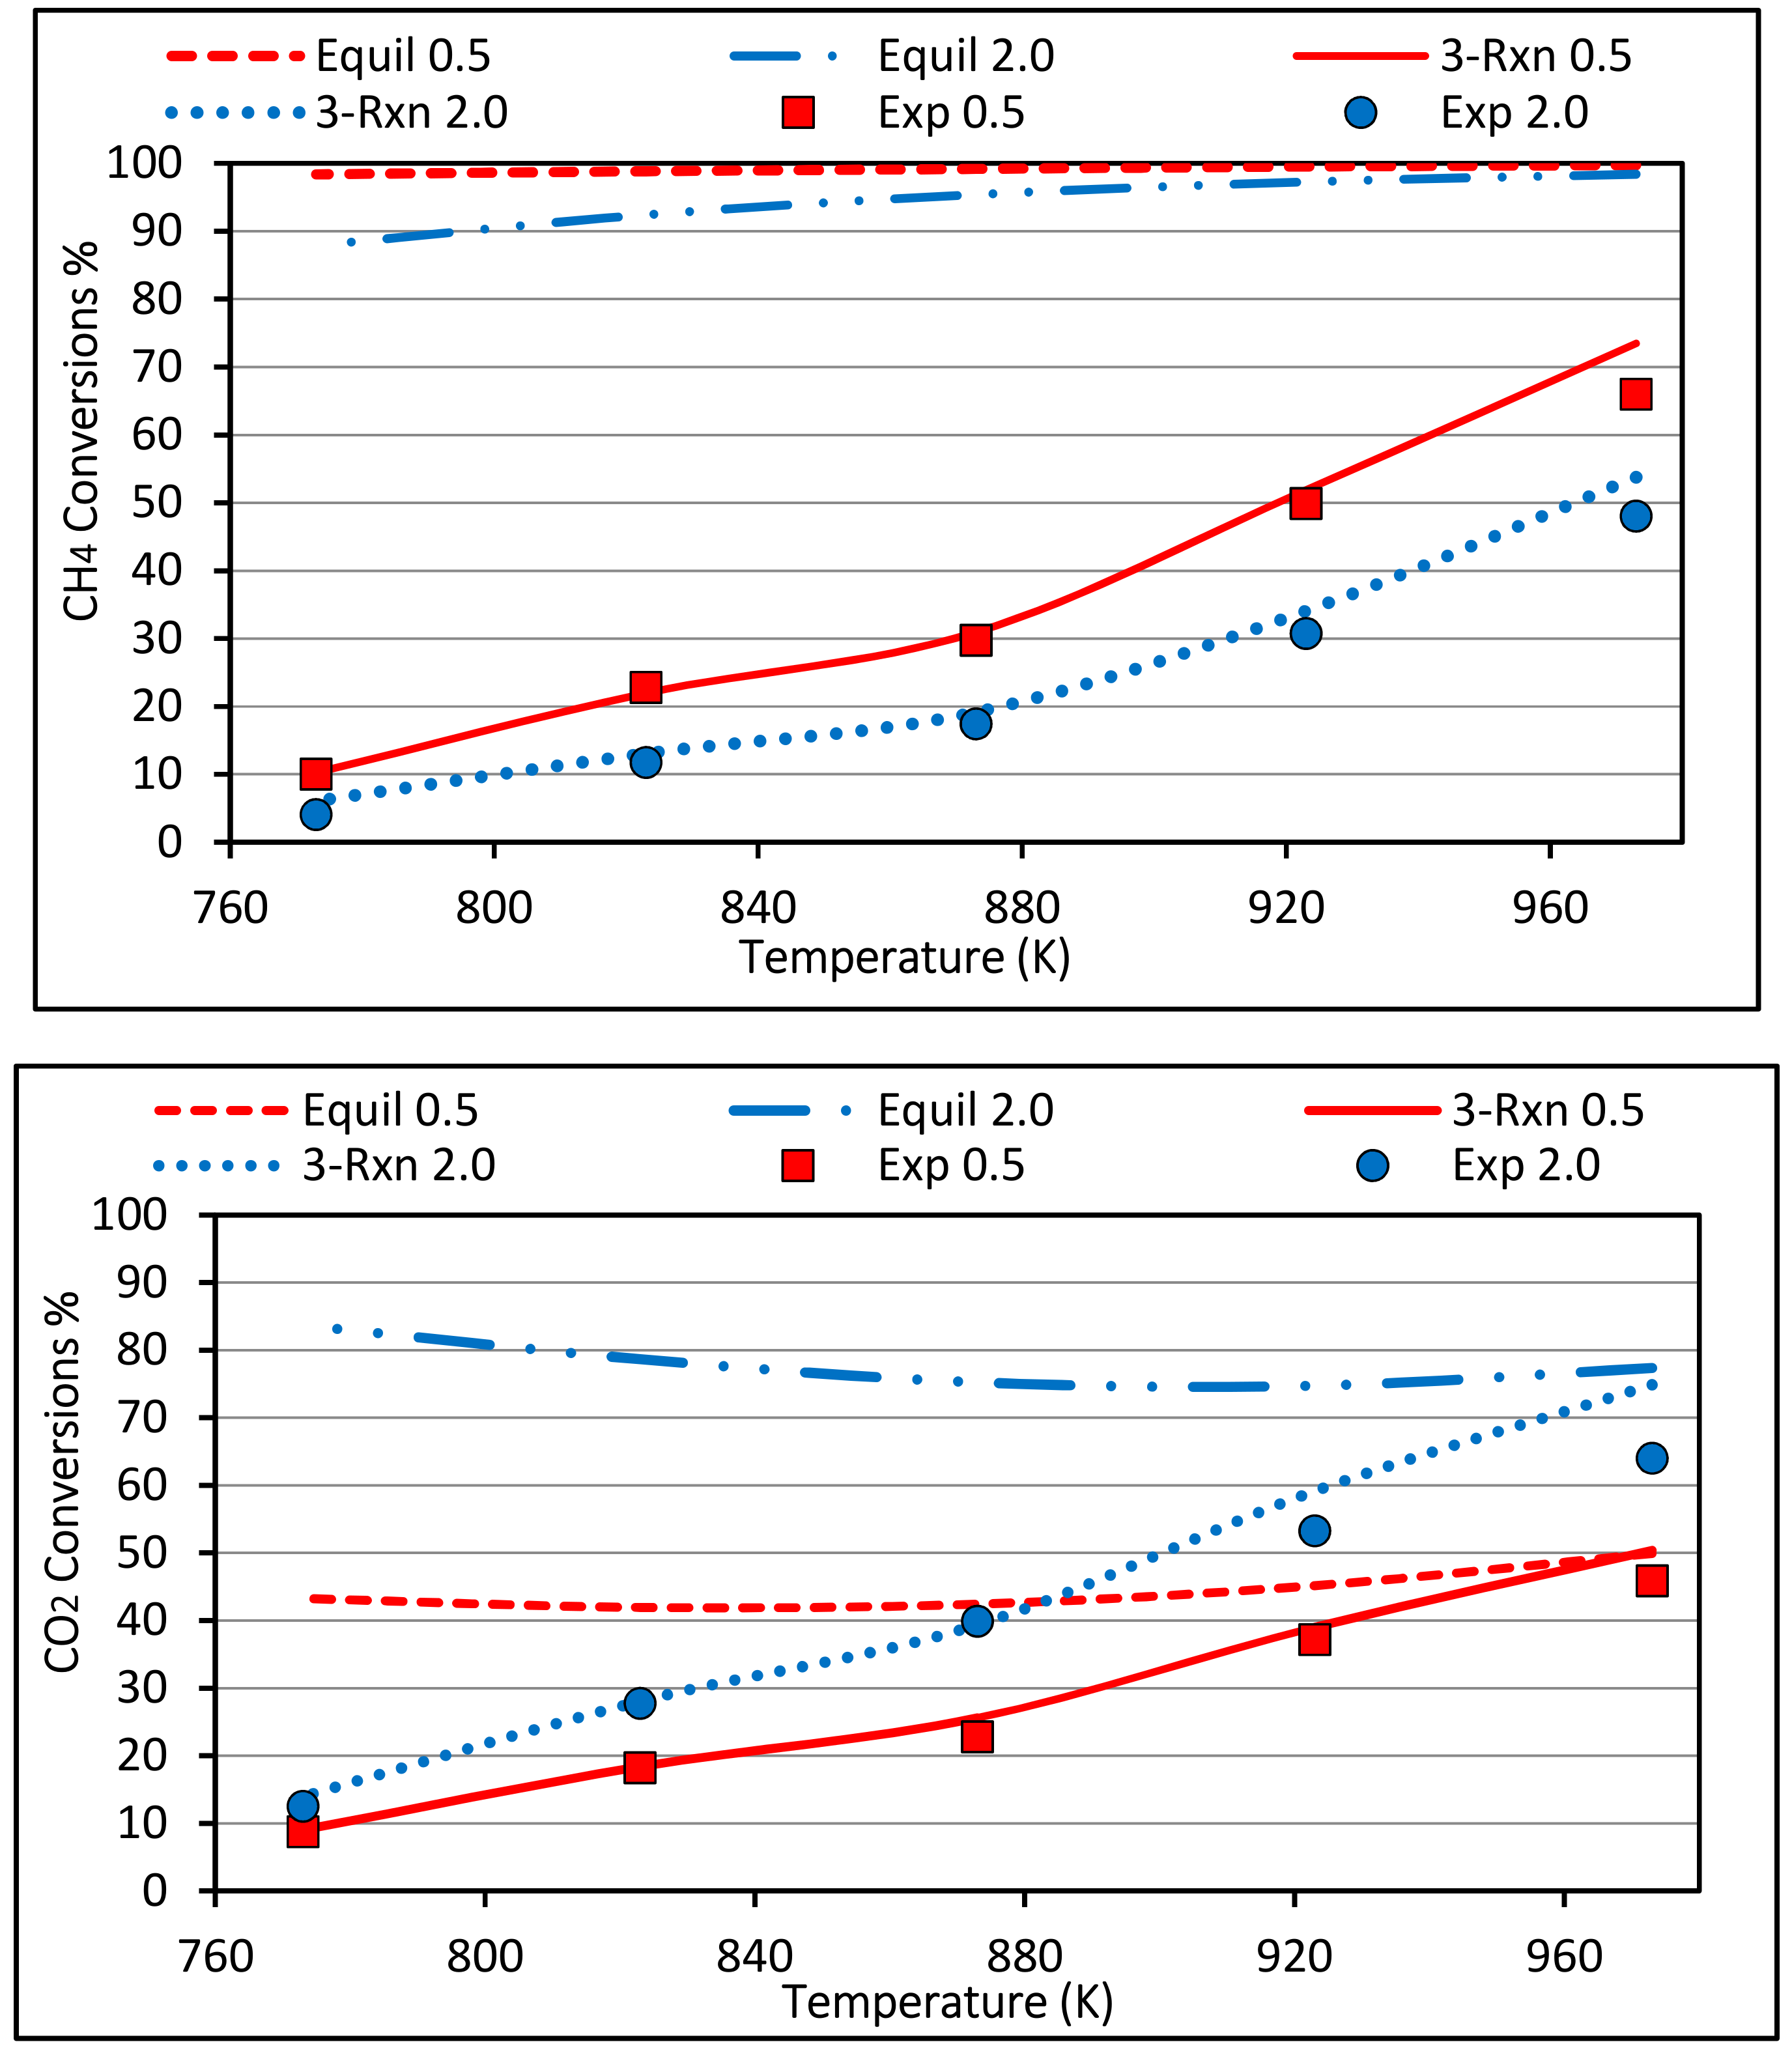
4.2. Methane and Carbon Dioxide Conversions
Estimated CH4 and CO2 conversions are based on inlet and outlet mole fractions due to the heavy He dilution. Figure 9 shows variations with temperature of experimental, equilibrium, and 3-reaction model predicted conversions at feed CH4/CO2 of 2.0 and 0.5. The 3-reaction model performed very well in predicting observed conversions.
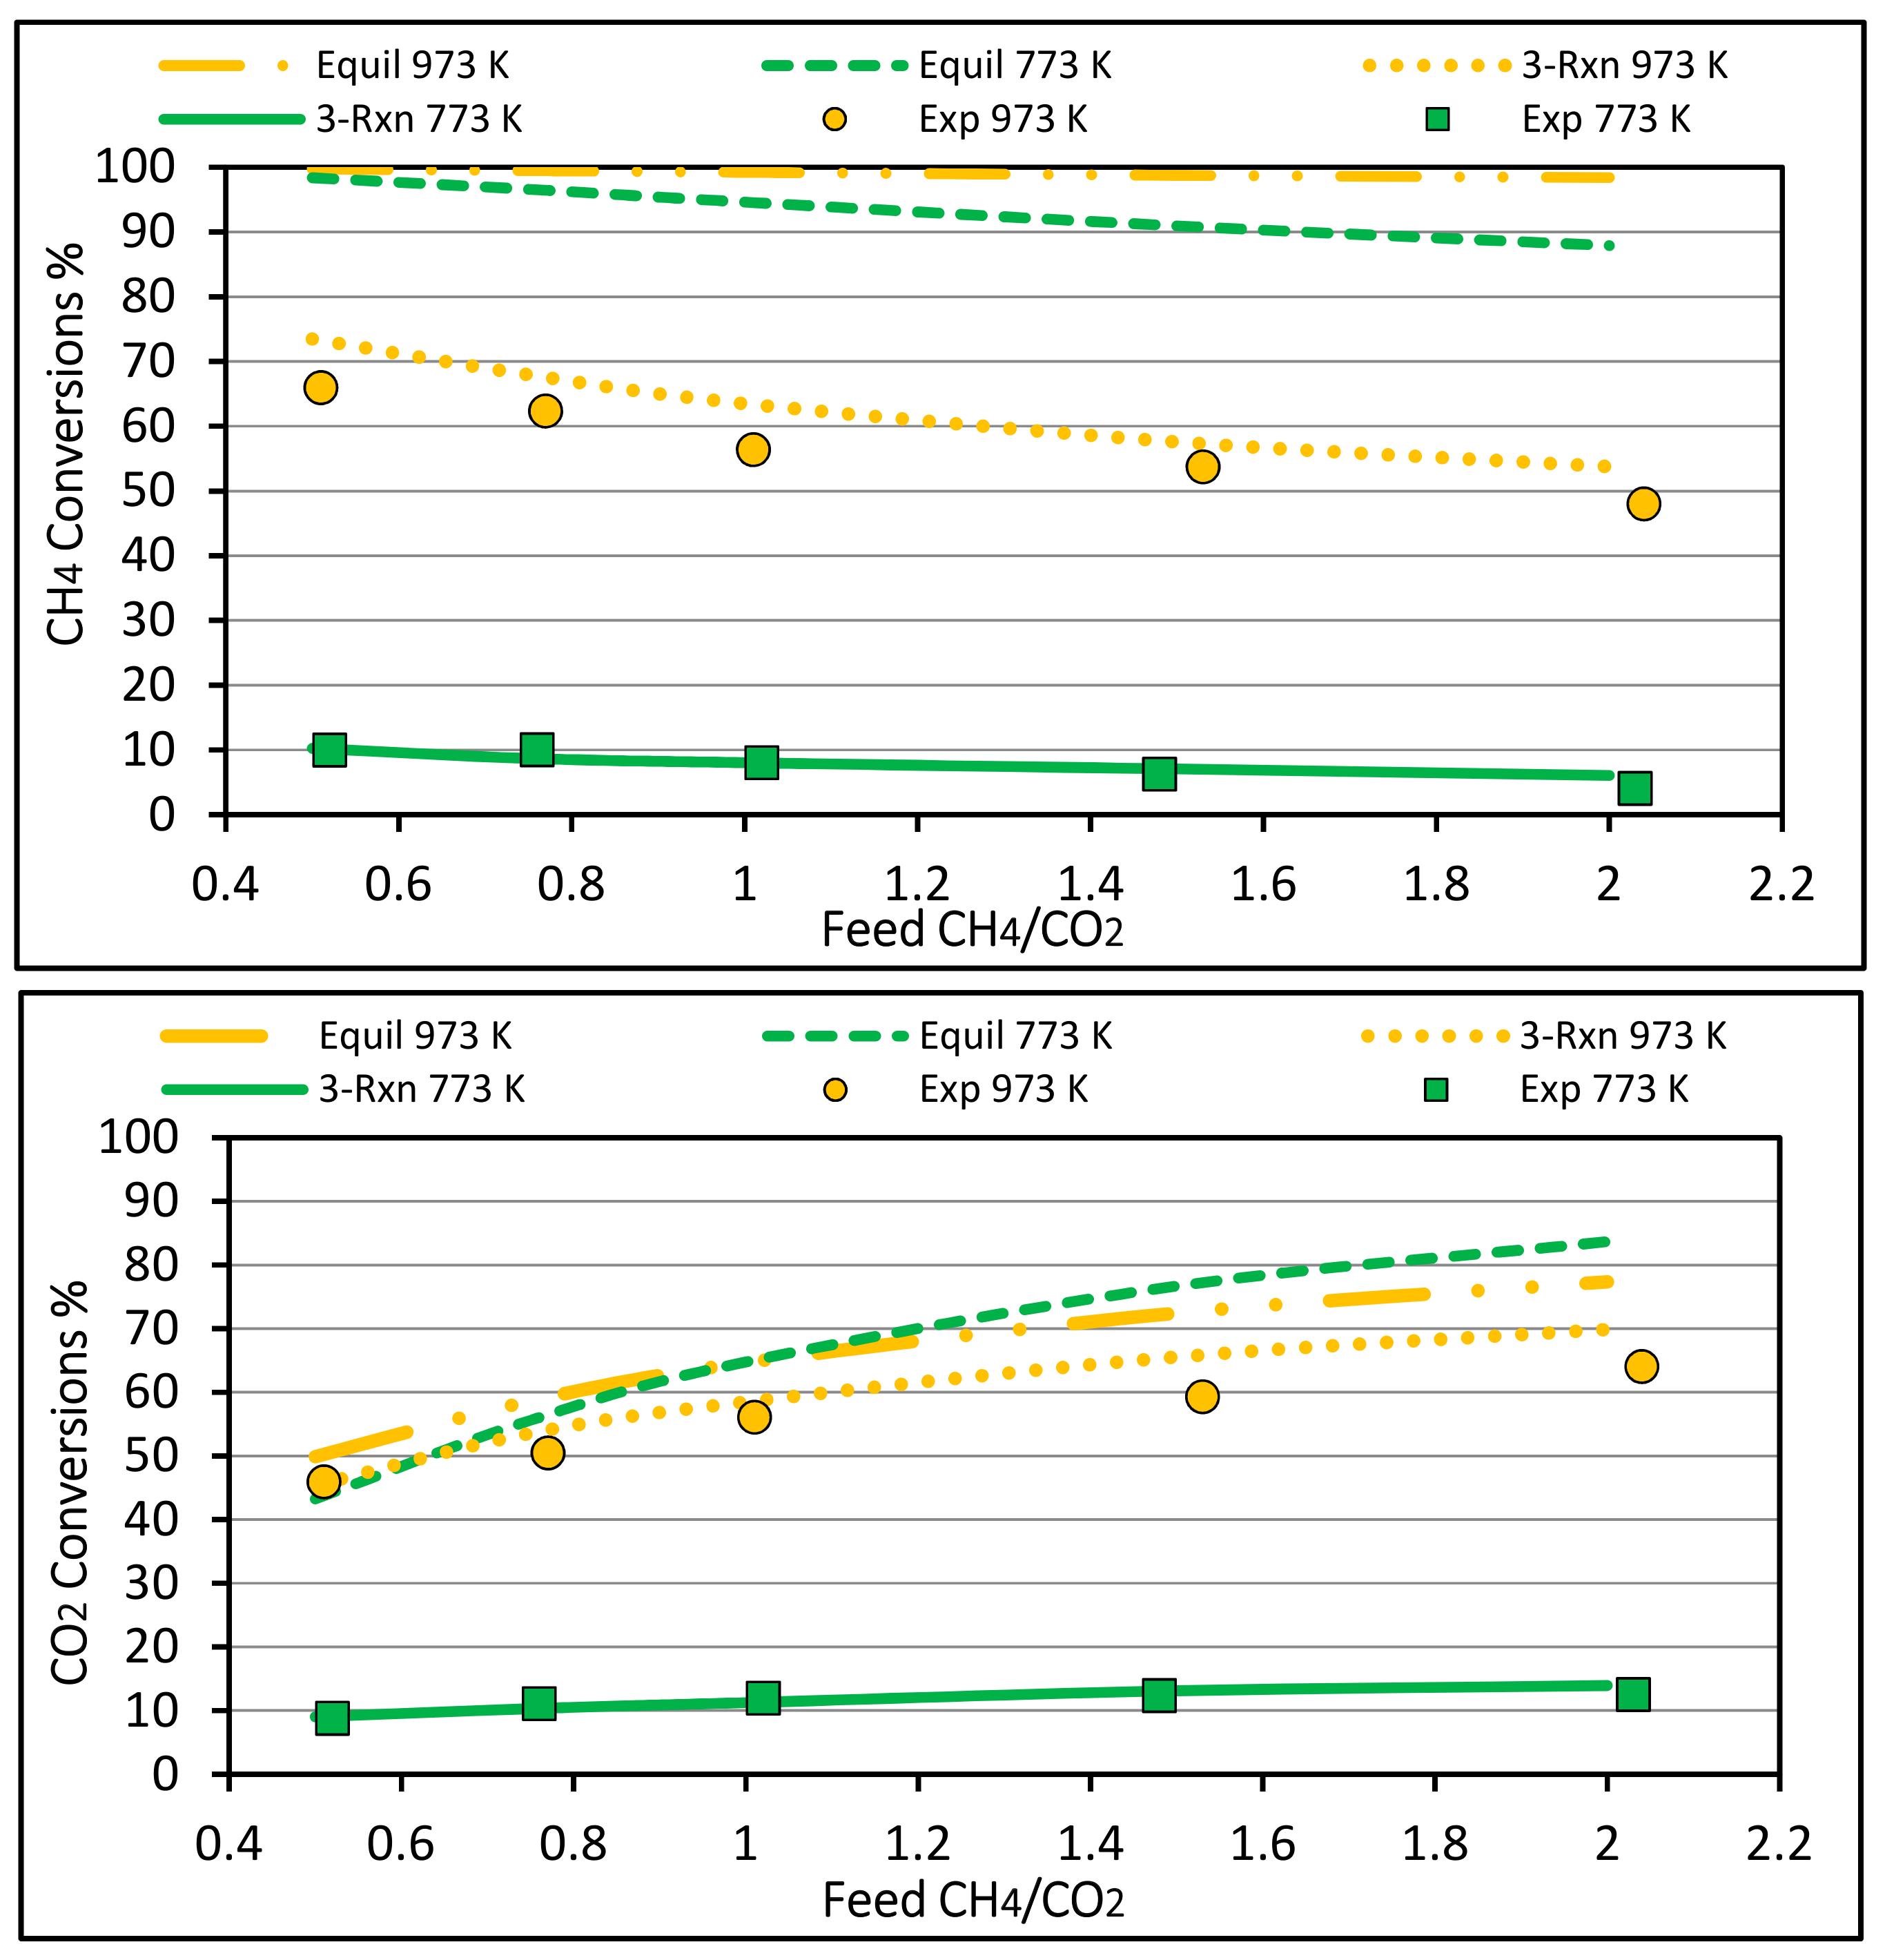
The CH4 equilibrium conversions are much greater than in the experiment, and are insensitive to temperature, suggesting a kinetic potential to improve conversions. Other experimental temperature runs showed similarly consistent results. Figure 10 shows similar results with variation of feed CH4/CO2. At 973 K, experimental CO2 conversions are much closer to equilibrium, suggesting that 973 K is nearly the upper temperature limit for improving CO2 conversions with this catalyst.
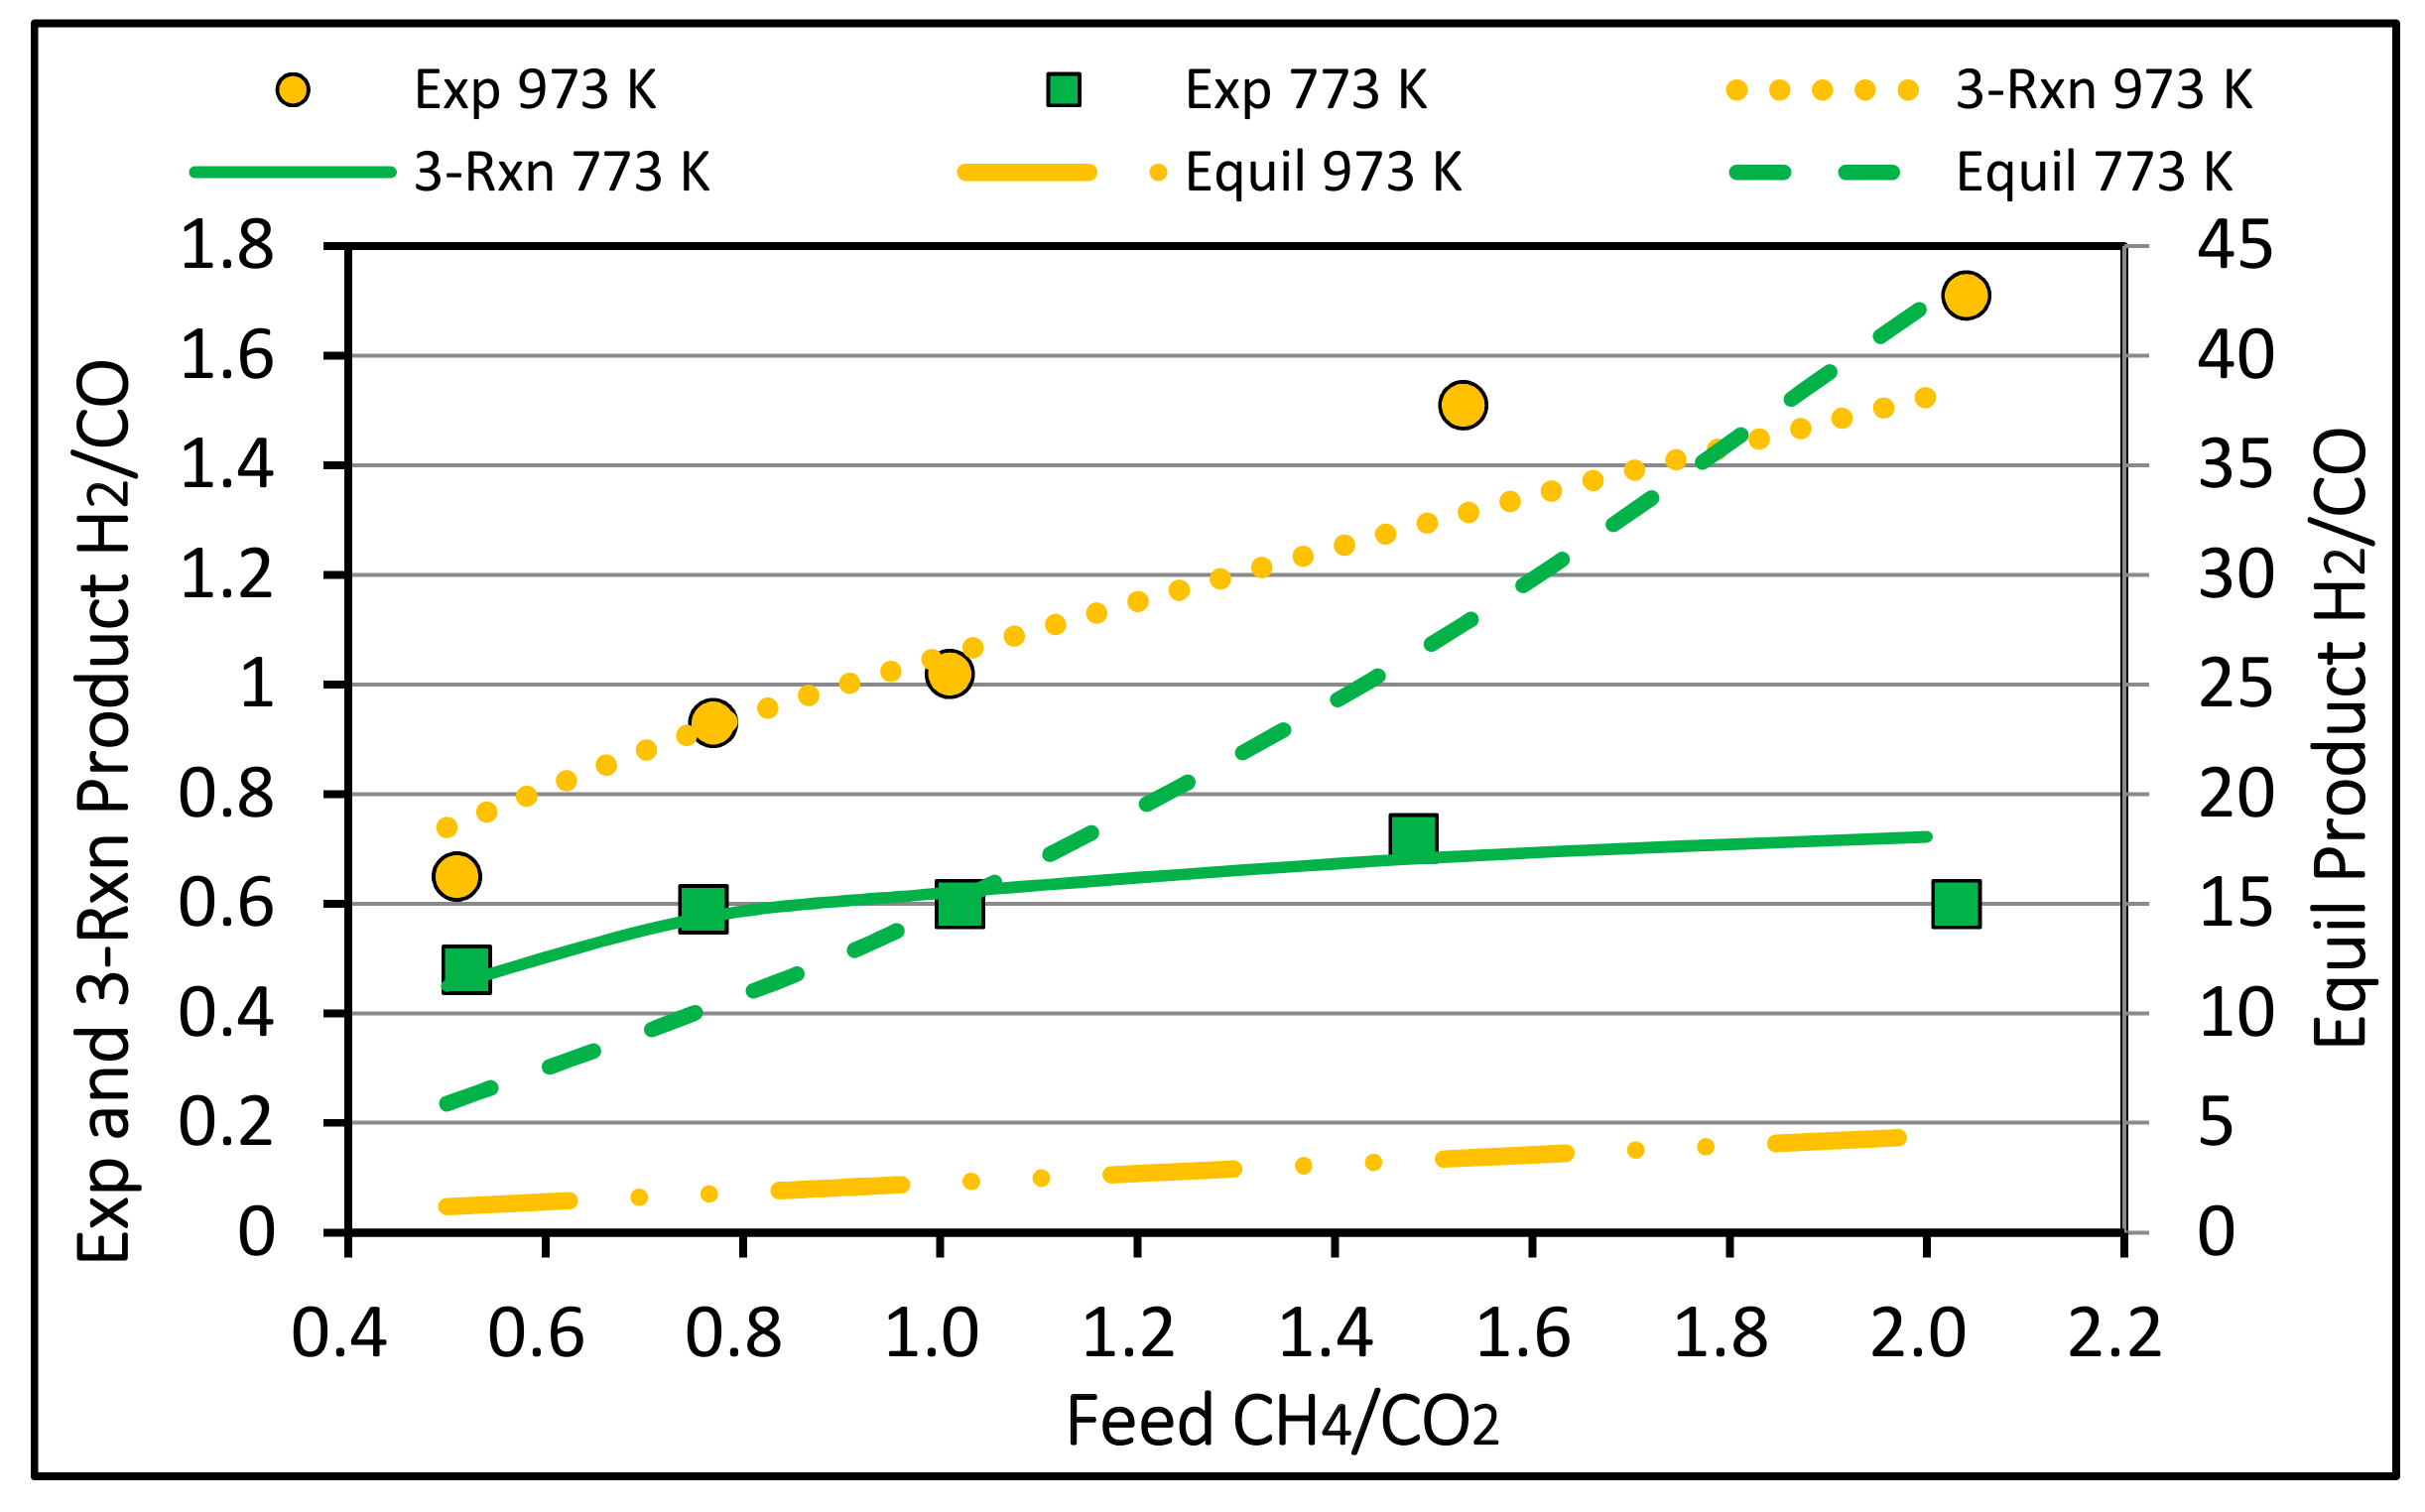
4.3. Syngas Molar Ratio H2/CO
As a high syngas H2/CO ratio is often preferred for many processes, the product mole fraction ratio H2/CO is an important index of reforming catalyst effectiveness [34]. Figure 11 shows that higher temperatures and feed CH4/CO2 favor higher H2/CO. The 3-reaction global model simulates well the experimental values. At both 773 and 973 K, equilibrium ratios far exceed the observed values.
The stoichiometric H2/CO for the ideal DR reaction is 1.0. At 773 K, the observed H2/CO at feed CH4/CO2 = 1 is <1. This is attributed to the RWGS reaction, which is more thermodynamically favored at these relatively low temperatures [35]. At 973 K with CH4/CO2 = 1, the experimental H2/CO is ≈1.0.
4.4. Comparison of Ru/CNT to Pt_Pd/CNT
A study similar to the one presented here was performed earlier with Pt_Pd/CNT catalyst, also admixed with inert zeolite [24]. Both the Ru/CNT and Pt_Pd/CNT catalysts were prepared in very similar ways. Based on CO adsorption and BET surface area tests of the metal/CNT-zeolite catalysts, the Pt_Pd and Ru catalyst site densities were estimated as 1.3 × 10⁻⁷ and 9.0 × 10⁻⁸ mole/m2, respectively [23].
Table 6 presents calculated results from the 3-reaction (DR, RWGS, MD) engineering kinetic models presented in this paper for Ru, and in [24] for Pt_Pd. Each simulation was run with a hypothetical packed-bed reactor with 1 gram of metal/CNT-zeolite catalyst held at a constant 773 K, 3.03 × 10⁵ Pa pressure, feeding CH4 and CO2 at 5.6 × 10⁻⁵ mole/s total rate (equimolar). While the differences are fairly small, there is a definite trend that the Ru/CNT catalyst, even with a smaller site density, produces a synthesis gas richer in H2. The drawback is a slightly larger Cs.
5. Conclusions
An Ru catalyst supported on CNT, prepared by a novel microwave synthesis technique, was tested for activity on dry reforming (DR) of CH4 to synthesis gas. The DR studies were undertaken in an isothermal packed bed reactor. The catalyst showed impressive activity and stability at modest temperatures. The outlet species concentrations and conversions were influenced by temperature and feed molar ratio of CH4/CO2. Based on the analysis of the experiment data, a small amount of carbon deposition was observed during DR, and it was enhanced by higher temperatures and feed CH4/CO2. Reactant conversions did not reach equilibrium values, suggesting potential to improve conversions and product yield. In order to account for both observed reactant conversions and product species concentrations, a global engineering model consisting of three reversible reactions was developed. The model reactions are dry reforming (ideal), reverse water gas shift, and methane decomposition. The three-reaction model adequately represents the observed species profiles as functions of temperature (773–973 K) and feed CH4/CO2 (0.5–2.0). Linear Arrhenius plots for the forward rate constants are observed for each reaction in the model over the calibration temperature range. The calibrated engineering model for the Ru/CNT catalyst predicts a higher selectivity and yield for H2 in comparison to previously published results for a similarly prepared Pt_Pd/CNT catalyst from our group, although at the expense of slightly more carbon deposits.
Author Contributions
Catalyst preparation and characterization: K.C.; Kinetic data collection and analyses: Y.Z.; Software preparation for data analysis: Y.Z.; Experiment simulations: Y.Z.; Writing—Original Draft Preparation, Y.Z.; Writing—Review and Editing: R.B., S.M.; Project Supervision: S.M., R.B.; Funding Acquisition: S.M. All authors have read and agreed to the published version of the manuscript.
Funding
This work was supported by the National Institute of Environmental Health Sciences (NIEHS) under Grant No. R01ES023209. Any opinions, findings, and conclusions or recommendations expressed in this material are those of the author(s) and do not necessarily reflect the views of the NIEHS.
Acknowledgments
The authors appreciate support from their respective departments, as well as a Faculty Instrument Usage Grant from the NJIT Material Characterization Laboratory.
Conflicts of Interest
None of the authors have any conflicts of interest regarding the work presented here.
References
- Kanellos, M. The Mind-Boggling Statistics around Wasted Natural Gas. Forbes. Available online: http://www.forbes.com/sites/michaelkanellos/2015/01/29/the-mind-boggling-statistics-around-wasted-natural-gas/#14587d1a7e18 (accessed on 29 January 2015).
- Nunez, C. Oil Drillers’ Burning of Natural Gas Costs U.S. Millions in Revenue. In National Geographic; National Geographic Partners: Washington, DC, USA, 2014. [Google Scholar]
- Yang, S.; Dezember, R. The U.S. is overflowing with Natural Gas. Not Everyone Can Get It. Wall Street Journal, 8 July 2019. [Google Scholar]
- Harder, A. EPA to Propose Rules Cutting Methane Emissions from Oil and Gas Drilling. Wall Street Journal, 17 August 2015. [Google Scholar]
- Elrod, M.J. Greenhouse Warming Potentials from the Infrared Spectroscopy of Atmospheric Gases. J. Chem. Educ. 1999, 76, 1702. [Google Scholar] [CrossRef]
- Usman, M.; Daud, W.W.; Abbas, H.F. Dry reforming of methane: Influence of process parameters—A review. Renew. Sustain. Energy Rev. 2015, 45, 710–744. [Google Scholar] [CrossRef] [Green Version]
- Ma, Q.; Wang, D.; Wu, M.; Zhao, T.; Yoneyama, Y.; Tsubaki, N. Effect of catalytic site position: Nickel nanocatalyst selectively loaded inside or outside carbon nanotubes for methane dry reforming. Fuel 2013, 108, 430–438. [Google Scholar] [CrossRef]
- Qu, Y.; Sutherland, A.M.; Guo, T. Carbon Dioxide Reforming of Methane by Ni/Co Nanoparticle Catalysts Immobilized on Single-Walled Carbon Nanotubes. Energy Fuels 2008, 22, 2183–2187. [Google Scholar] [CrossRef]
- Wu, T.; Zhang, Q.; Cai, W.; Zhang, P.; Song, X.; Sun, Z.; Gao, L. Phyllosilicate evolved hierarchical Ni- and Cu–Ni/SiO2 nanocomposites for methane dry reforming catalysis. Appl. Catal. A Gen. 2015, 503, 94–102. [Google Scholar] [CrossRef]
- Drif, A.; Bion, N.; Brahmi, R.; Ojala, S.; Pirault-Roy, L.; Turpeinen, E.; Seelam, P.K.; Keiski, R.L.; Epron, F. Study of the dry reforming of methane and ethanol using Rh catalysts supported on doped alumina. Appl. Catal. A Gen. 2015, 504, 576–584. [Google Scholar] [CrossRef]
- Hinkley, J.; Agrafiotis, C. Solar Thermal Energy and its Conversion to Solar Fuels via Thermochemical Processes. In Chapter 9, Polygeneration with Polystorage for Chemical and Energy Hubs for Energy and Chemicals; Khalilpour, K.R., Ed.; Academic Press: Cambridge, MA, USA, 2019; pp. 247–286. [Google Scholar]
- Park, J.-H.; Yeo, S.; Chang, T.S. Effect of supports on the performance of Co-based catalysts in methane dry reforming. J. CO2 Util. 2018, 26, 465–475. [Google Scholar] [CrossRef]
- Zhang, J.; Li, F. Coke-resistant Ni@SiO2 catalyst for dry reforming of methane. Appl. Catal. B Environ. 2015, 176, 513–521. [Google Scholar] [CrossRef]
- Yamagishi, T.; Furikado, I.; Ito, S.; Miyao, T.; Naito, S.; Tomishige, K.; Kunimori, K. Catalytic Performance and Characterization of RhVO4/SiO2 for Hydroformylation and CO Hydrogenation. J. Mol. Catal. A Chem. 2006, 244, 201–212. [Google Scholar] [CrossRef]
- Giehr, A.; Maier, L.; Schunk, S.A.; Deutschmann, O. Thermodynamic Considerations on the Oxidation State of Co/γ-Al2 O3 and Ni/γ-Al2 O3 Catalysts under Dry and Steam Reforming Conditions. ChemCatChem 2018, 10, 751–757. [Google Scholar] [CrossRef]
- Song, Y.; Ozdemir, E.; Ramesh, S.; Adishev, A.; Subramanian, S.; Harale, A.; AlBuali, M.; Fadhel, B.A.; Jamal, A.; Moon, D.; et al. Dry reforming of methane by stable Ni–Mo nanocatalysts on single-crystalline MgO. Science 2020, 367, 777–781. [Google Scholar] [CrossRef] [PubMed]
- Tomishige, K.; Asadullah, M.; Kunimori, K. Syngas Production by Biomass Gasification Using Rh/CeO2/SiO2 Catalysts and Fluidized Bed Reactor. Catal. Today 2004, 89, 389–403. [Google Scholar] [CrossRef]
- Iijima, S. Helical microtubules of graphitic carbon. Nature 1991, 354, 56–58. [Google Scholar] [CrossRef]
- Fu, X.; Yu, H.; Peng, F.; Wang, H.; Qian, Y. Facile Preparation of RuO2 /CNT Catalyst by a Homogeneous Oxidation Precipitation Method and Its Catalytic Performance. Appl. Catal. A Gen. 2007, 321, 190–197. [Google Scholar] [CrossRef]
- Donphai, W.; Faungnawakij, K.; Chareonpanich, M.; Limtrakul, J. Effect of Ni-CNTs/mesocellular silica composite catalysts on carbon dioxide reforming of methane. Appl. Catal. A Gen. 2014, 475, 16–26. [Google Scholar] [CrossRef]
- Khavarian, M.; Chai, S.-P.; Mohamed, A.R. The effects of process parameters on carbon dioxide reforming of methane over Co–Mo–MgO/MWCNTs nanocomposite catalysts. Fuel 2015, 158, 129–138. [Google Scholar] [CrossRef]
- Kim, J.-Y.; Kim, K.-H.; Park, S.-H.; Kim, K.-B. Microwave-polyol synthesis of nanocrystalline ruthenium oxide nanoparticles on carbon nanotubes for electrochemical capacitors. Electrochim. Acta 2010, 55, 8056–8061. [Google Scholar] [CrossRef]
- Zhu, Y. CO2 Reduction over Nobel Metal/Carbon Nanotube Catalyst. Ph.D. Thesis, Chemical Engineering Department, New Jersey Institute of Technology, Newark, NJ, USA, 2017. [Google Scholar]
- Zhu, Y.; Chen, K.; Yi, C.; Mitra, S.; Barat, R. Dry reforming of methane over palladium–platinum on carbon nanotube catalyst. Chem. Eng. Commun. 2018, 205, 888–896. [Google Scholar] [CrossRef]
- Chemkin-Pro Version 15131. Reaction Design, San Diego. Available online: http://www.ansys.com/products/fluids/ansys-chemkin-pro (accessed on 1 March 2017).
- Reynolds, W.C. The Element Potential Method for Chemical Equilibrium Analysis: Implementation in the Interactive Program STANJAN; Department of Mechanical Engineering, Stanford University: Stanford, CA, USA, 1986. [Google Scholar]
- Pakhare, D.; Spivey, J.J. A review of dry (CO2) reforming of methane over noble metal catalysts. Chem. Soc. Rev. 2014, 43, 7813–7837. [Google Scholar] [CrossRef] [PubMed]
- Wei, J.; Iglesia, E. Mechanism and Site Requirements for Activation and Chemical Conversion of Methane on Supported Pt Clusters and Turnover Rate Comparisons among Noble Metals. J. Phys. Chem. B 2004, 108, 4094–4103. [Google Scholar] [CrossRef]
- Bale, C.; Belisle, E. Reaction Web. Available online: http://www.crct.polymtl.ca/reacweb.htm (accessed on 1 June 2016).
- Foppa, L.; Silaghi, M.-C.; Larmier, K.; Comas-Vives, A. Intrinsic reactivity of Ni, Pd and Pt surfaces in dry reforming and competitive reactions: Insights from first principles calculations and microkinetic modeling simulations. J. Catal. 2016, 343, 196–207. [Google Scholar] [CrossRef]
- Zhu, Y.; Al-Ebbinni, N.; Henney, R.; Yi, C.; Barat, R. Extension to multiple temperatures of a three-reaction global kinetic model for methane dehydroaromatization. Chem. Eng. Sci. 2018, 177, 132–138. [Google Scholar] [CrossRef]
- Li, L.; Borry, R.W.; Iglesia, E. Design and optimization of catalysts and membrane reactors for the non-oxidative conversion of methane. Chem. Eng. Sci. 2002, 57, 4595–4604. [Google Scholar] [CrossRef]
- Karakaya, C.; Morejudo, S.H.; Zhu, H.; Kee, R.J. Catalytic Chemistry for Methane Dehydroaromatization (MDA) on a Bifunctional Mo/HZSM-5 Catalyst in a Packed Bed. Ind. Eng. Chem. Res. 2016, 55, 9895–9906. [Google Scholar] [CrossRef]
- Bartholomew, C.H.; Farrauto, R.J. Industrial Catalysis Processes; John Wiley & Sons, Inc.: Hoboken, NJ, USA, 2005. [Google Scholar]
- Quiroga, M.M.B.; Luna, A.E.C. Kinetic Analysis of Rate Data for Dry Reforming of Methane. Ind. Eng. Chem. Res. 2007, 46, 5265–5270. [Google Scholar] [CrossRef]
Figure 1.
(a) scanning electron microscope (SEM, 100× magnification) and (b) transmission electron microscope (TEM, 300× magnification) images of the synthesized ruthenium/carbon nanotube (Ru/CNT). The Ru nanoparticles are the very tiny (1–5 × 10⁻⁹ m) black spots in the TEM.
Figure 1.
(a) scanning electron microscope (SEM, 100× magnification) and (b) transmission electron microscope (TEM, 300× magnification) images of the synthesized ruthenium/carbon nanotube (Ru/CNT). The Ru nanoparticles are the very tiny (1–5 × 10⁻⁹ m) black spots in the TEM.

Figure 2.
Thermogravimetric analysis (TGA) of Ru/CNT in air.

Figure 3.
Carbon balance for all runs over Ru/CNT-zeolite. Circle I: 773, 823, 873 K; Circle II: 923, 973 K; Circle III: 973 K at higher feed CH4/CO2.
Figure 3.
Carbon balance for all runs over Ru/CNT-zeolite. Circle I: 773, 823, 873 K; Circle II: 923, 973 K; Circle III: 973 K at higher feed CH4/CO2.

Figure 4.
Forward rate constants ki from Table 5 for Reaction (Rxn) 1 (DR), 2 (RWGS), 3 (MD).
Figure 4.
Forward rate constants ki from Table 5 for Reaction (Rxn) 1 (DR), 2 (RWGS), 3 (MD).

Figure 5.
Experimental outlet data, and global model-simulated species PBR profiles: T = 923 K, feed CH4/CO2 = 0.5, gas space velocity (GSV) = 5.56 × 10⁻⁴ m3/s-kg. “Sim” = model-simulated, “Exp” = experiment.
Figure 5.
Experimental outlet data, and global model-simulated species PBR profiles: T = 923 K, feed CH4/CO2 = 0.5, gas space velocity (GSV) = 5.56 × 10⁻⁴ m3/s-kg. “Sim” = model-simulated, “Exp” = experiment.

Figure 6.
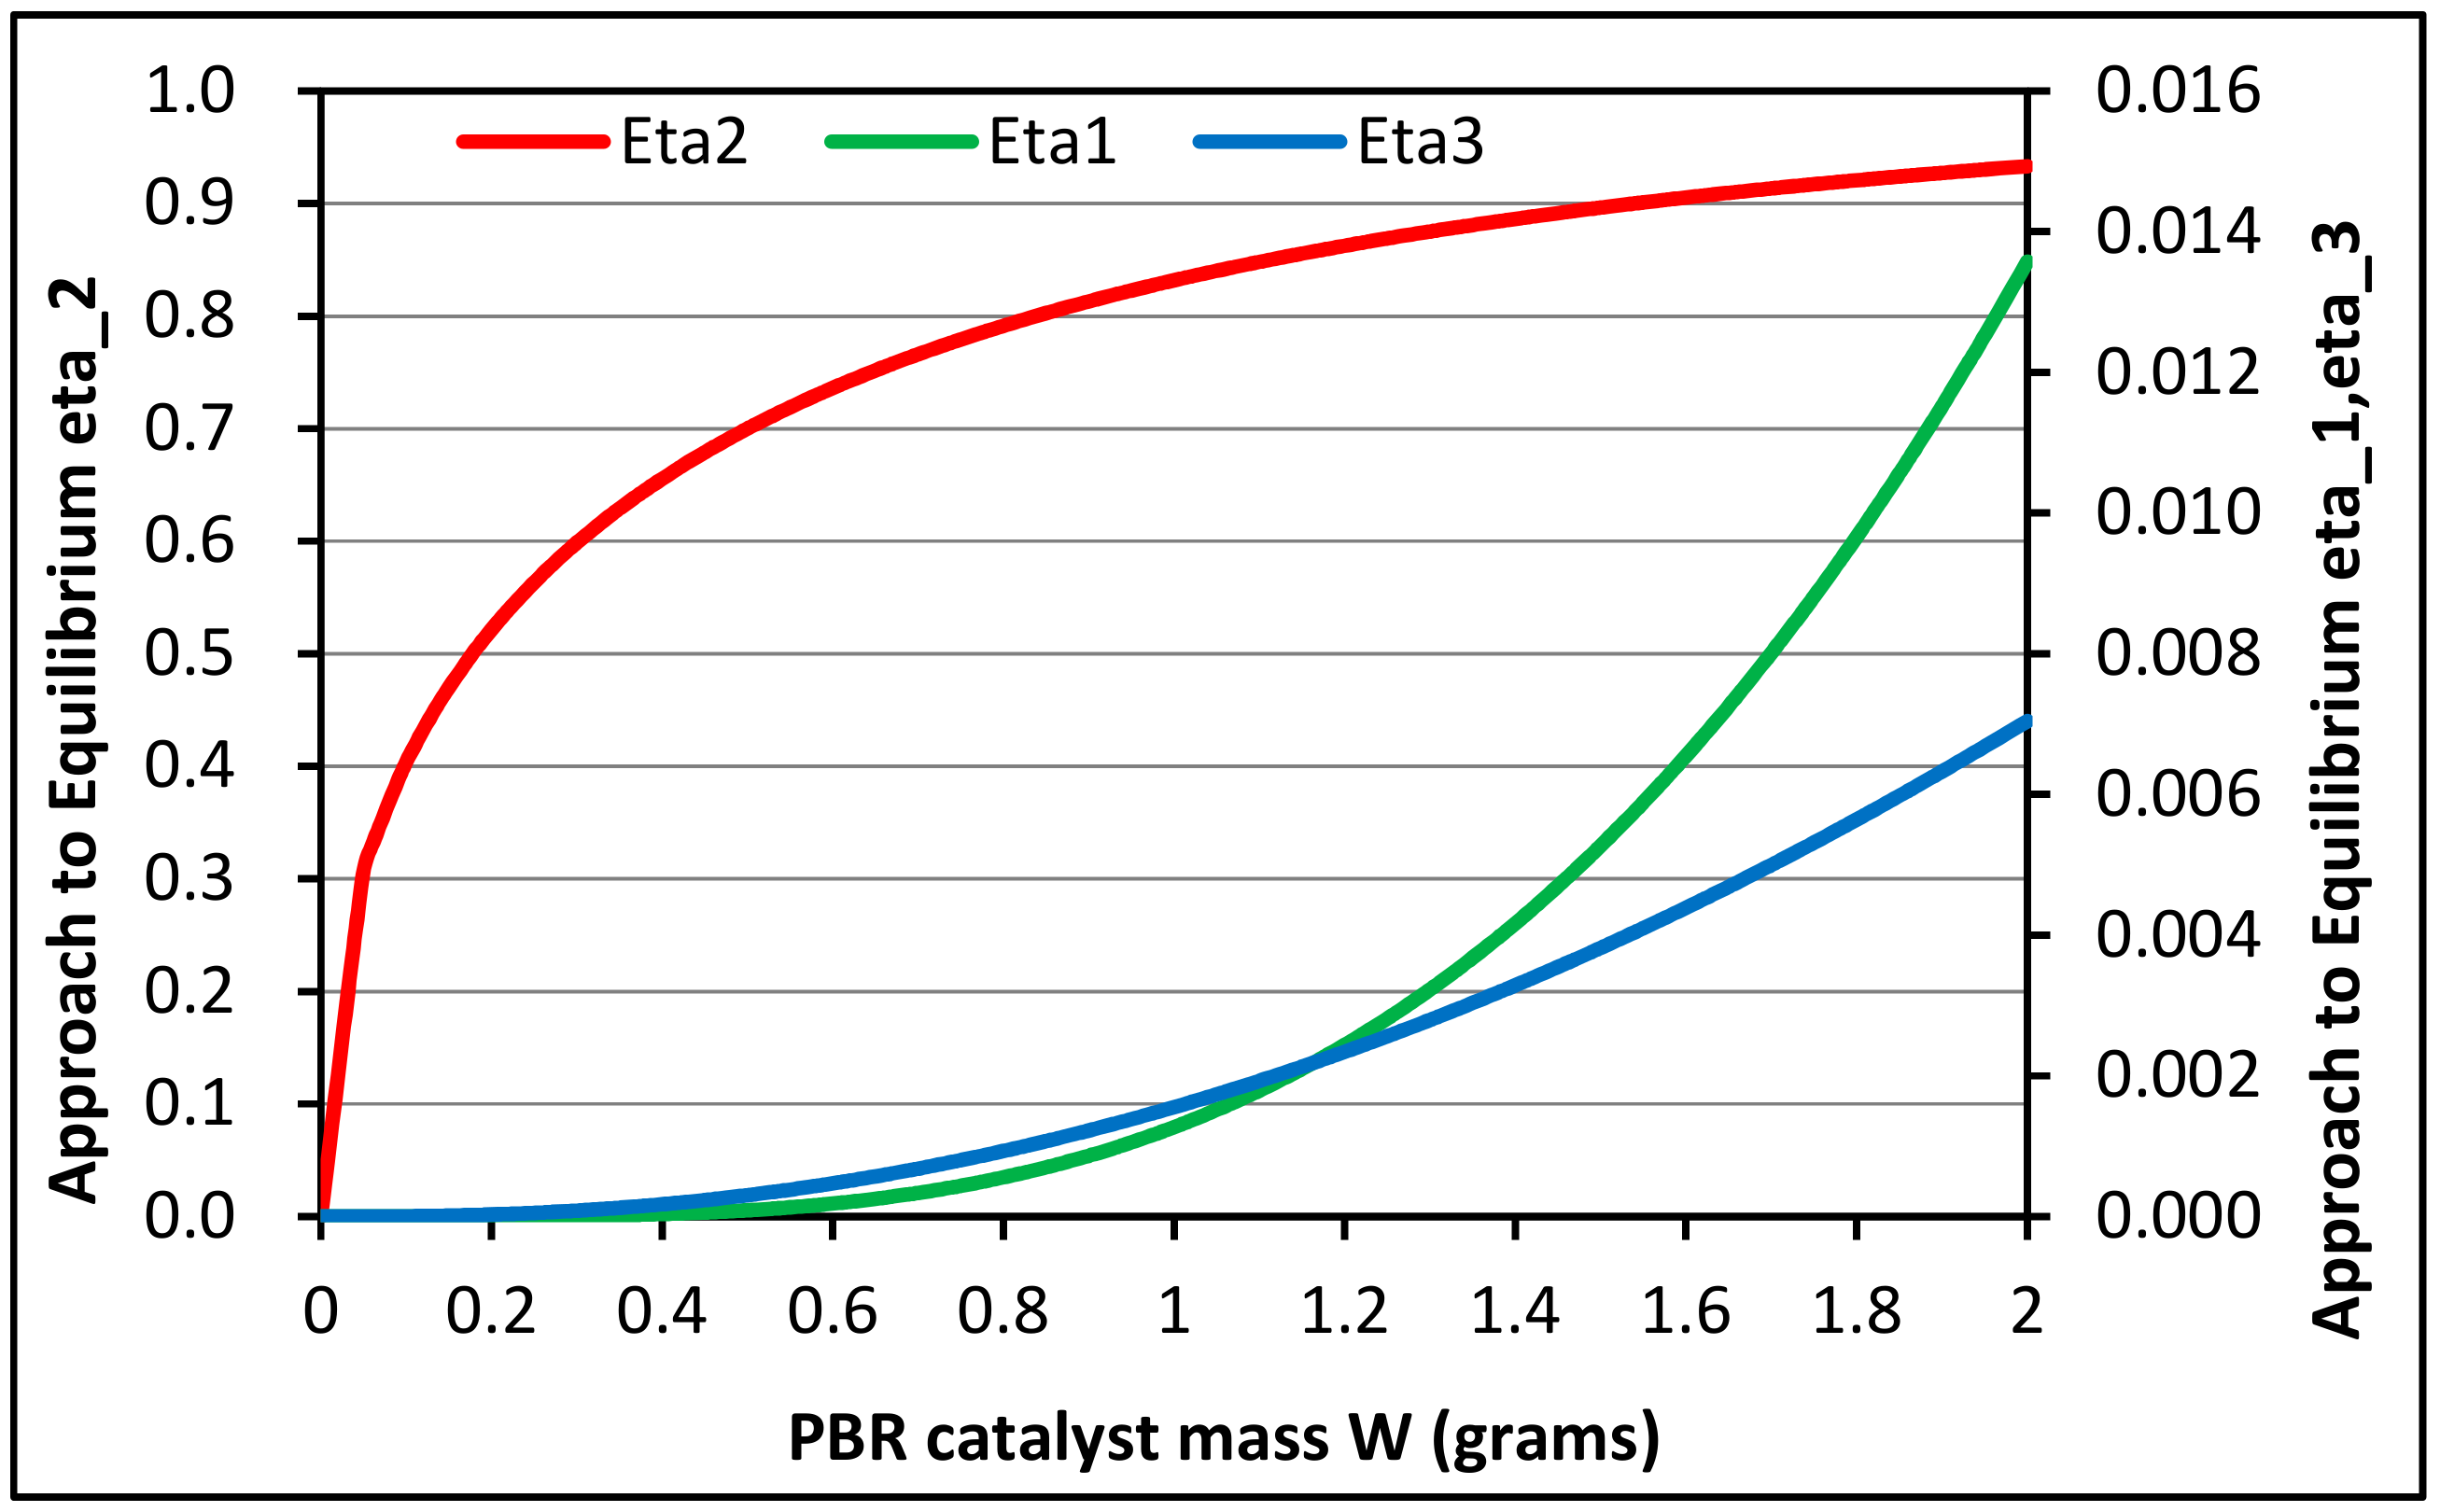
Equilibrium approaches (ηi): T = 923 K, feed CH4/CO2 = 0.5, GSV = 5.56 × 10⁻⁴ m3/s-kg, corresponding to Figure 5. “Eta i” = ηi for Reactions 1 (DR), 2 (RWGS), 3 (MD).
Figure 6.
Equilibrium approaches (ηi): T = 923 K, feed CH4/CO2 = 0.5, GSV = 5.56 × 10⁻⁴ m3/s-kg, corresponding to Figure 5. “Eta i” = ηi for Reactions 1 (DR), 2 (RWGS), 3 (MD).

Figure 7.
Comparison of experimental and 3-reaction (rxn) model-based outlet concentrations for cases: 873 K and GSV = 5.56 × 10⁻⁴ m3/s-kg.
Figure 7.
Comparison of experimental and 3-reaction (rxn) model-based outlet concentrations for cases: 873 K and GSV = 5.56 × 10⁻⁴ m3/s-kg.

Figure 8.
Comparison of experimental and 3-reaction model-based outlet concentrations for cases: CH4/CO2 = 1.0 and GSV = 5.56 × 10⁻⁴ m3/s-kg.
Figure 8.
Comparison of experimental and 3-reaction model-based outlet concentrations for cases: CH4/CO2 = 1.0 and GSV = 5.56 × 10⁻⁴ m3/s-kg.

Figure 9.
Impact of temperature on CH4 (upper plot) and CO2 (lower plot) conversions at GSV = 5.56 × 10⁻⁴ m3/s-kg; feed CH4/CO2 = 0.5, 2.0. “Exp” = experiment; “Equil” = equilibrium
Figure 9.
Impact of temperature on CH4 (upper plot) and CO2 (lower plot) conversions at GSV = 5.56 × 10⁻⁴ m3/s-kg; feed CH4/CO2 = 0.5, 2.0. “Exp” = experiment; “Equil” = equilibrium

Figure 10.
Impact of feed CH4/CO2 on conversion of CH4 and CO2 at GSV = 5.56 × 10⁻⁴ m3/s-kg.

Figure 11.
Effect of temperature, feed molar ratio on H2/CO at GSV = 5.56 × 10⁻⁴ m3/s-kg.


Table 1.
Elemental analysis of samples by energy-dispersive X-ray spectroscopy (EDX).
| C | O | Fe | Ni | Ru | |
|---|---|---|---|---|---|
| Raw CNTs | 96.50 | 1.38 | 0.68 | 1.44 | - |
| Ru/CNTs | 83.97 | 7.28 | - | - | 8.75 |
Table 2.
Impact of solid carbon (Cs) on equilibrium; T = 973 K, P = 3.03 × 10⁵ Pa, initial CH4/CO2 = 1.
Table 2.
Impact of solid carbon (Cs) on equilibrium; T = 973 K, P = 3.03 × 10⁵ Pa, initial CH4/CO2 = 1.
| Species | Feed (Mole Fractions) | Equil (w/o Cs) (Mole Fracs) | Equil (w/Cs) (Mole Fractions) |
|---|---|---|---|
| CH4 | 0.0725 | 0.0227 | 0.0010 |
| CO2 | 0.0725 | 0.0160 | 0.0284 |
| CO | -- | 0.0930 | 0.0253 |
| H2 | -- | 0.0796 | 0.0802 |
| H2O | -- | 0.0067 | 0.0440 |
| He | 0.8550 | 0.7820 | 0.7497 |
| Cs | n/a | n/a | 0.0714 |
| SUM | 1.0000 | 1.0000 | 1.0000 |
| H2/CO | n/a | 0.856 | 3.17 |
Table 3.
Global kinetic engineering model with primary dry reforming (DR) and secondary reverse water gas shift (RWGS), methane decomposition (MD) reactions.
Table 3.
Global kinetic engineering model with primary dry reforming (DR) and secondary reverse water gas shift (RWGS), methane decomposition (MD) reactions.
| Reaction | Rate Expression ri | Appr. to Equil. ηi | Kpi |
|---|---|---|---|
| Dry Reforming CH4 + CO2 = 2CO + 2H2 | |||
| Reverse Water Gas Shift CO2 + H2 = CO + H2O | |||
| Methane Decomposition CH4 = Cs + 2H2 |
Table 4.
Key packed-bed reactor (PBR) simulation equations using 3-reaction global model (Table 3).
Table 4.
Key packed-bed reactor (PBR) simulation equations using 3-reaction global model (Table 3).
| PBR Balances Species j | Net Rates rj | Mole Fractions yj | Partial Pressures |
|---|---|---|---|
At W = 0, Fjo = value | Total molar rate includes inert gas | P = total pressure |
| Reaction i | Parameter Ai (mole, s, kg_cat, Pa) | Parameter Ei (J/mole) |
|---|---|---|
| 1 | 8.575 × 10⁻⁸ | 82,446 |
| 2 | 0.109 | 110,646 |
| 3 | 0.206 | 128,064 |
Table 6.
Comparison of performances from Ru/CNT (model, this study) and Pt_Pd/CNT (model from [21]). T = 773K, P = 3.03 × 10⁵ Pa, 0.001 kg catalyst, total feed 5.6 × 10⁻⁵ mole/s, feed CH4/CO2 = 1.
Table 6.
Comparison of performances from Ru/CNT (model, this study) and Pt_Pd/CNT (model from [21]). T = 773K, P = 3.03 × 10⁵ Pa, 0.001 kg catalyst, total feed 5.6 × 10⁻⁵ mole/s, feed CH4/CO2 = 1.
| XCH4 | XCO2 | YCO | YH2 | YCs | SCO | SH2 | SCs | H2/CO | |
|---|---|---|---|---|---|---|---|---|---|
| Ru/CNT | 0.084 | 0.099 | 0.180 | 0.076 | 0.0021 | 2.148 | 0.901 | 0.0255 | 0.838 |
| Pt_Pd/CNT | 0.075 | 0.091 | 0.164 | 0.066 | 0.0016 | 2.201 | 0.879 | 0.0213 | 0.798 |
© 2020 by the authors. Licensee MDPI, Basel, Switzerland. This article is an open access article distributed under the terms and conditions of the Creative Commons Attribution (CC BY) license (http://creativecommons.org/licenses/by/4.0/).
Share and Cite
MDPI and ACS Style
Zhu, Y.; Chen, K.; Barat, R.; Mitra, S. Dry Reforming of Methane over a Ruthenium/Carbon Nanotube Catalyst. ChemEngineering 2020, 4, 16. https://doi.org/10.3390/chemengineering4010016
AMA Style
Zhu Y, Chen K, Barat R, Mitra S. Dry Reforming of Methane over a Ruthenium/Carbon Nanotube Catalyst. ChemEngineering. 2020; 4(1):16. https://doi.org/10.3390/chemengineering4010016
Chicago/Turabian StyleZhu, Yuan, Kun Chen, Robert Barat, and Somenath Mitra. 2020. "Dry Reforming of Methane over a Ruthenium/Carbon Nanotube Catalyst" ChemEngineering 4, no. 1: 16. https://doi.org/10.3390/chemengineering4010016