1. Introduction
The importance of freely sharing scientific data in support of proliferative and high-quality studies has been widely examined in the e-science literature and facilitated by the development of new digital technologies [
1,
2,
3]. Since the early 2000s, various stakeholders have advocated and made possible the implementation of different types of mandate policies to require researchers to archive raw datasets in publicly available data repositories for everyone in the world to reuse and repurpose [
4,
5]. In the field of biomedical sciences, the National Institute of Health (NIH) initiated a data openness requirement in 2003 for all of its sponsored projects [
6], which was accompanied by an increasing number of major scholarly biomedical journals that set free data sharing as a fulfillment of article acceptance and publishing [
7,
8]. To comply with the policies, many scholars have started making contributions to public data repositories and have become aware of the role open access plays in digital scholarly communication.
Yet, the rate of changes in scholars’ attitudes toward and involvements in data sharing is still lower than many may have expected. It was recently discovered that less than fifty percent of authors in the field of biomedical sciences have participated in the open data efforts, despite the decade-long open access promotion including various mandate policies. Most researchers still withhold data and disregard the call for a broad information exchange [
9]. Among other reasons such as technical difficulties, secrecy is still a prevalent fact of life in the community. To better understand the behaviors of biomedical scientists in free data management, it is useful to explore the contribution patterns of open scientific dataset and identify those who have made raw data available to the scholarly community and determine the correlations between mandatory policies and data contributions. Previous studies focused on assessing the connections between researchers’ actions in data contributions and their prior practices in data use as well as differences among various domain environments [
10], leaving other areas of exploration such as temporal and spatial analyses of data sharing largely unknown.
This research identifies a list of 13,785 journal articles whose authors have archived related datasets in a popular biomedical data repository, the Genome Expression Omnibus (GEO), after these articles were published in journals formally and became available in the PubMed database. Statistical analyses are conducted to answer the questions about data contributions and mandate implementations through time and across space. The purpose of this research is to seek changing patterns of raw data availability. It is our hope that such an analysis will help institutional administrators and open access professionals to adjust data management policies so as to increase the number of quality free datasets and enhance data usability. Biomedical scientists, as well as scholars in other fields, may also find the analysis useful for guiding their future data contributions.
2. Background
Open access (OA), facilitated by the Internet communication and motivated by an ever increasing subscription cost to scholarly journals and a sluggish publishing cycle, has a history of more than two decades, during which time scholars have experienced slow changes in their attitudes toward and participation in making contributions to the efforts of the digital information exchange [
11]. Overall, the rate of scholars’ involvements in the movement is far less than many OA advocates have anticipated. Using content size of e-print repositories as the evidence of scholars’ contributions, as many as 886 institution-based repositories were found as of 2010, while their content volumes were prevailingly small [
12]. Back in 2004, studies showed that the average number of documents per repository was 1250 and the median number was 290 only [
13]. Several years later, the majority of digital repositories still collected only several hundreds of content documents on average [
12]. Reasons causing scholars’ indifference in open access are many, including their concerns about and unfamiliarity to intellectual property infringement, their ignorance of the OA advantages in promoting scholarship and personal visibility, or simply their busy schedule of daily activities.
Various strategies have been adopted by OA advocates and managers to promote open access, e.g., increasing the awareness of OA significance among scholars, mediating self-archiving for faculty authors, and automating the process of self-contributions. Among many other strategies, implementing a mandate policy to require researchers to self-archive their publications in a digital data repository has been proven to be mostly effective. Several studies have already discovered the positive effect of self-archiving mandates [
14,
15]. For example, by analyzing three digital repositories, Sale finds that once a mandate policy has been institutionalized and routinized, “the deposit of articles takes place in a remarkably short time after publication” [
16]. The earliest e-print mandate policy was initiated by the University of Southampton’s School of Electronics and Computer Science in England in 2003 as an institutional mandate for research outcomes [
14]. As of the early 2011, a total of 349 mandate policies of various types were recorded [
17].
The first policy to require scientific data sharing was a funder-based mandate set by NIH in 2003, which was followed by a revision of the policy four years later with stronger language and requirements [
18]. A recently implemented funder-based mandate for data management plans was set by the National Science Foundation in January 2011 [
19]. In early 2013, the White House Office of Science and Technology Policy issued a new open access policy memorandum for increasing public access to federally funded scientific research, including peer-reviewed publications and digital data [
4]. In the fields of physical sciences, particularly biomedical sciences, many scholarly journals have also moved forward to ask the sharing of raw scientific data together with the publishing of analytical results in the form of journal articles [
8,
20].
To facilitate data identification, acquisition, digitization, curation and sharing, many public data repositories have been created. Repository professionals have paid attention to the functionality, accessibility and usability of the open data repositories [
21,
22], and made efforts to ensure successful data archiving, preservation and accurate query results from interoperable online resources. Here, usability refers to “the ease of use and acceptability of a system for a particular set of users carrying out specific tasks in a specific environment” [
23]. The ease of use has an impact on both users’ performance and satisfaction, while acceptability affects whether the system is used or not [
24].
Individual scholars have been widely encouraged to make their raw data publicly accessible in order to support comparative analyses and resource interoperability. In biomedical sciences, it was found that that nearly half of recent gene expression studies “have made their data available somewhere on the internet, after accounting for datasets overlooked by the automated methods of discovery” [
25].
Several centralized public data repositories have played a critical role in supporting data sharing in biomedical studies, specifically in gene expression studies. Of those repositories author-containing submitted data, RNA Abundance Database is based at the University of Pennsylvania as a key resource for gene expression studies, ArrayExpress is managed by the European Bioinformatics Institute as a database for people to submit, query and download data of genomic experiments, CIBEX, short for Center for Information Biology gene Expression database, is a Japanese version of public database for microarray data, and GEO is under the control of the National Center for Biotechnology Information at the National Library of Medicine in the United States.
GEO was first created in 2000 to operate as a free data repository for high-throughput gene expression data generated mostly by microarray technologies. Over the years, the repository has expanded its content coverage to accommodate more data types such as genome copy number variations, genome-wide profiling of DNA-binding proteins, and the next-generation sequencing technologies [
26]. Data submitted to GEO contain three entity types: platform—a descriptive summary of the array and a data table that describes the array template, sample—an explanation of the biological objects and the experimental protocols to which it was subjected, including a data table for hybridization measures for each attribute on the matching platform, and series—a group of related samples defined as part of a research project, which portrays the general research objectives and strategies. The functions of the GEO database also include identifying and producing many related data objects to support data mining and visual presentation and data rearrangement to alternative structures [
27,
28].
As of the late 2011, GEO collected a total of 2720 datasets for 9271 platforms and as many as 611,384 samples, in comparison to 120,000 samples found in GEO around five years ago. Researchers are allowed to submit their data to the repository and are able to use specifically designed tools and web interfaces to query and download gene expression patterns deposited by them and others via GEO designed web interfaces and applications. GEO organizes multiple utilities to assist users in carrying out effective and accurate searches and successful downloads, and presents retrieved data in various visualized forms at the level of individual genes or entire studies. On average, with current amounts of data submission and processing over 10,000 samples per month, GEO now receives more than 40,000 web hits and has 10,000 bulk FTP downloads in a single day [
26].
3. Research Questions
It has been widely recognized that scholars’ awareness of the benefits of open data sharing as well as their expressed willingness to make contributions to free information exchange cannot always guarantee an increase of their actual participations in the new means of scholarly communication: “there is much more support for OA publication in theory than in practice” [
11]. Yet, mandate policy has been considered to be a factor that has a much stronger effect on the frequency of data contributions by authors to public data repositories than that of the factor of open access advocacy, especially when a mandate is executed by a funding agency or a publisher [
17]. With the periodically implemented mandate policies of various types in the past decade, one may expect to observe some waves of increase in the amount of data in the history of GEO operations corresponding to the implementations of major mandates, which becomes the first research question of this study:
RQ1: Is the increase in the contribution rate of genomic data in GEO corresponding to the implementation of major mandate policies by funding agencies in the last decade?
If article authors tend to make data contributions by complying with mandate requirements rather than being self-motivated by propaganda of open access advantages, which has been evidenced in previous discoveries [
29], it will be reasonable to assume that the articles with their raw data opened in a public data repository would appear primarily in journals that mandate data sharing. In other words, mandate policies implemented by journal publishers, like the policies from funding agencies, have a positive impact on the number of participating researchers. Since a relatively small percent of scholarly journals have already implemented such a data mandate policy, only a selected group of journals can be used in our samples.
RQ2: Is the implementation of journal-level mandate policies correlated to the rate of data contributions?
At the same time, the strict requirements of open data sharing placed by some funding agencies, particularly the NIH, push awarded researchers to take part in open access for both raw data and publications. As projects supported by NIH and other major funding agencies typically represent high quality researches in the scholarly community, the research outcomes are capable of being published in top-ranked journals in related fields. This supposition helps formulate the third research question below:
RQ3: Do most articles with a data-sharing plan appear in reputable journals?
4. Methods
A collection of 13,785 biomedical articles was provided by GEO as of summer 2011. GEO defined these articles as publications that cite deposits of data in the repository in contrast to another list of articles that represents third-party publications that use GEO data as evidence to support independent studies [
30]. In other words, the former is a list of articles whose authors are GEO data contributors and whose corresponding datasets were archived at the time of articles’ publication. Although also as open scientific data users, these article authors have played a role as the data creator and provider, thereby providing the most appropriate data for us to examine the contribution patterns of these open datasets.
Each entry in the collection is presented with a standard citation including the information of its author, article title, journal name, volume and number, publication date, page numbers and a PubMed ID (PMID) linking the brief citation to an expanded citation in the PubMed article database. The expanded citation provides the article abstract and the first author’s affiliation and email address. Since this research only collected the attributes of article authors for the first author, we were satisfied with the available data in PubMed. Of these 13,785 articles, 21 were published in the 1999s before the existence of GEO which may be retroactively added, and were thus removed from our list, leaving a total of 13,764 articles as the actual size of the research population.
To obtain more information about the patterns of publication venue, all journals publishing these articles were measured for their impact factor and
h-index. The impact factor values were extracted from Thomson Reuter (ISI)’s
Journal Citation Reports (JCR) on Web of Science in 2011, while the
h-indexes were calculated by running a web tool developed by
SCImago Journal & Country Rank. Recently, the
h-index has been recognized as a reliable measure of journal quality in regard to the productivity and impact of the published work [
31,
32]. The
h-index technique is particularly identified for its robust functioning and its combined effect for both the number of publications and the citation rate in a balanced way [
33,
34,
35]. We hope these two measures could complement each other to provide more trustworthy analyses.
5. Analysis
To answer
RQ1 about the correlations between funder-based mandate implementations and data contributions, it is necessary to review a chronological change, if any, of data availability. Of the total study population, a sample size of 2085 articles was selected for an expanded citation by applying a stratified random sampling strategy with year as the population stratum for every third record in the list of 13,764 articles. An ordinal regression model was then adopted to analyze the correlations with the category of country/continent as the contribute factor (
Table 1). Each of the first three years in the time sequence,
i.e., 2000–2002, has a significance value of less than 0.05 to reject the null hypothesis for no change. Yet, one needs to cautiously interpret the numbers because of a small sample size for each of the years (
N = 12, 23, 36). On the other hand, the sample size for each of the consequent years is more than 200, enough to provide a rather precise statistical measure. It becomes clear that only the year immediately following the implementation and revision of the data mandate policy by NIH in 2003 and 2007 returns a low significance value to indicate a change of the data contribution rate. The significance values are 2004 = 0.001 and 2008 = 0.014 respectively. The values for the two years of mandate implementation—2003 (=0.000) and 2007 (=0.332)—seem to be rather confusing. However, by verifying the exact implementation date within each of the year, we found the values do provide an extra piece of evidence to support an effect of mandate policy. The first NIH mandate was made available in the spring of 2003, and therefore was able to bring up a change of data contribution rate as shown by the analyzed results; while its revision in 2007 took place in the fall, which was too late for that year to display any changes through statistical measures. The positive responses to the 2003 mandate policy resulted in a big jump of data contributions in 2004, which reached a platform so that the following years in 2005, 2006 and 2007 could not observe any significant change in the rate until another strong policy was in place in the late 2007. The results are, therefore, capable of suggesting that major mandate policies implemented by funding agencies have indeed created a noticeable impact on scholars’ behavior in open data contributions.
Further, according to the results in
Table 1, only the United States and Asian countries (excluding Japan) show a changing pattern of data contributions over the last decade, while other countries and continents in this analysis have not experienced significant changes over time. It may be relatively easy to understand the finding for the U.S. if the NIH mandates did have a positive influence on raw data contributions: the large majority, if not all, of the NIH recipients are based in the U.S. With regard to the finding for Asian countries, the possible explanation is that researchers there were late adopters of the open data sharing, while their peers in Australia, Canada, Japan and European countries had been enthusiastic from the very beginning for participating in the open data movement. An examination of data usage patterns has yielded a similar discovery [
5].
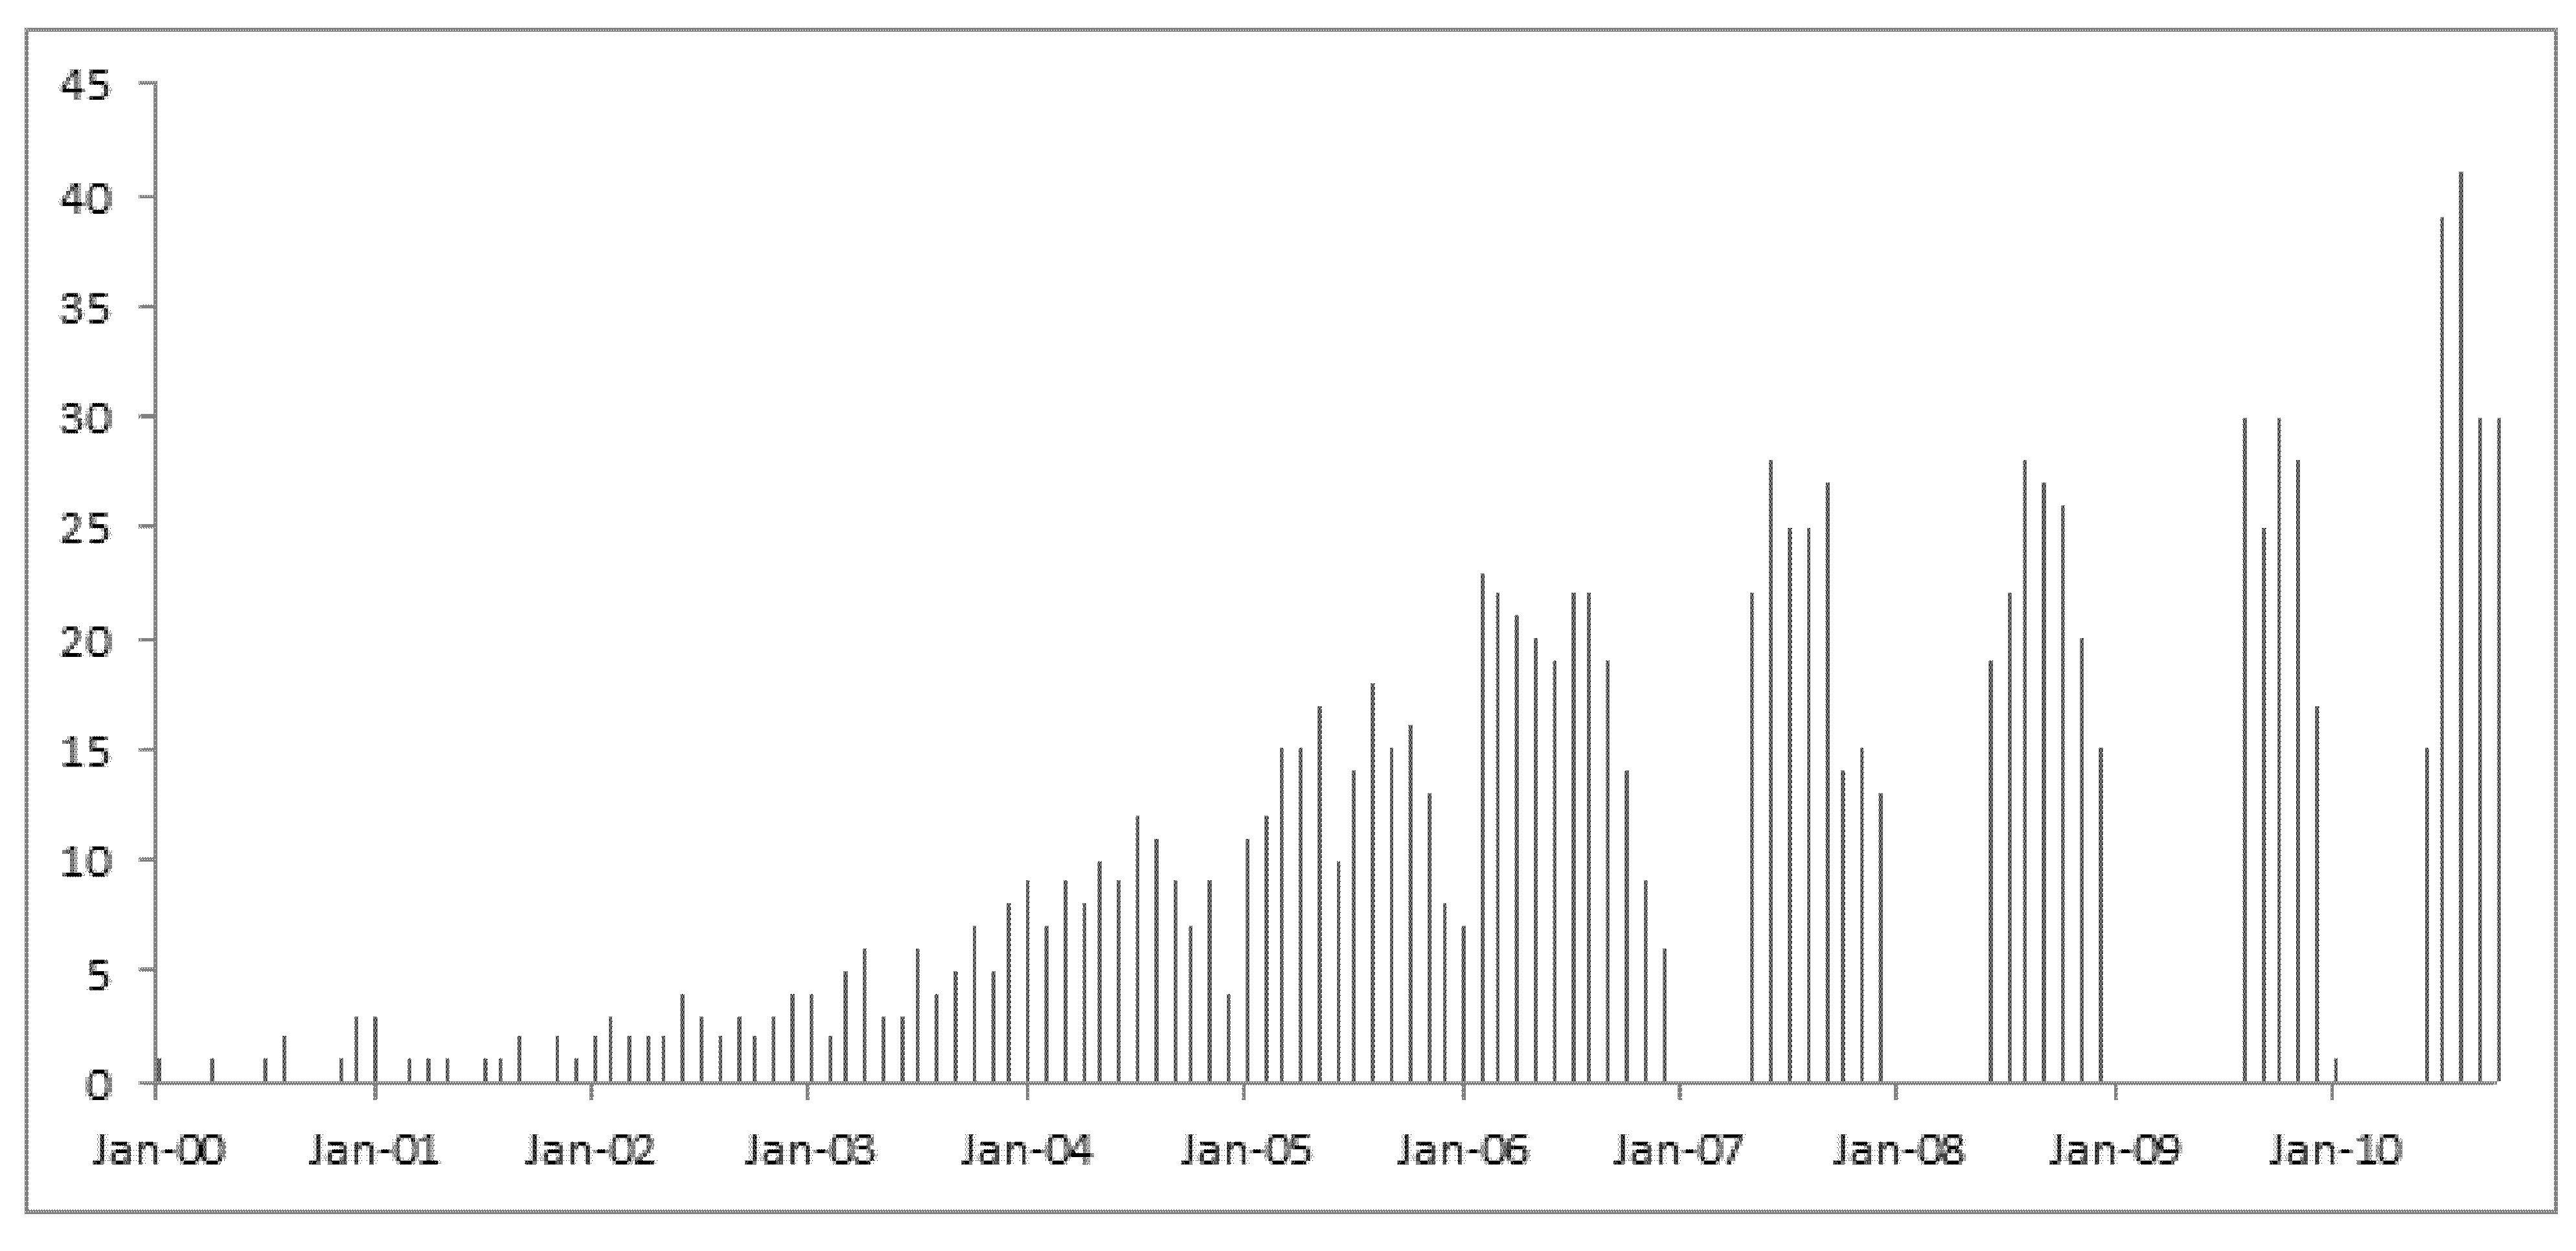
We then narrowed down the analysis into the records of data contributions by the first authors in the United States only. A continuous growth of open genomic data in the GEO database over the years is clearly demonstrated in a graphic exhibition of the dataset as shown in
Figure 1. The scale on the Y-axis indicates the sample size of data contributions by month in each year from 2000 onwards.
Table 1.
An ordinal regression analysis of genomic data contributions to Genome Expression Omnibus (GEO) over the last decade by country/continent.
Table 1.
An ordinal regression analysis of genomic data contributions to Genome Expression Omnibus (GEO) over the last decade by country/continent.
| Parameter Estimates | Estimate | Std. Error | Wald | df | Sig. | 95% Confidence Interval |
|---|
| Lower Bound | Upper Bound |
|---|
| Threshold | [Year = 2000] | −5.031 | 0.523 | 92.697 | 1 | 0.000 | −6.055 | −4.007 |
| [Year = 2001] | −3.948 | 0.467 | 71.406 | 1 | 0.000 | −4.864 | −3.032 |
| [Year = 2002] | −3.221 | 0.451 | 50.905 | 1 | 0.000 | −4.106 | −2.336 |
| [Year = 2003] | −2.481 | 0.444 | 31.285 | 1 | 0.000 | −3.350 | −1.612 |
| [Year = 2004] | −1.671 | 0.440 | 14.454 | 1 | 0.001 | −2.533 | −0.810 |
| [Year = 2005] | −0.844 | 0.438 | 3.718 | 1 | 0.054 | −1.703 | 0.014 |
| [Year = 2006] | −0.146 | 0.437 | 0.112 | 1 | 0.738 | −1.004 | 0.711 |
| [Year = 2007] | 0.425 | 0.438 | 0.943 | 1 | 0.332 | −0.433 | 1.282 |
| [Year = 2008] | 1.081 | 0.438 | 6.084 | 1 | 0.014 | 0.222 | 1.939 |
| [Year = 2009] | 1.876 | 0.440 | 18.200 | 1 | 0.000 | 1.014 | 2.738 |
| Location | [USA = 1] | −1.386 | 0.355 | 15.288 | 1 | 0.000 | −2.081 | −0.691 |
| [UK = 2] | 0.647 | 0.474 | 1.866 | 1 | 0.172 | −0.281 | 1.576 |
| [Europe = 3] | 0.549 | 0.444 | 1.527 | 1 | 0.217 | −0.322 | 1.419 |
| [Canada = 4] | 0.179 | 0.486 | 0.135 | 1 | 0.713 | −0.773 | 1.130 |
| [Australia = 5] | 0.528 | 0.539 | 0.962 | 1 | 0.327 | −0.527 | 1.584 |
| [Japan = 5] | 0.173 | 0.474 | 0.134 | 1 | 0.714 | −0.756 | 1.103 |
| [Asia = 7] | 1.113 | 0.473 | 5.545 | 1 | 0.019 | 0.187 | 2.039 |
| [Americas = 8] | 0 a | . | . | 0 | . | . | . |
Figure 1.
Data contribution rates over the past decade by U.S. authors.
Figure 1.
Data contribution rates over the past decade by U.S. authors.
For
RQ2, we focused on mandate policies set by journals and their impact on data contributions. There are a total of 924 individual journals in the study population. The first step of our work was to remove journals that published fewer than thirty articles throughout the time range from 2000 onwards in our dataset, which would be unreliable for any statistical measure. A final list of 66 journals was left. The second step was to find out journals that were open access to readers as of fall 2012. The website of each of the 66 journals was examined using a private Internet connection to avoid any cross-linking to a subscription-based resource as one may have experienced through an institutional Internet connection. Then, the next step was to contact the editorial staff of the OA journals for the exact date when an OA mandate policy was in place.
Table 2 has a final list of 24 open access journals confirmed, with a total of 3267 articles whose data are available on GEO. The correlations were compared between the open access date of each journal and the number of data contributions in the journal.
Table 2.
Top journals where GEO data contributors published their articles.
Table 2.
Top journals where GEO data contributors published their articles.
| Journal Title | Data on GEO | Impact Factor | OA DATE | r |
|---|
| BMC Genomics | 560 | 4.073 | Jul-2000 | 1 |
| EMBO Journal | 72 | 9.205 | Jan-2007 | 0.785 |
| Eukaryotic Cell | 59 | 3.604 | Sep-2009 | 0.737 |
| FASEB Journal | 46 | 5.712 | Jun-2008 | 0.870 |
| Genetics | 60 | 4.007 | Late 2009 | 0.724 |
| Genome Biology | 176 | 9.036 | Apr-2000 | 0.614 |
| Genome Research | 246 | 13.608 | Sep-2004 | 0.736 |
| International Journal of Cancer | 55 | 5.444 | Early 2010 | 0.776 |
| Journal of Clinical Investigation | 69 | 13.069 | Always | 1 |
| Journal of Virology | 57 | 5.402 | Aug-2009 | 0.737 |
| Leukemia | 55 | 9.561 | May-2010 | 0.694 |
| Microbiology | 93 | 0.718 | Jul-2006 | 0.659 |
| Molecular and Cellular Biology | 129 | 5.527 | Apr-2009 | 0.819 |
| Molecular Endocrinology | 73 | 4.544 | Early 2010 | 0.754 |
| Molecular Microbiology | 90 | 5.01 | Early 2005 | 0.803 |
| Molecular Systems Biology | 40 | 8.626 | Mar-2005 | 1 |
| Nucleic Acids Research | 151 | 8.026 | Jan-2005 | 0.703 |
| Oncogene | 99 | 6.373 | May-2010 | 0.666 |
| Plant Journal | 75 | 6.16 | Early 2005 | 0.671 |
| Plos Biology | 68 | 11.452 | Oct-2003 | 1 |
| Plos Genet | 193 | 8.694 | Jul-2005 | 1 |
| Plos One | 689 | 4.092 | Dec-2006 | 1 |
| RNA | 42 | 5.095 | Jul-2005 | 1 |
| Toxicological Sciences | 70 | 4.652 | Early 2008 | 0.879 |
Several journals, including BMC Genomics, Journal of Clinical Investigation, Molecular Systems Biology, the PLoS journals, and RNA, have an early implementation of data mandates, yielding a perfect correlation (r = 1) in the statistical analysis. However, a chronological comparison of policy effects is impossible to make with their dataset because the implementation dates are either earlier than the launch of GEO or at roughly the same time. On the other hand, other journals in the list have a policy implementation date in the middle of the data sequence which allows us to track rate changes before and after the requirement of OA data contributions by these journals. The results of our statistical analysis are self-explanatory, namely, the r values are all positive in a range from 0.614 to 0.879, indicating strong correlations of OA journal mandates and data contributions to GEO.
Table 3.
Data contributions and journal reputation rankings by impact factor and h-index.
Table 3.
Data contributions and journal reputation rankings by impact factor and h-index.
| Journal Title | Articles with GEO Data | Impact Factor | h-Index | Open Access |
|---|
| PloS One | 689 | 4.092 | 85 | Y |
| Proceedings of the Nat’l Academy of Sciences U.S.A. | 684 | 9.681 | 464 | N |
| BMC Genomics | 560 | 4.073 | 66 | Y |
| Cancer Research | 379 | 7.856 | 295 | Embargo |
| Physiological Genomics | 376 | 2.735 | 62 | N |
| Blood | 353 | 9.898 | 295 | Embargo |
| Nature | 337 | 36.28 | 734 | N |
| Journal of Biological Chemistry | 284 | 4.773 | 363 | N/Y (after 1 year) |
| Journal of Immunology | 253 | 5.788 | 258 | N |
| Genome Research | 246 | 13.608 | 177 | N/Y |
| Journal of Bacteriology | 204 | 3.825 | 156 | N |
| PloS Genetics | 193 | 8.694 | 81 | Y |
| Science | 185 | 31.201 | 711 | N |
| Cell | 179 | 32.403 | 503 | N |
| Genome Biology | 176 | 9.036 | 119 | Partial |
| Nature Genetics | 166 | 35.532 | 376 | N |
| Nucleic Acids Research | 151 | 8.026 | 280 | Hybrid |
| Molecular Cell | 139 | 14.178 | 250 | N |
| Applied and Environmental Microbiology | 134 | 3.829 | 197 | N |
| Plant Physiology | 132 | 6.535 | 168 | N |
| Molecular and Cellular Biology | 129 | 5.527 | 242 | N |
| Cancer Cell | 117 | 26.566 | 175 | N |
| Genes & Development | 110 | 11.659 | 313 | N |
| Plant Cell | 109 | 8.987 | 205 | N |
| Infection and Immunity | 109 | 4.165 | 148 | N |
| Development | 106 | 6.596 | 219 | N |
| Clinical Cancer Research | 103 | 7.742 | 186 | N |
| Cell Stem Cell | 102 | 25.421 | 85 | N |
| Human Molecular Genetics | 100 | 7.636 | 185 | Some |
| Oncogene | 99 | 6.373 | 220 | Some |
| Microbiology | 93 | 0.718 | 108 | Some |
| Molecular Microbiology | 90 | 5.01 | 167 | Some |
| Journal of Experimental Medicine | 89 | 13.853 | 316 | N |
| Plant Journal | 75 | 6.16 | 148 | Some |
| Molecular Endocrinology | 73 | 4.544 | 134 | Some |
| EMBO Journal | 72 | 9.205 | 290 | Some |
| Nature Immunology | 71 | 26.008 | 232 | N |
| Toxicological Sciences | 70 | 4.652 | 105 | Some |
| Journal of Clinical Investigation | 69 | 13.069 | 324 | Y |
| PloS Biology | 68 | 11.452 | 126 | Y |
| Nature Medicine | 66 | 22.462 | 357 | N |
| Immunity | 65 | 21.637 | 250 | Some |
| PLoS Pathogens | 64 | 9.127 | 70 | Y |
| Genetics | 60 | 4.007 | 159 | Some |
| Nature Biotechnology | 59 | 23.268 | 251 | N |
| Eukaryotic Cell | 59 | 3.604 | 65 | Some |
| Journal of Virology | 57 | 5.402 | 206 | Some |
| Leukemia | 55 | 9.561 | 115 | Some |
| International Journal of Cancer | 55 | 5.444 | 144 | Some |
| Stem Cells | 53 | 7.781 | 125 | N |
| Nature Structural & Molecular Biology | 53 | 12.712 | 179 | N |
| Genes Chromosomes Cancer | 52 | 3.306 | 84 | Some |
| Journal of Clinical Oncology | 50 | 18.372 | 328 | N |
| Nature Cell Biology | 48 | 19.488 | 226 | N |
| Developmental Cell | 47 | 14.03 | 152 | N |
| FASEB Journal | 46 | 5.712 | 189 | Some |
| Molecular Cancer Therapeutics | 44 | 5.226 | 91 | Some |
| Genomics | 44 | 3.019 | 106 | Some |
| RNA | 42 | 5.095 | n/a | Some |
| Journal of Neuroscience | 41 | 7.115 | 291 | Some |
| Molecular Systems Biology | 40 | 8.626 | 56 | Y |
| Molecular Biology of the Cell | 39 | 4.942 | 152 | Embargo |
| Gastroenterology | 39 | 11.675 | 257 | Some |
| Nature Methods | 37 | 19.276 | 112 | N |
| Endocrinology | 32 | 4.459 | 175 | Some |
| Molecular Vision | 31 | 2.205 | 53 | Y |
The third question of this research asks whether articles with a data sharing plan have been published mostly in reputable journals.
Table 3 lists journals where these GEO articles are published with impact factors and
h-indexes of the journals. With regard to impact factor (IF) values, the lowest is
Microbiology (IF = 0.718) and the highest is
Nature (IF = 36.280). More than one third of all journals in the list have an IF value higher than 10, and three fourths of the journals are higher than 5. For the
h-indexes, the range is 53–734 with approximately eighty-three percent of the journals being higher than 100. These are all very amazing numbers. Therefore, we are observing a group of high quality studies that have been able to publish in top-ranked scholarly journals of biomedical sciences.
Moving from journal level evaluation to article level evaluation, we will, however, find that the majority of the articles appear in relatively lower scored journals in the given value range. A correlation coefficient test reveals a very weak relationship, i.e., r = −0.012 between the numbers of GEO articles and journal IF values, and r = 0.229 between the numbers of GEO articles and journal h-index values. It provides indirect evidence to suggest the importance of open access mandate policies, rather than the reputation of a journal, in the decision of making data contributions to a digital data repository for free access.
6. Discussion and Implications
Traditionally, data withholding has been common in biomedical sciences, which takes various forms and is shaped by a range of characteristics of investigators and their training [
36]. There are many causes, such as researchers’ intention to protect their scientific priority [
37], strictures of commercial funders [
38], mentors’ discouragement and negative past experience with sharing [
9]. In a survey of 2893 geneticists and other life scientists at 100 most research-intensive universities in the U.S., Blumenthal
et al. found that “at a minimum that influences other than the competitiveness of the field may more powerfully affect data withholding” [
9]. However, the major obstacle of data sharing is considered to be growing commercialization of U.S. higher education that has largely prevented researchers from freeing their raw scientific data [
39].
There has been much controversy over data sharing in the scholarly community and publishing industry. The Association of American Publishers launched “PRISM” (Partnership for Research Integrity in Science & Medicine) in the mid-2000 as an anti-OA lobbying organization to counteract the accelerating growth of open access [
40,
41]. PRISM has attempted to equate traditional publishing models with peer review, and argued that the practice of peer review would be damaged by unnecessary government interference, agenda-driven research, and bad science. The reality behind it is that open access will frighten the industry whose profits are based primarily on subscription charges. On the other hand, governments and OA advocates responded to PRISM’s call by regulating grant-supported research. What governments and OA advocates have been saying is that open access can represent “the best interests of research, researchers, research institutions (universities), research funders (private and governmental), the vast R&D industry, and the tax-paying public that funds the research and the research institutions, and for whose benefit the research is being conducted” [
42]. More data are needed to claim an open data divide between the public and private sectors, though.
Rather than viewing the practices of open access as dichotomous, we observe an every changing OA landscape. OA can be generally provided in two different ways: the “green” self-archiving and the “golden” publishing [
43]. The former road refers to publishing articles in a non-OA journals but also self-archiving them in a digital archive for free use, while the latter road denotes publishing articles in an OA journal. An increasing number of commercial publishers have now started supporting the “green” OA policy to permit self-archiving activities although certain conditions may apply. As a comparison, many research supported by a public entity may have not made their data and research outcomes open accessible. The question is: to what extent have researchers made their data freely available if their projects are sponsored by the tax-paying public?
Our study shows that both funder-based and publisher-based mandates have a positive influence on scholars’ behavior for making raw data open access. With statistical analyses using regression models against open GEO data, all results point to a positive correlation between the implementation of an OA policy and the availability of open data through time. While data withholding may still have an influence over the attitudes and behaviors of biomedical scientists, mandates employed at an appropriate level have created more power to bring up changes to the practice of open data self-archiving. Evidence further indicates that like policies have also altered the habit of authors in selecting publishing venues: open access journals have been apparently preferred by those authors whose projects are sponsored by the federal government agencies, and these journals are also highly ranked in the biomedical profession (see
Table 3).
In response to the perceived “crisis in scholarly communication” regarding an environment of escalating costs and constrained resources, many discussions have emphasized the willingness of the faculty to change as the major obstacle to adapting to more cost-effective publishing models [
44]. The data sharing instance in biomedical studies, specifically the GEO data, provides a good example to show the importance of policy-making in the reshaping of digital scholarly communication. The scientific community and cultural institutions can work together, with necessary support of various stakeholders, to promote the Internet as a medium for disseminating global knowledge and to facilitate wider sharing of raw data. The potential of mandates for further leveraging public and private investments is tremendous.


