
Engineering Band Gap of Ternary Ag2TexS1−x Quantum Dots for Solution-Processed Near-Infrared Photodetectors
by
 , ,
, ,
Zan Wang
1,2,3,4 ,
,
Yunjiao Gu
1,2,3,
Daniil Aleksandrov
1,2,3,
Fenghua Liu
1,2,3,
Hongbo He
1,2,3,* and
Weiping Wu
1,2,3,* 1
Laboratory of Thin Film Optics, Shanghai Institute of Optics and Fine Mechanics, Chinese Academy of Sciences, Shanghai 201800, China
2
State Key Laboratory of High Field Laser Physics, Shanghai Institute of Optics and Fine Mechanics, Chinese Academy of Sciences, Shanghai 201800, China
3
University of Chinese Academy of Sciences, Beijing 100049, China
4
Department of Optics and Optical Engineering, University of Science and Technology of China, Hefei 230026, China
*
Authors to whom correspondence should be addressed.
Inorganics 2024, 12(1), 1; https://doi.org/10.3390/inorganics12010001
Submission received: 8 October 2023
/
Revised: 8 December 2023
/
Accepted: 11 December 2023
/
Published: 19 December 2023
(This article belongs to the Special Issue Advanced Inorganic Semiconductor Materials)
Abstract
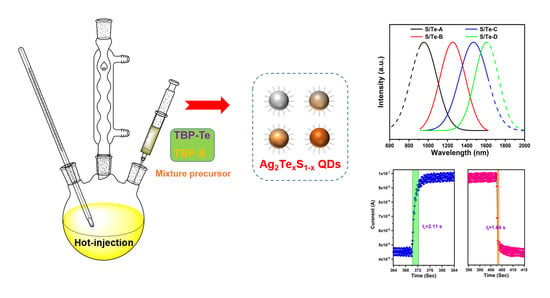
:Silver-based chalcogenide semiconductors exhibit low toxicity and near-infrared optical properties and are therefore extensively employed in the field of solar cells, photodetectors, and biological probes. Here, we report a facile mixture precursor hot-injection colloidal route to prepare Ag2TexS1−x ternary quantum dots (QDs) with tunable photoluminescence (PL) emissions from 950 nm to 1600 nm via alloying band gap engineering. As a proof-of-concept application, the Ag2TexS1−x QDs-based near-infrared photodetector (PD) was fabricated via solution-processes to explore their photoelectric properties. The ICP-OES results reveal the relationship between the compositions of the precursor and the samples, which is consistent with Vegard’s equation. Alloying broadened the absorption spectrum and narrowed the band gap of the Ag2S QDs. The UPS results demonstrate the energy band alignment of the Ag2Te0.53S0.47 QDs. The solution-processed Ag2TexS1−x QD-based PD exhibited a photoresponse to 1350 nm illumination. With an applied voltage of 0.5 V, the specific detectivity is 0.91 × 10¹⁰ Jones and the responsivity is 0.48 mA/W. The PD maintained a stable response under multiple optical switching cycles, with a rise time of 2.11 s and a fall time of 1.04 s, which indicate excellent optoelectronic performance.
1. Introduction
Near-infrared (NIR) light has several advantages, including great penetration depth, strong confidentiality, and excellent anti-electromagnetic interference properties [1,2,3,4]. Thus, NIR materials have found extensive applications across diverse domains such as bioimaging, optical communication, photodetectors, and solar cells [5,6,7,8,9,10,11]. Currently, NIR materials are mainly concentrated on PbS, PbSe, HgTe QDs, rare-earth nanocrystals, and single-walled carbon nanotubes (SWNTs) [12,13,14,15,16]. Among them, PbS, PbSe, and HgTe QDs contain the toxic heavy metals lead and mercury and rare-earth nanocrystals with non-tunable band gaps and narrow absorption windows. For SWNTs, their application is limited by their broad length distribution, spanning hundreds of nanometers. Therefore, it becomes imperative to foster the creation of novel materials with continuously tunable band gap and high biocompatibility. Silver-based chalcogenide (Ag2S, Ag2Se, and Ag2Te) QDs, as classic NIR materials, possess excellent properties such as low toxicity, wide absorption windows, and good biocompatibility [17,18,19]. Among these, Ag2S QDs are one of the most extensively studied semiconductor materials and have ultralow solubility product constants (Ksp(Ag2S) = 6.69 × 10−50), which enable the minimal release of Ag ions in biosystems, thus ensuring their potential application in biomedical, ReRAMs, and optoelectronic devices [20,21,22]. However, due to the large band gap of Ag2S (1.1 eV), its photoluminescence (PL) emission peak is limited to less than 1200 nm, and photodetectors based on this material cannot respond to light in longer wavelength bands and have poor power conversion efficiencies [23]. Therefore, expanding the band gap of Ag2S and improving its photoelectric performance is very important for the application of Ag2S materials in the field of optoelectronic devices.
Compared to traditional binary QDs, ternary alloy QDs not only retain the quantum size effect of nanomaterials but also enable effective control of the band gap by adjusting the composition [24,25]. Smith et al. [26] studied the influence of different reactive anion precursors on the size and composition of PbSexTe1−x, PbSxTe1−x, and PbSxSe1−x QDs. The results demonstrated that the highly reactive Chalcogenide precursors bis(trimethylsilyl) (TMS2) help to achieve uniform anion incorporation. In addition, it was possible to modulate the excitonic absorption and fluorescence peak of alloy QDs by adjusting the anions ratios. The next generation of electroluminescent displays based on quantum dots requires the development of efficient and stable Cd-free blue emission devices, which remains a challenge due to the poor photophysical properties of blue emission materials. Jang et al. [27] proposed a method by which to synthesize efficient blue-emitting ZnTeSe QDs. They found that the hydrofluoric acid and zinc chloride additives effectively improved the luminescence efficiency by eliminating the layer faults in the ZnSe crystal structure. Moreover, chloride passivation via liquid or solid ligand exchange results in slow radiative recombination, high thermal stability, and efficient charge transport characteristics, and the fluorescence peak was adjusted to 457 nm, while the photoluminescence quantum yield (PLQY) was elevated to a remarkable 100% by controlling the Te doping level. In addition, Ren et al. [28] proposed a water-phase synthesis method for the preparation of NIR CdHgTe alloy quantum dots. CdHgTe QDs are obtained by heating a mixture of CdCl2, Hg(ClO4)2 and NaHTe in the presence of a thiol stabilizer and exhibit PL emission peaks in the range from 600 to 830 nm, which can be adjusted according to size and composition. The PLQY of CdHgTe QDs is about 20–50%, which depends on its emission wavelength and composition. Compared to other reported NIR quantum dots (such as CdTe/CdHgTe and InAs), the prepared CdHgTe alloy quantum dots have a much narrower emission spectrum, with a full width at half-maximum (FWHM) of only 60–80 nm. HRTEM and XRD characterization show that CdHgTe QDs have a good crystal structure and monodispersity. In order to improve the photostability of CdHgTe QDs and reduce their cytotoxicity, CdS nanocrystal shells were added to the surface of CdHgTe QDs. Kim et al. [29] investigated the synthesis of eco-friendly materials AgBiS2 QDs and the effect of heat treatment on their properties. Increasing the heat treatment temperature reduces the number of surface functional groups, including N (amine) and S (thiol) groups, and there are fewer defects on the particle surface. However, heat treatment at 300 °C reduces PL intensity even when the ligands are fully removed. By measuring the photocurrent response of the AgBiS2 photodetector to near-infrared light, the photocurrent of the AgBiS2 photodetector is the highest after heat treatment at 200 °C. Heat treatment removes excessive protective agents and ligands in the inks and improves the photocurrent response of AgBiS2.
Herein, for the first time, we develop a facile mixture precursor hot-injection method for the synthesis of Ag2TexS1−x alloy QDs. The composition of the alloy QDs was regulated by adjusting the ratio of precursor S to precursor Te. Through augmenting the amount of the precursor Te, the fluorescence peak of the alloy QDs redshifted and the absorption spectrum broadened, thereby achieving controllable tuning of the band gap. Furthermore, a photodetector based on Ag2Te0.53S0.47 QDs as the photosensitive layer has been constructed. The narrow band gap photosensitive layer enables the device to exhibit photoresponse to 1350 nm illumination. The device maintained a stable response and exhibited excellent optoelectronic performance under multiple light switching cycles. This is also the first report on the preparation of Ag2TexS1−x QDs and the investigation of their optoelectronic properties.
2. Experimental Section
2.1. Materials
Silver acetate (AgAc, 99.99%, Alfa Aesar, Haverhill, MA, USA), sulfur powder (S, 99.95%, Aladdin, Shanghai, China), oleylamine (OAm, 80%, Acros, Geel, Belgium), tellurium powder (Te, 99.999%, Alfa Aesar), tri-n-butylphosphine (TBP, >95.0%, TCI, Tokyo, Japan), and 1,2-ethanedithiol (EDT, 98.0%, Alfa Aesar); all these reagents were used without purification.
2.2. Preparation of TBP-Te and TBP-S Precursors
The precursors of TBP-Te and TBP-S were prepared in a glove box. TBP-Te: 2.5 mmol (0.32 g) Te powder was dissolved in 5 mL TBP, employing the use of ultrasonic treatment for a duration of 24 h. TBP-S: 2.5 mmol (0.08 g) S powder was dissolved in 5 mL TBP with vigorous magnetic stirring and ultrasonic treatment for 1 h. The total number of moles of Te and S was kept at 0.10 mmol and the two precursors with different atomic ratios.
2.3. Synthesis of Ag2TexS1−x QDs
In the conventional hot-injection method, a blend comprising AgAc (0.067 g, 0.4 mmol) and Oam (16 mL) was introduced into a 100 mL three-neck flask at room temperature. Subsequently, the solution underwent a remove oxygen process through vigorous magnetic stirring while maintaining a vacuum for 30 min. Afterwards, the temperature of the reaction was subsequently elevated to 120 °C in the presence of a nitrogen atmosphere, resulting in the attainment of a transparent solution. Then, 0.2 mL mixture precursor (TBP-S and TBP-Te) was injected into the solution while vigorously stirring at a speed of 1000 rpm. This temperature was maintained for a duration of 5 min to ensure the consistent growth of the QDs. The products were precipitated with ethanol and recovered by centrifugation at a speed of 12,000 rpm for 10 min. The products were dispersed in chloroform (15 mg/mL). A series of Ag2TexS1−x samples were used, referred to as S/Te-A (S:Te = 1:0), S/Te-B (S:Te = 2:1), S/Te-C (S:Te = 1:1), and S/Te-D (S:Te = 0:1).
2.4. Photodetector Fabrication
The photodetector device fabrication and ligand exchange protocol is based on previous research [30]. At first, this process begins with cleaning the glass substrates. Then the Ag2TexS1−x QDs solution was deposited onto the glass substrate by employing the spin-coating technique under a speed of 1500 rpm and kept for 30 s. Subsequently, a volume of 500 μL of ligand solution (consisting of 5 mM EDT dissolved in acetonitrile) was gently applied onto the film for a duration of 30 s, followed by removal of the ligand solution using a spinning method. Afterwards, the QD film was immersed in acetonitrile 3 times to eliminate any remaining unbound ligands. The ligand exchange and spin-coating were iterated 6 times. Finally, 5 nm/100 nm-thick Ti/Au metal electrodes were deposited through an interdigitated shadow mask (the channel width is 50 μm and the size is 18 mm × 18 mm) through a thermal evaporator.
2.5. Characterizations
Talos F200X (ThermoFisher, Waltham, MA, USA) was used to test transmission electron microscope (TEM) and high-resolution TEM (HRTEM) images of Ag2TexS1−x QDs under an acceleration voltage of 200 kV. X-ray diffraction (XRD) patterns were measured by a PANalytical Empyrean diffractometer (Malven PANalytical, Almelo, Holland) (Cu-Kα λ = 1.54056 Å) in the range of 20–80°. An inductively coupled plasma optical emission spectrometer (ICP-OES) was performed on PerkinElmer Avio 500 (PerkinElmer, Waltham, MA, USA). The absorption spectra were recorded with a PerkinElmer Lambda 750 spectrometer (PerkinElmer, Waltham, MA, USA). The NIR fluorescence spectra were executed on an Applied NanoFluorescence Spectrometer (Houston, TX, USA), applying an excitation laser source of 785 nm. The X-ray photoelectron spectroscopy (XPS) were collected on a PHI-5000 VersaProbe instrument (ULVAC-PHI, Chigasaki, Japan) using Al/Kα radiation as excitation source, the electron emission angle is 34°, the diameter of the X-ray spot is 250 μm, the base pressure is 4.17 × 10⁻⁷ mBar during the analyses, the samples are etched for 60 s with 1 keV Ar+ ions before the XPS scan to remove the surface layer which adsorb water and oxygen in the air. All the XPS spectra recorded for Ag 3d, Te 3d, and S 2p were referenced to the C 1s peak, which was calibrated by positioning it to 289.58 eV−Φ. The 289.58 eV is the binding energy position of the C 1s peak with respect to the vacuum level, and Φ is the work function of Ag2Te0.53S0.47 (~5.16 eV) [31,32]. Thus, the set value of the extraneous polluted carbon is 284.42 eV. The ultraviolet photoelectron spectroscopy (UPS) was measured by using a Thermo ESCALAB 250Xi instrument (ThermoFisher, Waltham, MA, USA) with He I radiation. The Keithley 4200-SCS semiconductor analyzer equipped with a Signatone S-1160 Probe Station (Signatone, Gilroy, CA, USA) is employed to characterize the optoelectronic performance of devices.
3. Results and Discussion
Figure 1 displays the low-magnification TEM and HRTEM images of Ag2TexS1−x QDs, which exhibit excellent dispersibility, clear lattice patterns, and good crystallinity. Figure 1a shows TEM image of Ag2S QDs (denoted as S/Te-A), which appear as uniformly spherical particles. With the increase in the Te content, the morphology of the QDs gradually transformed from uniform spherical morphology to a branch-like structure, as shown in Figure 1b,c (denoted as S/Te-B and S/Te-C, respectively). When all the S elements are replaced by Te, the morphology changes to a branch-like structure composed of interconnected spherical particles (S/Te-D), as depicted in Figure 1d.
Similar results have been reported in other studies on Ag2Te QDs, which elucidate that this morphology is mainly attributed to the driving force generated by strong dipole-dipole interactions, leading to the formation of a branch-like structure [33]. Additionally, we performed a statistical analysis of the size distributions of the different Ag2TexS1−x QDs (100 particles counted in each image, Figure S1). The diameters of S/Te-A, S/Te-B, S/Te-C, and S/Te-D were measured as 3.92 ± 0.19 nm, 5.45 ± 0.31 nm, 5.32 ± 0.51 nm, and 5.23 ± 0.32 nm, respectively.
To investigate the crystal structure of the Ag2TexS1−x QDs, we measured the XRD patterns of the samples with different S/Te ratios. Figure 2 shows the S/Te-A sample consisting of Ag2S QDs, with diffraction peaks matching those of Ag2S crystals (JCPDS:14-0072) and exhibiting a relatively broad peak width, which is attributed to the small size of the QDs. The characteristic diffraction peaks of Ag2S in the Ag2TexS1−x QDs gradually weaken with increasing Te content, indicating a phase transition from monoclinic Ag2S crystals (JCPDS:14-0072) to monoclinic Ag2Te crystals (JCPDS:81-1820). Finally, the characteristic diffraction peaks of the S/Te-D sample coincided with those of pure Ag2Te crystals (JCPDS:81-1820), exhibiting broadened diffraction peaks. ICP-OES was used to analyze the actual atomic ratios of the S and Te anions in the samples. Figure S2 illustrates the relationship between Te/(Te + S) for the precursors and the products of the four samples. When the molar ratio of the Te source to the S source is 1:2, the Te-to-S ratio in the product is 0.54:1 (Ag2Te0.35S0.65). When the molar ratio of the Te source to the S source turns to 1:1, the Te-to-S ratio in the product becomes 1.13:1 (Ag2Te0.53S0.47) owing to the slightly higher reactivity of the Te source compared to that of the S source. These results demonstrate that the manipulation of the anion ratio in the precursor mixture is an effective means of controlling the anion content within the alloy QDs.
XPS was used to characterize the elements and their valence states in the alloyed QDs. Figure 3a shows the low-resolution scan spectrum of the Ag2Te0.53S0.47 QDs, which demonstrates the sample contains Ag, Te, O, S, and C elements. Figure 3b–d show the high-resolution scan spectra of Ag 3d, Te 3d, and S 2p. As illustrated in Figure 3b, the high-resolution Ag 3d region spectra of Ag2Te0.53S0.47 QDs show two symmetric peaks, Ag 3d5/2 and Ag 3d3/2, which correspond to binding energies of 367.7 eV and 373.7 eV, respectively. This confirms that the oxidation state of silver is univalent (Ag+) [34]. In Figure 3c, the high-resolution Te 3d region spectra show two peaks, Te 3d5/2 and Te 3d3/2, which correspond to binding energies of 572.0 eV and 582.4 eV, respectively, suggesting that the valence of telluride is negative bivalence (Te2−) [35,36]. Furthermore, the spectrum of the S 2p region was characterized and analysed (Figure 3d). The spectrum contains multiple peaks, which must be separated. Fitting the low-binding-energy peaks yields two distinct peaks with binding energies measuring 162.6 eV and 161.3 eV. These peaks can be attributed to the S 2p1/2 and S 2p3/2, respectively, in agreement with the Ag-S binding energies [37]. An additional peak appears in the high-energy region (approximately 168.3 eV), indicating that a small fraction of S may have undergone oxidation to form sulfate ions upon exposure to air [38].
Figure 4 shows the PL emission spectra of Ag2TexS1−x QDs with four different S/Te ratios under 785 nm excitation. The dashed lines represent the spectral regions that could not be detected because of the response range of the spectrometer (900 nm–1700 nm). The fluorescence peak of the Ag2TexS1−x QDs exhibits a gradual redshift, transitioning from 955 nm to 1255 nm, 1470 nm, and ultimately reaching 1605 nm. When the size of the direct band gap semiconductor decreases, the PL emission should blue-shift. However, the size of Ag2TexS1−x QDs decreases, and the PL peak redshift contradicts the above theory (S/Te-B to S/Te-D). This anomalous phenomenon can be explained by Vegard’s law, which describes the relationship between the band gap of ternary alloy materials and their elemental composition of elements [39]. The band gap of Ag2TexS1−x alloy can be described as follows:
where x is the proportion of component t; and Ealloy, Et, and Es are the band gap energies of the alloy material, pure t, and pure s, respectively. Because the band gap of Ag2Te (0.06 eV) [40] is much smaller than that of Ag2S (1.1 eV) [41], as the Te component increases, the value of x increases, leading to a decrease in the band gap of the alloy QDs and a redshift in the PL emission peaks.
Figure 5 shows the absorption spectra of Ag2TexS1−x QDs with four different S/Te ratios. The S/Te-A to S/Te-D samples do not exhibit distinct excitonic absorption peaks, which is similar to previous reports of Ag2S QDs and Ag2Te QDs [42,43]. The optical band gap values of Ag2TexS1−x QDs are calculated by the extrapolated energy intercept of the Tauc plot. For direct bandgap materials, the Tauc equation can be described as follows [44]:
where α is the absorption coefficient; hν is the incident photon energy; A is a proportionality constant; and Eg is the optical band gap, respectively. The band gap was calculated to be 1.45 eV, 1.07 eV, 0.89 eV, and 0.84 eV for S/Te-A, S/Te-B, S/Te-C, and S/Te-D, respectively. As the Te content increased, the absorption wavelength ranges of the alloy QDs broadened, and the band gap decreased. This result is consistent with the alterations observed in the PL emission spectra of Ag2TexS1−x QDs. Furthermore, the result reveals that the adjustment of Te content effectively controls the band gap of Ag2TexS1−x QDs.
UPS was used to measure the kinetic energy of the Ag2Te0.53S0.47 QDs, as shown in Figure 6. The test sample was prepared by spin-coating it into a thin film on a glass substrate. Figure 6a shows the survey of UPS spectrum of the Ag2Te0.53S0.47 QDs. Figure 6b portrays the region of high binding energy cutoff. The tangent value in the cutoff region is approximately 16.6 eV, indicating that the Fermi level positioning of the alloy QDs is 4.61 eV. Combined with the low binding energy cutoff region shown in Figure 6c (with a tangent value of approximately 0.54 eV), the energy level of the valence band maximum (EVB) was calculated to be 5.15 eV (relative to the vacuum level EVac). Finally, combined with the band gap of Ag2Te0.53S0.47 QDs (Eg = 0.89 eV), the energy level of the conduction band minimum (ECB) can be calculated to be 4.26 eV. Therefore, the accurate depiction of the energy band alignment for the Ag2Te0.53S0.47 QDs is depicted in Figure S3.
As a proof-of-concept application, Ag2TexS1−x QDs were used as the active layer for the photodetector (PD) device. The photoelectric properties of Ag2TexS1−x QD-based PD were investigated (Figure S4). Figure S4a,b show that neither the Ag2S QD-based or Ag2Te0.53S0.47 QD-based PD have any response to 1350 nm illumination. This can be attributed to the large band gap of these two QDs, which cannot be excited by 1350 nm light to generate photocurrent. With the increase in Te component, both Ag2Te0.53S0.47 QD-based and Ag2Te QD-based PD generate photocurrent under 1350 nm illumination, and the light response of Ag2Te0.53S0.47 QDs is more obvious than that of Ag2Te QDs. Thus, composition adjustment can not only expand the band gap of QDs, but also help to improve the performance of photodetectors.
In order to evaluate the performance of Ag2TexS1−x QD-based PDs, the corresponding figures of merit were calculated The two representative parameters (responsivity R and special detectivity D*) were determined as follows [45]:
where Iph is the photocurrent; Id is the dark current; P is the radiated power (product of active area and incident light density); A is the active area of the photodetector; and q is the electron charge. At an applied voltage of 0.5 V and an illumination intensity of 2 mW/cm2, the D* of the Ag2Te0.53S0.47 QD-based PD reaches 0.91 × 10¹⁰ Jones, and the R is 0.48 mA/W. In addition, the response speed of the Ag2Te0.53S0.47 QD-based PD was determined using the rise time (τr) and fall time (τf). Figure 7 shows the response speed curve of the detector at a bias voltage of 0.5 V and an illumination intensity of 2 mW/cm2. Figure 7a shows the detector still exhibits good repeatability under continuous 10-cycle switching. The fluctuations observed in the light and dark states may be caused by surface defects generated from ligand exchange processes. Figure 7b demonstrates that τr was 2.11 s and τf was 1.04 s within one switching cycle.
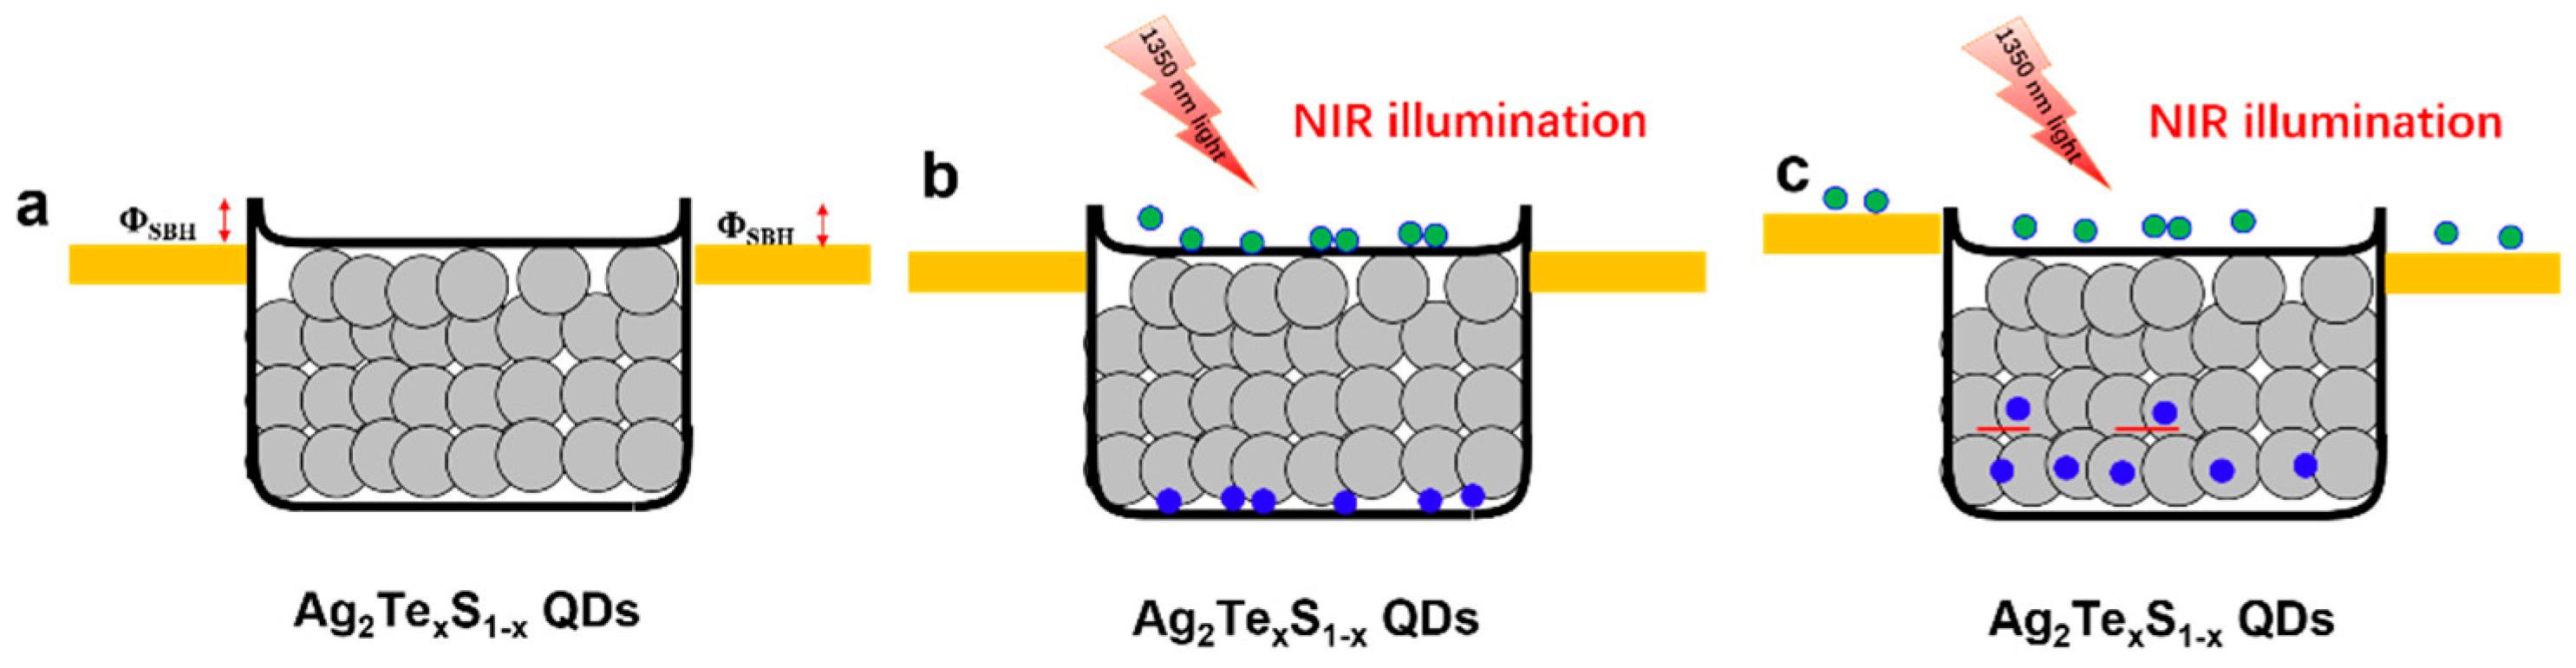
In order to elucidate the electron–hole transport mechanism in the photodetector, the schematic of energy band diagrams of Au/Ag2TexS1−x QDs/Au PD on the glass substrate is shown in Figure 8. Figure 8a shows the energy band diagram of the Ag2TexS1−x QD-based PD under dark and without external bias. The contact between the metal electrode (Au) and Ag2TexS1−x QDs exhibits a slight barrier height (ΦSBH), which proves that the contact between Au and the Ag2TexS1−x QDs is not a simple Ohmic contact but a Schottky contact. This is consistent with the results of the nonlinear I–V curve of the Ag2TexS1−x QD-based PD. Figure 8b shows the energy band diagram of the Ag2TexS1−x QD-based PD under NIR light with a wavelength of 1350 nm illumination and without external bias. The Ag2TexS1−x QDs are excited to produce charge carriers (electron–hole pairs), which are transported between the Ag2TexS1−x QDs due to the quantum tunneling effect. However, only a very small number of carriers can reach the electrode due to the influence of the Schottky barrier. Therefore, no photocurrent can be observed. In addition, under illumination and with external bias, the trap states of Ag2TexS1−x QDs (including surface defect levels and internal defect levels) serve as trapping centers for photogenerated holes [46]. This results in a reduction in the depletion region width and ΦSBH, which offers favorable conditions for carriers tunneling from the Ag2TexS1−x QDs to the metal electrode under external bias, causing increased photocurrent (Figure 8c).
4. Conclusions
In summary, we have successfully prepared Ag2TexS1−x ternary QDs via a facile mixture precursor hot-injection method. TEM images and XRD confirmed that the morphology and lattice parameter gradually shifted from Ag2S to Ag2TexS1−x and finally to Ag2Te QDs. The ICP-OES results reveal the relationship between the compositions of the precursor and samples, which is consistent with Vegard’s equation. In addition, optical characterization confirms the feasibility of Ag2TexS1−x QDs with tunable PL emission and band gap by alloying engineering. The EVB and ECB values of the Ag2Te0.53S0.47 QDs were also calculated using UPS and absorption spectra, and an accurate diagram of the energy band alignment was plotted. The Ag2TexS1−x QD-based PD was fabricated to investigate their photoelectric properties. The PD shows good photoresponse at 1350 nm illumination, D* is 0.91 × 10¹⁰ Jones, and R is 0.48 mA/W under an applied voltage of 0.5 V and power densities of 2 mW/cm2. The PD maintains a stable response under multiple optical switching cycles, with a rise time of 2.11 s and a fall time of 1.04 s, indicating excellent optoelectronic performance. Therefore, the novel Ag2TexS1−x ternary alloy QDs extend the photoresponse range of Ag2S QDs, demonstrating promising potential in near-infrared PL emission and photodetection.
Supplementary Materials
The following supporting information can be downloaded at https://www.mdpi.com/article/10.3390/inorganics12010001/s1: Figure S1: The size distribution of Ag2TexS1−x QDs; Figure S2: ICP-OES data shows the relative amount of Te in the product versus the relative amount of Te in the precursor solution. Figure S3: The schematic band alignment of Ag2Te0.53S0.47 alloyed QDs. Figure S4: The I-V characteristics of the fabricated Ag2Te0.53S0.47 QD-based PD in dark and under 1350 nm NIR light with power densities of 2 mW/cm2.
Author Contributions
Conceptualization, Z.W., H.H. and W.W.; methodology, Z.W.; formal analysis, Z.W.; investigation, Z.W., D.A. and W.W.; re-sources, H.H. and W.W.; data curation, Z.W.; writing—original draft preparation, Z.W.; writing—review and editing, Y.G., D.A., F.L. and W.W.; visualization, Z.W. and D.A.; supervision, H.H. and W.W.; project administration, Y.G., F.L., H.H. and W.W.; funding acquisition, Y.G., F.L., H.H. and W.W. All authors have read and agreed to the published version of the manuscript.
Funding
This work is supported by the National Natural Science Foundation of China (No. 52273242, No. 61975219, No. 22202231), the National Key R&D Program of China (No. 2021YFB2800703, No. 2021YFB2800701) and the Chinese Academy of Sciences.
Data Availability Statement
The data presented in this study are available in article.
Conflicts of Interest
The authors declare no conflict of interest.
References
- Aiello, R.; Di Sarno, V.; Santi, M.G.D.; De Rosa, M.; Ricciardi, I.; Giusfredi, G.; De Natale, P.; Santamaria, L.; Maddaloni, P. Lamb-dip saturated-absorption cavity ring-down rovibrational molecular spectroscopy in the near-infrared. Photonics Res. 2022, 10, 1803–1809. [Google Scholar] [CrossRef]
- Shanmugam, V.; Selvakumar, S.; Yeh, C.S. Near-infrared light-responsive nanomaterials in cancer therapeutics. Chem. Soc. Rev. 2014, 43, 6254–6287. [Google Scholar] [CrossRef]
- Zhang, Q.Q.; Li, Y.; Jiang, C.H.; Sun, W.B.; Tao, J.W.; Lu, L.H. Near-infrared light-enhanced generation of hydroxyl radical for cancer immunotherapy. Adv. Healthc. Mater. 2023, 12, 2301502. [Google Scholar] [CrossRef]
- Sun, P.; Zhang, M.D.; Dong, F.L.; Feng, L.F.; Chu, W.G. Broadband achromatic polarization insensitive metalens over 950 nm bandwidth in the visible and near-infrared. Chin. Opt. Lett. 2022, 20, 013601. [Google Scholar] [CrossRef]
- Tan, L.L.; Fu, Y.Q.; Kang, S.L.; Wondraczek, L.; Lin, C.G.; Yue, Y.Z. Broadband NIR-emitting Te cluster-doped glass for smart light source towards night-vision and NIR spectroscopy applications. Photonics Res. 2022, 10, 1187–1193. [Google Scholar] [CrossRef]
- Wang, Y.H.; Bai, S.C.; Sun, J.; Liang, H.; Li, C.; Tan, T.Y.; Yang, G.; Wang, J.W. Highly efficient visible and near-infrared luminescence of Sb3+, Tm3+ co-doped Cs2NaYCl6 lead-free double perovskite and light emitting diodes. J. Alloys Compd. 2023, 947, 169602. [Google Scholar] [CrossRef]
- Kufer, D.; Nikitskiy, I.; Lasanta, T.; Navickaite, G.; Koppens, F.H.L.; Konstantatos, G. Hybrid 2D-0D MoS2-PbS quantum dot photodetectors. Adv. Mater. 2015, 27, 176–180. [Google Scholar] [CrossRef]
- Zhang, H.; Kumar, S.; Sua, Y.M.; Zhu, S.Y.; Huang, Y.P. Near-infrared 3D imaging with upconversion detection. Photonics Res. 2022, 10, 2760–2767. [Google Scholar] [CrossRef]
- Zeng, X.K.; Wang, C.Y.; Cai, Y.; Lin, Q.G.; Lu, X.W.; Lin, J.H.; Yuan, X.M.; Cao, W.H.; Ai, Y.X.; Xu, S.X. High spatial-resolution biological tissue imaging in the second near-infrared region via optical parametric amplification pumped by an ultrafast vortex pulse. Chin. Opt. Lett. 2022, 20, 100003. [Google Scholar] [CrossRef]
- Konstantatos, G.; Badioli, M.; Gaudreau, L.; Osmond, J.; Bernechea, M.; Garcia de Arquer, F.P.; Gatti, F.; Koppens, F.H.L. Hybrid graphene-quantum dot phototransistors with ultrahigh gain. Nat. Nanotechnol. 2012, 7, 363–368. [Google Scholar] [CrossRef]
- Koppens, F.H.L.; Mueller, T.; Avouris, P.; Ferrari, A.C.; Vitiello, M.S.; Polini, M. Photodetectors based on graphene, other two-dimensional materials and hybrid systems. Nat. Nanotechnol. 2014, 9, 780–793. [Google Scholar] [CrossRef]
- Wang, Z.; Li, J.B.; Huang, F.F.; Hua, Y.J.; Tian, Y.; Zhang, X.H.; Xu, S.Q. Multifunctional optical materials based on transparent inorganic glasses embedded with PbS QDs. J. Alloys Compd. 2023, 942, 169040. [Google Scholar] [CrossRef]
- Semonin, O.E.; Luther, J.M.; Choi, S.; Chen, H.Y.; Gao, J.B.; Nozik, A.J.; Beard, M.C. Peak external photocurrent quantum efficiency exceeding 100% via MEG in a quantum dot solar cell. Science 2011, 334, 1530–1533. [Google Scholar] [CrossRef] [PubMed]
- Chen, M.Y.; Lu, H.P.; Abdelazim, N.M.; Zhu, Y.; Wang, Z.; Ren, W.; Kershaw, S.V.; Rogach, A.L.; Zhao, N. Mercury telluride quantum dot based phototransistor enabling high-sensitivity room-temperature photodetection at 2000 nm. ACS Nano 2017, 11, 5614–5622. [Google Scholar] [CrossRef]
- Wang, R.; Li, X.M.; Zhou, L.; Zhang, F. Epitaxial seeded growth of rare-earth nanocrystals with efficient 800 nm near-infrared to 1525 nm short-wavelength infrared downconversion photoluminescence for in vivo bioimaging. Angew. Chem. Int. Ed. 2014, 53, 12086–12090. [Google Scholar] [CrossRef]
- Kong, J.; Franklin, N.R.; Zhou, C.W.; Chapline, M.G.; Peng, S.; Cho, K.J.; Dai, H.J. Nanotube molecular wires as chemical sensors. Science 2000, 287, 622–625. [Google Scholar] [CrossRef]
- Dong, B.H.; Li, C.Y.; Chen, G.C.; Zhang, Y.J.; Zhang, Y.; Deng, M.J.; Wang, Q.B. Facile synthesis of highly photoluminescent Ag2Se quantum dots as a new fluorescent probe in the second near-infrared window for in vivo imaging. Chem. Mater. 2013, 25, 2503–2509. [Google Scholar] [CrossRef]
- Gu, Y.P.; Cui, R.; Zhang, Z.L.; Xie, Z.X.; Pang, D.W. Ultrasmall near-infrared Ag2Se quantum dots with tunable fluorescence for in vivo imaging. J. Am. Chem. Soc. 2012, 134, 79–82. [Google Scholar] [CrossRef]
- Li, C.Y.; Zhang, Y.J.; Wang, M.; Zhang, Y.; Chen, G.C.; Li, L.; Wu, D.M.; Wang, Q.B. In vivo real-time visualization of tissue blood flow and angiogenesis using Ag2S quantum dots in the NIR-II window. Biomaterials 2014, 35, 393–400. [Google Scholar] [CrossRef]
- Zhao, C.; Chen, C.L.; Wei, R.; Zou, Y.T.; Kong, W.C.; Huang, T.; Yu, Z.; Yang, J.J.; Li, F.; Han, Y.; et al. Laser-assisted synthesis of Ag2S-quantum-dot-in-perovskite matrix and its application in broadband photodetectors. Adv. Opt. Mater. 2022, 10, 2101535. [Google Scholar] [CrossRef]
- Martin-Garcia, B.; Spirito, D.; Krahne, R.; Moreels, I. Solution-processed silver sulphide nanocrystal film for resistive switching memories. J. Mater. Chem. C 2018, 6, 13128–13135. [Google Scholar] [CrossRef]
- Wang, B.; Zhao, C.; Lu, H.Y.; Zou, T.T.; Singh, S.C.; Yu, Z.; Yao, C.M.; Zheng, X.; Xing, J.; Zou, Y.T.; et al. SERS study on the synergistic effects of electric field enhancement and charge transfer in an Ag2S quantum dots/plasmonic bowtie nanoantenna composite system. Photonics Res. 2020, 8, 548–563. [Google Scholar] [CrossRef]
- Zhang, Y.; Hong, G.S.; Zhang, Y.J.; Chen, G.C.; Li, F.; Dai, H.J.; Wang, Q.B. Ag2S quantum dot: A bright and biocompatible fluorescent nanoprobe in the second near-infrared window. ACS Nano 2012, 6, 3695–3702. [Google Scholar] [CrossRef]
- Ji, C.Y.; Zhang, Y.; Zhang, X.Y.; Wang, P.; Shen, H.Z.; Gao, W.Z.; Wang, Y.D.; Yu, W.W. Synthesis and characterization of Ag2SxSe1-x nanocrystals and their photoelectrochemical property. Nanotechnology 2017, 28, 065602. [Google Scholar] [CrossRef] [PubMed]
- Bailey, R.E.; Nie, S.M. Alloyed semiconductor quantum dots: Tuning the optical properties without changing the particle size. J. Am. Chem. Soc. 2003, 125, 7100–7106. [Google Scholar] [CrossRef] [PubMed]
- Smith, D.K.; Luther, J.M.; Semonin, O.E.; Nozik, A.J.; Beard, M.C. Tuning the synthesis of ternary lead chalcogenide quantum dots by balancing precursor reactivity. ACS Nano 2011, 5, 183–190. [Google Scholar] [CrossRef]
- Kim, T.; Kim, K.H.; Kim, S.; Choi, S.M.; Jang, H.; Seo, H.K.; Lee, H.; Chung, D.Y.; Jang, E. Efficient and stable blue quantum dot light-emitting diode. Nature 2020, 586, 385–389. [Google Scholar] [CrossRef]
- Qian, H.; Dong, C.; Peng, J.; Qiu, X.; Xu, Y.; Ren, J. High-quality and water-soluble near-infrared photoluminescent CdHgTe/CdS quantum dots prepared by adjusting size and composition. J. Phys. Chem. C 2007, 111, 16852–16857. [Google Scholar] [CrossRef]
- Nakazawa, T.; Kim, D.; Oshima, Y.; Sato, H.; Park, J.; Kim, H. Synthesis and application of AgBiS2 and Ag2S nanoinks for the production of IR photodetectors. ACS Omega 2021, 6, 20710–20718. [Google Scholar] [CrossRef]
- Grotevent, M.J.; Hail, C.U.; Yakunin, S.; Bachmann, D.; Kara, G.; Dirin, D.N.; Calame, M.; Poulikakos, D.; Kovalenko, M.V.; Shorubalko, I. Temperature-dependent charge carrier transfer in colloidal quantum dot/graphene infrared photodetectors. ACS Appl. Mater. Interfaces 2021, 13, 848–856. [Google Scholar] [CrossRef]
- Bhatt, V.; Kumar, M.; Kim, E.C.; Chung, H.J.; Yun, J.H. Wafer-scale, thickness-controlled p-CuInSe2/n-Si heterojunction for self-biased, highly sensitive, and broadband photodetectors. ACS Appl. Electron. 2022, 4, 6284–6299. [Google Scholar] [CrossRef]
- Hu, H.; Wu, C.; He, C.; Shen, J.; Cheng, Y.; Wu, F.; Wang, S.; Guo, D. Improved photoelectric performance with self-powered characteristics through TiO2 surface passivation in an α- Ga2O3 nanorod array deep ultraviolet photodetector. ACS Appl. Electron. Mater. 2022, 4, 3801–3806. [Google Scholar] [CrossRef]
- Zhang, Y.J.; Yang, H.C.; An, X.Y.; Wang, Z.; Yang, X.H.; Yu, M.X.; Zhang, R.; Sun, Z.Q.; Wang, Q.B. Controlled synthesis of Ag2Te@Ag2S core-shell quantum dots with enhanced and tunable fluorescence in the second near-infrared window. Small 2020, 16, 2001003. [Google Scholar] [CrossRef]
- Wang, Z.; Liu, F.H.; Gu, Y.J.; Hu, Y.G.; Wu, W.P. Solution-processed self-powered near-infrared photodetectors of toxic heavy metal-free AgAuSe colloidal quantum dots. J. Mater. Chem. C 2022, 10, 1097–1104. [Google Scholar] [CrossRef]
- Kim, G.; Choi, D.; Eom, S.Y.; Song, H.; Jeong, K.S. Extended short-wavelength infrared photoluminescence and photocurrent of nonstoichiometric silver telluride colloidal nanocrystals. Nano Lett. 2021, 21, 8073–8079. [Google Scholar] [CrossRef]
- Yan, S.G.; Deng, D.Y.; Li, L.; Chen, Y.C.; Song, H.J.; Lv, Y. Glutathione modified Ag2Te nanoparticles as a resonance Rayleigh scattering sensor for highly sensitive and selective determination of cytochrome C. Sens. Actuators B Chem. 2016, 228, 458–464. [Google Scholar] [CrossRef]
- Chang, P.J.; Cheng, H.Y.; Zhao, F.Y. Photocatalytic reduction of aromatic nitro compounds with Ag/AgxS composites under visible light irradiation. J. Phys. Chem. C 2021, 125, 26021–26030. [Google Scholar] [CrossRef]
- Dinda, D.; Ahmed, M.E.; Mandal, S.; Mondal, B.; Saha, S.K. Amorphous molybdenum sulfide quantum dots: An efficient hydrogen evolution electrocatalyst in neutral medium. J. Mater. Chem. A 2016, 4, 15486–15493. [Google Scholar] [CrossRef]
- Denton, A.R.; Ashcroft, N.W. VEGARD LAW. Phys. Rev. A 1991, 43, 3161–3164. [Google Scholar] [CrossRef] [PubMed]
- Kershaw, S.V.; Susha, A.S.; Rogach, A.L. Narrow bandgap colloidal metal chalcogenide quantum dots: Synthetic methods, heterostructures, assemblies, electronic and infrared optical properties. Chem. Soc. Rev. 2013, 42, 3033–3087. [Google Scholar] [CrossRef]
- Du, Y.P.; Xu, B.; Fu, T.; Cai, M.; Li, F.; Zhang, Y.; Wang, Q.B. Near-infrared photoluminescent Ag2S quantum dots from a single source precursor. J. Am. Chem. Soc. 2010, 132, 1470–1471. [Google Scholar] [CrossRef] [PubMed]
- Zhang, Y.; Zhang, Y.J.; Hong, G.S.; He, W.; Zhou, K.; Yang, K.; Li, F.; Chen, G.C.; Liu, Z.; Dai, H.J.; et al. Biodistribution, pharmacokinetics and toxicology of Ag2S near-infrared quantum dots in mice. Biomaterials 2013, 34, 3639–3646. [Google Scholar] [CrossRef] [PubMed]
- Chen, C.; He, X.W.; Gao, L.; Ma, N. Cation exchange-based facile aqueous synthesis of small, stable, and nontoxic near-infrared Ag2Te/ZnS core/shell quantum dots emitting in the second biological window. ACS Appl. Mater. Interfaces 2013, 5, 1149–1155. [Google Scholar] [CrossRef]
- Jeon, J.W.; Jeon, D.W.; Sahoo, T.; Kim, M.; Baek, J.H.; Hoffman, J.L.; Kim, N.S.; Lee, I.H. Effect of annealing temperature on optical band-gap of amorphous indium zinc oxide film. J. Alloys Compd. 2011, 509, 10062–10065. [Google Scholar] [CrossRef]
- Wang, Z.; Gu, Y.J.; Li, X.M.; Liu, Y.; Liu, F.H.; Wu, W.P. Recent progress of quantum dot infrared photodetectors. Adv. Opt. Mater. 2023, 11, 2300970. [Google Scholar] [CrossRef]
- Guo, D.Y.; Wu, Z.P.; An, Y.H.; Guo, X.C.; Chu, X.L.; Sun, C.L.; Li, L.H.; Li, P.G.; Tang, W.H. Oxygen vacancy tuned Ohmic-Schottky conversion for enhanced performance in β-Ga2O3 solar-blind ultraviolet photodetectors. Appl. Phys. Lett. 2014, 105, 023507. [Google Scholar] [CrossRef]
Figure 1.
TEM and HRTEM images of Ag2TexS1−x QDs: (a) S/Te-A, (b) S/Te-B, (c) S/Te-C, and (d) S/Te-D.
Figure 1.
TEM and HRTEM images of Ag2TexS1−x QDs: (a) S/Te-A, (b) S/Te-B, (c) S/Te-C, and (d) S/Te-D.

Figure 2.
XRD patterns of four different Ag2TexS1−x QDs.
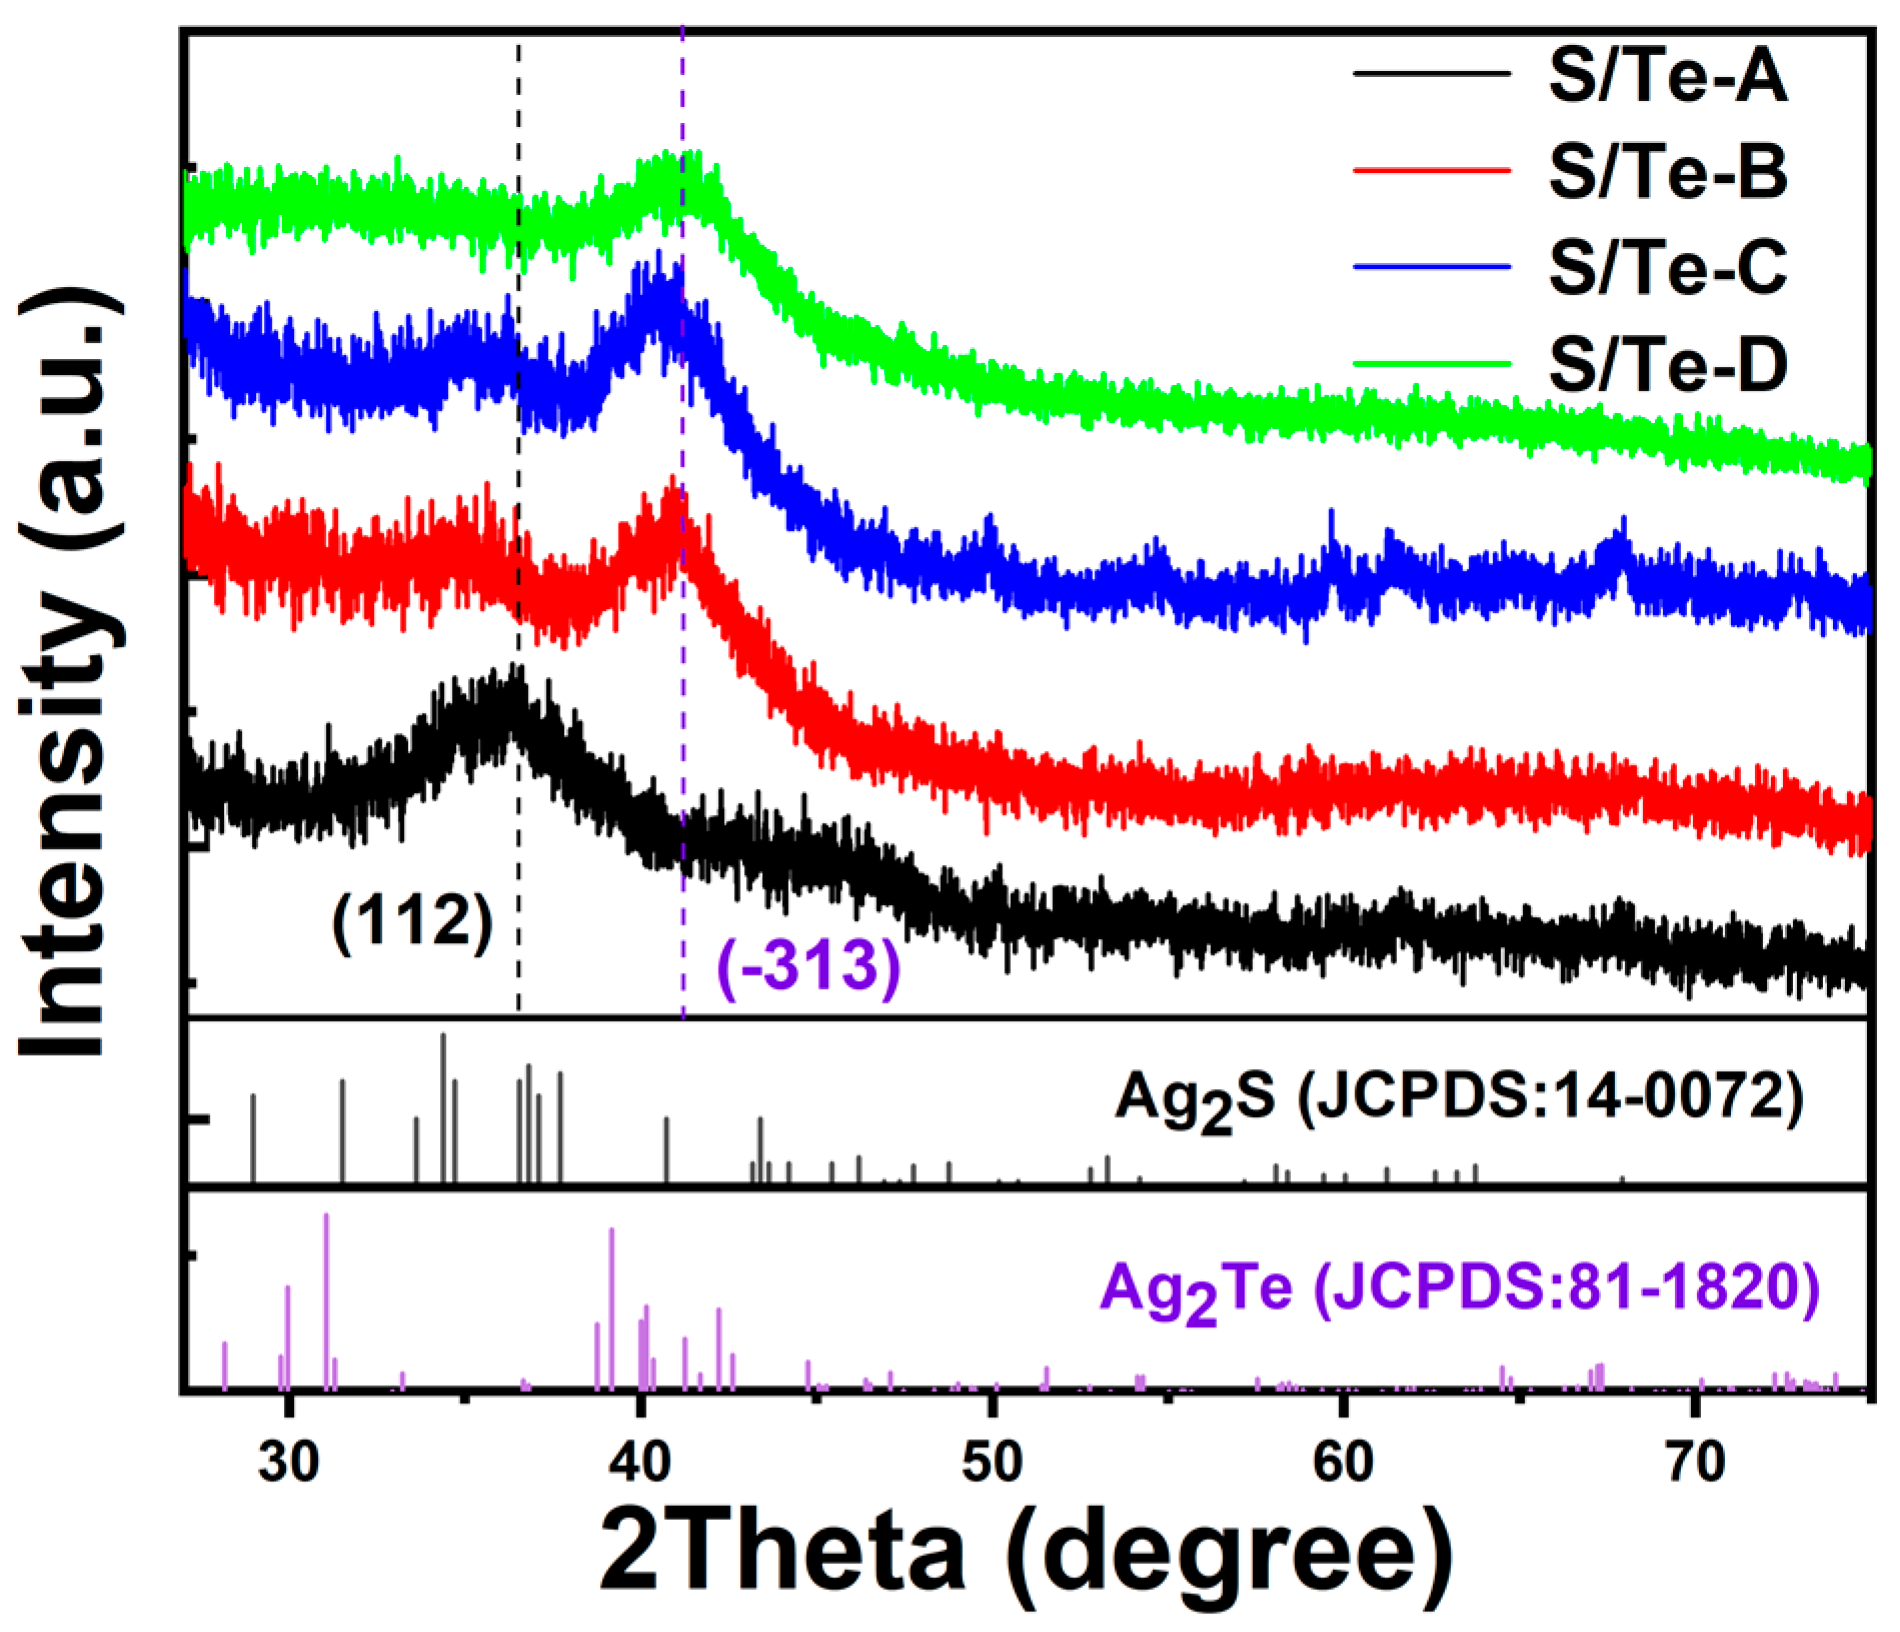
Figure 3.
(a) Survey XPS spectra of Ag2TexS1−x QDs. High-resolution XPS spectra for (b) Ag 3d, (c) Te 3d, and (d) S 2p. The overlapped spectra of S were fitted with the Gaussian function.
Figure 3.
(a) Survey XPS spectra of Ag2TexS1−x QDs. High-resolution XPS spectra for (b) Ag 3d, (c) Te 3d, and (d) S 2p. The overlapped spectra of S were fitted with the Gaussian function.

Figure 4.
PL emission spectra of the obtained four different Ag2TexS1−x QDs under an excitation of 785 nm (the dotted lines are the real raw experimental data, and the solid lines are the corresponding Gaussian fitting data).
Figure 4.
PL emission spectra of the obtained four different Ag2TexS1−x QDs under an excitation of 785 nm (the dotted lines are the real raw experimental data, and the solid lines are the corresponding Gaussian fitting data).
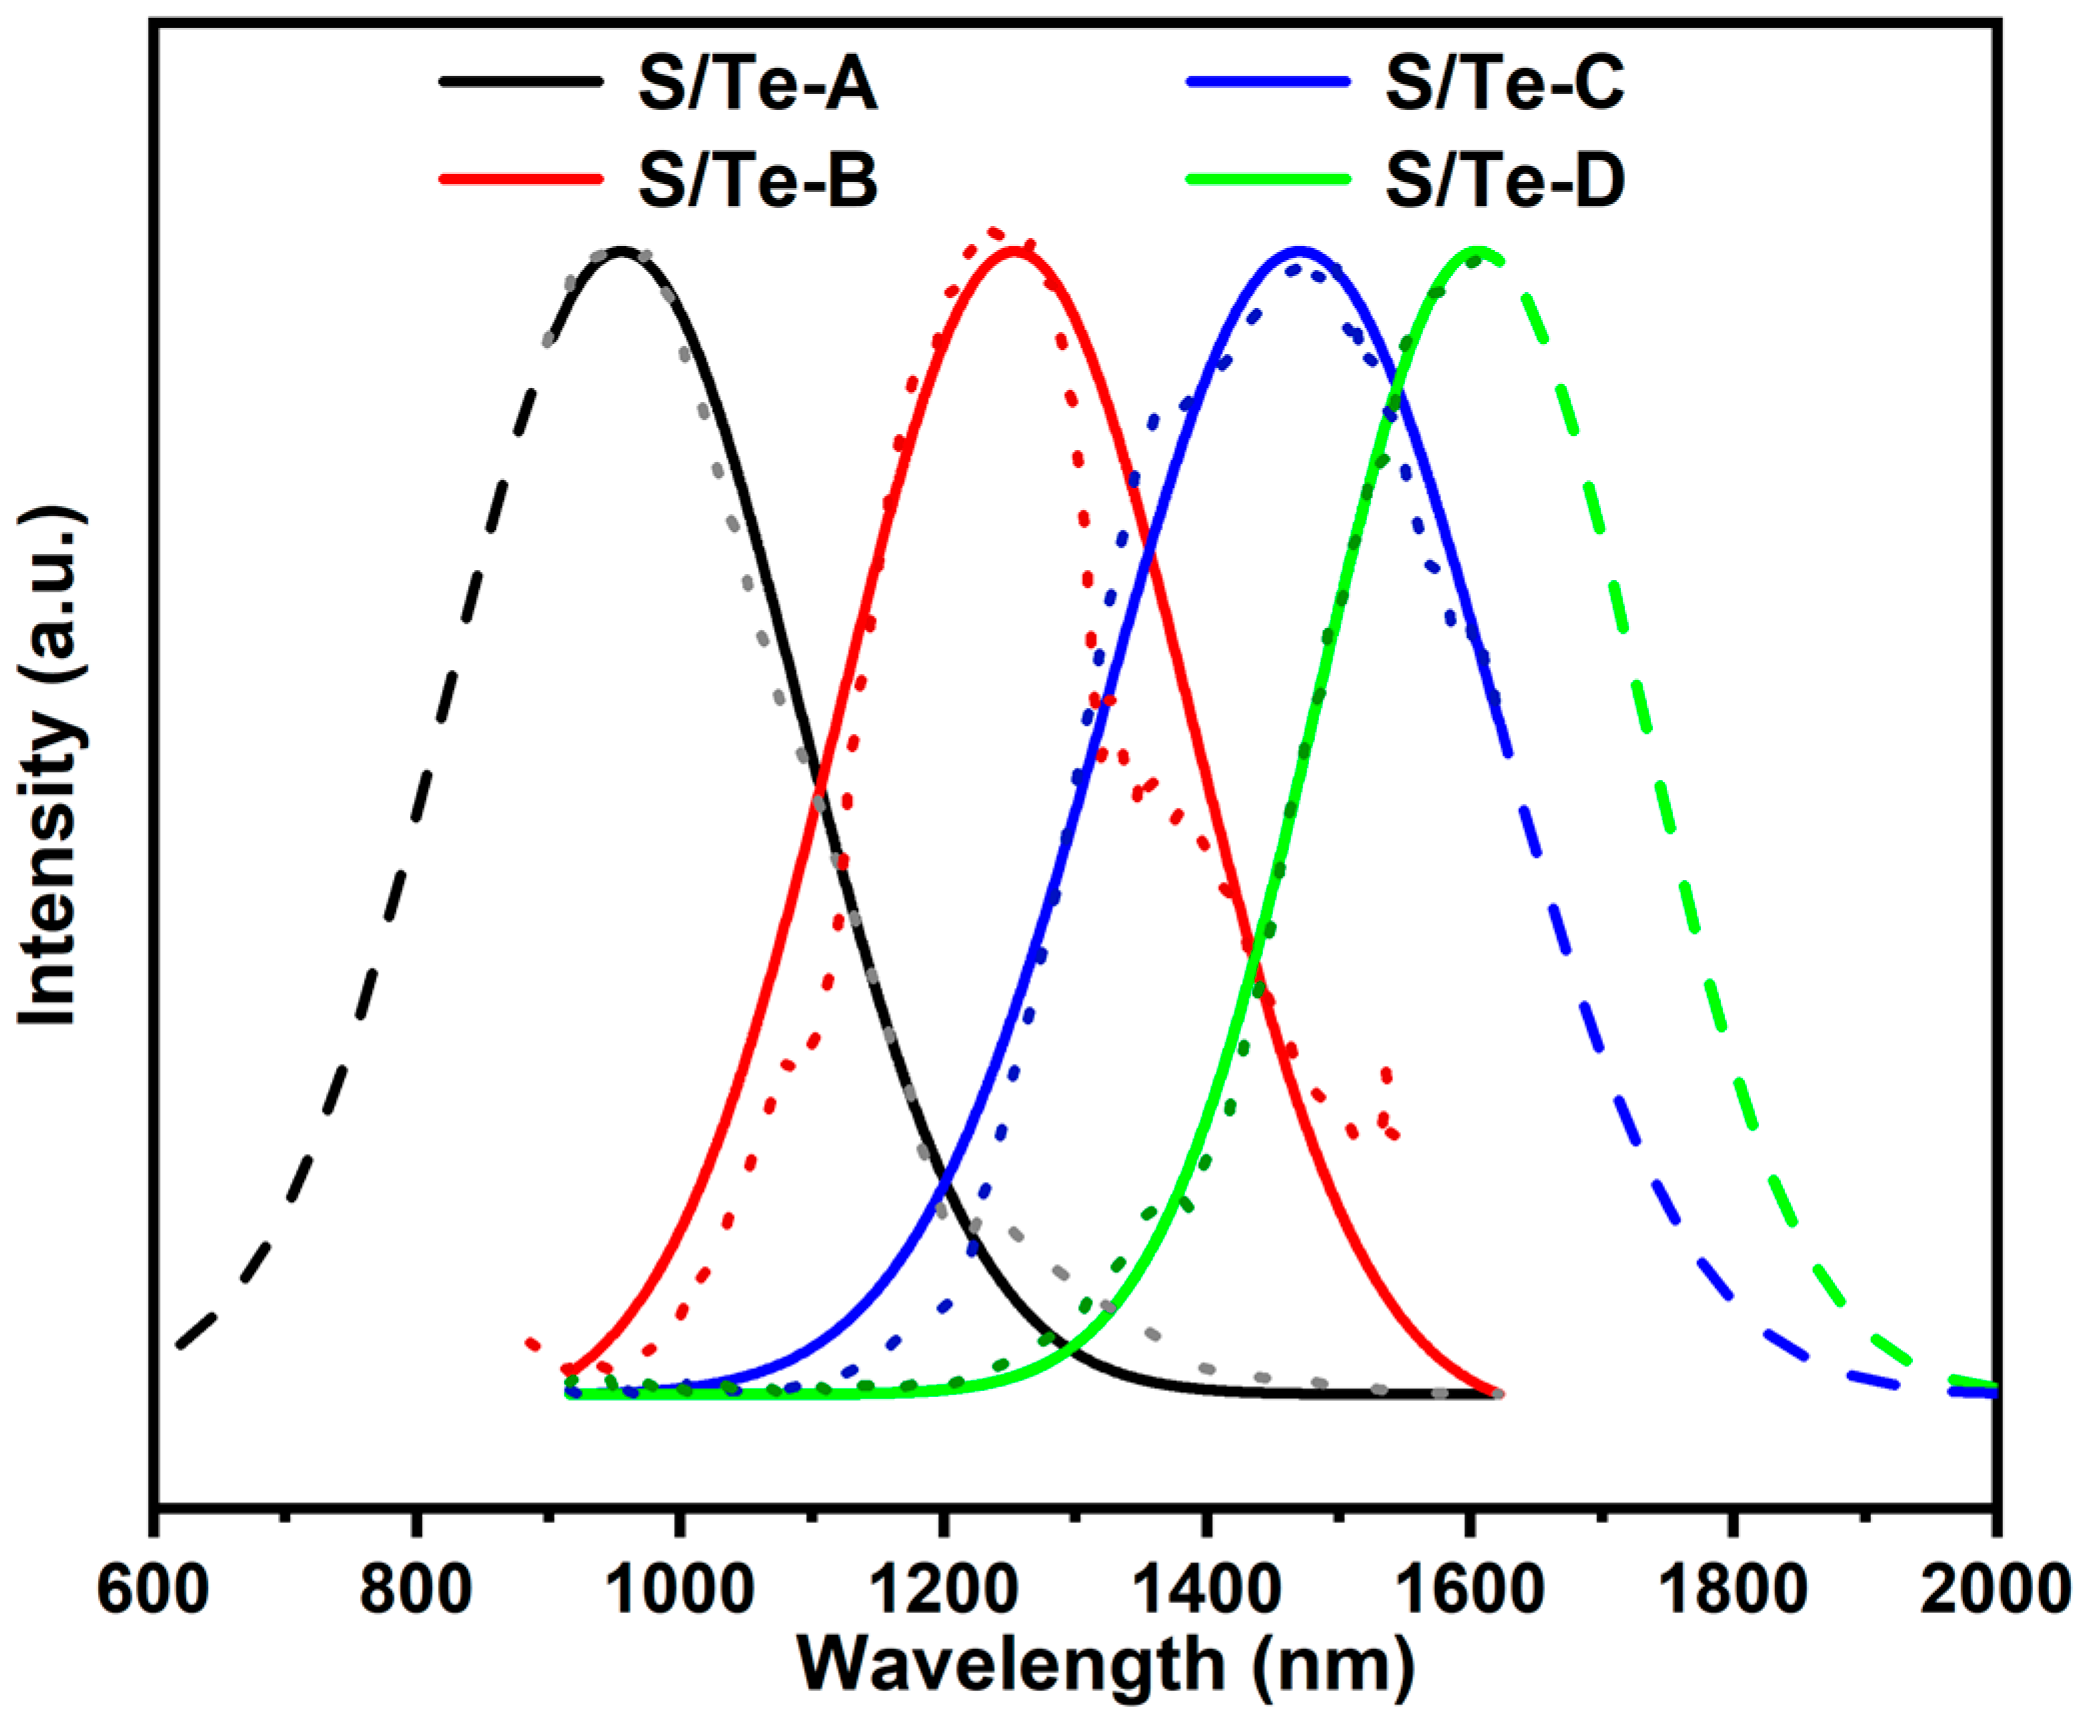
Figure 5.
Absorption spectrum and Tauc plot for estimating Eg (insert) of four different Ag2TexS1−x samples: (a) S/Te-A, (b) S/Te-B, (c) S/Te-C, and (d) S/Te-D.
Figure 5.
Absorption spectrum and Tauc plot for estimating Eg (insert) of four different Ag2TexS1−x samples: (a) S/Te-A, (b) S/Te-B, (c) S/Te-C, and (d) S/Te-D.
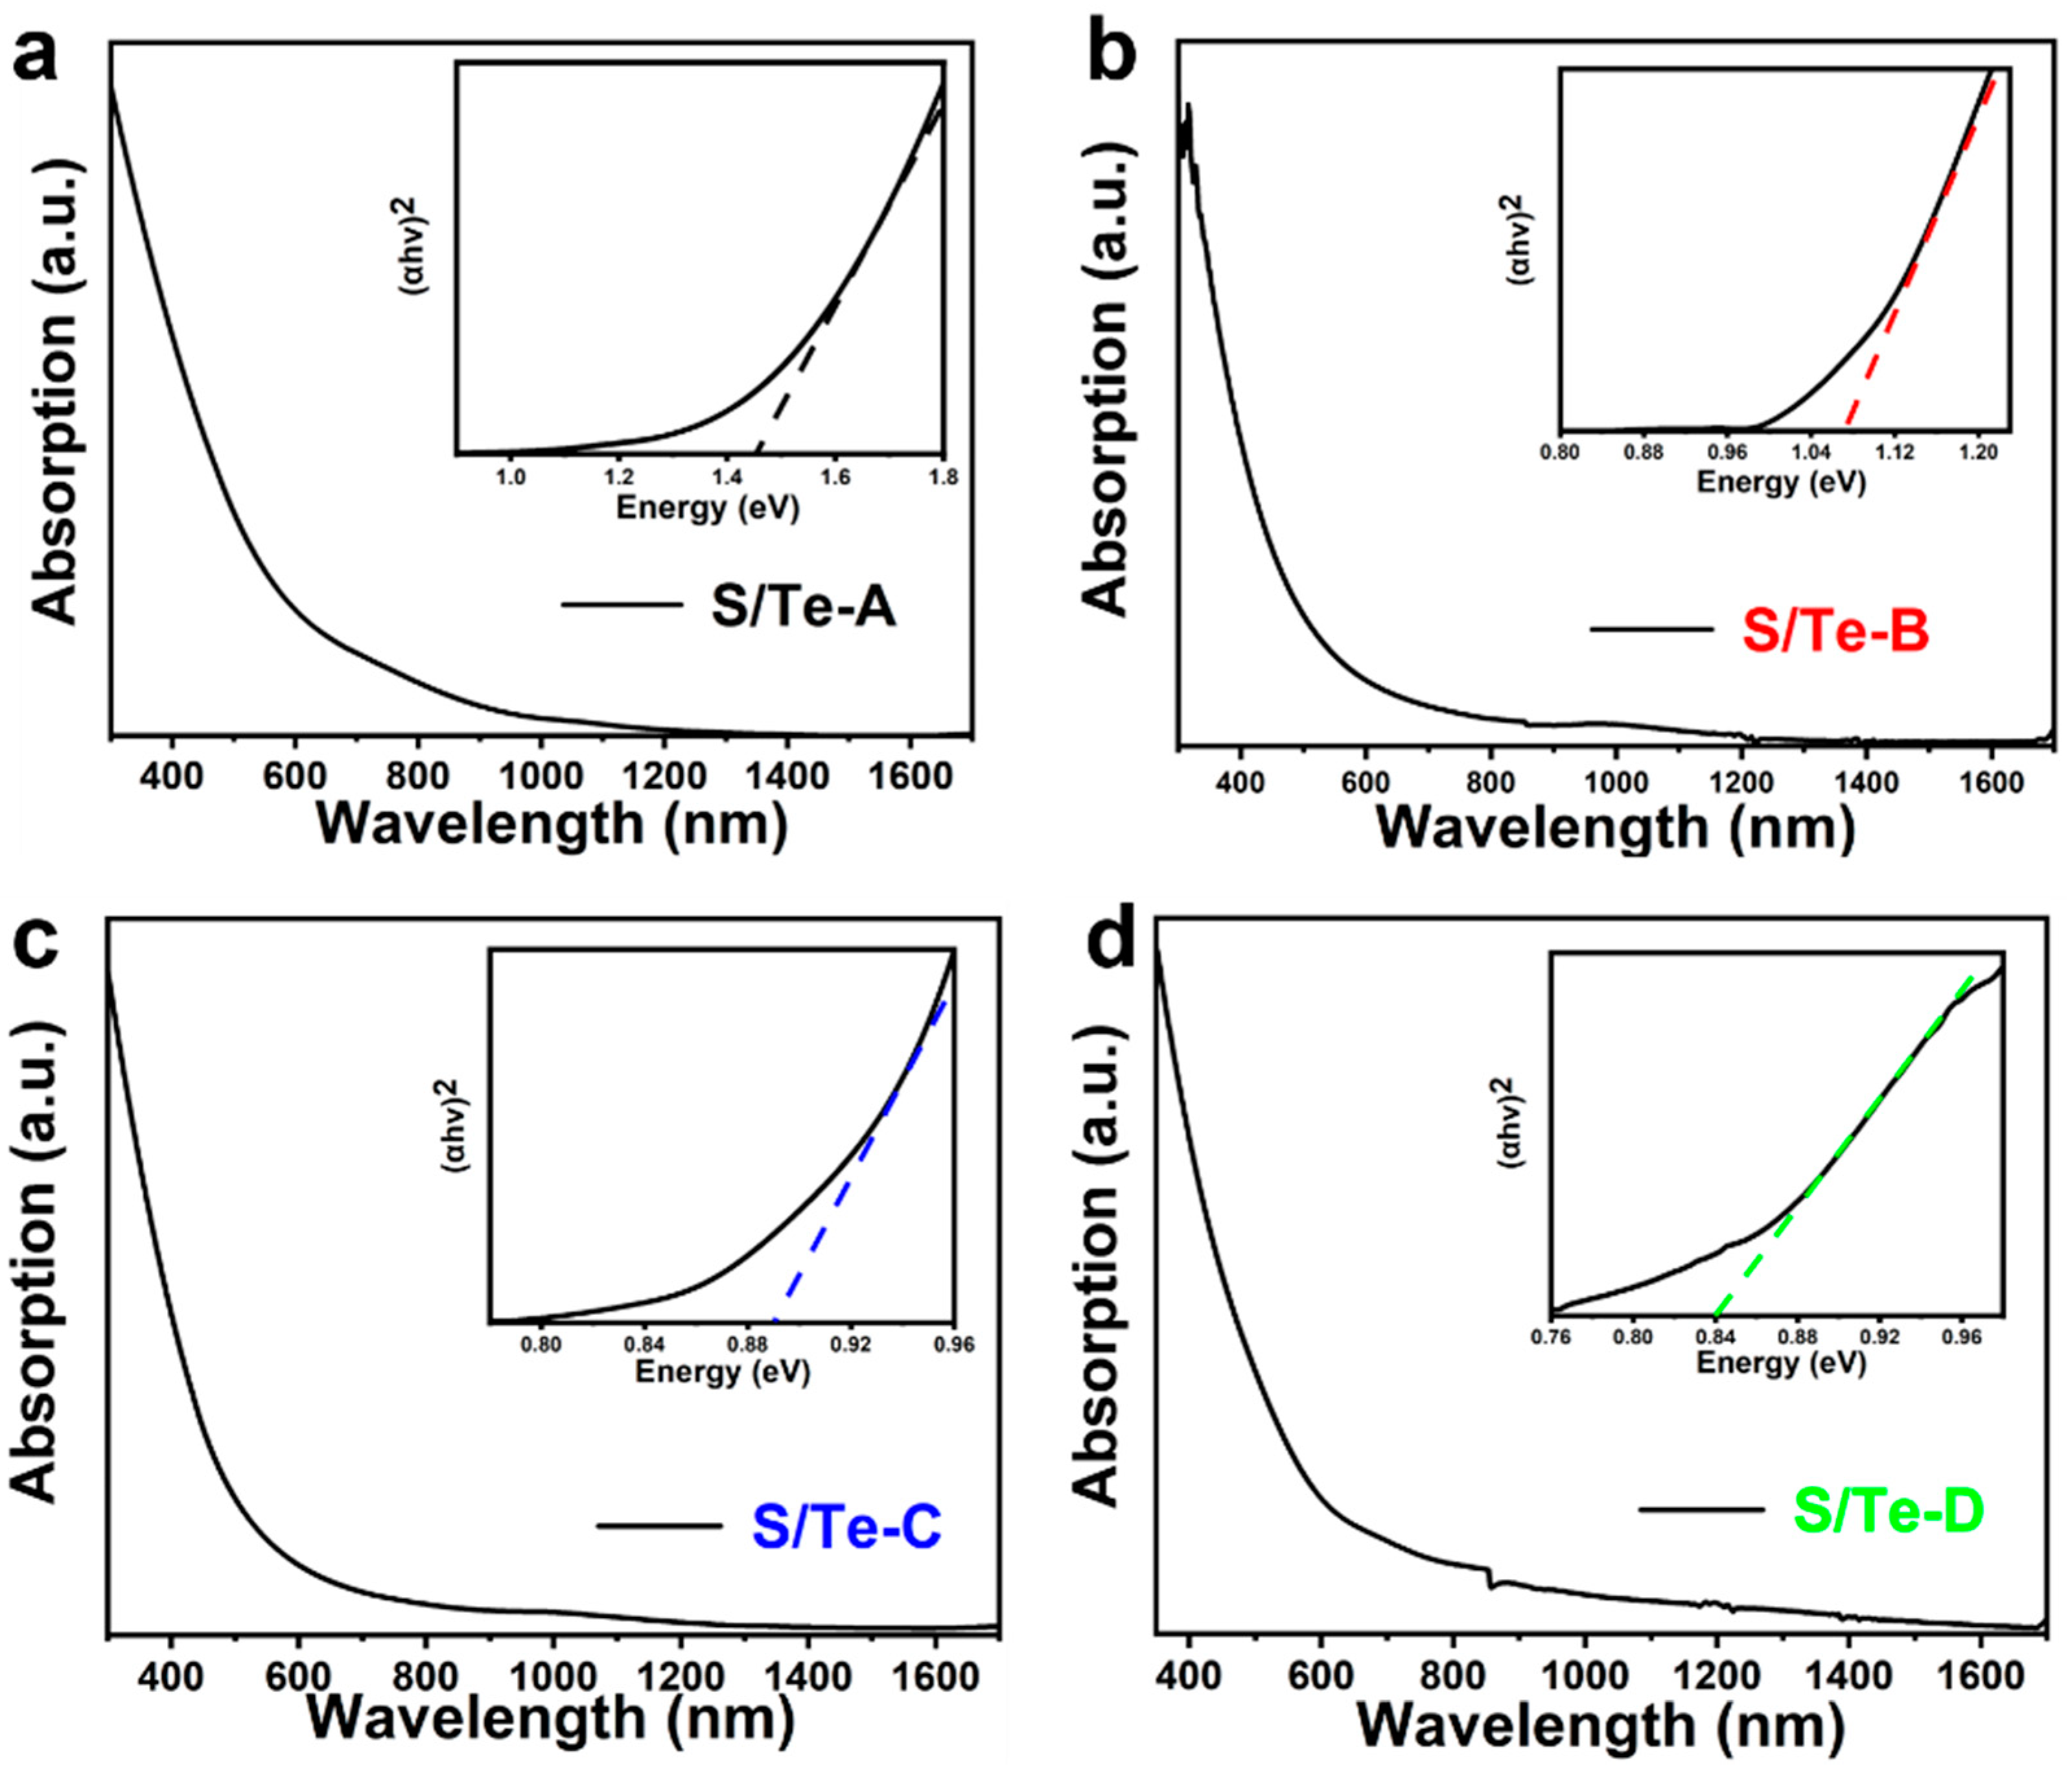
Figure 6.
(a) Survey UPS spectrum of the Ag2Te0.53S0.47 QDs. Amplified areas of (b) the high binding energy regions and (c) the low binding energy regions.
Figure 6.
(a) Survey UPS spectrum of the Ag2Te0.53S0.47 QDs. Amplified areas of (b) the high binding energy regions and (c) the low binding energy regions.
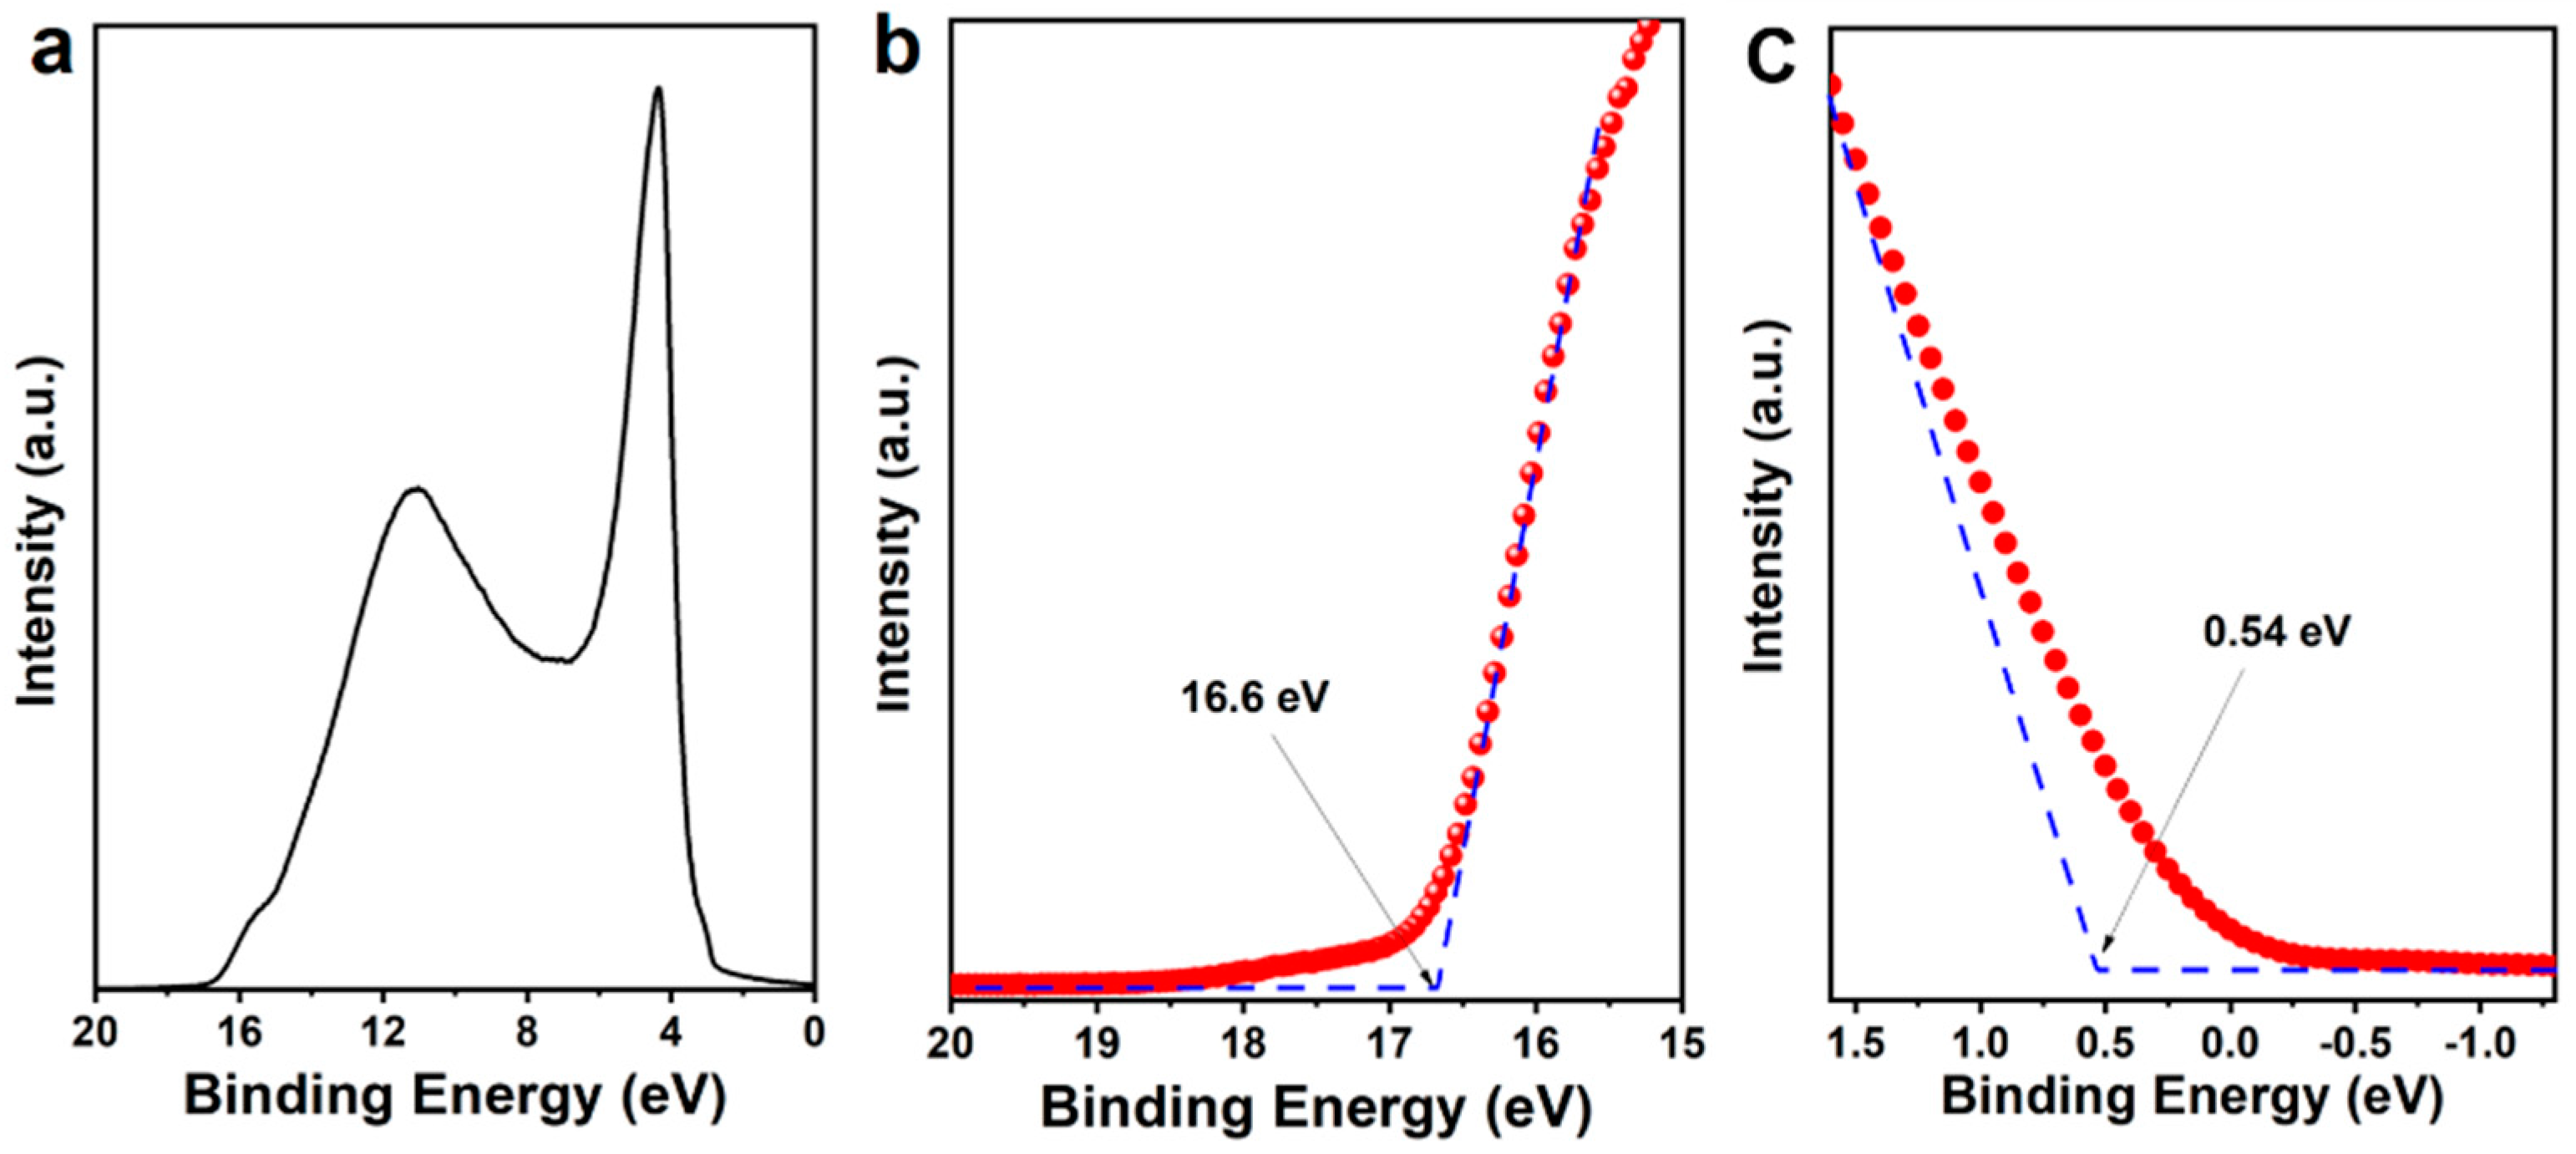
Figure 7.
(a) Time response of Ag2Te0.53S0.47 QD−based PD at 0.5 V under 1350 nm NIR illumination with power densities of 2 mW/cm2. (b) I−t curve for determining the rise and fall time of Ag2Te0.53S0.47 QD−based PD.
Figure 7.
(a) Time response of Ag2Te0.53S0.47 QD−based PD at 0.5 V under 1350 nm NIR illumination with power densities of 2 mW/cm2. (b) I−t curve for determining the rise and fall time of Ag2Te0.53S0.47 QD−based PD.

Figure 8.
The schematic of energy band diagrams of Au/Ag2TexS1−x QDs/Au PD on the glass substrate: (a) under dark and without external bias; (b) under NIR light with a wavelength of 1350 nm illumination and without external bias; (c) under illumination and with external bias.
Figure 8.
The schematic of energy band diagrams of Au/Ag2TexS1−x QDs/Au PD on the glass substrate: (a) under dark and without external bias; (b) under NIR light with a wavelength of 1350 nm illumination and without external bias; (c) under illumination and with external bias.
Disclaimer/Publisher’s Note: The statements, opinions and data contained in all publications are solely those of the individual author(s) and contributor(s) and not of MDPI and/or the editor(s). MDPI and/or the editor(s) disclaim responsibility for any injury to people or property resulting from any ideas, methods, instructions or products referred to in the content. |
© 2023 by the authors. Licensee MDPI, Basel, Switzerland. This article is an open access article distributed under the terms and conditions of the Creative Commons Attribution (CC BY) license (https://creativecommons.org/licenses/by/4.0/).
Share and Cite
MDPI and ACS Style
Wang, Z.; Gu, Y.; Aleksandrov, D.; Liu, F.; He, H.; Wu, W. Engineering Band Gap of Ternary Ag2TexS1−x Quantum Dots for Solution-Processed Near-Infrared Photodetectors. Inorganics 2024, 12, 1. https://doi.org/10.3390/inorganics12010001
AMA Style
Wang Z, Gu Y, Aleksandrov D, Liu F, He H, Wu W. Engineering Band Gap of Ternary Ag2TexS1−x Quantum Dots for Solution-Processed Near-Infrared Photodetectors. Inorganics. 2024; 12(1):1. https://doi.org/10.3390/inorganics12010001
Chicago/Turabian StyleWang, Zan, Yunjiao Gu, Daniil Aleksandrov, Fenghua Liu, Hongbo He, and Weiping Wu. 2024. "Engineering Band Gap of Ternary Ag2TexS1−x Quantum Dots for Solution-Processed Near-Infrared Photodetectors" Inorganics 12, no. 1: 1. https://doi.org/10.3390/inorganics12010001
Note that from the first issue of 2016, this journal uses article numbers instead of page numbers. See further details here.