1. Introduction
The ever increasing demand for bandwidth hungry applications, such as ultra-high definition video streaming, high resolution online video gaming and cloud services, are placing intensive pressure on existing fiber optic communication networks [
1]. This has led to a “capacity crunch”, where the existing networks struggle to meet the required bandwidth imposed by these new services and applications. Amongst the different network segments, the short reach and data centre networks (DCNs) form the last mile of the optical network. They require innovative low cost and low power solutions to be able to respond to the ever-increasing bandwidth demand challenges. Photonic integration [
2] provides a promising alternative to systems employing discrete components. By integrating multiple optical functionalities onto one chip, photonic integration can deliver cheaper, lower footprint, and lower power consumption solutions for optical networks. This can be a major advantage for DCNs, where compactness, cost, and power efficiency are critical [
3]. Photonic integrated circuits (PICs) are built from many different materials, on custom manufacturing platforms. These include silicon (Si), silica (SiO2), lithium niobate (LiNbO3), silicon nitride (SiN), indium phosphide (InP), polymer, or glass [
4]. PICs provide many attractive features, including smaller photonic dies, higher data rates, lower power consumption, lower cost per bit of data, and better reliability compared to legacy optics. Integrating multiple lasers in a single chip provides many advantages, such as the ability to achieve in-chip optical injection locking (OIL). OIL entails injecting light from a master laser into the cavity of a slave laser, thus transferring its frequency and phase to the slave laser [
5]. The transfer of the spectral characteristics from a spectrally purer master to a slave laser allows the improvement of various characteristics of the slave laser, such as optical linewidth [
6], relative intensity noise (RIN) [
7], and mode partition noise (MPN) [
8]. Furthermore, it can also enhance the laser modulation bandwidth [
9] and resonance frequency [
10]. Several studies have shown that the OIL can push the slave laser modulation bandwidth beyond the k-factor limit [
11]. A discrete OIL setup comprises different passive and active optical components, such as circulators, polarization controllers, isolators, master, and slave lasers. Such a setup suffers from instabilities due to polarization dependence in case of usage of standard single mode fiber (SSMF). Use of polarization maintaining fiber (PMF) based components could avoid the polarization dependence issue. However, it still suffers from temperature variation in the injection path and introduce large insertion losses (due to the passive components used). An on-chip (integrated) OIL solution can provide the same advantages as a discrete OIL setup, whilst offering a simpler, cheaper, smaller footprint, and polarization independent operation.
From the DCN and access network perspective, the ability to increase the modulation bandwidth of a laser is of particular interest, as it enables direct modulation of commercially available lasers with higher data rates. Direct modulation is a simple modulation technique, where the amplitude of the optical wave is modified, by varying the strength of the laser excitation [
12]. It alleviates the requirement for bulky and lossy external modulators in the transmitter, thus providing a cost and energy-efficient solution for DCNs. The high sensitivity of DCNs to both cost and energy favours direct modulation as an electro-optic conversion technique. Previous work has shown that multiple lasers implemented in a single PIC in a master-slave configuration can be directly modulated and used as a transmitter in short reach networks. In [
13], the authors report on a two-section discrete mode laser device in a master-slave configuration that achieves a side mode suppression ratio (SMSR) over 50 dB and a RIN of −142.6 dB/Hz. The laser is then directly modulated at a bit rate of 10 Gb/s, delivering an error-free back to back (B2B) transmission at a received optical power of −11 dBm. Furthermore, the same laser reported in [
13] was subsequently directly modulated and used to transmit a 10 Gb/s signal over 50 km of SSMF [
14]. Such long-distance transmission is achieved due to the reduction of the direct modulation induced frequency chirp by implementing OIL [
15]. Chirp, in systems employing direct modulation, is considered as one of the main limiting factors both in terms of the spectral efficiency as well as transmission distance (due to the interplay between the chirp and the fiber dispersion). The design of the chip in [
14] can be further improved by introducing additional, grating sections to the device. This would allow the lasing frequency of each laser to be tuned separately, thus providing much better control over the emission wavelength. Moreover, it provides more control over the power injected from the master laser, allowing for the optimization of the OIL, thus optimizing the overall performance of the integrated device. Furthermore, dividing each laser into two different sections gives the ability to control the bias of each section individually. This results in achieving accurate control over the Bragg condition (accurate overlap between the longitudinal mode of the FP laser and the Bragg mirror reflection), hence better compensation of cleaving facets error.
In this paper, we present an Indium Phosphide (InP) PIC that comprises of four sections, with different cavity lengths, realized in a master-slave configuration. All the sections of the PIC are active and can be biased separately. The complexity of the device structure and the amount of combinations of biases for each section results in different regimes of operation. Hence, an extensive characterization of the device, under different bias conditions, is critical in order to comprehend the device behaviour. Thus, in this paper, we present a detailed analysis of the device performance, under several bias conditions. We first carry out a static characterization of the PIC-based transmitter. The effect of injecting light from the master into the slave laser on vital transmitter parameters, such as linewidth and RIN, is presented. Subsequently, the dynamic characterization of the device, with and without injection from the master laser, is also presented and the enhancement of the PIC modulation bandwidth under OIL is shown. Finally, using the optimum operating conditions obtained from both static and dynamic characterizations, the performance of the PIC in a short reach network scenario is verified qualitatively and quantitatively through eye diagrams and BER as a function of the received optical power measurements.
The paper is organized as follows:
Section 2 includes a full description of the PIC design and the specifications of the different sections.
Section 3 presents the results of the static characterisation of the device, while the dynamic characterisation of the PIC is shown in
Section 4. This includes a comparative study (with and without OIL) of the frequency response, as well as the validation of the device performance in a 10.7 Gb/s directly modulated transmission system. Finally, conclusions are drawn in
Section 5.
2. Device Description
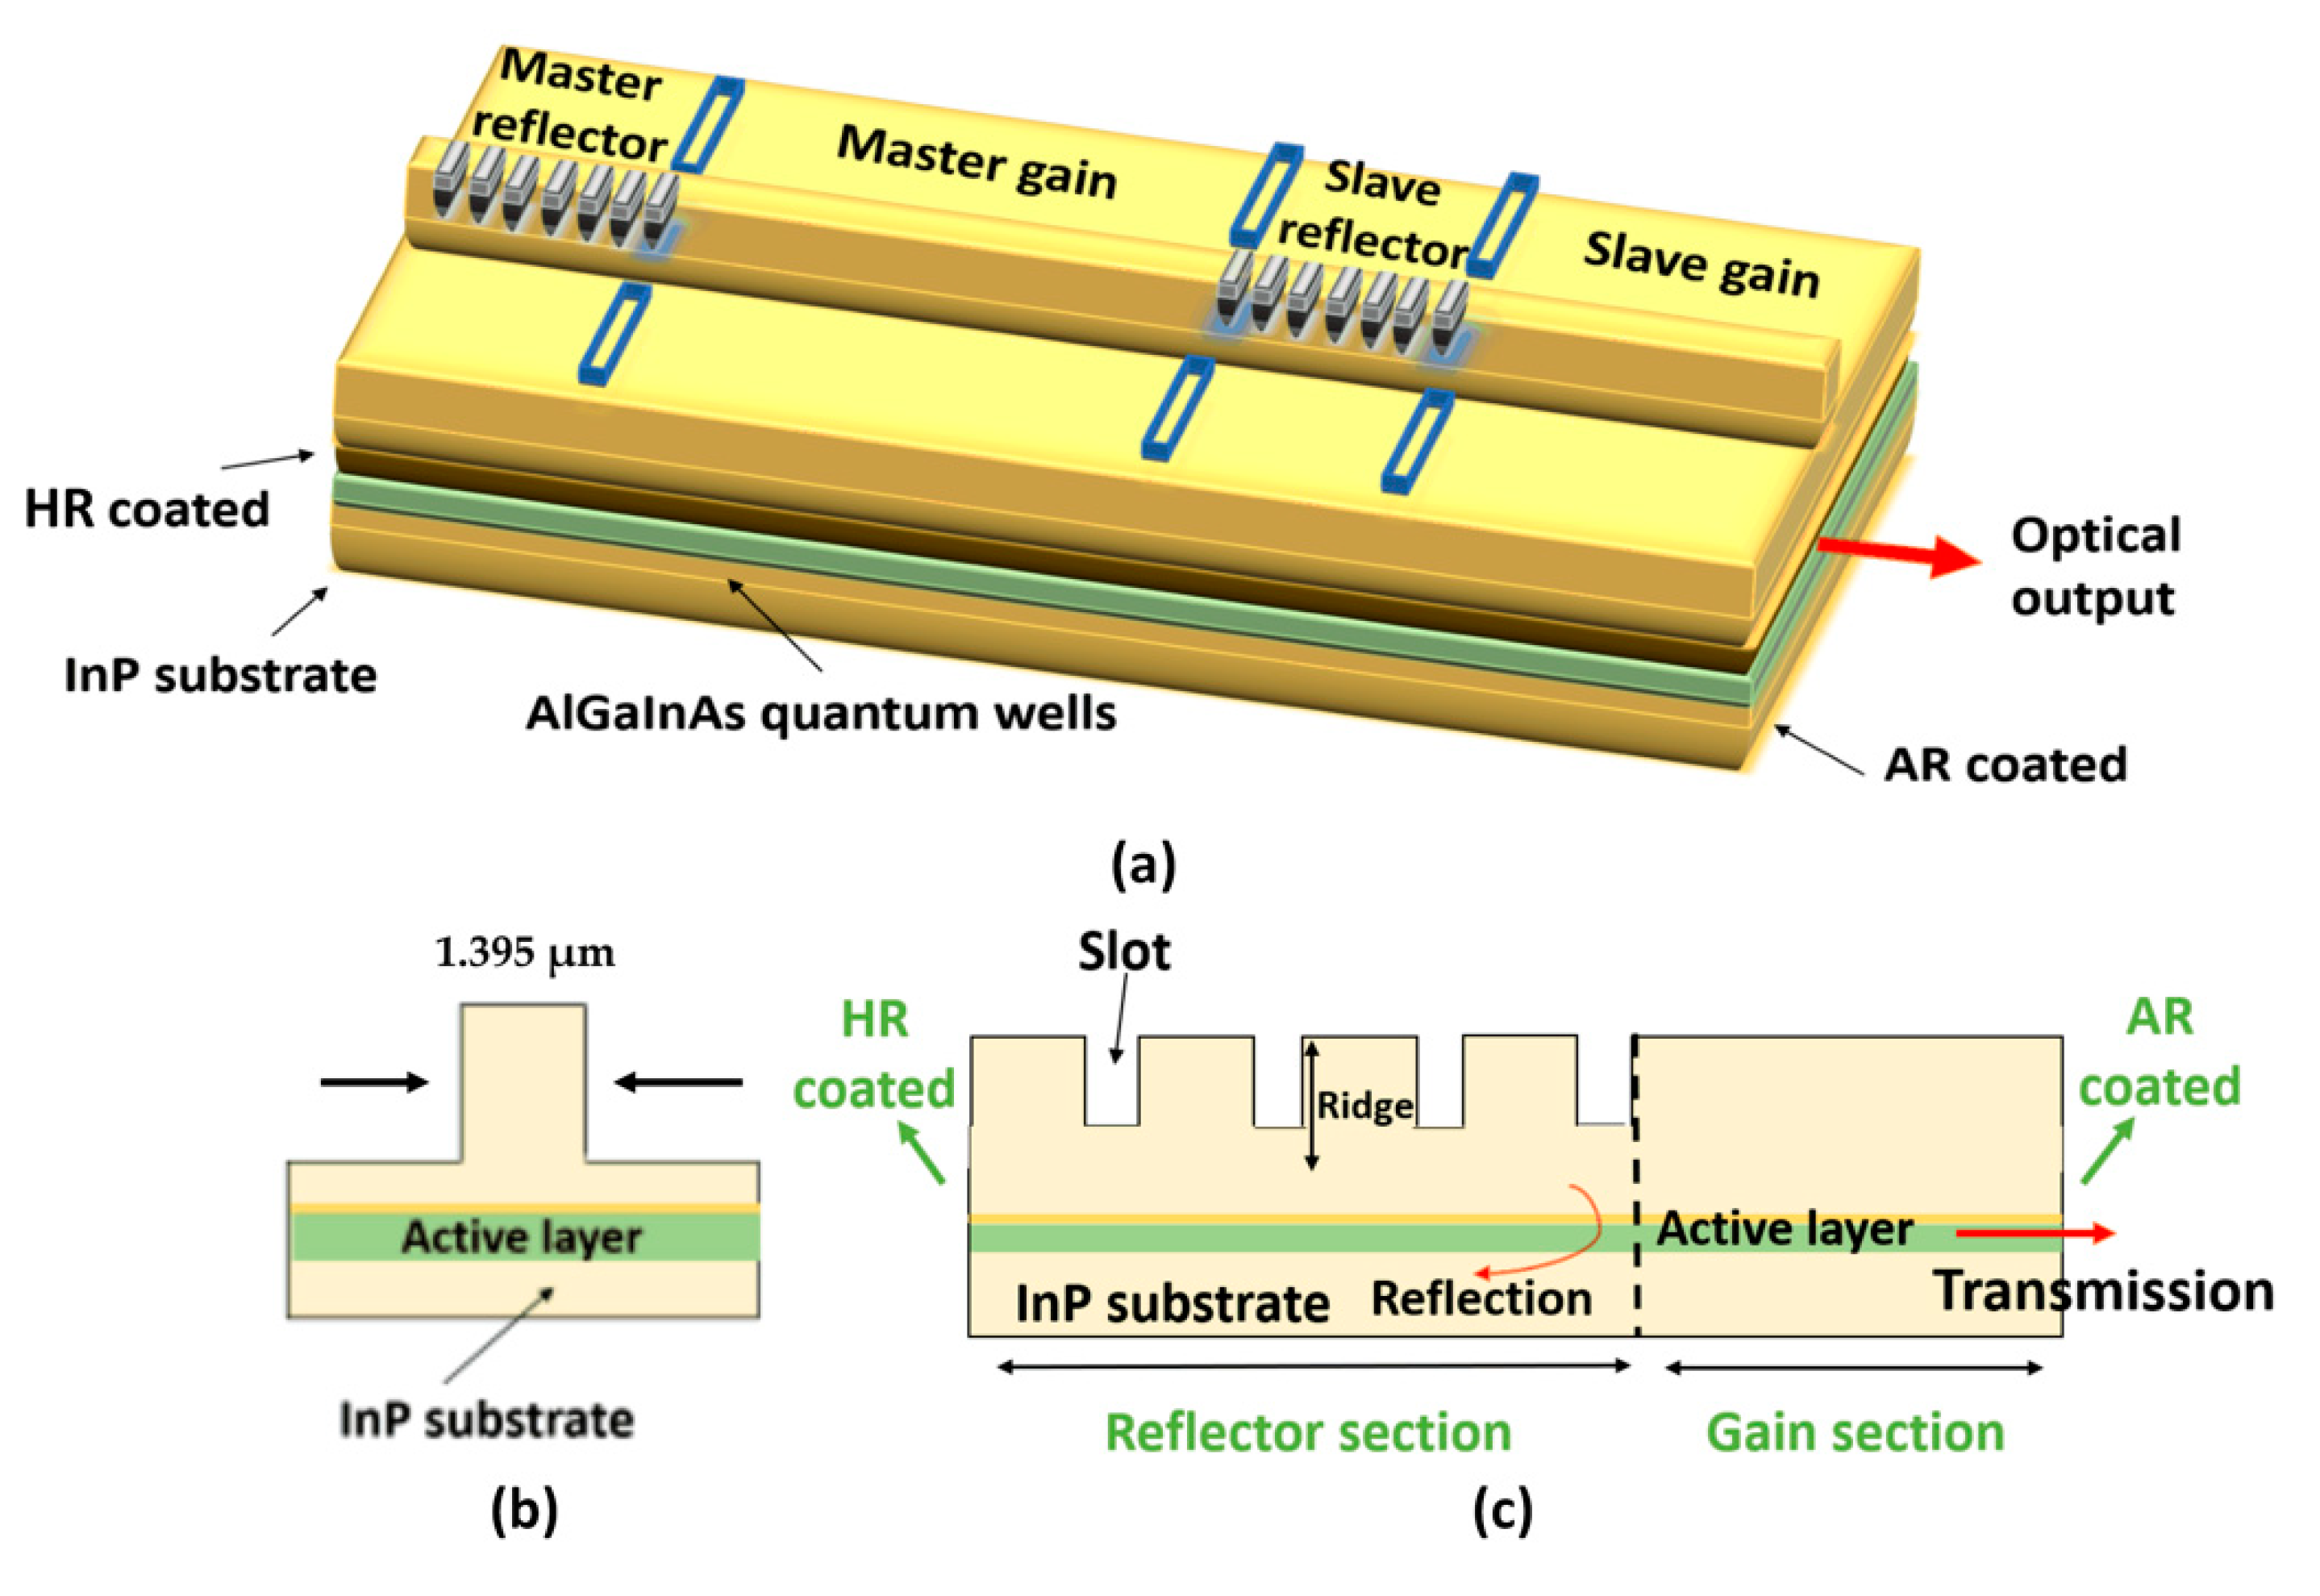
The schematic of the multi-section PIC is shown in
Figure 1a. The device is fabricated using a standard 1550 nm laser material (InP). Five strained ((Al
0.23Ga)
0.3In
0.7As) quantum wells of 5 nm thickness form the active region. This active region is placed on an n-doped InP substrate. There are in total 22 slots with a depth of 1.395 µm, as shown in
Figure 1b, which represents the side view of the device. These slots are used to control the longitudinal spectrum. Standard electron beam lithography is used in the fabrication of the slots to provide precise control of the slots’ dimensions (width, depth) and location [
16]. The total length of the device is ∼1.5 mm. The PIC consists of two regrowth-free Fabry-Pérot (FP) lasers, integrated into a master-slave configuration. Each laser consists of two electrically isolated sections, with different cavity lengths named gain and reflector sections, as shown in
Figure 1c. The gain section of each laser is a FP structure that generates and amplifies the light inside the cavity. This gain section has an anti-reflection (AR)-coated facet. Each of the multiple reflector sections of the laser serves as a grating. The multiple uniformly distributed slots in the reflector section act as a filter that enhances various FP mode(s), but suppresses other modes of the FP resonance. Hence, it restricts the FP laser to a single mode of the allowed FP cavity modes. This results in achieving a single longitudinal mode emission [
17]. These distributed slots can be considered as an active distributed Bragg grating [
18]. The left facet at the end of the slots region (reflector section) is high-reflection (HR)-coated. Both reflector sections of the two lasers are etched into the surface ridge waveguide, close to the active region, to provide internal reflections and enable a high SMSR (~50 dB) [
16]. Furthermore, they provide improved control of the emission wavelength and the injection power inside the PIC. Both sections of the laser (gain and reflector) share the same active layer and InP substrate. Besides consisting of two main sections, which are the master reflector (MR) and the master gain (MG), the master laser shares the slave reflector (SR) with the slave laser, which enables a reduction of the overall length of the device, providing better confinement and control of the total temperature of the PIC. The length of each section is optimized for its specific functions which enable the optimization of the PIC as a device for employment in short reach networks. The master gain is designed to be the longest of all sections (712 μm), in order to achieve a low linewidth emission. The slave gain section, on the other hand, is much shorter (355 μm), to ensure a high modulation bandwidth. The two reflector sections have an equal length of 215 μm. The isolation between different sections is achieved by separating them with a 2 μm wide etched trench, whose impedance is measured to be 2.29 kΩ.
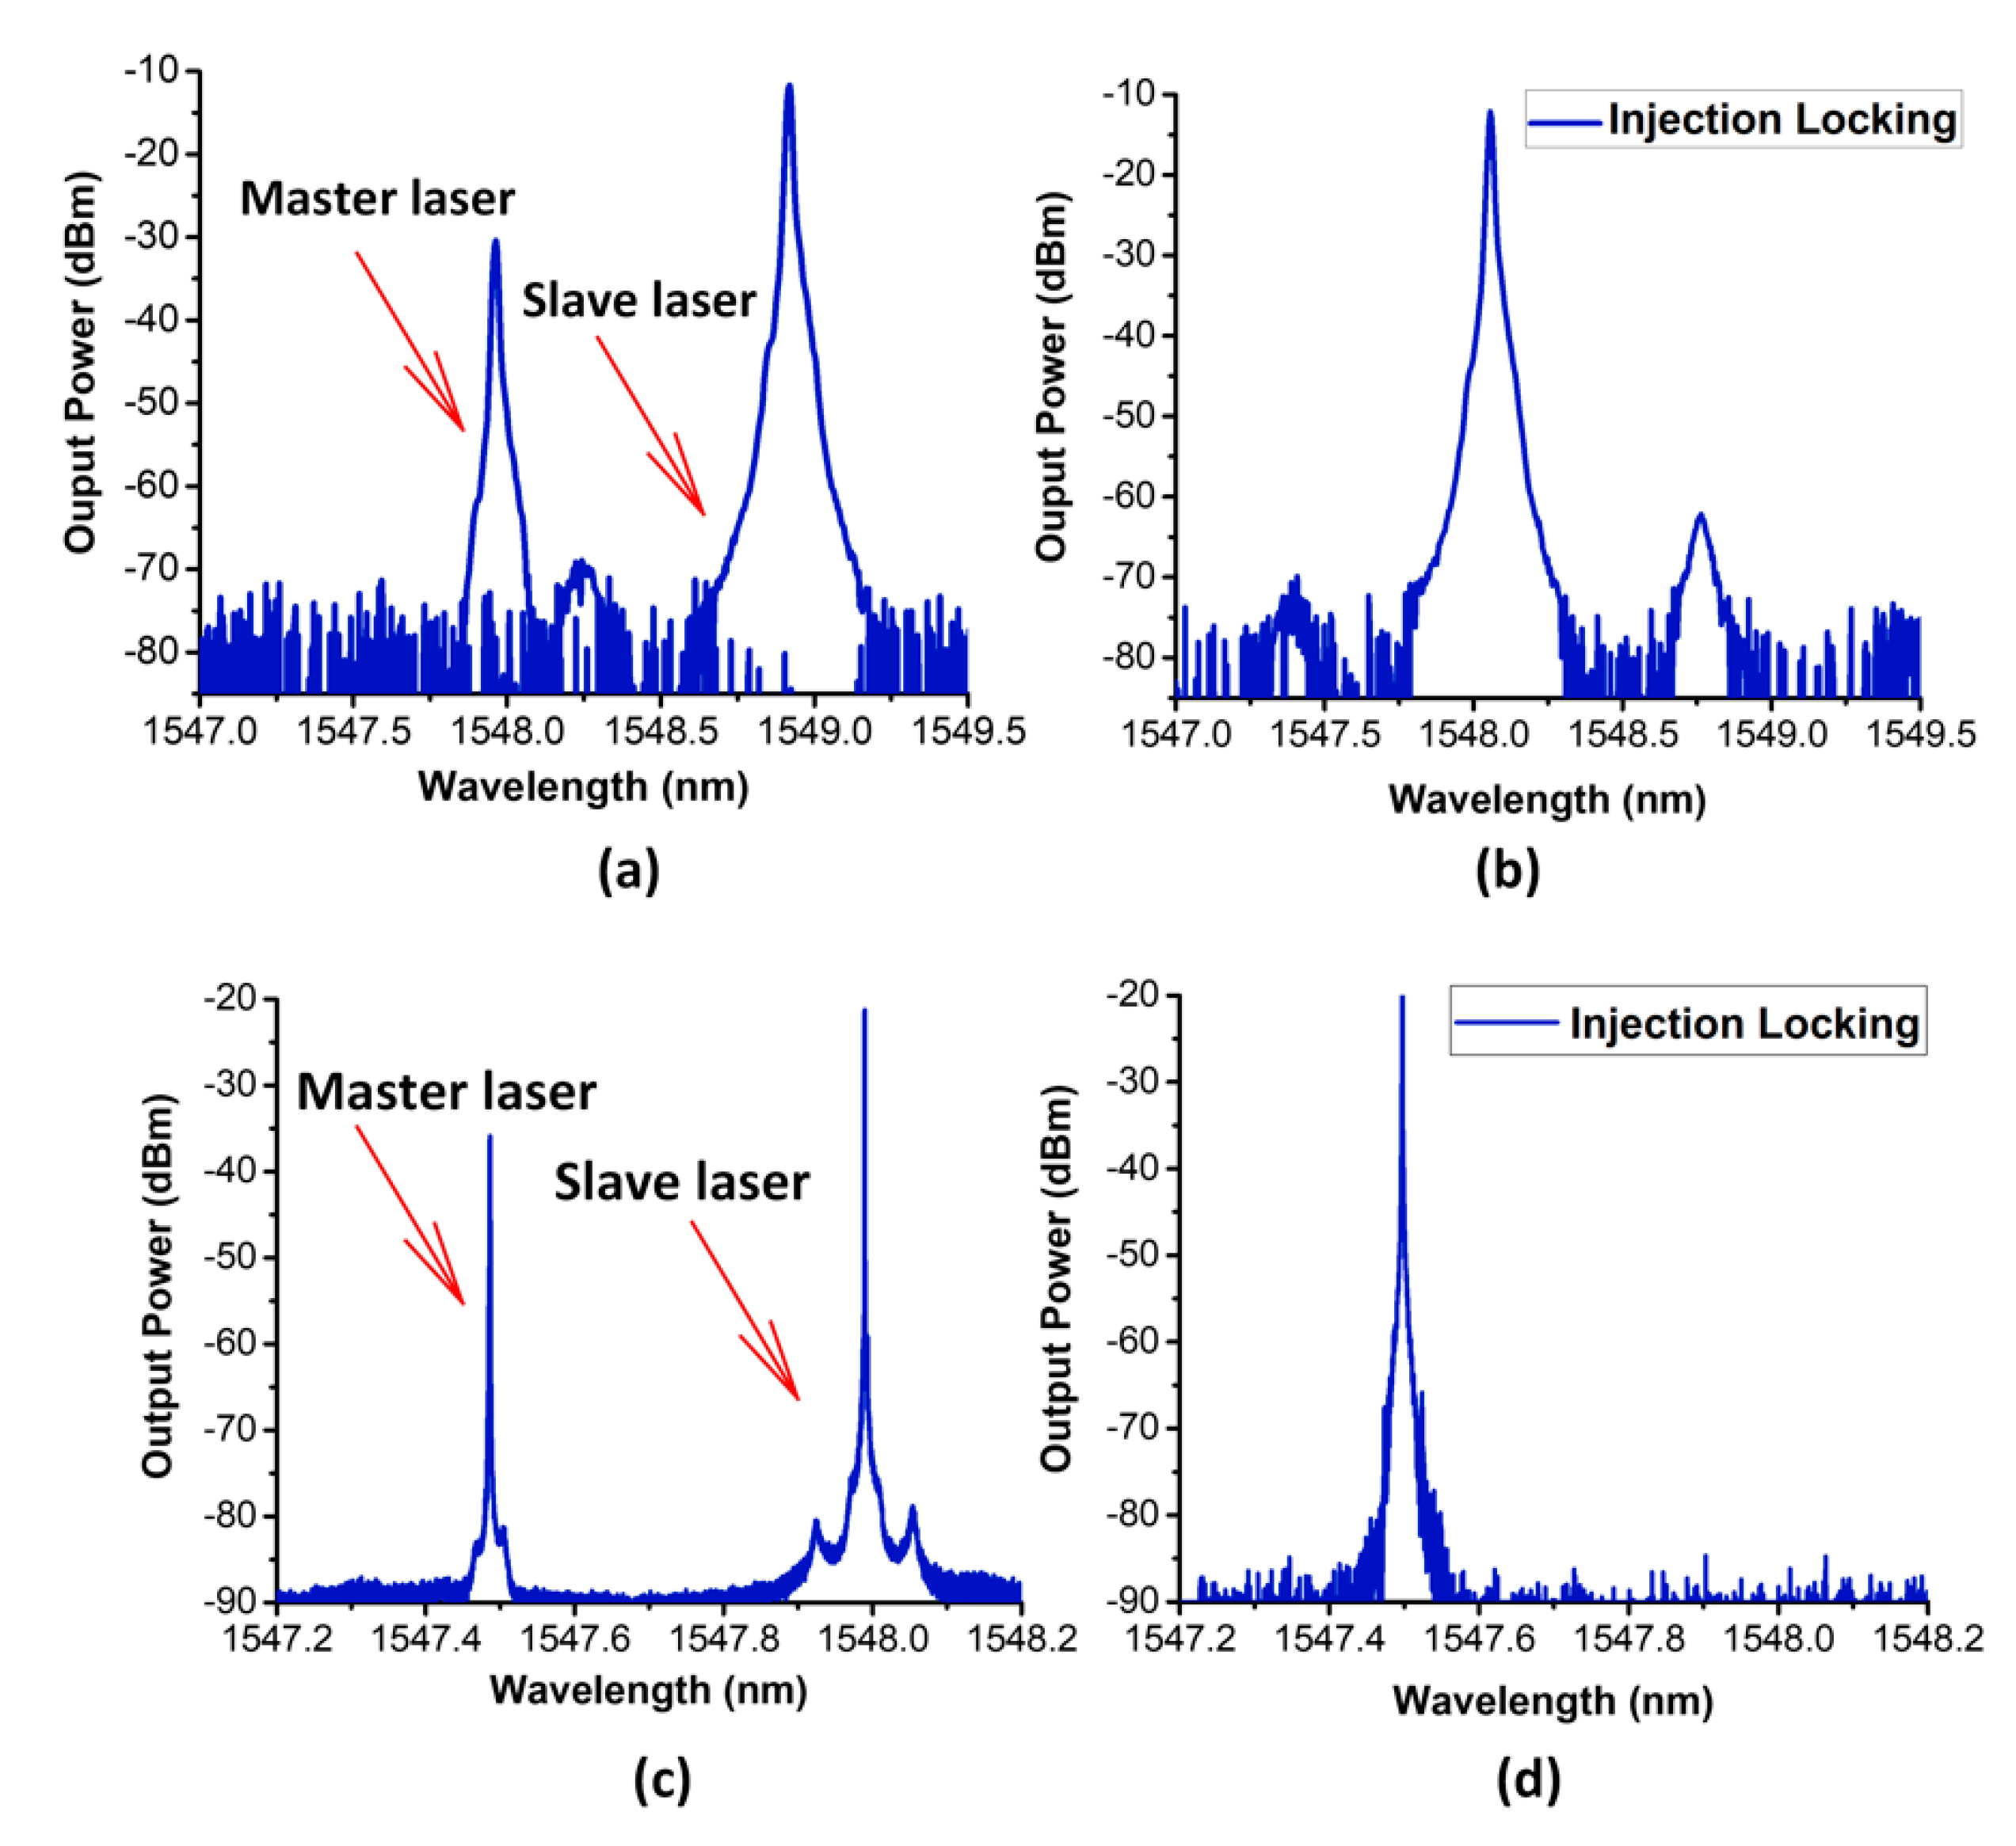
As the PIC consists of two distinct lasers, two independent spectral modes, corresponding to each laser, can be generated by the device. A continuous-wave (CW) spectrum of the master (biased at 35 mA) and slave (biased at 90 mA), operating in single-mode regime, is shown in
Figure 2a (OSA resolution: 20 pm). Biasing the device at “bias point 1” listed in
Table 1 results in achieving the injection locking spectrum shown in
Figure 2b. To further confirm the independence of the two lasers, the two independent spectral modes are shown again in
Figure 2c, where the OSA is set to a finer resolution of 0.04 pm. The master laser and slave lasers are biased at 40 and 60 mA, respectively. OIL is achieved again at “bias point 2” listed in
Table 1 and its spectrum is shown in
Figure 2d. It is important to note that OIL could be achieved at several other bias points, but we only highlight the two listed points for brevity.
The independence of the two spectral modes and the fact that each of the distinct modes originates from a different laser can be confirmed by calculating the wavelength/frequency difference between the cavity modes.
Figure 3a,b show the optical spectra of the two distinct lasers measured using a 20 pm high-resolution OSA (Yokagawa AQ6370).
Figure 3a shows the CW optical spectrum of the slave laser (SG = 80 mA, SR = 40 mA) taken when the master laser is turned off (MG,MR = 0 mA). Within the given OSA resolution, the obtained free spectral range (FSR) between the modes extents between 85 and 100 GHz. A 85 GHz frequency difference corresponds to a cavity length of 550 μm, which is approximately equal to the length of the slave laser cavity (SG + SR sections) (570 μm). This is calculated using the following formula:
where
is the FSR, with n a refractive index of 3.2 and a cavity length of L.
Figure 3b shows the CW optical spectrum of the master laser (MG = 80 mA, MR = 8 mA), when the slave laser is biased at transparency (SG = 20 mA, SR = 5 mA). Here, the mode spacing is around 50 GHz, thus corresponding to a cavity length of 937 μm—approximately equal to the master laser cavity length (MG + MR sections) (927 μm). These results confirm the possibility of achieving independent single mode emission from each distinct laser. The master laser emission wavelength can then be controlled, by varying its bias and tuned to achieve OIL. The obtained results are summarized in
Table 2 below for clarity.
The PIC can be operated in an OIL regime by fine-tuning the DC bias applied to the different sections. However, it is important to note that under certain bias points, the PIC portrays operation in a coupled cavity regime. This is mainly because the two lasers share the same optical waveguide, which leads to multi-cavity effects. Furthermore, the presence of finite electrical isolation between the different sections suggests the presence of some current leakage between the device sections. This current leakage, even if small, would mean that variation of the bias applied to one section would affect the other section.
For ease of use and experimentation, the PIC is encased in a 7-pin, temperature-controlled, fibre pigtailed high-speed butterfly package, as shown in
Figure 3c. A radio frequency (RF) connector, attached to the SG section, allows for high-speed modulation of the device. This package contains a thermoelectric cooler (TEC) to accurately control the device temperature to ensure stable operation of the device and a 10 kΩ thermistor for temperature reading to confirm the temperature stability. The device temperature is maintained at 20 °C throughout all the experimental measurements performed in this paper to ensure that uniformity and consistency are maintained.
3. Static Characterization
Static characterization can divulge information on stable regions of operation and provide quantitative details on important parameters that determine the capability of the device to be used in next generation short-reach optical networks. These parameters are the emission wavelength, RIN, SMSR, output optical power, and optical linewidth. First, the dependency of the output spectra of the PIC on the bias values of the different sections is investigated, using contour plots.
3.1. DC Characterization of the PIC
Here, we start by applying different combinations of DC bias to the four different sections of the PIC using a multi-channel current controller (LDC-3900). The light emitted by the SG section is recorded using an OSA with a spectral resolution of 20 pm.
Several important parameters can be extracted from the optical spectrum, such as the main mode peak power and emission wavelength, as well as the SMSR. Both the current controller and the OSA are driven by an automated Python script, which varies the bias of a specific section at each sweep. Contour plots are generated for both the slave and master lasers.
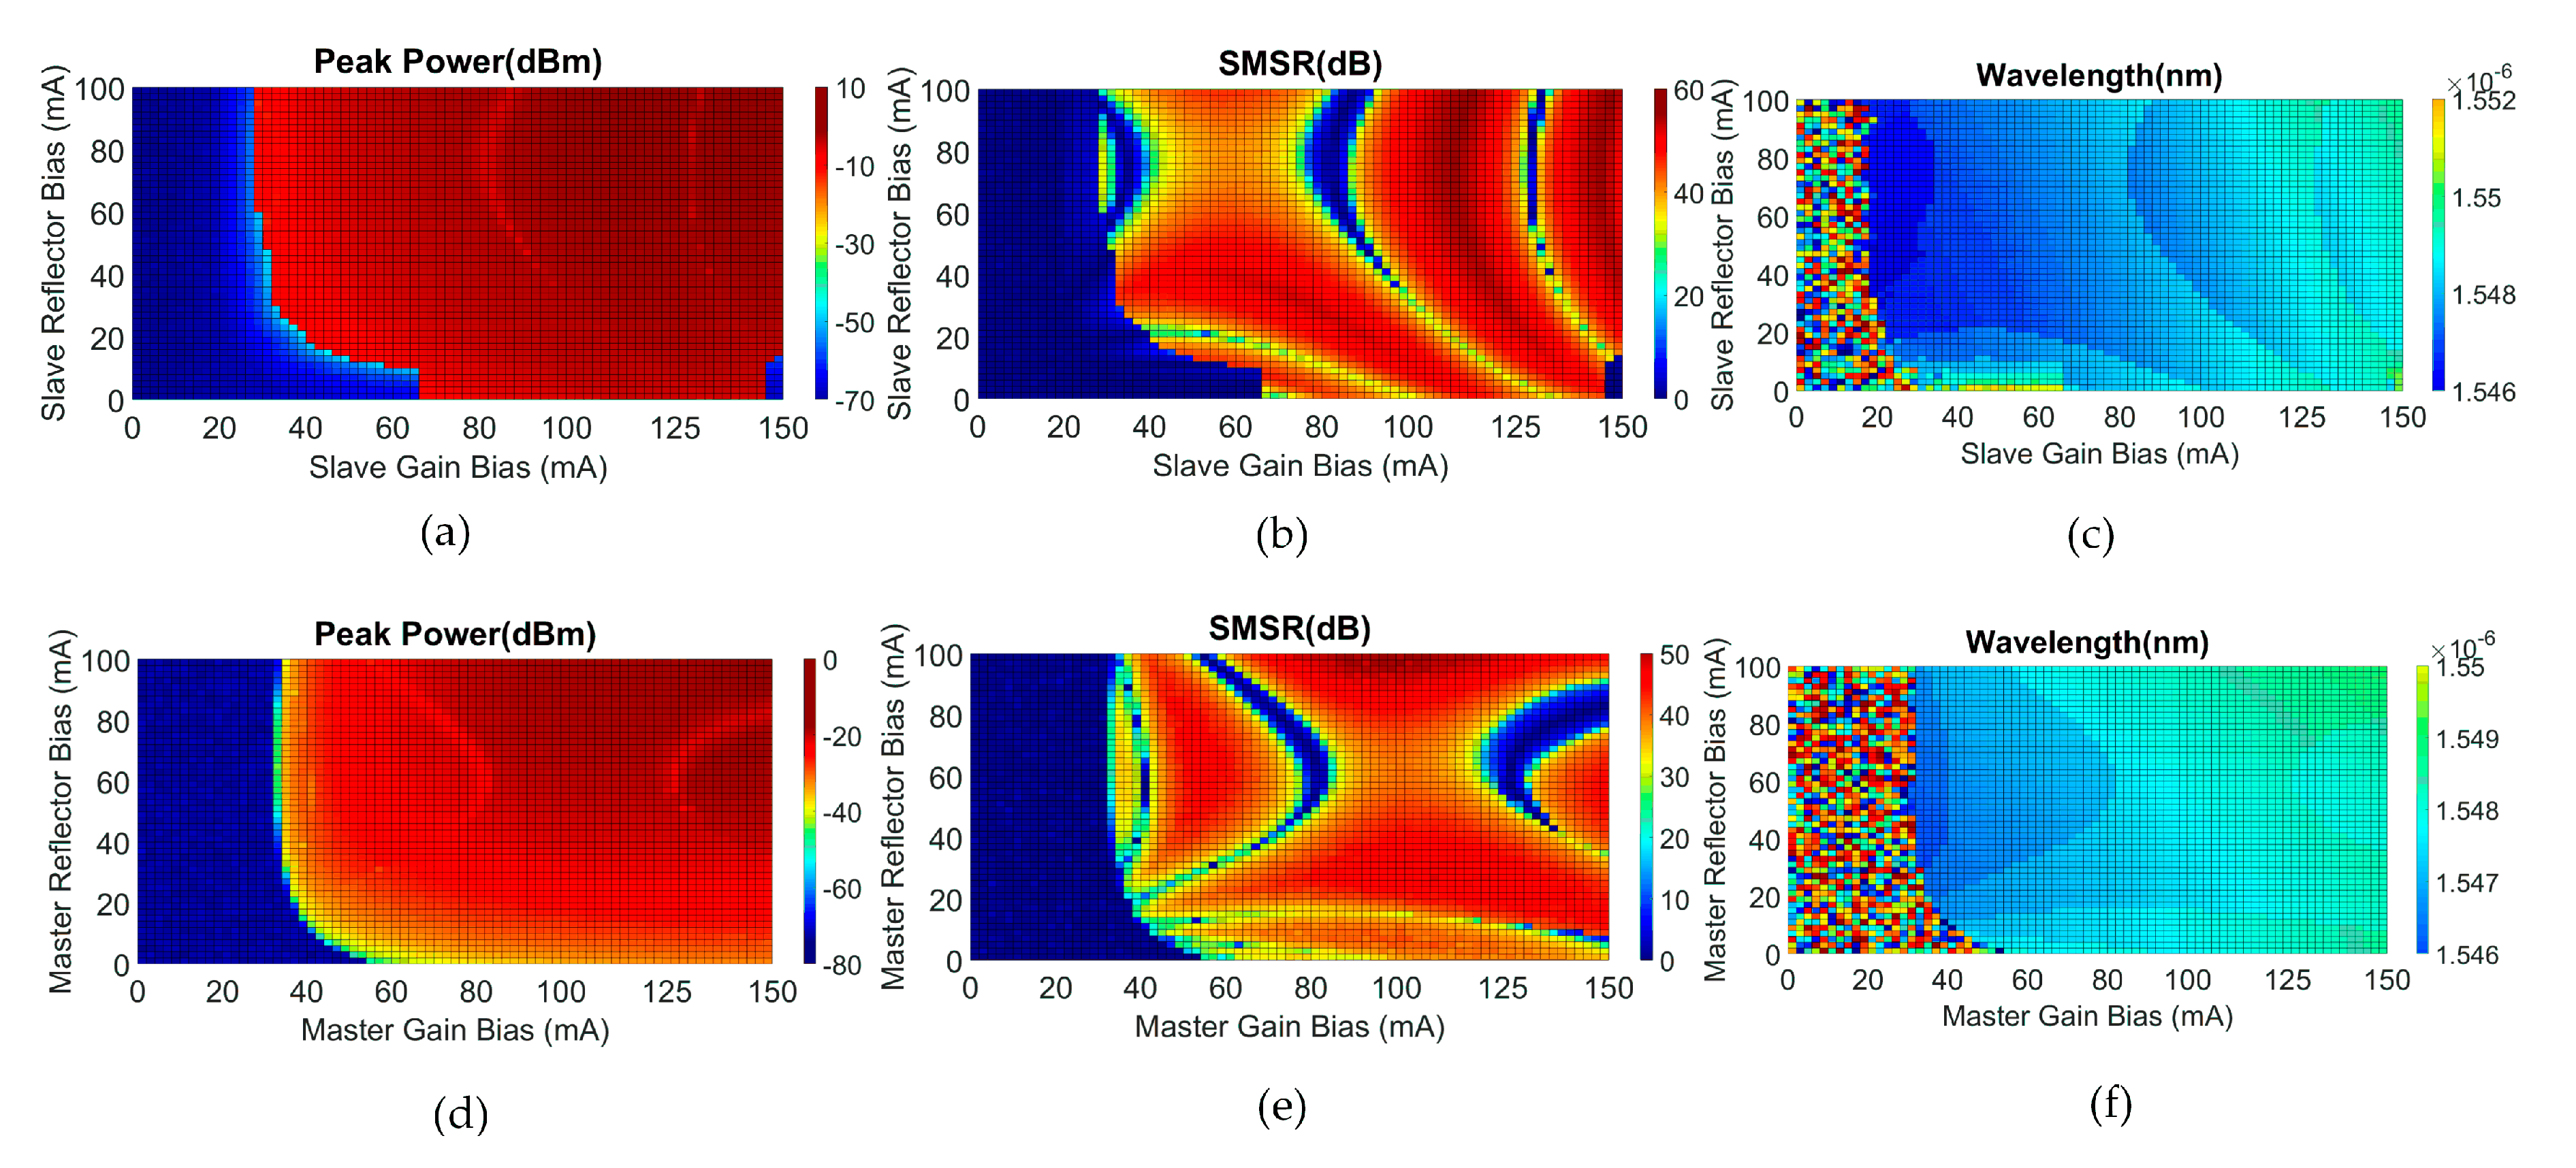
Figure 4a–c show the main mode peak power, SMSR, and main mode emission wavelength of the slave laser, as a function of the SG and SR bias currents, respectively. For this test, the master laser is turned off (MG and MR biased at 0 mA).
Figure 4d–f show the same parameters for the master laser, as a function of MG and MR bias currents. Here, the slave laser is biased just above transparency (SG = 10 mA, SR = 5 mA) to minimize any interaction between master and slave lasers. The SG and MG sections biases are varied from 0 to 150 mA, while the SR and MR section biases are varied from 0 to 100 mA as per the safe operating conditions of the PIC. From
Figure 4a, it can be observed that the SG has an average threshold of around 32 mA, when the SR is biased over 20 mA. This threshold value decreases with the increase of the SR bias. In addition, it can be noted that lasing from the SR section can be observed when the SG is at least biased at 30 mA and the SR is biased at least 65 mA. From
Figure 4a,b, it can be seen that for single-mode operation (high SMSR > 40 dB), the peak power of the slave reaches a maximum of 9 dBm. The SMSR contour plot in
Figure 4b allows one to identify the bias currents that result in a high SMSR (dark red regions) as well as the currents at which the device shows multi-mode behaviour (blue and cyan regions). The latter has been confirmed by observing a bi-modal operation of the slave laser on the OSA. A high SMSR of around 55~60 dB can be achieved for several bias points.
Figure 4c shows the emission wavelength of the slave laser main mode. From the plot, it can be observed that by varying the currents, the wavelength of the slave laser can be tuned gradually over ~2 nm, before a mode hop occurs (marked by an abrupt change in colour). The multi-coloured region on the left of the plot corresponds to the noise in the OSA, since for those currents the laser is biased below the threshold. The gradual variation in the emission wavelength (between the mode hops) is caused by temperature changes due to the Joule effect [
19] occurring with the increase in the bias of the SG and SR sections. When the temperature increases, the central emission wavelength of the laser experiences a redshift [
20]. This dependence is more obvious for the SG section than for the SR, due to lack of a grating in the SG section.
Master laser characterization shows that the MG has an average threshold of ~45 mA (around 13 mA higher than SG threshold), when the MR is biased higher than 20 mA, as depicted in
Figure 4d. The higher threshold value can be attributed to the fact that the master laser has a longer cavity length. Again, it can be seen that the MR lases only when the MG is biased above 40 mA, as illustrated in the same figure. The master laser SMSR contour plot shown in
Figure 4e manifests a comparable behavior with that of the slave laser. By careful control of the biases applied to the two sections of the master laser, a SMSR as high as 50 dB can be achieved.
Figure 4f shows the capability of the master laser wavelength to be gradually tuned over ~1.5 nm, through variation of the bias currents. Mode hopping only takes place for a few points of bias currents where we experience low SMSR. On the whole, it can be concluded from the different contour plots that a similar behaviour of the master laser and slave laser is obtained with slight variations of power, SMSR, and emission wavelengths values. These plots provide a good understanding of the device behaviour and a means to determine the optimum bias points that will ensure a single-mode emission with high SMSR and high output power. Having carried out a detailed characterization of the operating bias currents, we then chose optimum ones to carry out measurements of the optical linewidth and RIN.
3.2. Linewidth and RIN Measurements
With the ever-growing demand for bandwidth, future short-reach networks may need to employ coherent modulation schemes that combine both amplitude and phase modulation to increase the amount of data being transferred through an optical network [
21]. In such networks employing higher-order modulation formats, optical transmitter parameters such as the linewidth and RIN play an important role in determining the overall system performance. Hence, the linewidth and RIN are characterized to determine the suitability of the proposed PIC to be used in next-generation coherent short-reach networks.
Characterization results show that applying injection from the master laser into the slave laser improves important parameters such as linewidth and RIN, as long as the device is operating at single-mode regime. Many operating OIL bias points listed in
Table 3 could be chosen as highlighted earlier. However, for the sake of clarity, only two of these optimum operating points’ (bias points 1, 2 listed in
Table 3) linewidth results are highlighted in this paper.
The delayed self-heterodyne (DSH) technique [
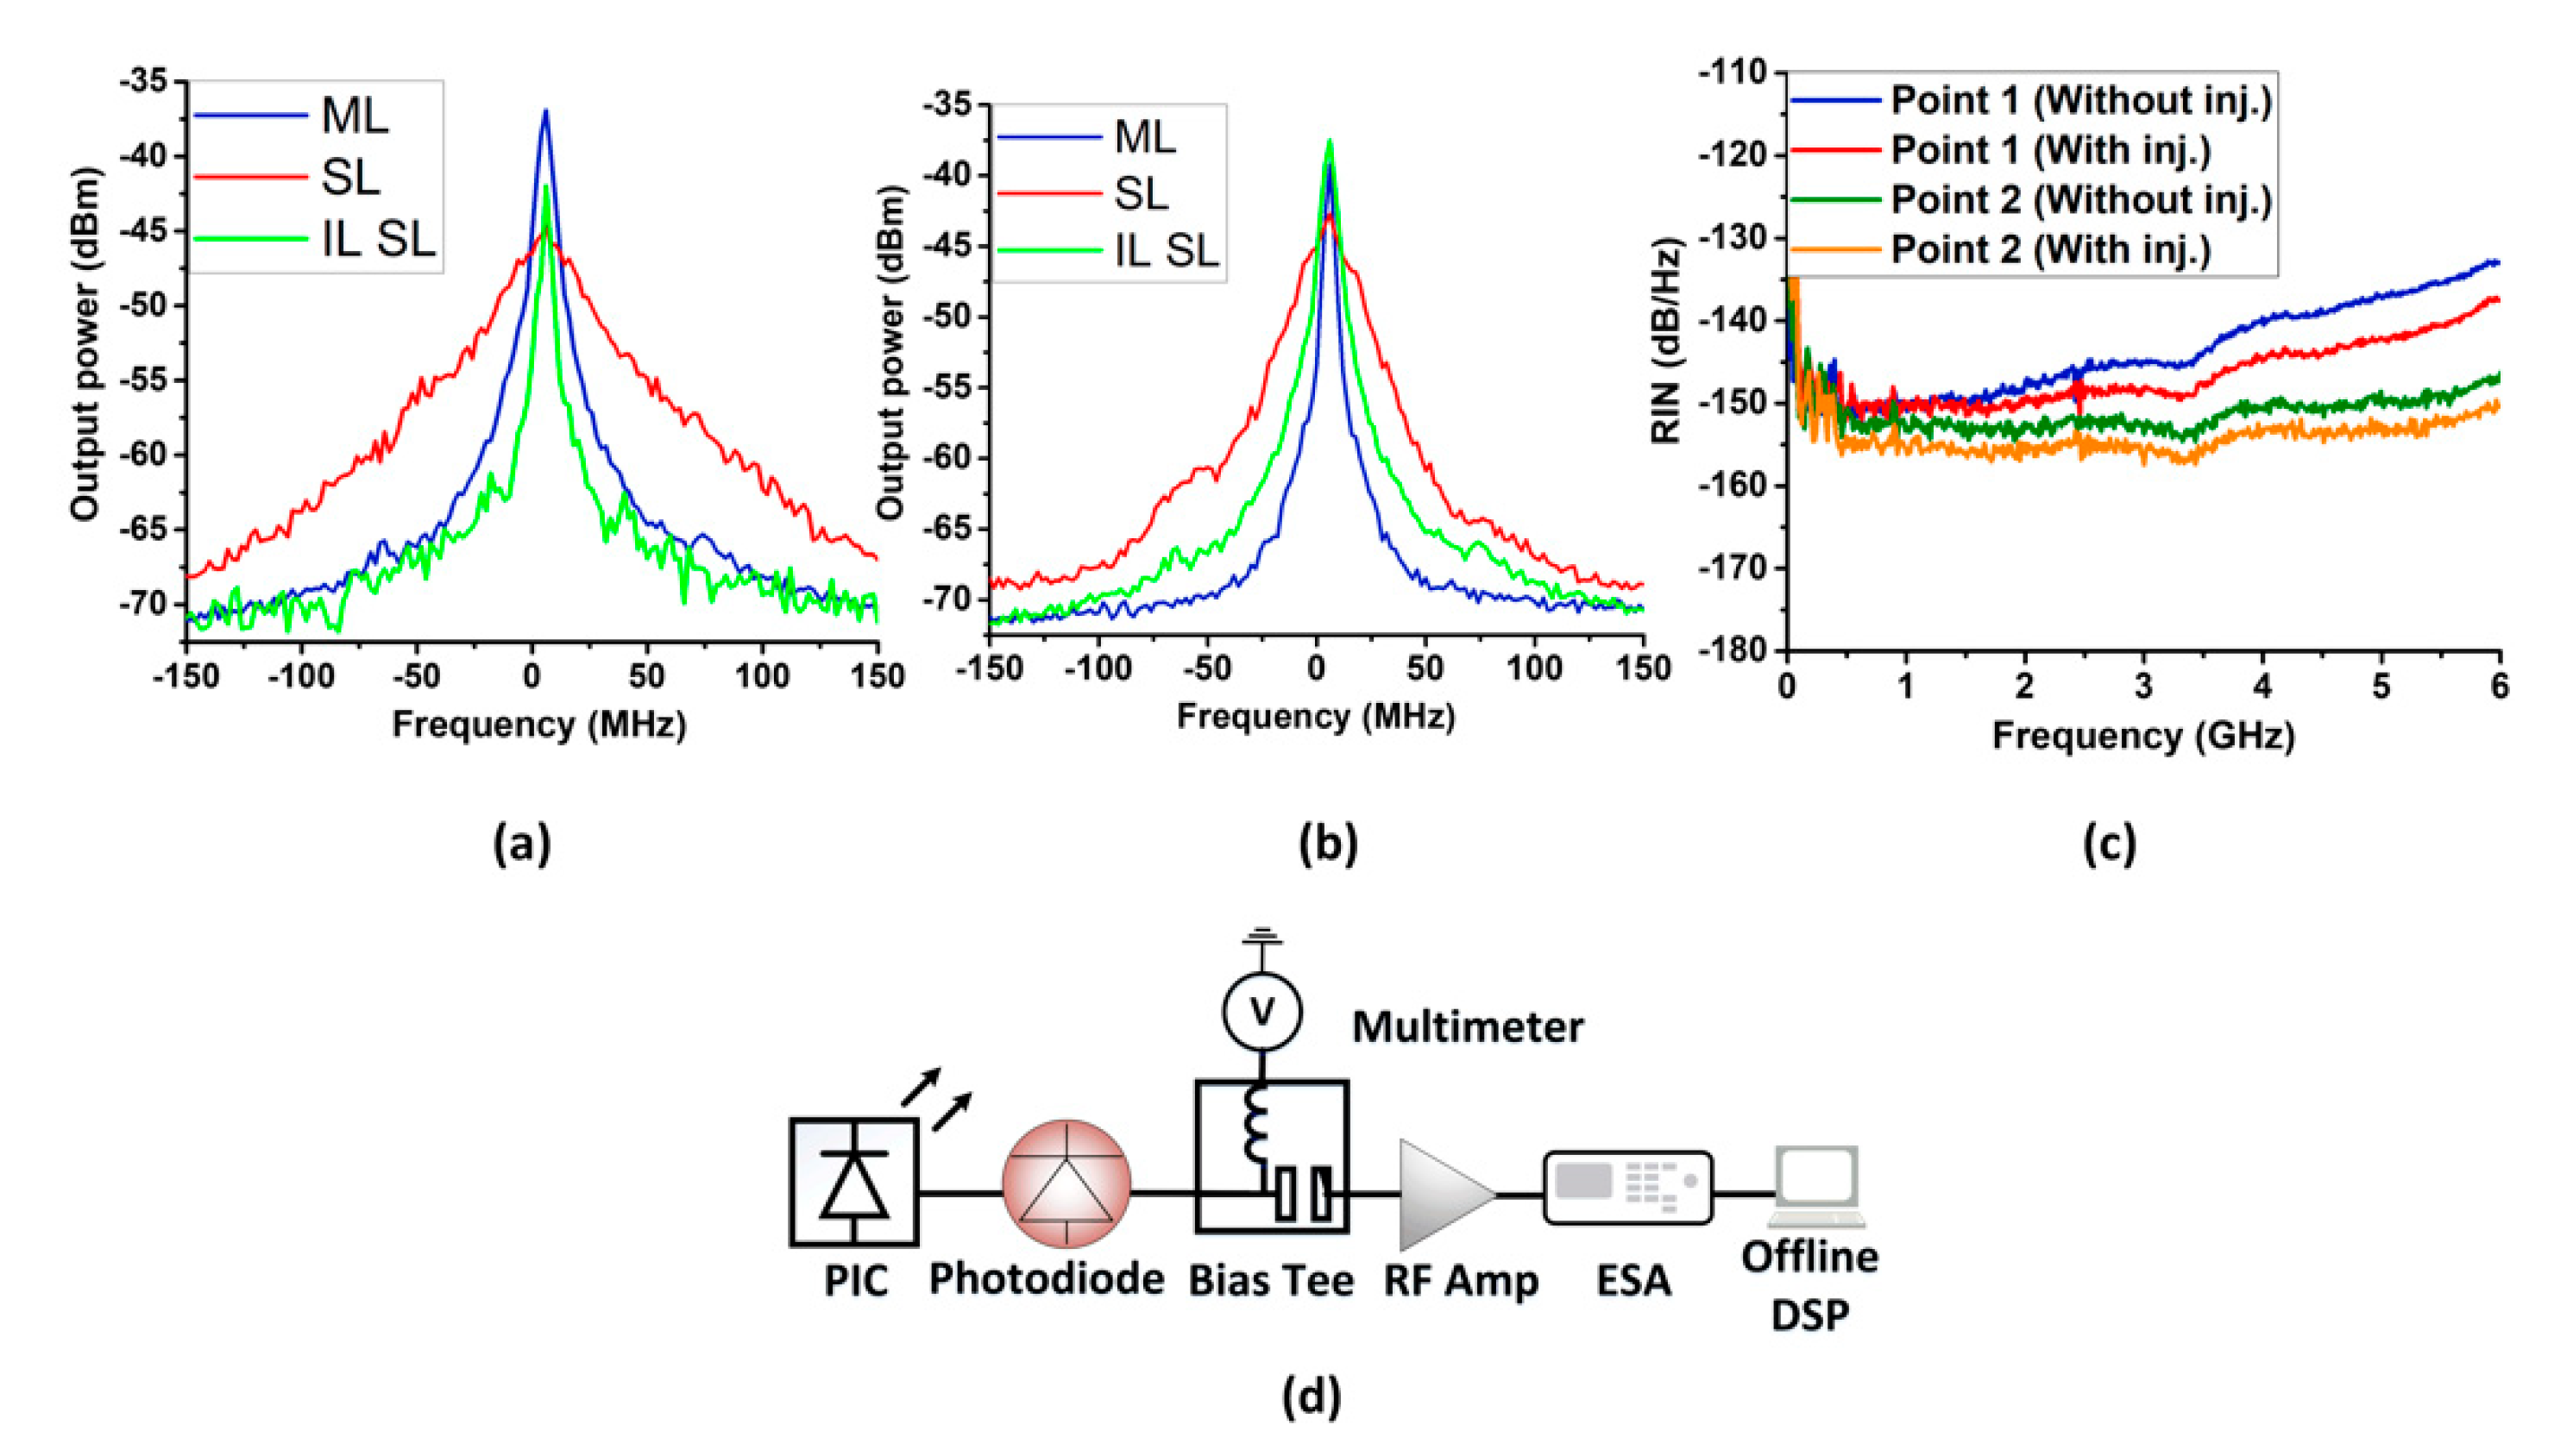
22], with a resolution of 50 kHz, is used to measure the linewidth of the device at different operating points. The linewidth measurements results are presented in
Figure 5a,b where the PIC is biased at two different optimum operating points “bias points 1, 2” as indicated in
Table 3 below for
Figure 5a,b, respectively. The blue trace shows the master laser linewidth on its own, the red trace shows the slave laser linewidth on its own, and the green trace shows the linewidth of the slave laser injection-locked by the master laser.
From
Figure 5a, it is evident that the free-running slave laser has a large linewidth of 8 MHz, which can be ascribed to its short cavity. The long cavity master laser at bias current of 112 mA has a much lower linewidth of 2 MHz. The optical linewidth of the slave laser can be significantly reduced by employing OIL from the lower linewidth master laser. OIL is achieved at bias point 1 listed in
Table 3. As OIL allows for the transfer of the phase noise characteristics from the master to the slave laser [
23], the linewidth of the latter is reduced to 2 MHz, as shown in
Figure 5a. Similar behaviour is shown in
Figure 5b, where again the lower linewidth of the master laser (2.7 MHz) was imposed into the slave laser through OIL. This results in decreasing the slave laser large linewidth from 5 MHz to 2.7 MHz (the device is biased at “bias point 2” listed in
Table 3). It is important to note that this PIC is a proof of concept device and the potential of further improvement exists. We anticipate that there will be a second generation of this device, which could be expected to give improved performance and linewidth results. However, the reduced linewidth as a result of the injection can still enable the device to be used with higher order modulation formats at high baud rates [
24].
RIN is another important parameter of an optical transmitter, quantifying the intensity fluctuations of the laser output power [
25]. High RIN values (>−120 dB/Hz) can be a limiting factor for the usage of a laser in DCNs, especially ones employing multi-level intensity modulation schemes such as PAM 4/8 [
26]. Moreover, it can also have a negative effect on other modulation schemes such as orthogonal frequency division multiplexing (OFDM) and discrete multi-tone transmission (DMT) [
27] that may be used to directly modulate the laser transmitter. The RIN characterization of the proposed four-section device has been carried out using an experimental set-up depicted in
Figure 5d [
28]. The optical emission of the DC biased device is detected by a 20 GHz high-speed photodetector (Thorlabs DXM20AF). The output of the photodiode is then connected to a bias tee (through the RF + DC terminal) to separate the DC and the AC components of the generated photocurrent. The DC port of the bias tee is connected to a multimeter, while the AC output is connected to an electrical amplifier, followed by a 6 GHz electrical spectrum analyser (ESA) (R&S FSL6). The latter is used to capture the AC component, resulting from optical power fluctuations of the laser. The RIN is computed based on both the AC component obtained from the ESA and the DC component obtained from the multimeter, using the equation below:
where
is the average electrical power (DC component), while
is the overall noise of the laser (AC component). The latter consists of three different components: the noise of the laser itself (
), the thermal (
), and shot (
) noise.
Figure 5c shows the obtained RIN values for bias points “1 and 2” listed in
Table 4 below with and without injection.
The obtained averaged value of RIN (DC to 6 GHz) of “bias point 1” in
Table 4 without injection (blue trace) (both MG and MR biases are set to zero) is −143.4 dB/Hz. Turning the master laser sections on (MG = 112 mA, MR = 74 mA) (red trace) decreases the average RIN to −146.1 dB/Hz. The reduction of RIN value for the injected case can be attributed to the reduction of cavity gain by the injected signal. This reduction also causes the carrier density to deplete, resulting in a decrease of the overall spontaneous emission rate, which in turn reduces the overall RIN of the PIC [
29]. A similar reduction in the RIN value is shown also for “bias point 2” listed in
Table 4 in the same figure. The RIN value obtained without injection (green trace) is −151.6 dB/Hz. This value decreases to −154.3 dB/Hz by turning the master laser on (MG = 45 mA, MR = 87 mA) and applying optical injection (orange trace). The obtained results demonstrate that the integrated device has a relatively low RIN value qualifying it as a potential candidate to be used in direct intensity modulated short-reach communication networks [
30].
Having concluded the static characterization of the PIC, we further investigate the dynamic performance of the PIC to determine its usefulness as a directly modulated transmitter for DCNs.
5. Conclusions
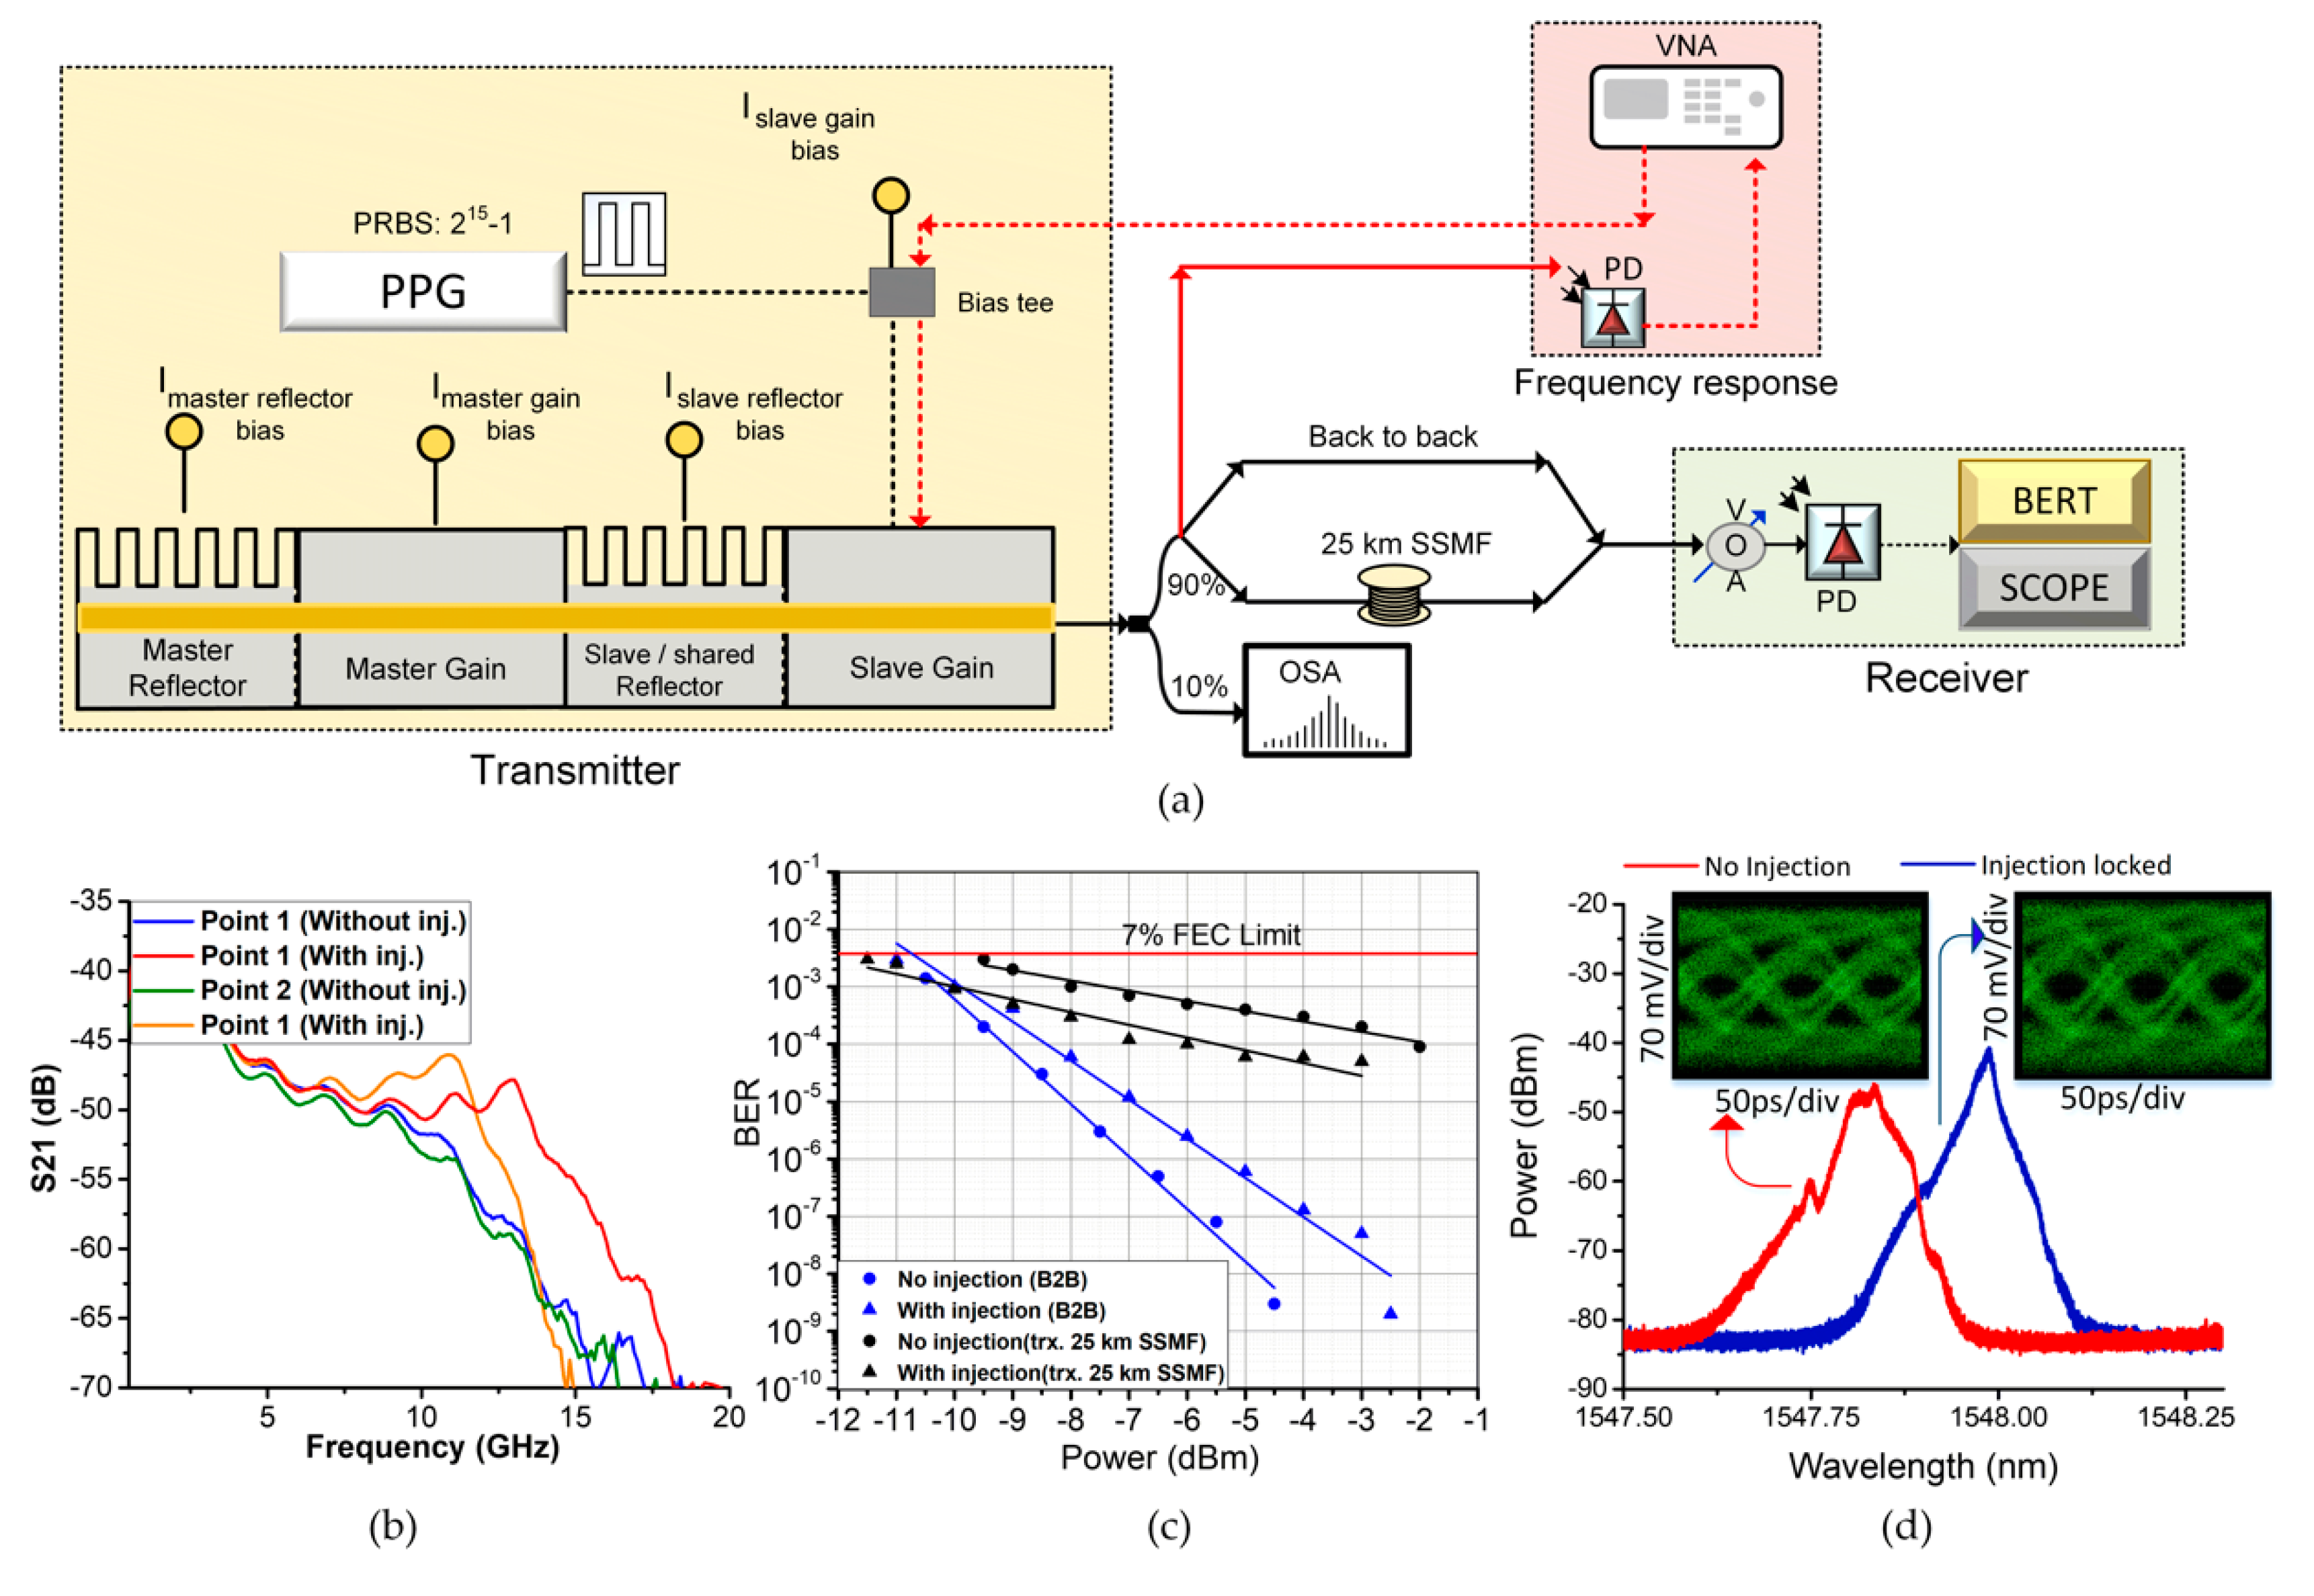
A novel PIC structure that can be employed as a low-cost optical transmitter system in the next generation short-reach networks is presented. The device consists of two lasers integrated in a master-slave configuration, where the master laser injects light into the cavity of the slave laser to improve its spectral characteristics. A set of static and dynamic characterizations are conducted on the PIC to analyze several important parameters of consideration for next-generation short-reach optical networks, including optical linewidth, RIN, and frequency response. Furthermore, the enhancements that OIL can provide to these parameters are presented. The reduction in linewidth of the PIC from 8 to 2 MHz due to OIL is demonstrated. Moreover, the RIN measurements show averaged RIN values as low as −154.3 dB/Hz, which allows the use of the device with multi-level modulation formats. Furthermore, it shows the reduction of RIN by applying OIL from the master laser. On the dynamic characterization part, the PIC shows a 4.5 GHz (45%) improvement in the modulation bandwidth under injection. Transmission performance of the injected case shows a 2 dB improvement in the minimum optical power required to achieve a bit error rate of (hard decision forward error correction limit) as a result of reduction in chirp by OIL.
These improved spectral characteristics, achieved due to the OIL, are accompanied by the attractive features of photonic integration, qualifying the multi-section PIC to be used in next-generation optical short-reach networks. In the future, we will aim to improve the PIC design to further reduce the linewidth of the master laser as well as to increase the control of the power injected from the master into the slave laser. This will result in further enhancements of the device spectral characteristics and performance.

 ,
, 

