Article

Numerical Study of Light Transport in Apple Models Based on Monte Carlo Simulations

by
Mohamed Lamine Askoura
1,2,*,
Fabrice Vaudelle
1 and
Jean-Pierre L’Huillier
1
1
Laboratoire Arts et Métiers ParisTech Angers (LAMPA), PRES LUNAM, École Nationale Supérieure des Arts et Métiers (ENSAM), 2 Boulevard du Ronceray, BP 93525, 49035 Angers Cedex 01, France
2
LUNAM Université, SFR 4207 QUASAV, Groupe École Supérieure D’agriculture (ESA), UPSP Groupe de Recherche Agro-Alimentaire sur le Produit et Procédés (GRAPPE), 55 Rue Rabelais, BP 30748, 49007 Angers Cedex 01, France
*
Author to whom correspondence should be addressed.
Photonics 2016, 3(1), 2; https://doi.org/10.3390/photonics3010002
Submission received: 10 October 2015 / Revised: 2 December 2015 / Accepted: 19 December 2015 / Published: 26 December 2015

Abstract

:
This paper reports on the quantification of light transport in apple models using Monte Carlo simulations. To this end, apple was modeled as a two-layer spherical model including skin and flesh bulk tissues. The optical properties of both tissue types used to generate Monte Carlo data were collected from the literature, and selected to cover a range of values related to three apple varieties. Two different imaging-tissue setups were simulated in order to show the role of the skin on steady-state backscattering images, spatially-resolved reflectance profiles, and assessment of flesh optical properties using an inverse nonlinear least squares fitting algorithm. Simulation results suggest that apple skin cannot be ignored when a Visible/Near-Infrared (Vis/NIR) steady-state imaging setup is used for investigating quality attributes of apples. They also help to improve optical inspection techniques in the horticultural products.

Graphical Abstract

1. Introduction

Propagation of light in turbid tissues such as biological tissues, fruits and vegetables is a complex mechanism which involves scattering and absorption. Incident photons that penetrate in turbid tissues often undergo multiple scattering events before being absorbed or exiting from the material. Light absorption is primarily due to chemical constituents (chromophores and pigments) of the material [1,2,3], whereas light scattering is more related to structural features (density, particle size, and cellular structures) [4,5,6]. These two fundamental optical events are characterized by the absorption coefficient µa, the scattering coefficient µs , the scattering anisotropy g, the reduced scattering coefficient µs (µs = µs(1 − g)), and the refractive index (n) [7,8]. Knowledge of these macroscopic optical coefficients is required to gain insight into light tissue interaction process, or to improve the optimization of the non-invasive (non-destructive) diagnostics technologies. Various optical methods have been developed to quantify light absorption and scattering in biological samples. They have been previously reported for non-invasive assessment of the optical properties of biological tissues and may be classified as spatially-resolved, time-resolved, and frequency-resolved methods [9,10]. All these methods allow us to extract the optical properties of turbid tissues, provided that an appropriate radiation transfer equation coupled with an inverse algorithm is used to fit the reflectance data [11,12,13]. Optical techniques devoted to the measurements of quality attributes of fruits, and food products mainly concern the hyperspectral imaging-based spatially-resolved method [14,15,16,17], and time-resolved method [1,2,18,19]. Studies carried out by means of these two systems were based on the major assumption that the interrogated samples are plane and homogeneous. These assumptions may not be well appropriate because most fruits are at least composed of two layers of tissues, i.e., skin and flesh, and also present a local curvature (or size) that cannot be assimilated to a plan boundary. Therefore, it seems more realistic to develop a two-layer or multi-layer model with curved boundary to study light propagation in whole fruit, and quantify the effect of the surrounding layer (skin) on the assessment of the flesh optical properties [20]. Several studies have provided analytical solutions to diffusion problem for layered media [21,22,23]. These models can be applied only in relatively simple configurations such as slabs with different homogeneous layers for which the light scattering prevails over the absorption (µs >> µa). Because the diffusion approximation is inaccurate near the boundary, application of these models requires that the thickness of the first layer be larger than its reduced transport mean free path (1/µa + µs). Other works have described numerical methods based on finite element [24,25,26] and Monte Carlo (MC) [6,27,28,29,30,31,32,33,34] models to simulate light transport in various complex multilayered biological structures. The Monte Carlo method has also been successfully used in the context of food and agricultural products for predicting optical features related to apples [20,35], kiwi fruit [36], and onion bulbs [37]. Although the MC method requires the propagation of substantial numbers of photons and large amounts of computing time to obtain statistically reliable results, it can solve the radiative transfer equation [38] without the limitations of complex sample geometries and optical properties.
This research was aimed at the development of a Monte Carlo model to simulate and quantify light propagation in apple tissue structures. The ultimate goal was to reveal the role played by the skin layer on the light transport features including backscattering images, steady-state diffuse reflectance profiles, internal sensibility profiles of photons, and penetration depth in the flesh. This paper is outlined as follows. In Section 2, we describe the Monte Carlo algorithm, apple tissue model based on a two-layer spherical geometry (skin and flesh), as well as two imaging-tissue setups related to whole and half-cut apples, with and without skin. In Section 3, we perform various simulations with a careful consideration of tissue optics and metrics. Simulation results are detailed with further information on the optimum sensing range which provides at the best the retrieved flesh optical properties in the case of an imaged whole apple. Finally, we conclude with prospects in Section 4.

2. Methodology

2.1. Monte Carlo Algorithm

Monte Carlo method allows us to simulate radiation transport in turbid media according to probabilities of mean free path l P , direction change due to scattering, absorption and Fresnel reflection [27]. These probabilities depend on the optical parameters µs, µa, g and n, which are assigned to the tissues. Here we used a Monte Carlo code described in a previous paper [20] that was adapted to both imaging setups displayed in Figure 1a,b.
Each tissue model is illuminated by a Gaussian collimated beam (ω0 = 0.5 mm at 1/e2) assumed in normal incidence. This is an acceptable approach to the problem (Figure 1a) if the angle between the source axis and detector axis is not too large (<10°). Preliminary apple experiments carried out by means of a homemade multispectral imaging system [39] have confirmed that the backscattering reflectance profiles have few distortions (symmetry) for incidence angles less than 10°. Moreover, in practical fruit diagnostics [39,40] the numerical aperture of the camera contributes to confine an effective area over the sample surface (~25 mm). In this paper, the Monte Carlo simulations take into account all backscattered photons coming out from a limited area of diameter 20 mm, at the considered surface of the fruit. The main steps of the Monte Carlo algorithm are depicted in the flowchart (Figure 2), and are summarized below:
Figure 1. Apple models and imaging-tissue setups used for the Monte Carlo simulations. (a) Whole apple assimilated to a sphere (flesh) surrounded by a thin layer of tissue (skin), and observed over its top curved boundary; (b) Half-cut spherical apple model observed over its equatorial plane. In both cases, the Gaussian beam size of the incident light source is 2ω0 = 1 mm.
Photonics 03 00002 g001
  • The emission point of a photon in the Gaussian beam is randomly determined to generate the coordinates   x 0 ,   y 0 . Given ε1 and ε2 independently uniformly distributed in [–1,1], set   R = ( 2 ε 1 1 ) 2 + ( 2 ε 2 1 ) 2   < 1 , and   z 0 is close to the local curvature of the model. Then the coordinates   x 0 and   y 0 are computed as [41]
    x 0 = w 0 2 ( 2 ε 1 1 ) 2 l n R R
    y 0 = w 0 2 ( 2 ε 2 1 ) 2 l n R R
  • To simulate propagation, Monte Carlo method requires defining a distance for the collision (step size). The step size of the photon is computed based on the sampling of the probability distribution for mean free path   l P = 1 µ t ( µ t =   µ a + µ s ) .
    S = l n   ε 3 µ t
    S ϵ [ 0 , ] , where ε 3 is a random number uniformly distributed over [0,1].
  • Once the photon has taken a step, some of the photon weight Wk (initial value W0 = 1) decrease due to absorption by tissue sample must occur. Therefore,
    W k = [ 1 µ a µ t ] W k 1
    until weight falls below a threshold value Wth (associated to a Russian roulette technique).
  • Once the photon has been moved and its weight decremented, the photon is ready to be scattered. A random number ε 4 is generated, and the selection of the deflection angle θ , is accomplished using the probability density function P H G ( cos θ ) of scattering in tissue (Henyey-Greenstein) [42]
    P 1 = 1 2 g [ 1 + g 2 ( 1 g 2 1 g + 2 g ε 4 ) 2 ] ; g > 0
    where θ = cos 1 ( P 1 ) , and φ = 2 π ε 5 : uniformly distributed within the interval [0,2π]. Once the deflection θ and azimuthal φ angles are chosen, the new direction for the photon propagation ( K x , K y , K z ) is computed from the three direction cosines ( K x , K y , K z ) using the formulas [43,44]
    K x = sin ( θ ) 1 K z 2 ( K x K z cos ( φ ) K y sin ( φ ) ) + K x cos ( θ )
    K y = sin ( θ ) 1 K z 2 ( K y K z cos ( φ ) K x sin ( φ ) ) + K y cos ( θ )
    K z = sin ( θ ) cos ( φ ) 1 K z 2 + K z cos ( θ )
To avoid division by zero, if the angle is too close to normal (i.e.,   | K z | 1 ), the following formulas are used [40], instead of Equations (6)–(8).
K x = sin ( θ ) cos ( φ )
K y = sin ( θ ) cos ( φ )
K z = s i g n K z cos ( φ )
Figure 2. Flowchart of the fundamental steps of the Monte Carlo simulations.
Photonics 03 00002 g002
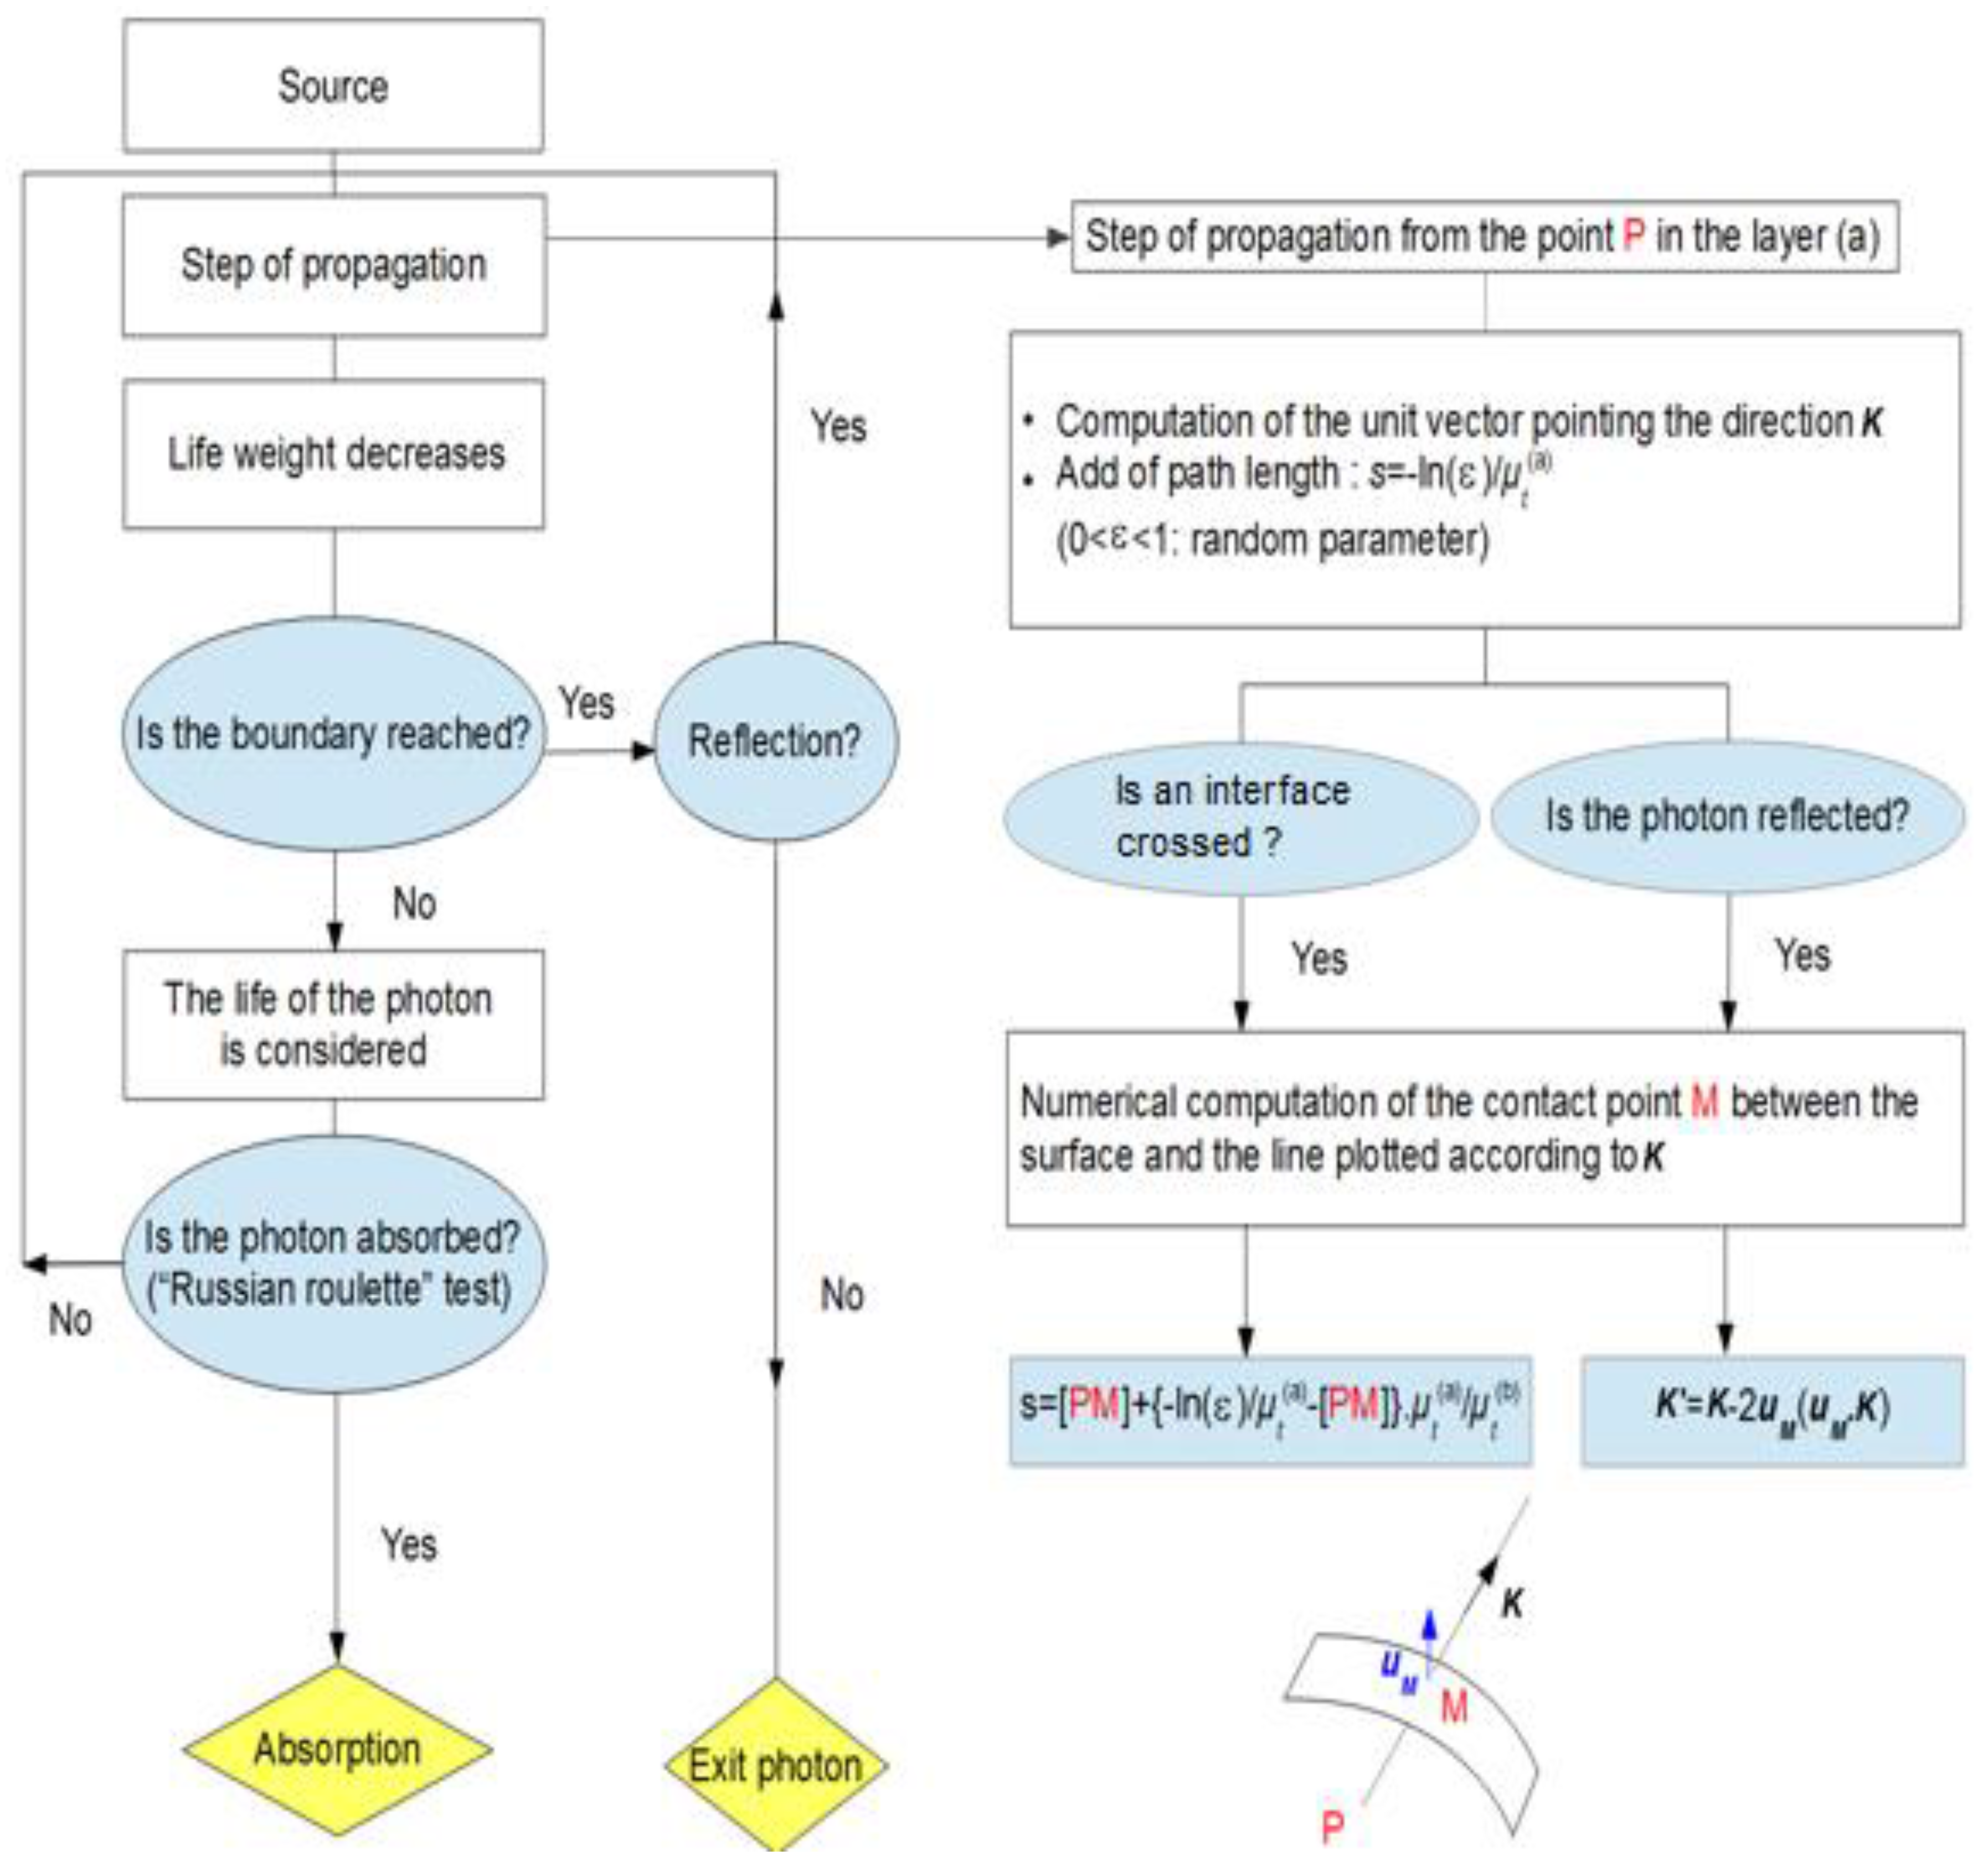
  • During a step, a photon may attempt to escape the spherical apple model (with and without skin layer) at the air–tissue interface. Then, the photon may either escape and contributes to the observed reflectance or be internally reflected by the interface (flesh or skin). Snell’s law, which gives the relationship between the angle of incidence θ i and the angle of transmittance θ t (and refractive indexes), allows us to calculate the internal reflectance R( θ i ), according to the Fresnel’s law
    n i sin ( θ i ) = n t sin ( θ t )
    R ( θ i ) = 1 2 [ s i n 2 ( θ i θ t ) s i n 2 ( θ i + θ t ) + t a n 2 ( θ i θ t ) t a n 2 ( θ i + θ t ) ]
If R ( θ i ) < ε 6 , then the photon escapes the boundary (skin–air) and account for the backscattering data.
If R ( θ i ) >   ε 6 , then the photon is internally reflected and its direction cosine is updated by reversing the change of direction.
A great task was also to determine the interaction point between the photon path and the sphere boundary. A procedure based on an optimization scheme was used to estimate the incidence point close to the considered boundary (flesh–air, flesh–skin and/or skin–air). For a photon coming from a point P (xP, yP, zP) and crossing at the point M (xM, yM, zM), the coordinate zM may be found by solving the set of two equations:
z M = ± r b 2 ( x P + γ ·   K x ) 2 ( y P + γ · K y ) 2 = h 1 ( γ )
z M = z P + γ · K z = h 2 ( γ )
where rb is the radius of the spherical boundary, and γ the length from P to M. An iterative scheme is then used to minimize the difference |h1 (γ) - h2 (γ)|, yielding the optimal value γ = γopt. Finally, the coordinates of the point M are given by (xP + γopt · Kx, yP + γopt · Ky, zP + γopt · Kz).
Another series of events arise when the photon hits an interface (skin-flesh). The new photons step size should be expressed as follows:
S n e w = P M + [ S P M ] µ t µ t n e w
where PM is equal to γopt. The Monte Carlo code was developed on the base of Matlab 8.a, and implemented on a PC (Processor Intel Core i5, 2.6 GHz).

2.2. Monte Carlo Input Data

In order to perform simulation, the Monte Carlo model requires defining the sample geometry parameters, and the optical properties of each considered tissue type (skin or flesh) as a part of the input data. The radius rs of the apple models described in Figure 1a,b was set at 35 mm, in agreement with the mean value measured in our laboratory for three apple varieties (Royal Gala, Golden Delicious and Granny Smith), but also with data reported by others [40,45].
Skin features have been well documented from histological observation [46,47]. The apple peel consists of flat cells whose sizes evolve rapidly from the surface to deep depths, through distinct layer types. The subsurface tissue is mainly composed of cuticle, epidermis, and hypodermis. Skin thickness values reported in the literature range from 50 µm to 100 µm, since hypodermis layers are ignored.
Measurements carried out with a confocal microscope have confirmed these data with a mean skin thickness value of 80 µm (Table 1). To this end, small slices of the three apples were removed with a surgical blade. Cut-samples were viewed at 100× enlargement using a Nikon A1S1 confocal laser scanning microscope interfaced to a digital camera, and the captured images were analyzed with ImageJ software. The skin thickness was estimated from the boundary where a fast growth of the cells was noted. Different values of the reduced scattering and absorption coefficients related to the flesh (µa(f), µs(f)), and the skin (µa(s), µs(s)) of three apple setup (Royal Gala, Golden Delicious and Granny Smith) are listed in Table 2. The data concerning the flesh have been reported by authors who worked with the hyperspectral imaging-based spatially-resolved method [48,49] or with the time-resolved method [1,2], in the wavelengths ranging from 633 nm to 850 nm.
The listed data especially show the variation between retrieved optical properties due to considered apple varieties or to the optical technique which has been used for the measurements. It should also be noted that the absorption and reduced scattering coefficients of the skin are both higher than those of the flesh tissue [50]. Finally, for all simulations, the anisotropy factor (g) was set at 0.8 [8,37], whereas the refractive indexes n = 1.4 and n = 1 were, respectively, used for the apple turbid models and the outside. In order to obtain reliable computational results, the number of launched photons was varied from 0.5 × 10⁶ to 2 × 10⁶ with respect to each investigated imaging tissue setup.
Table 1. Apple skin thickness measured with a confocal microscope.
ApplesSkin Thickness (µm)
Royal Gala65.6 ± 13.3
Granny Smith91.3 ± 13.8
Golden Delicious78.1 ± 09.1
Table 2. Optical properties of studied apple varieties (mm−1).
ApplesWavelengthsFlesh µa(f)Flesh µs(f)Skin µa(s)Skin µs(s)
Gala750–850 nm~0.1 ± 0.1 (1)
~0.0125 (2)
~1.2 (1)
1.15 ± 0.3 (2)
~ 0.15 ± 0.1 (1)3.75 (1)
633 nm~0.1 ± 0.1 (1)
~0.0125 (2)
~1.2 (1)
1.2 ± 0.3 (2)
~0.5 ± 0.1 (1)~4 (1)
Granny750–850 nm~0.04 ± 0.03 (1)
~0.004 (4)
~1.2 (1)
~2 (4)
~0.075 ± 0.03 (1)4.25 (1)
633 nm~0.1 ± 0,1 (1)
0.005 ± 0.0025 (5)
~1.2 (1)
1.1 ± 0.1 (5)
~0.5 ± 0.1 (1)~4 (1)
Golden750–850 nm~0.01 (3)
~0.004 (4)
0.8 ± 0.1 (3)
~2 (4)
633 nm~0.04 (3)
0.004 ± 0.0025 (5)
0.85 ± 0.15 (3)
1.4 ± 0.15 (5)
(1) Saeys et al., 2008 [50]; (2) Rowe et al., 2014 [48].; (3) Lu et al., 2010 [49]; (4) Cubeddu et al., 2001 [1]; (5) Cubeddu et al., 2001 [2].

3. Results and Discussion

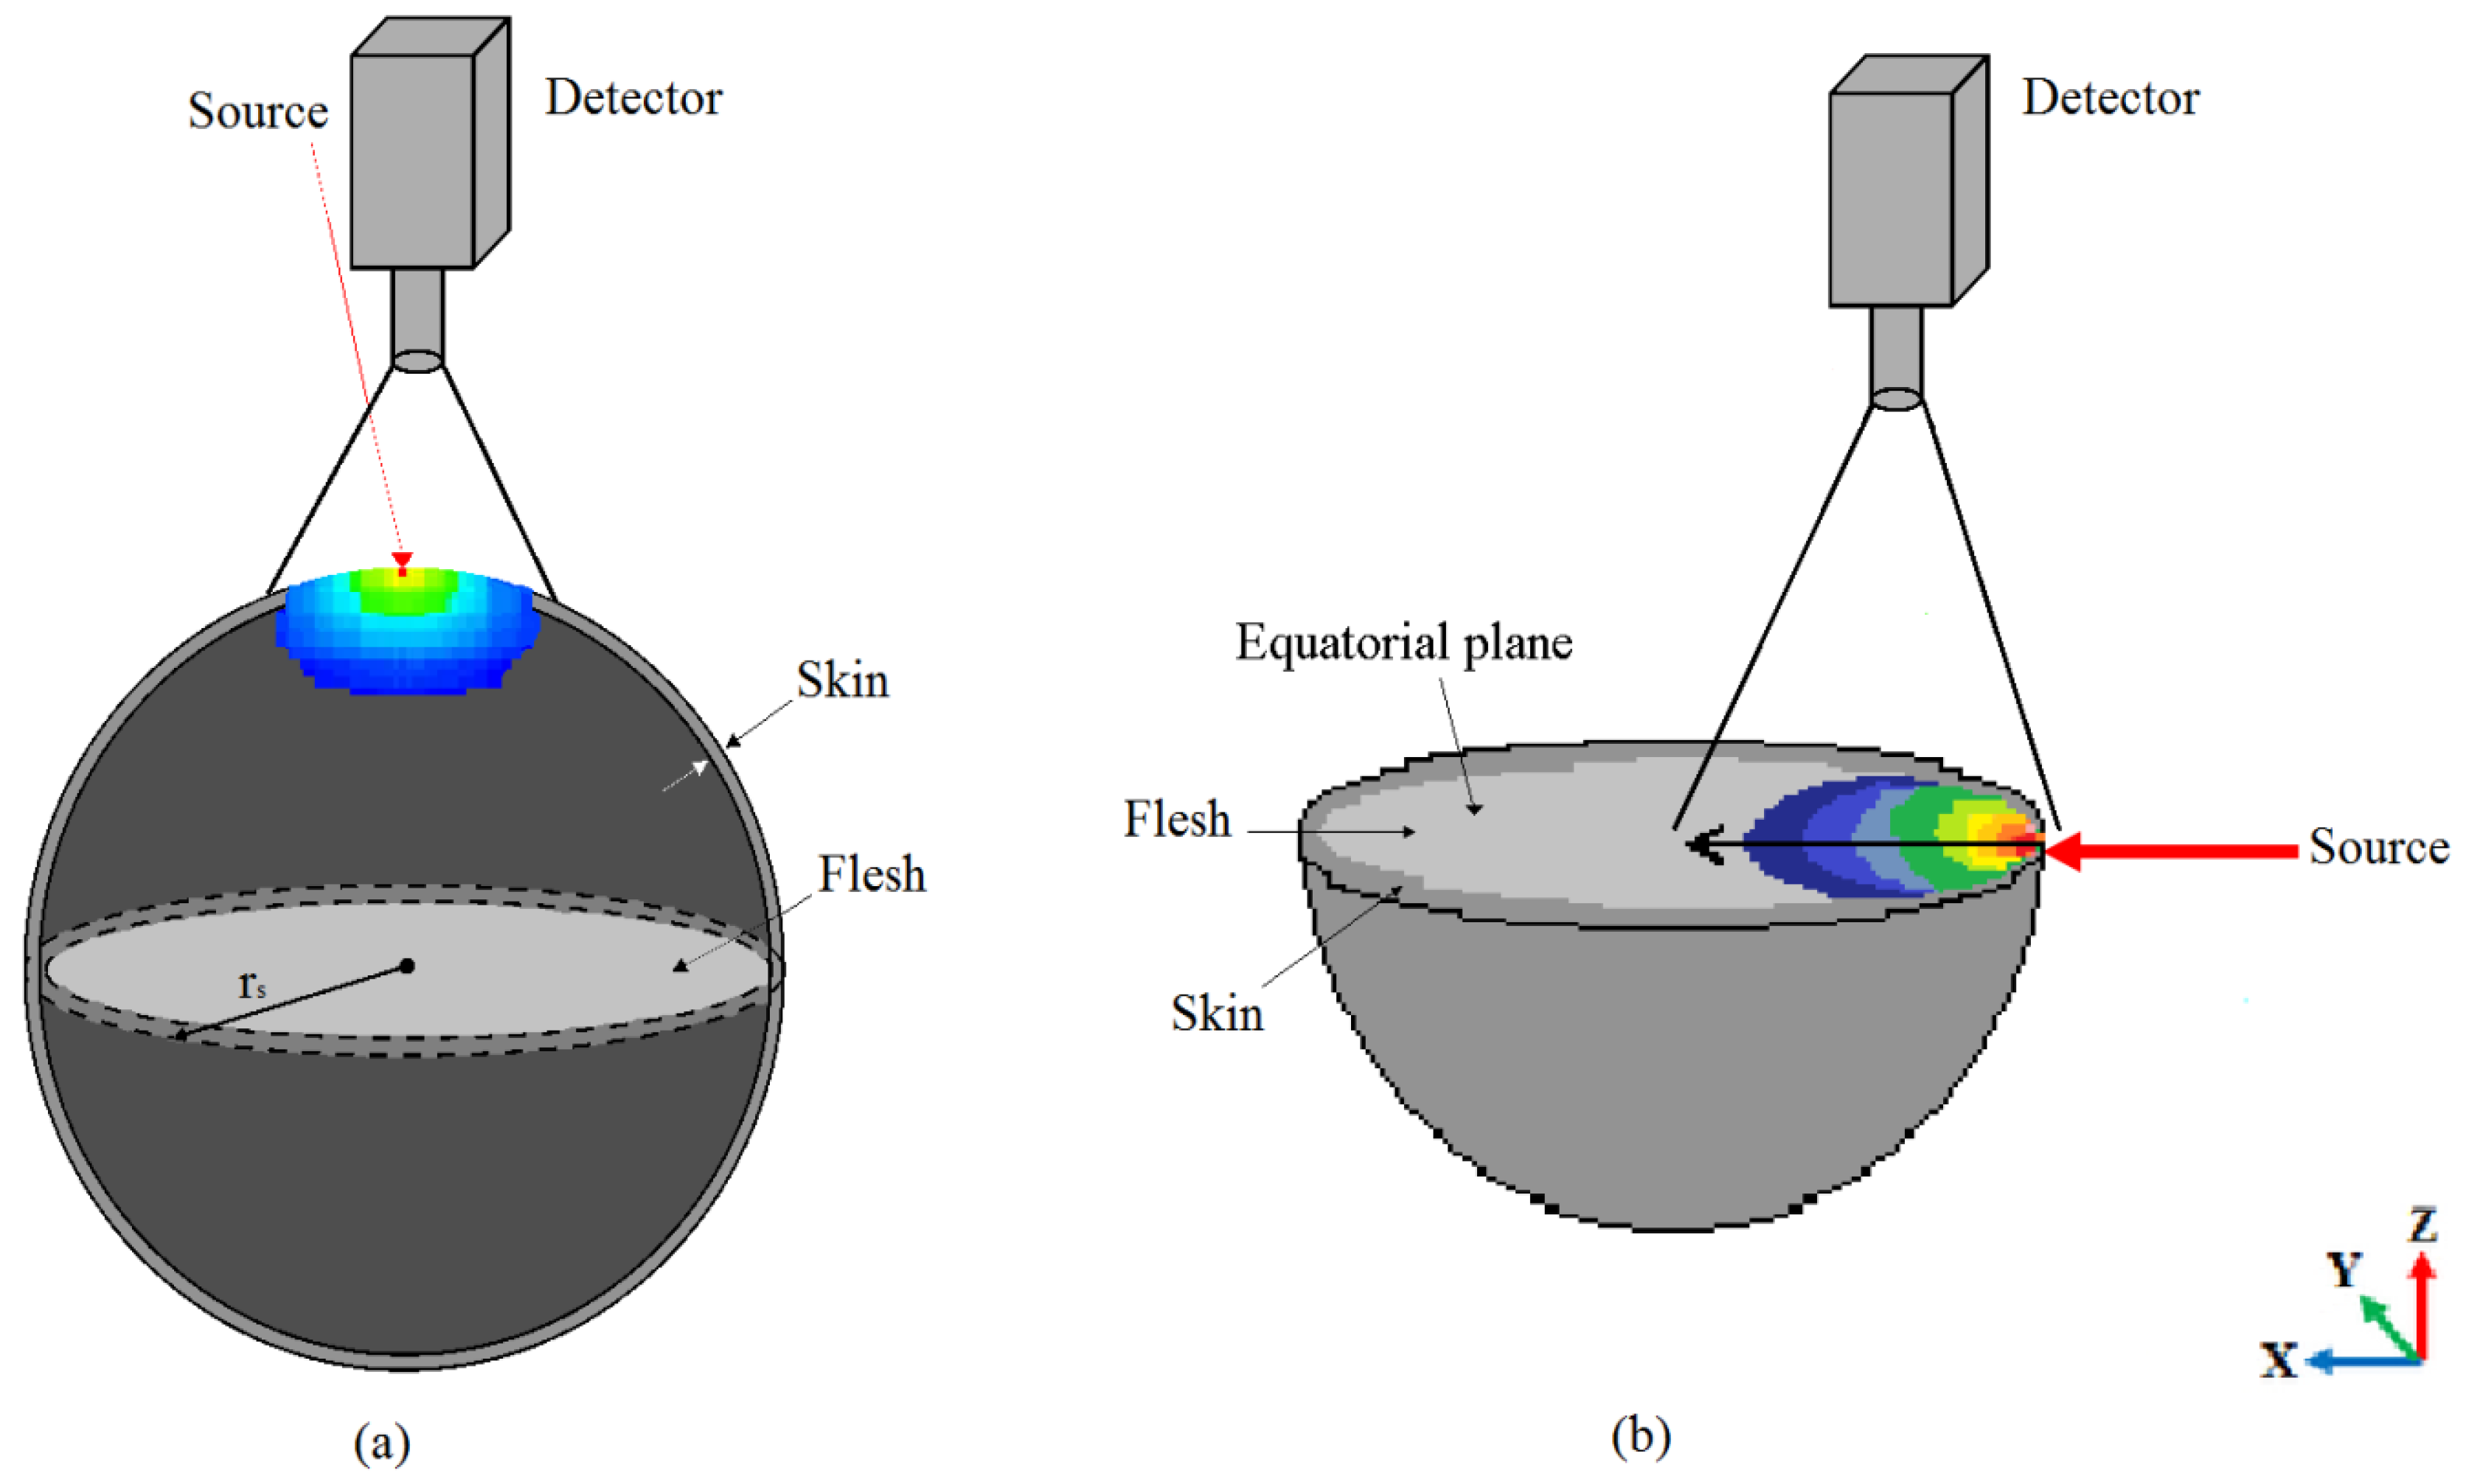
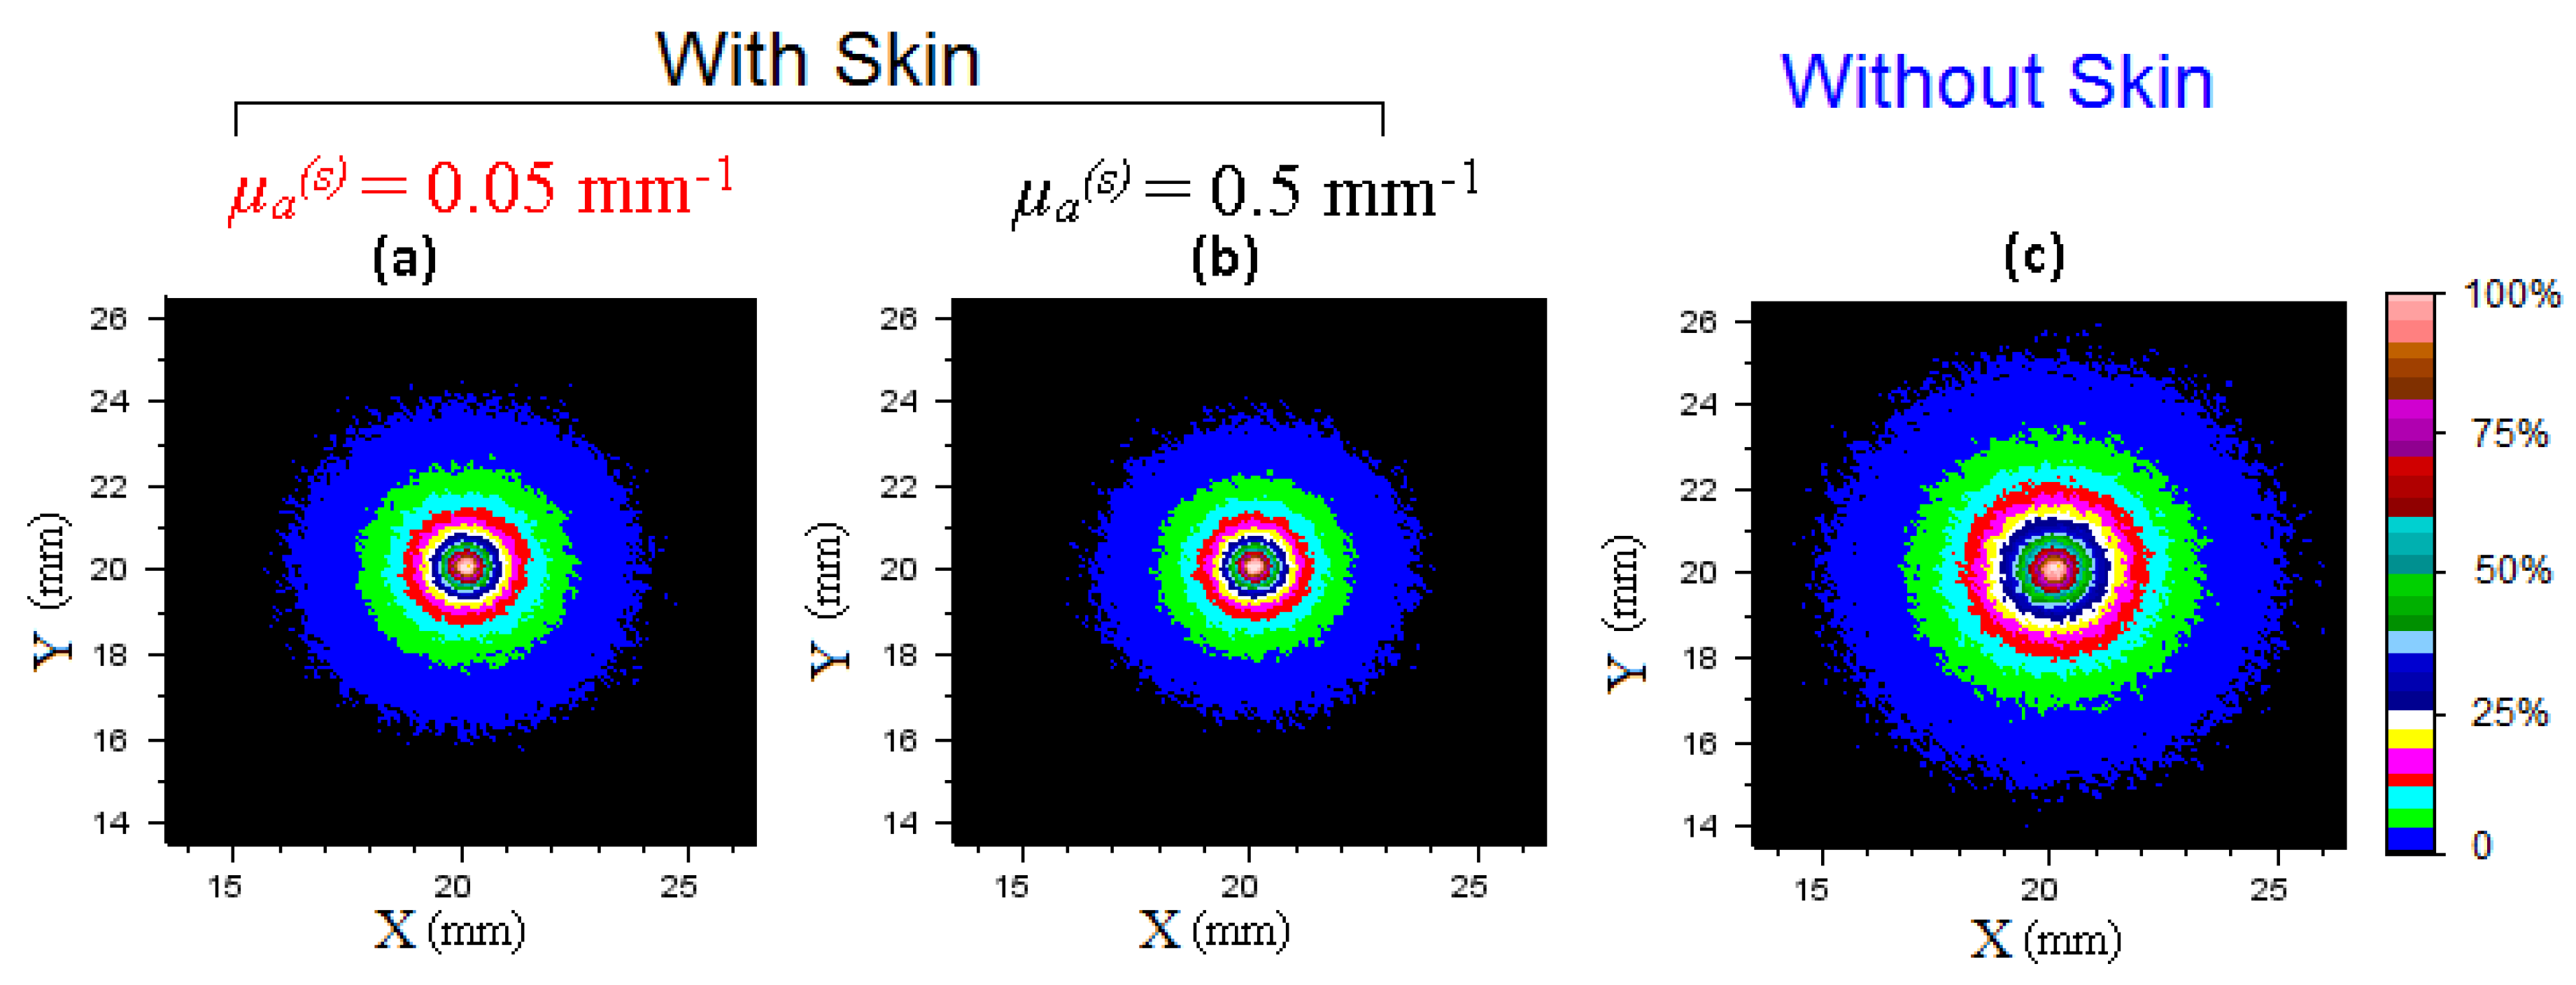
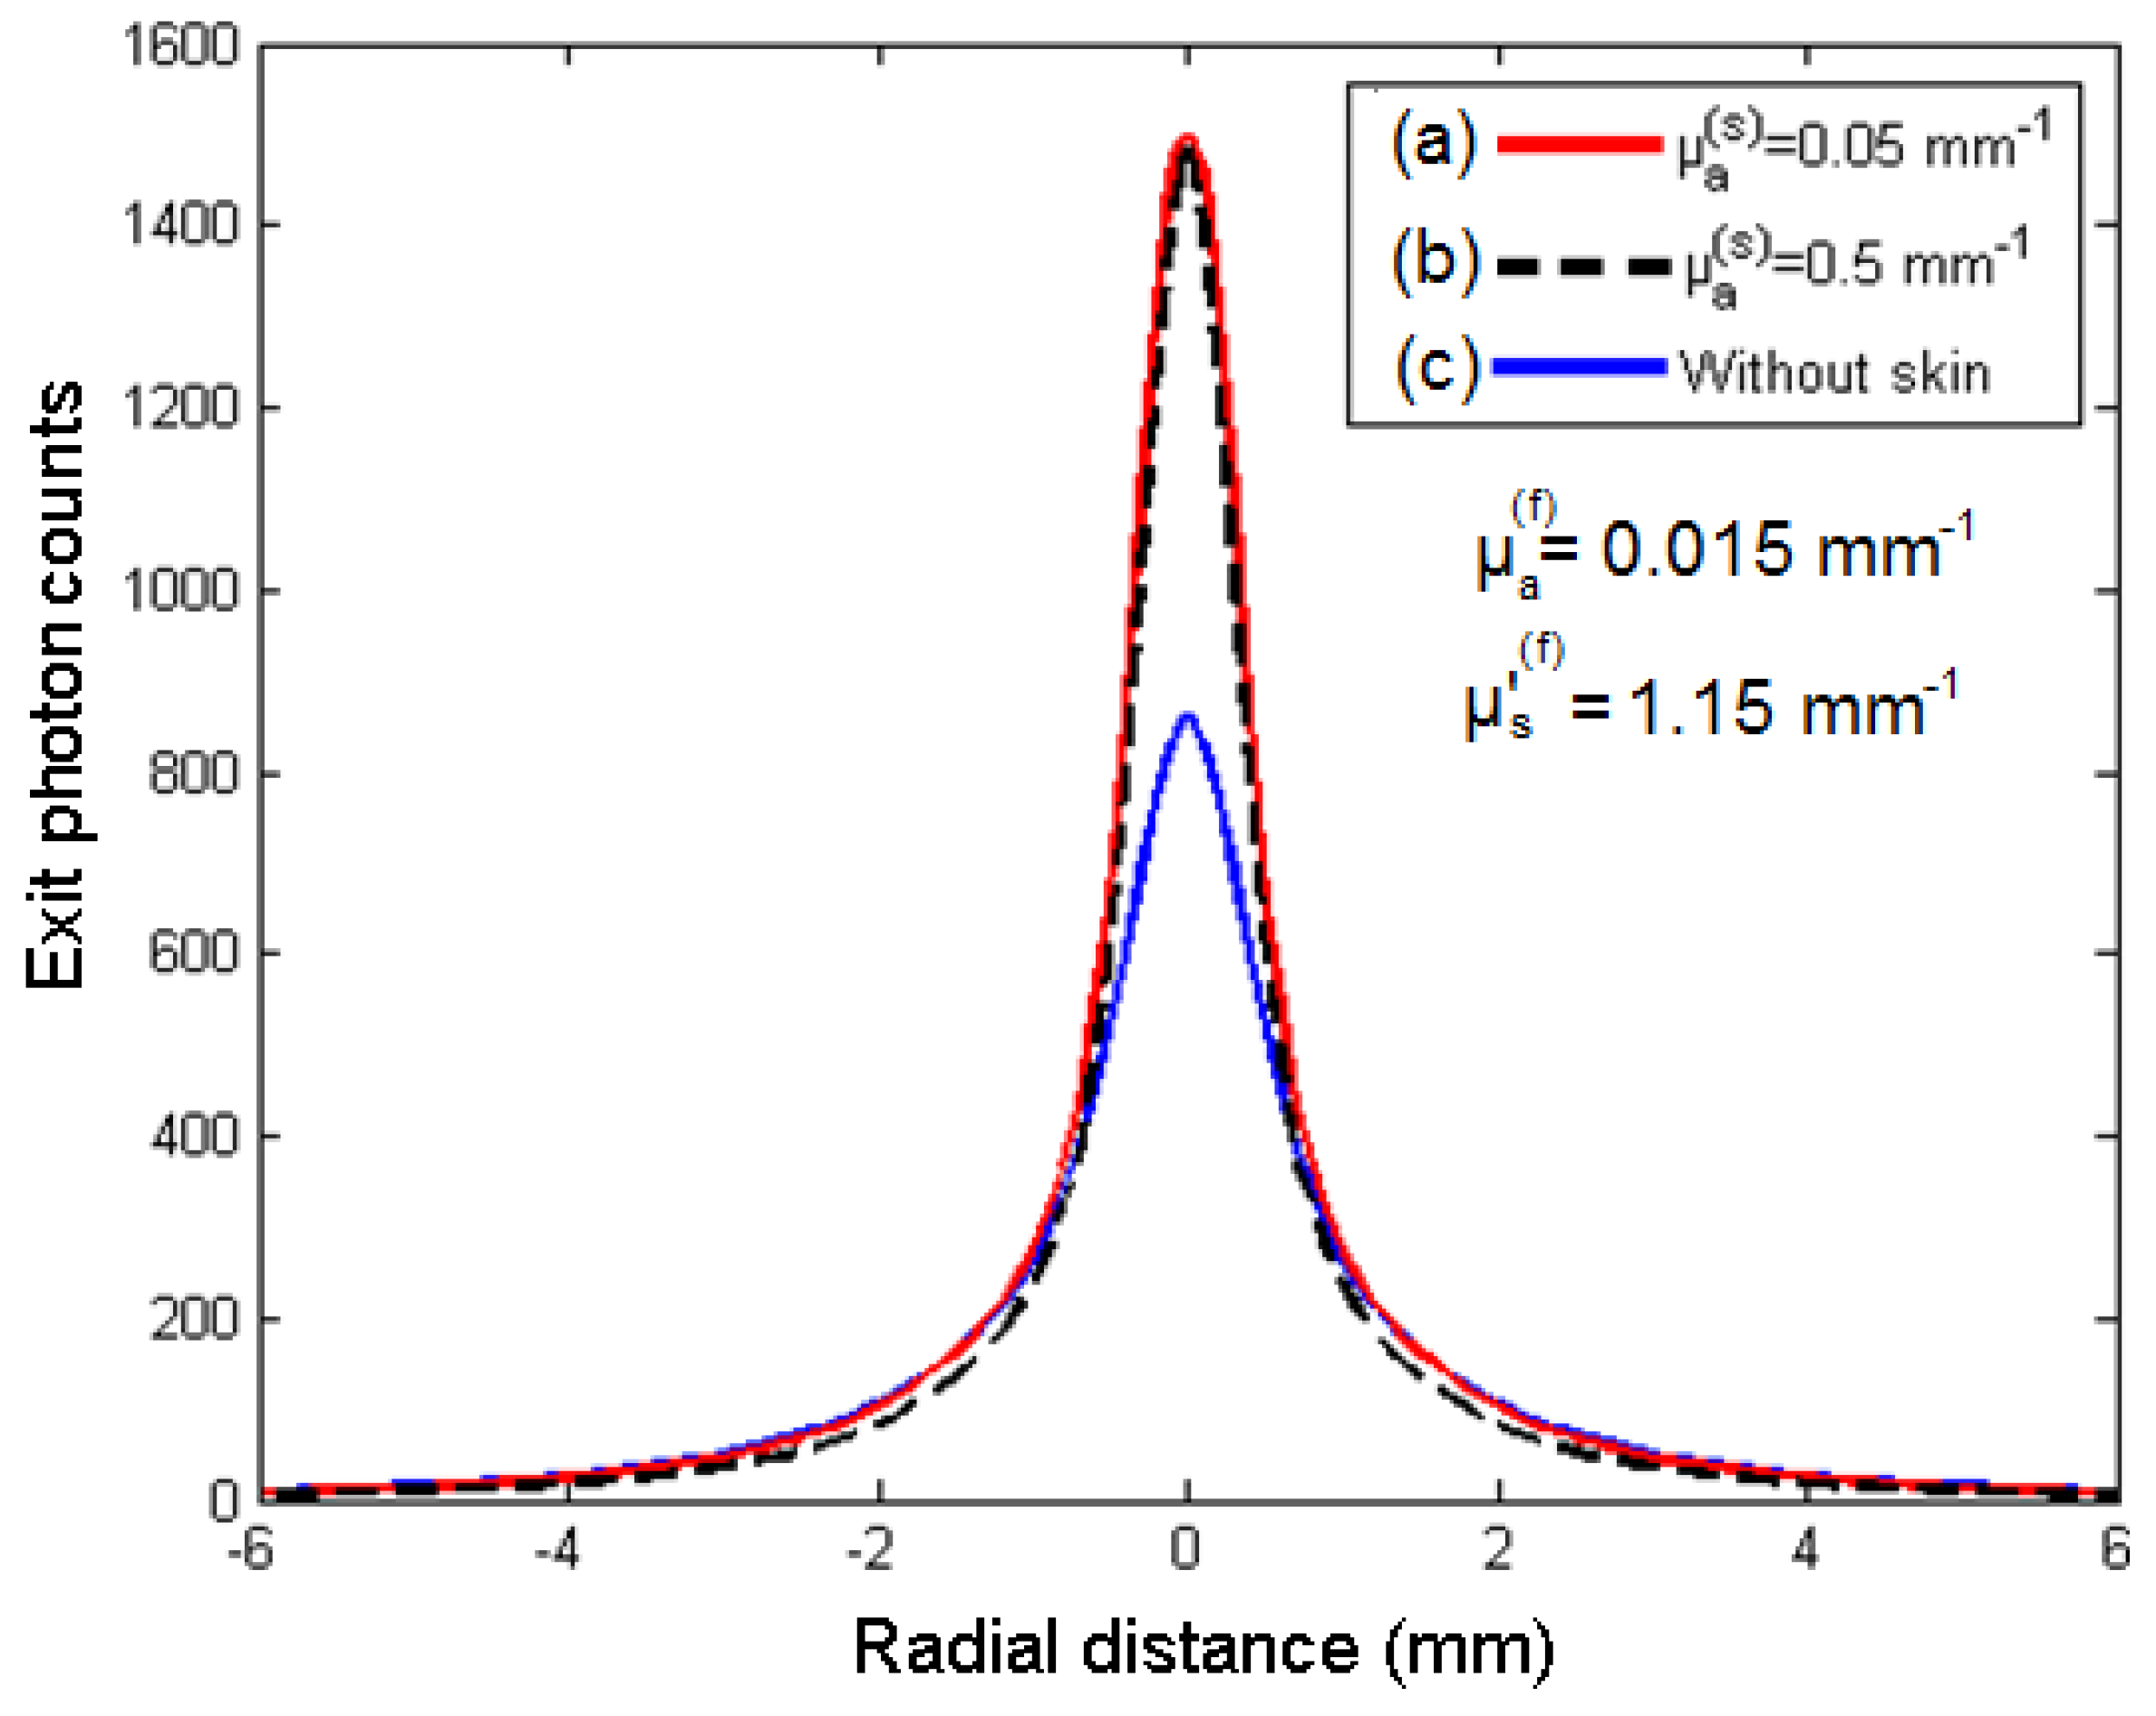
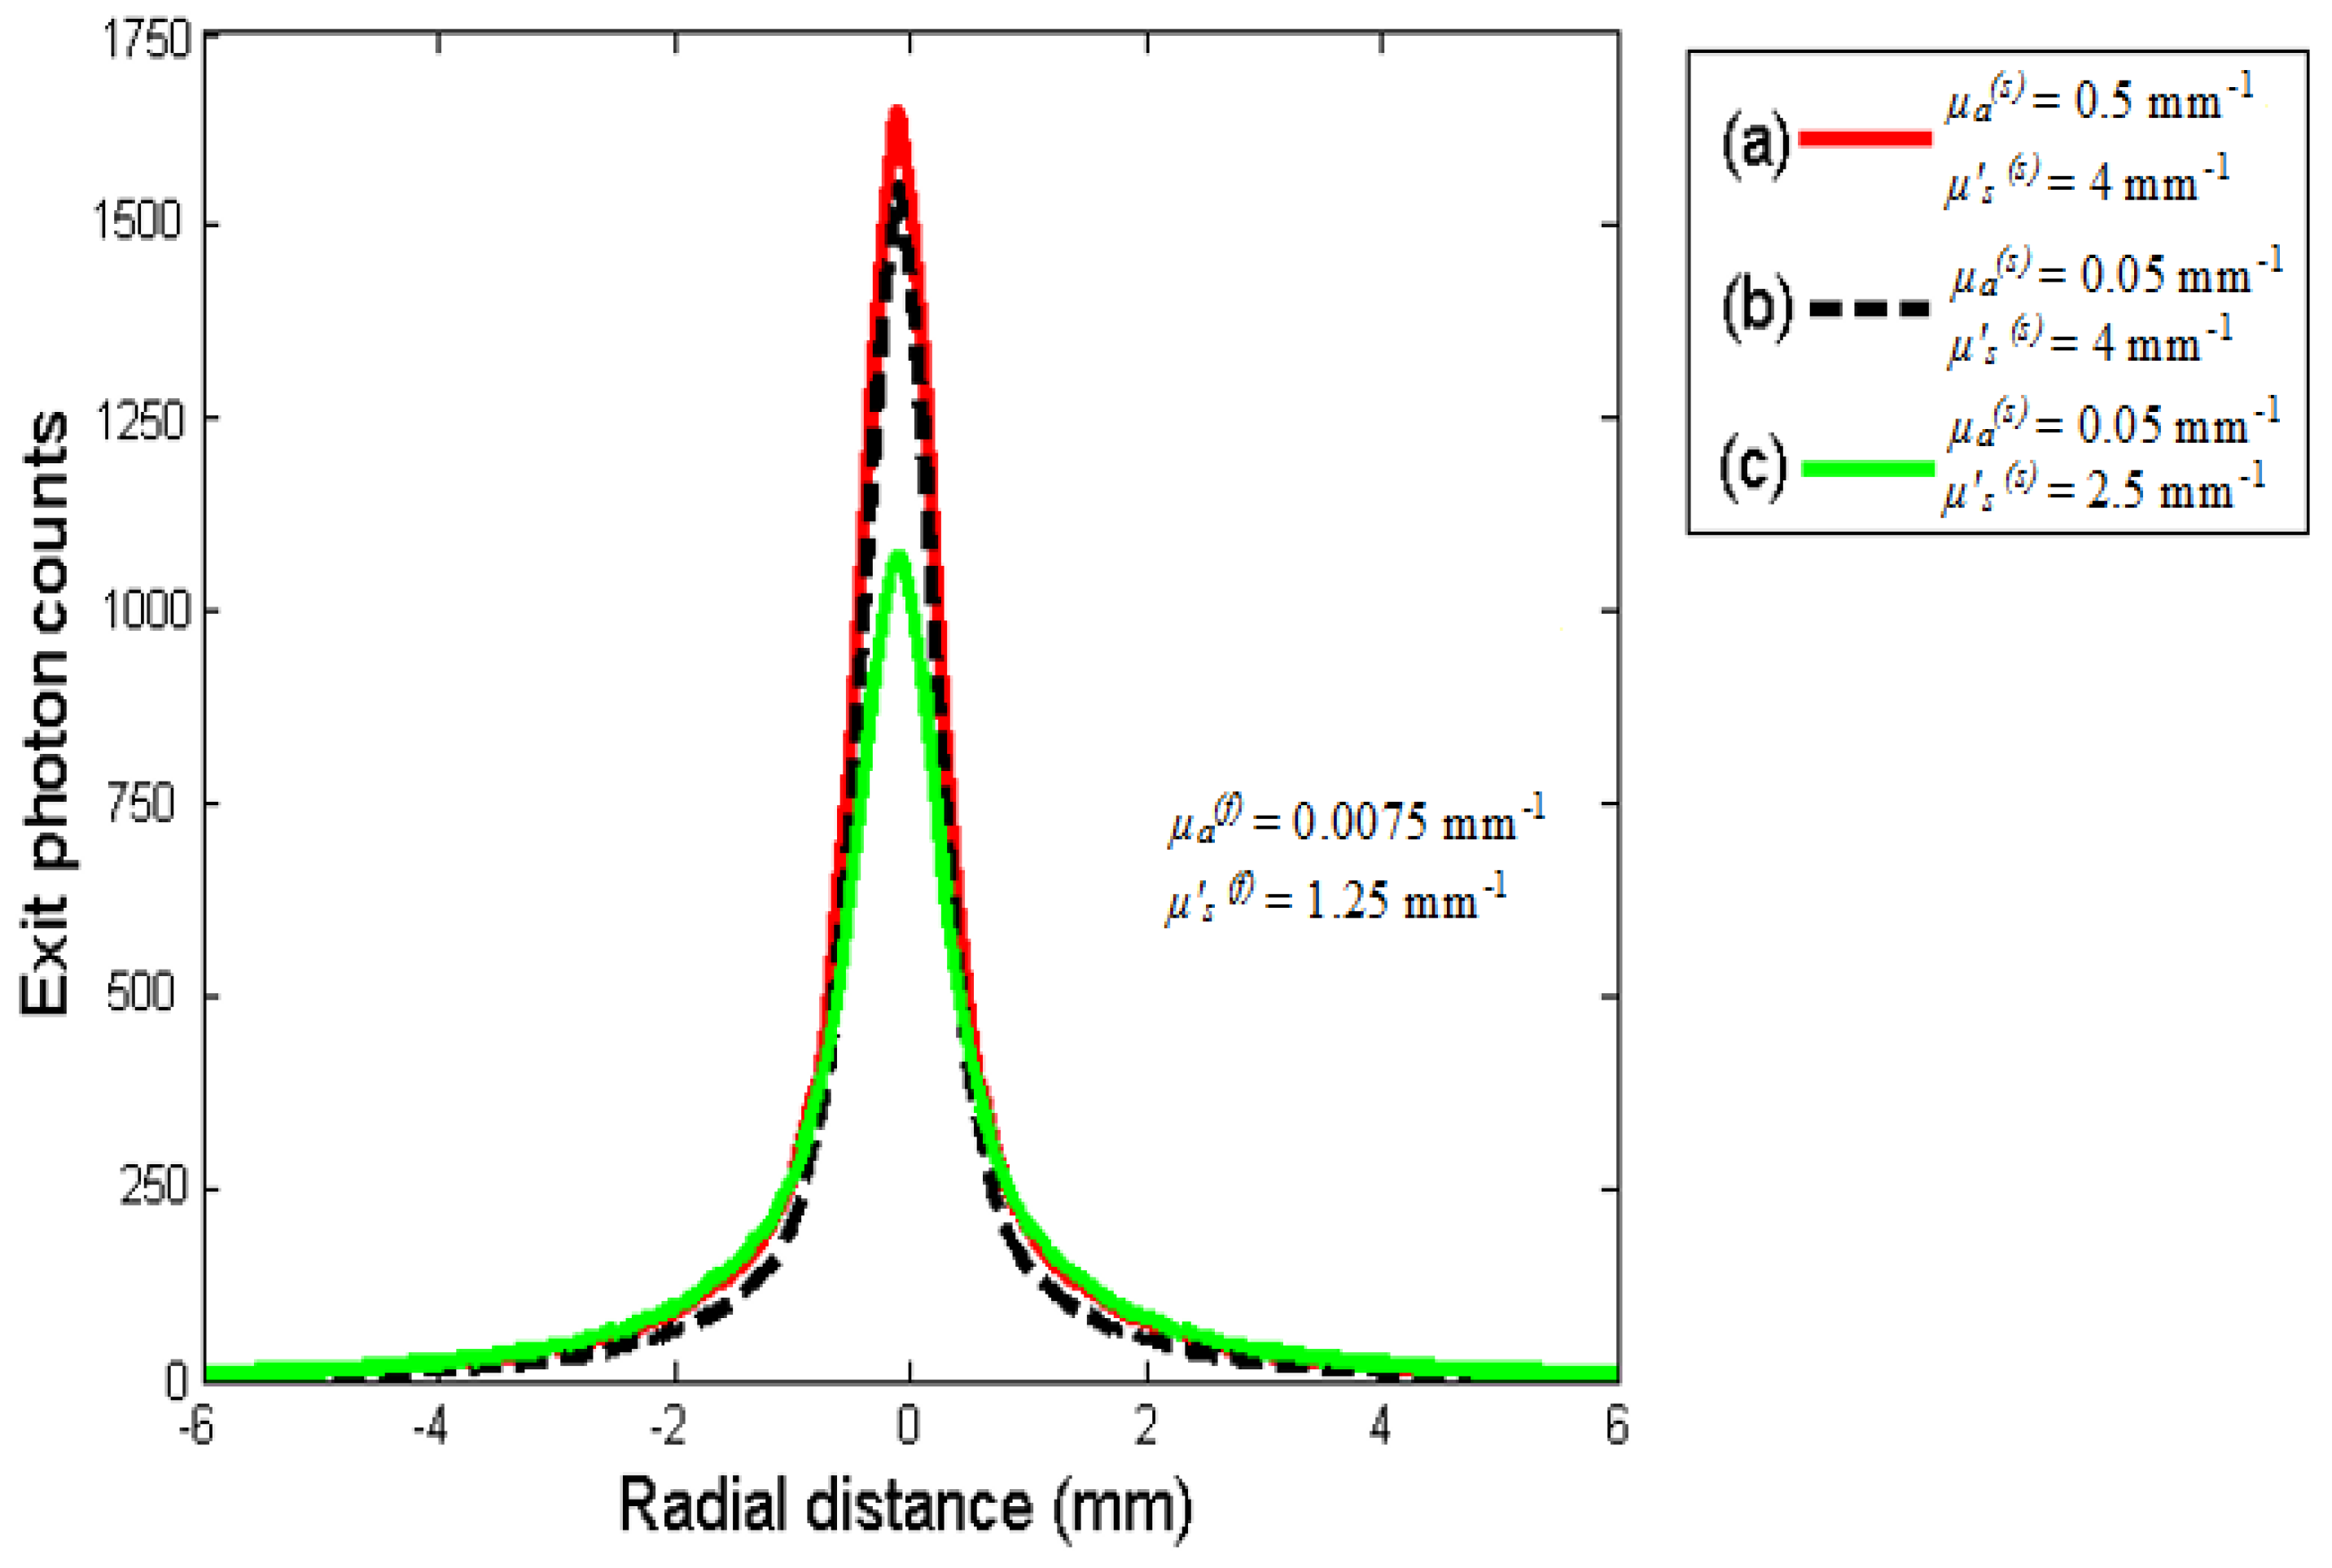
3.1. Imaging Whole Apple

To show the effect of the skin on light diffusion process in whole apple illuminated with a Gaussian spot laser, backscattering images associated with their diffuse reflectance profiles were first simulated. A first series of results was carried out by considering the whole apple as unpeeled or peeled. Typical backscattering images are displayed in Figure 3a–c. For convenience of direct comparisons, each presented image has been normalized with respect to its peak intensity.
In the cases of Figure 3a,b, the whole apple is covered with a skin layer of thickness 80 µm, whereas in the case of Figure 3c, the apple is considered peeled. The data were generated with µa(f) = 0.015 mm−1, µs(f) = 1.15 mm−1, µa(s) = 0.05 mm−1 (Figure 3a), or 0.5 mm−1 (Figure 3b), and µs(s) = 4 mm−1. We note that changing the absorption coefficient of the skin (0.5 mm−1 against 0.05 mm−1) does not affect the size of the computed backscattering images in Figure 3a,b. In contrast, the image related to the whole apple without skin (Figure 3c) appears larger with respect to the previous cases.
Figure 3. Simulated backscattering images captured at the periphery of a whole apple with skin (a), (b), and without skin (c). The images were generated with µa(f) = 0.015 mm−1-µs(f) = 1.15 mm−1, and (a) µa(s) = 0.05 mm−1-µs(s) = 4 mm−1, (b) µa(s) = 0.5 mm−1-µs(s) = 4 mm−1, (c) µa(s) = µa(f)-µs(s) = µs(f), rs = 35 mm, skin thickness of 80 µm, and normalized with respect to their peak intensity.
Photonics 03 00002 g003
The spatial diffuse reflectance profiles corresponding to the three computed images (Figure 3), are presented in Figure 4. Overall, it is shown that the peak intensity related to an intact apple is larger than the one obtained for an apple without skin (flesh alone).
Figure 4. Diffuse reflectance profiles plotted as a function of the radial distance ρ = X 2 + Y 2 , and corresponding to the three generated images (ac) displayed in Figure 3.
Photonics 03 00002 g004
Moreover, the peak intensity is practically not affected by the absorption coefficient of the skin. According to [20], the skin acts like a screen which confines the diffused photons in the sub-surface (skin–flesh). In this case, more backscattering photons can escape the boundary (skin–air), and then contribute to increase the peak intensity of the spatial diffuse reflectance.
A second series of computation was carried out using a skin thickness fixed at 150 µm, while varying the optical properties µa(s) and µs(s). The resulting normalized images are displayed in Figure 5a–c, and the corresponding spatial diffuse reflectance profiles are presented in Figure 6. All the data were generated with µa(f) = 0.0075 mm−1-µs(f) = 1.25 mm−1, and µa(s) = 0.05 mm−1-µs(s) = 4 mm−1 (Figure 5a), µa(s) = 0.5 mm−1-µs(s) = 4 mm−1 (Figure 5b), µa(s) = 0.05 mm−1-µs(s) = 2.5 mm−1 (Figure 5c). At first glance, it is possible to distinguish two different trends among the generated backscattering images in Figure 5a–c. First, when the absorption coefficient µa(s) of the skin is increased from 0.05 mm−1 to 0.5 mm−1, the backscattering area in Figure 5a,b shows only slight changes. Consequently, the corresponding spatial diffuse reflectance profiles (Figure 6a,b) are practically merged. Second, when the reduced scattering coefficient µs(s) of the skin is decreased from 4 mm−1 to 2.5 mm−1 (µa(s) = 0.05 mm−1), an enlarged image size is observed. As the scattering diameter increases, the peak intensity of the corresponding reflectance profile decreases (Figure 6). This is consistent with the fact that the optical properties of the skin become closer to those of the flesh in the case of Figure 5c in comparison to the cases in Figure 5a,b.
Figure 5. Simulated backscattering images captured over the curved boundary of a whole apple covered by a skin layer of thickness 150 µm with different optical properties. The data were generated with µa(f) = 0.0075 mm−1-µs (f) = 1.25 mm−1, (a) µa(s) = 0.05 mm−1-µs(s) = 4 mm−1, (b) µa(s) = 0.5 mm−1-µs(s) = 4 mm−1, (c) µa(s) = 0.05 mm−1-µs(s) = 2.5 mm−1, rs = 35 mm, and normalized with respect to their peak intensity.
Photonics 03 00002 g005
Figure 6. Diffuse reflectance profiles plotted as a function of the radial distance ρ = X 2 + Y 2 , and corresponding to the three generated images (a, c) displayed in Figure 5.
Photonics 03 00002 g006

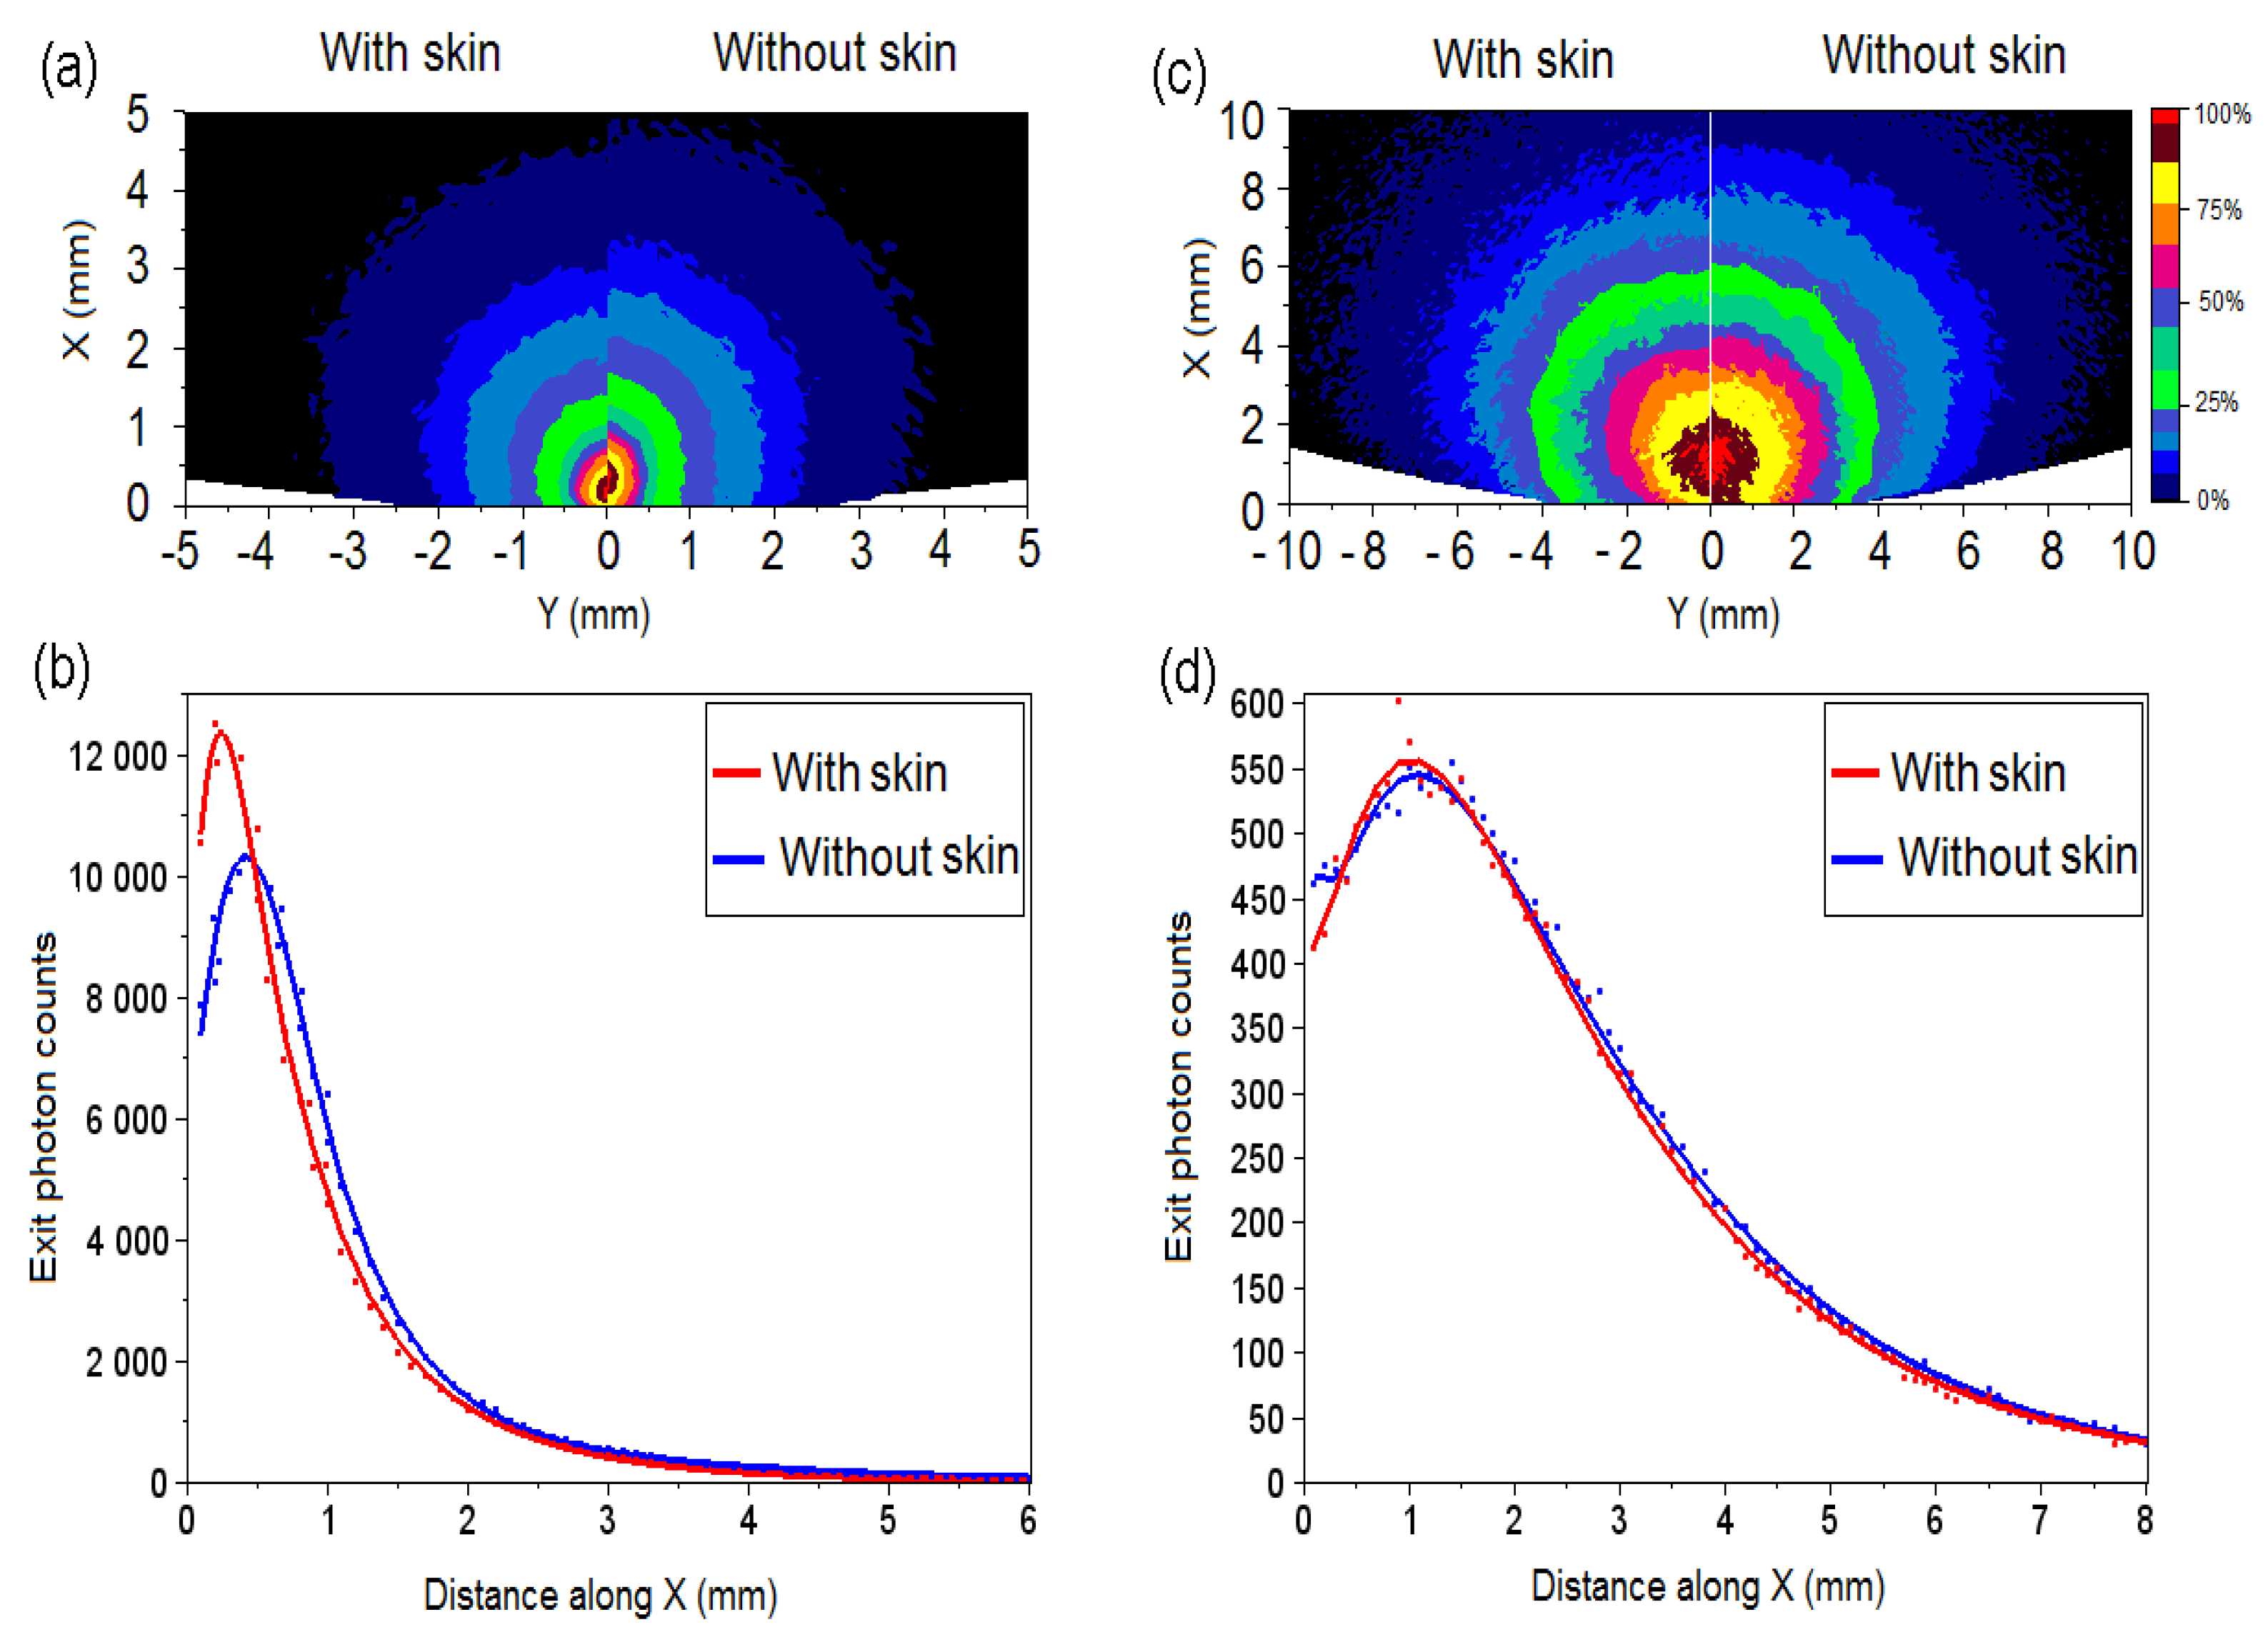
3.2. Imaging of Half-Cut Apple

To gain more information on the light propagation in apple structures, the model was adapted such that it mimics a half-cut apple with and without skin layer. As displayed in Figure 1b, the light source illuminates the sample normally to the boundary, at two different locations, z, below the equatorial plane. Typical backscattering images captured by a virtual detector, facing the equatorial plane of the apple models with and without skin layer are shown in Figure 7a,c for the source located at z = −0.5 mm or z = −3 mm. The corresponding diffuse reflectance profiles are displayed in Figure 7b,d. All data were generated with µa(f) = 0.0075 mm−1, µs(f) = 1.25 mm−1, µa(s) = 0.05 mm−1-µs(s) = 4 mm−1, and a skin thickness of 80 µm. In both investigated cases, the photon patterns stay close to the impact point of the light source, but the maximum density varies from each other.
When the source is near the plane surface (z = −0.5 mm, Figure 7a,b), the skin has the effect to shift the isolines near the curved boundary, and the peak intensity of the diffuse reflectance profile (Figure 6b) occurs at the distance of about 0.25 mm. In contrast, the peak intensity of the diffuse reflectance profiles computed for the flesh (without skin) is less sharp but occurs at about 0.5 mm. The effect of the skin weakens when the source is located further down (z = −3 mm) Figure 7c,d. A large scattering amount tends to uniformize the different events observed, while decreasing the recorded diffuse intensity. Therefore, the isolines (Figure 7c) related to unpeeled and peeled apple are barely shifted, and the corresponding diffuse reflectance profiles (Figure 7d) are practically merged. Furthermore, the peak intensity of both diffuse reflectance profiles occurs at the distance of 1.25 mm from the sample boundary.
Figure 7. Simulated backscattering images (a)–(c) captured over the equatorial plane of half-cut apple models with and without skin, and corresponding diffuse reflectance profiles (b)–(d), plotted along X for Y = 0 and Z = 0. (a)–(b) Source located at z = −0.5 mm from the plane surface, and (c)–(d) source located at z = −3 mm. The data were generated with µa(f) = 0.0075 mm−1-µs(f) = 1.25 mm−1, µa(s) = 0.05 mm−1-µs(s) = 4 mm−1, rs = 35 mm, and skin thickness of 80 µm.
Photonics 03 00002 g007
In both cases, backscattered light increases the incident light source, yielding an internal fluence rate that exceeds the irradiance delivered at the apple surface. This is in agreement with numerical findings of others, who showed that the peak and depth position of the fluence rate depend on the illuminating beam radius [26,51].

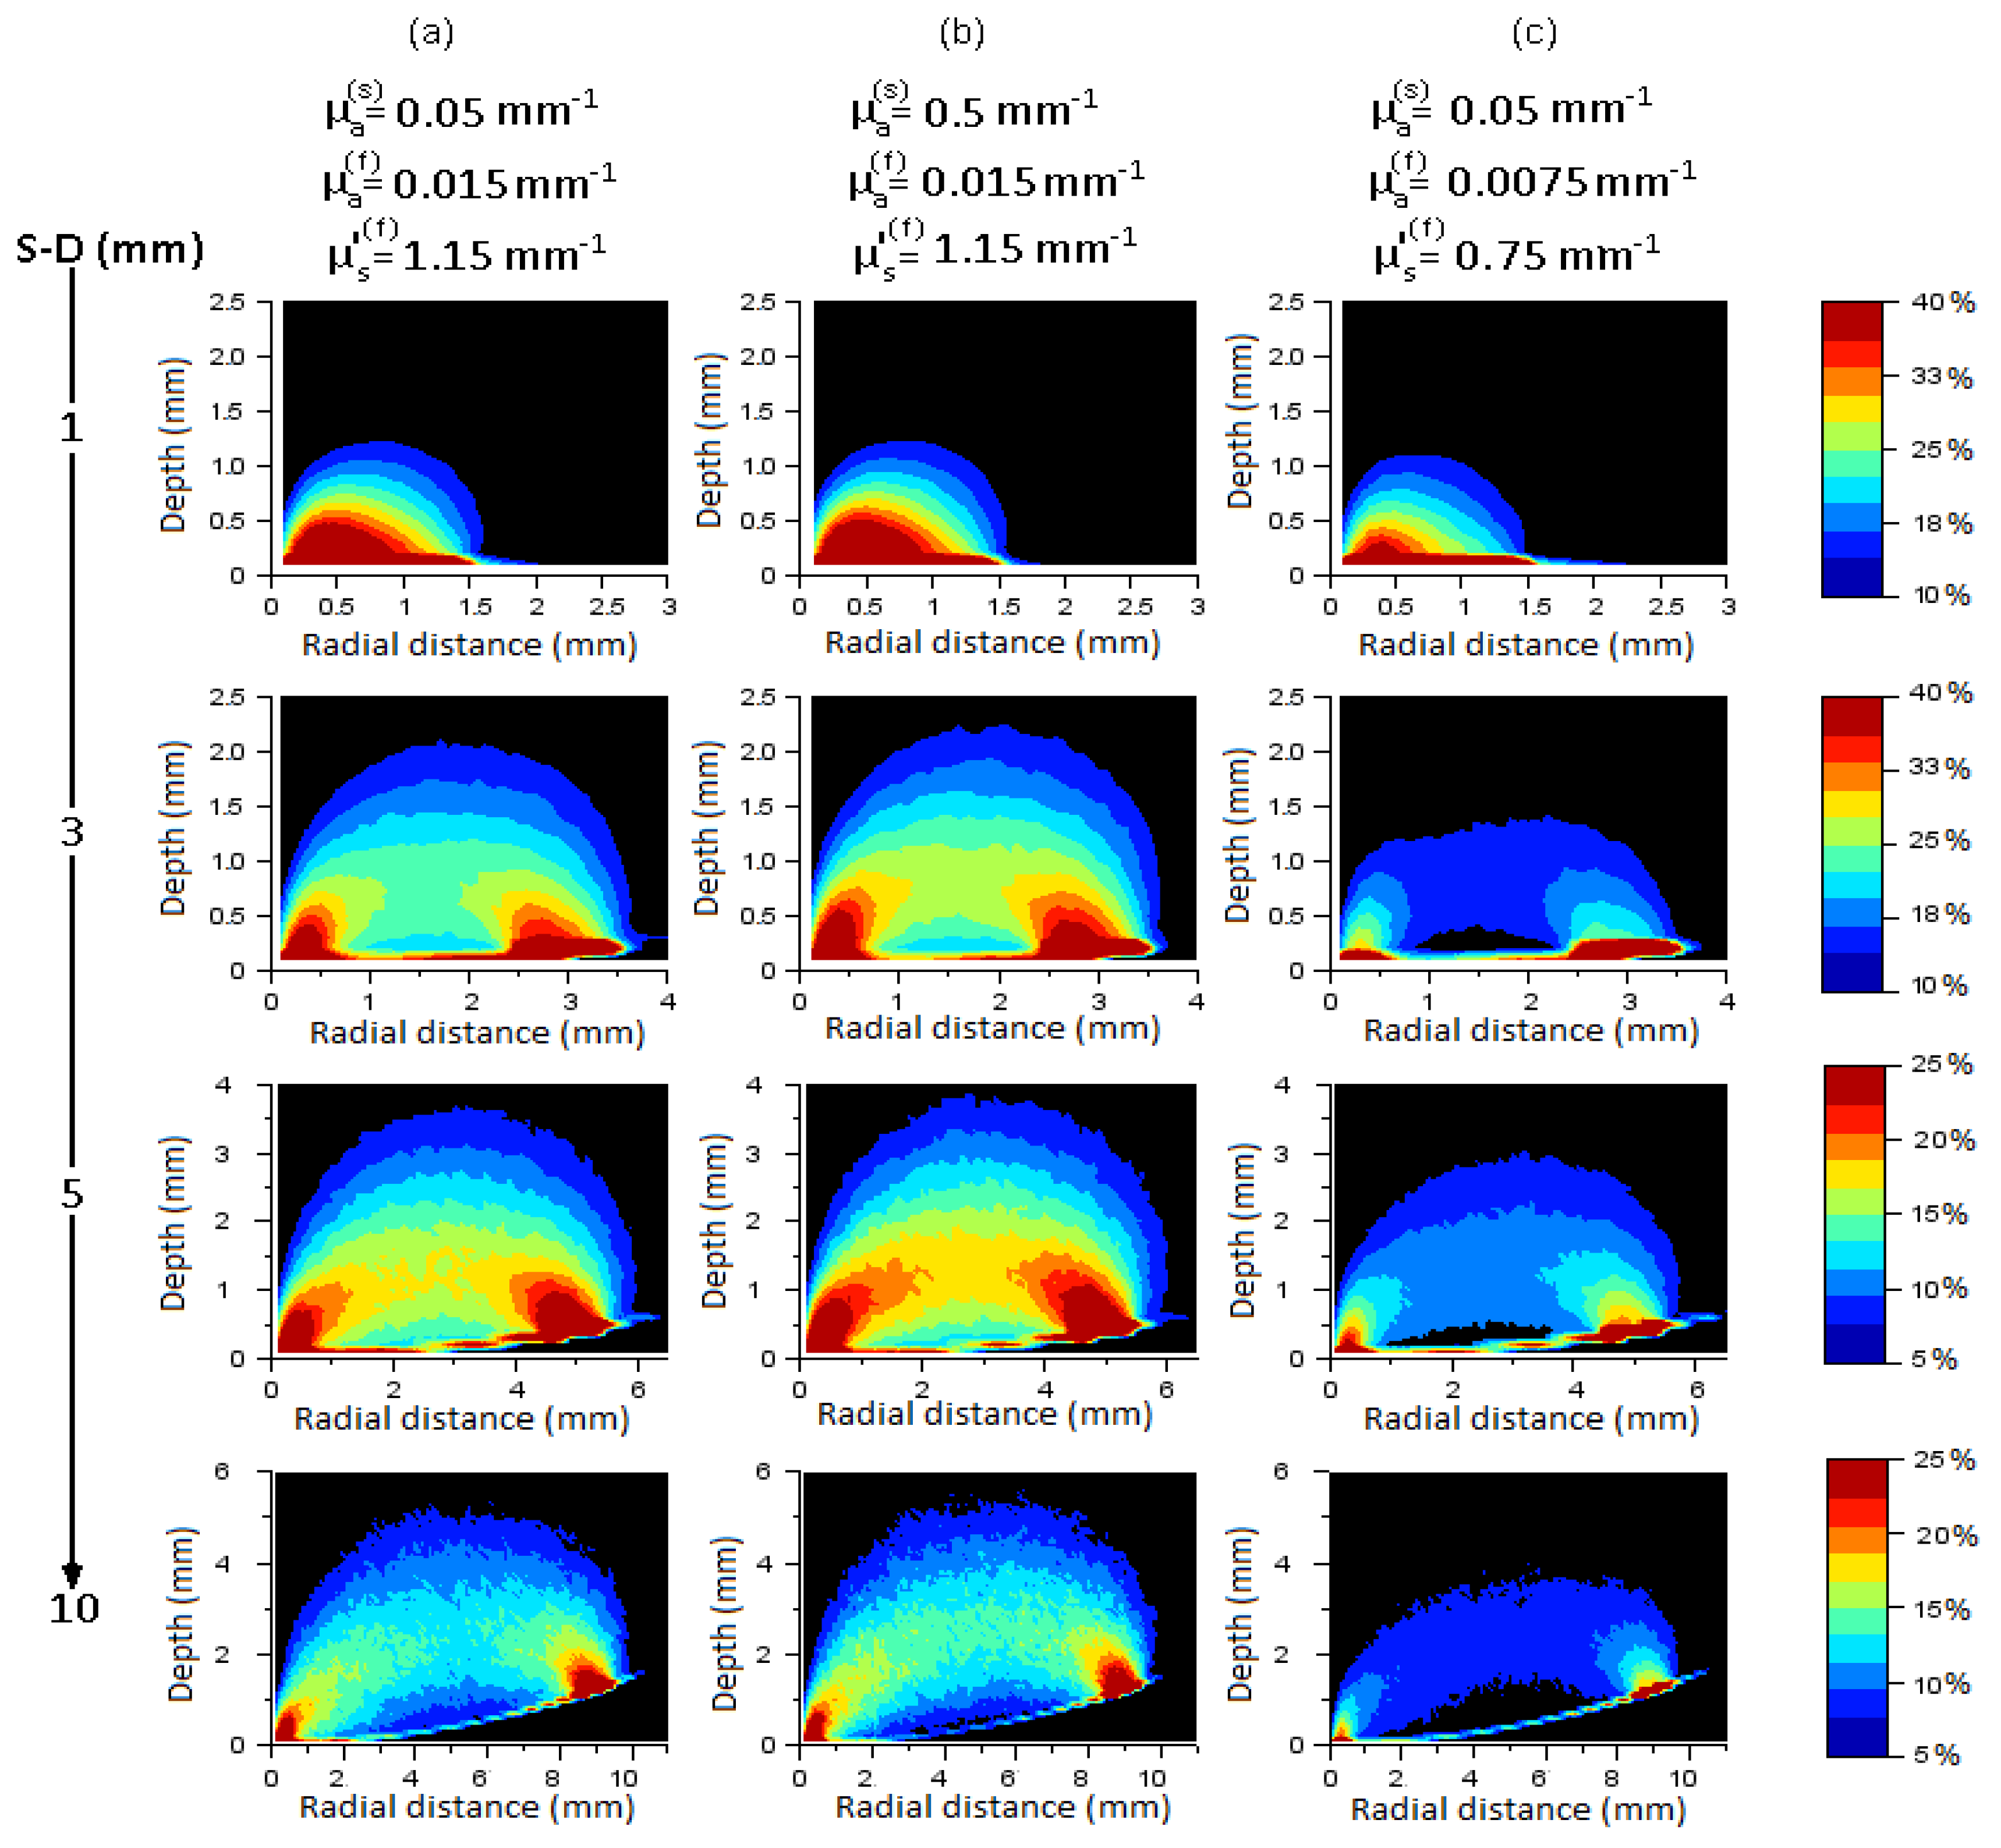
3.3. Assessment of Internal Optical Properties

In this subsection, we assess the optical properties of the apple flesh. The method is based on a diffusion theory model to fit the diffuse reflectance profiles and then to extract the unknown coefficients µa and µs. The analytical model of Kienle and Patterson [52] was chosen for these investigations. The diffuse reflectance Rd (ρ) generated at the radial distance ρ, from a point source acting at z 0 = 1/µt (µt = µa + µs) in a homogeneous semi-infinite diffusing medium is as follow:
R d ( ρ ) = C 1   Φ ( ρ , z = 0 ) + C 2 R f l u x   ( ρ )
Φ ( ρ , z = 0 ) = 1 4 π D [ e ( µ e f f   r 1 ) r 1 e ( µ e f f   r 2 ) r 2 ]
R flux   ( ρ )= 1 4π [ z 0 ( µ eff + 1 r 1 ) e ( µ eff   r 1 ) r 1 2 +( z 0 +2 z b )( µ eff + 1 r 2 ) e ( µ eff   r 2 ) r 2 2 ]
and µ e f f = 3 µ a ( µ a + µ s ) is the effective attenuation coefficient, r 1 = z 0 2 + ρ 2 , r 2 = ( z 0 + 2 z b ) 2 + ρ 2 , z b = 2 A D , D = 1 3 µ t , (A= 2.945, for n = 1.4) [53]. The constants C 1 = 1 4 π 2 π [ 1 R ( θ i ) ] c o s θ i d Ω and C 2 = 3 4 π 2 π [ 1 R ( θ i ) ] c o s 2 θ i d Ω are both dependent on the Fresnel reflection coefficient (Equation (13)), and the solid angle Ω. For n = 1.4, C1 = 0.118 and C2 = 0.306 [11]. The spatial profiles covering 2.8–10 mm[39]were used in the curve fitting procedure. This radial range is in agreement with the optimum imaging range for diffuse reflectance from the surface of “Golden Delicious” apples, which was estimated to be between the upper (4 × 10² lux) and lower (4 × 10⁻³ lux) detection limits of a CCD camera setup [54]. Fitting results, based on the use of the inverse nonlinear least squares algorithm (Trust-Region) implemented on Matlab 8.a, are listed Table 3. Three thicknesses of the skin (d = 0, 80, and 150 µm) and different combinations of optical properties µa(s)µs(s); µa(f)µs(f) were used as input data in the fitting procedures.
The accuracy of the retrieved method largely depends on the interplay between the optical properties which have been chosen. In the case of apple without skin layer (d = 0 µm), the fitting results are better for moderate values of µa(f)-µs(f) (0.025 mm−1–1.25 mm−1, 0.015 mm−1–1.15 mm−1) than for low values (0.0075 mm−1–0.75 mm−1) or especially for a low value of µa(f) (0.0075 mm−1–1.25 mm−1).
When the flesh is covered with a skin layer of thickness d = 80 µm or 150 µm, the relative errors on the estimates (µa-µ’s) increase with respect to the absorption coefficient (µa(s)) of the skin. This may be explained by the fact that a small number of photons propagating through the flesh are re-emitted when the skin is relatively absorbent.
Finally, when the optical properties of the flesh are low (0.0075 mm−1-1.25 mm−1) and those of the skin (d = 80 µm or 150 µm) high (0.05, 0.5-4 mm−1), the inverse algorithm does not give reasonable estimates. In this case, unsatisfactory results of estimating the optical properties of the flesh suggest that the approximation of the homogeneous medium as required by the diffusion model Equation (19) may not be well justified.
Source-detector sensitivity profiles related to a whole apple model covered with a skin layer of thickness 80 µm, are displayed in Figure 8. In order to compute these profiles, the Monte Carlo model requires storing the photons density Ni, j (only contributing to a source-detector pair) in grid elements i, j, which are related to the cylindrical coordinates ρ, z ( ρ = x 2 + y 2 ). With this equally spaced system, each volume element is drawn as an annular ring whose radius is ρ, thickness is dρ, and depth is dz. Let Ns be the number of photons scored by the detector. Then, the source-detector sensitivity profiles correspond to 2-D plots of the isolines from which the ratio N i , j N s remains fixed and expressed in percent (see color bars). The images (Figure 8) were generated for four source-distance (S-D) equal to 1, 3, 5 and 10 mm (horizontal columns), and different combinations of optical parameter sets (µa(s)-µ’s(s) = 4 mm−1), (µa(f)-µ’s(f)) corresponding to the vertical columns (a-b-c). First of all, we note that each computed source-detector sensitivity profiles (S-D = 1, 3, 5, and 10 mm) has a well-known banana-shape pattern [55,56] and peaks right beneath the source and detector locations.
Figure 8. Source-detector sensitivity profiles computed for a skin thickness d = 80 µm, four source-detector distances S-D = 1 mm, 3 mm, 5 mm and 10 mm (horizontal columns), and different combinations of optical properties µs(s) = 4 mm−1-µa(s); µa(f) -µs(f) (vertical columns (a-b-c)).
Photonics 03 00002 g008
Table 3. Retrieved internal optical properties (µa-µ’s) and errors (Δµa%, Δµs%) estimated with respect to the true values (µa(f)-µs(f)).
Input dataRetrieved DataRelative Error (%)
Fit Range (2.8–10 mm)
dµa(s)µs(s)µa(f)µs(f)µaµsΔµaΔµs
0--0.00751.250.00761.011.33%19.58%
800.0540.00751.250.01111.0948.00%12.92%
800.540.00751.250.01251.0966.67%13.00%
1500.0540.00751.250.01021.0936.00%12.70%
1500.540.00751.250.01241.0865.33%13.45%
1500.052.50.00751.250.01340.7178.67%42.92%
0--0.02251.250.02031.199.78%4.74%
800.0540.02251.250.02331.183.56%5.29%
1500.540.02251.250.02641.2017.33%3.63%
0--0.01501.150.01441.144.00%0.64%
800.0540.01501.150.01591.146.00%0.81%
800.540.01501.150.01631.148.67%0.84%
1500.0540.01501.150.01631.148.87%0.81%
1500.540.01501.150.01641.169.93%0.88%
1500.052.50.01501.150.01730.9515.47%17.14%
0--0.00750.750.00610.6018.67%19.67%
800.0540.00750.750.01920.60156.00%19.89%
1500.540.00750.750.02130.60184.00%19.96%
d: Skin thickness (µm); µa (mm−1); µs (mm−1)
The situation is, however, less clear when the detector is close to the source (S-D = 1 mm). Nevertheless, photons probe to a depth of about 0.4–0.5 mm, suggesting that reflectance measurements include the contribution of both skin and flesh (subsurface) tissues [57]. As the source-detector distance is increased (3, 5 and 10 mm), the photons probe more deeply in the flesh, but the depth reached is still dependent on the optical properties of each tissue type (skin, flesh). Therefore, the density of photons is greater in the skin in the case of the column (c) for which µa(f) = 0.0075 mm−1-µs(f) = 0.75 mm−1 than for the case of the column (a) where µa(f) = 0.015 mm−1-µs(f) = 1.15 mm−1. In contrast, there are less photons in the skin in the case of the column (b) (µa(s) = 0.5 mm−1) than for the case of the column (a) (µa(s) = 0.05 mm−1).

4. Conclusions

We have proposed novel computational methodologies based on Monte Carlo method to quantitatively study light transport in apple tissues. Monte Carlo simulations were run for apple modeled as a two-layer spherical geometry including the flesh and the skin. Backscattering images and reflectance profiles were simulated for two different spatially-resolved imaging tissue setups, and the resulting reflectance data were analyzed by a semi-infinite photon diffusion model to estimate the optical properties of the flesh.
Learning from various simulation results, we obtained the following conclusions. First of all, even though the skin is considered a thin layer (80 µm or 150 µm), which is the worst case for applying the diffusion theory to a two-layer tissue model, it is still possible to estimate its effect on optical features with a suitable Monte Carlo approach. Since the Monte Carlo model does not approximate the scattering function, light transport in apple tissue models can be computed with accuracy, even near the light source and skin or flesh boundary.
Both simulated imaging tissue setups (whole apple and half-cut apple models) demonstrate that the internal light dose strongly depends on the presence of the skin. In fact, this thin layer acts like a screen which confines the backscattered photons near the sub-surface of the two-layer spherical model. This will result in a radial reflectance profile that has larger peak intensity compared to the backscattering profile computed with the flesh only. An additional practical issue is the assessment of the internal properties using a spatially homogeneous diffusion model to fit the spatially heterogeneous reflectance data. Because the sensing range is limited from 2.8 mm to 10 mm, the curvature effect of the apple can be ignored in all measurements. However, in this current analysis approach, the relative errors in the estimates are largely dependent on the interplay between the chosen optical parameters for each tissue type. Wrong results are obtained when both the absorption and reduced scattering coefficients of the flesh are low, whereas the best estimates are noted in the case of moderate values. Although the present results can provide useful predictions, additional studies are awaited to assess optical properties of apple samples to compare simulation results with experiments carried out with a steady-state imaging setup.

Acknowledgments

This work was funded by the Regional Council of Pays de la Loire and supported by the AI fruit project.

Author Contributions

F. Vaudelle developed the Monte Carlo model, M.L. Askoura performed all simulations and J.P. L’Huillier devised the project and wrote the first draft of the manuscript. All authors approved the final manuscript.

Conflicts of Interest

The authors declare no conflict of interest.

References

  1. Cubeddu, R.; D’Andrea, C.; Pifferi, A.; Taroni, P.; Torricelli, A.; Valentini, G.; Dover, C.; Johnson, D.; Ruiz-Altisent, M.; Valero, C. Nondestructive quantification of chemical and physical properties of fruits by time-resolved reflectance spectroscopy in the wavelength range 650–1000 nm. Appl. Opt. 2001, 40, 538–543. [Google Scholar] [CrossRef] [PubMed]
  2. Cubeddu, R.; D’Andrea, C.; Pifferi, A.; Taroni, P.; Torricelli, A.; Valentini, G.; Ruiz-Altisent, M.; Valero, C.; Ortiz, C.; Dover, C. Time-resolved reflectance spectroscopy applied to the nondestructive monitoring of the internal optical properties in apples. Appl. Spectrosc. 2001, 55, 1368–1374. [Google Scholar] [CrossRef] [Green Version]
  3. Nicolaï, B.M.; Verlinden, B.E.; Desmet, M.; Saevels, S.; Saeys, W.; Theron, K.; Cubeddu, R.; Pifferi, A.; Torricelli, A. Time-resolved and continuous wave NIR reflectance spectroscopy to predict soluble solids content and firmness of pear. Postharvest Biol. Technol. 2008, 47, 68–74. [Google Scholar] [CrossRef]
  4. McGlone, V.; Abe, H.; Kawano, S. Kiwifruit firmness by near infrared light scattering. J. Near Infrared Spectrosc. 1997, 5, 83–90. [Google Scholar] [CrossRef]
  5. Il’iasov, S.; Krasnikov, V.V. Physical Principles of Infrared Irradiation of Foodstuffs; Hemisphere Pub. Corp.: Summit, NJ, USA, 1991. [Google Scholar]
  6. Watté, R.; Aernouts, B.; Van Beers, R.; Herremans, E.; Ho, Q.T.; Verboven, P.; Nicolaï, B.; Saeys, W. Modeling the propagation of light in realistic tissue structures with mmc-fpf: A meshed monte carlo method with free phase function. Opt. Express 2015, 23, 17467–17486. [Google Scholar] [CrossRef] [PubMed]
  7. Tuchin, V.V.; Maksimova, I.L.; Zimnyakov, D.A.; Kon, I.L.; Mavlyutov, A.H.; Mishin, A.A. Light propagation in tissues with controlled optical properties. J. Biomed. Opt. 1997, 2, 401–417. [Google Scholar] [CrossRef] [PubMed]
  8. Cheong, W.-F.; Prahl, S.A.; Welch, A.J. A review of the optical properties of biological tissues. IEEE J. Quantum Electron. 1990, 26, 2166–2185. [Google Scholar] [CrossRef]
  9. Welch, A.J.; Van Gemert, M.J. Optical-Thermal Response of Laser-Irradiated Tissue; Springer: New York, NY, USA, 1995; Vol. 1. [Google Scholar]
  10. Gibson, A.; Hebden, J.; Arridge, S.R. Recent advances in diffuse optical imaging. Phys. Med. Biol. 2005, 50. [Google Scholar] [CrossRef]
  11. Kienle, A.; Patterson, M.S. Improved solutions of the steady-state and the time-resolved diffusion equations for reflectance from a semi-infinite turbid medium. J. Opt. Soc. Am. A 1997, 14, 246–254. [Google Scholar] [CrossRef]
  12. Farrell, T.J.; Patterson, M.S.; Wilson, B. A diffusion theory model of spatially resolved, steady-state diffuse reflectance for the noninvasive determination of tissue optical properties in vivo. Med. Phys. 1992, 19, 879–888. [Google Scholar] [CrossRef] [PubMed]
  13. Contini, D.; Martelli, F.; Zaccanti, G. Photon migration through a turbid slab described by a model based on diffusion approximation. I. Theory. Appl. Opt. 1997, 36, 4587–4599. [Google Scholar] [CrossRef] [PubMed]
  14. Qin, J.; Lu, R. Hyperspectral diffuse reflectance imaging for rapid, noncontact measurement of the optical properties of turbid materials. Appl. Opt. 2006, 45, 8366–8373. [Google Scholar] [CrossRef] [PubMed]
  15. Peng, Y.; Lu, R. Analysis of spatially resolved hyperspectral scattering images for assessing apple fruit firmness and soluble solids content. Postharvest Biol. Technol. 2008, 48, 52–62. [Google Scholar] [CrossRef]
  16. Cen, H.; Lu, R.; Mendoza, F.; Beaudry, R.M. Relationship of the optical absorption and scattering properties with mechanical and structural properties of apple tissue. Postharvest Biol. Technol. 2013, 85, 30–38. [Google Scholar] [CrossRef]
  17. Lorente, D.; Zude, M.; Idler, C.; Gómez-Sanchis, J.; Blasco, J. Laser-light backscattering imaging for early decay detection in citrus fruit using both a statistical and a physical model. J. Food Eng. 2015, 154, 76–85. [Google Scholar] [CrossRef]
  18. Valero, C.; Ruiz-Altisent, M.; Cubeddu, R.; Pifferi, A.; Taroni, P.; Torricelli, A.; Valentini, G.; Johnson, D.; Dover, C. Selection models for the internal quality of fruit, based on time domain laser reflectance spectroscopy. Biosyst. Eng. 2004, 88, 313–323. [Google Scholar] [CrossRef] [Green Version]
  19. Chauchard, F.; Roger, J.; Bellon-Maurel, V.; Abrahamsson, C.; Andersson-Engels, S.; Svanberg, S. Madstress: A linear approach for evaluating scattering and absorption coefficients of samples measured using time-resolved spectroscopy in reflection. Appl. Spectrosc. 2005, 59, 1229–1235. [Google Scholar] [CrossRef] [PubMed]
  20. Vaudelle, F.; L’Huillier, J.-P. Influence of the size and skin thickness of apple varieties on the retrieval of internal optical properties using VIS/NIR spectroscopy: A monte carlo-based study. Comput. Electron. Agric. 2015, 116, 137–149. [Google Scholar] [CrossRef]
  21. Schmitt, J.; Wall, R.; Zhou, G.; Walker, E. Multilayer model of photon diffusion in skin. JOSA A 1990, 7, 2141–2153. [Google Scholar] [CrossRef]
  22. Kienle, A.; Patterson, M.S.; Dögnitz, N.; Bays, R.; Wagnieres, G.; van Den Bergh, H. Noninvasive determination of the optical properties of two-layered turbid media. Appl. Opt. 1998, 37, 779–791. [Google Scholar] [CrossRef] [PubMed]
  23. Cen, H.; Lu, R. Quantification of the optical properties of two-layer turbid materials using a hyperspectral imaging-based spatially-resolved technique. Appl. Opt. 2009, 48, 5612–5623. [Google Scholar] [CrossRef] [PubMed]
  24. Arridge, S.; Schweiger, M.; Hiraoka, M.; Delpy, D. A finite element approach for modeling photon transport in tissue. Med. Phys. 1993, 20, 299–309. [Google Scholar] [CrossRef] [PubMed]
  25. Aydin, E.; Katsimichas, S.; de Oliveira, C. Time-dependent diffusion and transport calculations using a finite-element-spherical harmonics method. J. Quant. Spectrosc. Radiat. Transf. 2005, 95, 349–363. [Google Scholar] [CrossRef]
  26. Deulin, X.; L’Huillier, J.P. Finite element approach to photon propagation modeling in semi-infinite homogeneous and multilayered tissue structures. Eur. Phys. J. Appl. Phys. 2006, 33, 133–146. [Google Scholar] [CrossRef]
  27. Wang, L.; Jacques, S.L.; Zheng, L. MCML-Monte Carlo modeling of light transport in multi-layered tissues. Comput. Methods Prog. Biomed. 1995, 47, 131–146. [Google Scholar] [CrossRef]
  28. Okada, K. Extended time dependent dielectric breakdown model based on anomalous gate area dependence of lifetime in ultra thin silicon dioxides. Jpn. J. Appl. Phys. 1997, 36, 1443–1447. [Google Scholar] [CrossRef]
  29. Mansouri, C.; L’Huillier, J.-P.; Kashou, N.H.; Humeau, A. Depth sensitivity analysis of functional near-infrared spectroscopy measurement using three-dimensional monte carlo modelling-based magnetic resonance imaging. Lasers Med. Sci. 2010, 25, 431–438. [Google Scholar] [CrossRef] [PubMed] [Green Version]
  30. Vaudelle, F.; L’huillier, J.-P. Time-resolved optical fluorescence spectroscopy of heterogeneous turbid media with special emphasis on brain tissue structures including diseased regions: A sensitivity analysis. Opt. Commun. 2013, 304, 161–168. [Google Scholar] [CrossRef] [Green Version]
  31. Eze, R.; Kumar, S. Laser transport through thin scattering layers. Appl. Opt. 2010, 49, 358–368. [Google Scholar] [CrossRef] [PubMed]
  32. Zamora-Rojas, E.; Garrido-Varo, A.; Aernouts, B.; Pérez-Marín, D.; Saeys, W.; Yamada, Y.; Guerrero-Ginel, J.E. Understanding near infrared radiation propagation in pig skin reflectance measurements. Innov. Food Sci. Emerg. Technol. 2014, 22, 137–146. [Google Scholar] [CrossRef]
  33. Meglinski, I.V.; Matcher, S.J. Quantitative assessment of skin layers absorption and skin reflectance spectra simulation in the visible and near-infrared spectral regions. Physiol. Meas. 2002, 23, 741–753. [Google Scholar] [CrossRef] [PubMed]
  34. Boas, D.; Culver, J.; Stott, J.; Dunn, A. Three dimensional monte carlo code for photon migration through complex heterogeneous media including the adult human head. Opt. Express 2002, 10, 159–170. [Google Scholar] [CrossRef] [PubMed]
  35. Qin, J.; Lu, R. Monte carlo simulation for quantification of light transport features in apples. Comput. Electron. Agric. 2009, 68, 44–51. [Google Scholar] [CrossRef]
  36. Baranyai, L.; Zude, M. Analysis of laser light propagation in kiwifruit using backscattering imaging and monte carlo simulation. Comput. Electron. Agric. 2009, 69, 33–39. [Google Scholar] [CrossRef]
  37. Wang, W.; Li, C. Measurement of the light absorption and scattering properties of onion skin and flesh at 633 nm. Postharvest Biol. Technol. 2013, 86, 494–501. [Google Scholar] [CrossRef]
  38. Ishimaru, A. Wave Propagation and Scattering In Random Media. Volume I-Single Scattering And Transport Theory; New York Academic Press Inc.: New York, NY, USA, 1978; p. 267. [Google Scholar]
  39. Askoura, M.L.; Piron, V.; Vaudelle, F.; L’Huillier, J.-P.; Madieta, E.; Mehinagic, E. Experimental investigation on light propagation through apple tissue structures. Proc. SPIE 2015, 9542. [Google Scholar] [CrossRef]
  40. Peng, Y.; Lu, R. Improving apple fruit firmness predictions by effective correction of multispectral scattering images. Postharvest Biol. Technol. 2006, 41, 266–274. [Google Scholar] [CrossRef]
  41. Zhang, F.; Kinnunen, M.; Popov, A.; Myllylä, R. Monte carlo method for simulating optical coherence tomography signal in homogeneous turbid media. Proc. SPIE 2007, 7022. [Google Scholar] [CrossRef]
  42. Prahl, S.A.; Keijzer, M.; Jacques, S.L.; Welch, A.J. A monte carlo model of light propagation in tissue. Dosim. Laser Radiat. Med. Biol. 1989, 5, 102–111. [Google Scholar]
  43. Prahl, S.A.; van Gemert, M.J.; Welch, A.J. Determining the optical properties of turbid media by using the adding-doubling method. Appl. Opt. 1993, 32, 559–568. [Google Scholar] [CrossRef] [PubMed]
  44. Witt, A.N. Multiple scattering in reflection nebulae. Ii. Uniform plane-parallel nebulae with foreground stars. Astrophys. J. Suppl. Ser. 1977, 35, 7–19. [Google Scholar] [CrossRef]
  45. Castro, D.C.; Álvarez, N.; Gabriel, P.; Micheloud, N.; Buyatti, M.; Gariglio, N. Crop loading studies on “caricia” and “eva” apples grown in a mild winter area. Sci. Agric. 2015, 72, 237–244. [Google Scholar] [CrossRef]
  46. Konarska, A. The structure of the fruit peel in two varieties of malus domestica borkh.(rosaceae) before and after storage. Protoplasma 2013, 250, 701–714. [Google Scholar] [CrossRef] [PubMed]
  47. Homutova, I.; Blažek, J. Differences in fruit skin thickness between selected apple (malus domestica borkh.) cultivars assessed by histological and sensory methods. Hortic. Sci. 2006, 33, 108–113. [Google Scholar]
  48. Rowe, P.I.; Künnemeyer, R.; McGlone, A.; Talele, S.; Martinsen, P.; Seelye, R. Relationship between tissue firmness and optical properties of “royal gala” apples from 400 to 1050 nm. Postharvest Biol. Technol. 2014, 94, 89–96. [Google Scholar] [CrossRef]
  49. Lu, R.; Cen, H.; Huang, M.; Ariana, D.P. Spectral absorption and scattering properties of normal and bruised apple tissue. Trans. ASABE 2010, 53, 263–269. [Google Scholar] [CrossRef]
  50. Saeys, W.; Velazco-Roa, M.A.; Thennadil, S.N.; Ramon, H.; Nicolaï, B.M. Optical properties of apple skin and flesh in the wavelength range from 350 to 2200 nm. Appl. Opt. 2008, 47, 908–919. [Google Scholar] [CrossRef] [PubMed]
  51. Keijzer, M.; Jacques, S.L.; Prahl, S.A.; Welch, A.J. Light distributions in artery tissue: Monte carlo simulations for finite-diameter laser beams. Lasers Surg. Med. 1989, 9, 148–154. [Google Scholar] [CrossRef] [PubMed]
  52. Kienle, A.; Lilge, L.; Patterson, M.S.; Hibst, R.; Steiner, R.; Wilson, B.C. Spatially resolved absolute diffuse reflectance measurements for noninvasive determination of the optical scattering and absorption coefficients of biological tissue. Appl. Opt. 1996, 35, 2304–2314. [Google Scholar] [CrossRef] [PubMed]
  53. Haskell, R.C.; Svaasand, L.O.; Tsay, T.-T.; Feng, T.-C.; McAdams, M.S.; Tromberg, B.J. Boundary conditions for the diffusion equation in radiative transfer. J. Opt. Soc. Am. A 1994, 11, 2727–2741. [Google Scholar] [CrossRef]
  54. Qin, J.; Lu, R. Measurement of the optical properties of fruits and vegetables using spatially resolved hyperspectral diffuse reflectance imaging technique. Postharvest Biol. Technol. 2008, 49, 355–365. [Google Scholar] [CrossRef]
  55. Lee, K. Optical mammography: Diffuse optical imaging of breast cancer. World J. Clin. Oncol. 2011, 2, 64–72. [Google Scholar] [CrossRef] [PubMed]
  56. Feng, S.; Zeng, F.-A.; Chance, B. Photon migration in the presence of a single defect: A perturbation analysis. Appl. Opt. 1995, 34, 3826–3837. [Google Scholar] [CrossRef] [PubMed]
  57. Do Trong, N.N.; Rizzolo, A.; Herremans, E.; Vanoli, M.; Cortellino, G.; Erkinbaev, C.; Tsuta, M.; Spinelli, L.; Contini, D.; Torricelli, A. Optical properties-microstructure-texture relationships of dried apple slices: Spatially resolved diffuse reflectance spectroscopy as a novel technique for analysis and process control. Innov. Food Sci. Emerg. Technol. 2014, 21, 160–168. [Google Scholar] [CrossRef] [Green Version]

