Spatial Relation Awareness Module for Phase Unwrapping


1
Graduate School of Engineering, Chiba University, 1-33, Yayoi-cho, Inage-ku, Chiba 263-8522, Japan
2
Computermind Corp., Shinjuku Kokusai Building 4F, 6-6-2 Nishi-Shinjuku, Shinjuku-ku, Tokyo 160-0023, Japan
*
Author to whom correspondence should be addressed.
Photonics 2024, 11(2), 175; https://doi.org/10.3390/photonics11020175
Submission received: 15 January 2024
/
Revised: 8 February 2024
/
Accepted: 9 February 2024
/
Published: 14 February 2024
Abstract
:Phase unwrapping is a technique used to recover the original phase from the wrapped phase in the range . Various methods have been proposed for phase unwrapping. In particular, methods using convolutional neural networks (CNNs) have been extensively researched because of their high robustness against noise and fast inference speed. However, conventional CNN-based methods discard the local position information and relationships between pixels in the convolution process, resulting in poor phase-unwrapping performance. To obtain better phase unwrapping results, we propose a module that combines a global convolution network, which applies convolutional layers with a kernel size equivalent to that of the feature maps, and CoordConv, which acquires the positional relationships between pixels. We validated the performance of the proposed method by comparing it with a quality-guided path algorithm and deep learning-based phase unwrapping methods and found that the proposed method is highly robust against noise.
1. Introduction
Phase unwrapping is used to measure physical quantities, such as variations and surface shapes, in various practical fields, including magnetic resonance imaging [1], synthetic aperture radar [2], fringe projection techniques [3], and digital holographic interferometry [4]. In general, the phase measurement is typically acquired using the arctangent function, which is limited to the range of . Consequently, if the phase shift exceeds this range, the resulting image exhibits discontinuities with jumps of (where n denotes an integer). Hence, to obtain the true physical quantity, it is necessary to add a suitable multiple of 2 to the observed values, thereby restoring the phase distribution to a truly continuous state. This process is known as phase unwrapping [5,6]. The formula for phase unwrapping is expressed as follows:
where denotes the true phase, is the wrapped phase, is the pixel coordinates, and k is an integer coefficient known as the “wrap count” utilized to derive the true phase . Phase unwrapping can easily calculate the true phase in an ideal noiseless environment; however, it is a difficult task in an environment with noise, discontinuities, or sudden changes.
- Path-following approach: several proposed methods include the quality guided path algorithm, which determines the unwrapping path using a quality map or reliability criteria [9,10,11], and the branch cut algorithm [12], which imposes constraints on the unwrapping path to traverse line segments connecting two endpoints.
- Minimum norm approach: An approach to phase unwrapping by minimizing the norm between the gradient of the wrapping phase and the unwrapping phase. Phase unwrapping using the least-squares method [13] is the most typical minimum norm approach.
The path-following approach is computationally efficient, but less robust against noise. However, the minimum-norm approach is computationally inefficient and highly robust against noise.
In recent years, deep learning [14], a data-driven method, has achieved great success in various fields such as image recognition and natural language [15,16,17]. In the field of image recognition, Convolutional neural networks (CNNs) [18] have demonstrated remarkable performance in practical tasks [19,20]. To address the problem of phase unwrapping, several studies have applied CNN [7,8,21,22].
Two primary approaches are commonly utilized when employing a CNN to address the phase-unwrapping problem. The first approach is regression-based [8,21], where the wrapped phase serves as the input, and the CNN directly predicts the true phase value for each pixel. This approach achieves excellent performance while minimizing computational time through the direct inference of the true phase. While training has required large amounts of training data, the method proposed in [8] achieves excellent performance with small ones. The second approach is semantic segmentation-based [7,20,22,23,24], and involves inferring the wrap count for each pixel and subsequently calculating the true phase. Specifically, the segmentation-based approach determines the wrap count, an unknown integral multiple of added to each pixel of the wrapped phase, and recovers the true phase based on Equation (1). In this approach, when a pixel is misclassified, the error for that pixel will be at least or more. CNN-based models demonstrate robust performance even in noisy environments and outperform traditional methods that are less effective under such conditions.
Phase unwrapping involves the estimation of the true phase based on the wrapped phase, and achieving accurate unwrapping necessitates the consideration of spatial continuity and global relationships among the pixels. Conventional CNN-based methods employ repeated convolutions with relatively small kernels for feature extraction. Although these methods excel in terms of localization robustness, they disregard local location information and pixel relationships during the convolution process. To address this problem, we propose a CNN-based feature extraction method that considers phase continuity and global relationships.
In this study, we propose a new module called the spatial relation awareness module (SRAM) that combines a global convolution network (GCN) [25], which applies a convolution layer with a kernel size equivalent to that of the feature maps, and CoordConv [26], which strengthens the consideration of the positional relationships between pixels. Figure 1 illustrates the integration of SRAM and the CNN-based architecture utilized in this study. SRAM is specifically applied to the skip connection of the encoder–decoder model, imparting global features to the decoder that considers the pixel positional relationships crucial for effective phase unwrapping.
The key contributions of this study are as follows:
- We demonstrated that the performance of phase unwrapping can be improved by applying the proposed module SRAM, which takes into account the continuity of phase and the relationships between pixels, to the encoder–decoder model.
- The SRAM proposed in this study is easy to implement, highly reusable, and can be applied to a wide range of encoder–decoder models.
- In terms of the performance of phase unwrapping on wrapped phases containing noise, the proposed method achieved a 4.98% improvement in normalized root mean square error (NRMSE) compared to the conventional method, quality-guided phase unwrapping (QGPU) [9]. Furthermore, it outperformed the CNN-based method, spatial quad-directional long short term memory (SQD-LSTM) [8], by 0.65%.
2. Related Work
This section describes the general phase unwrapping methods.
2.1. Quality-Guided Phase Unwrapping Algorithm
QGPU [10,11] is a traditional method of phase unwrapping. QGPU consists of two main steps: computing the reliability value and creating an unwrapping path. The reliability value is a metric calculated based on the differences between the target pixel and its neighboring pixels, using the second difference between orthogonally and diagonally adjacent pixels. Initially, the second difference D for the pixel within a window is calculated using the following equation:
where are the coordinates given in the phase image, are the horizontal and vertical directions, respectively, and are the differences in the diagonal components. is an unwrapping operation that adds or subtracts phase jumps, and is the phase value. Next, the confidence level was calculated based on the differences in the windows using the following equation:
In the initial state, each pixel in the phase image is considered to belong to no group, and the reliability of an edge is calculated by summing the reliabilities of the two adjacent pixels, as shown in Figure 2 Then, all the edge reliabilities are sorted, and the phase unwrapping process starts from the two adjacent pixels with the highest edge reliability.
2.2. CNN Approach
There has been considerable research on methods using CNNs, which are faster and more robust to noise than conventional methods. Refs. [7,22,23,27] consider phase unwrapping as a segmentation task and employ methods such as SegNet [28], DeepLabV3+ [24], and UNet [20] to infer the wrap count of each pixel. The ground truth of the wrap count can be expressed as
where and represent the true and wrapped phase values, respectively, at pixel . Function denotes the operation of rounding a value.
The approaches proposed in [8,21] consider phase unwrapping as a regression task to directly estimate the true phase from the wrapped phase. As a regression task, this formulation typically involves selecting the mean squared error (MSE) as the loss function. However, according to [8], the use of the MSE loss leads to poor convergence during training and degradation of the phase-unwrapping performance. This is because it is possible to generate the same wrapped phase from multiple true phases , making the MSE loss, which aims for a unique solution, unsuitable for phase-unwrapping tasks that do not possess a unique solution. Therefore, in [8], a loss function was designed to enhance the similarity between the predicted phase and the true phase , while allowing for other solutions during convergence as follows:
where and represent the weights assigned to each loss function and denotes the expectation value. The variance of the error loss, denoted by , enables the learning of multiple alternative solutions, whereas the total variation in the error loss, denoted by , increases as the similarity between and improves by forcing the network to match the gradients of and .
Furthermore, in [8], a CNN incorporating SQD-LSTM module was introduced as a remedy for phase unwrapping, addressing the challenges through regression tasks. It has been reported that incorporating SQD-LSTM into the bottleneck of the encoder–decoder model improves the performance of phase unwrapping. The architecture of the SQD-LSTM is illustrated in Figure 3. The SQD-LSTM module employs four distinct LSTMs [29] to extract spatial relationships in four directions (specifically, left-to-right, right-to-left, top-to-bottom, and bottom-to-top) from the encoded features. The four features obtained from each direction are represented as , , , and , respectively. The SQD-LSTM facilitates the recovery of a continuous true phase by learning the spatial relationships of features.
However, global features can be lost during the process from the input layer to the bottleneck layer. To address this issue, we introduced a novel skip connection to complement the lost global features.
3. Proposed Method
The proposed method employs a regression approach that directly infers the true phase in an encoder–decoder model. The architecture of the proposed method is illustrated in Figure 1.
In conventional CNNs, as the convolution process is repeated, local positional information and pixel relationships are discarded. However, it is crucial to consider the relationships between pixels for phase unwrapping. In our proposed method, we apply an SRAM to skip connections between the encoder and the decoder. This SRAM incorporates GCN [25] and CoordConv [26] layers to preserve pixel positional information, thereby considering the relationships between pixels during phase unwrapping.
We have provided a detailed description of the architecture used in this study. To capture the global spatial dependencies, we adopted the SQD-LSTM module proposed in [8] at the connection point (bottleneck) between the encoder and decoder. However, even with the SQD-LSTM module at the bottleneck, as the convolution and pooling operations are repeated in the encoder, global spatial dependencies can be lost in the process. To address this issue, we employed SRAM in skip connections that transferred the features extracted from the encoder to the corresponding resolution in the decoder.
SRAM is a module that combines a GCN, which performs convolution using kernels of the same size as the input, with CoordConv to retain positional information. This combination enables the learning of specific spatial structures within the phase images. CoordConv is a simple extension of the input feature map of the convolution layer, which can be realized by adding two channels: in the vertical (i coordinate channel) and horizontal directions (j coordinate channel). Figure 4 shows an overview of CoordConv. Specifically, for a feature map of height h and width w, the i-coordinate channel has the same size as the feature map, with its first row filled with 0, the second row filled with 1, and the third row filled with 2. The j-coordinate channels are similar, with columns filled with constant values instead of rows. Finally, linear scaling is applied such that the i and j coordinate values fall within the range . Reference [26] also proposes a pattern of adding a channel whose location information is the distance from the center of the image, but the proposed method uses a simple coordinate channel. The implementation of SRAM is simple and can be applied to any network in the encoder–decoder models.
4. Results
This section describes the validation results that demonstrate the effectiveness of the proposed method.
4.1. Data Generation
For this validation, the phase data were generated using a mixed Gaussian distribution, following an approach similar to that in [8]. The dataset used in this study consists of a synthetic phase image containing random shapes and a corresponding wrapped phase image, which is realized by adding and subtracting multiple Gaussian distributions with different shapes and positions. The formula for generating a phase image is expressed as
where x and y represent the spatial coordinates of the pixels. , , and C are lamp phase parameters, each with random gradients and shifts. This can be expressed as follows:
and . Here, represents real numbers, and represents natural numbers. N denotes the number of Gaussian distributions generated within a single-phase image and ranges from . A represents the weight of a Gaussian distribution with . and are the mean and standard deviation of the Gaussian distribution, respectively, with and . By combining the Gaussian distributions, we generated phase images of irregular and arbitrary shapes. Furthermore, we incorporated lamp phases with randomly selected gradients in the vertical and horizontal directions.
A noisy image is generated by introducing Gaussian noise with a arbitrary signal-to-noise ratio () to a noise-free image. The formula for calculating () is expressed as
where and represent signal-power and noise-power. represents the ratio of signal to noise, and is expressed in decibels (). In this experiment, we set to 1.0 and calculated using
which is a rearrangement of Equation (13). Next, Gaussian noise with mean 0 and variance 1, scaled by the calculated , is added to the noise-free image to generate a noise image. As evident from Equation (14), lower values correspond to higher noise-power.
4.2. Implementation Details
A GeForce RTX 3070 graphics card was used. We used TensorFlow version 2.5.0 and CUDA version 11.2 to implement the proposed method. The proposed method was implemented based on [8]. The SRAM and boundary refinement (BR) were used for skip connections to pass the features directly from the encoder to the decoder. The BR is a simple module consisting of several convolutional layers applied to refine the object boundary information proposed by the GCN in [25]. The parameters related to the model structure are presented in Figure 1.
The size of the input layer was pixels with 1 channel grayscale image. Equation (9) was used as the loss function, and the hyperparameters and were set to 0.1 and 1.0, respectively, following [8]. The batch size was set to eight, and ADAM [30] was employed as the optimization function. The learning rate was set to , , , epoch = 100.
4.3. Quantitative Evaluation
This section describes the results of the phase unwrapping performance verification. The data used for the validation were generated according to Equation (12), and the size of the phase images was pixels. We created two datasets comprising 2000 phase images. One of these datasets was randomly assigned additive Gaussian noise levels of 0, 5, 10, 20, and 60 dB before wrapping to simulate the noise commonly encountered in real-world wrapped-phase images. This dataset was labeled as the “Noisy” dataset, while the other clean dataset was labeled as the “Noise Free” dataset. Both datasets were split into 1000 images each for the training and test data. Table 1 lists the details of these datasets.
The following model was used to demonstrate the effectiveness of the proposed method:
- SRAM (Ours): a proposed CNN model employing SRAM for skip connection.
- −CoordConv: An ablation model that removes CoordConv [26] from the proposed SRAM. In other words, a model in which only GCNs are applied to skip connections.
- −GCN: An ablation model that removes GCN [25] from the proposed SRAM. In other words, a model in which only CoordConv is applied to skip connections.
In this validation, we have employed early stopping based on the validation loss to prevent overfitting the training data. The training loss curves for each model are shown in Figure 5. Inset (a) shows that in the early stages of training, the SQD-LSTM with the fewest parameters steadily reduces the loss. Conversely, inset (b) represents the second half of training, showing that our proposed SRAM achieves the lowest loss.
The NRMSE was used as a quantitative measure of phase unwrapping. The NRMSE is defined by
where and are the max value and min value of the true phase . Table 2 lists the performance evaluation results for the trained models on the noisy dataset, calculating the NRMSE for the noisy and noise-free test datasets. The average NRMSE values for each model, trained five times with different initial weight parameters, are presented.
For the processing time, we used the noisy dataset, noise-free dataset, and dataset generated with a noise level of 0 dB; inferred 1000 images for each dataset; and calculated the average inference processing time per image.
The QGPU achieved perfect phase unwrapping for a noise-free dataset. However, significant performance degradation was observed for the noisy dataset. The proposed method improved the performance on both datasets by applying SRAM, thereby demonstrating its robustness against noise. We also evaluated the performance of the proposed method using a model that removed CoordConv and GCN as the ablation dies. The results showed that the performance of both ablation models decreased, indicating that the combination of CoordConv and GCN enhanced their ability to account for pixel continuity and global relationships. The computation time for the QGPU was 12∼14 ms for both the noisy and noise-free datasets. In contrast, the CNN models required 42∼45 ms to process the noisy and noise-free datasets. However, CNN models have a constant computation time independent of the input data. In contrast, the QGPU was highly influenced by the noise level of the inferred images, resulting in a computation time of ms per image for data with a noise level of 0 dB. The proposed method is based on the SQD-LSTM model with the addition of SRAM, which slightly increases the computational cost of the added network. The computation time of the proposed method is independent of the input data and is robust to noise, indicating that it is a practical method.
Next, to comprehensively evaluate the robustness of each model against noise, we created 200 noise-free original images and generated datasets by adding 0, 5, 10, 15, 20, and 25 dB of noise to them. This enabled the creation of validation datasets with varying noise levels, derived from the same source images. Using the models trained on the noisy dataset, we evaluated the performance on the generated datasets. The results are listed in Table 3, and the resulting images of phase unwrapping for each model are presented in Figure 6, while the NRMSE values for each noise level are displayed graphically in Figure 7.
QGPU exhibited significantly lower performance when dealing with data with strong noise levels of 0 and 5 dB. Compared with other methods, including ablation models, the proposed method achieves high-precision phase unwrapping across a wide range of noise levels, demonstrating its high robustness against noise.
As a supplementary experiment, a model trained on a noise-free dataset was used to verify the response to noise in a manner similar to the experiment described above. The results are listed in Table 4 and Figure 8 and Figure 9. Note that the QGPU results are the same as those in Table 3 and Figure 6 and Figure 7, which are the results of training on the Noisy dataset.
When CNN models are not trained on noisy images, their performance in the phase unwrapping of data containing noise is lower. This aligns with intuitive expectations and confirms the importance of training noisy data. The proposed method shows a higher performance than SQD-LSTM, even though it is trained on a noise-free dataset. This is believed to be a result of the GCN and CoordConv in the SRAM functioning effectively, learning pixel continuity, and global spatial dependencies.
5. Discussion
The proposed SRAM method is considered to have improved the phase-unwrapping performance as a result of training the global pixel-to-pixel relationship. SRAM introduces CoordConv to preserve the positional relationships between pixels. However, the insertion layers where CoordConv is the most effective, such as the convolution layer closest to the input layer and the encoding process, need to be carefully verified.
The SRAM uses a GCN internally. An intuitive understanding of the role of the GCN is to perform convolution using kernels of the same size as the input feature maps () for feature extraction considering global pixel relationships. However, instead of handling kernels of the same size as the input feature maps (), convolution is performed using two kernels, () and (), and the results are added to produce the feature maps. This reduces the number of computational steps compared with using the () kernel, which is advantageous in terms of speed. The GCN was also applied to a general image segmentation task in [25], and it was confirmed that the () kernel exhibited performance degradation, possibly due to overlearning caused by the increase in parameters. We expect to see a similar trend in the phase-unwrapping task as well.
The SRAM is a module designed to train global features, and can be easily applied to encoder–decoder models. The effective handling of global features is crucial not only in the phase-unwrapping task, but also in tasks such as segmentation, reconstruction, and image generation. In fact, Ref. [25] demonstrated the use of a GCN to improve segmentation models, and Ref. [26] reported performance enhancement in image generation models using CoordConv. In this study, a dataset was generated using a simulator and subsequently validated. To demonstrate the practical applicability of the proposed method, we aimed to further validate it using measured data obtained from optical experiments in real-world scenarios. In addition, we have focused primarily on the validation of smooth phases, such as cell data. However, for practical applications, it is crucial to investigate the effect on phases with discontinuities, such as industrial products. In future work, we will verify whether the preservation of global pixel relationships by SRAM can perform discontinuous phase unwrapping.
As shown by the validation in this study, deep learning can create models with high robustness by learning a large amount of data. Preparing large amounts of real data is time-consuming and expensive. Therefore, we aim to explore a more practical scheme by utilizing domain adaptation [33], which involves pretraining using a large amount of data from simulated domains and optimization of real-world domain data, taking into consideration operational considerations.
6. Conclusions
Phase unwrapping is the task of estimating the true phase from the wrapped phase, and it is used in various practical fields to measure physical quantities such as mutations and surface topography. Various phase unwrapping methods have been proposed. Among these, CNN-based methods have been extensively researched in recent years because of their high robustness against noise and fast inference speeds.
However, conventional CNN-based methods discard local position information and pixel relationships in the convolution process. Therefore, we designed a CNN-based feature extraction module that considers phase continuity and global relationships. We propose a new module called the SRAM, which combines a GCN that applies a convolution layer with a kernel size equivalent to the feature map size and CoordConv, which strengthens the consideration of positional relationships among pixels. SRAM applies to the skip connection of encoder–decoder models and provides the decoder with global features that consider pixel–positional relationships that are useful for phase unwrapping.
We evaluated the performance of the proposed method against QGPU, which is a non-deep learning phase-unwrapping method, and SQD-LSTM, which is a CNN-based method that performs better than PhaseNet 2.0, which is a classical CNN-based method. The proposed method exhibited high performance on noisy and noise-free datasets and high robustness against noise. The inference speed of the proposed method is comparable to that of the SQD-LSTM, with a slight increase owing to the addition of SRAM. SRAM is simple to implement and can be applied to encoder–decoder style architectures; thus, it has a wide range of applications.
Author Contributions
Conceptualization, C.A.; methodology, C.A.; software; validation, C.A.; formal analysis, C.A. and T.S.; investigation, C.A. and T.S.; resources, C.A.; data curation, C.A.; writing—original draft preparation C.A.; writing—review and editing, C.A., T.S. and T.I.; visualization, C.A.; supervision, T.S.; project administration, T.S.; funding acquisition, T.S. and T.I. All authors have read and agreed to the published version of the manuscript.
Funding
This work was supported by IAAR Research Support Program, Chiba University, Japan.
Institutional Review Board Statement
Not applicable.
Informed Consent Statement
Not applicable.
Data Availability Statement
The data that support the findings of this study are available from the corresponding author, T.S., upon reasonable request.
Conflicts of Interest
Chiori Azuma was employed by the company Computermind Corp. The remaining authors declare that the research was conducted in the absence of any commercial or financial relationships that could be construed as a potential conflict of interest.
References
- Dong, J.; Liu, T.; Chen, F.; Zhou, D.; Dimov, A.; Raj, A.; Cheng, Q.; Spincemaille, P.; Wang, Y. Simultaneous phase unwrapping and removal of chemical shift (SPURS) using graph cuts: Application in quantitative susceptibility mapping. IEEE Trans. Med. Imaging 2014, 34, 531–540. [Google Scholar] [CrossRef]
- Goldstein, R.M.; Zebker, H.A.; Werner, C.L. Satellite radar interferometry: Two-dimensional phase unwrapping. Radio Sci. 1988, 23, 713–720. [Google Scholar] [CrossRef]
- Gorthi, S.S.; Rastogi, P. Fringe projection techniques: Whither we are? Opt. Lasers Eng. 2010, 48, 133–140. [Google Scholar] [CrossRef]
- Waghmare, R.G.; Sukumar, P.R.; Subrahmanyam, G.S.; Singh, R.K.; Mishra, D. Particle-filter-based phase estimation in digital holographic interferometry. J. Opt. Soc. Am. A 2016, 33, 326–332. [Google Scholar] [CrossRef] [PubMed]
- Itoh, K. Analysis of the phase unwrapping algorithm. Appl. Opt. 1982, 21, 2470. [Google Scholar] [CrossRef] [PubMed]
- Ghiglia, D.C.; Pritt, M.D. Two-Dimensional Phase Unwrapping: Theory, Algorithms, and Software, 1st ed.; Wiely-Interscience: Hoboken, NJ, USA, 1998. [Google Scholar]
- Spoorthi, G.; Gorthi, R.K.S.S.; Gorthi, S. PhaseNet 2.0: Phase unwrapping of noisy data based on deep learning approach. IEEE Trans. Image Process. 2020, 29, 4862–4872. [Google Scholar] [CrossRef]
- Perera, M.V.; De Silva, A. A joint convolutional and spatial quad-directional LSTM network for phase unwrapping. In Proceedings of the ICASSP 2021—2021 IEEE International Conference on Acoustics, Speech and Signal Processing (ICASSP), Toronto, ON, Canada, 6–11 June 2021; pp. 4055–4059. [Google Scholar]
- Lei, H.; Chang, X.Y.; Wang, F.; Hu, X.T.; Hu, X.D. A novel algorithm based on histogram processing of reliability for two-dimensional phase unwrapping. Optik 2015, 126, 1640–1644. [Google Scholar] [CrossRef]
- Zhao, M.; Huang, L.; Zhang, Q.; Su, X.; Asundi, A.; Kemao, Q. Quality-guided phase unwrapping technique: Comparison of quality maps and guiding strategies. Appl. Opt. 2011, 50, 6214–6224. [Google Scholar] [CrossRef] [PubMed]
- Herráez, M.A.; Burton, D.R.; Lalor, M.J.; Gdeisat, M.A. Fast two-dimensional phase-unwrapping algorithm based on sorting by reliability following a noncontinuous path. Appl. Opt. 2002, 41, 7437–7444. [Google Scholar] [CrossRef]
- Huang, Q.; Zhou, H.; Dong, S.; Xu, S. Parallel branch-cut algorithm based on simulated annealing for large-scale phase unwrapping. IEEE Trans. Geosci. Remote Sens. 2015, 53, 3833–3846. [Google Scholar] [CrossRef]
- Pritt, M.D.; Shipman, J.S. Least-squares two-dimensional phase unwrapping using FFT’s. IEEE Trans. Geosci. Remote Sens. 1994, 32, 706–708. [Google Scholar] [CrossRef]
- LeCun, Y.; Bengio, Y.; Hinton, G. Deep learning. Nature 2015, 521, 436–444. [Google Scholar] [CrossRef]
- Hinton, G.; Deng, L.; Yu, D.; Dahl, G.E.; Mohamed, A.r.; Jaitly, N.; Senior, A.; Vanhoucke, V.; Nguyen, P.; Sainath, T.N.; et al. Deep neural networks for acoustic modeling in speech recognition: The shared views of four research groups. IEEE Signal Process. Mag. 2012, 29, 82–97. [Google Scholar] [CrossRef]
- Krizhevsky, A.; Sutskever, I.; Hinton, G.E. Imagenet classification with deep convolutional neural networks. Adv. Neural Inf. Process. Syst. 2012, 25. [Google Scholar]
- Vaswani, A.; Shazeer, N.; Parmar, N.; Uszkoreit, J.; Jones, L.; Gomez, A.N.; Kaiser, Ł.; Polosukhin, I. Attention is all you need. Adv. Neural Inf. Process. Syst. 2017, 30. [Google Scholar]
- LeCun, Y.; Bengio, Y. Convolutional networks for images, speech, and time series. Handb. Brain Theory Neural Netw. 1995, 3361, 1995. [Google Scholar]
- Pohlen, T.; Hermans, A.; Mathias, M.; Leibe, B. Full-resolution residual networks for semantic segmentation in street scenes. In Proceedings of the IEEE Conference on Computer Vision and Pattern Recognition, Honolulu, HI, USA, 21–26 July 2017; pp. 4151–4160. [Google Scholar]
- Ronneberger, O.; Fischer, P.; Brox, T. U-net: Convolutional networks for biomedical image segmentation. In Proceedings of the International Conference on Medical Image Computing and Computer-Assisted Intervention, Munich, Germany, 5–7 October 2015; Springer: Cham, Switzerland, 2015; pp. 234–241. [Google Scholar]
- Wang, K.; Li, Y.; Kemao, Q.; Di, J.; Zhao, J. One-step robust deep learning phase unwrapping. Opt. Express 2019, 27, 15100–15115. [Google Scholar] [CrossRef]
- Zhang, T.; Jiang, S.; Zhao, Z.; Dixit, K.; Zhou, X.; Hou, J.; Zhang, Y.; Yan, C. Rapid and robust two-dimensional phase unwrapping via deep learning. Opt. Express 2019, 27, 23173–23185. [Google Scholar] [CrossRef]
- Zhang, J.; Tian, X.; Shao, J.; Luo, H.; Liang, R. Phase unwrapping in optical metrology via denoised and convolutional segmentation networks. Opt. Express 2019, 27, 14903–14912. [Google Scholar] [CrossRef]
- Chen, L.C.; Zhu, Y.; Papandreou, G.; Schroff, F.; Adam, H. Encoder-decoder with atrous separable convolution for semantic image segmentation. In Proceedings of the European Conference on Computer Vision (ECCV), Munich, Germany, 8–14 September 2018; pp. 801–818. [Google Scholar]
- Peng, C.; Zhang, X.; Yu, G.; Luo, G.; Sun, J. Large kernel matters–improve semantic segmentation by global convolutional network. In Proceedings of the IEEE Conference on Computer Vision and Pattern Recognition, Honolulu, HI, USA, 21–26 July 2017; pp. 4353–4361. [Google Scholar]
- Liu, R.; Lehman, J.; Molino, P.; Petroski Such, F.; Frank, E.; Sergeev, A.; Yosinski, J. An intriguing failing of convolutional neural networks and the coordconv solution. Adv. Neural Inf. Process. Syst. 2018, 31. [Google Scholar]
- Xie, X.; Tian, X.; Shou, Z.; Zeng, Q.; Wang, G.; Huang, Q.; Qin, M.; Gao, X. Deep learning phase-unwrapping method based on adaptive noise evaluation. Appl. Opt. 2022, 61, 6861–6870. [Google Scholar] [CrossRef]
- Badrinarayanan, V.; Kendall, A.; Cipolla, R. Segnet: A deep convolutional encoder-decoder architecture for image segmentation. IEEE Trans. Pattern Anal. Mach. Intell. 2017, 39, 2481–2495. [Google Scholar] [CrossRef]
- Hochreiter, S.; Schmidhuber, J. Long short-term memory. Neural Comput. 1997, 9, 1735–1780. [Google Scholar] [CrossRef]
- Kingma, D.P.; Ba, J. Adam: A method for stochastic optimization. arXiv 2014, arXiv:1412.6980. [Google Scholar]
- Available online: https://docs.opencv.org/3.4/df/d3a/group__phase__unwrapping.html (accessed on 15 January 2024).
- Available online: https://github.com/Laknath1996/DeepPhaseUnwrap/ (accessed on 15 January 2024).
- Azuma, C.; Ito, T.; Shimobaba, T. Adversarial domain adaptation using contrastive learning. Eng. Appl. Artif. Intell. 2023, 123, 106394. [Google Scholar] [CrossRef]
Figure 1.
Overview of our proposed spatial relation awareness module (SRAM). (a) shows the structure of the CNN architecture applying the SRAM used in this verification, and (b,c) show information on the detailed structure of the SRAM. For (a), the number of channels in each convolutional block is indicated above it, and the number of channels in each transposed convolution layer is indicated below it.

Figure 2.
Overview of the calculation of QGPU. (a) shows the calculation of reliability and (b) shows the calculation of edge reliability.
Figure 2.
Overview of the calculation of QGPU. (a) shows the calculation of reliability and (b) shows the calculation of edge reliability.
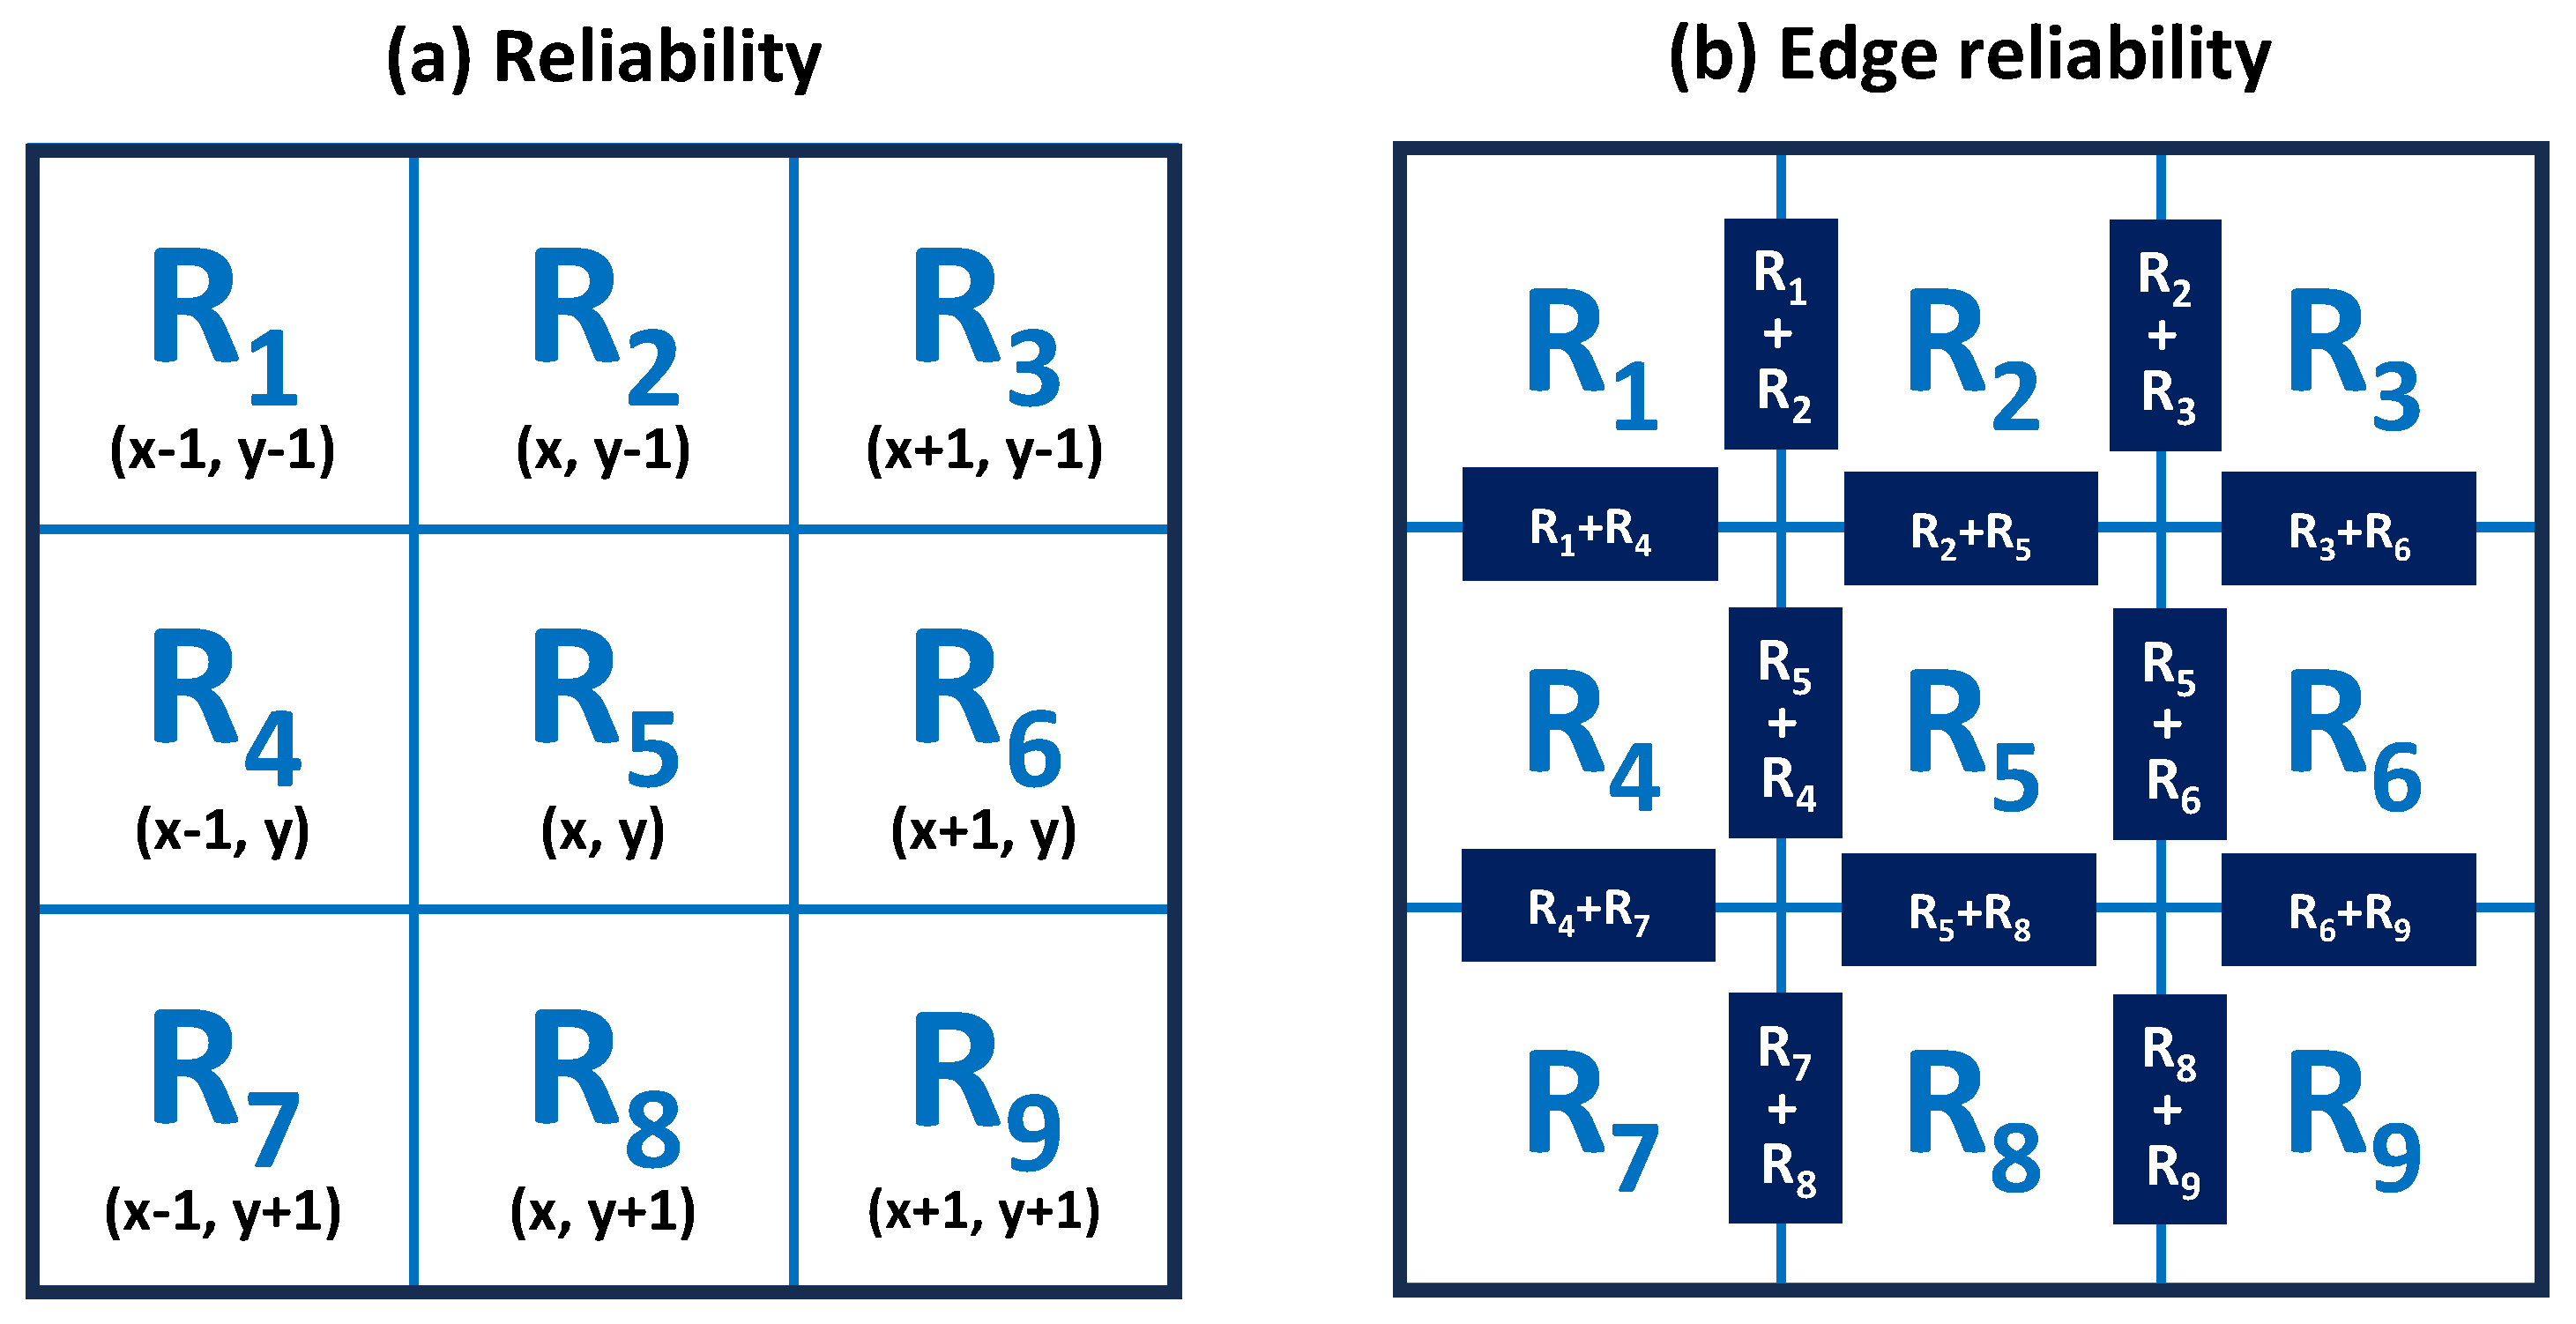
Figure 3.
Overview of SQD-LSTM module [8], which utilizes four LSTMs to learn the spatial relationships of features.
Figure 3.
Overview of SQD-LSTM module [8], which utilizes four LSTMs to learn the spatial relationships of features.
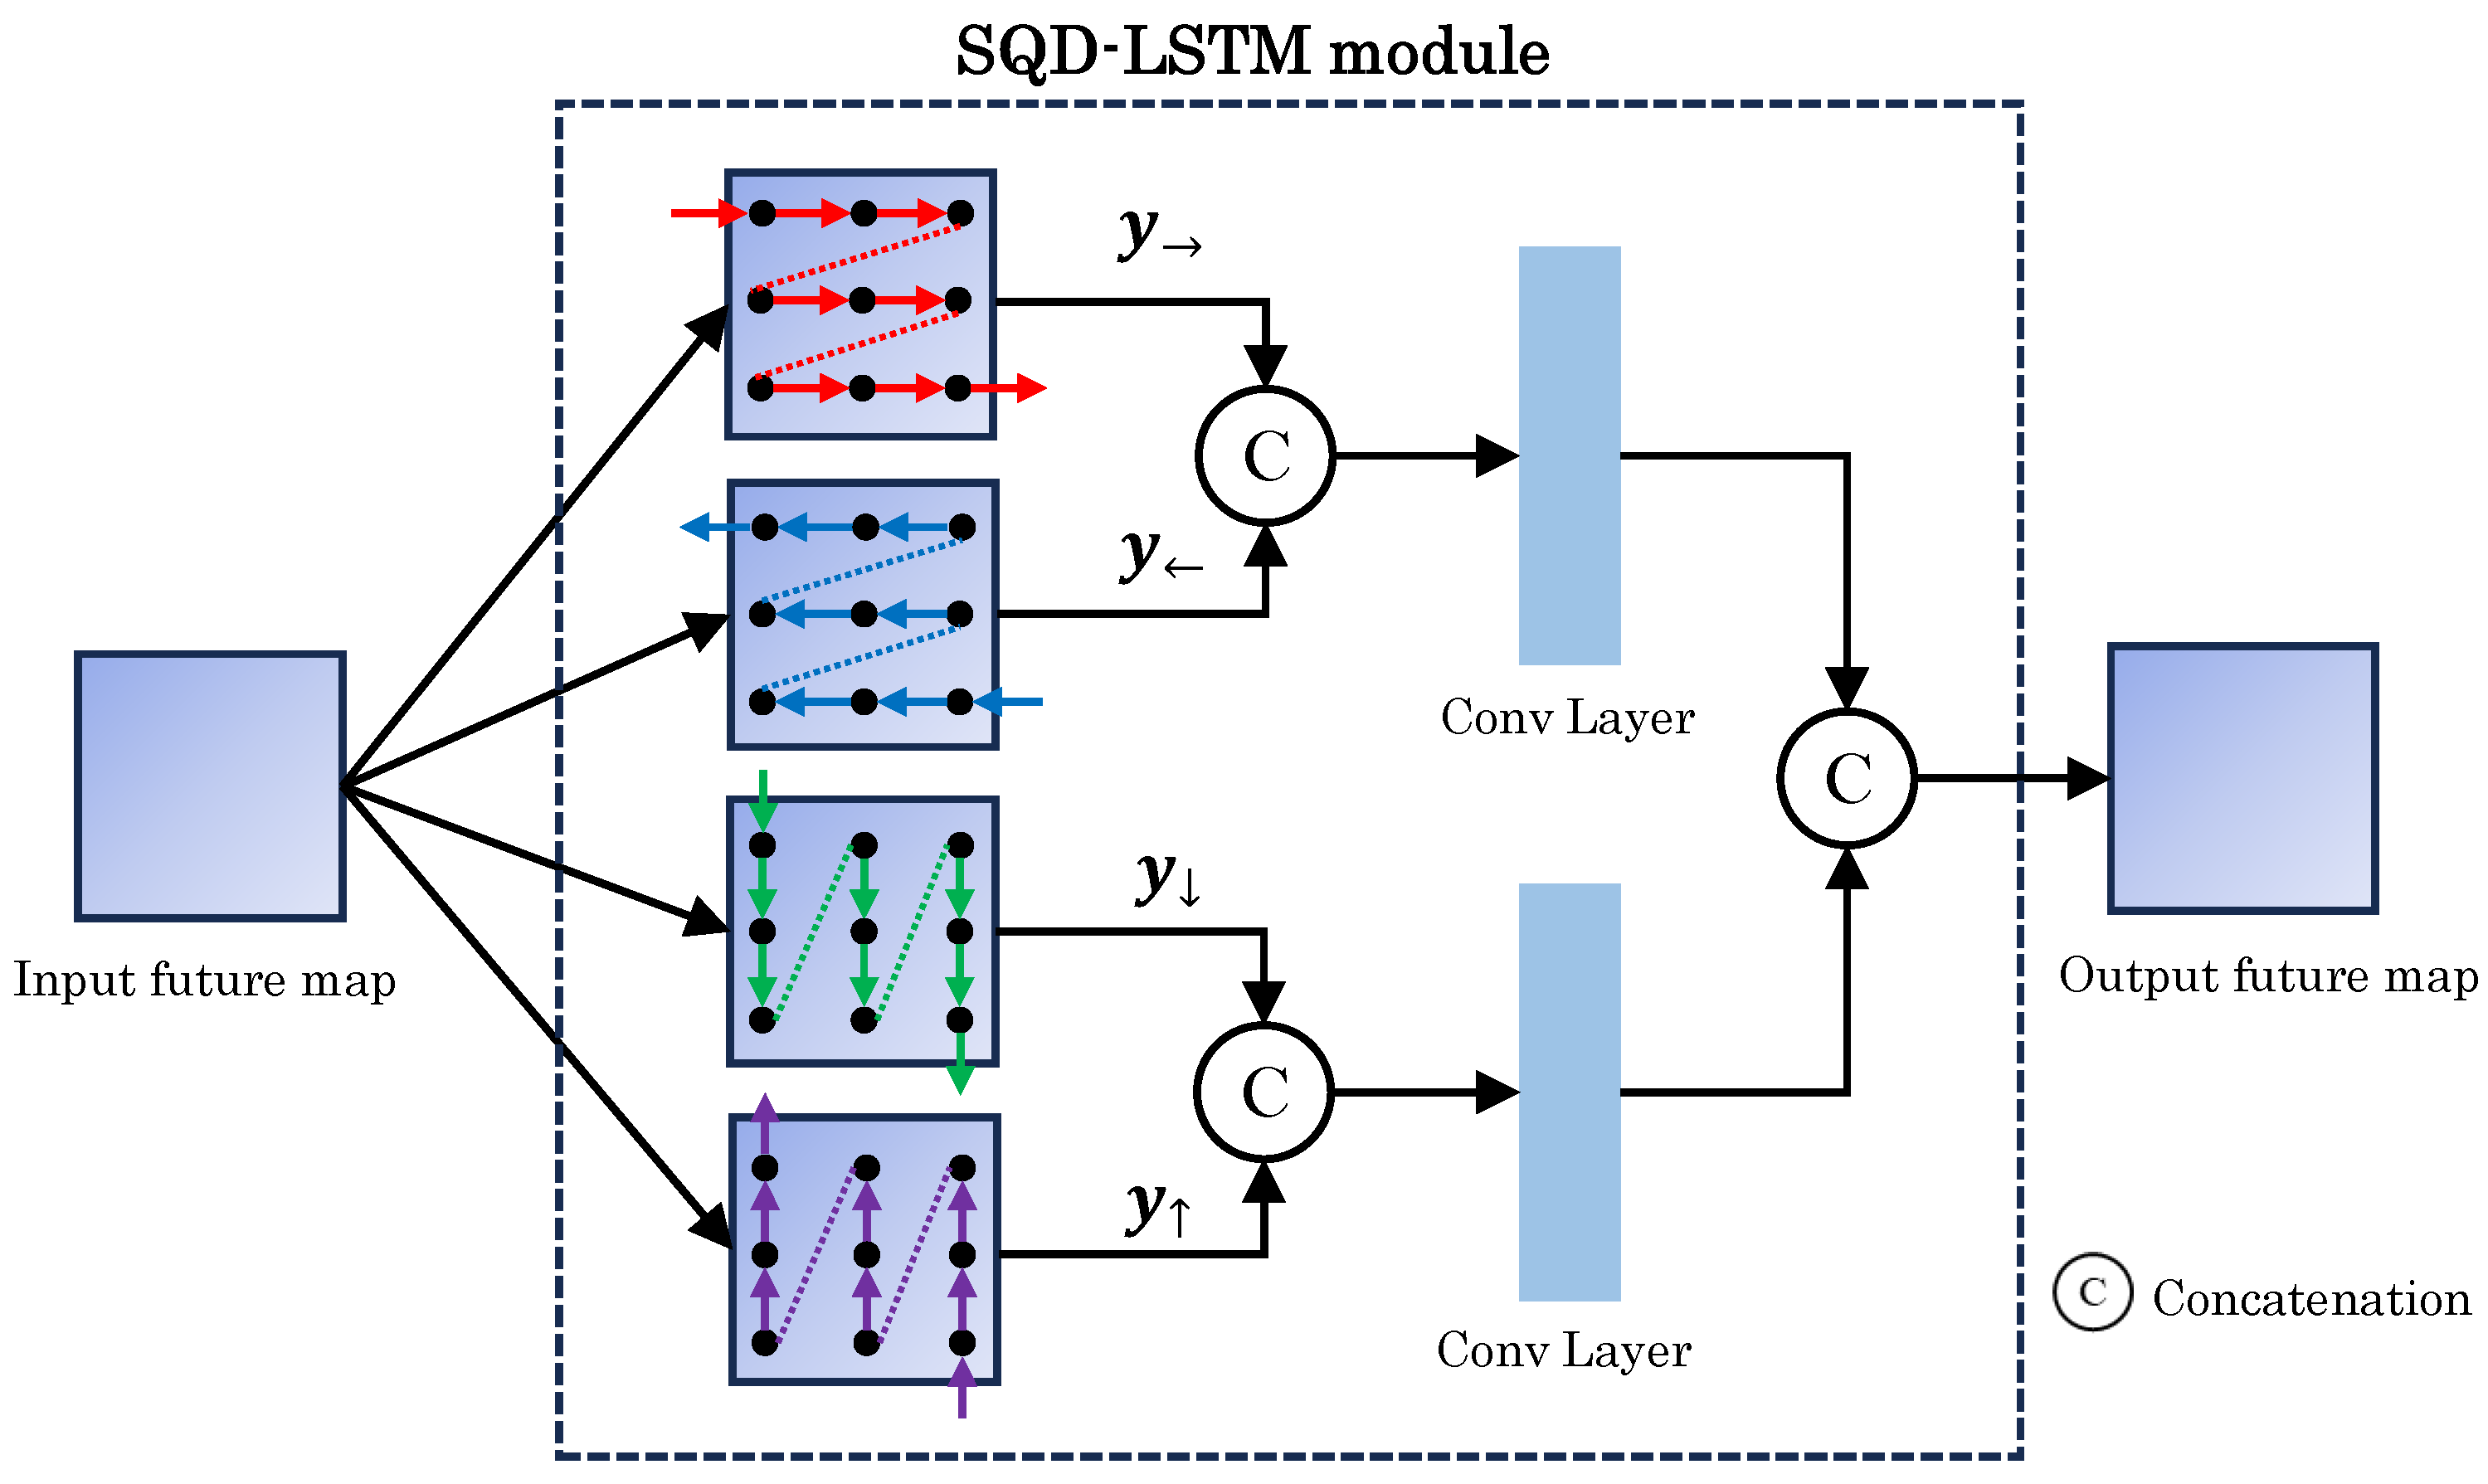
Figure 4.
Overview of the CoordConv [26].
Figure 4.
Overview of the CoordConv [26].

Figure 5.
Graphs of training loss for each model trained on the noisy dataset. The inset graph (a) has been enlarged to the range of epoch from 0 to 10, and training loss up to 6, the inset (b) has been enlarged to the range of epoch from 40 to 70 and training loss up to 0.5, allowing for a detailed examination of the data.

Figure 6.
The resulting images of phase unwrapping for each model trained on the Noisy dataset.
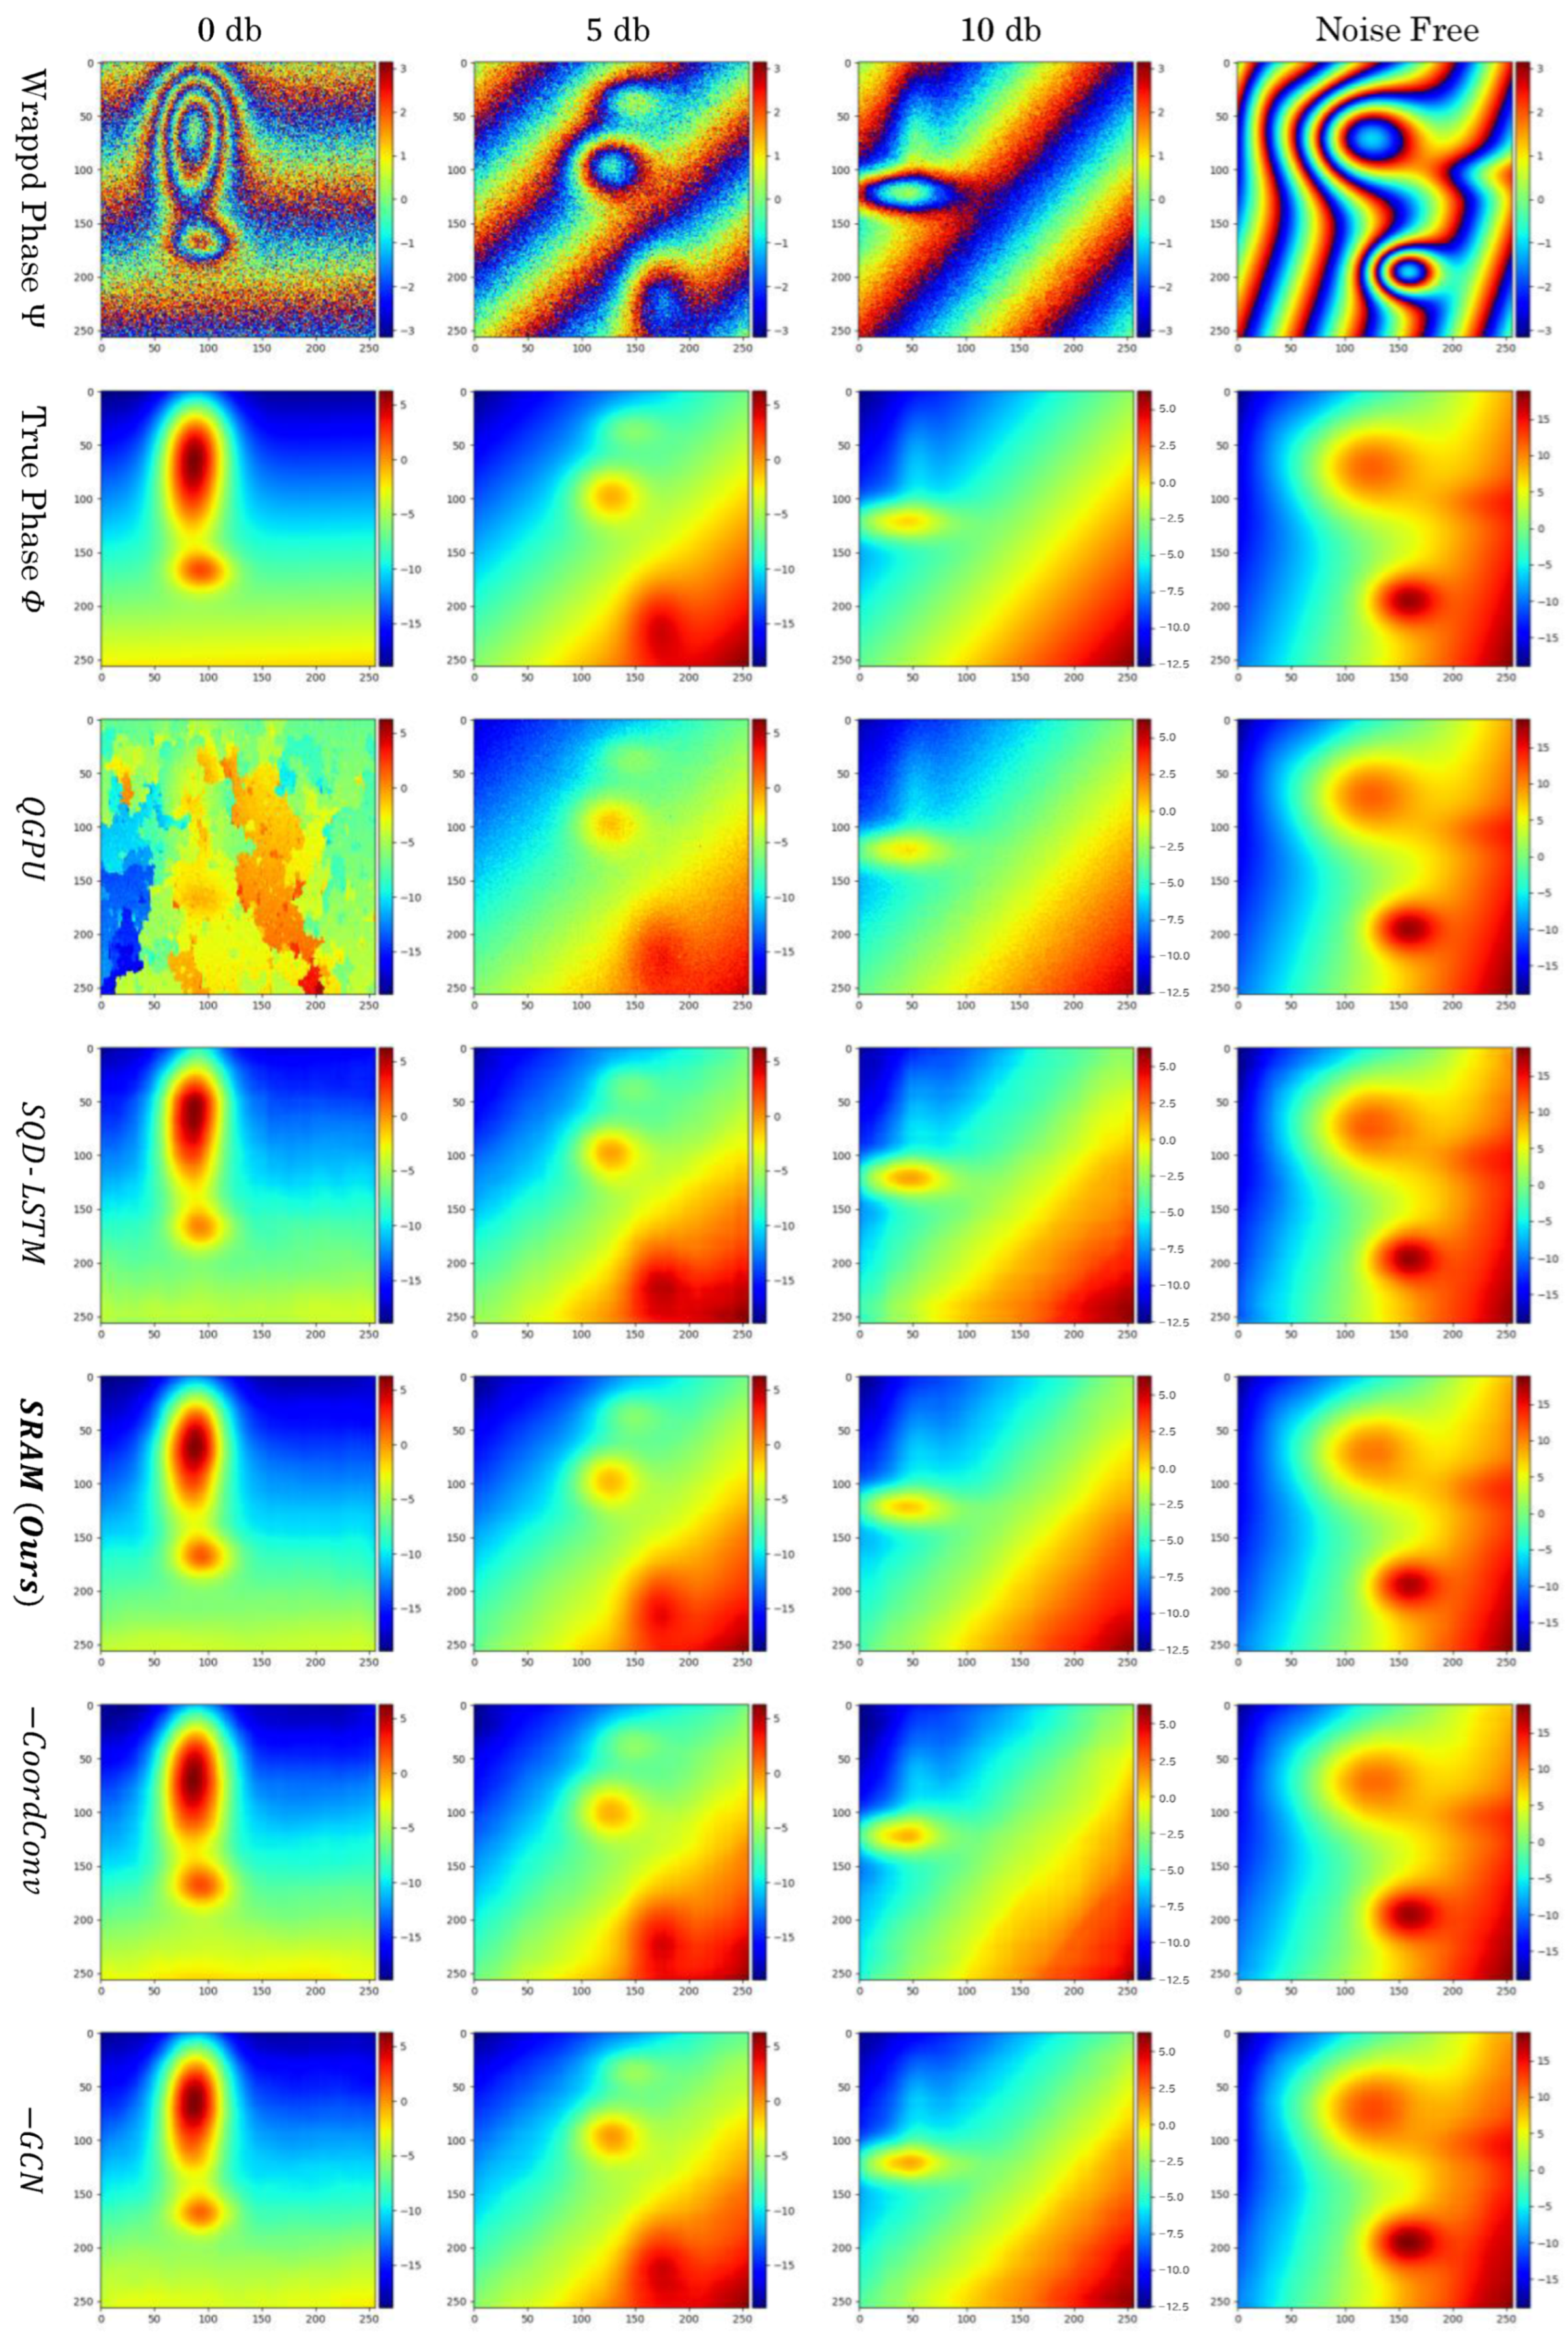
Figure 7.
NRMSE at different noise levels using Noisy models (w/o QGPU). The results of QGPU are not depicted in the graph because the range of RMSE values differs from other methods, but detailed information is provided in Table 3.
Figure 7.
NRMSE at different noise levels using Noisy models (w/o QGPU). The results of QGPU are not depicted in the graph because the range of RMSE values differs from other methods, but detailed information is provided in Table 3.

Figure 8.
The resulting images of phase unwrapping for each model trained on the noise-free dataset.
Figure 8.
The resulting images of phase unwrapping for each model trained on the noise-free dataset.

Figure 9.
NRMSE at different noise levels using the noise-free models. The inset graph has been enlarged to the range of noise levels from 10 to 25 dB and NRMSE up to 6%, allowing for a detailed examination of the data.
Figure 9.
NRMSE at different noise levels using the noise-free models. The inset graph has been enlarged to the range of noise levels from 10 to 25 dB and NRMSE up to 6%, allowing for a detailed examination of the data.


Table 1.
Details of the dataset used to evaluate the performance of phase unwrapping.
| Dataset | Noise (dB) | Number of Images | |
|---|---|---|---|
| Train | Test | ||
| Noisy | [0, 5, 10, 20, 60] | 1000 | 1000 |
| Noise Free | None | 1000 | 1000 |
Table 2.
Performance evaluation (NRMSE) results using the noisy/noise free datasets.
| Method | NRMSE | Computational Time (ms) | |||
|---|---|---|---|---|---|
| Noise Free | Noisy | Noise Free | Noisy | 0 (dB) | |
| QGPU [9] | 0.00% | 7.08% | 12.33 | 14.68 | 243.12 |
| SQD-LSTM [8] | 2.19% | 2.75% | 42.26 | 42.60 | 42.22 |
| SRAM (Ours) | 1.65% | 2.10% | 44.86 | 45.05 | 44.81 |
| −CoordConv | 2.12% | 2.33% | 44.89 | 45.06 | 45.11 |
| −GCN | 1.87% | 2.39% | 42.18 | 42.37 | 42.03 |
Table 3.
Evaluating responsiveness (NRMSE) to noise using models trained on noisy dataset.
| Noise Level (dB) | ||||||
|---|---|---|---|---|---|---|
| 0 | 5 | 10 | 15 | 20 | 25 | |
| QGPU [9] | 25.56% | 4.50% | 1.81% | 0.91% | 0.54% | 0.27% |
| SQD-LSTM [8] | 3.96% | 2.73% | 2.66% | 2.41% | 2.70% | 2.44% |
| SRAM (Ours) | 2.32% | 1.90% | 1.92% | 1.86% | 1.96% | 1.86% |
| −CoordConv | 2.76% | 2.35% | 2.38% | 2.22% | 2.44% | 2.23% |
| −GCN | 3.18% | 2.71% | 2.73% | 2.46% | 2.75% | 2.47% |
Table 4.
Evaluating responsiveness (NRMSE) to noise using models trained on the noise-free dataset.
| Noise Level (dB) | ||||||
|---|---|---|---|---|---|---|
| 0 | 5 | 10 | 15 | 20 | 25 | |
| QGPU [9] | 25.56% | 4.50% | 1.81% | 0.91% | 0.54% | 0.27% |
| SQD-LSTM [8] | 33.90% | 28.81% | 7.28% | 2.70% | 2.54% | 2.46% |
| SRAM (Ours) | 24.42% | 9.81% | 3.79% | 2.02% | 1.59% | 1.38% |
| −CoordConv | 25.74% | 16.68% | 5.61% | 2.63% | 1.83% | 1.65% |
| −GCN | 26.25% | 13.72% | 4.27% | 2.55% | 2.15% | 1.84% |
Disclaimer/Publisher’s Note: The statements, opinions and data contained in all publications are solely those of the individual author(s) and contributor(s) and not of MDPI and/or the editor(s). MDPI and/or the editor(s) disclaim responsibility for any injury to people or property resulting from any ideas, methods, instructions or products referred to in the content. |
© 2024 by the authors. Licensee MDPI, Basel, Switzerland. This article is an open access article distributed under the terms and conditions of the Creative Commons Attribution (CC BY) license (https://creativecommons.org/licenses/by/4.0/).
Share and Cite
MDPI and ACS Style
Azuma, C.; Ito, T.; Shimobaba, T. Spatial Relation Awareness Module for Phase Unwrapping. Photonics 2024, 11, 175. https://doi.org/10.3390/photonics11020175
AMA Style
Azuma C, Ito T, Shimobaba T. Spatial Relation Awareness Module for Phase Unwrapping. Photonics. 2024; 11(2):175. https://doi.org/10.3390/photonics11020175
Chicago/Turabian StyleAzuma, Chiori, Tomoyoshi Ito, and Tomoyoshi Shimobaba. 2024. "Spatial Relation Awareness Module for Phase Unwrapping" Photonics 11, no. 2: 175. https://doi.org/10.3390/photonics11020175
Note that from the first issue of 2016, this journal uses article numbers instead of page numbers. See further details here.