Polarization-Based De-Scattering Imaging in Turbid Tissue-like Scattering Media


1
School of Physics and Information Technology, Shaanxi Normal University, Xi’an 710119, China
2
Xi’an Key Laboratory of Optical Information Manipulation and Augmentation, Xi’an 710119, China
3
Fundamentals Department, Air Force Engineering University, Xi’an 710051, China
*
Authors to whom correspondence should be addressed.
Photonics 2023, 10(12), 1374; https://doi.org/10.3390/photonics10121374
Submission received: 3 November 2023
/
Revised: 5 December 2023
/
Accepted: 12 December 2023
/
Published: 14 December 2023
(This article belongs to the Special Issue Optical Technology for Challenging Conditions:Methods and Applications)
Abstract
:In shallow tissues of the human body, pathological changes often occur, and there are several kinds of scattering media, such as mucosa, fat, and blood, present on the surface of these tissues. In such scattering environments, it is difficult to distinguish the location of the lesions using traditional attenuation-based imaging methods, while polarization-based imaging methods are more sensitive to this information. Therefore, in this paper, we conducted experiments using diluted milk to simulate biological tissues with scattering effects, illuminated with non-polarized light sources, and used an optimized robust polarization de-scattering algorithm for image processing. The results were qualitatively and quantitatively analyzed through local intensity comparison and visual fidelity functions, verifying the effectiveness of this algorithm under specific conditions.
1. Introduction
Polarization imaging allows us to obtain additional information beyond conventional imaging, which has been proven in various fields such as dehazing imaging, material surface and structure detection, biomedical imaging, and so on. In the field of biomedical imaging, polarization imaging has played a crucial role. For instance, in cellular and tissue imaging, polarization imaging can be used to observe and analyze the structure, morphology, and function of cells and tissues [1]; in neuroscience research, polarization imaging can be used to study the structure and function of the nervous system, aiding in the understanding of the workings and mechanisms of neurological disorders [2]; in ophthalmic diagnostics, polarization imaging can be employed for the diagnosis and the treatment of various eye diseases, including corneal diseases, glaucoma, and retinal diseases [3]; in cancer detection and diagnosis, polarization imaging can be used for the early detection and diagnosis of cancer [4,5]; in dermatology, polarization imaging can be utilized for the diagnosis and assessment of skin diseases, assisting doctors in determining the type and severity of skin diseases [6]. In addition to the aforementioned applications of polarization imaging, we have discovered that a polarization-based de-scattering imaging method (PBD, the method we proposed) can offer new solutions for biomedical imaging diagnostics in certain scenarios where scattering environments are present.
Due to the presence of turbid tissues or components in the human body that act as scattering media [7] (such as mucosa, fat, blood, etc.), the accuracy of diagnosis using traditional attenuation-based imaging methods is greatly reduced. However, polarization imaging methods are highly sensitive to environmental structures, and the influence of light scattering on polarization states has been found to be very useful in surface or subsurface structural imaging as well as deep tissue transmission imaging [8,9,10]. Therefore, the combination of polarization imaging with traditional approaches will make biomedical diagnostic imaging more convenient and clearer.
In previous biomedical imaging studies, such as the imaging of calcium oxalate crystals in Epipremnum aureum leaves, and early cancer diagnosis, various polarization parameters (depolarization and birefringence, etc.) were used to characterize the samples. These parameters are based on the fact that the polarization state of reflected light is lost due to scattering when illuminated with polarized light. Therefore, backscattered light contains polarized photons that have undergone multiple scattering events, and depolarized light typically depends on the scattering medium particle size and scattering mechanisms [11,12]. It is found that accurately measuring and analyzing tissue polarization signals is a significant challenge. However, in other applications where the influence of scattering media needs to be eliminated, such as outdoor dehazing [13,14] and underwater de-scattering [15,16], several image reconstruction methods (based on polarization imaging) have been proposed that achieve good results without the need for complex modeling, directly improving imaging quality in scattering environments.
The current methods for de-scattering imaging can be roughly divided into three categories: enhancement methods, restoration methods, and deep learning methods. Enhancement methods refer to using image processing algorithms to improve contrast, such as adaptive histogram equalization (AHE, which improves image contrast by computing multiple histograms for different sections of the image and redistributing the lightness values. It enhances local contrast and edge definition, but can overamplify noise), Retinex algorithm (restores the visual information lost due to poor illumination conditions by decomposing the original image into reflectance and illumination components. It enhances local contrast and color constancy), wavelet transform (wavelet transform enhances images by decomposing them into different frequency sub bands. It separates the image’s edge and luminance information, allowing for detailed processing and improved visual perception.), etc. This method is simple and direct but has limited effectiveness. Restoration methods usually involve establishing a physical model to obtain the dehazing image through inversion. This method is based on specific priors or assumptions, for example, based on the Dark Channel Prior [17], maximizing contrast, Haze-Lines Prior [18], Color Attenuation Prior [19], and polarization-based methods [13,14], etc. These kinds of methods produce better de-scattering output, but the assumptions and prior information have certain limitations and may not be applicable to all scenarios. Deep learning methods [20,21,22], on the other hand, mostly propose trainable end-to-end networks to directly output dehazed results. However, this method requires specific datasets, and a large amount of data and time.
In this paper, we will establish a polarization-based de-scattering imaging algorithm by utilizing an image degradation model to estimate relevant parameters. We will then validate the feasibility of this method through simulation experiments and perform qualitative and quantitative analysis on the restored results. The evaluation of the restoration results will be conducted using the Visual Information Fidelity (VIF) [23] as an evaluation metric. Comparative analysis will be carried out with results obtained from the other three de-scattering methods: Dark Channel Prior (DCP) [17], All-in-One Network (AOD-Net) [20] and Feature Fusion Attention Network (FFA-Net) [21].
2. Theory
2.1. Image Degradation Model
A widely used physical model in scattering environment imaging scenarios is the degradation model proposed by Nayar et al. [24,25] in 2000. In this model, the total light signal Itotal captured by the camera when imaging through a scattering medium is composed of two parts, A and D:
where A represents the signal reaching the camera from ambient light that has not undergone scattering attenuation from the target; and D represents the signal reaching the camera from the scene target’s reflected light after scattering attenuation. To further elaborate:
where A∞ represents the ambient light scattered at an infinite distance along the imaging path, and t(z) is the medium transmittance that describes the degree of radiation attenuation, given by
where z represents the distance from the target to the camera and β represents the extinction coefficient due to scattering and absorption. The recovered target image is
Therefore, the method reconstructs the target image mainly by estimating A and A∞.
2.2. Estimation of A and A∞
Under the condition that the scattered particle size satisfies Mie scattering theory, due to the multiple scattering effect, component A is generally considered partially polarized light with a small degree of polarization, while component D is considered unpolarized light. Therefore, we can use the following PBD imaging method to estimate A and A∞.
First, by rotating a linear polarizer in front of the camera, images I(0), I(45), I(90) and I(135) are obtained in four different directions (0°, 45°, 90°and 135°). Then, the Stokes parameters are calculated from these four images, where S0 corresponds to the previously mentioned Itotal.
The degree of polarization (DoP) p and angle of polarization (AoP) θ of the total intensity are calculated using the following equations, respectively:
Since the polarized component in the total intensity comes from the A, most of the elements in the matrix composed of the θ values computed from Equation (7) (referred to as the θ matrix) are considered as the polarization angle of the A, denoted as θA. However, some different values may be present due to the possibility of partially polarized characteristics in the scene light closer to the camera. Based on this, we consider the most frequent value in the θ-matrix as θA.
From the above, it is clear that A is partially polarized, and its polarized component can be written as Ap, and, accordingly, the polarization degree of the A is pA, and . As mentioned above, another component of the total intensity, D, is considered to be unpolarized, and therefore the polarization degree of the total intensity can be written in addition to Equation (6) as . Orthogonal decomposition of Ap with polarization angle θA, where the component decomposed along the 0° polarizer direction is denoted as , the component decomposed along 90° polarizer direction is denoted as , θA is the angle between Ap and 0°, and the two components can be expressed as and , respectively. and are the polarization components in I(0) and I(90), respectively, and can also be expressed in terms of equations containing I(0) and I(90) as follows:
Therefore, Ap can be calculated as
From Equation (9), we can deduce that p
where pA is the maximum value in matrix-p. The intensity of A is calculated by the equation :
In the frequency domain of images captured directly from the camera, two key observations can be made. Firstly, A is predominantly located in the low-frequency region. Secondly, D and noise are typically found in the high-frequency region. Therefore, to improve the accuracy of estimating the A intensity, we can use a low-pass filter to roughly separate the A. Additionally, this process also effectively suppresses the noise. So, in our algorithm, the first step is to apply a low-pass filter in the patch of 5 × 5 in the frequency domain to the four polarized images [14], and then perform the aforementioned calculations using the filtered images.
Next, let us consider how to estimate the value of the ambient light A∞ scattered into the imaging path from distant surroundings. In fact, if the estimation of the A is accurate, its maximum value can be considered as A∞. However, from Equation (4), to ensure that the denominator is not zero, the value of A∞ needs to be slightly larger than the maximum value in A. In our algorithm, the expression for A∞ is as follows:
The result of de-scattering is mainly determined by A, so the coefficient in Equation (12) is slightly larger than one. After A and A∞ are determined, the de-scattering result can be calculated using Equation (4).
3. Experiments and Analysis
To validate the effectiveness of our proposed de-scattering algorithm in scattering environments, similar to mucosa and blood, we designed a simulation experiment using onion epidermal cell slices as targets and diluted milk [26] to mimic the scattering environment of biological tissues. The experiment was conducted using an Olympus polarized microscope under a 20× objective lens, and four polarized images at different angles were obtained using a time-sequential polarization imaging method. All calculations in this article were performed in commercial software Matlab R2021a. We aimed to achieve non-invasive imaging, where the light source and camera are symmetrically distributed on the same side. However, due to the close distance between the microscope objective and the focal plane, and the fixed position of the camera, it was difficult to set up a same-side light source. Therefore, we initially used the microscope’s built-in transmitted halogen lamp as the experimental light source for reflection experiments. However, in this case, some of the light will be directly reflected by the top glass slide, which may influence the experimental results (some areas are overexposed). Therefore, to simulate reflection experiments under non-direct incident conditions, we chose to simulate the experiments using transmitted illumination. Additionally, due to the weak light signals reflected back, EMCCD (Electron Multiplying Charge-Coupled Device, a type of CCD that amplifies the electron signal to improve sensitivity in low-light imaging) was used for image capturing. The schematic diagram of the experimental setup and actual experimental process are shown in Figure 1.
3.1. Reflected Light Source Experiment
In the reflection experiment, we first stacked glass slides of the same thickness on both sides of the first cell slice, leaving a scattering layer gap of 280 μm. Then, we placed the second cell slice on it and aligned the observation portions of the two slices. We continued to stack glass slides of the same thickness on both sides of the second cell slice, also leaving a scattering layer gap of 280 μm. Finally, we added another glass slide on top to obtain the observation sample with two layers of targets and two layers of scattering media. The top single glass slide and the side portions of the stacked slices were fixed using hot glue. From the top down, the two layers of targets are denoted as Layer 1 and Layer 2. Then, water mixed with milk in ratios of 7:1, 6:1, and 5:1 was used as the scattering media. Initially, water was injected into the scattering layer gaps to obtain clear target images (ground truth). Then, using a syringe with a needle diameter of 0.3 mm, the liquid in the scattering layer was extracted and replaced. Using this process, the original images and polarized images of targets in the scattering environment with different concentrations of scattering media can be obtained. The rotation of the polarizer was controlled using a motor to reduce errors. The images obtained from the reflection experiment and the results after processing via four methods are shown in Figure 2.
From the processed results in Figure 2, it can be observed that each image restoration method partially restores the original images to some extent. Both the DCP and PBD methods show good subjective results, but the PBD method produces images with more uniform overall brightness. The histogram in Figure 3 shows the grayscale value distribution of the original image and the processed image. For the entire image, the DCP and AOD-Net methods have a better stretching effect on the grayscale values, while the effects of the FFA-Net and PBD methods are less obvious. However, the grayscale value distribution of the ground truth is not particularly concentrated to begin with, and the grayscale value distribution of the image processed using the DCP method is mostly concentrated in the lower value range. Considering Figure 1, the overall processing result appears darker, and the visual effect of the DCP method is not particularly superior to that of the PBD method.
We compared the intensity values at the marked black lines in Figure 2 with the corresponding positions in other images, and the results are shown in Figure 4. Compared to the ground truth (line a), the contrast at the cell wall significantly decreases after adding scattering media with different dilution ratios (line b). At a ratio of 7:1, the contrast (difference between the maximum and minimum values) at black rectangular regions of Layer 1 and Layer 2 is approximately 34.6% and 28.8% of the original image, respectively. Similarly, at a ratio of 6:1, it is 28.8% and 18.2%, and at a ratio of 5:1, it is 25.7% and 10.3%.
In Layer 1, after processing with the DCP method (line c), the contrast improves significantly, and the contrast enhancement relative to the same region of the original image is about 2.85 times (at 7:1), 5.65 times (at 6:1), and 2.46 times (at 5:1). The restoration effect of the PBD method (line f) is comparable to that of the DCP method and the brightness is closer to the ground truth, and the contrast enhancement relative to the same region of original image is about 2.84 times (at 7:1), 2.26 times (at 6:1), and 2.86 times (at 5:1). The AOD-Net (line d) and FFA-Net (line e) methods show limited improvement in contrast (contrast enhancement lower than 1.5 times) after restoration.
Similarly, when comparing the restored images of Layer 2 with the ground truth using the four methods, it can be observed that the DCP method (line c) introduces significant noise compared to the PBD method (line f), which can achieve almost complete restoration. The restoration results of methods AOD-Net (line d) and FFA-Net (line e) are extremely bad. When using the DCP method, the contrast enhancement relative to the same region of the original image is about 3.51 times (at 7:1), 3 times (at 6:1), and 1.88 times (at 5:1). With the PBD method, the contrast enhancement relative to the same region of the original image is about 4.58 times (at 7:1), 2.91 times (at 6:1), and 3.19 times (at 5:1). This analysis implies that PBD has a better performance in higher turbid media.
To evaluate the processing results further and objectively, we also used the Visual Information Fidelity (VIF) as an evaluation function to calculate the fidelity of the initial image and the four processed images relative to the ground truth. In simple terms, VIF assesses the quality of an image by comparing its structural information and perceptual characteristics, including brightness, contrast, and structural similarity. Therefore, VIF can be used to measure the effectiveness of image processing algorithms and evaluate the similarity between reconstructed and original images. A higher score indicates better fidelity. Moreover, compared to metrics like PSNR (Peak Signal-to-Noise Ratio, a measure used to assess the quality of a reconstructed image compared to the original image) and SSIM (Structural Similarity Index Measure, a metric for comparing the similarity and difference between two images), VIF, which combines natural image statistics models, image distortion models, and the human visual system model, has higher consistency with subjective visual perception. Table 1 presents the VIF values of the images in the reflection experiment results, and it is evident that the PBD method consistently achieves the highest scores across various conditions. In conclusion, both from objective metrics and subjective effects, our proposed PBD method performs better.
3.2. Transmitted Light Source Experiment
In the transmitted illumination light source experiment, we used the same method to create three-layer observation samples, controlling the thickness of each scattering layer gap to be around 260 μm. From the top to down, the three layers of targets are denoted as Layer 1, Layer 2, and Layer 3. We mixed water and diluted milk in different concentrations of 16:1, 8:1, 7:1, and 6:1 as scattering media. Similar to the reflection experiment, we obtained the ground truth, target images, and polarized images under the influence of different concentrations of scattering media. In this case, a color camera equipped with a microscope can be used, since the transmitted ray is strong enough. The images obtained from the transmitted illumination experiment and the images processed by four different methods are shown in Figure 5.
By comparing the results in Figure 5, we can see that the PBD and DCP methods still yield the best results, followed by AOD-Net, and FFA-Net performs the worst. Although the DCP method performs well in overall structural restoration, it still suffers from significant brightness deviations in some Layer 1 and Layer 2 images, as well as color shifts in Layer 3 images. Therefore, in this scenario, the robustness of the PBD method is superior to that of the DCP method.
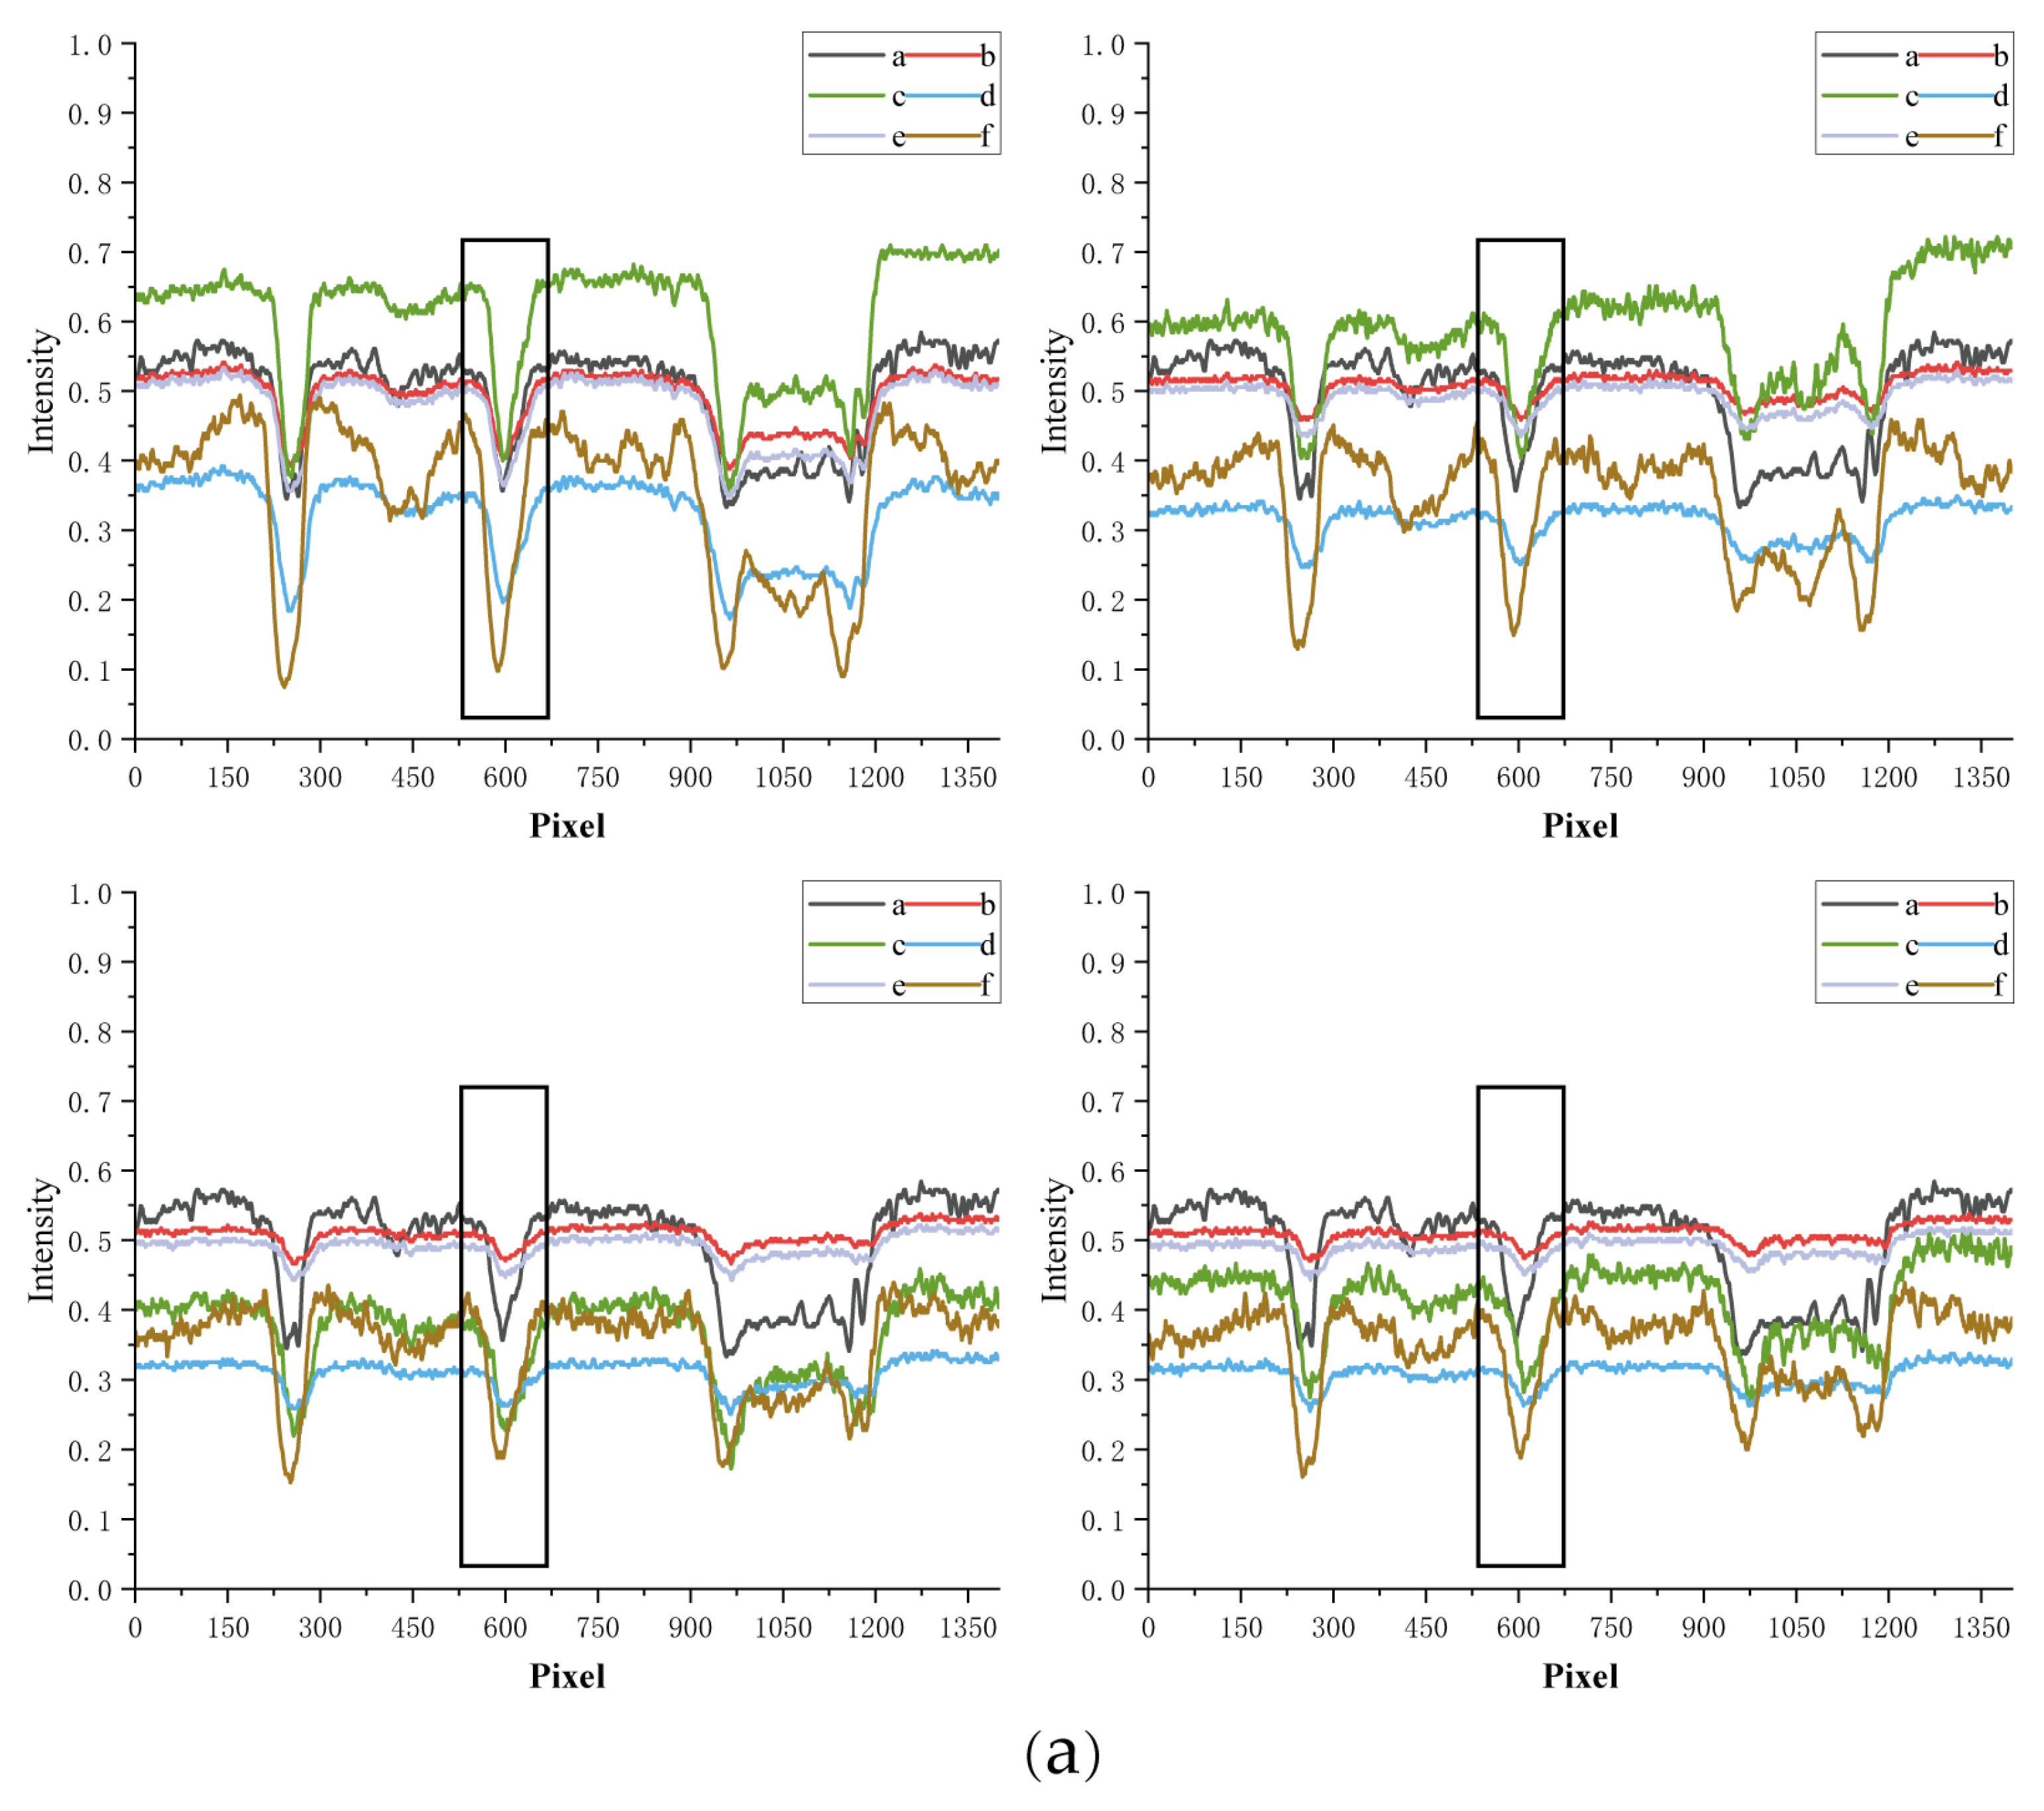
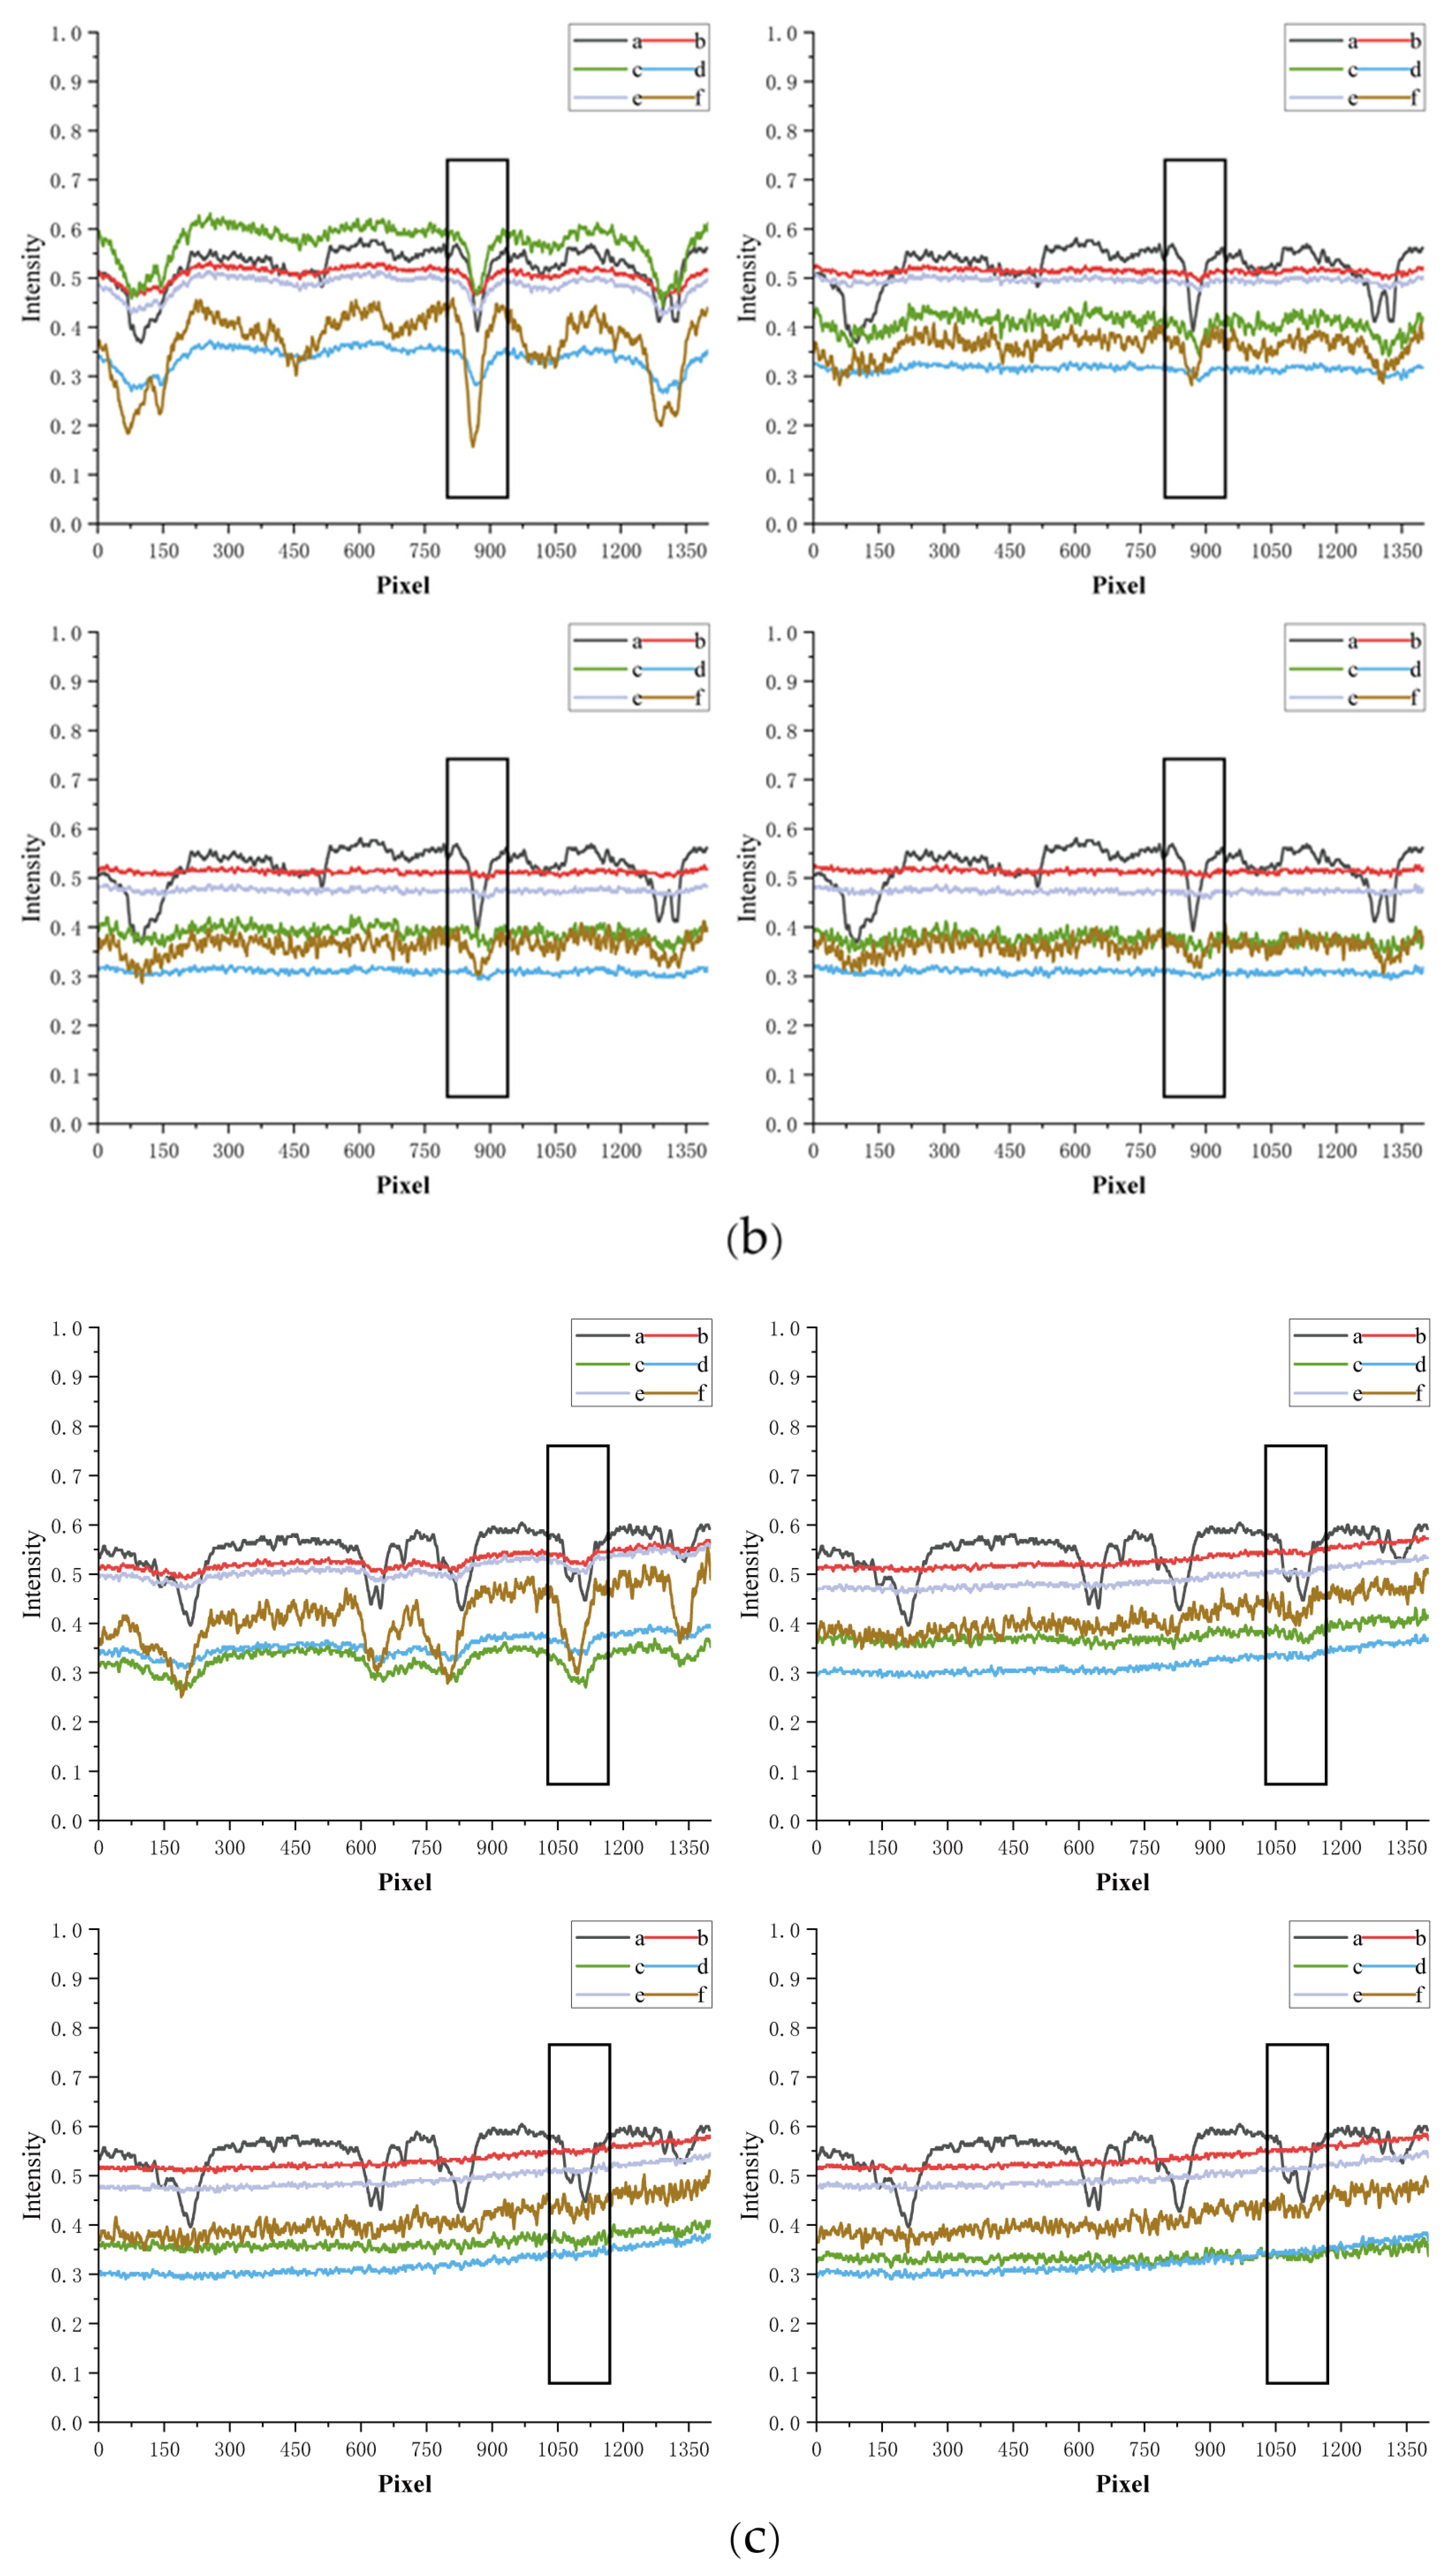
Similarly, we compare the intensity values at the yellow line markers in the corresponding images in Figure 5, and the results are shown in Figure 6. This local comparison objectively reflects the restoration effects of different methods. The PBD and DCP methods show excellent results, especially for Layer 1 at different concentrations, and for all layers at a concentration of 16:1. However, as the concentration and imaging depth change, the restoration performance of the PBD and DCP methods significantly decreases for Layer 2 at concentrations other than 16:1. The PBD method (line f) still improves the contrast at the cell wall for all concentrations to some extent, but the improvement with the DCP method (line c) is not as significant as that with the PBD method. For greater depths, with Layer 3, except for the PBD method, which can achieve effective restoration at a concentration of 16:1, none of the four methods can restore the targets effectively at other concentrations.
For Layer 1, the black rectangular region at concentrations of 16:1, 8:1, 7:1, and 6:1, when processed by the PBD method, shows contrast enhancements of 3.45 times, 6.34 times, 6.6 times, and 6.94 times, respectively, compared to the same region of the original image. When processed via the DCP method, it shows contrast enhancements of 2.31 times, 4.19 times, 4.48 times, and 4.71 times, respectively. The AOD-Net method and FFA-Net method also show enhancements of less than 1.5 times. For Layer 2, when processed using the PBD method, the contrast enhancements at four different concentrations are as follows: 6.47 times, 8.07 times, 6.3 times, and 5.88 times. When processed using the PBD method, contrast enhancements were 2.71 times, 5.46 times, 3.2 times, and 3 times, respectively. For Layer 3, only at a concentration of 16:1, the PBD and DCP methods can achieve limited contrast enhancement, denoted as 7.45 times and 2.15 times, respectively. Under other concentration conditions, the recovered targets are submerged in image noise, resulting in poor restoration quality.
Table 2 shows the VIF values of each image in the transmission experiment, and the PBD method still scores higher than the other methods. From subjective to objective, local to overall validation, the effectiveness of the PBD method is confirmed.
4. Conclusions
In this paper, we propose a polarization imaging method that enhances the visibility of cell-scale targets in a scattering medium environment. Firstly, we obtain four linear polarization images of the target using a time-division polarization imaging method. Then, we apply Gaussian low-pass filtering to the four images to reduce noise and improve the accuracy of subsequent parameter estimation. Finally, we calculate the reconstructed image using a scattering removal imaging algorithm based on polarization angle estimation. We conducted experiments on scattering media with various concentrations under both reflection and transmission illumination conditions. The results show that our method has significant advantages in terms of the quality of the reconstructed results compared to three other methods. Additionally, our method uses non-polarized light for illumination, making it applicable in various lighting environments without specific requirements for the light source. In summary, our method only requires four polarization images as an input to generate the reconstructed result, making it simple, efficient, and robust.
Of course, the simulation experiments we are currently conducting are relatively simple and not difficult to reproduce. At the same time, there are parts of our experiment that have not yet been explored. For example, the thickness of visible light penetrating biological tissues is quite limited. It is possible to try to deepen the penetration depth by using the absorption window of biological tissues in the near-infrared region [27], which may yield more information. During the experiment, we manually rotate the knob to adjust the height of the carrier stage and shoot targets at different layers. If this process can be achieved through electronic control, it may effectively reduce focusing errors. As for our algorithm, the processing of color images is just calculating the three channels in sequence and then outputting. If the intensity value of a certain channel is significantly higher, the final output image may appear color-biased. In addition, low-pass filtering will inevitably cause some detail loss. Although our current observation target is relatively simple and the impact is not significant, if we need to observe smaller, more detailed targets, this issue may need to be considered.
We believe that this polarization-based scattering removal imaging technique has broad prospects in the field of biomedical imaging and other applications that involve the imaging of scattering media. It provides a feasible approach to obtain more accurate and clear images, thereby improving the accuracy and reliability of diagnosis and research. However, further research and validation are still necessary, and the performance of this method needs to be optimized and its application scope expanded.
Author Contributions
Conceptualization, J.L.; methodology, J.L.; software, S.Z.; validation, S.Z. and J.L.; formal analysis, S.Z.; investigation, S.Z.; resources, J.L. and L.R.; data curation, Y.J.; writing—original draft preparation, S.Z.; writing—review and editing, J.L.; visualization, S.Z. and J.L.; supervision, J.L. and L.R.; project administration, L.R.; funding acquisition, J.L. All authors have read and agreed to the published version of the manuscript.
Funding
This research was funded by the Natural Science Foundation of Shaanxi Province, China, grant number 2022JQ-612, 2022JQ-075, 2021JM-204; and the Xi’an Scientific and Technological Projects, China, grant number 2020KJRC0013.
Data Availability Statement
Data are contained within the article.
Conflicts of Interest
The authors declare no conflict of interest.
References
- Van Eeckhout, A.; Garcia-Caurel, E.; Garnatje, T.; Escalera, J.C.; Durfort, M.; Vidal, J. Polarimetric imaging microscopy for advanced inspection of vegetal tissues. Sci. Rep. 2021, 11, 3913. [Google Scholar] [CrossRef]
- Hafi, N.; Grunwald, M.; van den Heuvel, L.S.; Aspelmeier, T.; Chen, J.H.; Zagrebelsky, M. Fluorescence nanoscopy by polarization modulation and polarization angle narrowing. Nat. Methods 2014, 11, 579–584. [Google Scholar] [CrossRef] [PubMed]
- Ahlers, C.; Gotzinger, E.; Pircher, M.; Golbaz, I.; Prager, F.; Schutze, C. Imaging of the retinal pigment epithelium in age-related macular degeneration using polarization-sensitive optical coherence tomography. Investig. Ophthalmol. Vis. Sci. 2010, 51, 2149–2157. [Google Scholar] [CrossRef] [PubMed]
- Li, D.; He, H.; Zeng, N.; Du, E.; Liao, R.; He, Y. Polarization Imaging and Scattering Model of Cancerous Liver Tissues. J. Innov. Opt. Health Sci. 2013, 6, 1350025. [Google Scholar] [CrossRef]
- Peng, T.; Xie, H.; Ding, Y.C.; Wang, W.C.; Li, Z.M.; Jin, D.Y. CRAFT: Multimodality confocal skin imaging for early cancer diagnosis. J. Biophotonics 2012, 5, 469–476. [Google Scholar] [CrossRef] [PubMed]
- Rey-Barroso, L.; Burgos-Fernández, F.J.; Royo, S.; Puig, S.; Malvehy, J.; Pellacani, G. Polarized Multispectral Imaging for the Diagnosis of Skin Cancer. Color Imaging Conf. 2019, 27, 381–385. [Google Scholar] [CrossRef]
- Ghosh, N.; Vitkin, I.A. Tissue polarimetry: Concepts, challenges, applications, and outlook. J. Biomed. Opt. 2011, 16, 110801. [Google Scholar] [CrossRef] [PubMed]
- Canabal-Carbia, M.; Rodriguez, C.; Estévez Caride, I.; Van Eeckout, A.; González-Arnay, E.; García-Caurel, E. Enhancing Biological Tissue Structures Visualization through Polarimetric Parameters. In SPIE Polarized Light and Optical Angular Momentum for Biomedical Diagnostics 2023; SPIE: San Francisco, CA, USA, 2023; Volume 12382, pp. 35–46. [Google Scholar]
- Jacques, S.L.; Roman, J.R.; Lee, K. Imaging superficial tissues with polarized light. Lasers Surg. Med. 2000, 26, 119–129. [Google Scholar] [CrossRef]
- Luthria, G.; Li, R.; Wang, S.; Prytyskach, M.; Kohler, R.H.; Lauffenburger, D.A. In vivo microscopy reveals macrophage polarization locally promotes coherent microtubule dynamics in migrating cancer cells. Nat. Commun. 2020, 11, 3521. [Google Scholar] [CrossRef]
- Tukimin, S.N.; Karman, S.B.; Ahmad, M.Y.; Wan Kamarul Zaman, W.S. Polarized Light-Based Cancer Cell Detection Techniques: A Review. IEEE Sens. J. 2019, 19, 9010–9025. [Google Scholar] [CrossRef]
- Wang, D.; Qi, J.; Huang, B.; Noble, E.; Stoyanov, D.; Gao, J. Polarization-based smoke removal method for surgical images. Biomed. Opt. Express 2022, 13, 2364–2379. [Google Scholar] [CrossRef] [PubMed]
- Liang, J.; Ren, L.-Y.; Ju, H.-J.; Qu, E.-S.; Wang, Y.-L. Visibility enhancement of hazy images based on a universal polarimetric imaging method. J. Appl. Phys. 2014, 116, 173107. [Google Scholar] [CrossRef]
- Liang, J.; Ju, H.J.; Ren, L.Y.; Yang, L.M.; Liang, R.G. Generalized Polarimetric Dehazing Method Based on Low-Pass Filtering in Frequency Domain. Sensors 2020, 20, 1729. [Google Scholar] [CrossRef] [PubMed]
- Liu, F.; Wei, Y.; Han, P.; Yang, K.; Bai, L.; Shao, X. Polarization-based exploration for clear underwater vision in natural illumination. Opt. Express 2019, 27, 3629–3641. [Google Scholar] [CrossRef] [PubMed]
- Deng, J.; Zhu, J.; Li, H.; Zhang, X.; Guo, F.; Hou, X. Real-time underwater polarization imaging without relying on background. Opt. Lasers Eng. 2023, 169, 107721. [Google Scholar] [CrossRef]
- He, K.; Sun, J.; Tang, X. Single Image Haze Removal Using Dark Channel Prior. IEEE Trans. Pattern Anal. Mach. Intell. 2011, 33, 2341–2353. [Google Scholar]
- Zhang, S.; He, F.; Ren, W. NLDN: Non-local dehazing network for dense haze removal. Neurocomputing 2020, 410, 363–373. [Google Scholar] [CrossRef]
- Zhu, Q.; Mai, J.; Shao, L. A Fast Single Image Haze Removal Algorithm Using Color Attenuation Prior. IEEE Trans. Image Process. 2015, 24, 3522–3533. [Google Scholar]
- Li, B.; Peng, X.; Wang, Z.; Xu, J.; Feng, D. All-in-one dehazing network. In Proceedings of the IEEE International Conference on Computer Vision, Venice, Italy, 22–29 October 2017; pp. 4770–4779. [Google Scholar]
- Qin, X.; Wang, Z.; Bai, Y.; Xie, X.; Jia, H. FFA-Net: Feature fusion attention network for single image dehazing. In Proceedings of the AAAI Conference on Artificial Intelligence, New York, NY, USA, 7–12 February 2020; Volume 34, pp. 11908–11915. [Google Scholar]
- Bolun, C.; Xiangmin, X.; Kui, J.; Chunmei, Q.; Dacheng, T. DehazeNet: An End-to-End System for Single Image Haze Removal. IEEE Trans. Image Process. 2016, 25, 5187–5198. [Google Scholar]
- Sheikh, H.R.; Bovik, A.C. Image information and visual quality. IEEE Trans. Image Process. 2006, 15, 430–444. [Google Scholar] [CrossRef]
- Narasimhan, S.G.; Nayar, S.K. Chromatic framework for vision in bad weather. In Proceedings of the IEEE Conference on Computer Vision and Pattern Recognition, Hilton Head Island, SC, USA, 13–15 June 2000; Volume 1, pp. 598–605. [Google Scholar]
- Schechner, Y.Y.; Narasimhan, S.G.; Nayar, S.K. Polarization-based vision through haze. Appl. Opt. 2003, 42, 511–525. [Google Scholar] [CrossRef] [PubMed]
- Vitor, A.R.; Shaus, A.; Cardoso, G.C. Image Haziness Contrast Metric Describing Optical Scattering Depth. Optics 2023, 4, 525–537. [Google Scholar] [CrossRef]
- Cai, Y.; Wei, Z.; Song, C.; Tang, C.; Han, W.; Dong, X. Optical nano-agents in the second near-infrared window for biomedical applications. Chem. Soc. Rev. 2019, 48, 22–37. [Google Scholar] [CrossRef] [PubMed]
Figure 1.
(A) Schematic diagram of the experiment: a. camera (EMCCD and Color Camera); b. polarizer; c. reflected light source; d. objective lens; e. cell slices; f. scattering medium; and g. transmitted light source. (B) Diagram of the experiment process. (C) Diluted milk.
Figure 1.
(A) Schematic diagram of the experiment: a. camera (EMCCD and Color Camera); b. polarizer; c. reflected light source; d. objective lens; e. cell slices; f. scattering medium; and g. transmitted light source. (B) Diagram of the experiment process. (C) Diluted milk.
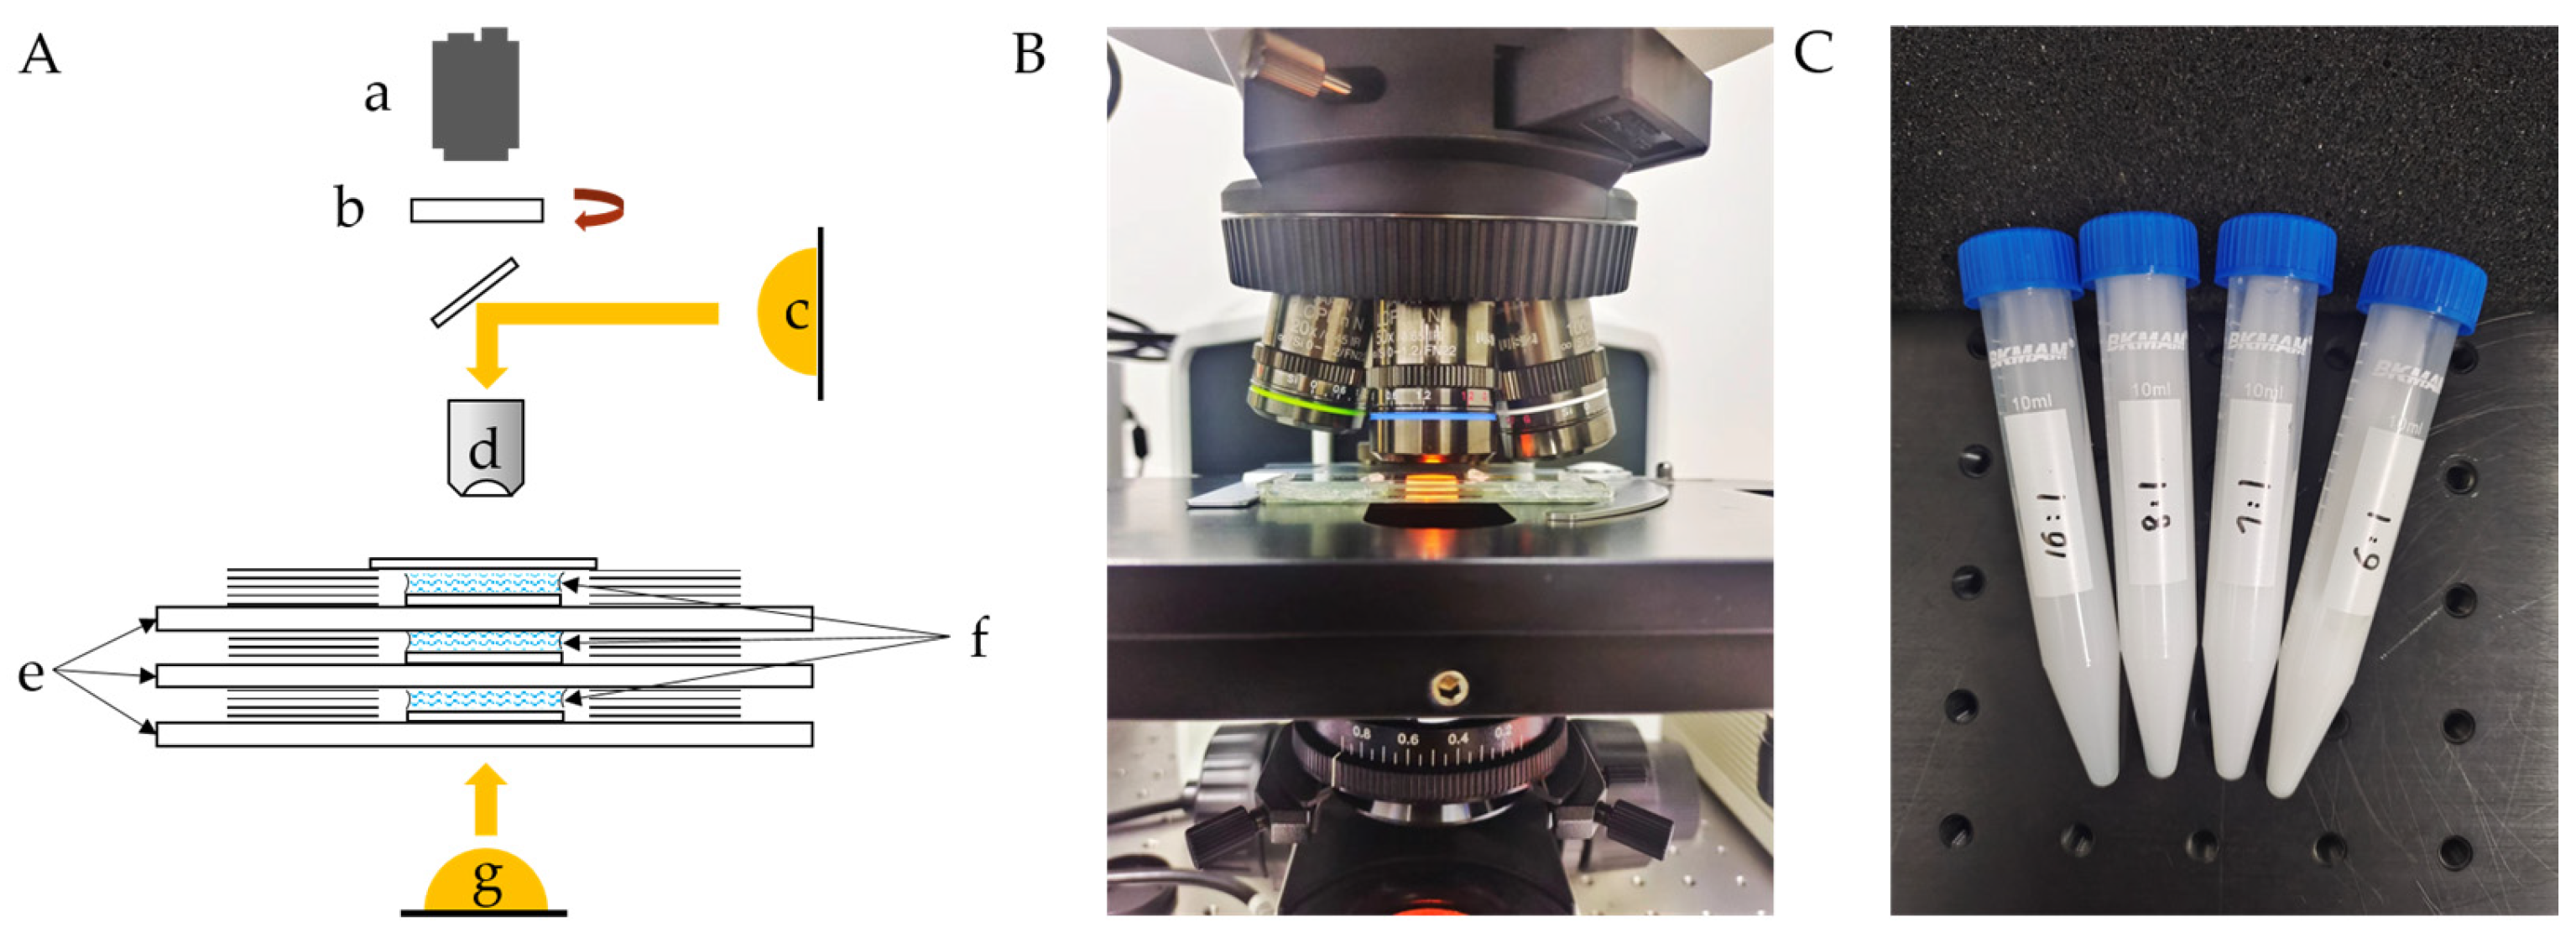
Figure 2.
Experimental and post-processing images: (A) Layer 1, (B) Layer 2, (ⅰ) water (ground truth), (ⅱ) 7:1, (ⅲ) 6:1, (ⅳ) 5:1. (a) Images captured using EMCCD in different media environments (original images), (b) DCP, (c) AOD-Net, (d) FFA-Net, and (e) PBD.
Figure 2.
Experimental and post-processing images: (A) Layer 1, (B) Layer 2, (ⅰ) water (ground truth), (ⅱ) 7:1, (ⅲ) 6:1, (ⅳ) 5:1. (a) Images captured using EMCCD in different media environments (original images), (b) DCP, (c) AOD-Net, (d) FFA-Net, and (e) PBD.
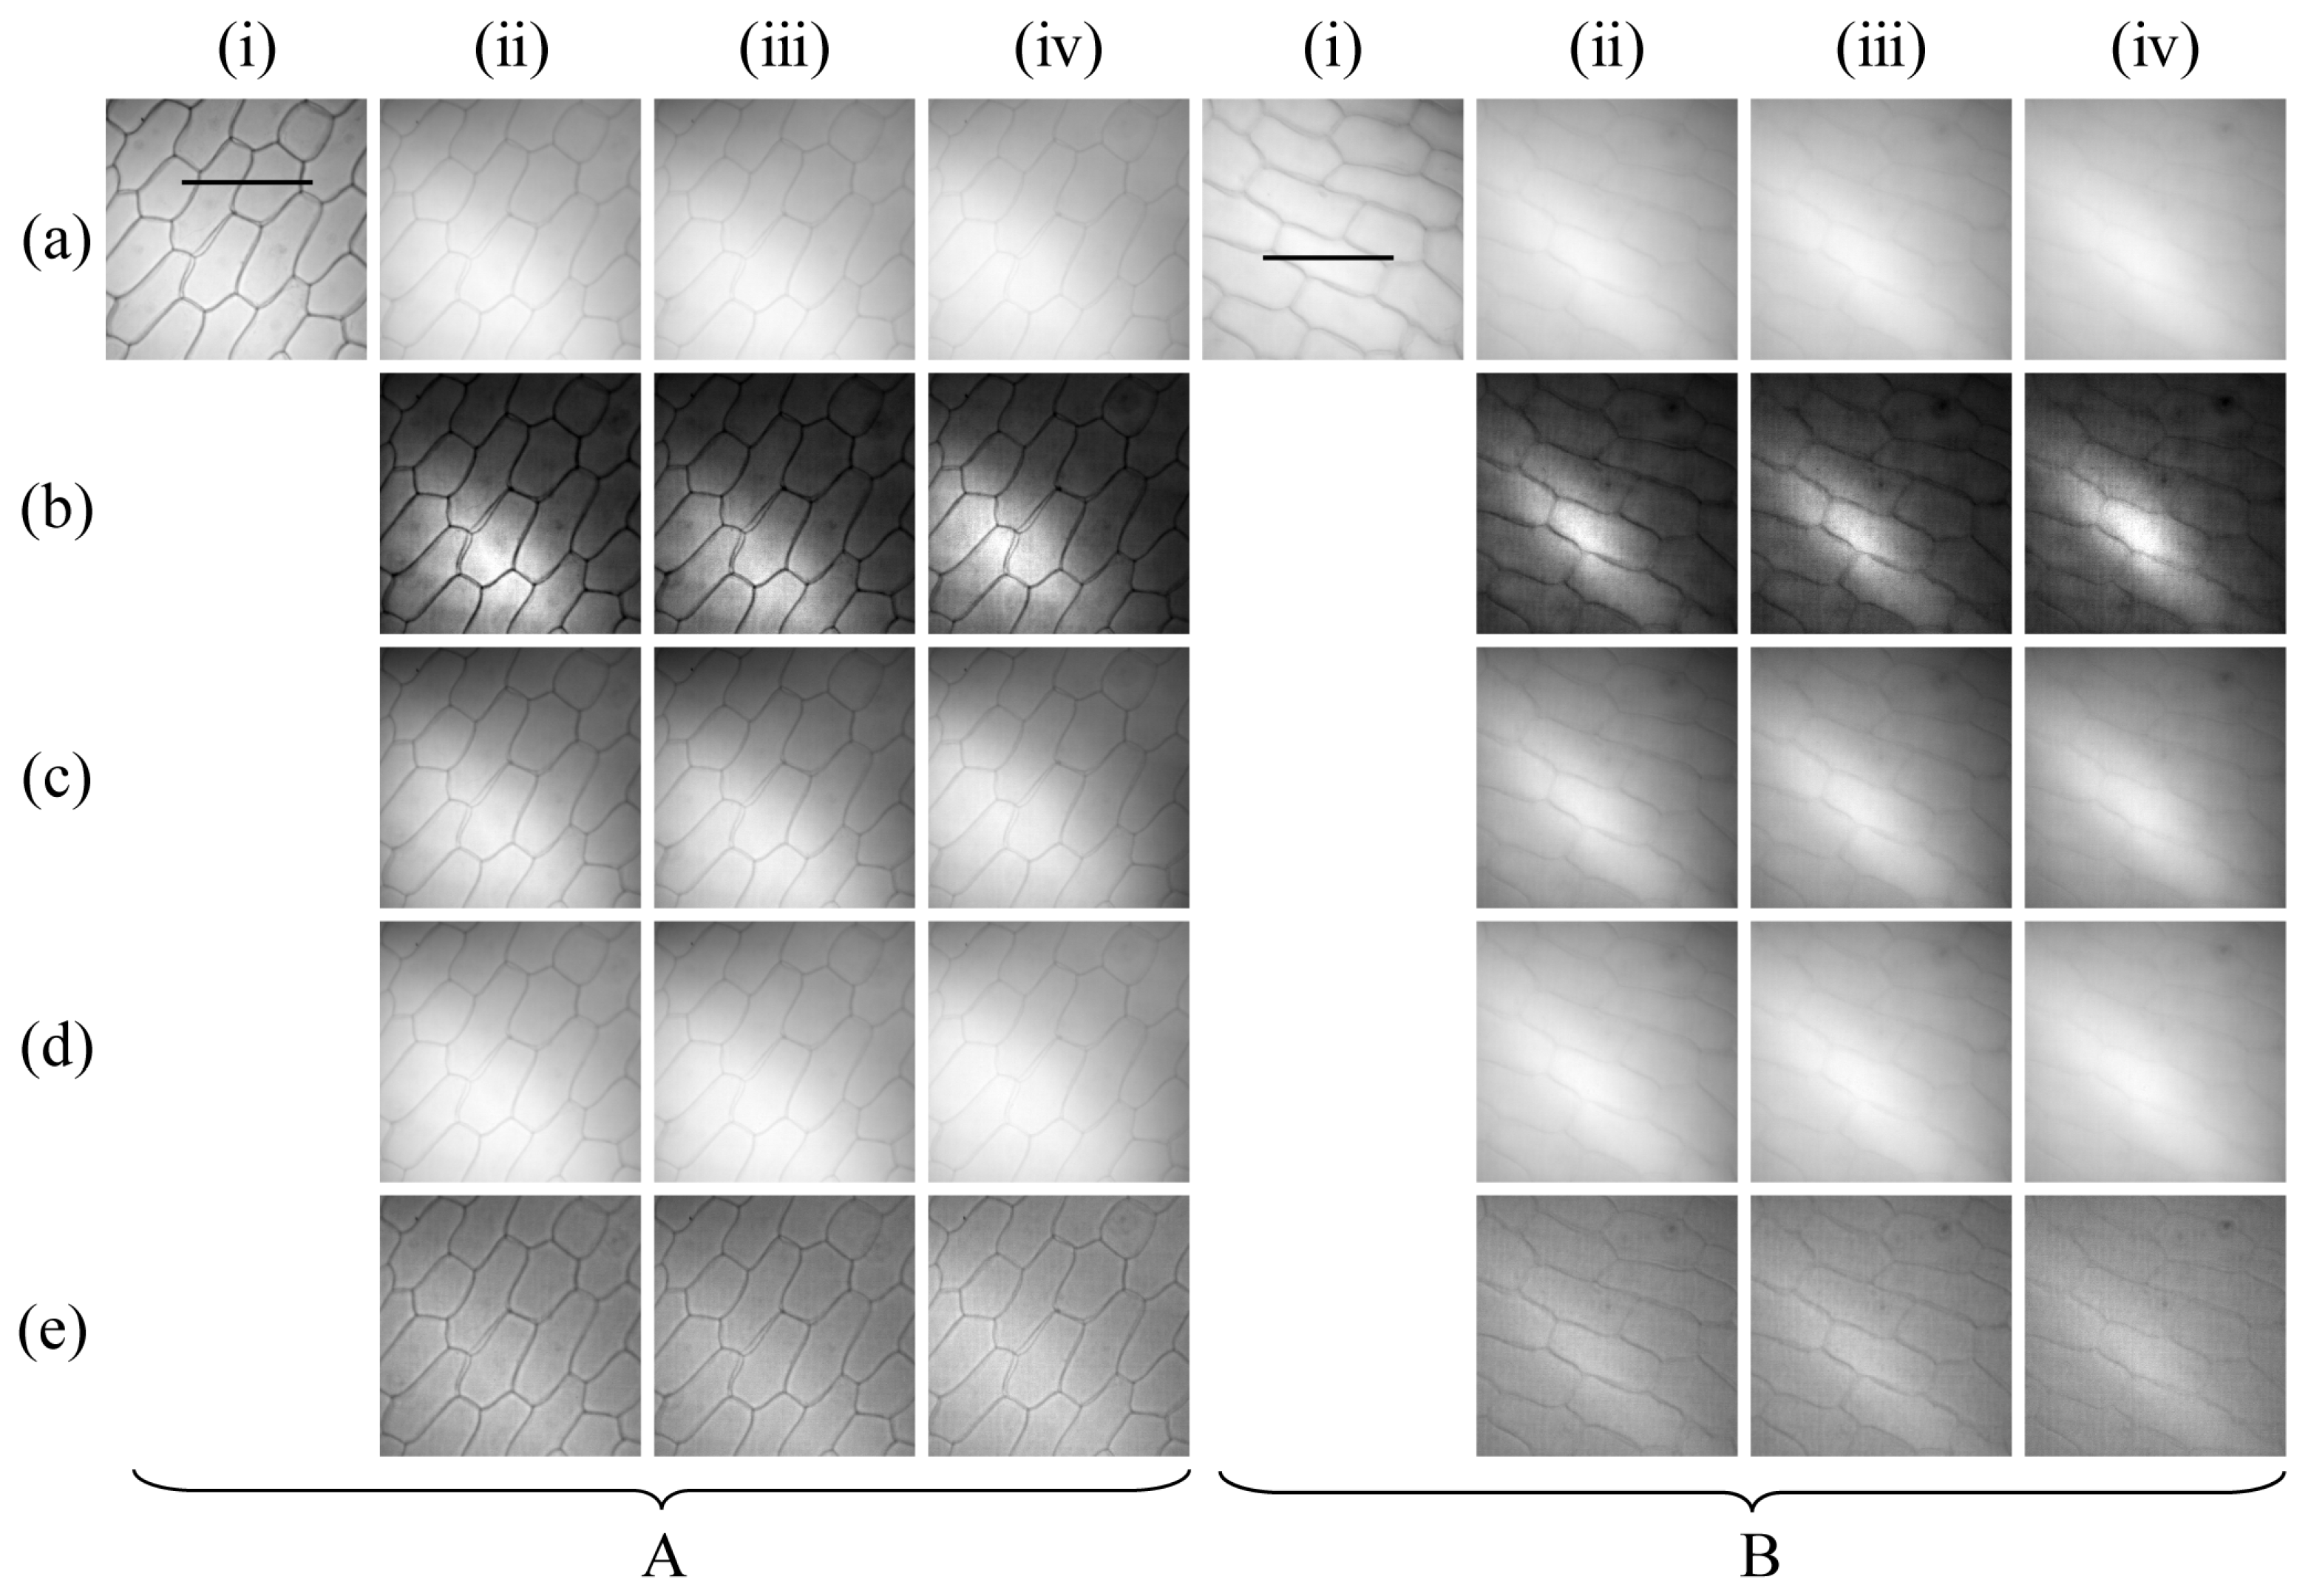
Figure 3.
Histogram of experimental and post-processing images: (A) Layer 1, (B) Layer 2, (ⅰ) water (ground truth), (ⅱ) 7:1, (ⅲ) 6:1, (ⅳ) 5:1. (a) Images captured using EMCCD in different media environments (original images), (b) DCP, (c) AOD-Net, (d) FFA-Net, and (e) PBD.
Figure 3.
Histogram of experimental and post-processing images: (A) Layer 1, (B) Layer 2, (ⅰ) water (ground truth), (ⅱ) 7:1, (ⅲ) 6:1, (ⅳ) 5:1. (a) Images captured using EMCCD in different media environments (original images), (b) DCP, (c) AOD-Net, (d) FFA-Net, and (e) PBD.
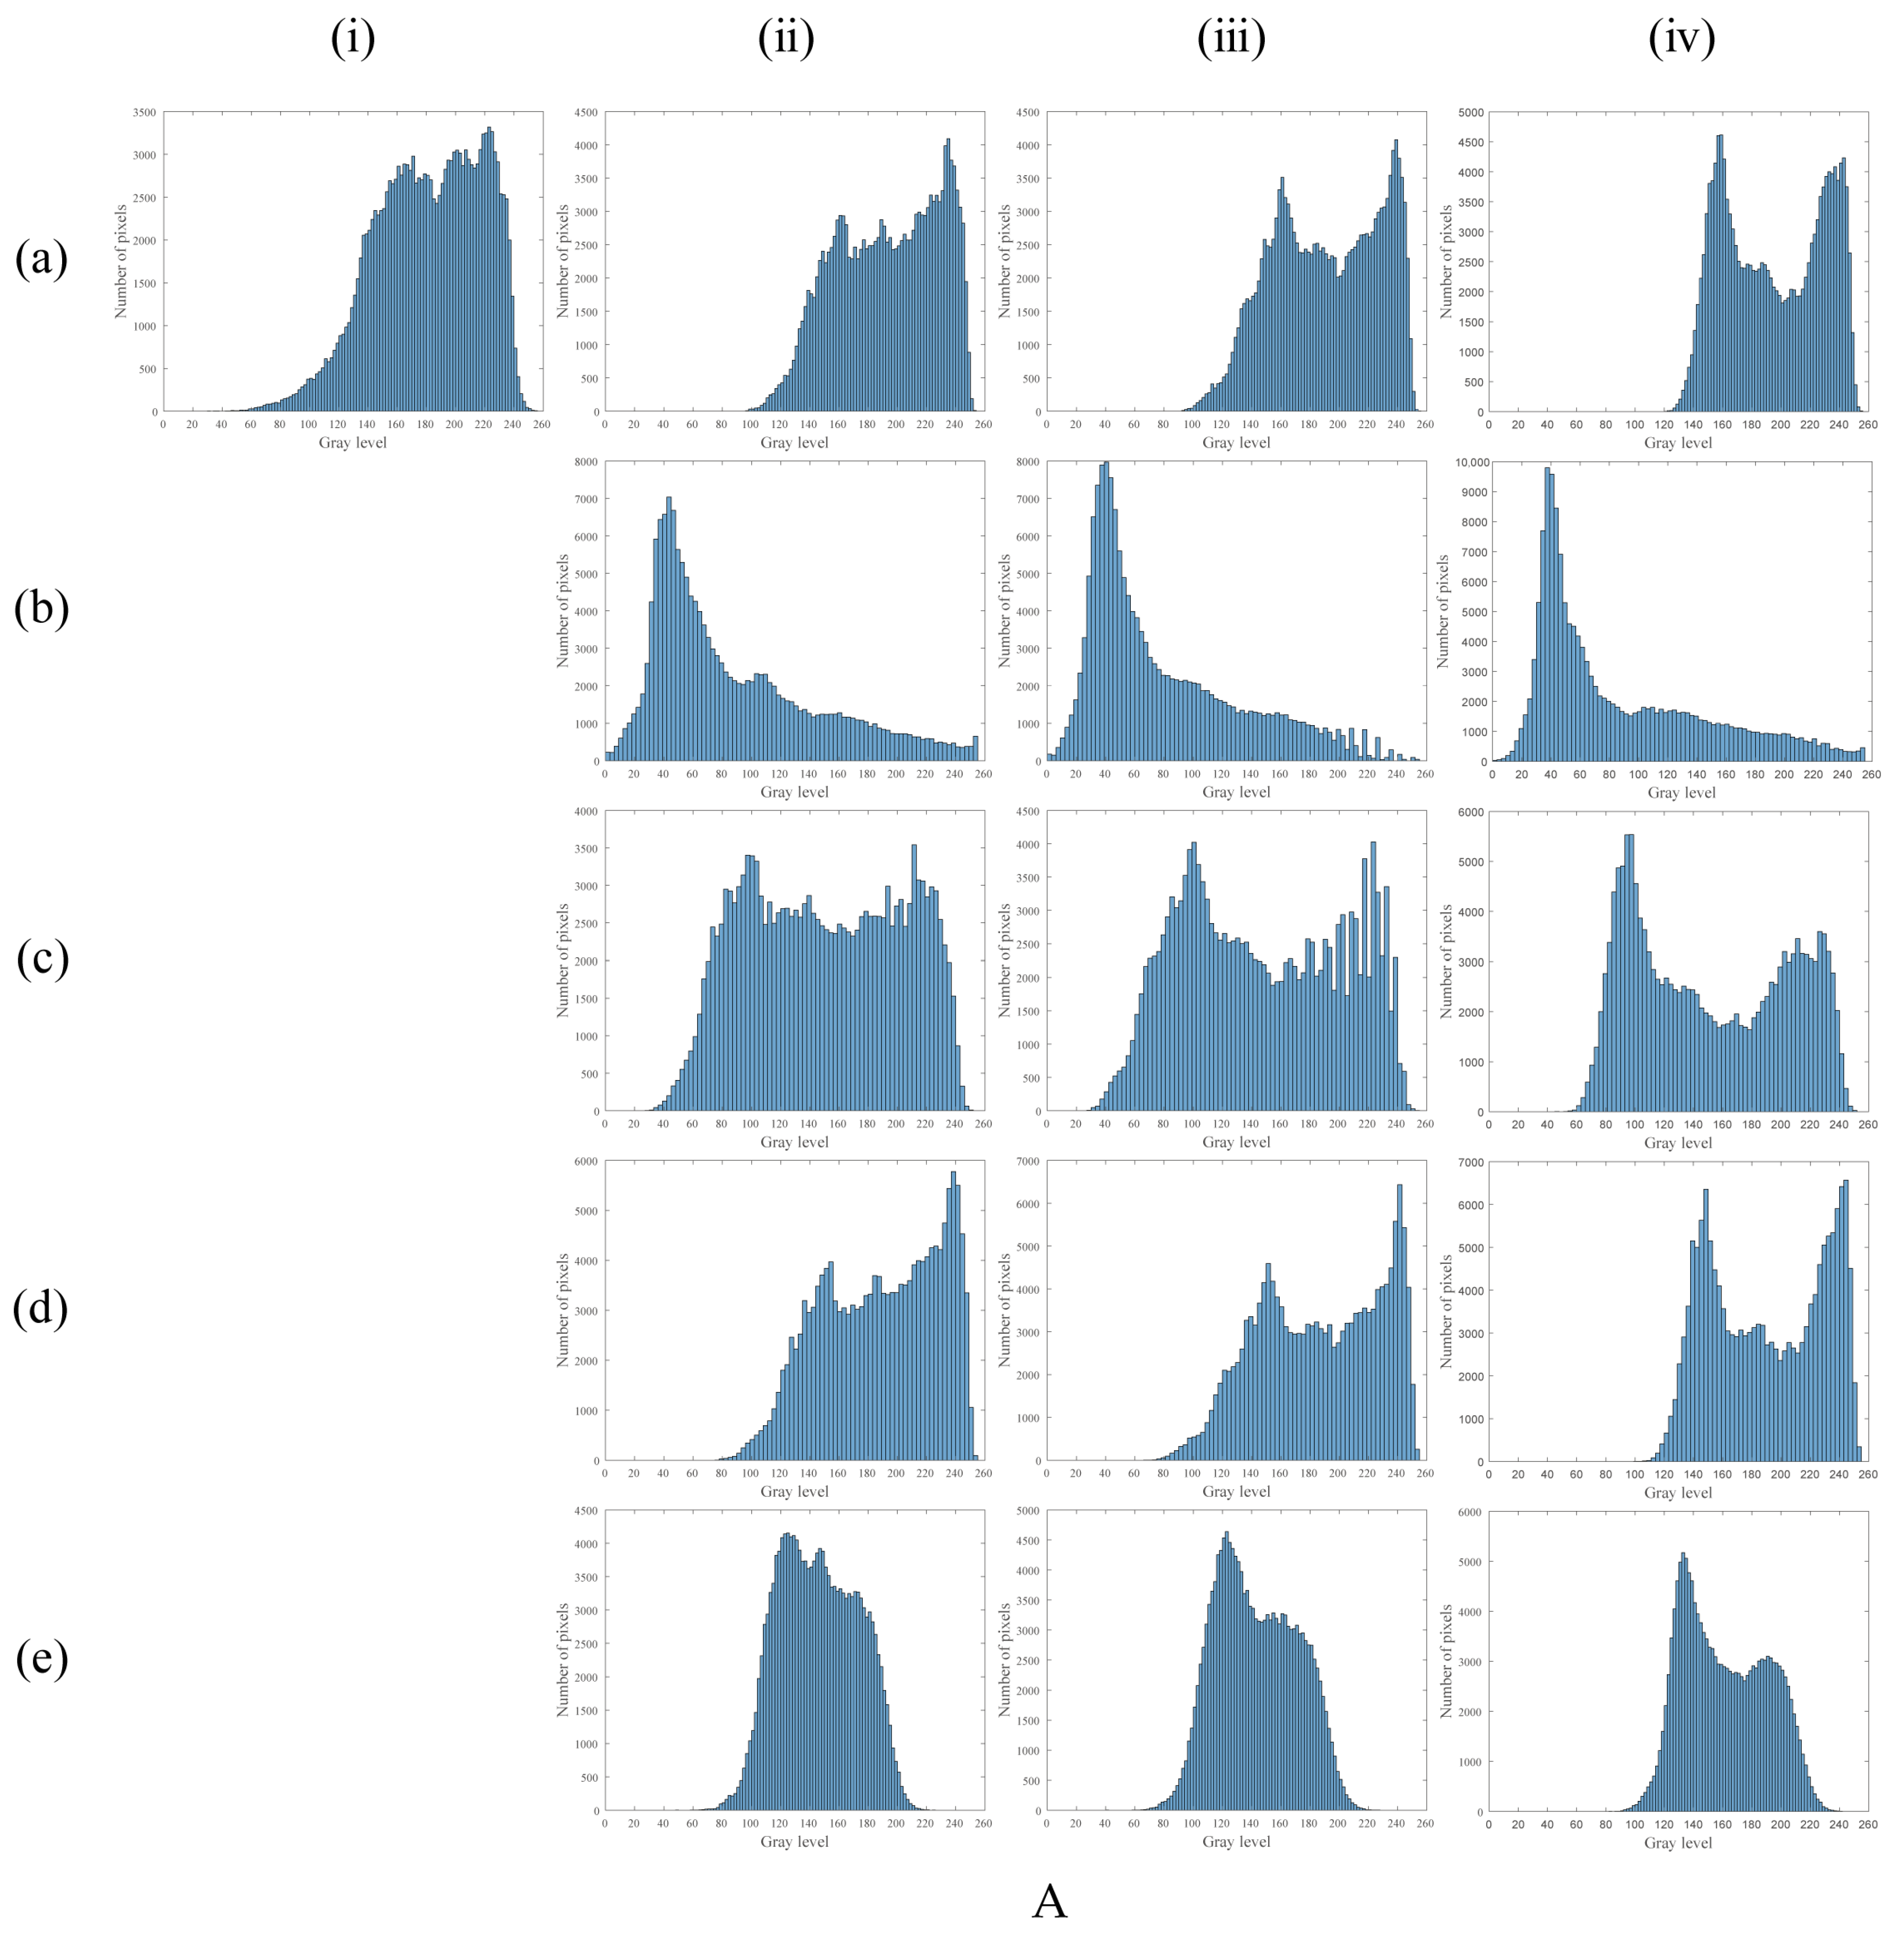
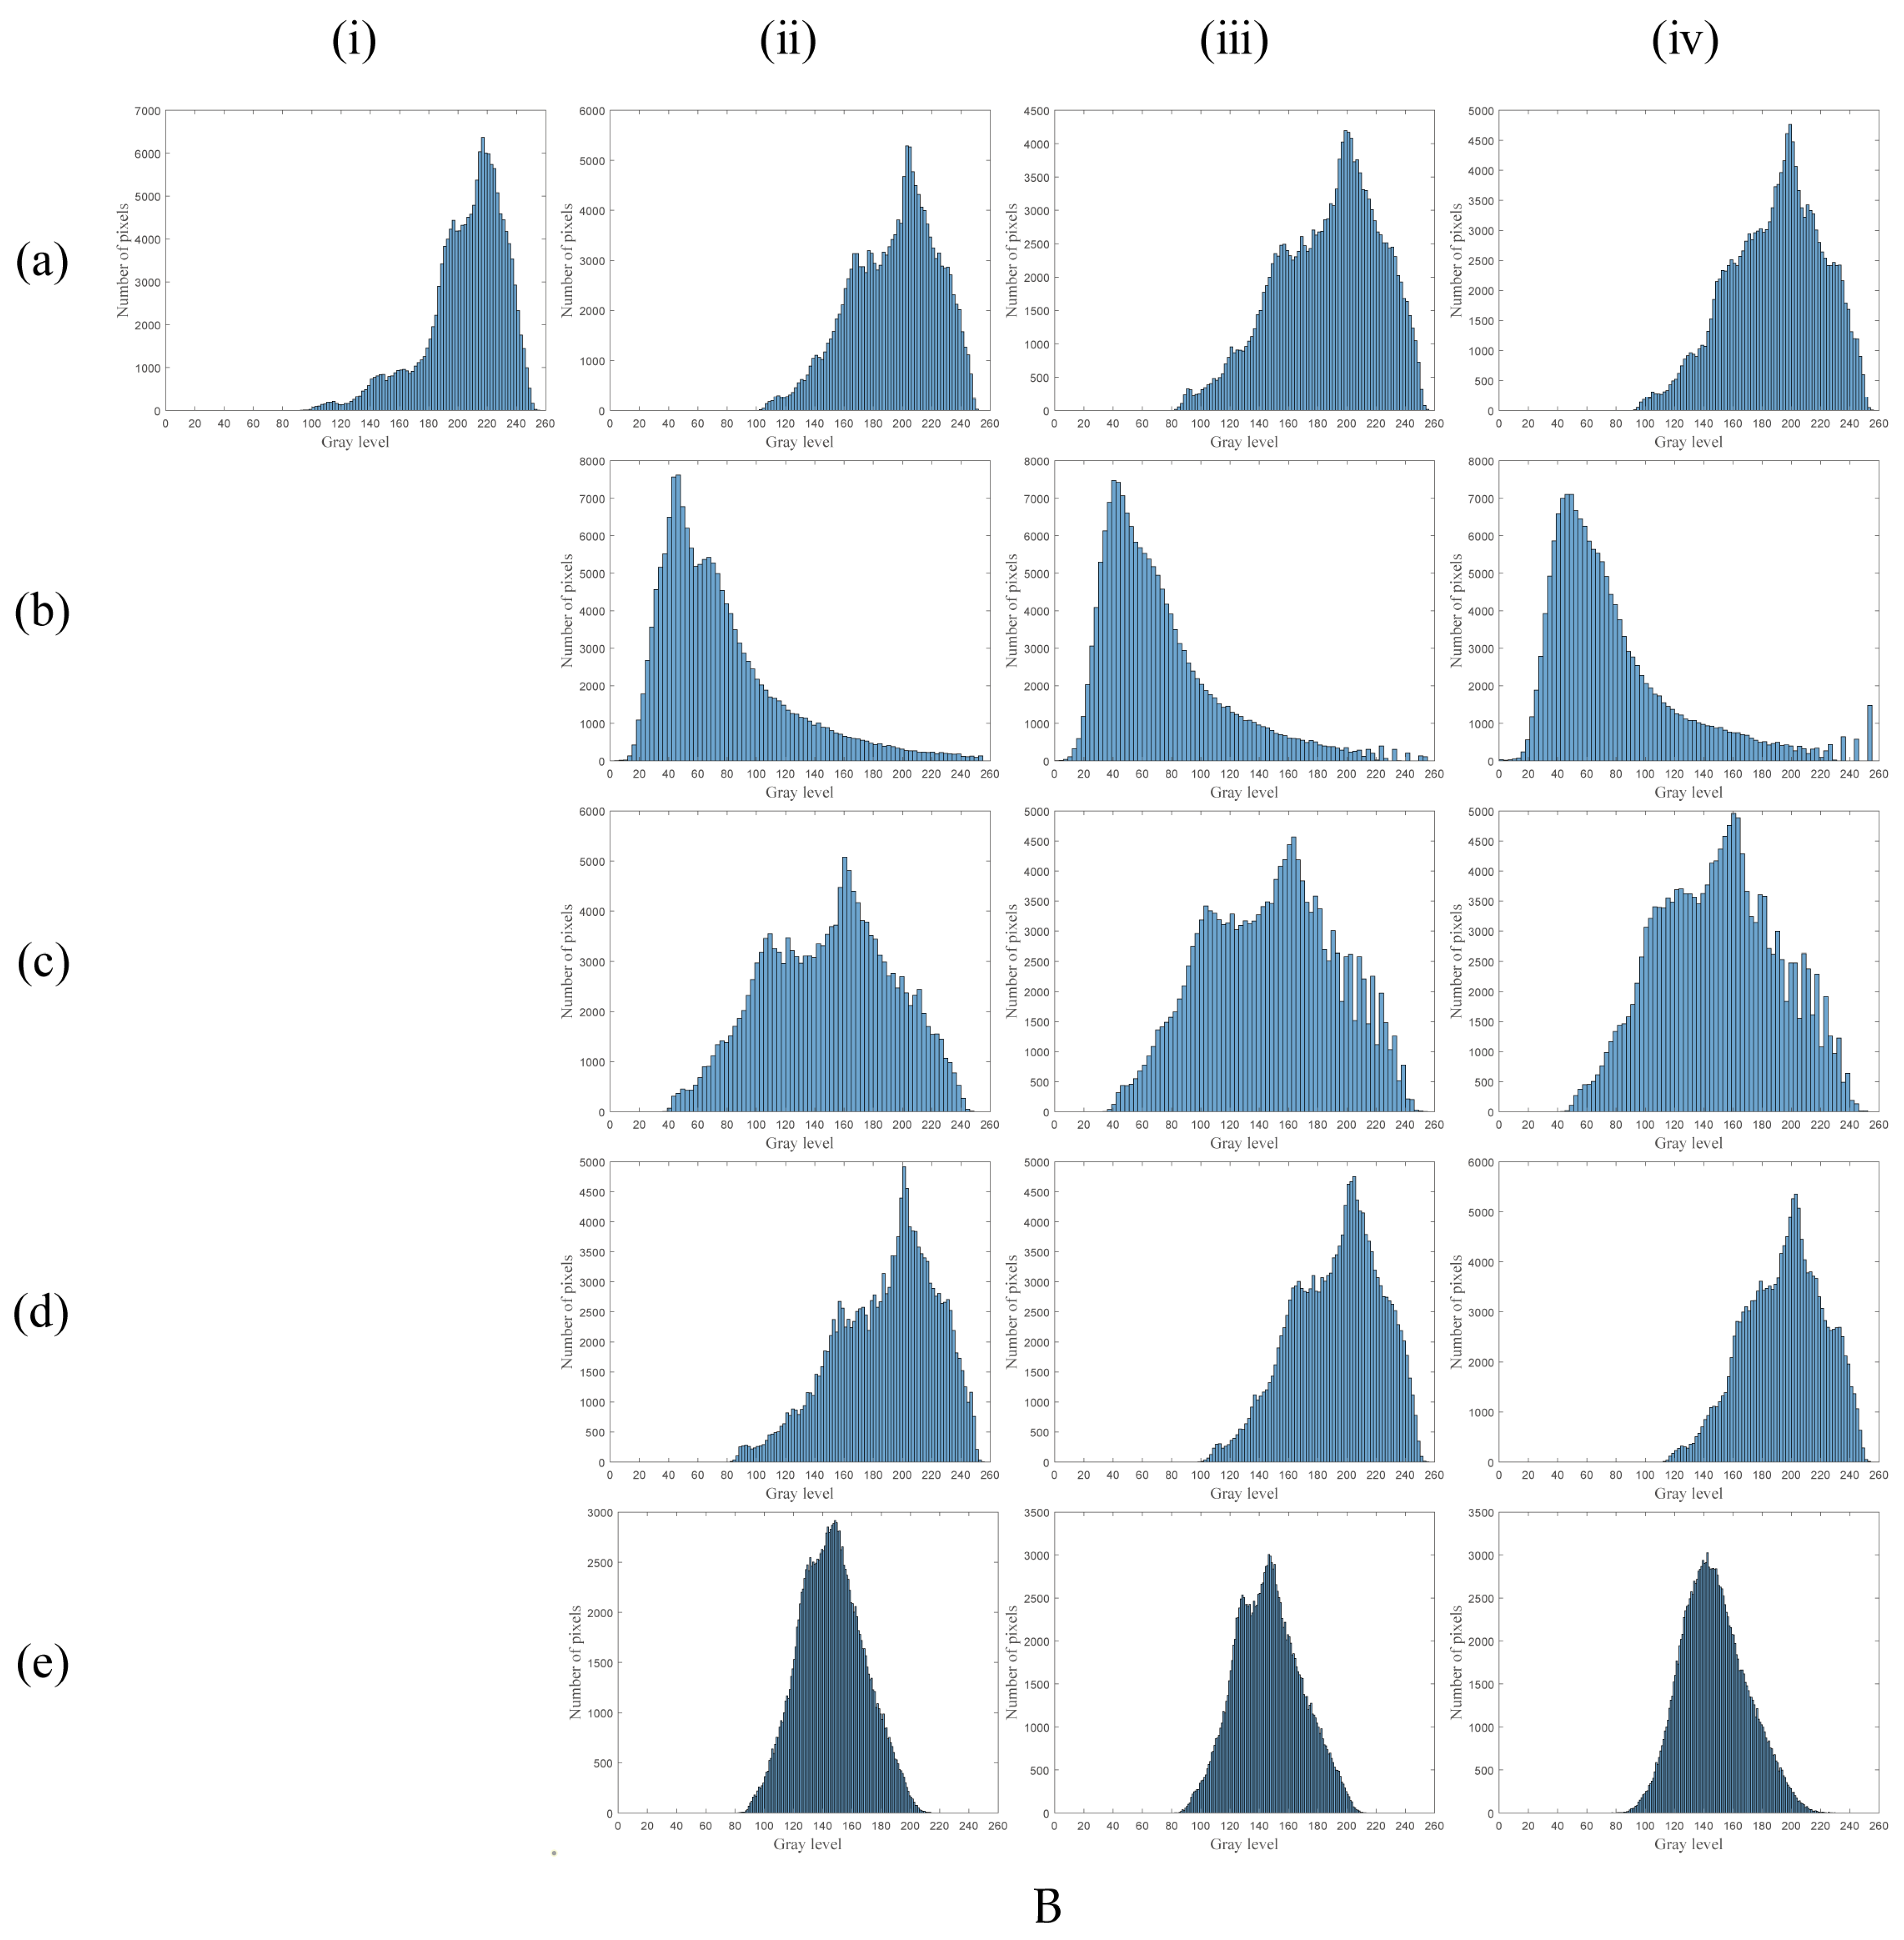
Figure 4.
Intensity values at black line (in Figure 2) for different images: (a) Layer 1 and (b) Layer 2. Images from left to right correspond to concentrations of 7:1, 6:1, and 5:1. Legends a–f represent ground truth, original image, DCP, AOD-Net, FFA-Net, and PBD, respectively. The curves in the black box show the depths on the edge of the sample.
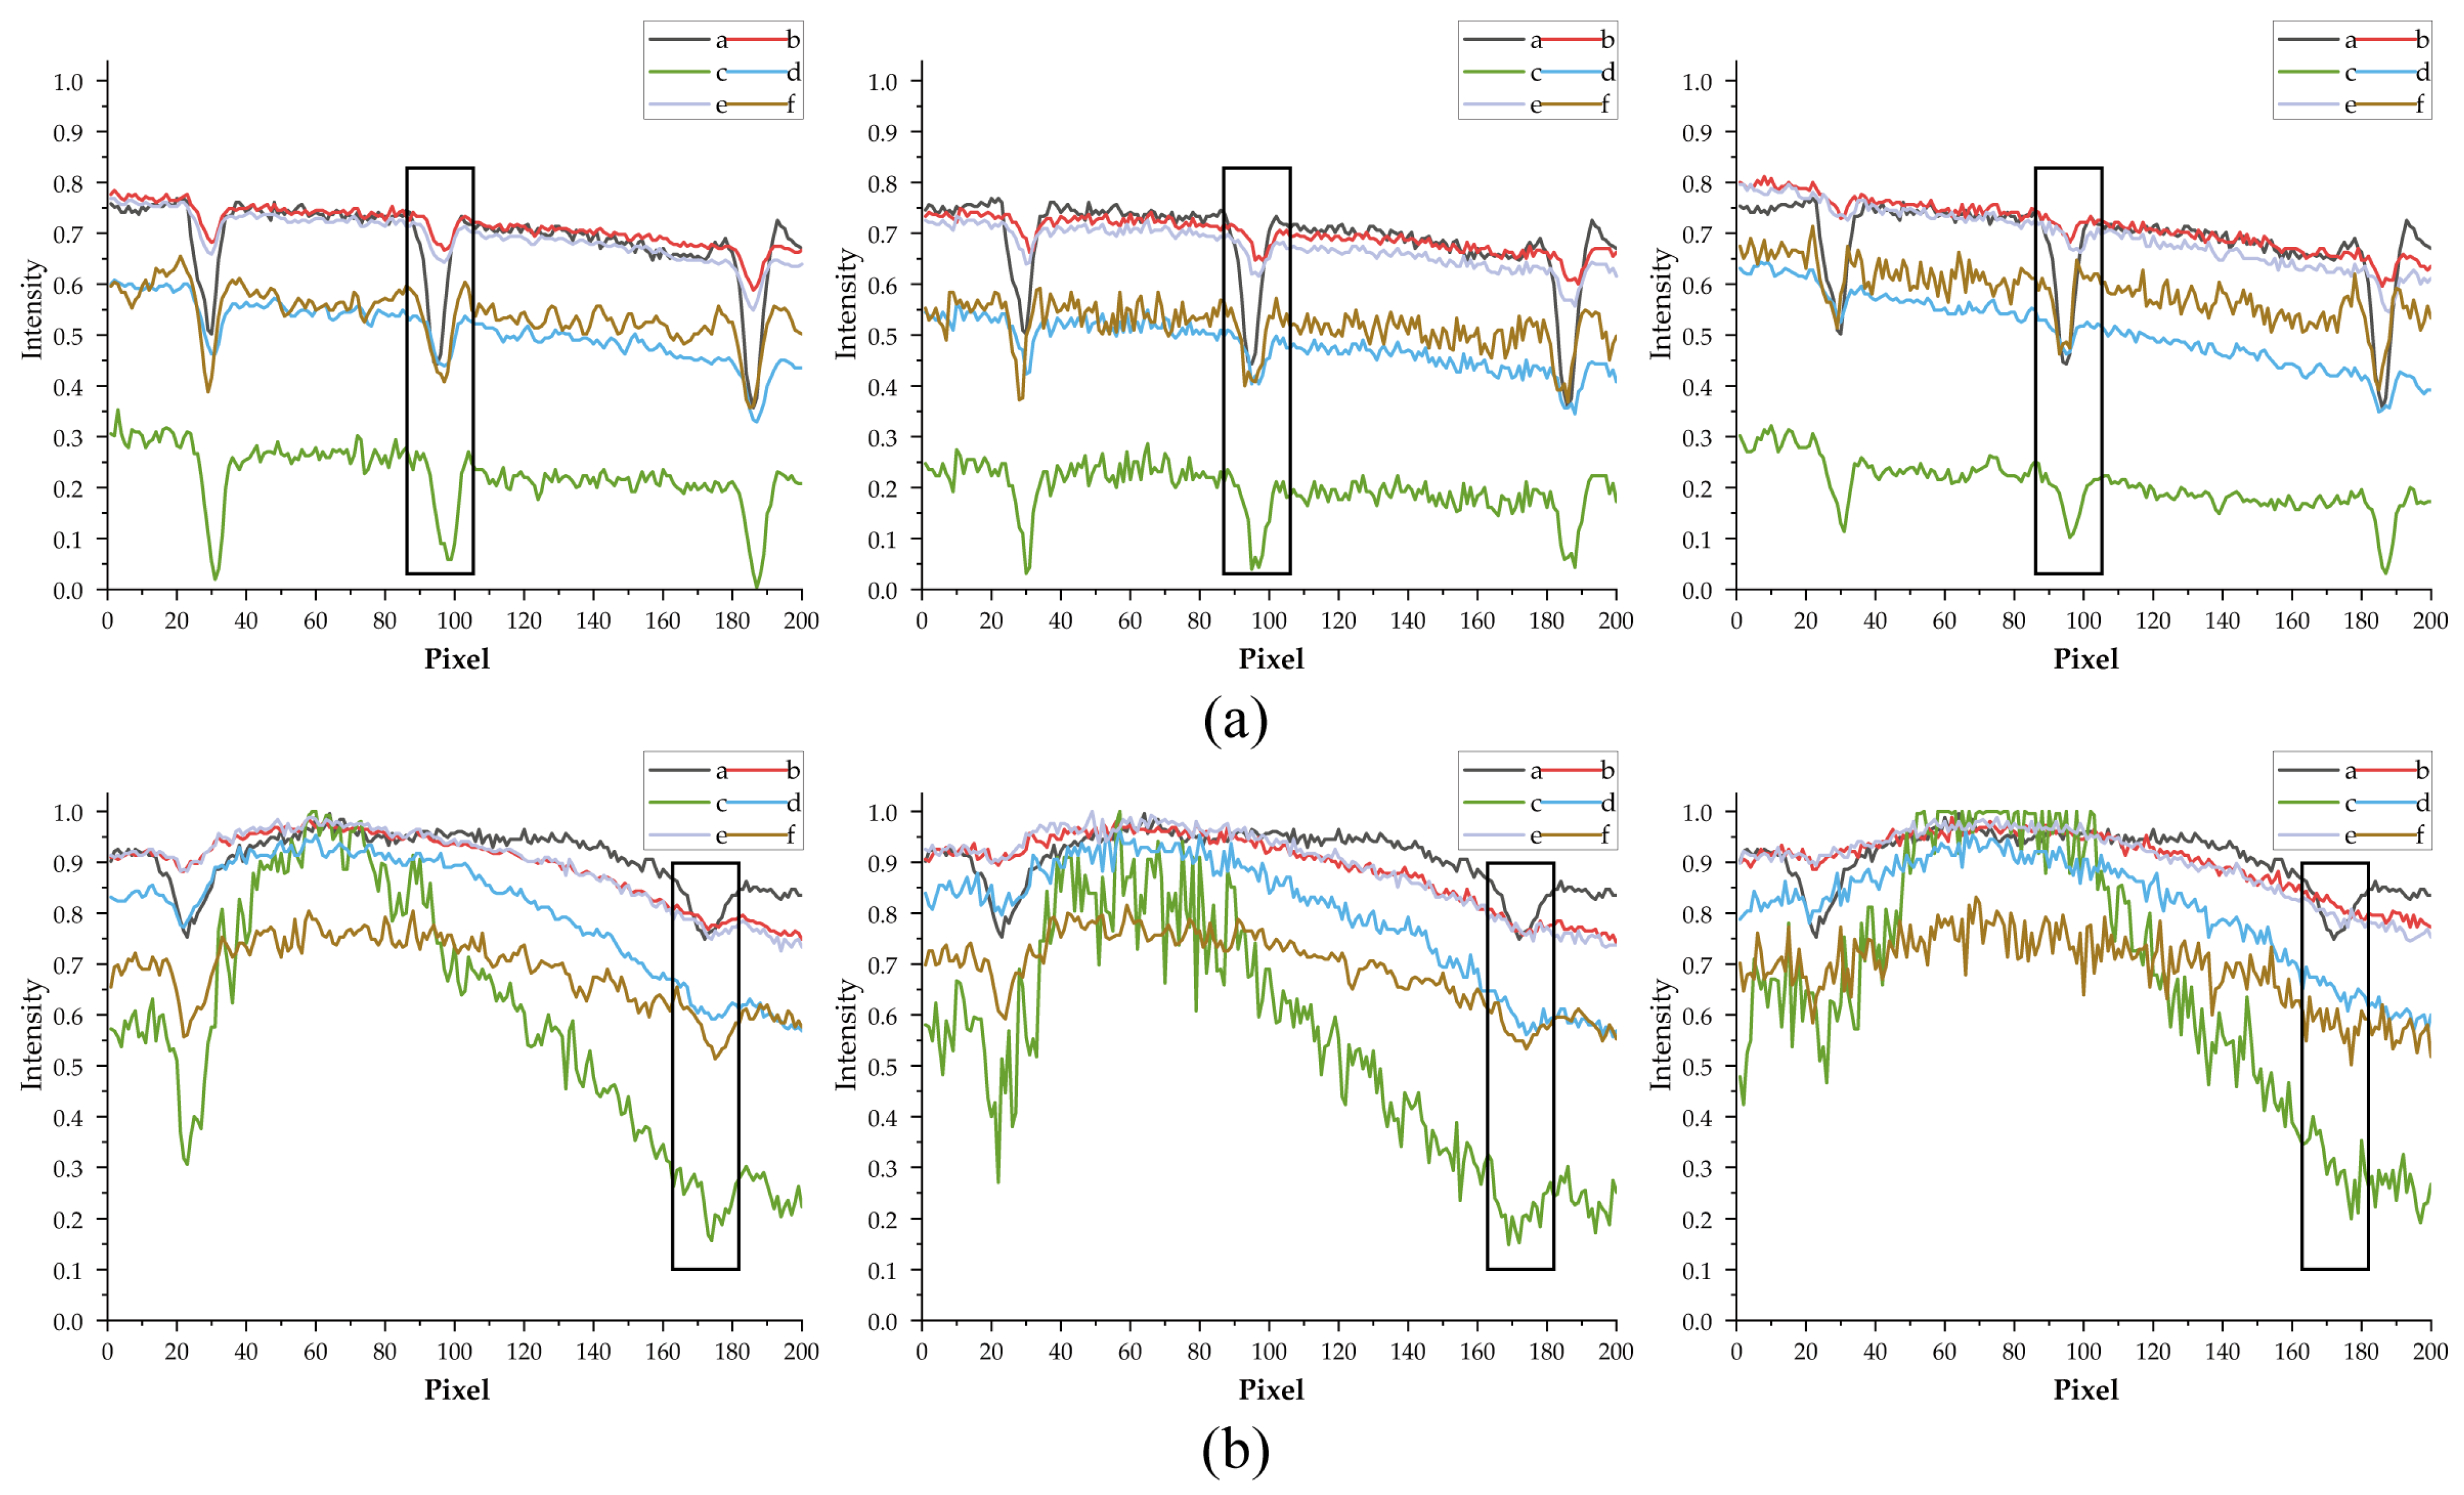
Figure 5.
Experimental and post-processing images: (A) Layer 1, (B) Layer 2, and (C) Layer 3. (ⅰ) Water (ground truth), (ⅱ) 16: 1, (ⅲ) 8: 1, (ⅳ) 7: 1, and (ⅴ) 6:1. (a) Images captured by the Color Camera in different media environments (original images), (b) DCP, (c) AOD-Net, (d) FFA-Net, and (e) PBD.
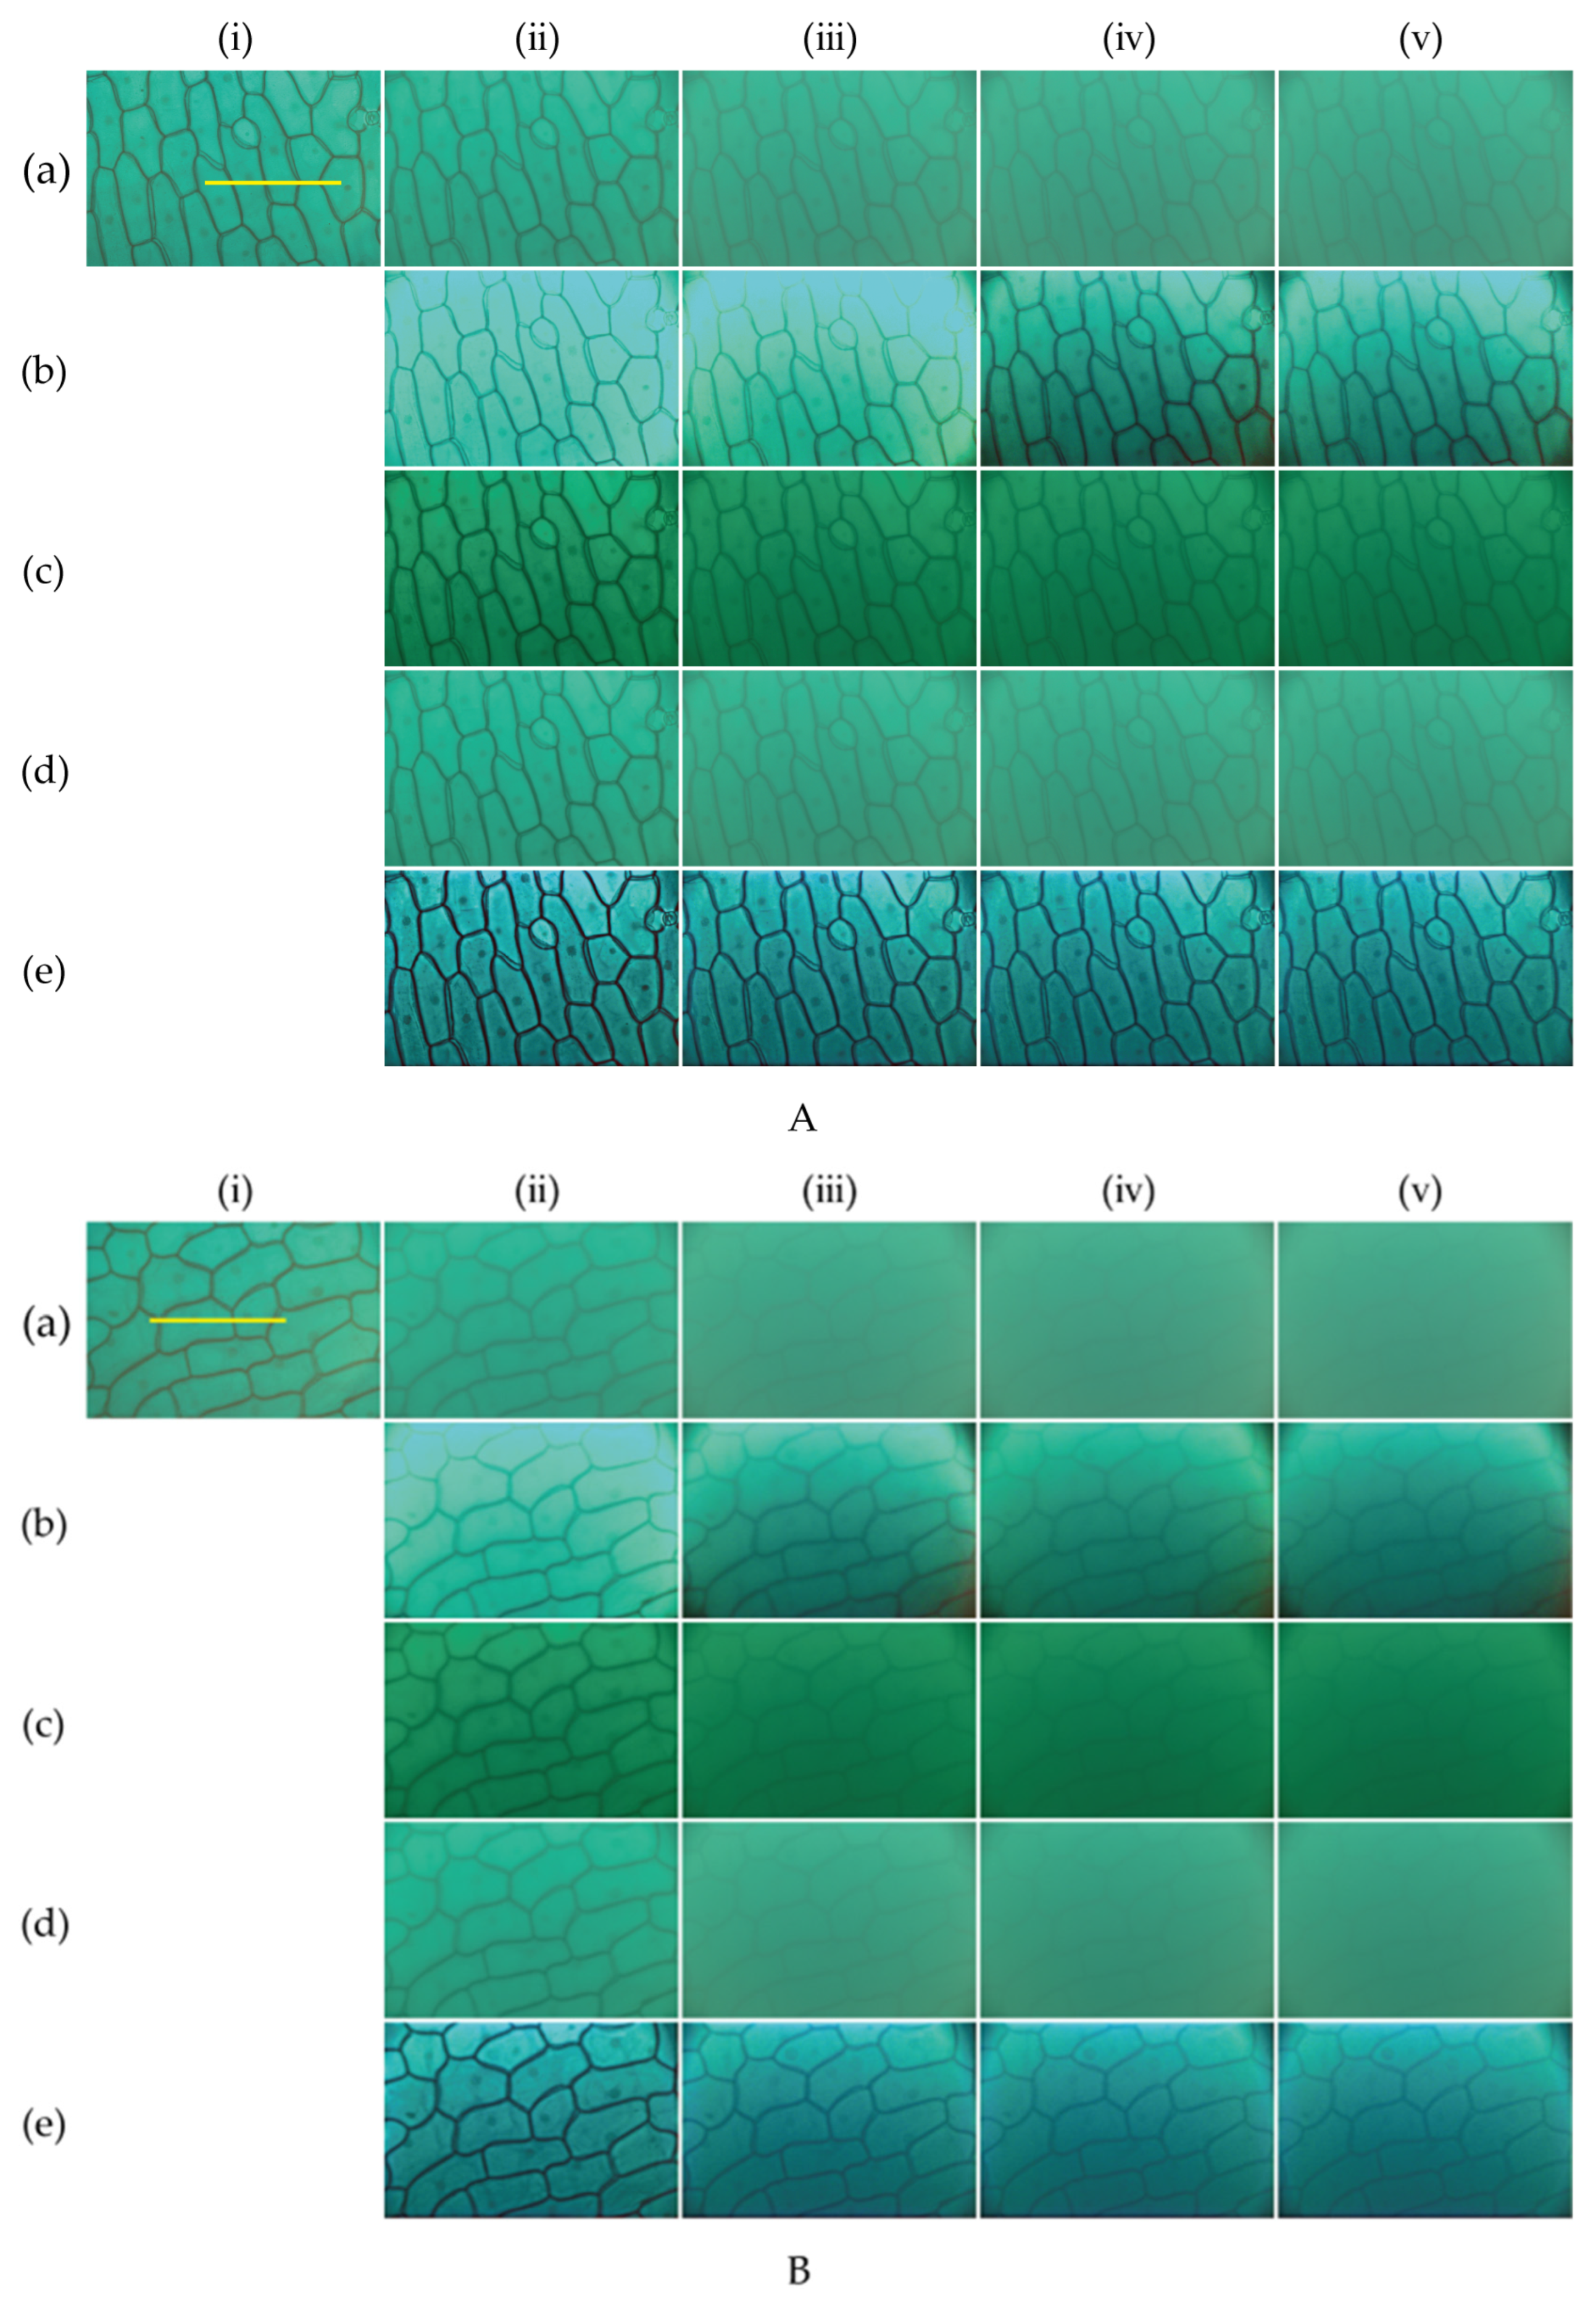
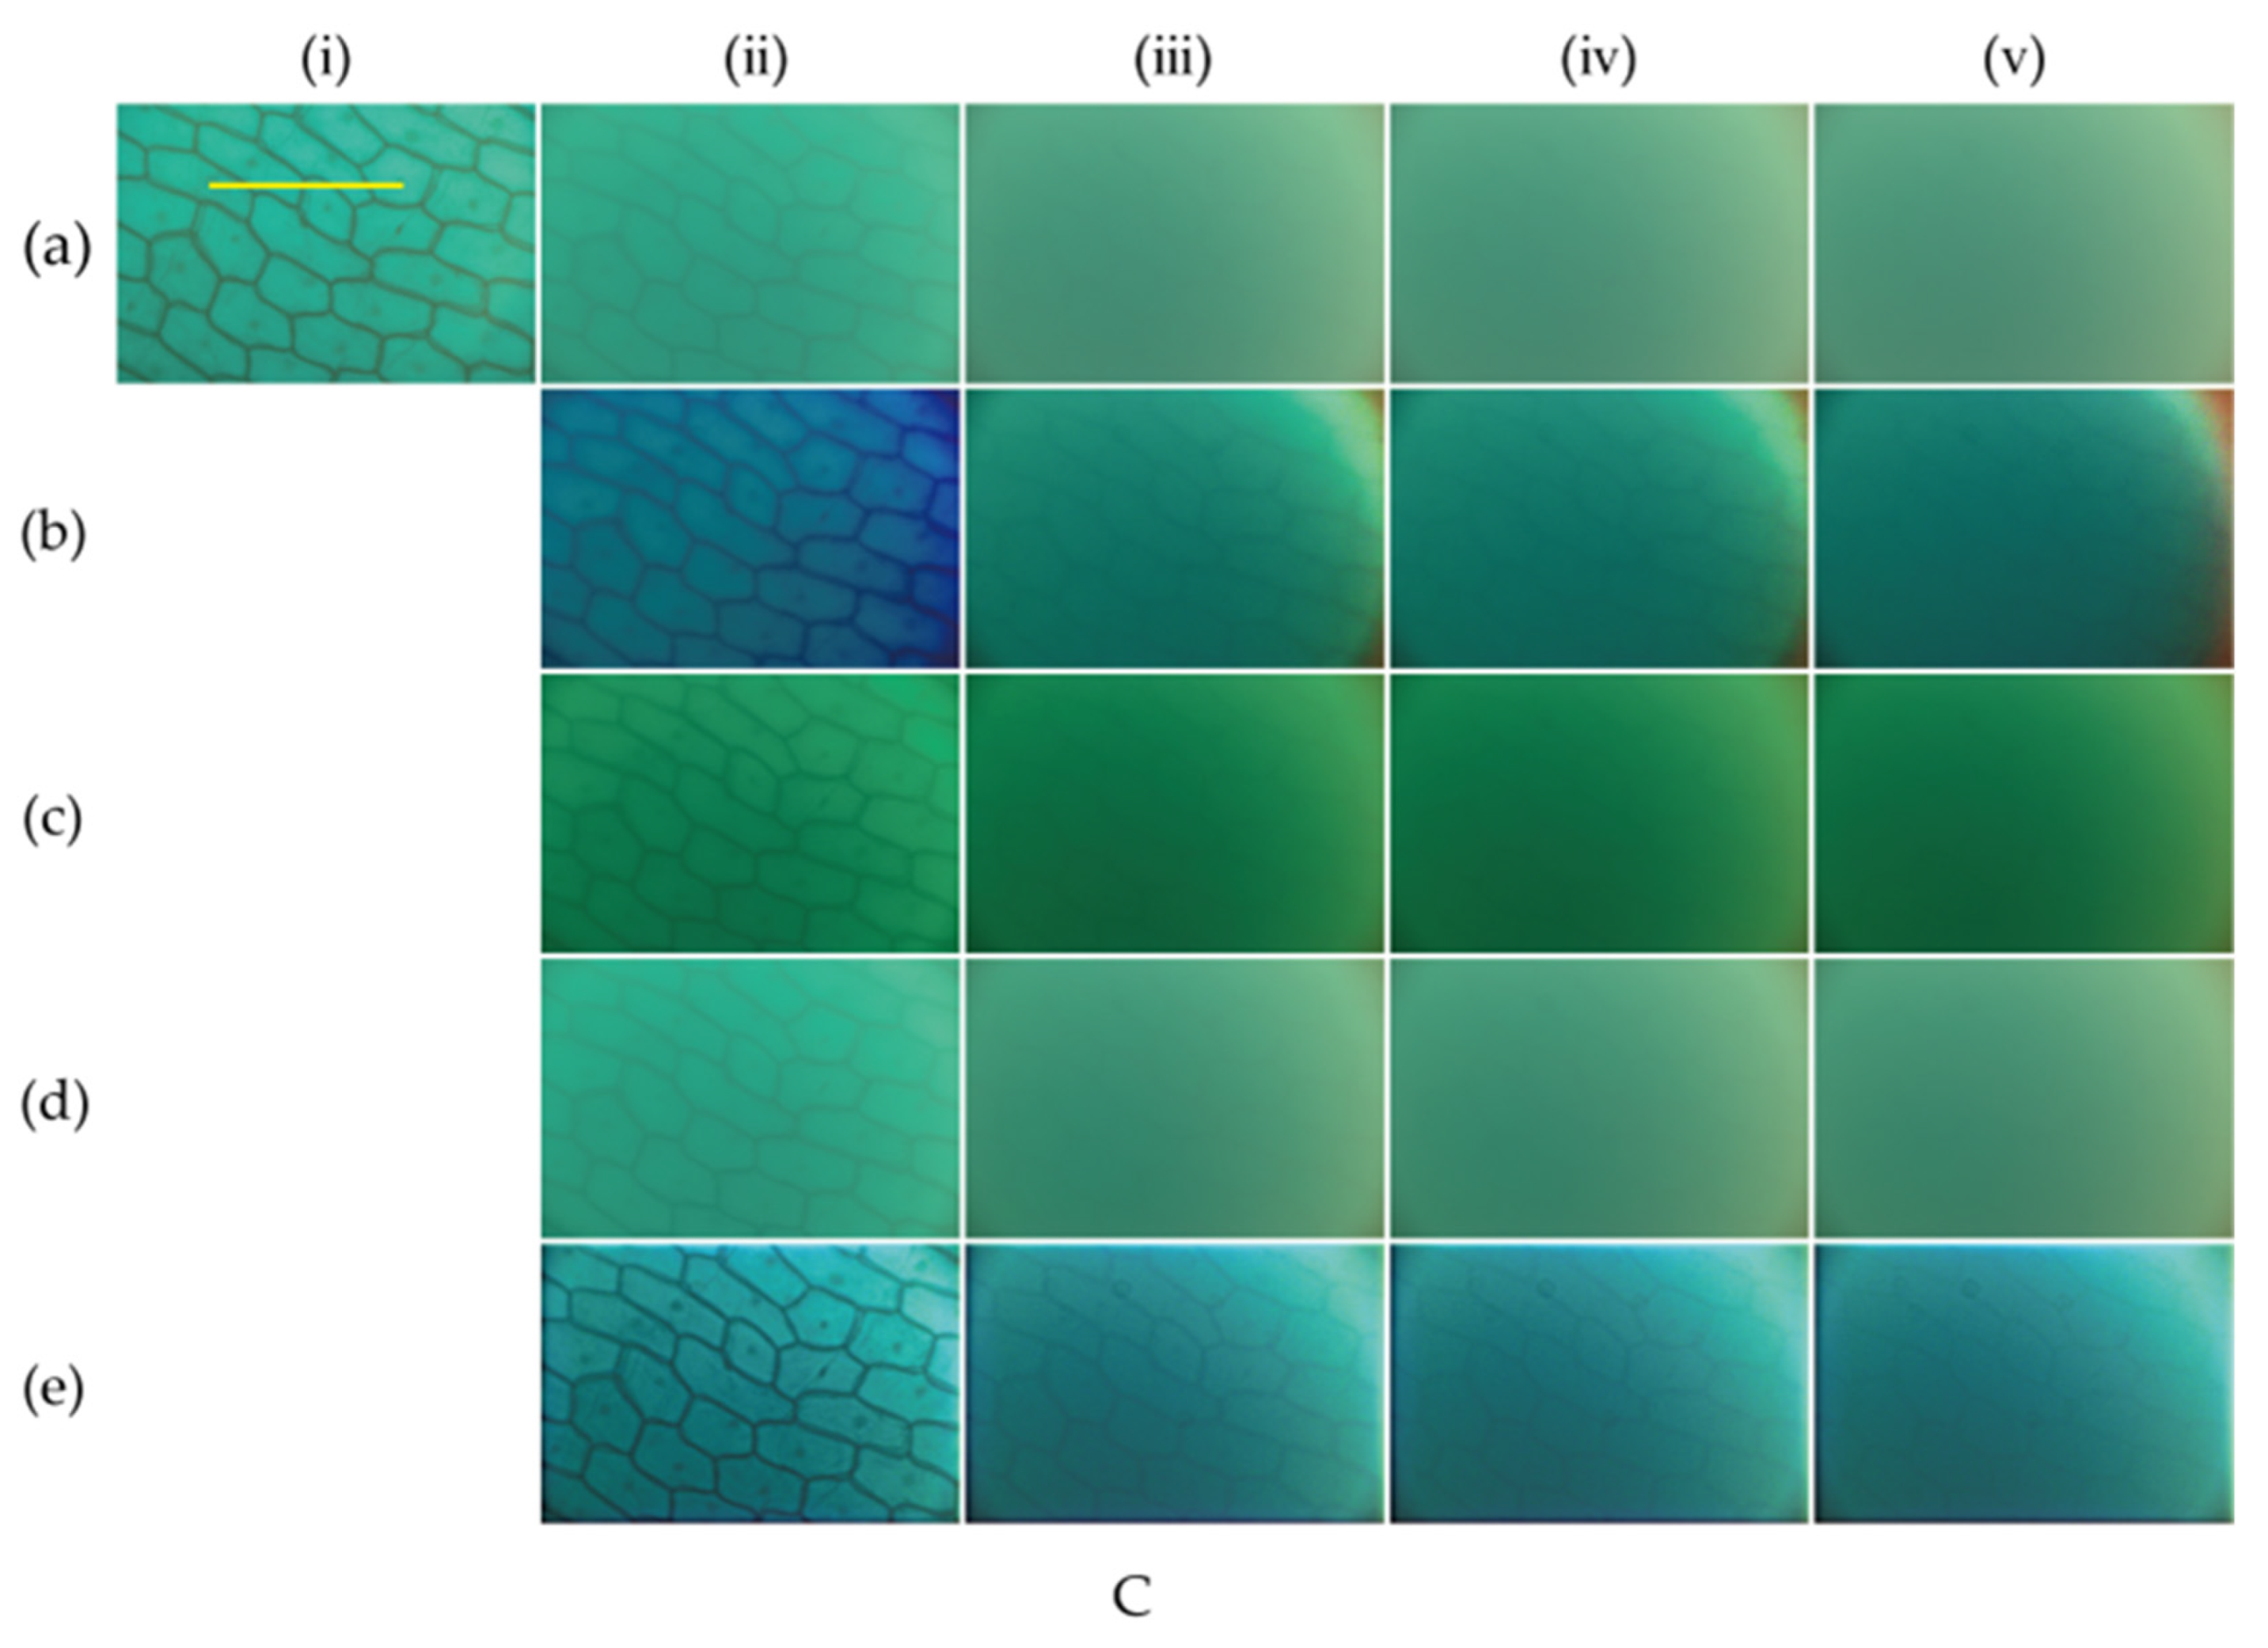
Figure 6.
Intensity values at yellow line (in Figure 5) for different images: (a) Layer 1, (b) Layer 2, and (c) Layer 3. Images from left to right correspond to concentrations of 16:1, 8:1, 7:1, and 6:1. Legends a–f represent ground truth, original images, DCP, AOD-Net, FFA-Net, and PBD, respectively. The curves in the black box show the depths on the edge of the sample.

Table 1.
VIF values for reflected light source experiment.
| Original | DCP | AOD-Net | FFA-Net | PBD | ||
|---|---|---|---|---|---|---|
| Layer 1 | 7:1 | 0.044 | 0.050 | 0.058 | 0.055 | 0.100 |
| 6:1 | 0.038 | 0.071 | 0.058 | 0.051 | 0.111 | |
| 5:1 | 0.040 | 0.050 | 0.061 | 0.025 | 0.135 | |
| Layer 2 | 7:1 | 0.149 | 0.281 | 0.189 | 0.163 | 0.283 |
| 6:1 | 0.144 | 0.243 | 0.224 | 0.167 | 0.263 | |
| 5:1 | 0.077 | 0.118 | 0.112 | 0.084 | 0.118 |
Table 2.
VIF values for transmitted light source experiment.
| Original | DCP | AOD-Net | FFA-Net | PBD | ||
|---|---|---|---|---|---|---|
| Layer 1 | 16:1 | 0.070 | 0.107 | 0.090 | 0.080 | 0.121 |
| 8:1 | 0.031 | 0.076 | 0.041 | 0.035 | 0.106 | |
| 7:1 | 0.028 | 0.076 | 0.038 | 0.031 | 0.123 | |
| 6:1 | 0.026 | 0.074 | 0.034 | 0.028 | 0.112 | |
| Layer 2 | 16:1 | 0.043 | 0.090 | 0.058 | 0.051 | 0.131 |
| 8:1 | 0.033 | 0.104 | 0.045 | 0.036 | 0.126 | |
| 7:1 | 0.034 | 0.098 | 0.046 | 0.038 | 0.135 | |
| 6:1 | 0.033 | 0.100 | 0.044 | 0.036 | 0.126 | |
| Layer 3 | 16:1 | 0.039 | 0.074 | 0.053 | 0.045 | 0.133 |
| 8:1 | 0.036 | 0.083 | 0.049 | 0.039 | 0.117 | |
| 7:1 | 0.036 | 0.081 | 0.049 | 0.039 | 0.115 | |
| 6:1 | 0.035 | 0.083 | 0.049 | 0.039 | 0.101 |
Disclaimer/Publisher’s Note: The statements, opinions and data contained in all publications are solely those of the individual author(s) and contributor(s) and not of MDPI and/or the editor(s). MDPI and/or the editor(s) disclaim responsibility for any injury to people or property resulting from any ideas, methods, instructions or products referred to in the content. |
© 2023 by the authors. Licensee MDPI, Basel, Switzerland. This article is an open access article distributed under the terms and conditions of the Creative Commons Attribution (CC BY) license (https://creativecommons.org/licenses/by/4.0/).
Share and Cite
MDPI and ACS Style
Zhang, S.; Liang, J.; Jiang, Y.; Ren, L. Polarization-Based De-Scattering Imaging in Turbid Tissue-like Scattering Media. Photonics 2023, 10, 1374. https://doi.org/10.3390/photonics10121374
AMA Style
Zhang S, Liang J, Jiang Y, Ren L. Polarization-Based De-Scattering Imaging in Turbid Tissue-like Scattering Media. Photonics. 2023; 10(12):1374. https://doi.org/10.3390/photonics10121374
Chicago/Turabian StyleZhang, Shirong, Jian Liang, Yanru Jiang, and Liyong Ren. 2023. "Polarization-Based De-Scattering Imaging in Turbid Tissue-like Scattering Media" Photonics 10, no. 12: 1374. https://doi.org/10.3390/photonics10121374
Note that from the first issue of 2016, this journal uses article numbers instead of page numbers. See further details here.