
Variability on Functionally Graded Plates’ Deflection Due to Uncertainty on Carbon Nanotubes’ Properties


1
CIMOSM, Centro de Investigação em Modelação e Otimização de Sistemas Multifuncionais, ISEL/IPL, Instituto Superior de Engenharia de Lisboa, 1959-007 Lisboa, Portugal
2
DCeT, Universidade Aberta & CEMAPRE/REM, ULisboa & CIMOSM, ISEL, 1269-001 Lisboa, Portugal
3
CIMA—Research Centre for Mathematics and Applications & CIMOSM, ISEL, 7000-671 Évora, Portugal
4
IDMEC, IST-Instituto Superior Técnico, Universidade de Lisboa, 1049-001 Lisboa, Portugal
*
Author to whom correspondence should be addressed.
Math. Comput. Appl. 2024, 29(2), 22; https://doi.org/10.3390/mca29020022
Submission received: 15 February 2024
/
Revised: 13 March 2024
/
Accepted: 14 March 2024
/
Published: 16 March 2024
(This article belongs to the Special Issue Mathematical and Computational Approaches in Applied Mechanics: A Themed Issue Dedicated to Professor J.N. Reddy)
Abstract
:Carbon nanotubes are widely used as material reinforcement in diverse fields of engineering. Being that their contribution is significant to improving the mean properties of the resulting materials, it is important to assess the influence of the variability on carbon nanotubes’ material and geometrical properties to structures’ responses. This work considers functionally graded plates constituted by an aluminum continuous phase reinforced with single-walled or multi-walled carbon. The nanotubes' weight fraction evolution through the thickness is responsible for the plates’ functional gradient. The plates’ samples are simulated considering that only the nanotubes’ material and geometrical characteristics are affected by uncertainty. The results obtained from the multiple regression models developed allow us to conclude that the length of the nanotubes has no impact on the maximum transverse displacement of the plates in opposition to the carbon nanotubes’ weight fraction evolution, their internal and external diameters, and the Young’s modulus. The multiple regression models developed can be used as alternative prediction tools within the domain of the study.
1. Introduction
Functionally graded materials (FGM) are advanced composite materials with well-known advantages and applications [1] when compared to traditional composites. This is evident in the minimization of abrupt stress transitions which are characteristic of these latter. Simultaneously, the recognition of carbon nanotubes’ (CNTs) attractive physicochemical structural abilities has motivated a large number of studies as well as applications in a wide range of sectors, as referred to in the review developed by Gupta et al. [2] 2019. More recent applications include CNTs composite fibers for electronic textiles, CNT-coated electrodes for probing neurons in the cerebrum, and bio-compatible materials for scaffolding in tissue engineering as mentioned by Rathinavel et al. [3].
A significant number of reviews focusing on a diversity of structural, mechanical, and physical characteristics of CNTs have been developed so far, those referenced here being only some of the most recent. Hence, among others, one may refer to the review paper by Liew et al. [4], which focused on the relevance of CNTs in functionally graded materials and the graded patterns of such reinforcements. The review also includes a survey of mechanical analysis of functionally graded carbon nanotube-reinforced composites and discusses recent advances and prospects in this field of research. Another review study was performed by Radhamani et al. [5] on carbon nanotubes’ reinforced metal and steel nanocomposites. In this review, topics such as carbon nanotubes’ dispersion uniformity, interfacial bonding, weight fraction, length, and alignment with the matrix are examined against the nanocomposites’ properties enhancement. The authors also discuss possible paths to overcome technical challenges and potential applications of those nanocomposites. Vinyas et al. [6] performed a comprehensive review of the analysis of nanocomposites, covering the manufacturing processes to the properties’ characterization, to identify the various methodologies, techniques, theories, and formulations that are used in nanocomposite technology. The use of graphene and its derivatives, particularly graphene platelets as relevant nanofillers for composites due to superior mechanical properties, was the object of a review work done by Zhao et al. [7]. The paper reviews graphene’s mechanical properties, outlines functionally graded materials and functionally graded graphene platelets reinforced composites, discusses micromechanics models, and explores key problems and future research directions. Another review on CNTs, their properties, synthesis methods, and applications in micro and nanotechnology was developed by Shoukat and Khan [8]. In that work, various types of carbon nanotubes are explored, with details on their electrical conductance, resistivity, and thermal conductivity. Besides specific growth methods for the carbon nanotubes, the paper also describes formation methods, and applications of CNTs in electronics, biomedicine, and chemical sensors. Soni et al. [9] performed a comprehensive review of recent research on functionally graded carbon nanotubes reinforced composites, covering experimental and theoretical studies on the mechanical, vibration, thermal, thermo-mechanical, and low-velocity impact responses of those structures and/or structural components. The authors also discuss challenges and potential research paths.
From a more general perspective, functionally graded materials and the structures built from this type of advanced composites continue to draw the attention of several researchers. To name only a few, one can refer to the recent works of Valencia Murillo et al. [10], Kurpa et al. [11], and Alghanmi and Aljaghthami [12].
Considering the subject of the present work, it was relevant to compile references ranging from the CNTs properties’ experimental and theoretical characterization to their modeling and integration as reinforcement into continuous material phases. A significant number of research works can be found in these domains. Among them, we can cite, for example, the investigation conducted by Ruoff and Lorents [13], which focused on the mechanical and thermal properties of CNTs. This study resulted in deriving the tensile and bending stiffness constants of ideal multi-walled and single-walled carbon nanotubes (MWCNTs, SWCNTs), and further extending the study to the characterization of their fundamental frequency. The authors suggested that the thermal expansion of CNTs would be essentially isotropic in contrast with the anisotropic character observed for carbon fibers and in graphite. The strength of the interface between the CNTs and the continuous matrix phase and the importance of achieving high-strength nanotube-reinforced composites was emphasized. Another research work involving the preparation of long carbon nanotubes, and the corresponding mechanical and physical property characterization, was carried out by Xie et al. [14], wherein they discussed the correlation among the obtained results with the CNTs microstructure.
A study on the thermo-mechanical properties of epoxy-based nanocomposites containing low-weight fractions of randomly oriented carbon nanotubes was developed by Fidelusa et al. [15]. The authors produced the nanocomposites with two epoxy resins and in both cases, a good dispersion of the nanotubes was exhibited. While moderate improvements in the tensile Young’s modulus were observed, more significant enhancement in tensile impact toughness was evident for specific nanocomposites. The glass transition temperature showed no significant alterations and the elastic modulus of SWCNTs exceeded the Krenchel model predictions for short-fiber composites with random orientation.
Martone et al. [16] investigated the reinforcement efficiency arising from the use of CNTs with varying aspect ratios in an epoxy system. They concluded that this efficiency wasn’t only influenced by the nanotubes’ high modulus but also by their aspect ratio. Qiu and Yang [17] presented a study on the structure and properties of CNTs, where their geometric structure and their strong carbon–carbon chemical bonds were investigated, and found to contribute to relevant electronic, mechanical, and thermal properties. The authors also provided a summary and an outlook on foreseen potential developments in the field. The impact on the viscoelastic behavior of sandwich structures by integrating through-thickness graded core materials and nanocomposite skins with homogeneous or graded properties where the viscoelastic behavior of the sandwich core was modeled using the complex method was investigated by Loja [18]. It was concluded that effective design solutions for specific structural requirements can be achieved by considering such material design variables/profiles.
When the scale level of modeling requires a more refined approach because an average response is not sufficiently representative, the use of nonlocal approaches needs to be considered. This is well illustrated, for example, by the prediction needs arising from the increasing trend of electronic devices’ miniaturization in different application fields and, from the use of functionally graded material systems in nano and microdevices. For such small-sized structures, the relevance of size dependency effects cannot be ignored, thus requiring the use of nonlocal approaches as noted by Eringen [19].
Many published works straightly related to the characterization of nanostructure and microstructure behavior can be found in the literature. Among others, one may refer to the literature review developed by Garg et al. [20] where the authors present a review of theories and methodologies used to investigate the behavior of nanostructures, where size-dependent and size-independent theories are discussed in detail.
To refer to some works in this context, Reddy and Pang [21] presented analytical solutions based on nonlocal approaches of the Euler–Bernoulli and Timoshenko beam theories to assess the size–dependency effect on the bending, buckling, and free natural vibrations of carbon nanotubes, modeled as straight beams. More recently, Kong et al. [22] investigated the influences of various parameters on the thermal buckling and post-buckling responses of functionally graded CNTs’ reinforced nanobeams. To this purpose, the authors developed a formulation based on the Euler–Bernoulli theory, symmetry couple stress theory, and classical surface energy theory.
Reddy and Kim [23] studied the size effects on FGM nano and microplates by developing a general third-order theory of FGM plates accounting for a microstructure-dependent length scale parameter and the von Kármán nonlinearity. The theory considers temperature-dependent properties of the constituent materials, and the modified couple stress theory was used to incorporate a microstructural length scale parameter. Later, Liu et al. [24] presented a thin plate formulation based on isogeometric analysis, the modified couple stress theory, and the Kirchhoff theory to study the mechanical behavior of homogeneous and functionally graded microplates.
More recently, Thanh et al. [25] presented a study on the static bending behavior of functionally graded CNTs’ reinforced composite nanoplates with different CNT distributions. The authors used isogeometric analysis in association with a refined plate theory and the modified couple stress theory to capture the size-dependent effects and to demonstrate the influence of the length scale on the bending behaviors of the nanoplates. A free vibration study of isotropic gradient elastic thick non-rectangular microplates was developed by Zhang et al. [26], where the microstructure-dependent effects of microplates were accounted for by considering a negative second-order gradient elastic theory with symmetry.
From another perspective, relevant to the present work, the non-deterministic character of real structures’ behavior recommends its consideration in analyses. The uncertainty that affects the material and geometrical quantities involved in a problem definition and modeling has been the object of some studies. Different approaches and alternative descriptive and/or predictive models have been proposed for specific case studies. Although in a wider scope, one may refer in this context to the works by Sotiropoulos and Tserpes [27], Yin et al. [28], and Bouwer et al. [29].
Although theoretically, SWCNTs possess high ultimate strengths, experimental values demonstrate that these are considerably lower and exhibit variability, lacking clear information about this. Takakura et al. [30] presented the first experimental measurements of ultimate tensile strengths for individually defined SWCNTs. The authors found that the strength depends on the chiral structure with a small diameter. This led to the conclusion that near-armchair nanotubes display the highest strengths, thus pointing to the importance of, during the synthesis, targeting specific CNT structures.
In this context, recognizing the variability that affects structures and materials’ properties, García-Macías et al. [31] explored the use of CNT in advanced cementitious composites with self-sensing capabilities, highlighting the limited understanding of uncertainties in functionally graded composite materials. They considered a stochastic representation of gradient profiles and studied the uncertainty propagation in the response of the plates. To characterize the response of these plates, the finite element method was used, and for representing stochastic uncertainties in overall composite material properties, they used probability theory. Pouresmaeeli and Fazelzadeh [32] studied the static instability of functionally graded carbon nanotube-reinforced composite beams considering material and geometrical uncertainties. A non-probabilistic approach was employed to model some variables’ uncertainty propagation and sensitivity analysis was used to identify more significant ones. The influence of the nanotubes’ volume fraction on the buckling load variability was also studied. Also recognizing that deterministic analyses are insufficient to more adequately characterize FGM plates’ mechanical responses, Carvalho et al. [33] studied the effects of variability in material and geometrical parameters on the static and free vibration of those plates. Regression models were employed to describe these responses and to characterize the contribution of each model parameter to explaining response variability. A further study focused on exponentially graded plates with a functional gradient was developed by Rosa et al. [34]. In that study, the material and geometrical parameters for an exponentially graded plate were generated using a random multivariate normal distribution and Latin hypercube sampling. Subsequently, the linear static responses of these plates were obtained via the finite element method and correlated to the input parameters. Statistical models were established to serve as alternative description models.
Karsh et al. [35] proposed an approach to carry out a stochastic dynamic analysis of pre-twisted functionally graded plates. This approach was based on the combined use of an efficient neural network and the finite element method. From the results they achieved for the pre-twisted FGM cantilever plates, they assessed the influence of stochastic variations in geometric parameters, material properties, and temperature on the natural frequencies and mode shapes of those plates. The authors compared the efficiency and accuracy of artificial neural networks and polynomial neural networks to verify those results against direct Monte Carlo simulations. It was found that artificial neural networks can capture significant uncertainty effects on the dynamic responses of functionally graded plates without prejudice to the accuracy. Wang et al. [36] considered the use of extended support vector regression and Monte Carlo simulations to perform machine learning-aided stochastic free vibration analysis for FGM bar-type structures. The authors analyzed the influence of uncertainties on material properties, dimensions, and material gradient, and the approach was demonstrated to be computationally efficient and to provide accuracy. Gao et al. [37] presented a study on the probabilistic stability of functionally graded graphene platelets reinforced beams, using a non-inclusive Chebyshev metamodel with discrete singular convolution. Deterministic and probabilistic outcomes for critical buckling loads were obtained, including probability density functions, cumulative density functions (CDFs), means, and standard deviations. It was concluded that porosity distribution has a significant influence on the critical buckling load, followed by the porosity coefficient and graphene platelet weight fraction. A related investigation on the effects of the uncertainty in the free vibration responses of functionally graded porous nanocomposite shells with graphene platelet reinforcement was carried out by Baghlani et al. [38]. The authors considered the influence of material and geometry uncertainties, having used an interval analysis approach for the uncertainty analysis and Fourier differential quadrature for solving motion equations. It was found that the shells’ type of curvature has a significant effect on uncertainty propagation and frequency sensitivity.
The present work aims to characterize the influence of introducing uncertainty regarding the geometrical and material properties of SWCNTs and MWCNTs on the maximum static deflection of functionally graded plates. Considering the scale level of modeling required for the present work, the use of a homogenized, local approach can be considered appropriate, thus being the one selected.
The remainder of this paper is organized as follows: Section 2 describes the materials and the methodology used in this study, Section 3 presents the results of a verification case, Section 4 describes the simulation process and the discussion of the obtained results, and Section 5 draws the main conclusions.
According to the authors’ knowledge, and considering the literature search developed and illustrated in the present manuscript, no similar published works were found.
Overall, it is understood that a more complete understanding of the relative influence of CNTs’ characterizing parameters will enable not only a more adequate selection of such nano inclusions for a specific application but may be also useful for customization purposes in manufacturing phases.
2. Materials and Methods
2.1. Functionally Graded Materials
This work aims to analyze the variability of the static deflection of functionally graded plates whose mixture composition results from the incorporation of SWCNTs and MWCNTs into an aluminum, continuous phase. Although other material and geometrical parameters associated with the plates’ characterization can be considered as uncertainty sources, this work intends to analyze, solely, the variability induced by the uncertainty associated with CNTs characterizing parameters. Therefore, variables non-associated with CNT characterization are considered deterministic.
In this study, it is considered that the carbon nanotubes’ weight fraction varies through the plate’s thickness, as can be observed in Figure 1. On the lower surface of the plate, one has only aluminum, corresponding to material phase B, and at the upper surface, one has material phase A, which corresponds to a mixture of 2.5% in weight of carbon nanotubes with aluminum.
The mixture is governed by the known power law, presented in Equation (1), assuming that there is a perfect adhesion among phases and there are no porosities in the resulting material.
To predict the distribution through the thickness of the material properties, arising from the mixture of the nano-inclusions, one may consider Halpin–Tsai equations [39] to estimate Young’s modulus, as presented in Equation (2).
where , , and represent respectively the Young’s modulus of the mixture, of the aluminum matrix, and of the nanotubes. The nanotubes’ outer diameter, thickness, and length are represented by , , and , independently if one is considering single-walled or multi-walled nanotubes. The volume fraction of the nanotubes is determined by considering their weight fraction () in the mixture and the relation between the nanotubes and the aluminum densities. Besides being assumed that the resulting composite presents no porosities it is also assumed that there is a good dispersion of the nanotubes into the matrix, considering the low weight/volume fractions of the nanotubes used [40].
Voigt rule of mixtures was employed for determining the remaining material parameters, such as the Poisson’s coefficient and shear modulus, according to Equation (3):
where stands for a generic property of material , and for its corresponding volume fraction. In this work, the material gradient is related to the evolution of the CNT weight fraction through the plates’ thickness.
2.2. Displacement Field and Constitutive Relations
Considering the plates’ geometrical characteristics that one intends to study, the first-order shear deformation theory, in which the displacement field is given in Equation (4), is used.
In this equation, the parameters stand for the displacements of a generic point in the directions oX, oY, and oZ, respectively. The displacements represent the position variation of a generic coordinate point (x, y, 0) in the same directions. The rotations of the plate’s transverse normals around the directions oY and oX are respectively denoted by and . This displacement field is then characterized by presenting five degrees of freedom: {, , , , }.
The corresponding deformations , (Equation (5)) are subsequently obtained by applying to Equation (4), the kinematical relations from the elasticity theory for small deformations [41].
The stress and strain fields are described by the constitutive relations associated with the first-order shear deformation theory, as described in Equation (6).
where the reduced elastic stiffness coefficients, , are given in the literature, namely in [42], and the matrices are respectively associated with the membrane bending and transverse shear stiffness coefficients ( and ).
It is well known that the FSDT approach brings some limitations namely due to their through-thickness constant transverse shear deformations, . To mitigate this, a shear correction factor, , needs to be used. The use of , for homogeneous plates, is widely used, even when dealing with non-homogeneous plates. In this work, and to better adequate the shear correction factor to each specific plate, one can alternatively use the Singha et al. formulation [43], also implemented in [44].
In Equation (7), the parameter represents the thickness coordinate corresponding to the neutral surface, stands for the plate’s thickness, and represents the neutral surface’ shift about the plate’s mid-surface. This shifting of the neutral surface with respect to the plate middle surface and the adjustment in the power law to having it described in the neutral surface referential, are presented in Equation (8).
The parameters , are the Young’s and shear modulus of the functionally graded plates.
2.3. Finite Element Model
If one considers the minimization of the total potential energy of the system, it is achieved in the set of equilibrium Equation (9) for a generic plate element within a discretized domain [45]:
with being the element linear stiffness matrix, representing the vector of the element generalized displacements and the vector of the element generalized forces. The element stiffness matrix is given as described in Equation (10).
The and matrices have been defined in the previous section. Matrices and express the relationships between the element nodal generalized displacements and the deformations and are closely related to the finite element implemented. In the present work, a bilinear Lagrange quadrilateral element is used (Q4). The constitution of these matrices is given for each element node as presented in Equation (11).
where is the interpolating function associated with the element i-th node. After the evaluation of all the element matrices and vectors and their assembly into the global stiffness matrix and global load vector, so the whole discretized domain is represented, the problem boundary conditions will be imposed to finally achieve the generalized nodal displacements.
2.4. Statistical Methods
Multiple linear regression is a statistical model used to predict the outcome of a dependent variable based on the values of two or more independent variables, , This model assumes a linear relationship between the dependent variable and the regressors is linear:
As the individual data values, , for any given value of the independent variables vary randomly about the mean, an unobserved error or residual variable, , is introduced into the model to account for this random variation.
This model also assumes that the errors, , are uncorrelated with each other, follow a normal distribution with a mean of zero, and exhibit constant variance (homoscedasticity). For standard least squares estimation methods, the absence of perfect multicollinearity among the predictors is required, meaning that a linear relationship between two or more independent variables is not allowed.
To verify these assumptions, several tools can be employed. The Durbin–Watson two-sided test [46] is used to detect the presence of autocorrelation at lag 1 in the residuals. The Breusch–Pagan test [47] is applied to test for heteroskedasticity of the model’s residuals. The Shapiro–Wilk test is used to examine the normality of the errors. The multicollinearity is examined with the VIF (Variance Inflation Factor) where a VIF value exceeding 5 indicates a problematic issue of correlation among the independent variables [48].
In multiple linear regression problems, specific hypothesis tests regarding the model parameters are useful for assessing the adequacy of the model. The ANOVA F test enables testing the joint significance of the regressors:
Rejecting the null hypothesis of this test allows us to conclude that at least one of the independent variables significantly contributes to the model. However, this conclusion does not provide information about which regressions have a significant contribution to the model. Therefore, an individual independent variable test is needed—the t-test on the individual regression coefficient—to identify which regressors contribute significantly to the regression model:
The Friedman Test
The Frieman test is a two-way analysis of variance by ranks, testing the null hypothesis that k-paired samples have been drawn from populations with the same median [49]. The R implementation is employed for this purpose [50]. If the null hypothesis of the Friedman test is rejected, it indicates that at least one of the populations’ medians is different from the others. However, as the test result does not provide information about which medians differ from each other, pairwise comparisons between each pair of samples are performed using the Bonferroni correction.
3. Maximum Static Deflection: Verification Study
Before conducting the simulations required to obtain the results that will be post-processed to analyze the influence that the variability on the SWCNT and MWCNT material and geometrical properties will produce in the static maximum deflection of functionally graded plates, a verification case is performed.
To this purpose a sandwich simply supported square plate with unit edge and different edge-to-thickness ratios is analyzed. This plate is submitted to a 1 MPa uniformly distributed transverse load. The plate’s core is constituted by alumina and the outer layers are composed of a functionally graded mixture of alumina and aluminum, that progresses to a fully metallic phase in the outer surfaces. This is done by considering different values for the power exponent law. The heights of the layers, progressing from the lower layer to the upper one, are respectively , , and , being the total thickness.
The plate is discretized in a 20 × 20 mesh of Q4 finite elements. The results are presented in a non-dimensional form using the multiplier , where () and ( represent the plate’s dimensions with respect to the and directions respectively, ( is the Young’s modulus of alumina, and () the transverse load intensity.
The results obtained are presented in Table 1.
The results obtained with the present model present very low relative deviations with respect to the reference [51], allowing us to conclude that the model has very good performance.
4. Case Study
4.1. Data Simulation for Carbon Nanotubes
In this subsection, a description of the simulation process employed in this case study is provided. To evaluate the impact of geometric and material properties of carbon nanotubes (CNTs) on the static response of functionally graded plates, a prior simulation of the CNTs was conducted using the values outlined in Figure 2. This figure presents in a tree schematic representation the reference values sourced from [https://www.cheaptubes.com (accessed on 15 February 2024)], where d_ext and d_int represent the outer and inner diameters of the carbon nanotube and l its length. The resulting cases represent the eight types of combinations obtained from the manufacturer’s information.
Fifty nanotubes were simulated to create a reasonably sized sample that could effectively illustrate a real-world scenario. The uncertainty in input parameters arose from a dependency structure with a uniform assumption for each variable. This assumption of equiprobability aimed to translate the information provided by the manufacturer.
Initially, using equiprobability on the CNT type (SWCNT or MWCNT), the type was simulated. Subsequently, contingent on this outcome, the outer diameter of the nanotube was generated in accordance with the values provided in Figure 2. The other variables were simulated sequentially in the same fashion. For each nanotube combination obtained, a validation test was conducted. This allowed the elimination of impossible situations, such as the inner diameter being greater than the outer diameter.
The simulated carbon nanotubes are then integrated into an aluminum continuous phase (E = 70 GPa, ν = 0.3) in a graded manner through the thickness from which square plates are constituted. The FGM plates to be analyzed are considered in a simply supported condition and submitted to a unit uniform transverse pressure (1 Pa). The edge-to-thickness ratio (a/h) of the plates is equal to 20, with a unitary length edge (a = 1 m).
Considering the aim of the present study, the aluminum properties were considered not to be affected by uncertainty. The average elastic properties of the functionally graded mixture are estimated according to the Halpin–Tsai equation and Voigt rule of mixtures as referred to in Section 2. The plates are discretized in a 20 × 20 mesh of Q4 finite elements.
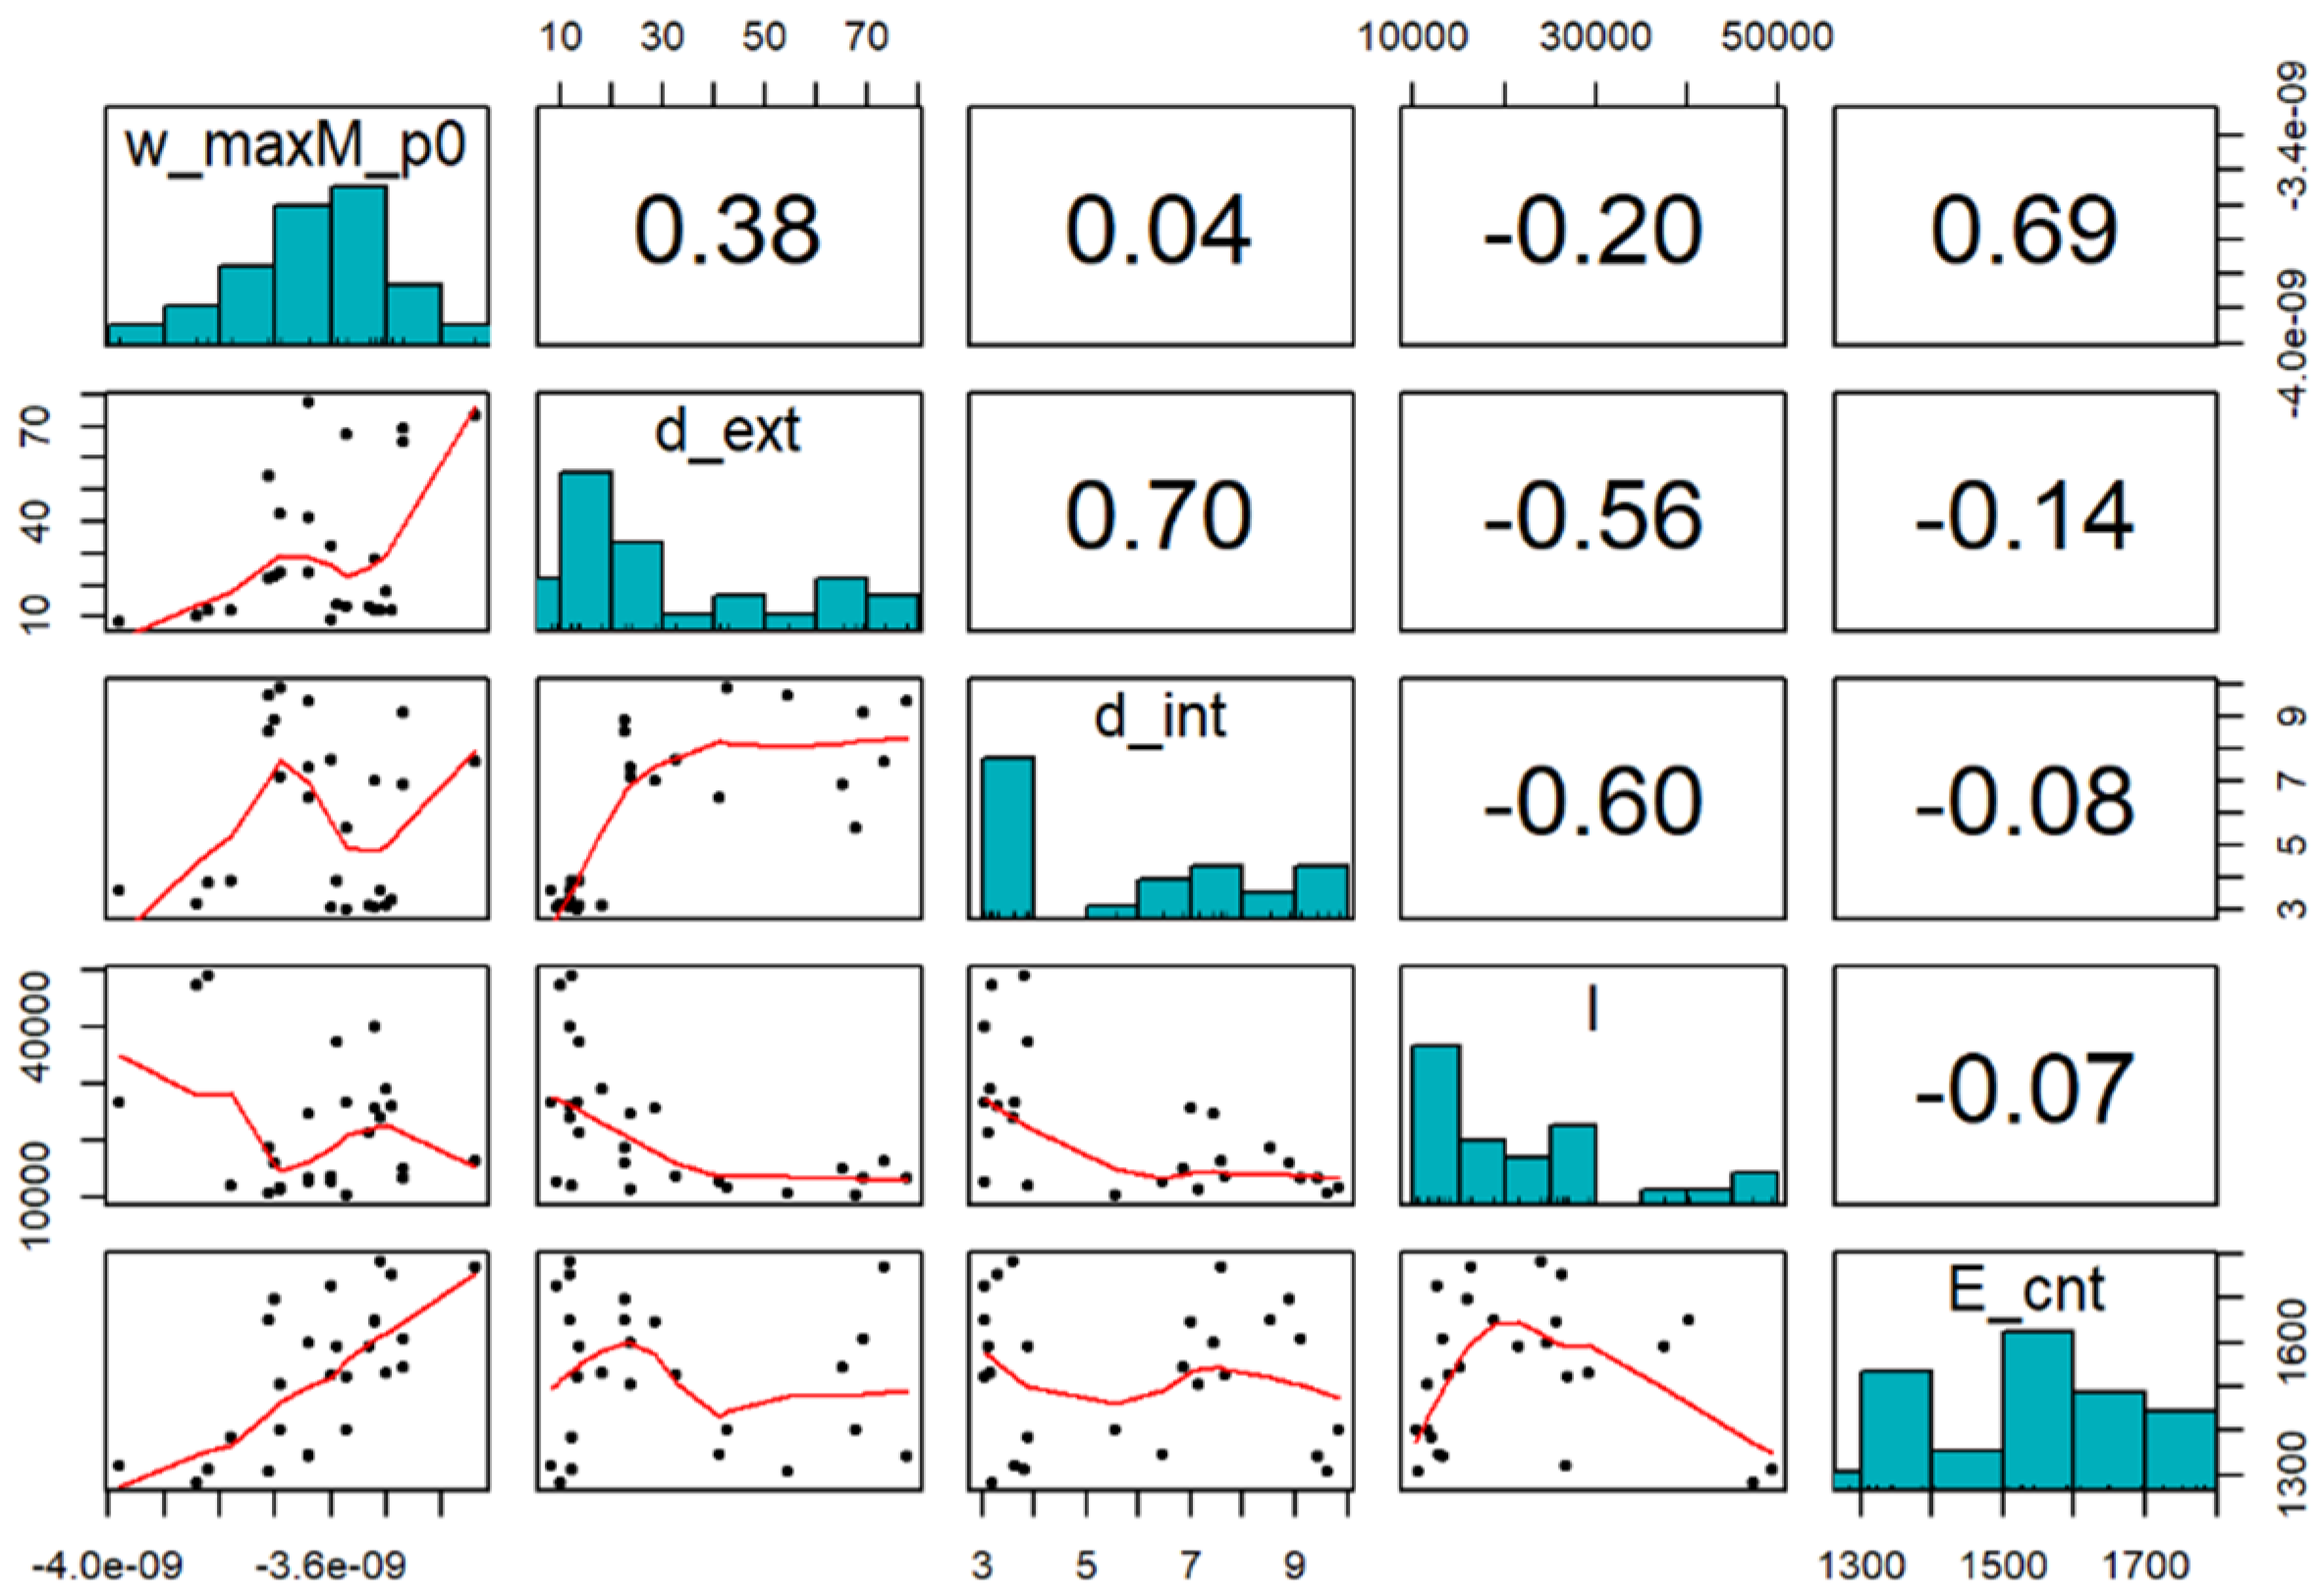
In Figure 3, one can see the results of the simulation as well as the maximum transverse displacement for . This case represents the maximum mixture in this study, the higher percentage of carbon in the nanotubes (Phase A: Aluminum + 2.5% CNTs). On the diagonal, the distribution of each of the variables is displayed. Also, below the diagonal, is the scatter plot, and above the diagonal are the values of the linear correlation coefficient for each pair of variables. The length presents a very low correlation with maximum transverse displacement. All the remainder input parameters present a positive and moderate correlation with the maximum transverse displacement. The low correlation between the diameters and Young’s modulus is relevant when modeling the maximum transverse displacement using all input variables. This is discussed in the following section, where the variability of the maximum transverse displacement is described using a linear regression model with the input variables.
The input variables for this stage of analysis are the CNTs’ length represented by l [μm], the CNT external and internal diameters respectively represented by d_ext and d_int [μm], the Young’s modulus of the CNT, E_cnt, and the plate maximum transverse displacement w_max [m]. As expected, there is a high correlation between the diameters resulting from the simulation scheme (Figure 3). However, the correlation between the other inputs shows low values, which is important for a distinct contribution to explaining the variability of the maximum transverse displacement.
4.2. Plates’ Maximum Transverse Displacement Distributions
In this work, both single-walled (SWCNT) and multi-walled (MWCNT) CNTs were used to integrate the plates, but separately. In Figure 4, we can see the maximum transverse displacement for the different values of the power-law exponent () in the two cases. It is possible to conclude that the maximum transverse displacement differs with the type of CNT.
Also, it is possible to observe that the plates’ maximum transverse displacement has an inverse relationship with . There is a clear difference in the value of the maximum transverse displacement among the exponents considered.
Since there is dependence between the exponent law samples, a Friedman test was applied to assess if these differences were significant. Considering the Friedman test result (p-value < 2.2 × 10⁻¹⁶) and the pairwise comparison tests (results in Table 2), it is possible to conclude that the maximum transverse displacement values did not prove to be significantly different for and (p-value = 0.064) and are significant differences in this variable for all the remaining pairs. This result led to excluding the case from the rest of the analysis because the conclusions would be similar.
4.3. Model for Plates’ Maximum Transverse Displacement—p = 0
The results obtained in the previous section led to the separation of the two cases (plates with SWCNT and plates with MWCNT). As we can see in Figure 5 and Figure 6, the correlation between the variables differs with the CNT’s type: SWCNT or MWCNT. Thus, the models were fitted for both cases, plates with SWCNT and plates with MWCNT, as well as for the various values of (excluding , as in this case the maximum transverse displacement values did not prove to be significantly different from the case where ).
As observed from the matrix plot in Figure 5, the external diameter of the SWCNTs presents a strong correlation to the maximum transverse deflection of the plates, followed by the Young’s modulus with a weaker correlation coefficient. The internal diameter also shows a weaker correlation to the deflection although with an inverse trend when compared to the other parameters.
Figure 6 depicts a matrix plot considering the correlations among the parameters associated with the plates with MWCNTs. As one can conclude, in this case, the strongest correlation to the maximum transverse deflection of the plates is observed for the Young’s modulus. A weaker, moderate correlation is observed for the external diameter.
It is thus possible to understand that for the two cases, the parameters Young’s modulus and external diameter are the most relevant although differing from one case to another. The remaining input parameters present low correlation coefficients to the plates’ maximum transverse displacement.
Considering the case of p = 0, the basis case, two linear regression models were fitted corresponding to plates with single and plates with multi-walled CNTs.
4.3.1. Model I—Plates with SWCNT
To choose the best model, all regression models based on the input variables were considered. This was done by using all possible combinations of inputs as input in the regression model. In the end, the model with the highest adjusted value , was chosen:
This model is significant (F-test with p-value 3.974 × 10⁻⁷) with . The estimates of this model are presented in Table 3. Although, the residuals are not Gaussian (p-value for Shapiro–Wilk test).
Also, all the other models are not suitable because they are not significant, have non-significant coefficients, or do not satisfy the residuals assumptions for a significance of 1%.
Thus, as the quality of this fit was not satisfactory, transformations were applied to linearize the data. Regarding all possible models combining input variables and the logarithm of input variables, the model with the highest was:
To assess the generalizability of this result, the F-test was conducted. The resulting p-value of 1.565 × 10⁻¹⁰ for this test indicates the significance of the model meaning that at least one of the input variables contributes significantly to explain the maximum transverse displacement. Furthermore, Table 4 displays the results of the t-tests showing all coefficients as significant at a significance level of α = 1%.
As mentioned in Section 2.4, the multiple regression model is constructed based on certain assumptions regarding the residuals. The highest VIF is 1.15, and the residuals exhibit homoscedasticity (Breusch-Pagan test), lack correlation (Durbin-Watson test), and follow a Gaussian distribution (Shapiro-Wilk test) considering α = 1%.
Note that the variable length of the nanotubes has never been included in the previous models. In fact, in all the possible models, this variable never achieved statistical significance.
4.3.2. Model II—Plates with MWCNT
In a similar way as for the plates with SWCNTs case, a model was selected with the highest from all possible linear models with input variables. The selected model is the one described in Equation (15).
This is significant (p-value 4.886 × 10⁻⁸ for F-test) as well as all its parameters (Table 5) at α = 1%. The highest VIF is 2.003 and the residuals are fulfilling all the residuals assumptions for α = 1%.
Although this is a suitable model it does not have a very good fitting. . Thus, for fitting improvement, transformations of input variables were considered.
An adjusted determination coefficient of 0.919 was achieved with the model in Equation (17). However, the coefficient of the length of the nanotube (l) is not significant (see Table 6).
The second model with the highest also was not suitable for similar reasons (instead of it was the variable that has a non-significant coefficient). As occurred for the plates with SWCNTs case, again the length of the nanotube does not have a significant impact on the plate deformation.
The third best-fitting model was the one defined in Equation (16). This model has and it is significant the F-test (p-value 1.21 × 10⁻¹²) with significant coefficients (Table 7) at α = 1%. The highest VIF is 3.05 and the residuals are homoscedastic (Breusch-Pagan test), uncorrelated (Durbin-Watson test) and Gaussian (Shapiro-Wilk test) considering α = 1%.
In short, for a similar best model was obtained for the maximum transverse deflection for plates with SWCNTs and MWCNTs. Both models present a very good fitting for the data, have statistical significance, and fulfill all the assumptions regarding the residuals. In both cases, the variable length of the nanotube has no impact on the deformation.
4.4. Model for Plates’ Maximum Transverse Displacement—Other Values of
The methodology for model selection described for the case of was applied to the other cases regarding different values of . Thus, the models were ranked by , provided they met the following requirements:
- Significant overall model (F-test) and all model variables are significant (t-tests) at α = 1%;
- No multicollinearity issues (VIF less than 5 for all independent variables);
- Homoscedastic residuals (Breusch-Pagan test), uncorrelated residuals (Durbin–Watson test), and normal distribution of residuals (Shapiro-Wilk test) considering α = 1%.
The model fitted for described in Equation (16) is also the best model for the other values of regarding both the FGM plates with SWCNTs and with MWCNTs. For the SWCNTs case the partial slopes can be seen in Table 8, and for the MWCNTs case are presented in Table 9.
As a global result, the variable length, l, never achieved statistical significance. That implies the length of the nanotube has no impact on the plates’ deformation. Concerning the plates with SWCNT case, it is concluded that the internal diameter parameter has a negative slope showing thus an inverse trend regarding the plates’ deflection, while the external diameter as well as the Young’s modulus have a direct proportional impact on those deflections. As increases, the modulus of the intercept () and the coefficient of the internal diameter () also increases (decreases in modulus) and there is a decreasing trend in the other slopes ( and ). Thus, the impact of the input variables—external and internal diameter and Young’s modulus—on the maximum transverse displacement shows an opposite influence.
Concerning the MWCNTs’ case similar conclusions can be taken about the same parameters’ influence on the maximum transverse plates’ deflection.
5. Conclusions
The objective of the present work is the characterization of the influence that geometrical and material properties’ uncertainty of SWCNTs and MWCNTs has on the maximum static deflection of functionally graded plates. To this purpose, only these characteristics are subjected to variability.
According to the analyses conducted, different maximum transverse displacement results are obtained for SWCNT and MWCNT reinforced plates, which is expected considering the different contributions of these different carbon nanotubes to the plates’ stiffening. It is also possible to verify that the exponent values considered, influence these displacements; however, it is concluded that the results obtained for p = 10, do not prove to be significantly different from the ones obtained when p = 8. This is also an expected result considering the evolution of the volume fraction distribution through the plates’ thickness.
Multiple regression models are developed to describe the maximum transverse displacement of plates reinforced with SWCNT or MWCNT. For an exponent a similar best regression model is obtained for the two cases. It is possible to conclude that the models present a very good fitting for the data, showing statistical significance and fulfilling all the assumptions regarding the residuals. In both cases, the variable length of the nanotube has no impact on the plates’ deflection. The model fitted for the exponent described in Equation (16) is also the best model for the other values of regarding both plates reinforced with single-walled and multi-walled carbon nanotubes.
As a global result, the variable length never achieves statistical significance. This implies the length of the nanotube has no significant impact on the maximum transverse displacement of the plates.
Regarding the other input variables, considering the defined evolution of the materials mixture, it is demonstrated that the parameter associated with the nanotubes’ internal diameter has a negative value (negative slope) thus an opposite trend influence on the plates’ maximum deflection, and the external diameter as well as the Young’s modulus have a direct trend influence on the plates’ deflection.
As a complementary conclusion, it is possible to say that due to their quality characteristics, the multiple regression models developed can be used as alternative prediction tools within the domain of the study.
Author Contributions
Investigation. Conceptualization, M.A.R.L., A.C., A.M., and A.F.M.; Supervision, M.A.R.L. and A.C.; Methodology, M.A.R.L., A.C., A.M., and A.F.M.; software, validation, visualization, A.F.M., A.C., and A.M.; data curation, A.F.M., A.C., and A.M.; formal analysis, A.F.M., A.C., and A.M.; Writing—Original Draft, M.A.R.L., A.C. and A.M.; Writing—Review & Editing, M.A.R.L., A.C. and A.M. All authors have read and agreed to the published version of the manuscript.
Funding
This research received no external funding.
Data Availability Statement
Data is contained within the article.
Acknowledgments
M.A.R. Loja acknowledges the support of FCT/MEC through Project IDMEC. LAETA UIDB/50022/2020. Alda Carvalho is a CEMAPRE/REM member and has the support of Project CEMAPRE/REM—UIDB/05069/2020—financed by FCT/MCTES through national funds.
Conflicts of Interest
M.A.R. Loja, as co-guest editor of the present special issue, was not involved in the editorial review nor in the decision on the possible publication of this article. All the authors declare that there are no competing interests.
References
- Birman, V.; Byrd, L.W. Modeling and analysis of functionally graded materials and structures. Appl. Mech. Rev. 2007, 60, 195–216. [Google Scholar] [CrossRef]
- Gupta, N.; Gupta, S.M.; Sharma, S.K. Carbon nanotubes: Synthesis, properties and engineering applications. Carbon Lett. 2019, 29, 419–447. [Google Scholar] [CrossRef]
- Rathinavel, S.; Priyadharshini, K.; Panda, D. A review on carbon nanotube: An overview of synthesis, properties, functionalization, characterization, and the application. Mater. Sci. Eng. 2021, 268, 11509. [Google Scholar] [CrossRef]
- Liew, K.M.; Lei, Z.X.; Zhang, L.W. Mechanical analysis of functionally graded carbon nanotube reinforced composites: A review. Compos. Struct. 2015, 120, 90–97. [Google Scholar] [CrossRef]
- Radhamani, A.V.; Chung Lau, H.; Ramakrishna, S. CNT-reinforced Metal and Steel Nanocomposites: A Comprehensive Assessment of Progress and Future Directions. Compos. Part A Appl. Sci. Manuf. 2018, 114, 170–187. [Google Scholar] [CrossRef]
- Vinyas, M.; Atul, J.; Nguyen Thoi, T.; Loja, M.A.R. A Comprehensive Review on Analysis of Nanocomposites: From Manufacturing to Properties Characterization. Mater. Res. Express 2019, 6, 092002. [Google Scholar] [CrossRef]
- Zhao, S.; Zhao, Z.; Yang, Z.; Ke, L.; Kitipornchai, S.; Yang, J. Functionally graded graphene reinforced composite structures: A review. Eng. Struct. 2020, 210, 110339. [Google Scholar] [CrossRef]
- Shoukat, R.; Khan, M.I. Carbon nanotubes: A review on properties. synthesis methods and applications in micro and nanotechnology. Microsyst. Technol. 2021, 27, 4183–4192. [Google Scholar] [CrossRef]
- Soni, S.K.; Thomas, B.; Swain, A.; Roy, T. Functionally graded carbon nanotubes reinforced composite structures: An extensive review. Compos. Struct. 2022, 299, 116075. [Google Scholar] [CrossRef]
- Valencia Murillo, C.E.; Gutierrez Rivera, M.E.; Celaya Garcia, L.D. Thermal–Structural Linear Static Analysis of Functionally Graded Beams Using Reddy Beam Theory. Math. Comput. Appl. 2023, 28, 84. [Google Scholar] [CrossRef]
- Kurpa, L.; Pellicano, F.; Shmatko, T.; Zippo, A. Free Vibration Analysis of Porous Functionally Graded Material Plates with Variable Thickness on an Elastic Foundation Using the R-Functions Method. Math. Comput. Appl. 2024, 29, 10. [Google Scholar] [CrossRef]
- Alghanmi, R.A.; Aljaghthami, R.H. A Four-Variable Shear Deformation Theory for the Static Analysis of FG Sandwich Plates with Different Porosity Models. Math. Comput. Appl. 2024, 29, 20. [Google Scholar] [CrossRef]
- Ruoff, R.S.; Lorents, D.C. Mechanical and Thermal Properties of Carbon Nanotubes. In Carbon Nanotubes; Elsevier: Amsterdam, The Netherlands, 1996; pp. 143–148. [Google Scholar]
- Xie, S.; Li, W.; Pan, Z.; Chang, B.; Sun, L. Mechanical and physical properties on carbon nanotube. J. Phys. Chem. Solids 2000, 61, 1153–1158. [Google Scholar] [CrossRef]
- Fidelusa, J.D.; Wiesela, E.; Gojnyb, F.H.; Schulteb, K.; Wagner, H.D. Thermo-mechanical properties of randomly oriented carbon/epoxy nanocomposites. Compos. Part A 2005, 36, 1555–1561. [Google Scholar] [CrossRef]
- Martone, A.; Faiella, G.; Antonucci, V.; Giordano, M.; Zarrelli, M. The effect of the aspect ratio of carbon nanotubes on their effective reinforcement modulus in an epoxy matrix. Compos. Sci. Technol. 2011, 71, 1117–1123. [Google Scholar] [CrossRef]
- Qiu, H.; Yang, J. Structure and Properties of Carbon Nanotubes. In Industrial Applications of Carbon Nanotubes. Micro and Nano Technologies; Peng, H., Li, Q., Chen, T., Eds.; Elsevier: Amsterdam, The Netherlands, 2017; pp. 47–69. [Google Scholar]
- Loja, M.A.R. Dynamic Response of Soft Core Sandwich Beams with Metal-Graphene Nanocomposite Skins. Shock Vib. 2017, 2017, 7842413. [Google Scholar] [CrossRef]
- Eringen, A.C. Nonlocal Continuum Field Theories; Springer: New York, NY, USA, 2002. [Google Scholar]
- Garg, A.; Chalak, H.D.; Zenkour, A.M.; Belarbi, M.-O.; Houari, M.-S.-A. A Review of Available Theories and Methodologies for the Analysis of Nano Isotropic, Nano Functionally Graded, and CNT Reinforced Nanocomposite Structures. Arch. Comput. Methods Eng. 2022, 29, 2237–2270. [Google Scholar] [CrossRef]
- Reddy, J.N.; Pang, S.D. Nonlocal continuum theories of beams for the analysis of carbon nanotubes. J. Appl. Phys. 2008, 103, 23511. [Google Scholar] [CrossRef]
- Kong, L.; Zhang, B.; Li, C. Thermal Buckling and Postbuckling Behaviors of Couple Stress and Surface Energy-Enriched FG-CNTR Nanobeams. Symmetry 2022, 14, 2228. [Google Scholar] [CrossRef]
- Reddy, J.N.; Kim, J. A nonlinear modified couple stress-based third-order theory of functionally graded plates. Compos. Struct. 2012, 94, 1128–1143. [Google Scholar] [CrossRef]
- Liu, S.; Yu, T.; Bui, T.Q.; Xia, S. Size-dependent analysis of homogeneous and functionally graded microplates using IGA and a non-classical Kirchhoff plate theory. Compos. Struct. 2017, 172, 34–44. [Google Scholar] [CrossRef]
- Thanh, C.-L.; Vu-Huu, T.; Phung-Van, P.; Nguyen-Xuan, H.; Abdel Wahab, M. Size-Dependent Analysis for FG-CNTRC Nanoplates Based on Refined Plate Theory and Modified Couple Stress. In Proceedings of the 1st International Conference on Numerical Modelling in Engineering, NME 2018, Ghent, Belgium, 28–29 August 2018; Lecture Notes in Civil Engineering, 20. Springer: Singapore, 2019; pp. 225–237. [Google Scholar]
- Zhang, B.; Li, C.; Zhang, L.; Xie, F. Size-Dependent Free Vibration of Non-Rectangular Gradient Elastic Thick Microplates. Symmetry 2022, 14, 2592. [Google Scholar] [CrossRef]
- Sotiropoulos, D.G.; Tserpes, K. Interval-Based Computation of the Uncertainty in the Mechanical Properties and the Failure Analysis of Unidirectional Composite Materials. Math. Comput. Appl. 2022, 27, 38. [Google Scholar] [CrossRef]
- Yin, S.; Qin, H.; Gao, Q. An Efficient Orthogonal Polynomial Method for Auxetic Structure Analysis with Epistemic Uncertainties. Math. Comput. Appl. 2022, 27, 49. [Google Scholar] [CrossRef]
- Bouwer, J.M.; Wilke, D.N.; Kok, S. Spatio-Temporal Gradient Enhanced Surrogate Modeling Strategies. Math. Comput. Appl. 2023, 28, 57. [Google Scholar] [CrossRef]
- Takakura, A.; Beppu, K.; Nishihara, T.; Fukui, A.; Kozeki, T.; Namazu, T.; Miyauchi, Y.; Itami, K. Strength of carbon nanotubes depends on their chemical structures. Nat. Commun. 2019, 10, 3040. [Google Scholar] [CrossRef]
- García-Macías, E.; Castro-Triguero, R.; Friswell, M.I.; Adhikari, S.; Sáez, A. Metamodel-based approach for stochastic free vibration analysis of functionally graded carbon nanotube reinforced plates. Compos. Struct. 2016, 152, 183–198. [Google Scholar] [CrossRef]
- Pouresmaeeli, S.; Fazelzadeh, S.A. Uncertain Buckling and Sensitivity Analysis of Functionally Graded Carbon Nanotube-Reinforced Composite Beam. Int. J. Appl. Mech. 2017, 9, 1750071. [Google Scholar] [CrossRef]
- Carvalho, A.; Silva, T.A.N.; Loja, M.A.R.; Damásio, F.R. Assessing the influence of material and geometrical uncertainty on the mechanical behavior of FGM plates. Mech. Adv. Mater. Struct. 2017, 24, 417–426. [Google Scholar] [CrossRef]
- Rosa, R.S.B.; Loja, M.A.R.; Carvalho, A.C.J.V.N. Toward variability characterization and statistic models constitution for the prediction of exponentially graded plates’ static response. J. Compos. Sci. 2018, 2, 59. [Google Scholar] [CrossRef]
- Karsh, P.K.; Mukhopadhyay, T.; Dey, S. Stochastic dynamic analysis of twisted functionally graded plates. Compos. Part B Eng. 2018, 147, 259–278. [Google Scholar] [CrossRef]
- Wang, Q.; Wu, D.; Tin-Loi, F.; Gao, W. Machine learning aided stochastic structural free vibration analysis for functionally graded bar-type structures. Thin-Walled Struct. 2019, 144, 106315. [Google Scholar] [CrossRef]
- Gao, K.; Do, D.M.; Li, R.; Kitipornchai, S.; Yang, J. Probabilistic stability analysis of functionally graded graphene reinforced porous beams. Aerosp. Sci. Technol. 2020, 98, 105738. [Google Scholar] [CrossRef]
- Baghlani, A.; Najafgholipour, M.A.; Khayat, M. The influence of mechanical uncertainties on the free vibration of functionally graded graphene-reinforced porous nanocomposite shells of revolution. Eng. Struct. 2021, 228, 111356. [Google Scholar] [CrossRef]
- Halpin, J.C.; Kardos, J.L. The Halpin-Tsai Equations: A Review. Polym. Eng. Sci. 1976, 16, 344–352. [Google Scholar]
- Costa, D.M.S.; Loja, M.A.R. Assessing the static behavior of hybrid CNT-metal-ceramic composite plates. AIMS Mater. Sci. 2016, 3, 808–831. [Google Scholar] [CrossRef]
- Reddy, J.N. An evaluation of equivalent-single-layer and layerwise theories of composite laminates. Compos. Struct. 1993, 25, 21–35. [Google Scholar] [CrossRef]
- Reddy, J.N. Mechanics of Laminated Composite Plates and Shells, 2nd ed.; CRC Press: Boca Raton, FL, USA, 2003. [Google Scholar]
- Singha, M.K.; Prakash, T.; Ganapathi, M. Finite element analysis of functionally graded plates under transverse load. Finite Elem. Anal. Des. 2011, 47, 453–460. [Google Scholar] [CrossRef]
- Mota, A.F.; Loja, M.A.R.; Barbosa, J.I.; Rodrigues, J.A. Porous Functionally Graded Plates: An Assessment of the Influence of Shear Correction Factor on Static Behavior. Math. Comput. Appl. 2020, 25, 25. [Google Scholar] [CrossRef]
- Zienkiewicz, O.C.; Taylor, R.L. The Finite Element Method, 5th ed.; Butterworth-Heinemann: Oxford, UK, 2000; Volume 1. [Google Scholar]
- Durbin, J.; Watson, G.S. Testing for Serial Correlation in Least Squares Regression. Biometrika 1951, 38, 159–179. [Google Scholar] [CrossRef] [PubMed]
- Breusch, T.S.; Pagan, A.R. A Simple Test for Heteroskedasticity and Random Coefficient Variation. Econometrica 1979, 47, 1287–1294. [Google Scholar] [CrossRef]
- James, G.; Witten, D.; Hastie, T.; Tibshirani, R. An Introduction to Statistical Learning; Springer: New York, NY, USA, 2013. [Google Scholar]
- Siegel, S.; Castellan, N.J., Jr. Nonparametric Statistics for the Behavioral Sciences, 2nd ed.; Mcgraw-Hill Book Company: New York, NY, USA, 1988. [Google Scholar]
- Hollander, M.; Wolfe, D.A. Nonparametric Statistical Methods; John Wiley & Sons: New York, NY, USA, 2013; pp. 139–146. [Google Scholar]
- Demirhan, P.A.; Taskin, V. Levy solution for bending analysis of functionally graded sandwich plates based on four variable plate theory. Compos. Struct. 2017, 177, 80–95. [Google Scholar] [CrossRef]
Figure 1.
Schematic representation of the graded mixture of carbon nanotubes and aluminum through plates’ thickness.
Figure 1.
Schematic representation of the graded mixture of carbon nanotubes and aluminum through plates’ thickness.

Figure 2.
Illustrative flowchart of the simulation process.

Figure 3.
Matrix plot for the maximum transverse displacement, (), and all the input variables.

Figure 4.
Plates’ maximum transverse displacement [m] for the different values of the power law’ exponent and CNT type.
Figure 4.
Plates’ maximum transverse displacement [m] for the different values of the power law’ exponent and CNT type.

Figure 5.
Matrix plot for the plates’ maximum transverse displacement and all the input parameters: Plates with SWCNT.
Figure 5.
Matrix plot for the plates’ maximum transverse displacement and all the input parameters: Plates with SWCNT.

Figure 6.
Matrix plot for the plates’ maximum transverse displacement and all the input parameters: Plates with MWCNT.
Figure 6.
Matrix plot for the plates’ maximum transverse displacement and all the input parameters: Plates with MWCNT.


Table 1.
Non-dimensional maximum static plate’s deflection for different aspect ratios (a/h) and power law exponents (p).
Table 1.
Non-dimensional maximum static plate’s deflection for different aspect ratios (a/h) and power law exponents (p).
| a/h | ||||||
|---|---|---|---|---|---|---|
| 10 | 20 | |||||
| p | [51] | [51] | ||||
| 0 | 0.4666 | 0.4655 | −0.23 | 0.4494 | 0.4480 | −0.31 |
| 0.5 | 0.6590 | 0.6574 | −0.25 | 0.6401 | 0.6381 | −0.31 |
| 2 | 1.0153 | 1.0129 | −0.23 | 0.9945 | 0.9912 | −0.33 |
| 10 | 1.4296 | 1.4194 | −0.72 | 1.3997 | 1.3944 | −0.38 |
Table 2.
Comparison of maximum transverse displacement for the different values of the exponent of the power law: pairwise comparisons using the Bonferroni correction.
Table 2.
Comparison of maximum transverse displacement for the different values of the exponent of the power law: pairwise comparisons using the Bonferroni correction.
| 1.80 × 10⁻⁹ | ||||||
| 1.20 × 10⁻¹¹ | 1.10 × 10⁻⁵ | |||||
| 4.30 × 10⁻¹³ | 8.50 × 10⁻¹⁰ | 1.70 × 10⁻⁵ | ||||
| 1.50 × 10⁻¹³ | 1.10 × 10⁻¹¹ | 1.30 × 10⁻⁹ | 3.00 × 10⁻⁵ | |||
| 1.10 × 10⁻¹⁴ | 2.90 × 10⁻¹³ | 3.60 × 10⁻¹² | 1.90 × 10⁻¹⁰ | 3.20 × 10⁻⁷ | ||
| 4.90 × 10⁻¹⁵ | 1.60 × 10⁻¹³ | 6.20 × 10⁻¹³ | 2.20 × 10⁻¹¹ | 3.40 × 10⁻⁹ | 0.064 |
Table 3.
Estimates of the model are defined in Equation (15). Plates with SWCNT: with p = 0 data.
| Estimate | Std. Error | t | p-Value 1 | |
|---|---|---|---|---|
| Intercept | −5.252 × 10⁻⁹ | 5.886 × 10⁻¹⁰ | −8.924 | 2.07 × 10⁻⁸ *** |
| −6.226 × 10⁻¹⁰ | 2.081 × 10⁻¹⁰ | −2.992 | 0.00721 ** | |
| 3.686 × 10⁻¹⁰ | 4.546 × 10⁻¹¹ | 8.109 | 9.44 × 10⁻⁸ *** | |
| 6.603 × 10⁻¹⁰ | 2.989 × 10⁻¹³ | 2.209 | 0.03901 * |
1 Significance codes: 0 ‘***’ 0.001 ‘**’ 0.01 ‘*’ 0.05.
Table 4.
Estimates of the model are defined in Equation (16). Plates with SWCNT: with p = 0 data.
| Estimate | Std. Error | t | p-Value 1 | |
|---|---|---|---|---|
| Intercept | −11.732 × 10⁻⁹ | 2.234 × 10⁻⁹ | −5.250 | 3.88 × 10⁻⁵ *** |
| −0.7828 × 10⁻⁹ | 1.591 × 10⁻¹⁰ | −4.919 | 8.27 × 10⁻⁵ *** | |
| 0.9688 × 10⁻⁹ | 7.490 × 10⁻¹¹ | 12.935 | 3.57 × 10⁻¹¹ *** | |
| 0.9498 × 10⁻⁹ | 3.043 × 10⁻¹⁰ | 3.121 | 0.00538 ** |
1 Significance codes: 0 ‘***’ 0.001 ‘**’ 0.01.
Table 5.
Estimates of the model are defined in Equation (15). Plates with MWCNT: with p = 0 data.
| Estimate | Std. Error | t | p-Value 1 | |
|---|---|---|---|---|
| Intercept | −4.635 × 10⁻⁹ | 1.331 × 10⁻¹⁰ | −34.815 | <2 × 10⁻¹⁶ *** |
| −2.558 × 10⁻¹¹ | 7.277 × 10⁻¹² | −3.515 | 0.00195 ** | |
| 4.849 × 10⁻¹² | 7.947 × 10⁻¹³ | 6.101 | 3.85 × 10⁻⁶ *** | |
| 6.647 × 10⁻¹³ | 8.304 × 10⁻¹⁴ | 8.004 | 5.85 × 10⁻⁸ *** |
1 Significance codes: 0 ‘***’ 0.001 ‘**’ 0.01.
Table 6.
Estimates of the model are defined in Equation (17). Plates with MWCNT: with p = 0 data.
| Estimate | Std. Error | t | p-Value 1 | |
|---|---|---|---|---|
| Intercept | −1.151 × 10⁻⁸ | 6.169 × 10⁻¹⁰ | −18.656 | 1.50 × 10⁻¹⁴ *** |
| −2.489 × 10⁻¹⁰ | 3.138 × 10⁻¹¹ | −7.933 | 9.41 × 10⁻⁸ *** | |
| 2.227 × 10⁻¹⁰ | 1.948 × 10⁻¹¹ | 11.432 | 1.77 × 10⁻¹⁰ *** | |
| 1.001 × 10⁻¹¹ | 7.626 × 10⁻¹¹ | 13.129 | 1.36 × 10⁻¹¹ *** | |
| 2.708 × 10⁻¹¹ | 2.210 × 10⁻¹¹ | 1.226 | 0.234 |
1 Significance codes: 0 ‘***’ 0.001 0.1 ‘ ’ 1.
Table 7.
Estimates of the model are defined in Equation (16). Plates with MWCNT: with p = 0 data.
| Estimate | Std. Error | t | p-Value 1 | |
|---|---|---|---|---|
| Intercept | 1.120 × 10⁻⁸ | 5.697 × 10⁻¹⁰ | −19.659 | 1.91 × 10⁻¹⁵ *** |
| −2.576 × 10⁻¹⁰ | 3.092 × 10⁻¹¹ | −8.331 | 2.99 × 10⁻⁸ *** | |
| 2.158 × 10⁻¹⁰ | 1.886 × 10⁻¹¹ | 11.441 | 9.88 × 10⁻¹¹ *** | |
| 1.001 × 10⁻⁹ | 7.712 × 10⁻¹¹ | 12.974 | 8.76 × 10⁻¹² *** |
1 Significance codes: 0 ‘***’ 0.001.
Table 8.
Estimates of model defined in Equation (16) for plates with SWCNT with different values of p. The standard errors of the estimates are in parentheses.
Table 8.
Estimates of model defined in Equation (16) for plates with SWCNT with different values of p. The standard errors of the estimates are in parentheses.
| Intercept | |||||
|---|---|---|---|---|---|
| 0.894 | −11.732 × 10⁻⁹ (2.234 × 10⁻⁹) *** | −7.828 × 10⁻¹⁰ (1.591 × 10⁻¹⁰) *** | 9.688 × 10⁻¹⁰ (7.490 × 10⁻¹¹) *** | 9.498 × 10⁻¹⁰ (3.043 × 10⁻¹⁰) ** | |
| 0.909 | −9.775 × 10⁻⁹ (1.453 × 10⁻⁹) *** | −5.684 × 10⁻¹⁰ (1.035 × 10⁻¹⁰) *** | 6.834 × 10⁻¹⁰ (4.873 × 10⁻¹¹) *** | 6.647 × 10⁻¹⁰ (1.980 × 10⁻¹⁰) ** | |
| 0.912 | −8.923 × 10⁻⁹ (1.161 × 10⁻⁹) *** | −4.694 × 10⁻¹⁰ (8.273 × 10⁻¹¹) *** | 5.552 × 10⁻¹⁰ (3.894 × 10⁻¹¹) *** | 5.415 × 10⁻¹⁰ (1.582 × 10⁻¹⁰) ** | |
| 0.913 | −8.220 × 10⁻⁹ (9.283 × 10⁻¹⁰) *** | −3.783 × 10⁻¹⁰ (6.613 × 10⁻¹¹) *** | 4.465 × 10⁻¹⁰ (3.113 × 10⁻¹¹) *** | 4.410 × 10⁻¹⁰ (1.265 × 10⁻¹⁰) ** | |
| 0.917 | −7.592 × 10⁻⁹ (7.434 × 10⁻¹⁰) *** | −3.099 × 10⁻¹⁰ (5.295 × 10⁻¹¹) *** | 3.675 × 10⁻¹⁰ (2.492 × 10⁻¹¹) *** | 3.502 × 10⁻¹⁰ (1.013 × 10⁻¹⁰) ** | |
| 0.925 | −7.090 × 10⁻⁹ (5.367 × 10⁻¹⁰) *** | −2.438 × 10⁻¹⁰ (3.823 × 10⁻¹¹) *** | 2.778 × 10⁻¹⁰ (1.799 × 10⁻¹¹) *** | 2.774 × 10⁻¹⁰ (7.311 × 10⁻¹¹) ** |
Significance codes: 0 ‘***’ 0.001 ‘**’ 0.01.
Table 9.
Estimates of model defined in Equation (16) for plates with MWCNT with different values of p. The standard errors of the estimates are in parentheses.
Table 9.
Estimates of model defined in Equation (16) for plates with MWCNT with different values of p. The standard errors of the estimates are in parentheses.
| Intercept | |||||
|---|---|---|---|---|---|
| 0.917 | −11.201 × 10⁻⁹ (5.697 × 10⁻¹⁰) *** | −2.576 × 10⁻¹⁰ (3.092 × 10⁻¹¹) *** | 2.158 × 10⁻¹⁰ (1.886 × 10⁻¹¹) *** | 10.01 × 10⁻¹⁰ (7.712 × 10⁻¹¹) *** | |
| 0.914 | −9.799 × 10⁻⁹ (4.421 × 10⁻¹⁰) *** | −1.977 × 10⁻¹⁰ (2.399 × 10⁻¹¹) *** | 1.659 × 10⁻¹⁰ (1.464 × 10⁻¹¹) *** | 7.532 × 10⁻¹⁰ (5.985 × 10⁻¹¹) *** | |
| 0.919 | −9.017 × 10⁻⁹ (3.554 × 10⁻¹⁰) *** | −1.681 × 10⁻¹⁰ (1.928 × 10⁻¹¹) *** | 1.383 × 10⁻¹⁰ (1.177 × 10⁻¹¹) *** | 6.238 × 10⁻¹⁰ (4.811 × 10⁻¹¹) *** | |
| 0.910 | −8.329 × 10⁻⁹ (3.074 × 10⁻¹⁰) *** | −1.311 × 10⁻¹⁰ (1.668 × 10⁻¹¹) *** | 1.125 × 10⁻¹⁰ (1.018 × 10⁻¹¹) *** | 5.103 × 10⁻¹⁰ (4.161 × 10⁻¹¹) *** | |
| 0.910 | −7.806 × 10⁻⁹ (2.563 × 10⁻¹⁰) *** | −1.114 × 10⁻¹⁰ (1.391 × 10⁻¹¹) *** | 0.942 × 10⁻¹⁰ (8.485 × 10⁻¹²) *** | 4.247 × 10⁻¹⁰ (3.469 × 10⁻¹¹) *** | |
| 0.923 | −7.306 × 10⁻⁹ (1.873 × 10⁻¹⁰) *** | −0.869 × 10⁻¹⁰ (1.016 × 10⁻¹¹) *** | 0.743 × 10⁻¹⁰ (6.200 × 10⁻¹²) *** | 3.403 × 10⁻¹⁰ (2.535 × 10⁻¹¹) *** |
Significance codes: 0 ‘***’ 0.001.
Disclaimer/Publisher’s Note: The statements, opinions and data contained in all publications are solely those of the individual author(s) and contributor(s) and not of MDPI and/or the editor(s). MDPI and/or the editor(s) disclaim responsibility for any injury to people or property resulting from any ideas, methods, instructions or products referred to in the content. |
© 2024 by the authors. Licensee MDPI, Basel, Switzerland. This article is an open access article distributed under the terms and conditions of the Creative Commons Attribution (CC BY) license (https://creativecommons.org/licenses/by/4.0/).
Share and Cite
MDPI and ACS Style
Carvalho, A.; Martins, A.; Mota, A.F.; Loja, M.A.R. Variability on Functionally Graded Plates’ Deflection Due to Uncertainty on Carbon Nanotubes’ Properties. Math. Comput. Appl. 2024, 29, 22. https://doi.org/10.3390/mca29020022
AMA Style
Carvalho A, Martins A, Mota AF, Loja MAR. Variability on Functionally Graded Plates’ Deflection Due to Uncertainty on Carbon Nanotubes’ Properties. Mathematical and Computational Applications. 2024; 29(2):22. https://doi.org/10.3390/mca29020022
Chicago/Turabian StyleCarvalho, Alda, Ana Martins, Ana F. Mota, and Maria A. R. Loja. 2024. "Variability on Functionally Graded Plates’ Deflection Due to Uncertainty on Carbon Nanotubes’ Properties" Mathematical and Computational Applications 29, no. 2: 22. https://doi.org/10.3390/mca29020022